Embed Size (px)
Citation preview
Chapter 4 114
CHAPTER 4
ASSESSMENT OF CYTOTOXIC AND GENOTOXIC POTENTIAL OF REPEATED
DOSE OF THIACLOPRID IN RAT
INTRODUCTION
The introduction of new chemicals in nature may be responsible for numerous negative effects
in humans, such as biochemical malfunctions or genetic instability (Tsutsui et al., 1984; Evans,
1985). Pesticides are widely used noxious chemicals in agriculture, either separately or in
mixtures, and they invade the environment in large quantities (Demsia et al., 2007) and one of
the major environmental health problems caused by these pesticides is their potential adverse
effect on non-target organisms (Cavas et al., 2012).
Among currently available pesticides, neonicotinoids are considered to be the most important
chemical class of insecticides introduced to the global market since the advent of synthetic
pyrethroids (Jeschke and Nauen, 2008). Neonicotinoid insecticides are extensively used, both
in crop protection and animal health applications (Chudoku, 2008; Cavas et al., 2012). They
are currently registered in 120 countries and account for 25% of the world insecticide market
(Jeschke et al., 2011). Thiacloprid is a member of the neonicotinoid group of insecticides,
which act as selective agonist for the nicotinic acetylcholine receptors in insects. It is used
against a wide range of insect pests in public health and in veterinary applications (Tomizawa
and Casida, 2005).
Pesticides are very reactive compounds forming covalent bonds with various cellular
biomolecules such as DNA and can consequently damage cells’ genetic structure and/or
interfere with metabolic processes. Thus, the genotoxicity of pesticides is currently a topic of
worldwide concern (Cavas et al., 2012). It is also known that free radicals play an important
role in the toxicity of pesticides and environmental chemicals (D’Almeida et al., 1997;
Duzguner and Erdogan, 2012). Pesticide chemicals such as insecticides may induce oxidative
stress leading to generation of free radicals and alterations in antioxidants or free radical
scavenging enzyme systems (Kanbur et al., 2008; Duzguner and Erdogan, 2010). The data on
experimental animals either in vivo or in vitro (John et al., 2001; Thapar et al., 2002; Singh et
al., 2006) indicate that the enzymes associated with antioxidant defense mechanisms are
altered under the influence of pesticides. Moreover, oxidative stress and DNA damage have
Chapter 4 115
been proposed as mechanisms linking pesticide exposure to health effects such as cancer and
neurological diseases. During metabolism of the insecticides, reactive oxygen species (ROS)
and reactive nitrogen species (RNS) such as nitric oxide (NO) can be generated (Grisham et
al., 1999; Duzguner and Erdogan, 2012).
Thiacloprid is the first among the cyano group of chloronicotinyl insecticides to be registered
by Bayer AgroScience Ltd., with brand name of Calypso, Alanto, Biscaya, etc. (Elbert et al.,
2001; Erdelen, 2001). Today, the use of this insecticide for controlling various species of pests
on many crops is very common (Elbert et al., 2000). Because the use of thiacloprid has
become increasingly widespread throughout the world, the assessment of its possible
genotoxic and cytotoxic effects on living organisms is very important (Kocaman et al., 2012).
EPA (2003) and FAO (2006) have even reported development of thyroid, ovarian, uterine and
prostate cancer due to thiacloprid exposure in rats, suggesting it can be a potent carcinogen as
well.
A literature survey showed that not many studies have been carried out on the potential
genotoxic/cytotoxic (Zang et al., 2000; Feng et al., 2004, 2005; Karabay and Gunnetur, 2005;
Demsia et al., 2007; Kocaman and Topaktas, 2007, Kocaman et al., 2012) and carcinogenic
(Green et al., 2005; Green et al., 2005a; Pastoor et al., 2005) effects of some neonicotinoid
insecticides. The available literature indicates that only one study has addressed the
cytogenetic effect of thiacloprid in vivo and one another study has addressed the effect in vitro.
Sekeroglu et al. (2011) reported that thiacloprid significantly decreased the mitotic index (MI)
and binuclear cell numbers and significantly increased the chromosome aberrations
(112.5mg/kg, for 24 h) and also caused a significant increase in micronucleated binuclear cells
(22.5mg/kg/day, for 30 days) in rat bone marrow cells. Kocaman et al. (2012) reported that
thiacloprid increased the chromosome aberration and sister chromatid exchange significantly at
all tested concentrations of 75, 150, and 300µg/ml during an in vitro study on human
peripheral lymphocytes.
However, the genotoxic as well as cytotoxic potential of thiacloprid have not yet been
investigated in a single study. As observed in the previous chapters, thiacloprid exposure can
induce oxidative stress, which may form DNA adducts and cause DNA damage. Increased
DNA damage to bone marrow cells is known to lead to apoptosis or mutation in the cells.
Apoptosis contributes to the pathogenesis of a number of diseases, including cancer
(Thompson, 1995). Cell death in response to DNA damage, in most instances, has been shown
to result from apoptosis (Thompson, 1995). Apoptosis is induced by many cytotoxic chemicals
Chapter 4 116
and ionizing radiation and is characterized by morphological and biochemical changes such as
chromatin condensation, nuclear fragmentation, formation of apoptotic bodies and DNA
fragmentation at internucleosomal sites (Yusuke and Shosuke, 1996). Moreover, the DNA of
apoptotic cells shows a unique fragmented pattern in gel electrophoresis experiments.
Electrophoresis has proved to be a powerful molecular-level tool to distinguish between
normal and apoptotic cells (Reed, 1994).
It is known that genotoxicity assessment of a particular compound is done by evaluation of its
ability to induce any change in the chromosome structure and number such as gene mutations,
chromosomal rearrangements, or deletions and loss or gain of a whole chromosome.
Chromosome aberration (CA) and micronucleus (MN) formation are among the most widely
used and well-established cytogenetic markers for determination of genotoxicity of any
compound (Carrano and Natarajan, 1988). The structural CA formation results from DNA-
level damage that is associated with an increased risk of cancer and can also be used to predict
genotoxic risk of potentially mutagenic and carcinogenic chemicals (Bonassi et al., 2004;
Norppa et al., 2006; Kocaman et al., 2012).
The rodent bone-marrow MN test is the most widely used short-term in vivo assay for the
identification of genotoxic effects such as chromosome damage and aneuploidy associated
with mutagenesis and carcinogenesis (Heddle, 1973; Schmid, 1973; Vanderkerken et al., 1989;
Demsia et al., 2007). MN can be formed from acentric chromosomal/chromatid fragments or
from whole chromosomes/chromatids that fail to be segregated to daughter nuclei during
mitotic cellular division, because they did not attach properly with the spindle during the
segregation process in anaphase (Fenech, 2007; Bonassi et al., 2004; Fenech et al., 2011).
Thus, both clastogenic and aneugenic effects (leading to structural and numerical CAs,
respectively) can be determined with the micronucleus assay (Norppa and Falck, 2003;
Kocaman et al., 2012).
Genotoxic effects of different types of neonicotinoid insecticides have been investigated by
several researchers (Karabay and Gunnehir, 2005; Kocaman and Topaktas, 2007; Costa et al.,
2009; Stivaktakis et al., 2010; Cavas et al., 2012). However, a literature survey showed that
the studies dealing with the genotoxic and cytotoxic effects of thiacloprid are extremely rare
(Sekeroglu et al., 2011; Kocaman et al., 2012). As thiacloprid is the most frequently used
neonicotinoid pesticide, it is possible that its exposure may have potential toxic effects on non-
target organisms such as mammals, a notion which remains to be properly tetsed. Efforts in
this direction have already revealed the hepatotoxic, thyrotoxic and neurotoxic effects of
Chapter 4 117
thiacloprid in the mammalian system (Chapters 1, 2 and 3). Hence, the current study was
designed to investigate the potential genotoxic and cytotoxic effects of thiacloprid on
mammalian bone marrow, using SD rat as the animal model. To fulfill this objective, various
ROS parameters were estimated to examine the oxidative stress generated by repeated
thiacloprid exposure in rat bone marrow. Potential DNA damage induced by thiacloprid was
assessed by MN test, chromosomal aberration test and comet assay in rat bone marrow.
Possible cell death induced by thiacloprid exposure was also assessed by acridine orange and
ethidium bromide staining of bone marrow smears and results were confirmed by DNA ladder
assay.
MATERIAL AND METHODS
Male Sprague Dawley (SD) rats (weighing 225–275gm) were obtained from CPCSEA
approved animal breeders and housed in well-ventilated cages in a temperature/humidity-
controlled room, with access to water and food ad libitum. All animal experiments were
approved by IAEC as per the standard guidelines of CPCSEA, India. Thiacloprid (Alanto 240,
21.7%SC) was purchased from the local market in Vadodara. Test compound was dissolved in
distilled water to obtain the desired dose concentrations of 50mg/kg body weight and
100mg/kg body weight (1/30 and 1/15 of its LD50 value respectively). Rats were given oral
doses of thiacloprid by intubation once in a day for 28 days and 90 days (subacute and
subchronic studies respectively). For both the studies, animals were divided into three groups
as control, low dose treatment group [50mg/kg body weight (LTD)] and high dose treatment
group [100mg/kg body weight (HTD)] with 5 animals in each group.
The rats were euthanized under mild diethyl ether anaesthesia after overnight fasting. Bone
marrow was removed from the femur bones in RPMI 1640 medium and then centrifuged at
3000rpm for 5 minutes. The pellet was resuspended again in RPMI 1640 medium. Bone
marrow smear was prepared on clean glass slide and remaining marrow was used for
evaluating ROS parameters.
Protocol I: Oxidative stress parameters
The lipid peroxidation product, malondialdehyde (MDA), was estimated by thiobarbituric acid
(TBA) method (Janero, 1998) and intensity of colour was measured at 532nm. Catalase
activity was measured at 590nm by the method of Sinha et al. (1972). Marklund and Marklund
method (1974) was adopted to estimate the superoxide dismutase (SOD) activity at 420nm.
Chapter 4 118
The activity of glutathione peroxidase (GPx) was determined by the method of Rotruck et al.
(1973) and the GSH content remaining after the reaction was measured by the method of
Ellman et al. (1961) at 412nm. The method described by Habig et al. (1994) was used for
estimating the activity of Glutathione-S-transferase (GST) at 340nm. The reduced glutathione
level was measured at 412nm by the method of Beutler et al. (1963).
Protocol II: Cytotoxicity and Genotoxicity parameters
Bone marrow smear was fixed, followed by staining with acridine orange:ethidium bromide
(AO/EB) (1:1) solution for 2 minutes and then washed with PBS. At least 1000 bone marrow
cells were examined for each group under fluorescent microscope (Leica DM2500) using a
fluorescein filter and 40X objective. Green fluorescence is observed for viable cells and red
fluorescence for necrotic cells, while the apoptotic cells show red and green fluorescence with
apoptotic characteristics.
Micronucleus (MN) test was performed according to prescribed protocol of Romagna and
Staniforth (1989). Bone marrow smear was stained for 5 minutes with 10µg/ml acridine orange
fluorescent dye followed by washing with PBS twice. Slides were observed under fluorescent
microscope to score micronuclei. 1000 cells were counted per rat. Bone marrow smear was
stained with 2% Geimsa stain to score polychromatic erythrocyte (PCE) (immature or
intermediate erythrocyte with ribosome) and normochromatic erythrocyte (NCE) (mature
erythrocyte without ribosome). PCE/NCE ratio was calculated for analysis of cytotoxicity of
test chemical. Micronucleated PCE (MNPCE) and micronucleated NCE (MNNCE) were also
scored with Geimsa staining.
Evans et al. (1964) method was used for metaphase chromosome preparation. Rats were
weighed and colchicine (4mg/kg body weight) was administered intraperitoneally 2.5 hrs prior
to the harvest of bone marrow cells. The collected bone marrow cells were agitated in 0.6%
KCl and then incubated at 50ºC in water bath for 45 minutes, followed by centrifugation. The
pellet was fixed using 3:1 (Methanol: Glacial acetic acid) fixative, agitated properly and then
centrifuged at 3000 rpm for 10 minutes to again collect the pellet. This step was repeated
twice. Cells were spread on a chilled glass slide which was then kept on a hot plate at 60ºC for
10 seconds. Finally slides were stained with 2% Geimsa for 10 minutes.
Comet assay was performed in rat bone marrow cells, according to the in vivo comet assay
guidelines of Tice et al. (2000), as described by Saquib et al. (2009). Bone marrow cells were
mixed with 1% Low Melting Agarose (LMA), then layered onto slides pre-coated with 1%
Chapter 4 119
agarose and kept at 4°C for 10 min. After gelling, another layer of LMA was added onto it.
Cells were lysed overnight in a lysis buffer and then rinsed in PBS twice before subjecting to
DNA denaturation in cold electrophoretic buffer at 4°C for 20 minutes. Electrophoresis was
performed at 25V (300mA) at 4 °C for 30 minutes. Slides were then washed with
neutralization buffer thrice. Each slide was stained with 20μg/ml ethidium bromide solution
and analyzed at 40X magnification (excitation wavelength of 515-560nm and emission
wavelength of 590nm) using a fluorescence microscope (Leica DM2500). Images from 100
cells (50 from each replicate slide) were randomly selected and subjected to image analysis
with CometScore software (TriTek Corporation, Virginia). Mean values of the Olive tail
movement (OTM), tail length (μm) and % DNA in tail were separately analyzed for statistical
significance. To quantify the DNA damage, tail length (TL) and tail movement (TM) were
evaluated.
Statistical Analysis
The data are expressed as the Mean ± standard error. Differences between the groups were
assessed by one way ANOVA using the SPSS software (version 12.0). The comparisons
between the groups were made using a post hoc Bonferroni test. Differences were considered
significant at p ≤ 0.05.
RESULTS
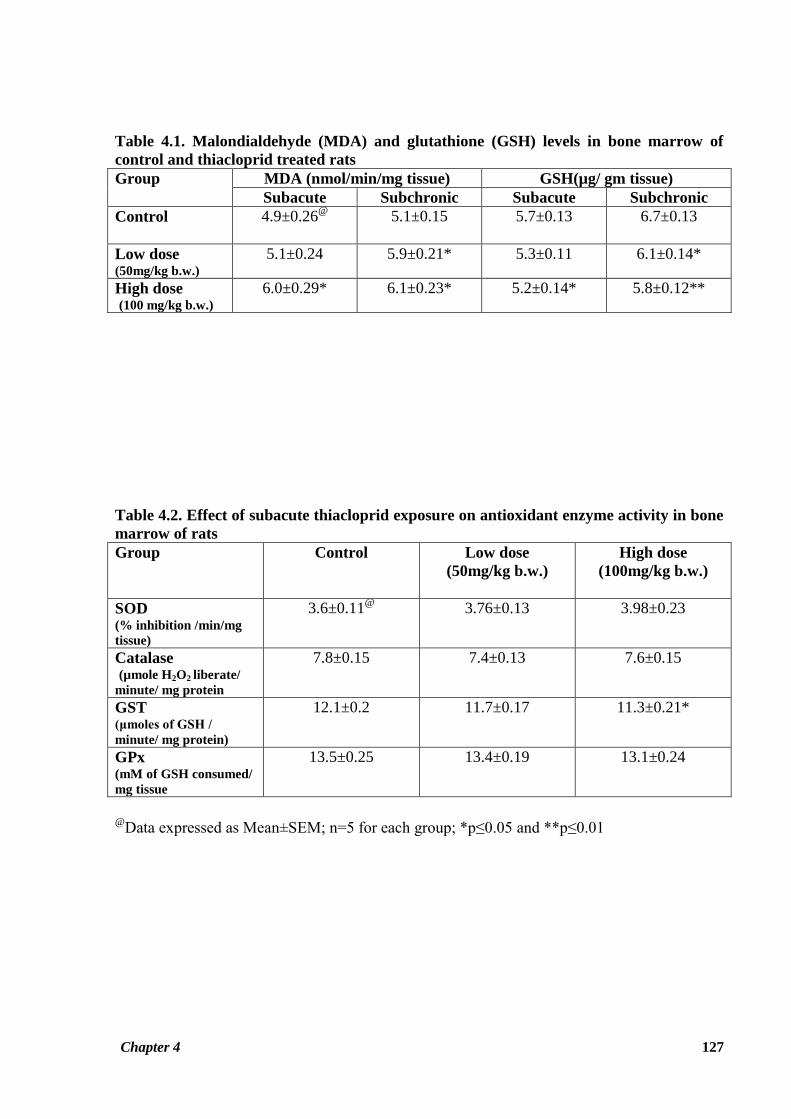
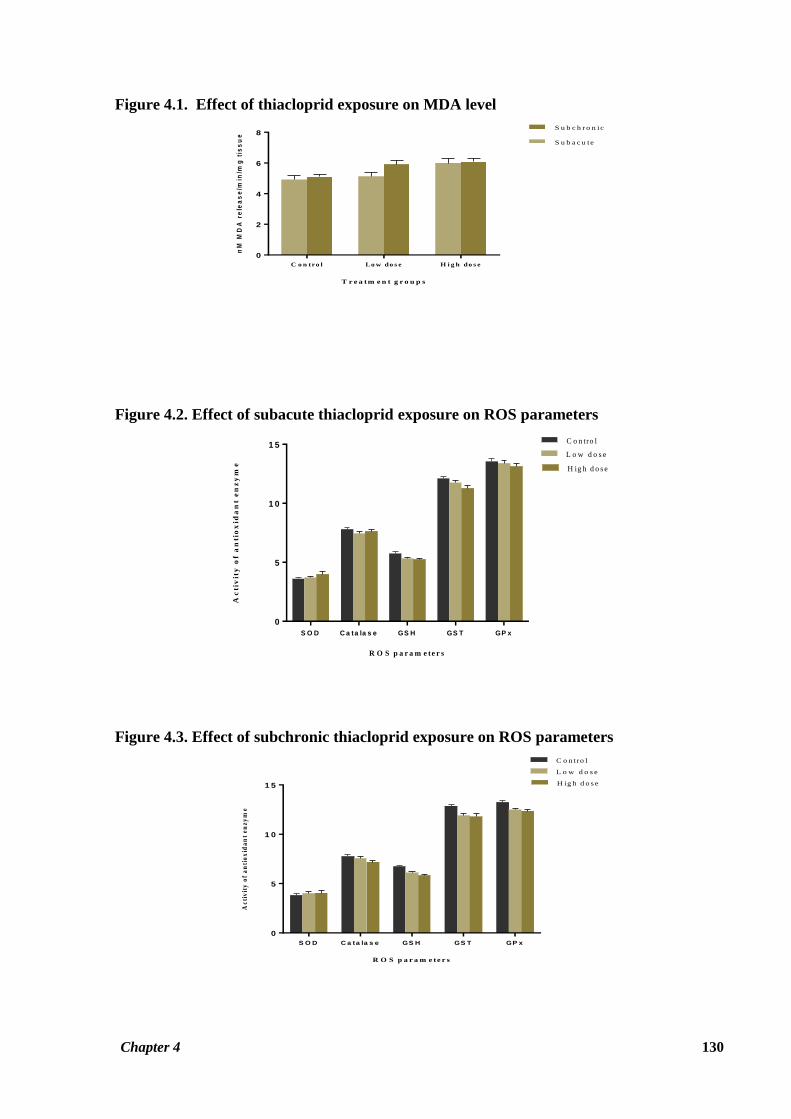
In Table 4.1, bone marrow MDA and GSH levels have been given. Bone marrow MDA levels
observed for animals of HTD group in the subacute study and also for both LTD and HTD
groups in subchronic study were significantly increased (p ≤ 0.05) in comparison with the
corresponding control groups. Furthermore, the increase in TBARS level was also observed
for the bone marrow of animals in the LTD group of the subacute study; however the
difference was not significant (Figure 4.1). A pronounced decrease in treated rat bone marrow
GSH level as compared to control GSH was noted during both the treatment periods. This
decrease was statistically significant for LTD group (p ≤ 0.05) in the subacute study and both
LTD (p ≤ 0.05) and HTD (p ≤ 0.01) groups in the subchronic study. GSH value observed for
the LTD group was also less than the control group, but the difference was not statistically
significant. (Table 4.1, Figures 4.2 and 4.3).
Table 4.2 shows the values for antioxidant enzyme activity in the bone marrow of the
experimental rats given subacute exposure to thiacloprid. Activity of catalase was observed to
be decreased in the both the treatment groups as compared to control group. GST activity was
Chapter 4 120
also found to be decreased in treated rats compared to control animals with significantly lower
activity observed in HTD group (p ≤ 0.05). No significant decrease in GPx activity was
observed for the treatment groups as compared to the control group in the subacute study
(Figure 4.2).
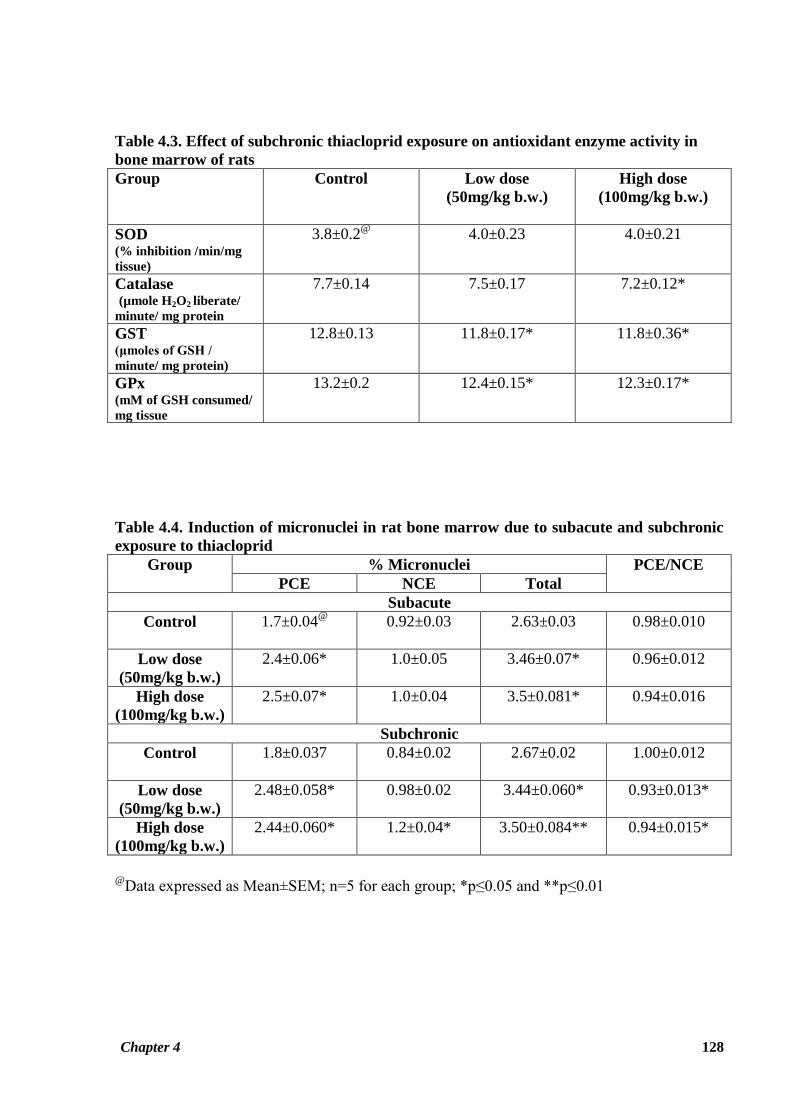
Effect on antioxidant enzyme activity after 90 days of thiacloprid administration is shown in
Table 4.3. Activity of catalase enzyme was found to be decreased in treated rats as compared
to control rats, with the difference being significant for the HTD group (p ≤ 0.05). GST and
GPx activities in bone marrow of treated rats of both the dosage groups were observed to be
significantly decreased as compared to reference group of rats (p ≤ 0.05) (Figure 4.3).
However, it was noted that SOD activity in the bone marrow was not affected by thiacloprid
exposure during both the study periods (Tables 4.2, 4.3; Figures 4.2, 4.3).
Data showing the effect of thiacloprid on rat bone marrow cells giving rise to micronuclei is
given in Table 4.4. Thiacloprid induced a significant increase (p ≤ 0.05) in percent frequency
of MNPCE number in both the treatment groups in the subacute study. Even repeated 90 days
exposure to test compound induced a significant increase in frequency of MNPCE in rat bone
marrow of both the treatment groups (p ≤ 0.05). An increase in percent frequency of MNNCE
in treatment groups as compared to control group was also observed in the subacute study, but
this result was not statistically significant. However, the increase in MNNCE frequency
observed for the HTD group as compared to control group in the subchronic study was
significant (p ≤ 0.05) (Figure 4.4). Total percent frequency of micronucleus induced by
thiacloprid was observed to be significantly higher (p ≤ 0.05) in both the treatment groups as
compared to the control group in subacute study. Same trend was observed for the LTD (p ≤
0.05) and HTD (p ≤ 0.01) groups in the subchronic study as well (Figure 4.4) Figure 4.8 shows
bone marrow cells with a micronucleus in the thiacloprid treated rats.
The cytotoxic potential of thiacloprid was evaluated through the ratio of PCE to NCE among
total cell count of bone marrow. The calculated PCE/NCE ratio is given in Table 4.4. The ratio
of PCE/NCE was observed insignificantly decreased for both the treatment groups in the 28
days study, but a significantly decreased ratio of PCE/NCE was observed for both the
treatment groups as compared to control group in the subchronic study (p ≤ 0.05) (Figure 4.5).
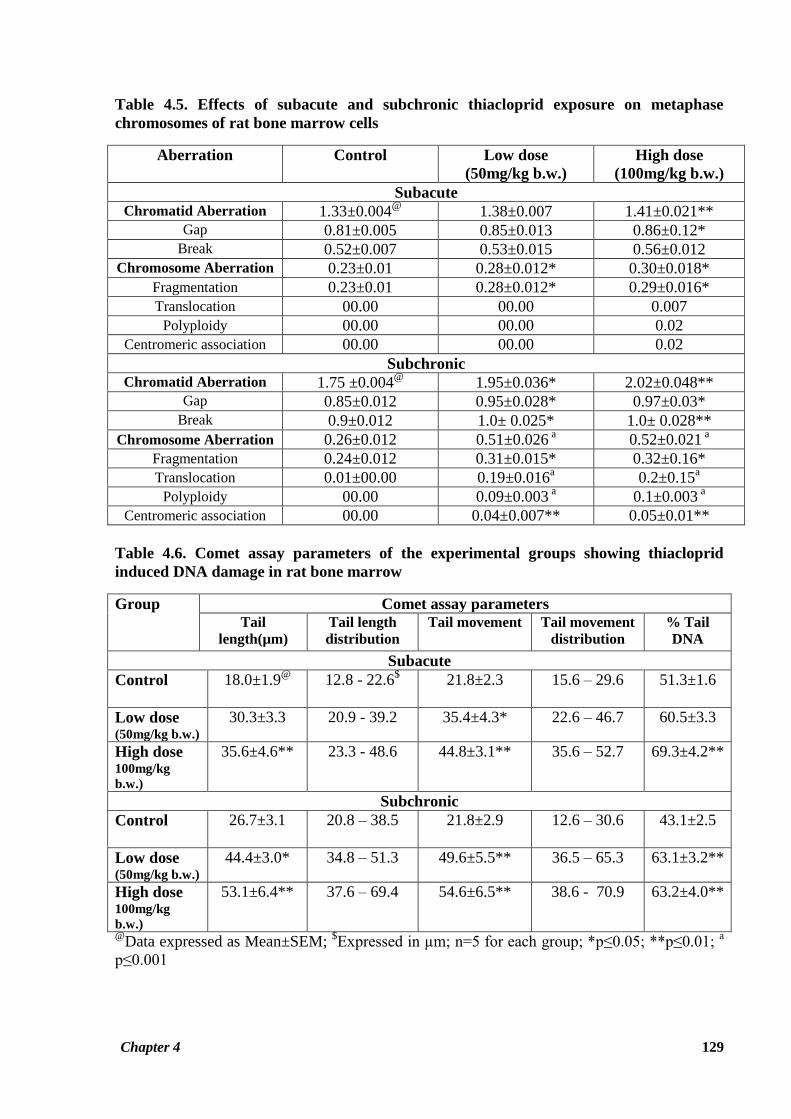
Table 4.5 summarizes the effects of thiacloprid on metaphase chromosomes of rat bone
marrow cells following 28 and 90 days exposure. Thiacloprid induced structural as well as
numerical aberrations in rat bone marrow cells as encountered in the present investigation.
Chapter 4 121
Among these, special emphasis has been put on gaps, breaks, translocation, fragmentation,
centric association (dicentric and ring chromosome) and polyploidy. The increased frequency
of chromatid aberrations with reference to gaps and breaks was observed to be highly
significant for HTD group in both subchronic (p ≤ 0.01) as well as subacute studies (p ≤ 0.01)
as compared to control values. Frequency of these aberrations was also significantly higher for
the LTD group (p ≤ 0.05) in the subchronic study. Thiacloprid treatment also significantly
increased the frequency of chromosome type aberrations in both the treatment groups in the
subacute (p ≤ 0.05) as well as the subchronic study (p ≤ 0.001). Chromosomal aberrations in
the treatment groups of the subchronic study were observed to be increased almost two fold as
compared to control group (Figure 4.10). Among chromosomal aberrations, fragmentation of
chromosome was the most frequently encountered aberration (Figure 4.10 C & D). Frequency
of ring chromosome was observed insignificantly increased due to thiacloprid exposure
(Figure 4.10). Translocation and polyploidy were the least encountered aberrations in
comparison to other chromosomal aberrations. Figure 4.10 represents the various types of
chromosomal aberrations induced by thiacloprid in rat bone marrow cells.
Genotoxicity of thiacloprid on rat bone marrow cells was assessed using comet assay to
analyze the extent of DNA damage at the level of individual cells. Results generated by
CometScore software are illustrated in Table 4.6. Single cell DNA damage as assessed by
comet tail length was found to be highly significant in HTD group of rats as compared to
control group for both the studies (p ≤ 0.01). Rats exposed to thiacloprid at low dose in the
subchronic study also showed significantly increased length of comet tail (p ≤ 0.05). A highly
significant olive tail movement of comet was observed for the HTD groups (p ≤ 0.01) as
compared to control group in both the studies. Tail movement in the LTD group was also
significantly higher (p ≤ 0.05) than the control group in the subacute study. % Tail DNA of
comet was also observed to be significantly higher than the control group, in HTD groups of
both the studies as well as in the LTD group of the subchronic study (p ≤ 0.01) (Figures 4.6 a
& b). DNA damage induced by thiacloprid as assessed by comet assay is shown in Figure 4.11.
Thiacloprid-induced cell-death, as observed by DNA gel electrophoresis, is presented in Figure
4.12. DNA fragmentation was clearly evident in treated rat bone marrow (L-1 and H-1
represent LTD and HTD groups of subacute study; L-2 and H-2 represent LTD and HTD
groups of subacute study), whereas such fragmentation was absent in control (C-1 for
subchronic and C-2 for subacute) rat bone marrow. Moreover, nuclear condensation, cell
shrinkage and fragmentation into apoptotic bodies, which are characteristics of apoptosis were
Chapter 4 122
observed in the thiacloprid treatment groups as visualized in AO/EB stained bone marrow
smears (Figure 4.9). Acridine orange intercalates with DNA and RNA, making the former
appear green while the latter stains red. Thus a viable cell has bright green chromatin in its
nucleus and red-orange cytoplasm. Ethidium bromide is only taken up by nonviable cells.
Ethidium bromide intercalates into DNA, making it appear orange, but binds only weakly to
RNA, which may appear slightly red. Thus a dead cell has bright orange chromatin (the
ethidium overwhelms the acridine) and its cytoplasm, if it has any contents remaining, appears
dark red. Cells that have undergone necrosis have the fluorescent features of nonviable cells
but do not have apoptotic nuclear morphology (Ribble et al., 2005). Based on these features, it
was observed that a greater number of cells were in the apoptotic phase in thiacloprid treated
groups and also that thiacloprid induced cell apoptosis in a dose dependent manner (Figure
4.9).
DISCUSSION
The present study was designed to evaluate the cytotoxic and genotoxic effects of the
neonicotinoid thiacloprid. In this regard, several studies were carried out and one among these
was the evaluation of oxidative defense mechanisms in the bone marrow of thiacloprid treated
rats. Results obtained demonstrated that exposure of rats to thiacloprid decreased the activity
of antioxidant enzymes as well as the GSH level and increased the TBARS level, indicating
that that the test compound may result in the impairment of antioxidant mechanisms and
metabolic detoxification in organs. As such, the decrease in antioxidant enzyme levels is
interpreted as an indirect inhibition of their activity by their binding with oxidative molecules
produced during pesticide metabolism after exposure (Duzguner and Erdogan, 2012).
Neonicotinoid exposure can promote lipid peroxidation and hence, the LPO activity was also
assessed during the current thiacloprid induced genotoxicity study. Lipid peroxidation results
in altered membrane function and production of toxic and reactive aldehydes, mainly MDA,
which is capable of interacting with proteins or DNA and thereby possibly promoting
mutagenesis (Cheeseman, 1993; Toyokuni, 1996). Oxygen free radicals generated due to
exposure to pesticides can cause tissue damage by triggering several oxidative mechanisms
and lipid peroxidation (Kanbur et al., 2008). Indeed, Duzguner and Erdogan (2012) reported
that neonicotinoid imidacloprid leads to lipid peroxidation in various organs of rats. Similar
result of the significant increase of MDA, the index of lipid peroxidation, in bone marrow
Chapter 4 123
following thiacloprid treatment is an important evidence of oxidative stress in the present
study.
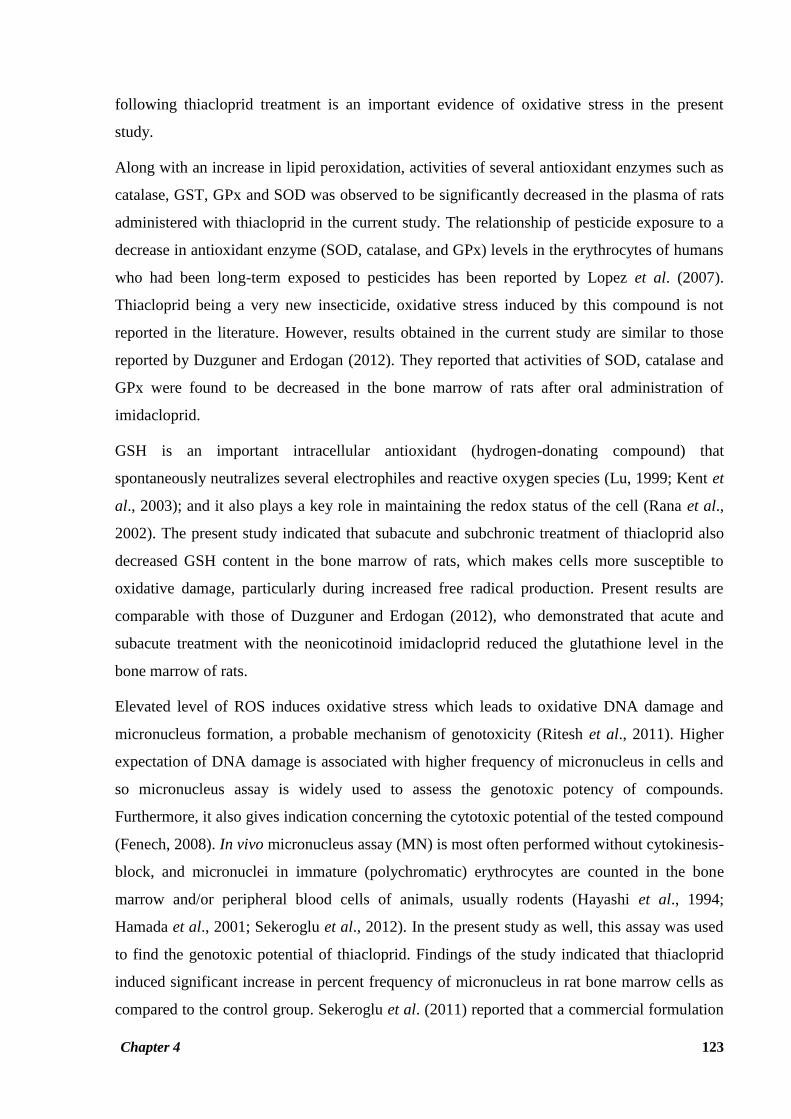
Along with an increase in lipid peroxidation, activities of several antioxidant enzymes such as
catalase, GST, GPx and SOD was observed to be significantly decreased in the plasma of rats
administered with thiacloprid in the current study. The relationship of pesticide exposure to a
decrease in antioxidant enzyme (SOD, catalase, and GPx) levels in the erythrocytes of humans
who had been long-term exposed to pesticides has been reported by Lopez et al. (2007).
Thiacloprid being a very new insecticide, oxidative stress induced by this compound is not
reported in the literature. However, results obtained in the current study are similar to those
reported by Duzguner and Erdogan (2012). They reported that activities of SOD, catalase and
GPx were found to be decreased in the bone marrow of rats after oral administration of
imidacloprid.
GSH is an important intracellular antioxidant (hydrogen-donating compound) that
spontaneously neutralizes several electrophiles and reactive oxygen species (Lu, 1999; Kent et
al., 2003); and it also plays a key role in maintaining the redox status of the cell (Rana et al.,
2002). The present study indicated that subacute and subchronic treatment of thiacloprid also
decreased GSH content in the bone marrow of rats, which makes cells more susceptible to
oxidative damage, particularly during increased free radical production. Present results are
comparable with those of Duzguner and Erdogan (2012), who demonstrated that acute and
subacute treatment with the neonicotinoid imidacloprid reduced the glutathione level in the
bone marrow of rats.
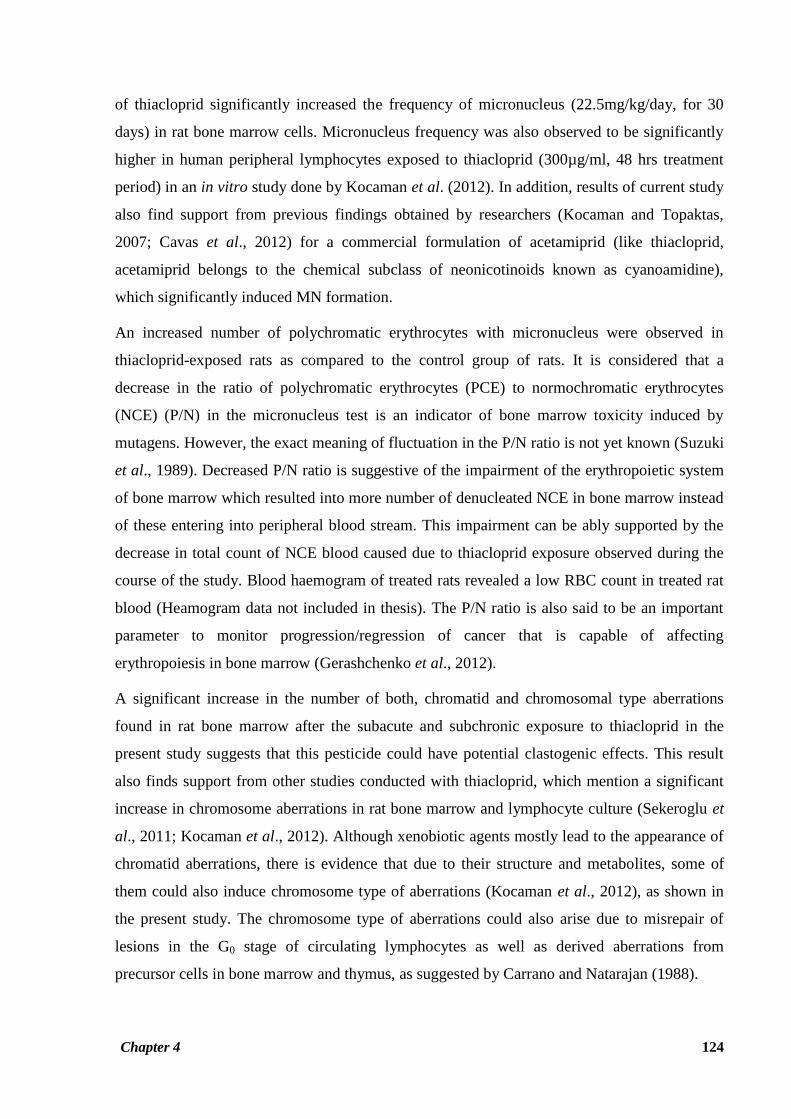
Elevated level of ROS induces oxidative stress which leads to oxidative DNA damage and
micronucleus formation, a probable mechanism of genotoxicity (Ritesh et al., 2011). Higher
expectation of DNA damage is associated with higher frequency of micronucleus in cells and
so micronucleus assay is widely used to assess the genotoxic potency of compounds.
Furthermore, it also gives indication concerning the cytotoxic potential of the tested compound
(Fenech, 2008). In vivo micronucleus assay (MN) is most often performed without cytokinesis-
block, and micronuclei in immature (polychromatic) erythrocytes are counted in the bone
marrow and/or peripheral blood cells of animals, usually rodents (Hayashi et al., 1994;
Hamada et al., 2001; Sekeroglu et al., 2012). In the present study as well, this assay was used
to find the genotoxic potential of thiacloprid. Findings of the study indicated that thiacloprid
induced significant increase in percent frequency of micronucleus in rat bone marrow cells as
compared to the control group. Sekeroglu et al. (2011) reported that a commercial formulation
Chapter 4 124
of thiacloprid significantly increased the frequency of micronucleus (22.5mg/kg/day, for 30
days) in rat bone marrow cells. Micronucleus frequency was also observed to be significantly
higher in human peripheral lymphocytes exposed to thiacloprid (300µg/ml, 48 hrs treatment
period) in an in vitro study done by Kocaman et al. (2012). In addition, results of current study
also find support from previous findings obtained by researchers (Kocaman and Topaktas,
2007; Cavas et al., 2012) for a commercial formulation of acetamiprid (like thiacloprid,
acetamiprid belongs to the chemical subclass of neonicotinoids known as cyanoamidine),
which significantly induced MN formation.
An increased number of polychromatic erythrocytes with micronucleus were observed in
thiacloprid-exposed rats as compared to the control group of rats. It is considered that a
decrease in the ratio of polychromatic erythrocytes (PCE) to normochromatic erythrocytes
(NCE) (P/N) in the micronucleus test is an indicator of bone marrow toxicity induced by
mutagens. However, the exact meaning of fluctuation in the P/N ratio is not yet known (Suzuki
et al., 1989). Decreased P/N ratio is suggestive of the impairment of the erythropoietic system
of bone marrow which resulted into more number of denucleated NCE in bone marrow instead
of these entering into peripheral blood stream. This impairment can be ably supported by the
decrease in total count of NCE blood caused due to thiacloprid exposure observed during the
course of the study. Blood haemogram of treated rats revealed a low RBC count in treated rat
blood (Heamogram data not included in thesis). The P/N ratio is also said to be an important
parameter to monitor progression/regression of cancer that is capable of affecting
erythropoiesis in bone marrow (Gerashchenko et al., 2012).
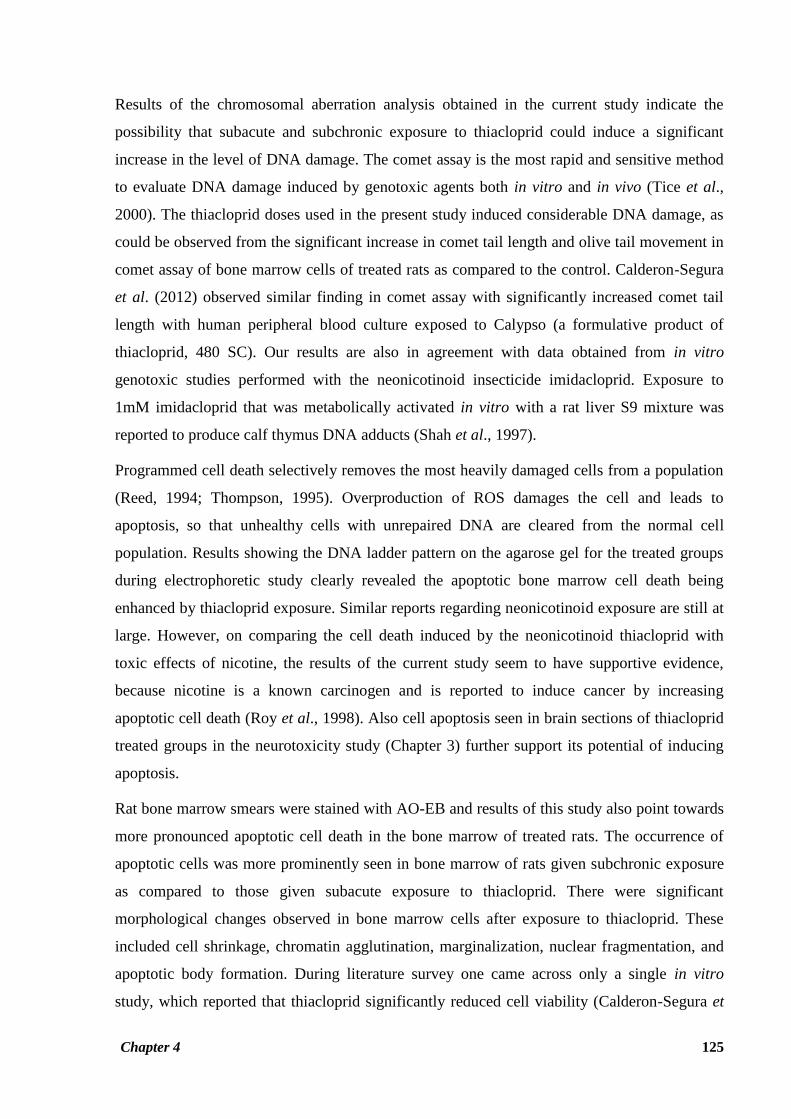
A significant increase in the number of both, chromatid and chromosomal type aberrations
found in rat bone marrow after the subacute and subchronic exposure to thiacloprid in the
present study suggests that this pesticide could have potential clastogenic effects. This result
also finds support from other studies conducted with thiacloprid, which mention a significant
increase in chromosome aberrations in rat bone marrow and lymphocyte culture (Sekeroglu et
al., 2011; Kocaman et al., 2012). Although xenobiotic agents mostly lead to the appearance of
chromatid aberrations, there is evidence that due to their structure and metabolites, some of
them could also induce chromosome type of aberrations (Kocaman et al., 2012), as shown in
the present study. The chromosome type of aberrations could also arise due to misrepair of
lesions in the G0 stage of circulating lymphocytes as well as derived aberrations from
precursor cells in bone marrow and thymus, as suggested by Carrano and Natarajan (1988).
Chapter 4 125
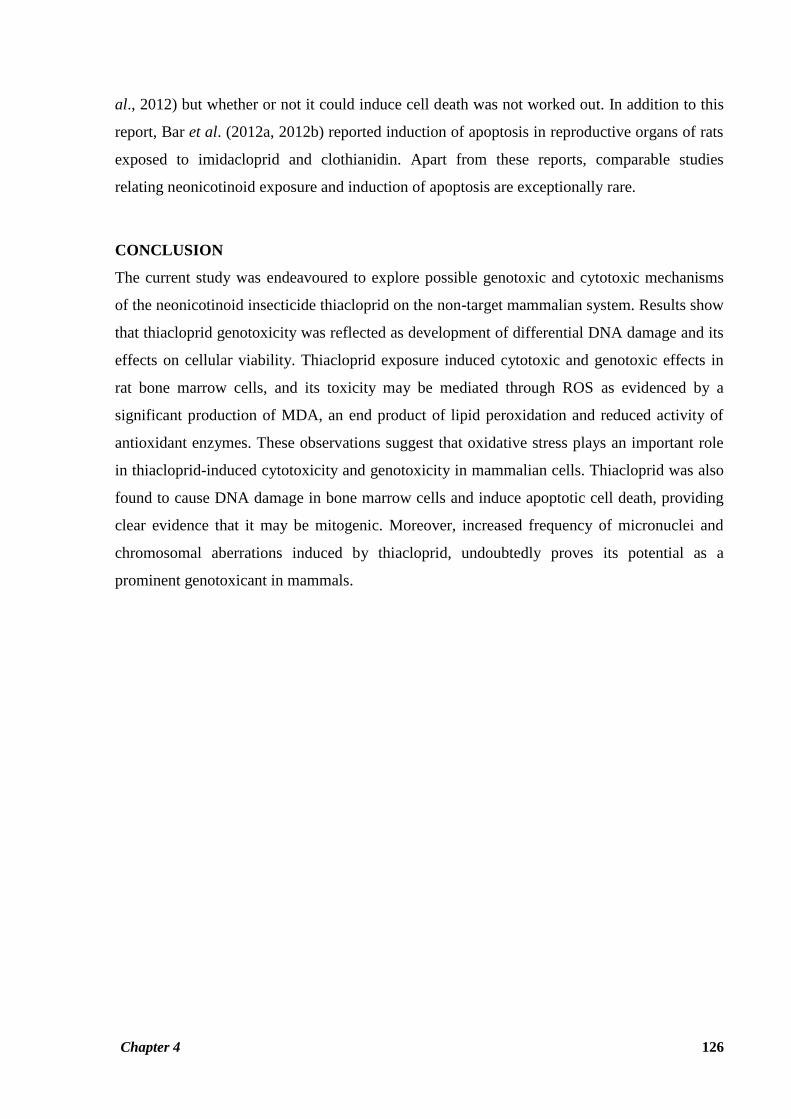
Results of the chromosomal aberration analysis obtained in the current study indicate the
possibility that subacute and subchronic exposure to thiacloprid could induce a significant
increase in the level of DNA damage. The comet assay is the most rapid and sensitive method
to evaluate DNA damage induced by genotoxic agents both in vitro and in vivo (Tice et al.,
2000). The thiacloprid doses used in the present study induced considerable DNA damage, as
could be observed from the significant increase in comet tail length and olive tail movement in
comet assay of bone marrow cells of treated rats as compared to the control. Calderon-Segura
et al. (2012) observed similar finding in comet assay with significantly increased comet tail
length with human peripheral blood culture exposed to Calypso (a formulative product of
thiacloprid, 480 SC). Our results are also in agreement with data obtained from in vitro
genotoxic studies performed with the neonicotinoid insecticide imidacloprid. Exposure to
1mM imidacloprid that was metabolically activated in vitro with a rat liver S9 mixture was
reported to produce calf thymus DNA adducts (Shah et al., 1997).
Programmed cell death selectively removes the most heavily damaged cells from a population
(Reed, 1994; Thompson, 1995). Overproduction of ROS damages the cell and leads to
apoptosis, so that unhealthy cells with unrepaired DNA are cleared from the normal cell
population. Results showing the DNA ladder pattern on the agarose gel for the treated groups
during electrophoretic study clearly revealed the apoptotic bone marrow cell death being
enhanced by thiacloprid exposure. Similar reports regarding neonicotinoid exposure are still at
large. However, on comparing the cell death induced by the neonicotinoid thiacloprid with
toxic effects of nicotine, the results of the current study seem to have supportive evidence,
because nicotine is a known carcinogen and is reported to induce cancer by increasing
apoptotic cell death (Roy et al., 1998). Also cell apoptosis seen in brain sections of thiacloprid
treated groups in the neurotoxicity study (Chapter 3) further support its potential of inducing
apoptosis.
Rat bone marrow smears were stained with AO-EB and results of this study also point towards
more pronounced apoptotic cell death in the bone marrow of treated rats. The occurrence of
apoptotic cells was more prominently seen in bone marrow of rats given subchronic exposure
as compared to those given subacute exposure to thiacloprid. There were significant
morphological changes observed in bone marrow cells after exposure to thiacloprid. These
included cell shrinkage, chromatin agglutination, marginalization, nuclear fragmentation, and
apoptotic body formation. During literature survey one came across only a single in vitro
study, which reported that thiacloprid significantly reduced cell viability (Calderon-Segura et
Chapter 4 126
al., 2012) but whether or not it could induce cell death was not worked out. In addition to this
report, Bar et al. (2012a, 2012b) reported induction of apoptosis in reproductive organs of rats
exposed to imidacloprid and clothianidin. Apart from these reports, comparable studies
relating neonicotinoid exposure and induction of apoptosis are exceptionally rare.
CONCLUSION
The current study was endeavoured to explore possible genotoxic and cytotoxic mechanisms
of the neonicotinoid insecticide thiacloprid on the non-target mammalian system. Results show
that thiacloprid genotoxicity was reflected as development of differential DNA damage and its
effects on cellular viability. Thiacloprid exposure induced cytotoxic and genotoxic effects in
rat bone marrow cells, and its toxicity may be mediated through ROS as evidenced by a
significant production of MDA, an end product of lipid peroxidation and reduced activity of
antioxidant enzymes. These observations suggest that oxidative stress plays an important role
in thiacloprid-induced cytotoxicity and genotoxicity in mammalian cells. Thiacloprid was also
found to cause DNA damage in bone marrow cells and induce apoptotic cell death, providing
clear evidence that it may be mitogenic. Moreover, increased frequency of micronuclei and
chromosomal aberrations induced by thiacloprid, undoubtedly proves its potential as a
prominent genotoxicant in mammals.
Chapter 4 127
Table 4.1. Malondialdehyde (MDA) and glutathione (GSH) levels in bone marrow of
control and thiacloprid treated rats
Group MDA (nmol/min/mg tissue) GSH(µg/ gm tissue)
Subacute Subchronic Subacute Subchronic
Control
4.9±0.26@
5.1±0.15 5.7±0.13 6.7±0.13
Low dose (50mg/kg b.w.)
5.1±0.24 5.9±0.21* 5.3±0.11 6.1±0.14*
High dose (100 mg/kg b.w.)
6.0±0.29* 6.1±0.23* 5.2±0.14* 5.8±0.12**
Table 4.2. Effect of subacute thiacloprid exposure on antioxidant enzyme activity in bone
marrow of rats
Group
Control Low dose
(50mg/kg b.w.)
High dose
(100mg/kg b.w.)
SOD (% inhibition /min/mg
tissue)
3.6±0.11@
3.76±0.13 3.98±0.23
Catalase (µmole H2O2 liberate/
minute/ mg protein
7.8±0.15 7.4±0.13 7.6±0.15
GST (μmoles of GSH /
minute/ mg protein)
12.1±0.2 11.7±0.17 11.3±0.21*
GPx (mM of GSH consumed/
mg tissue
13.5±0.25 13.4±0.19 13.1±0.24
@
Data expressed as Mean±SEM; n=5 for each group; *p≤0.05 and **p≤0.01
Chapter 4 128
Table 4.3. Effect of subchronic thiacloprid exposure on antioxidant enzyme activity in
bone marrow of rats
Group
Control Low dose
(50mg/kg b.w.)
High dose
(100mg/kg b.w.)
SOD (% inhibition /min/mg
tissue)
3.8±0.2@
4.0±0.23 4.0±0.21
Catalase (µmole H2O2 liberate/
minute/ mg protein
7.7±0.14 7.5±0.17 7.2±0.12*
GST (μmoles of GSH /
minute/ mg protein)
12.8±0.13 11.8±0.17* 11.8±0.36*
GPx (mM of GSH consumed/
mg tissue
13.2±0.2 12.4±0.15* 12.3±0.17*
Table 4.4. Induction of micronuclei in rat bone marrow due to subacute and subchronic
exposure to thiacloprid
Group
% Micronuclei PCE/NCE
PCE NCE Total
Subacute
Control
1.7±0.04@
0.92±0.03 2.63±0.03 0.98±0.010
Low dose
(50mg/kg b.w.)
2.4±0.06* 1.0±0.05 3.46±0.07* 0.96±0.012
High dose
(100mg/kg b.w.)
2.5±0.07* 1.0±0.04 3.5±0.081* 0.94±0.016
Subchronic
Control
1.8±0.037 0.84±0.02 2.67±0.02 1.00±0.012
Low dose
(50mg/kg b.w.)
2.48±0.058* 0.98±0.02 3.44±0.060* 0.93±0.013*
High dose
(100mg/kg b.w.)
2.44±0.060* 1.2±0.04* 3.50±0.084** 0.94±0.015*
@
Data expressed as Mean±SEM; n=5 for each group; *p≤0.05 and **p≤0.01
Chapter 4 129
Table 4.5. Effects of subacute and subchronic thiacloprid exposure on metaphase
chromosomes of rat bone marrow cells
Aberration
Control Low dose
(50mg/kg b.w.)
High dose
(100mg/kg b.w.)
Subacute
Chromatid Aberration 1.33±0.004@
1.38±0.007 1.41±0.021** Gap 0.81±0.005 0.85±0.013 0.86±0.12*
Break 0.52±0.007 0.53±0.015 0.56±0.012
Chromosome Aberration 0.23±0.01 0.28±0.012* 0.30±0.018*
Fragmentation 0.23±0.01 0.28±0.012* 0.29±0.016*
Translocation 00.00 00.00 0.007
Polyploidy 00.00 00.00 0.02
Centromeric association 00.00 00.00 0.02
Subchronic
Chromatid Aberration 1.75 ±0.004@
1.95±0.036* 2.02±0.048** Gap 0.85±0.012 0.95±0.028* 0.97±0.03*
Break 0.9±0.012 1.0± 0.025* 1.0± 0.028**
Chromosome Aberration 0.26±0.012 0.51±0.026 a 0.52±0.021
a
Fragmentation 0.24±0.012 0.31±0.015* 0.32±0.16*
Translocation 0.01±00.00 0.19±0.016a 0.2±0.15
a
Polyploidy 00.00 0.09±0.003 a 0.1±0.003
a
Centromeric association 00.00 0.04±0.007** 0.05±0.01**
Table 4.6. Comet assay parameters of the experimental groups showing thiacloprid
induced DNA damage in rat bone marrow
Group Comet assay parameters
Tail
length(µm) Tail length
distribution
Tail movement Tail movement
distribution % Tail
DNA
Subacute
Control 18.0±1.9@
12.8 - 22.6$ 21.8±2.3 15.6 – 29.6 51.3±1.6
Low dose (50mg/kg b.w.)
30.3±3.3 20.9 - 39.2 35.4±4.3* 22.6 – 46.7 60.5±3.3
High dose 100mg/kg
b.w.)
35.6±4.6** 23.3 - 48.6 44.8±3.1** 35.6 – 52.7 69.3±4.2**
Subchronic
Control 26.7±3.1 20.8 – 38.5 21.8±2.9
12.6 – 30.6 43.1±2.5
Low dose (50mg/kg b.w.)
44.4±3.0* 34.8 – 51.3 49.6±5.5** 36.5 – 65.3 63.1±3.2**
High dose 100mg/kg
b.w.)
53.1±6.4** 37.6 – 69.4 54.6±6.5** 38.6 - 70.9 63.2±4.0**
@Data expressed as Mean±SEM;
$Expressed in µm; n=5 for each group; *p≤0.05; **p≤0.01;
a
p≤0.001
Chapter 4 130
Figure 4.1. Effect of thiacloprid exposure on MDA level
T r e a tm e n t g r o u p s
nM
MD
A r
ele
as
e/m
in/m
g t
iss
ue
C o n tro l Lo w do s e H i g h do s e
0
2
4
6
8
S u b a c u te
S u b c h r o n ic
Figure 4.2. Effect of subacute thiacloprid exposure on ROS parameters
R O S p a r a m e te r s
Ac
tiv
ity
of a
ntio
xid
an
t e
nz
ym
e
S O D C a ta la s e GS H GS T GP x
0
5
1 0
1 5C o n tro l
L o w d o s e
H ig h d o s e
Figure 4.3. Effect of subchronic thiacloprid exposure on ROS parameters
R O S p a r a m e te r s
Ac
tiv
ity
of
an
tio
xid
an
t e
nz
ym
e
S O D C a ta la s e GS H GS T GP x
0
5
1 0
1 5
C o n tro l
L o w d o s e
H ig h d o s e
Chapter 4 131
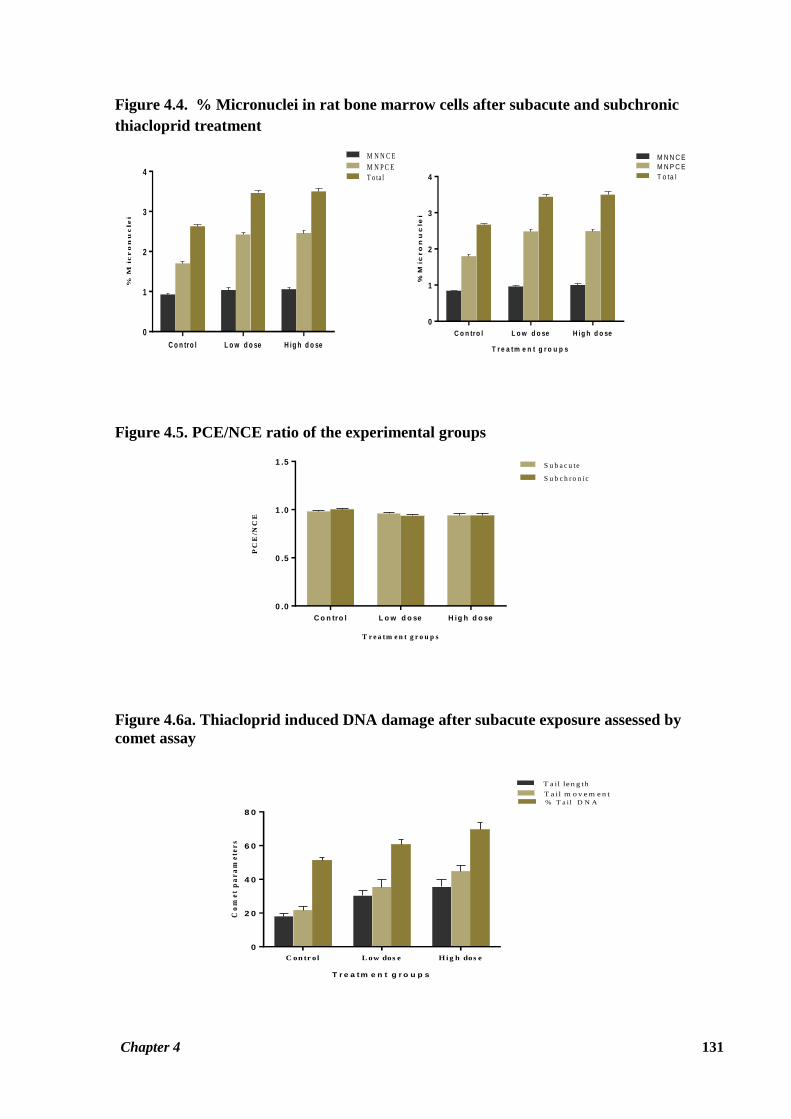
Figure 4.4. % Micronuclei in rat bone marrow cells after subacute and subchronic
thiacloprid treatment %
Mic
ro
nu
cle
i
C o n tro l L o w d o se H ig h d o se
0
1
2
3
4
M N N C E
M N P C E
T o ta l
T r e a tm e n t g r o u p s
%M
icro
nu
cle
i
C o n tro l L o w d o se H ig h d o se
0
1
2
3
4
M N N C E
M N P C E
T o ta l
Figure 4.5. PCE/NCE ratio of the experimental groups
T r e a tm e n t g r o u p s
PC
E/N
CE
C o n tro l L o w d o se H ig h d o se
0 .0
0 .5
1 .0
1 .5 S u b a c u te
S u b c h r o n ic
Figure 4.6a. Thiacloprid induced DNA damage after subacute exposure assessed by
comet assay
T r e a tm e n t g r o u p s
Co
me
t p
ar
am
ete
rs
C on tr ol L ow dos e H i g h dos e
0
2 0
4 0
6 0
8 0
T a il le n g th
T a il m o v e m e n t
% T a il D N A
Chapter 4 132
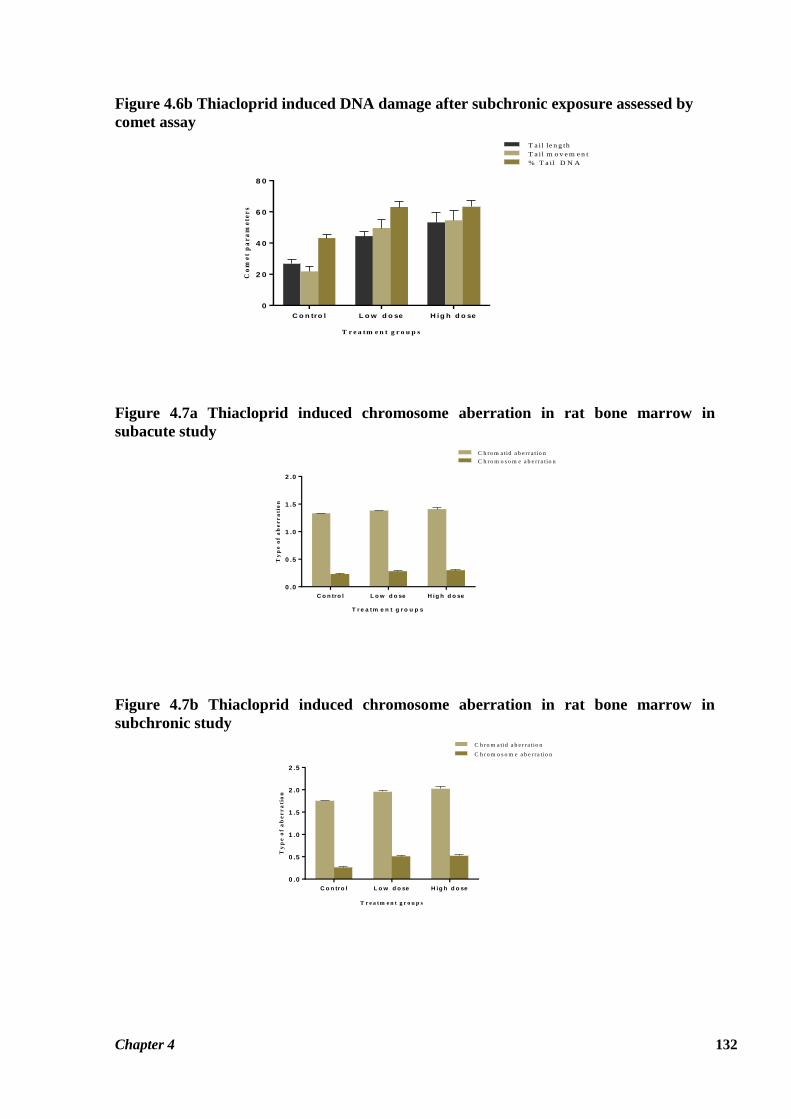
Figure 4.6b Thiacloprid induced DNA damage after subchronic exposure assessed by
comet assay
T r e a tm e n t g r o u p s
Co
me
t p
ar
am
ete
rs
C o n tro l L o w d o se H ig h d o se
0
2 0
4 0
6 0
8 0
T a il le n g th
T a il m o v e m e n t
% T a il D N A
Figure 4.7a Thiacloprid induced chromosome aberration in rat bone marrow in
subacute study
T r e a tm e n t g r o u p s
Ty
pe
of
ab
er
ra
tio
n
C o n tro l L o w d o se H ig h d o se
0 .0
0 .5
1 .0
1 .5
2 .0
C h ro m a tid a b e r ra t io n
C h ro m o s o m e a b e r ra tio n
Figure 4.7b Thiacloprid induced chromosome aberration in rat bone marrow in
subchronic study
T r e a tm e n t g r o u p s
Ty
pe
of
ab
er
ra
tio
n
C o n tro l L o w d o se H ig h d o se
0 .0
0 .5
1 .0
1 .5
2 .0
2 .5
C h ro m a tid a b e r ra t io n
C h ro m o s o m e a b e r ra tio n
Chapter 4 133
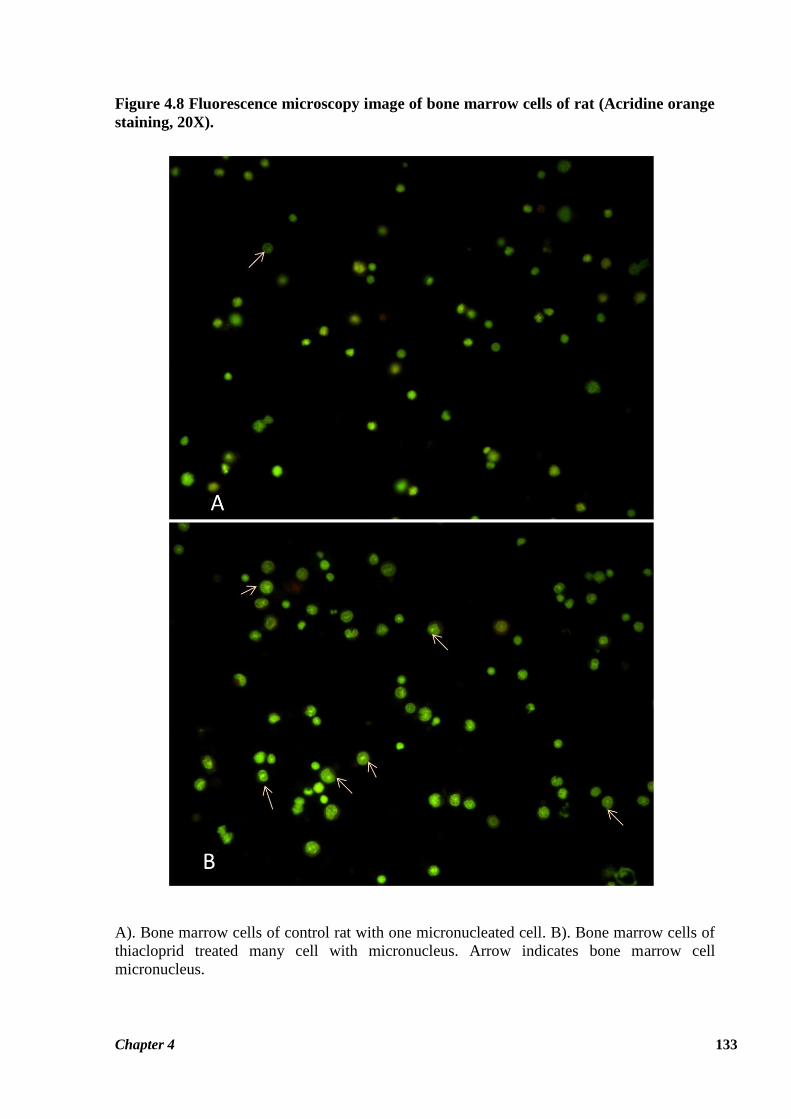
Figure 4.8 Fluorescence microscopy image of bone marrow cells of rat (Acridine orange
staining, 20X).
A). Bone marrow cells of control rat with one micronucleated cell. B). Bone marrow cells of
thiacloprid treated many cell with micronucleus. Arrow indicates bone marrow cell
micronucleus.
Chapter 4 134
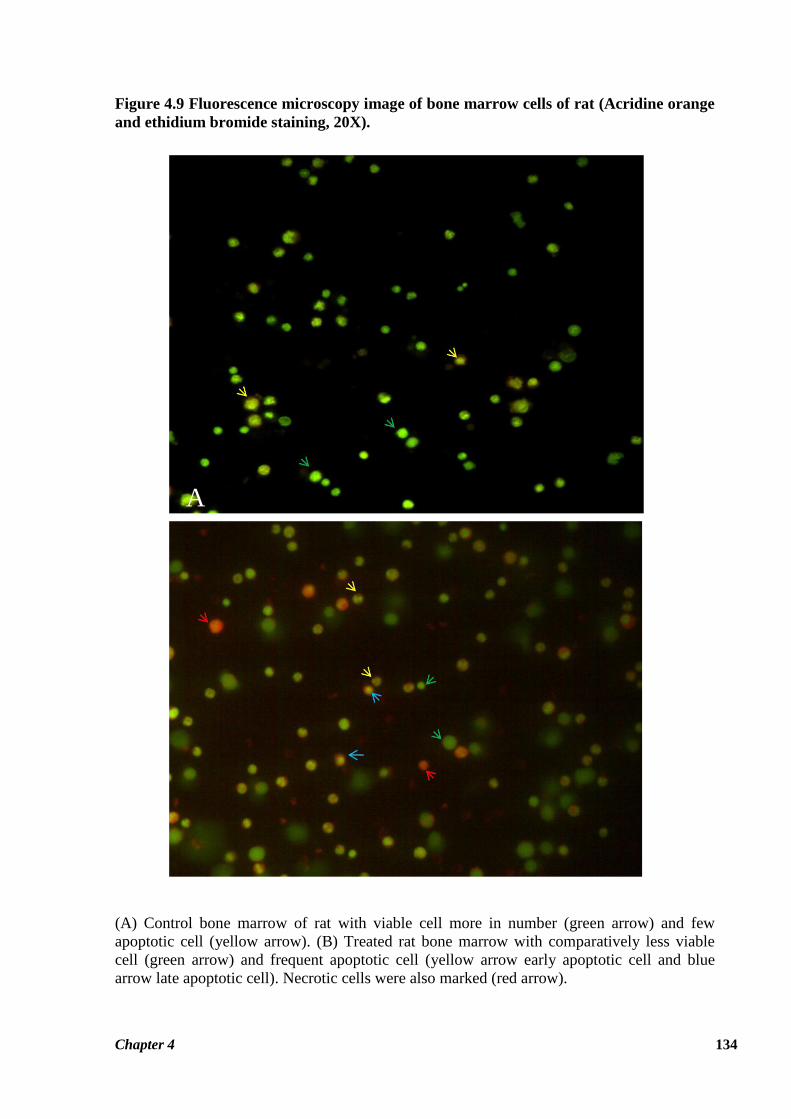
Figure 4.9 Fluorescence microscopy image of bone marrow cells of rat (Acridine orange
and ethidium bromide staining, 20X).
(A) Control bone marrow of rat with viable cell more in number (green arrow) and few
apoptotic cell (yellow arrow). (B) Treated rat bone marrow with comparatively less viable
cell (green arrow) and frequent apoptotic cell (yellow arrow early apoptotic cell and blue
arrow late apoptotic cell). Necrotic cells were also marked (red arrow).
A
Chapter 4 135
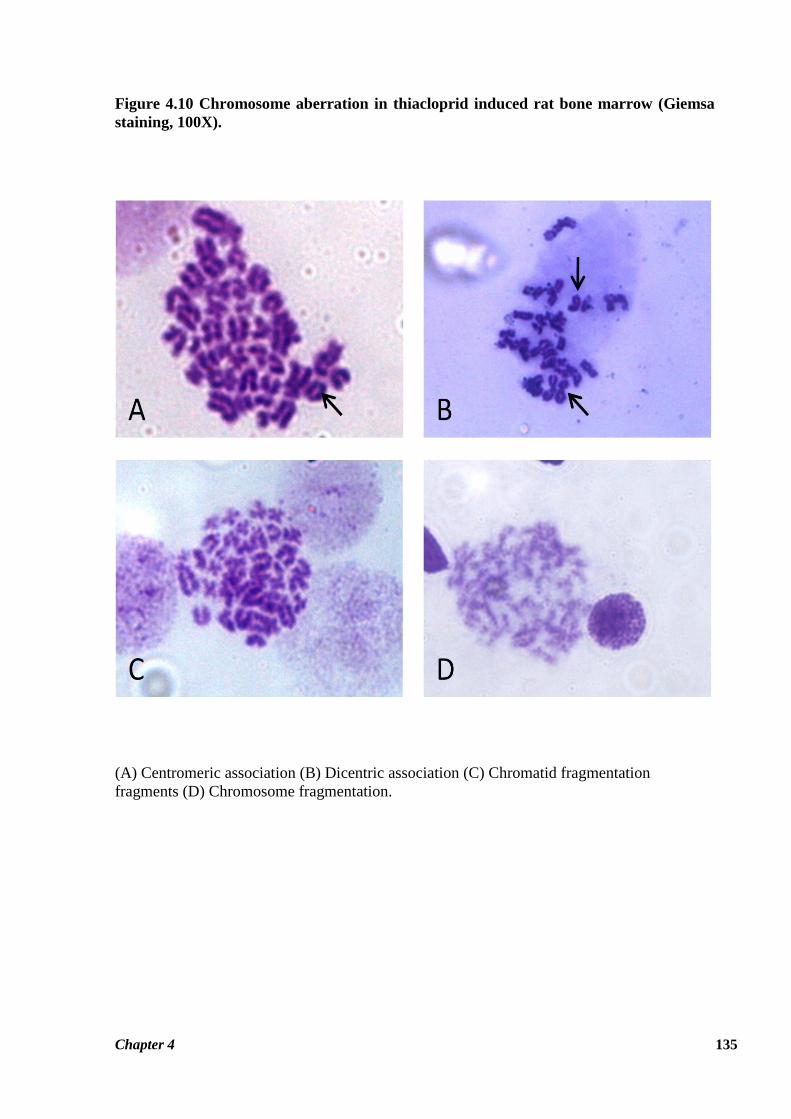
Figure 4.10 Chromosome aberration in thiacloprid induced rat bone marrow (Giemsa
staining, 100X).
(A) Centromeric association (B) Dicentric association (C) Chromatid fragmentation
fragments (D) Chromosome fragmentation.
Chapter 4 136
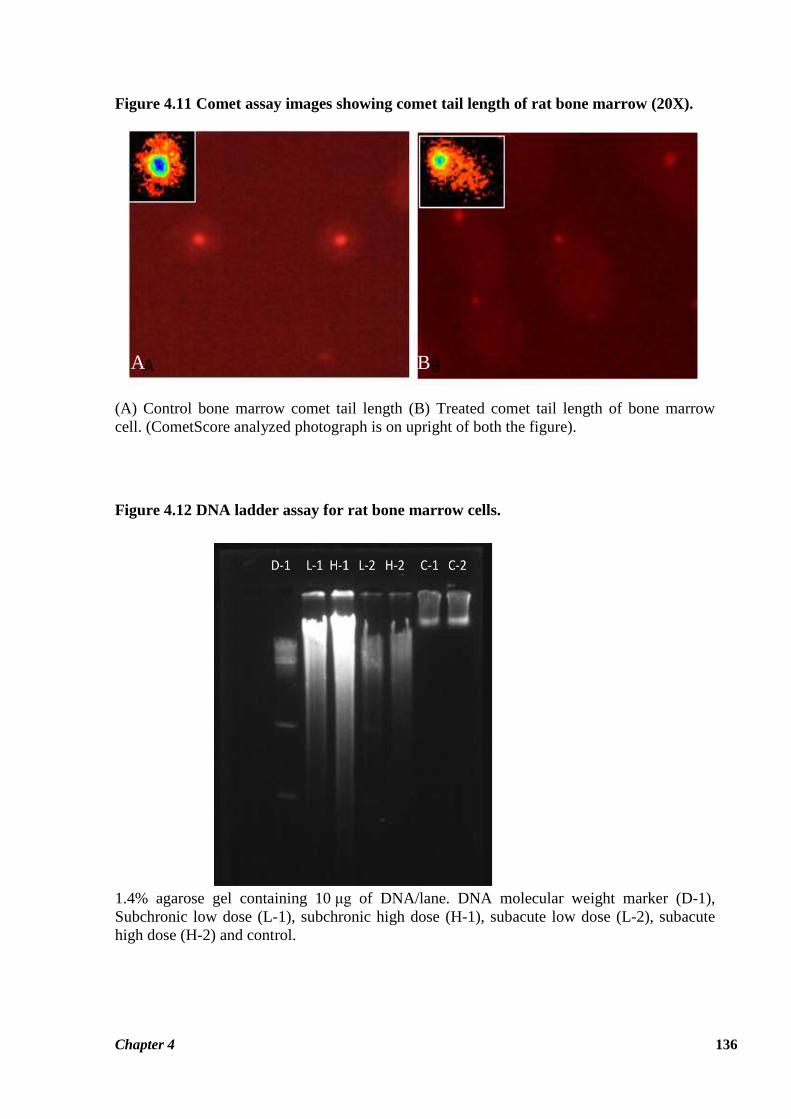
Figure 4.11 Comet assay images showing comet tail length of rat bone marrow (20X).
(A) Control bone marrow comet tail length (B) Treated comet tail length of bone marrow
cell. (CometScore analyzed photograph is on upright of both the figure).
Figure 4.12 DNA ladder assay for rat bone marrow cells.
1.4% agarose gel containing 10 μg of DNA/lane. DNA molecular weight marker (D-1),
Subchronic low dose (L-1), subchronic high dose (H-1), subacute low dose (L-2), subacute
high dose (H-2) and control.
A
B
B