Embed Size (px)
Citation preview
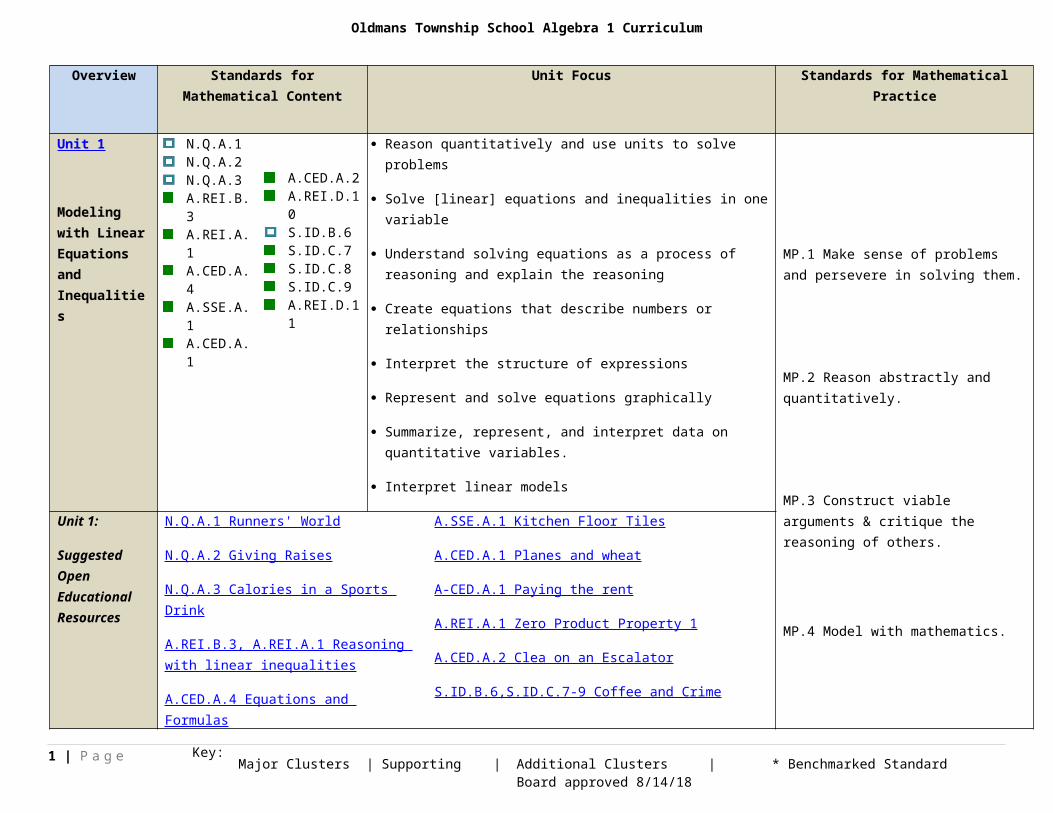
Oldmans Township School Algebra 1 Curriculum
Overview Standards for Mathematical Content
Unit Focus Standards for Mathematical Practice
Unit 1
Modeling with Linear Equations and Inequalities
N.Q.A.1N.Q.A.2N.Q.A.3A.REI.B.3A.REI.A.1A.CED.A.4A.SSE.A.1A.CED.A.1
A.CED.A.2A.REI.D.10S.ID.B.6S.ID.C.7S.ID.C.8 S.ID.C.9A.REI.D.11
Reason quantitatively and use units to solve problems
Solve [linear] equations and inequalities in one variable
Understand solving equations as a process of reasoning and explain the reasoning
Create equations that describe numbers or relationships
Interpret the structure of expressions
Represent and solve equations graphically
Summarize, represent, and interpret data on quantitative variables.
Interpret linear models
MP.1 Make sense of problems and persevere in solving them.
MP.2 Reason abstractly and quantitatively.
MP.3 Construct viable arguments & critique the reasoning of others.
MP.4 Model with mathematics.
MP.5 Use appropriate tools strategically.
MP.6 Attend to precision.
Unit 1:
Suggested Open Educational Resources
N.Q.A.1 Runners' World
N.Q.A.2 Giving Raises
N.Q.A.3 Calories in a Sports Drink
A.REI.B.3, A.REI.A.1 Reasoning with linear inequalities
A.CED.A.4 Equations and Formulas
A.SSE.A.1 Kitchen Floor Tiles
A.CED.A.1 Planes and wheat
A-CED.A.1 Paying the rent
A.REI.A.1 Zero Product Property 1
A.CED.A.2 Clea on an Escalator
S.ID.B.6,S.ID.C.7-9 Coffee and Crime
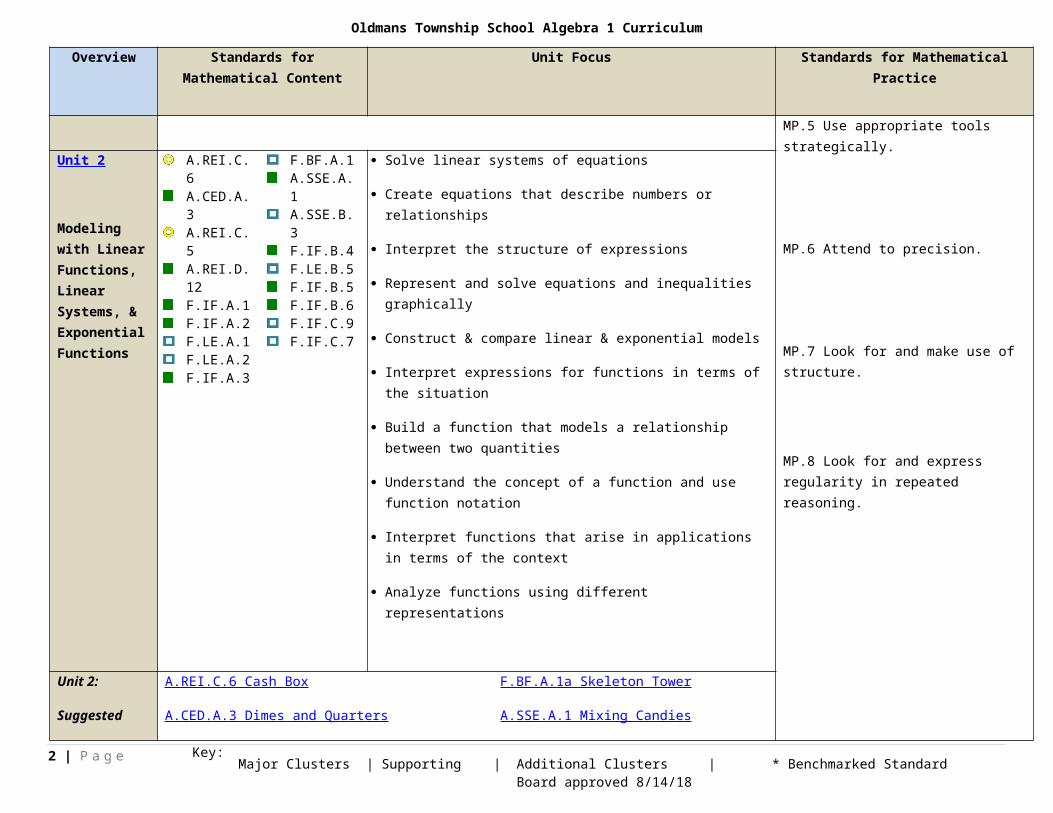
Unit 2
Modeling with Linear Functions, Linear Systems,
A.REI.C.6A.CED.A.3A.REI.C.5A.REI.D.12F.IF.A.1F.IF.A.2F.LE.A.1F.LE.A.2F.IF.A.3
F.BF.A.1A.SSE.A.1 A.SSE.B.3F.IF.B.4F.LE.B.5F.IF.B.5F.IF.B.6F.IF.C.9F.IF.C.7
Solve linear systems of equations
Create equations that describe numbers or relationships
Interpret the structure of expressions
Represent and solve equations and inequalities graphically
Construct & compare linear & exponential models 1 | P a g e Major Clusters | Additional Clusters | * Benchmarked Standard Board approved 8/14/18Supporting | Key:
Oldmans Township School Algebra 1 Curriculum
Overview Standards for Mathematical Content
Unit Focus Standards for Mathematical Practice
& Exponential Functions
Interpret expressions for functions in terms of the situation
Build a function that models a relationship between two quantities
Understand the concept of a function and use function notation
Interpret functions that arise in applications in terms of the context
Analyze functions using different representations
MP.7 Look for and make use of structure.
MP.8 Look for and express regularity in repeated reasoning.
Unit 2:
Suggested Open Educational Resources
A.REI.C.6 Cash Box
A.CED.A.3 Dimes and Quarters
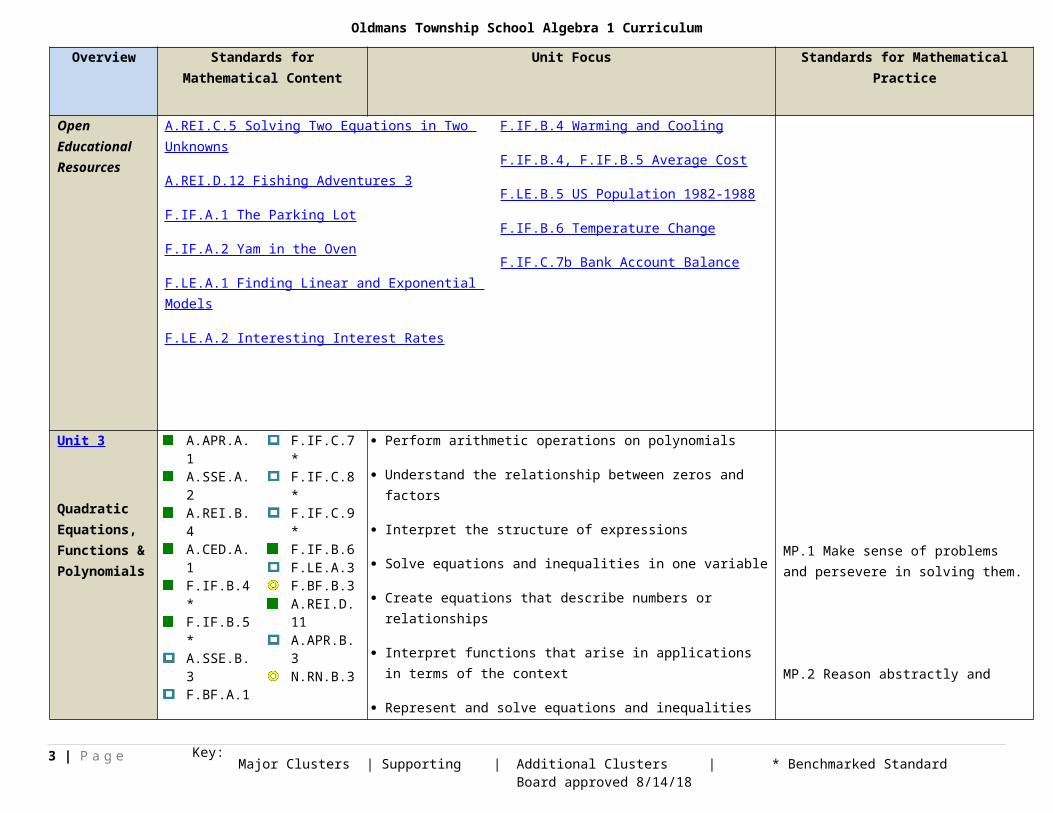
A.REI.C.5 Solving Two Equations in Two Unknowns
A.REI.D.12 Fishing Adventures 3
F.IF.A.1 The Parking Lot
F.IF.A.2 Yam in the Oven
F.LE.A.1 Finding Linear and Exponential Models
F.LE.A.2 Interesting Interest Rates
F.BF.A.1a Skeleton Tower
A.SSE.A.1 Mixing Candies
F.IF.B.4 Warming and Cooling
F.IF.B.4, F.IF.B.5 Average Cost
F.LE.B.5 US Population 1982-1988
F.IF.B.6 Temperature Change
F.IF.C.7b Bank Account Balance
2 | P a g e Major Clusters | Additional Clusters | * Benchmarked Standard Board approved 8/14/18Supporting | Key:
Oldmans Township School Algebra 1 Curriculum
Overview Standards for Mathematical Content
Unit Focus Standards for Mathematical Practice
Unit 3
Quadratic Equations, Functions & Polynomials
A.APR.A.1A.SSE.A.2A.REI.B.4A.CED.A.1F.IF.B.4*F.IF.B.5*A.SSE.B.3F.BF.A.1
F.IF.C.7*F.IF.C.8*F.IF.C.9*F.IF.B.6F.LE.A.3F.BF.B.3A.REI.D.11A.APR.B.3N.RN.B.3
Perform arithmetic operations on polynomials
Understand the relationship between zeros and factors
Interpret the structure of expressions
Solve equations and inequalities in one variable
Create equations that describe numbers or relationships
Interpret functions that arise in applications in terms of the context
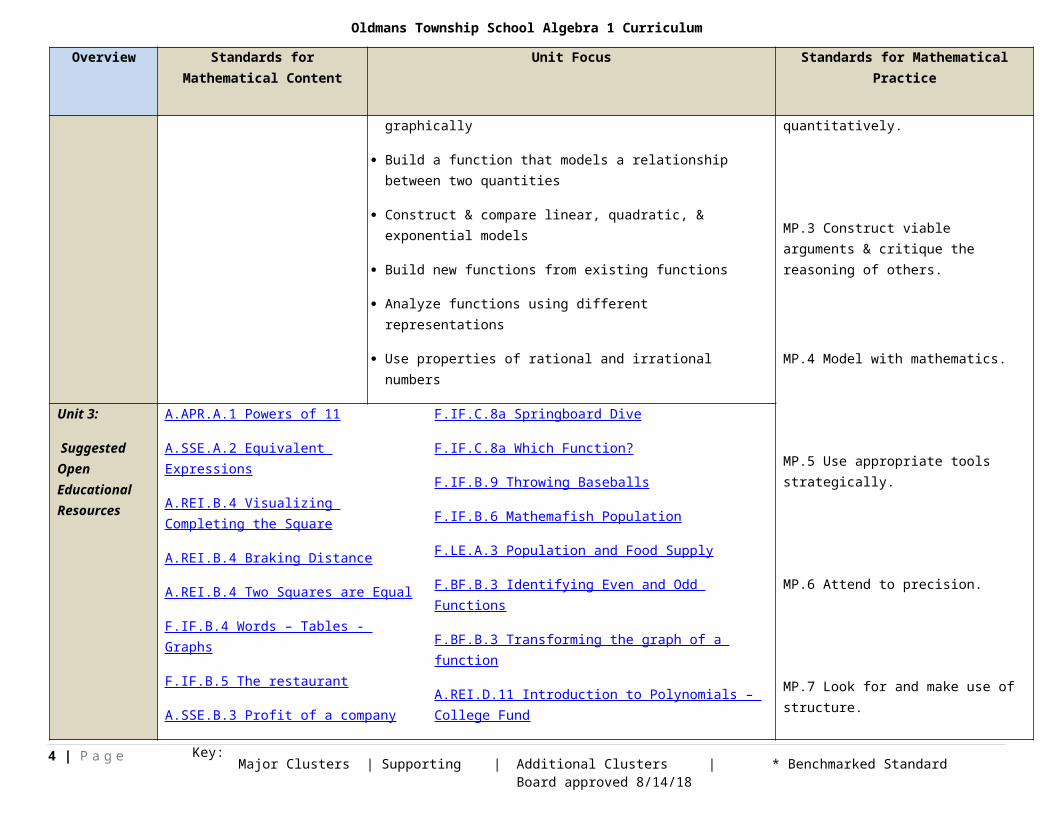
Represent and solve equations and inequalities graphically
Build a function that models a relationship between two quantities
Construct & compare linear, quadratic, & exponential models
Build new functions from existing functions
Analyze functions using different representations
Use properties of rational and irrational numbers
MP.1 Make sense of problems and persevere in solving them.
MP.2 Reason abstractly and quantitatively.
MP.3 Construct viable arguments & critique the reasoning of others.
MP.4 Model with mathematics.
MP.5 Use appropriate tools strategically.
MP.6 Attend to precision.
Unit 3:
Suggested Open Educational Resources
A.APR.A.1 Powers of 11
A.SSE.A.2 Equivalent Expressions
A.REI.B.4 Visualizing Completing the Square
A.REI.B.4 Braking Distance
A.REI.B.4 Two Squares are Equal
F.IF.B.4 Words – Tables - Graphs
F.IF.B.5 The restaurant
A.SSE.B.3 Profit of a company
F.IF.C.8a Springboard Dive
F.IF.C.8a Which Function?
F.IF.B.9 Throwing Baseballs
F.IF.B.6 Mathemafish Population
F.LE.A.3 Population and Food Supply
F.BF.B.3 Identifying Even and Odd Functions
F.BF.B.3 Transforming the graph of a function
A.REI.D.11 Introduction to Polynomials – College Fund
3 | P a g e Major Clusters | Additional Clusters | * Benchmarked Standard Board approved 8/14/18Supporting | Key:
Oldmans Township School Algebra 1 Curriculum
Overview Standards for Mathematical Content
Unit Focus Standards for Mathematical Practice
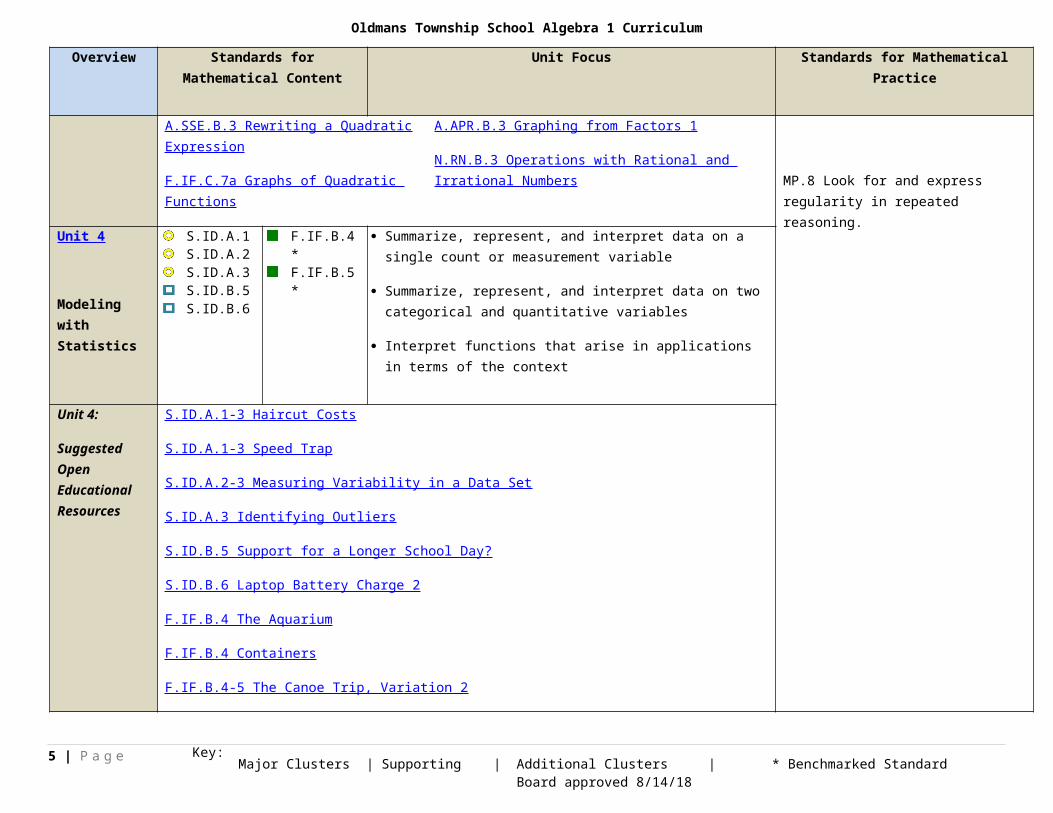
A.SSE.B.3 Rewriting a Quadratic Expression
F.IF.C.7a Graphs of Quadratic Functions
A.APR.B.3 Graphing from Factors 1
N.RN.B.3 Operations with Rational and Irrational Numbers
MP.7 Look for and make use of structure.
MP.8 Look for and express regularity in repeated reasoning.
Unit 4
Modeling with Statistics
S.ID.A.1S.ID.A.2S.ID.A.3S.ID.B.5S.ID.B.6
F.IF.B.4*F.IF.B.5*
Summarize, represent, and interpret data on a single count or measurement variable
Summarize, represent, and interpret data on two categorical and quantitative variables
Interpret functions that arise in applications in terms of the context
Unit 4:
Suggested Open Educational Resources
S.ID.A.1-3 Haircut Costs
S.ID.A.1-3 Speed Trap
S.ID.A.2-3 Measuring Variability in a Data Set
S.ID.A.3 Identifying Outliers
S.ID.B.5 Support for a Longer School Day?
S.ID.B.6 Laptop Battery Charge 2
F.IF.B.4 The Aquarium
F.IF.B.4 Containers
F.IF.B.4-5 The Canoe Trip, Variation 2
Unit 1 Algebra 1
Content & Practice Standards Suggested Standards for Mathematical Critical Knowledge & Skills
4 | P a g e Major Clusters | Additional Clusters | * Benchmarked Standard Board approved 8/14/18Supporting | Key:
Oldmans Township School Algebra 1 Curriculum
Practice
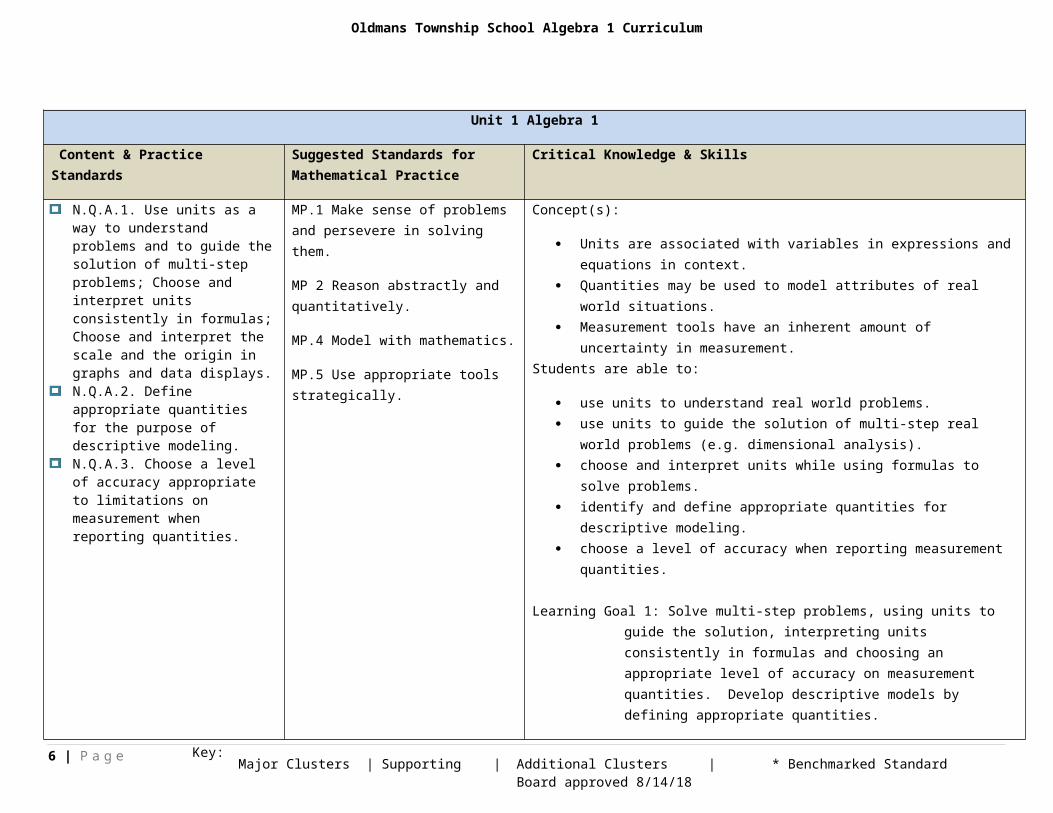
N.Q.A.1. Use units as a way to understand problems and to guide the solution of multi-step problems; Choose and interpret units consistently in formulas; Choose and interpret the scale and the origin in graphs and data displays.N.Q.A.2. Define appropriate quantities for the purpose of descriptive modeling.N.Q.A.3. Choose a level of accuracy appropriate to limitations on measurement when reporting quantities.
MP.1 Make sense of problems and persevere in solving them.
MP 2 Reason abstractly and quantitatively.
MP.4 Model with mathematics.
MP.5 Use appropriate tools strategically.
Concept(s):
Units are associated with variables in expressions and equations in context. Quantities may be used to model attributes of real world situations. Measurement tools have an inherent amount of uncertainty in measurement.
Students are able to:
use units to understand real world problems. use units to guide the solution of multi-step real world problems (e.g. dimensional
analysis). choose and interpret units while using formulas to solve problems. identify and define appropriate quantities for descriptive modeling. choose a level of accuracy when reporting measurement quantities.
Learning Goal 1: Solve multi-step problems, using units to guide the solution, interpreting units consistently in formulas and choosing an appropriate level of accuracy on measurement quantities. Develop descriptive models by defining appropriate quantities.
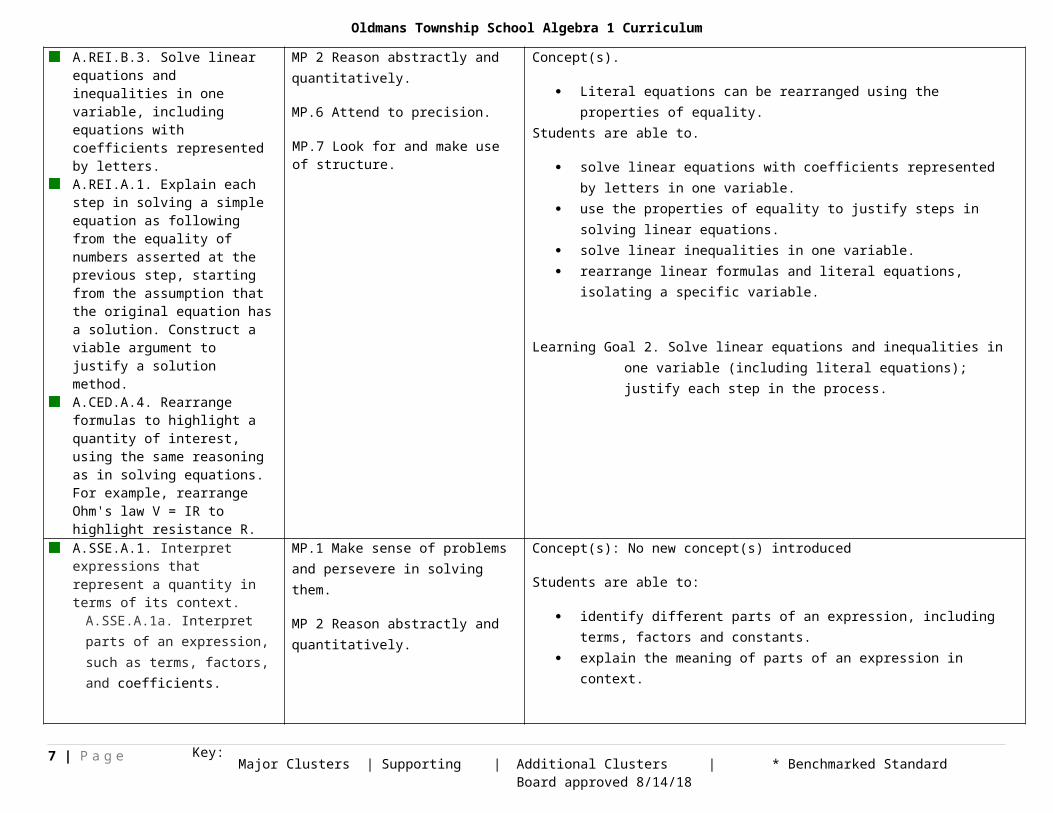
A.REI.B.3. Solve linear equations and inequalities in one variable, including equations with coefficients represented by letters.A.REI.A.1. Explain each step in solving a simple equation as following from the equality of numbers asserted at the previous step, starting from the assumption that the original equation has a solution. Construct a viable argument to justify a solution method.A.CED.A.4. Rearrange formulas to highlight a quantity of interest, using the same reasoning as in solving equations. For example, rearrange Ohm's law V = IR to highlight resistance R.
MP 2 Reason abstractly and quantitatively.
MP.6 Attend to precision.
MP.7 Look for and make use of structure.
Concept(s).
Literal equations can be rearranged using the properties of equality.Students are able to.
solve linear equations with coefficients represented by letters in one variable. use the properties of equality to justify steps in solving linear equations. solve linear inequalities in one variable. rearrange linear formulas and literal equations, isolating a specific variable.
Learning Goal 2. Solve linear equations and inequalities in one variable (including literal equations); justify each step in the process.
A.SSE.A.1. Interpret expressions that represent a quantity in terms of its context.
MP.1 Make sense of problems and persevere in solving them.
Concept(s): No new concept(s) introduced
Students are able to:
5 | P a g e Major Clusters | Additional Clusters | * Benchmarked Standard Board approved 8/14/18Supporting | Key:
Oldmans Township School Algebra 1 Curriculum
A.SSE.A.1a. Interpret parts of an expression, such as terms, factors, and coefficients.
MP 2 Reason abstractly and quantitatively.
identify different parts of an expression, including terms, factors and constants. explain the meaning of parts of an expression in context.
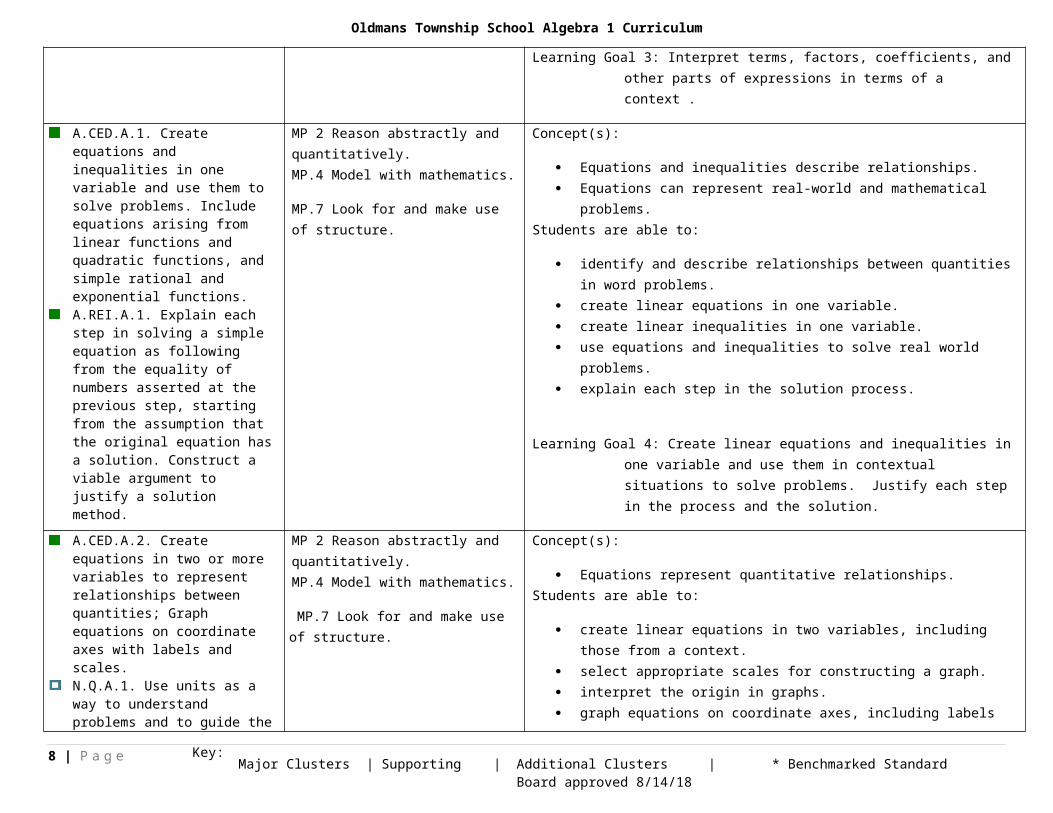
Learning Goal 3: Interpret terms, factors, coefficients, and other parts of expressions in terms of a context .
A.CED.A.1. Create equations and inequalities in one variable and use them to solve problems. Include equations arising from linear functions and quadratic functions, and simple rational and exponential functions. A.REI.A.1. Explain each step in solving a simple equation as following from the equality of numbers asserted at the previous step, starting from the assumption that the original equation has a solution. Construct a viable argument to justify a solution method.
MP 2 Reason abstractly and quantitatively. MP.4 Model with mathematics.
MP.7 Look for and make use of structure.
Concept(s):
Equations and inequalities describe relationships. Equations can represent real-world and mathematical problems.
Students are able to:
identify and describe relationships between quantities in word problems. create linear equations in one variable. create linear inequalities in one variable. use equations and inequalities to solve real world problems. explain each step in the solution process.
Learning Goal 4: Create linear equations and inequalities in one variable and use them in contextual situations to solve problems. Justify each step in the process and the solution.
A.CED.A.2. Create equations in two or more variables to represent relationships between quantities; Graph equations on coordinate axes with labels and scales.N.Q.A.1. Use units as a way to understand problems and to guide the solution of multi-step problems; Choose and interpret units consistently in formulas; Choose and interpret the scale and the origin in graphs and data displays.A.REI.D.10. Understand that the graph of an equation in two variables is the set of all its solutions plotted in the coordinate plane, often forming a curve (which could be a line). [Focus on linear equations.]
MP 2 Reason abstractly and quantitatively. MP.4 Model with mathematics.
MP.7 Look for and make use of structure.
Concept(s):
Equations represent quantitative relationships.Students are able to:
create linear equations in two variables, including those from a context. select appropriate scales for constructing a graph. interpret the origin in graphs. graph equations on coordinate axes, including labels and scales. identify and describe the solutions in the graph of an equation.
Learning Goal 5: Create linear equations in two variables to represent relationships between quantities; graph equations on coordinate axes with labels and scales.
S.ID.B.6. Represent data on two quantitative variables on a scatter
MP.1 Make sense of problems and persevere in solving them.
Concept(s):
6 | P a g e Major Clusters | Additional Clusters | * Benchmarked Standard Board approved 8/14/18Supporting | Key:
Oldmans Township School Algebra 1 Curriculum
plot, and describe how the variables are related.
S.ID.B.6a. Fit a function to the data (including the use of technology); use functions fitted to data to solve problems in the context of the data. Use given functions or choose a function suggested by the context. Emphasize linear, quadratic, and exponential models.
S.ID.B.6c. Fit a linear function for a scatter plot that suggests a linear association.
S.ID.C.7. Interpret the slope (rate of change) and the intercept (constant term) of a linear model in the context of the data. S.ID.C.8. Compute (using technology) and interpret the correlation coefficient of a linear fit. S.ID.C.9. Distinguish between correlation and causation.
MP 2 Reason abstractly and quantitatively. MP.4 Model with mathematics.
MP.5 Use appropriate tools strategically.
MP.6 Attend to precision.
Scatter plots represent the relationship between two variables. Scatter plots can be used to determine the nature of the association between the
variables. Linear models may be developed by fitting a linear function to approximately
linear data. The correlation coefficient represents the strength of a linear association.
Students are able to:
distinguish linear models representing approximately linear data from linear. equations representing “perfectly” linear relationships.
create a scatter plot and sketch a line of best fit. fit a linear function to data using technology. solve problems using prediction equations. interpret the slope and the intercepts of the linear model in context. determine the correlation coefficient for the linear model using technology. determine the direction and strength of the linear association between two
variables.
Learning Goal 6: Represent data on a scatter plot, describe how the variables are related and use technology to fit a function to data.
Learning Goal 7: Interpret the slope, intercept, and correlation coefficient of a data set of a linear model; distinguish between correlation and causation.
A.REI.D.11. Explain why the x-coordinates of the points where the graphs of the equations y = f(x) and y = g(x) intersect are the solutions of the equation f(x) = g(x); find the solutions approximately, e.g., using technology to graph the functions, make tables of values, or find successive approximations. Include cases where f(x) and/or g(x) are linear, polynomial, rational, absolute value, exponential, and logarithmic functions.* [Focus on linear equations.]
MP.1 Make sense of problems and persevere in solving them.
MP.3 Construct viable arguments and critique the reasoning of others.
MP.5 Use appropriate tools strategically.
Concept(s):
y = f(x), y=g(x) represent a system of equations. Systems of equations can be solved graphically (8.EE.C.8).
Students are able to:
explain the relationship between the x-coordinate of a point of intersection and the solution to the equation f(x) = g(x) for linear equations y = f(x) and y = g(x).
find approximate solutions to the system by making a table of values, graphing, and finding successive approximations.
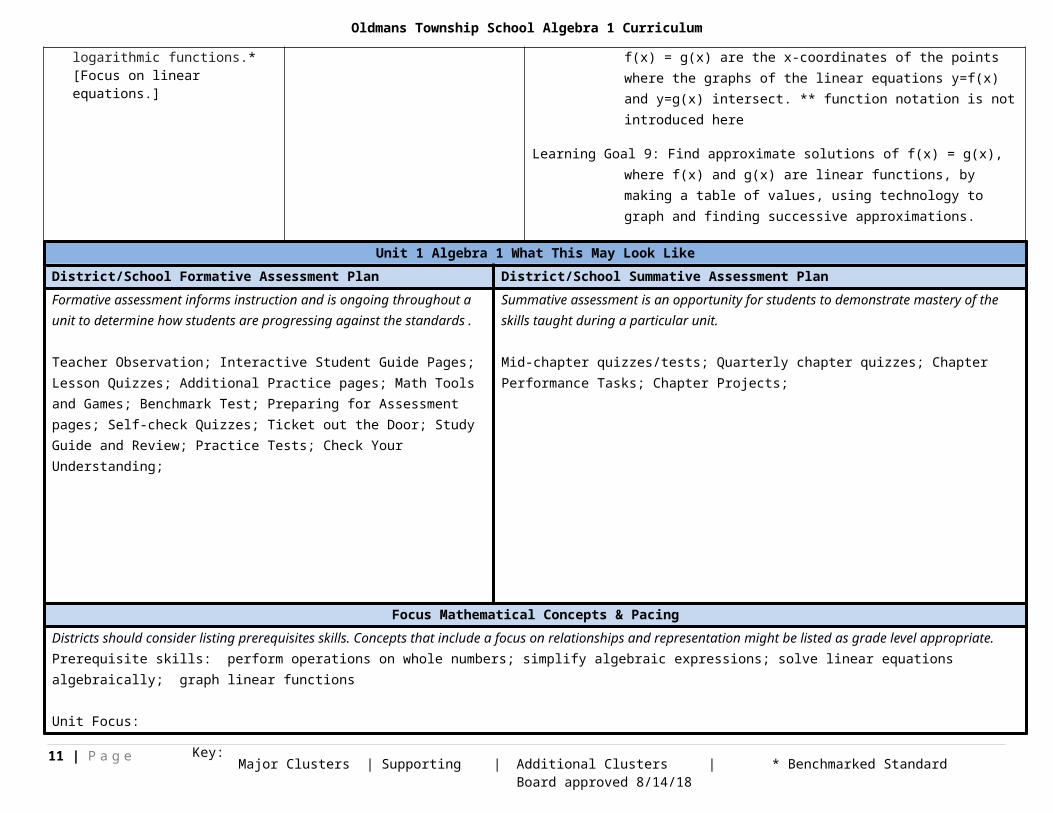
Learning Goal 8: Explain why the solutions of the equation f(x) = g(x) are the x-coordinates of the points where the graphs of the linear equations y=f(x) and y=g(x) intersect. ** function notation is not introduced here
Learning Goal 9: Find approximate solutions of f(x) = g(x), where f(x) and g(x) are linear functions, by making a table of values, using technology to graph and
7 | P a g e Major Clusters | Additional Clusters | * Benchmarked Standard Board approved 8/14/18Supporting | Key:
Oldmans Township School Algebra 1 Curriculum
finding successive approximations.
Unit 1 Algebra 1 What This May Look LikeDistrict/School Formative Assessment Plan District/School Summative Assessment PlanFormative assessment informs instruction and is ongoing throughout a unit to determine how students are progressing against the standards.
Teacher Observation; Interactive Student Guide Pages; Lesson Quizzes; Additional Practice pages; Math Tools and Games; Benchmark Test; Preparing for Assessment pages; Self-check Quizzes; Ticket out the Door; Study Guide and Review; Practice Tests; Check Your Understanding;
Summative assessment is an opportunity for students to demonstrate mastery of the skills taught during a particular unit.
Mid-chapter quizzes/tests; Quarterly chapter quizzes; Chapter Performance Tasks; Chapter Projects;
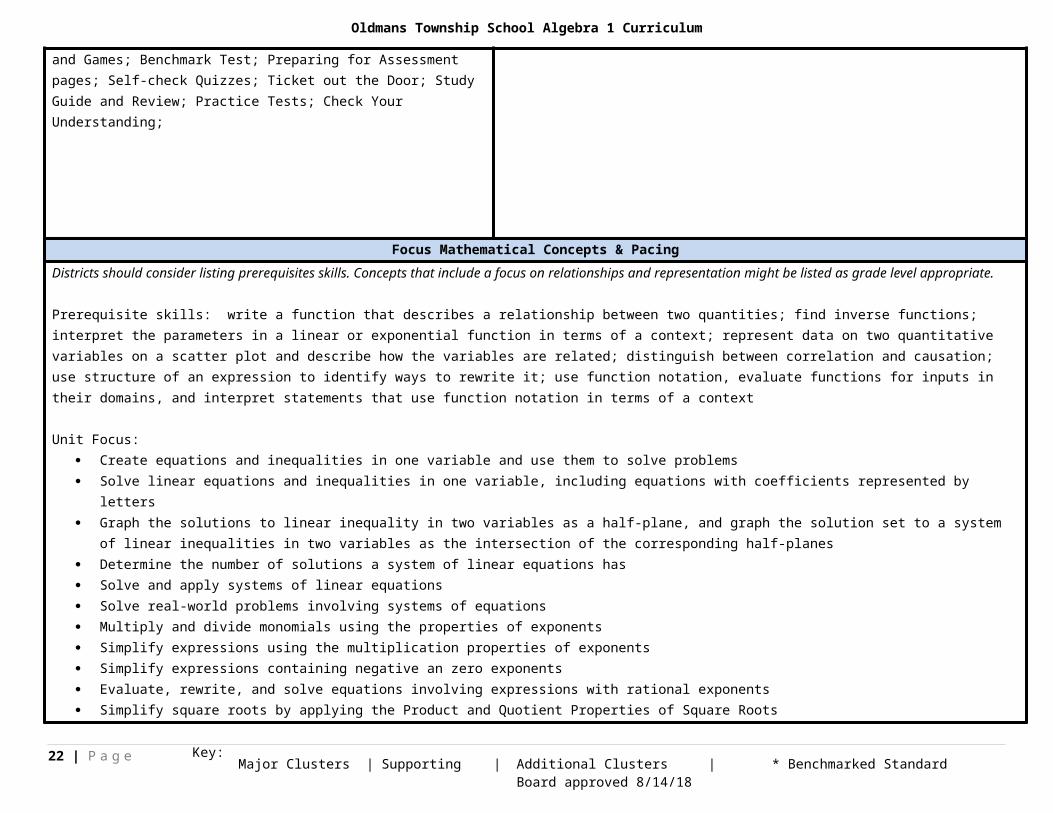
Focus Mathematical Concepts & PacingDistricts should consider listing prerequisites skills. Concepts that include a focus on relationships and representation might be listed as grade level appropriate. Prerequisite skills: perform operations on whole numbers; simplify algebraic expressions; solve linear equations algebraically; graph linear functions
Unit Focus: Write algebraic expressions and use the order of operations Define appropriate quantities for descriptive modeling Represent and interpret relations and functions Interpret the graphs of functions Create equations that describe relationships Solve linear equations in one variable Use formulas to solve real-world problems Identify linear equations, intercepts, and zeros Graph and write linear equations Use rate of change to solve problems Write and graph linear equations in various forms Use scatter plots and lines of fit, and write equations of best-fit lines using linear regression Find inverse linear functions Explore causation and correlation
Common Misconceptions: ignore the order of operations and work left to right; forgetting the names of the properties; all calculators follow the order of operations; misidentifying
8 | P a g e Major Clusters | Additional Clusters | * Benchmarked Standard Board approved 8/14/18Supporting | Key:

Oldmans Township School Algebra 1 Curriculum
the coefficient of expressions like x2/3; misunderstanding functional notation for multiplication; forgetting absolute value cannot be negative; dropping negatives in the middle of a problem; Standard Form means both A and B have to be positive; forgetting to distribute correctly; switching the x- and y-coordinates; confusing intercepts;
Pacing: Chapter 1 – 14 days Chapter 2 – 14 days Chapter 3 – 17 days Chapter 4 – 14 days
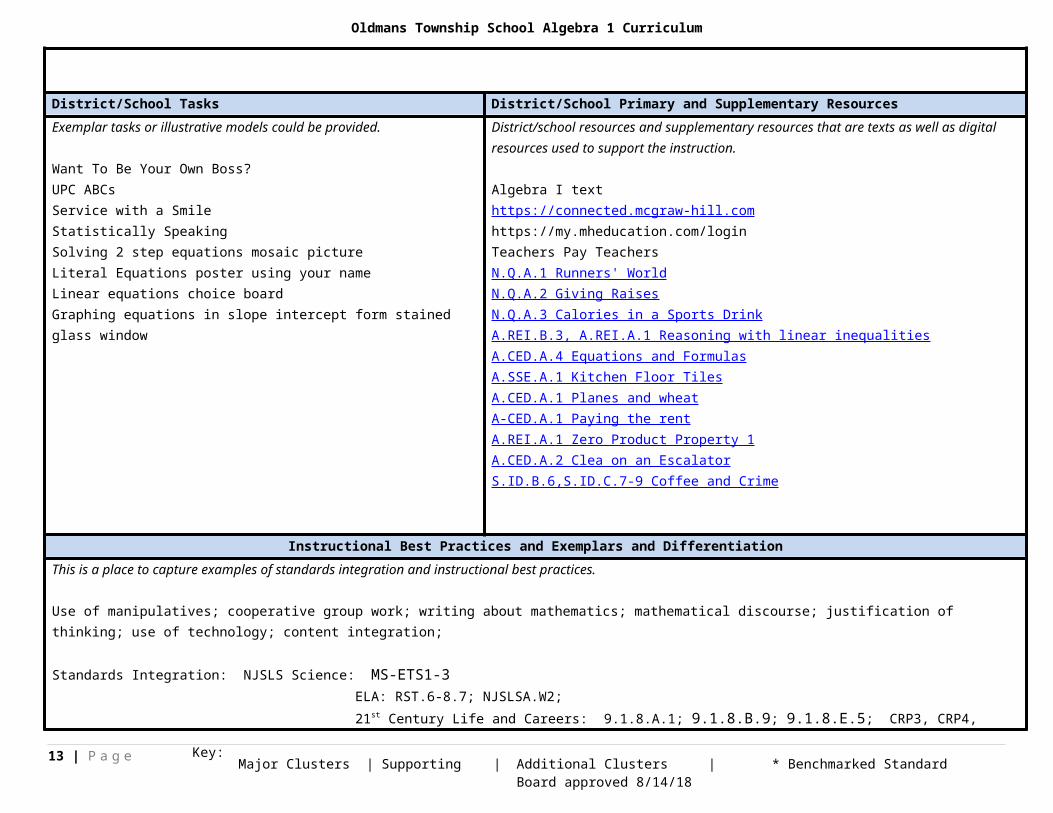
District/School Tasks District/School Primary and Supplementary ResourcesExemplar tasks or illustrative models could be provided.
Want To Be Your Own Boss?UPC ABCsService with a SmileStatistically SpeakingSolving 2 step equations mosaic pictureLiteral Equations poster using your nameLinear equations choice boardGraphing equations in slope intercept form stained glass window
District/school resources and supplementary resources that are texts as well as digital resources used to support the instruction.
Algebra I texthttps://connected.mcgraw-hill.comhttps://my.mheducation.com/loginTeachers Pay TeachersN.Q.A.1 Runners' WorldN.Q.A.2 Giving RaisesN.Q.A.3 Calories in a Sports DrinkA.REI.B.3, A.REI.A.1 Reasoning with linear inequalitiesA.CED.A.4 Equations and FormulasA.SSE.A.1 Kitchen Floor TilesA.CED.A.1 Planes and wheatA-CED.A.1 Paying the rentA.REI.A.1 Zero Product Property 1A.CED.A.2 Clea on an EscalatorS.ID.B.6,S.ID.C.7-9 Coffee and Crime
9 | P a g e Major Clusters | Additional Clusters | * Benchmarked Standard Board approved 8/14/18Supporting | Key:

Oldmans Township School Algebra 1 Curriculum
Instructional Best Practices and Exemplars and DifferentiationThis is a place to capture examples of standards integration and instructional best practices.
Use of manipulatives; cooperative group work; writing about mathematics; mathematical discourse; justification of thinking; use of technology; content integration;
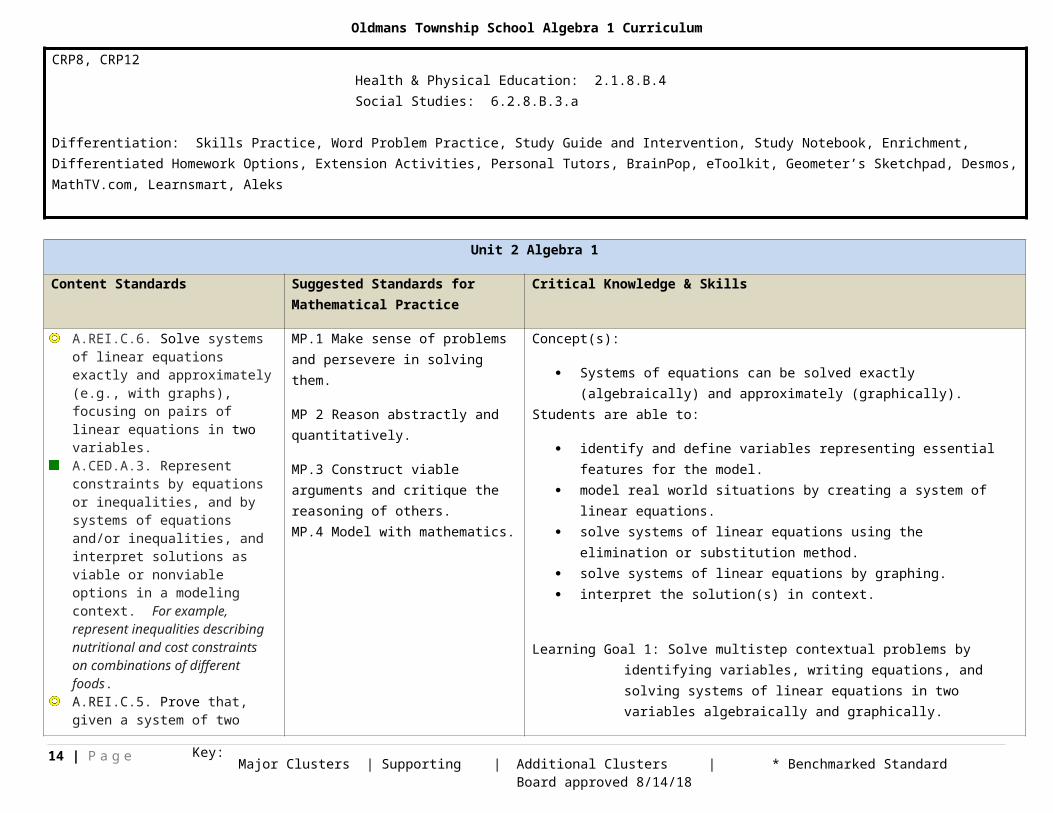
Standards Integration: NJSLS Science: MS-ETS1-3 ELA: RST.6-8.7; NJSLSA.W2; 21st Century Life and Careers: 9.1.8.A.1; 9.1.8.B.9; 9.1.8.E.5; CRP3, CRP4, CRP8, CRP12 Health & Physical Education: 2.1.8.B.4 Social Studies: 6.2.8.B.3.a Differentiation: Skills Practice, Word Problem Practice, Study Guide and Intervention, Study Notebook, Enrichment, Differentiated Homework Options, Extension Activities, Personal Tutors, BrainPop, eToolkit, Geometer’s Sketchpad, Desmos, MathTV.com, Learnsmart, Aleks
Unit 2 Algebra 1
Content Standards Suggested Standards for Mathematical Practice
Critical Knowledge & Skills
A.REI.C.6. Solve systems of linear equations exactly and approximately (e.g., with graphs), focusing on pairs of linear equations in two variables.A.CED.A.3. Represent constraints by equations or inequalities, and by systems of equations and/or inequalities, and interpret solutions as viable or nonviable options in a modeling context. For example, represent inequalities describing nutritional and cost constraints on combinations of different foods.A.REI.C.5. Prove that, given a system of two equations in two variables, replacing one equation by the sum of that equation and a multiple of the other produces a system with the same solutions.
MP.1 Make sense of problems and persevere in solving them.
MP 2 Reason abstractly and quantitatively.
MP.3 Construct viable arguments and critique the reasoning of others.MP.4 Model with mathematics.
Concept(s):
Systems of equations can be solved exactly (algebraically) and approximately (graphically).
Students are able to:
identify and define variables representing essential features for the model. model real world situations by creating a system of linear equations. solve systems of linear equations using the elimination or substitution method. solve systems of linear equations by graphing. interpret the solution(s) in context.
Learning Goal 1: Solve multistep contextual problems by identifying variables, writing equations, and solving systems of linear equations in two variables algebraically and graphically.
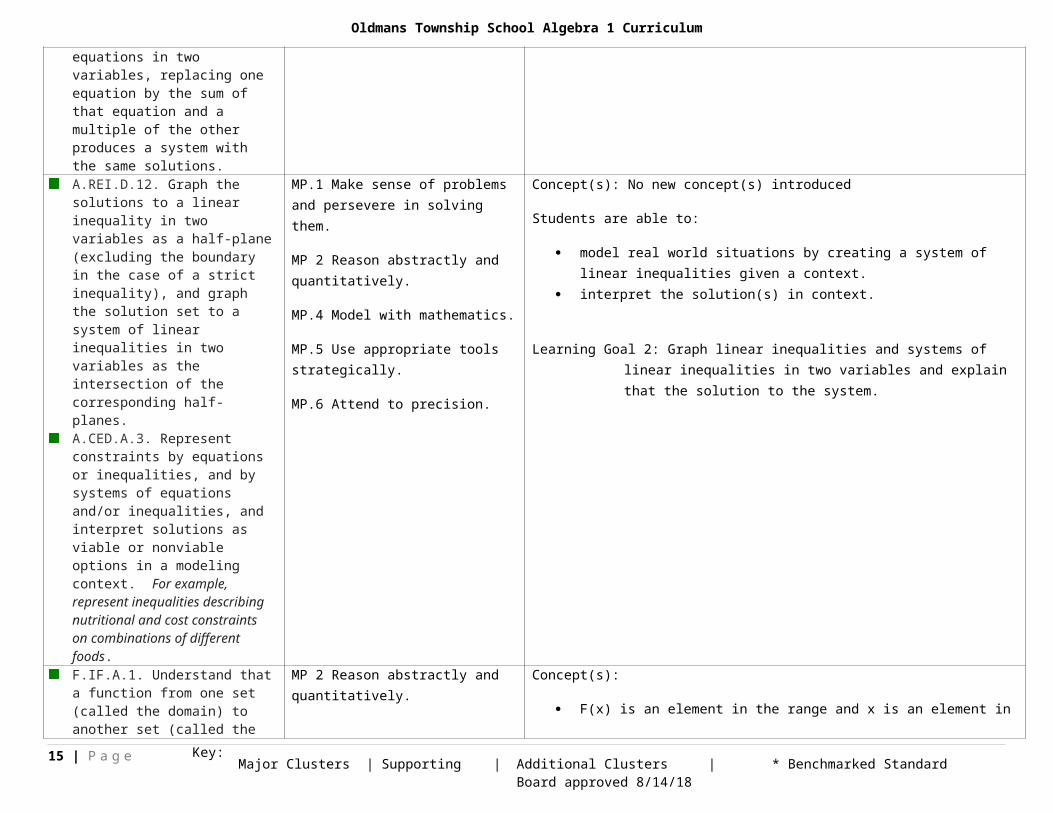
A.REI.D.12. Graph the solutions to a linear inequality in two variables as a half-plane (excluding the boundary in
MP.1 Make sense of problems and persevere in solving them.
Concept(s): No new concept(s) introduced
10 | P a g e Major Clusters | Additional Clusters | * Benchmarked Standard Board approved 8/14/18Supporting | Key:
Oldmans Township School Algebra 1 Curriculum
the case of a strict inequality), and graph the solution set to a system of linear inequalities in two variables as the intersection of the corresponding half-planes.A.CED.A.3. Represent constraints by equations or inequalities, and by systems of equations and/or inequalities, and interpret solutions as viable or nonviable options in a modeling context. For example, represent inequalities describing nutritional and cost constraints on combinations of different foods.
MP 2 Reason abstractly and quantitatively.
MP.4 Model with mathematics.
MP.5 Use appropriate tools strategically.
MP.6 Attend to precision.
Students are able to:
model real world situations by creating a system of linear inequalities given a context.
interpret the solution(s) in context.
Learning Goal 2: Graph linear inequalities and systems of linear inequalities in two variables and explain that the solution to the system.
F.IF.A.1. Understand that a function from one set (called the domain) to another set (called the range) assigns to each element of the domain exactly one element of the range. If f is a function and x is an element of its domain, then f(x) denotes the output of f corresponding to the input x. The graph of f is the graph of the equation y = f(x).F.IF.A.2. Use function notation, evaluate functions for inputs in their domains, and interpret statements that use function notation in terms of a context.
MP 2 Reason abstractly and quantitatively.
MP.6 Attend to precision.
MP.7 Look for and make use of structure.
Concept(s):
F(x) is an element in the range and x is an element in the domain.Students are able to:
use the definition of a function to determine whether a relationship is a function. use function notation once a relation is determined to be a function. evaluate functions for given inputs in the domain. explain statements involving function notation in the context of the problem.
Learning Goal 3: Explain the definition of a function, including the relationship between the domain and range. Use function notation, evaluate functions and interpret statements in context.
F.LE.A.1. Distinguish between situations that can be modeled with linear functions and with exponential functions.
F.LE.A.1a. Prove that linear functions grow by equal differences over equal intervals, and that exponential functions grow by equal factors over equal intervals.
F.LE.A.1b. Recognize situations in which one quantity changes at a constant rate per unit interval relative to another.
MP.3 Construct viable arguments and critique the reasoning of others.MP.6 Attend to precision.
Concept(s):
Linear functions grow by equal differences over equal intervals. Exponential functions grow by equal factors over equal intervals.
Students are able to:
identify and describe situations in which one quantity changes at a constant rate. identify and describe situations in which a quantity grows or decays by a constant
percent. show that linear functions grow by equal differences over equal intervals. show that exponential functions grow by equal factors over equal intervals.
11 | P a g e Major Clusters | Additional Clusters | * Benchmarked Standard Board approved 8/14/18Supporting | Key:

Oldmans Township School Algebra 1 Curriculum
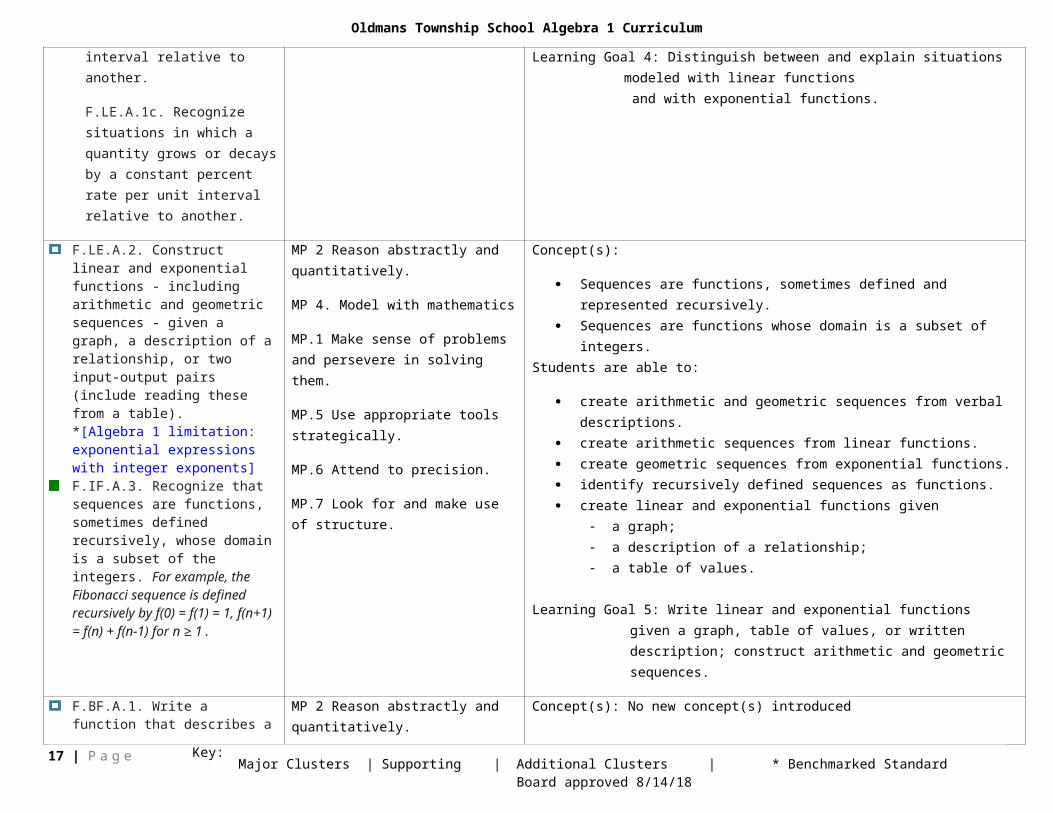
F.LE.A.1c. Recognize situations in which a quantity grows or decays by a constant percent rate per unit interval relative to another.
Learning Goal 4: Distinguish between and explain situations modeled with linear functions
and with exponential functions.
F.LE.A.2. Construct linear and exponential functions - including arithmetic and geometric sequences - given a graph, a description of a relationship, or two input-output pairs (include reading these from a table). *[Algebra 1 limitation: exponential expressions with integer exponents]F.IF.A.3. Recognize that sequences are functions, sometimes defined recursively, whose domain is a subset of the integers. For example, the Fibonacci sequence is defined recursively by f(0) = f(1) = 1, f(n+1) = f(n) + f(n-1) for n ≥ 1.
MP 2 Reason abstractly and quantitatively.
MP 4. Model with mathematics
MP.1 Make sense of problems and persevere in solving them.
MP.5 Use appropriate tools strategically.
MP.6 Attend to precision.
MP.7 Look for and make use of structure.
Concept(s):
Sequences are functions, sometimes defined and represented recursively. Sequences are functions whose domain is a subset of integers.
Students are able to:
create arithmetic and geometric sequences from verbal descriptions. create arithmetic sequences from linear functions. create geometric sequences from exponential functions. identify recursively defined sequences as functions. create linear and exponential functions given
a graph; a description of a relationship; a table of values.
Learning Goal 5: Write linear and exponential functions given a graph, table of values, or written description; construct arithmetic and geometric sequences.
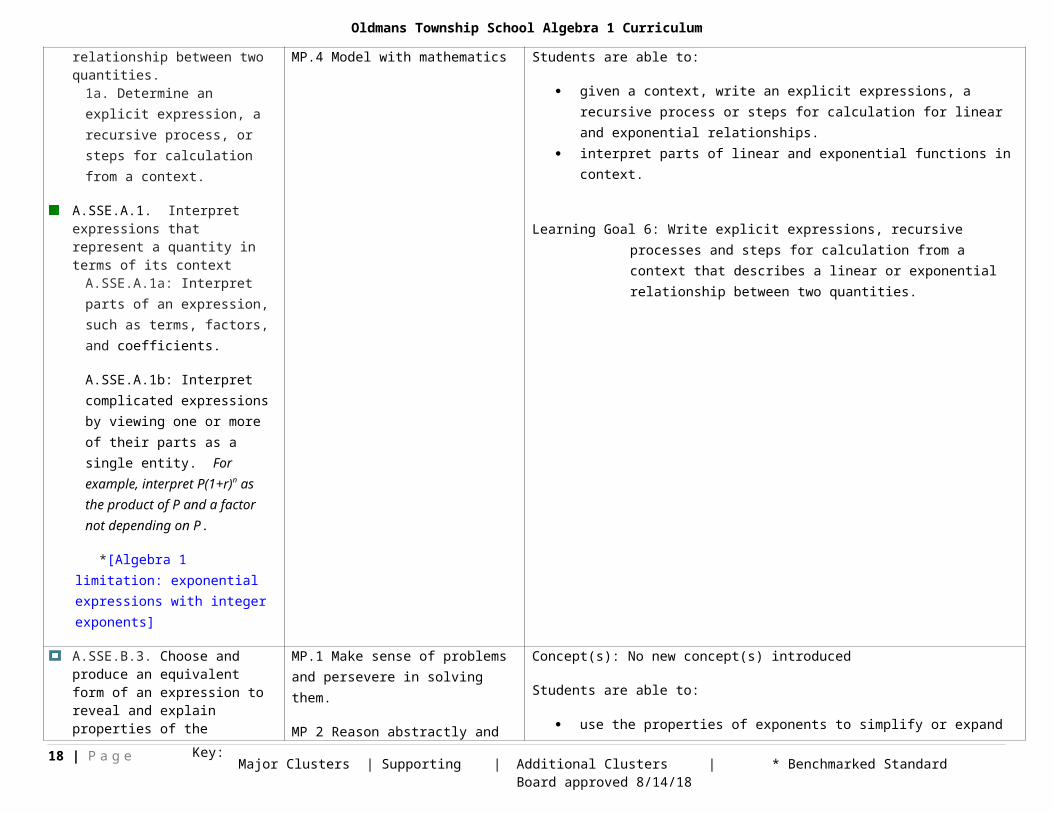
F.BF.A.1. Write a function that describes a relationship between two quantities.
1a. Determine an explicit expression, a recursive process, or steps for calculation from a context.
A.SSE.A.1. Interpret expressions that represent a quantity in terms of its context
A.SSE.A.1a: Interpret parts of an expression, such as terms, factors, and coefficients.
A.SSE.A.1b: Interpret complicated expressions by viewing one or more of their parts as a single entity. For example, interpret P(1+r)n as the product of P and a
MP 2 Reason abstractly and quantitatively.
MP.4 Model with mathematics
Concept(s): No new concept(s) introduced
Students are able to:
given a context, write an explicit expressions, a recursive process or steps for calculation for linear and exponential relationships.
interpret parts of linear and exponential functions in context.
Learning Goal 6: Write explicit expressions, recursive processes and steps for calculation from a context that describes a linear or exponential relationship between two quantities.
12 | P a g e Major Clusters | Additional Clusters | * Benchmarked Standard Board approved 8/14/18Supporting | Key:
Oldmans Township School Algebra 1 Curriculum
factor not depending on P.
*[Algebra 1 limitation: exponential expressions with integer exponents]
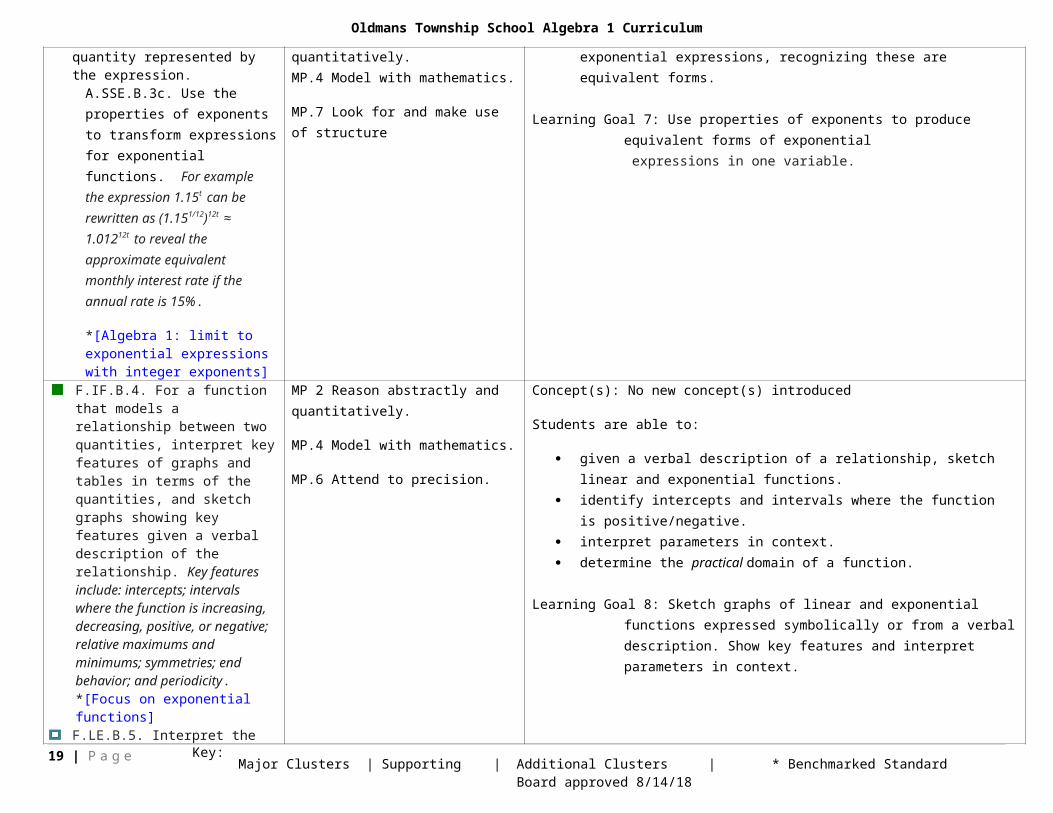
A.SSE.B.3. Choose and produce an equivalent form of an expression to reveal and explain properties of the quantity represented by the expression.
A.SSE.B.3c. Use the properties of exponents to transform expressions for exponential functions. For example the expression 1.15t can be rewritten as (1.151/12)12t ≈ 1.01212t to reveal the approximate equivalent monthly interest rate if the annual rate is 15%.
*[Algebra 1: limit to exponential expressions with integer exponents]
MP.1 Make sense of problems and persevere in solving them.
MP 2 Reason abstractly and quantitatively. MP.4 Model with mathematics.
MP.7 Look for and make use of structure
Concept(s): No new concept(s) introduced
Students are able to:
use the properties of exponents to simplify or expand exponential expressions, recognizing these are equivalent forms.
Learning Goal 7: Use properties of exponents to produce equivalent forms of exponential expressions in one variable.
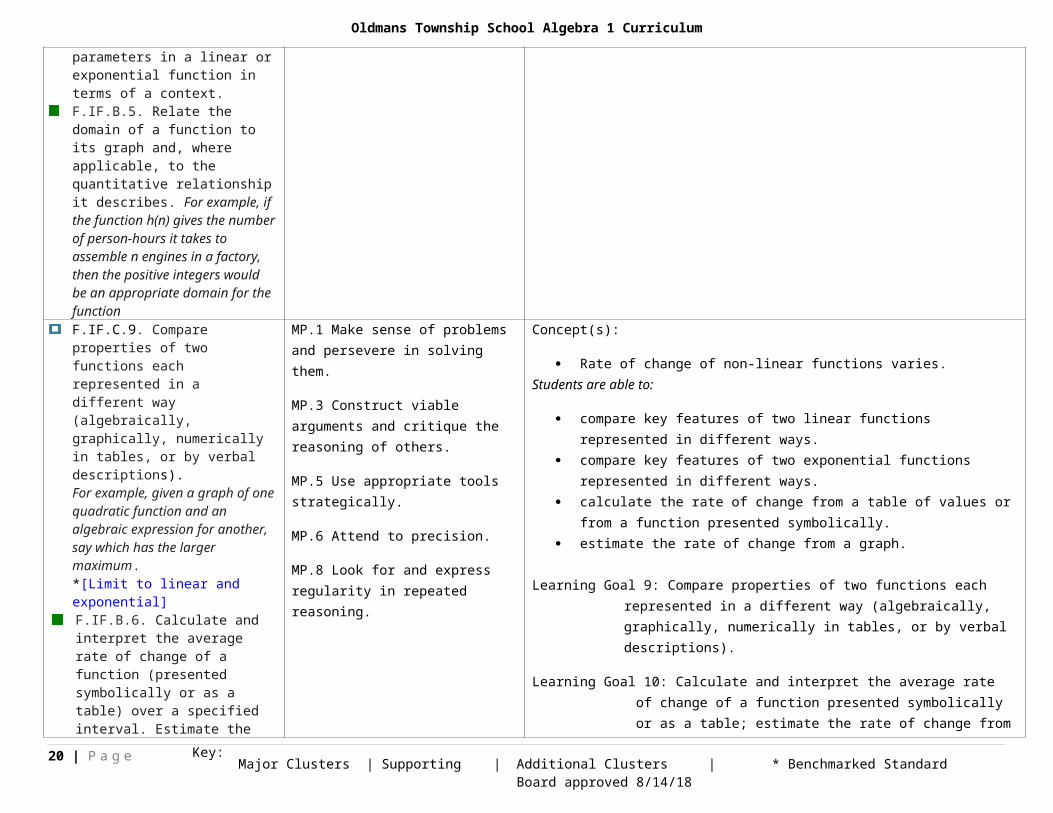
F.IF.B.4. For a function that models a relationship between two quantities, interpret key features of graphs and tables in terms of the quantities, and sketch graphs showing key features given a verbal description of the relationship. Key features include: intercepts; intervals where the function is increasing, decreasing, positive, or negative; relative maximums and minimums; symmetries; end behavior; and periodicity. *[Focus on exponential functions]F.LE.B.5. Interpret the parameters in a linear or exponential function in terms of a context.F.IF.B.5. Relate the domain of a function to its graph and, where applicable, to the quantitative relationship it describes. For example, if the function h(n) gives the number of person-hours it takes to
MP 2 Reason abstractly and quantitatively.
MP.4 Model with mathematics.
MP.6 Attend to precision.
Concept(s): No new concept(s) introduced
Students are able to:
given a verbal description of a relationship, sketch linear and exponential functions.
identify intercepts and intervals where the function is positive/negative. interpret parameters in context. determine the practical domain of a function.
Learning Goal 8: Sketch graphs of linear and exponential functions expressed symbolically or from a verbal description. Show key features and interpret parameters in context.
13 | P a g e Major Clusters | Additional Clusters | * Benchmarked Standard Board approved 8/14/18Supporting | Key:
Oldmans Township School Algebra 1 Curriculum
assemble n engines in a factory, then the positive integers would be an appropriate domain for the functionF.IF.C.9. Compare properties of two functions each represented in a different way (algebraically, graphically, numerically in tables, or by verbal descriptions). For example, given a graph of one quadratic function and an algebraic expression for another, say which has the larger maximum.*[Limit to linear and exponential]F.IF.B.6. Calculate and interpret the average rate of change of a function (presented symbolically or as a table) over a specified interval. Estimate the rate of change from a graph.
MP.1 Make sense of problems and persevere in solving them.
MP.3 Construct viable arguments and critique the reasoning of others.
MP.5 Use appropriate tools strategically.
MP.6 Attend to precision.
MP.8 Look for and express regularity in repeated reasoning.
Concept(s):
Rate of change of non-linear functions varies. Students are able to:
compare key features of two linear functions represented in different ways. compare key features of two exponential functions represented in different ways. calculate the rate of change from a table of values or from a function presented
symbolically. estimate the rate of change from a graph.
Learning Goal 9: Compare properties of two functions each represented in a different way (algebraically, graphically, numerically in tables, or by verbal descriptions).
Learning Goal 10: Calculate and interpret the average rate of change of a function presented symbolically or as a table; estimate the rate of change from a graph.
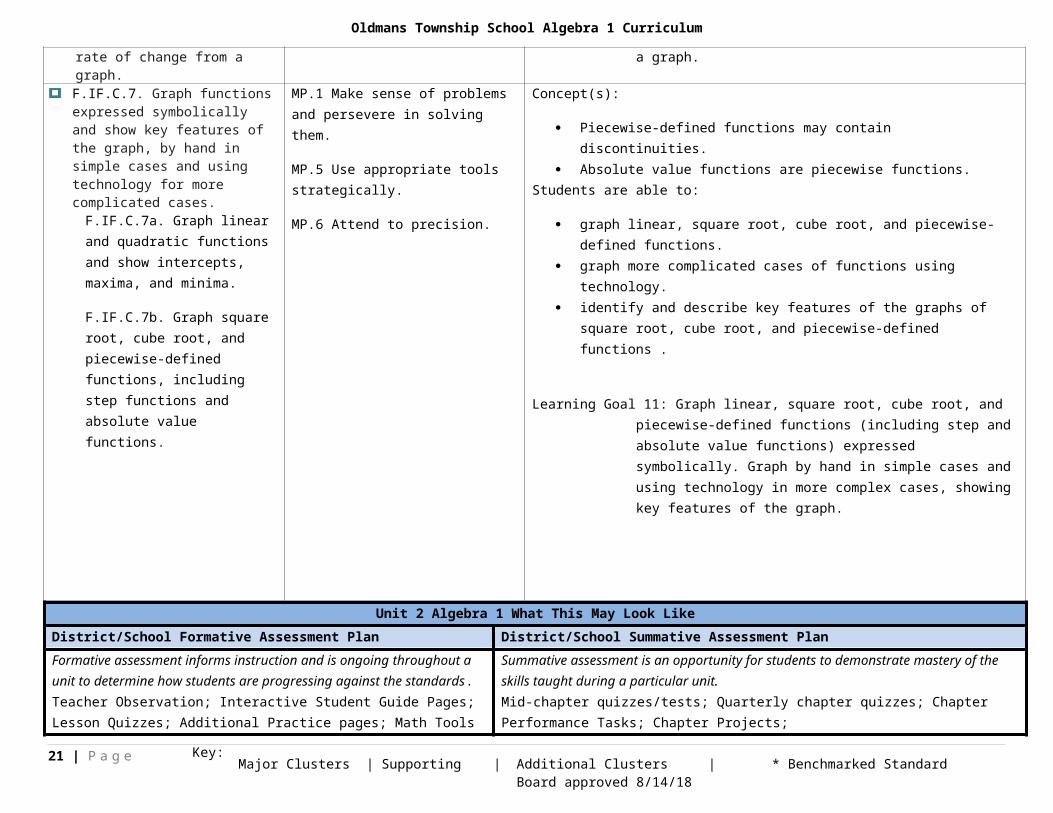
F.IF.C.7. Graph functions expressed symbolically and show key features of the graph, by hand in simple cases and using technology for more complicated cases.
F.IF.C.7a. Graph linear and quadratic functions and show intercepts, maxima, and minima.
F.IF.C.7b. Graph square root, cube root, and piecewise-defined functions, including step functions and absolute value functions.
MP.1 Make sense of problems and persevere in solving them.
MP.5 Use appropriate tools strategically.
MP.6 Attend to precision.
Concept(s):
Piecewise-defined functions may contain discontinuities. Absolute value functions are piecewise functions.
Students are able to:
graph linear, square root, cube root, and piecewise-defined functions. graph more complicated cases of functions using technology. identify and describe key features of the graphs of square root, cube root, and
piecewise-defined functions .
Learning Goal 11: Graph linear, square root, cube root, and piecewise-defined functions (including step and absolute value functions) expressed symbolically. Graph by hand in simple cases and using technology in more complex cases, showing key features of the graph.
14 | P a g e Major Clusters | Additional Clusters | * Benchmarked Standard Board approved 8/14/18Supporting | Key:
Oldmans Township School Algebra 1 Curriculum
Unit 2 Algebra 1 What This May Look LikeDistrict/School Formative Assessment Plan District/School Summative Assessment PlanFormative assessment informs instruction and is ongoing throughout a unit to determine how students are progressing against the standards.Teacher Observation; Interactive Student Guide Pages; Lesson Quizzes; Additional Practice pages; Math Tools and Games; Benchmark Test; Preparing for Assessment pages; Self-check Quizzes; Ticket out the Door; Study Guide and Review; Practice Tests; Check Your Understanding;
Summative assessment is an opportunity for students to demonstrate mastery of the skills taught during a particular unit.Mid-chapter quizzes/tests; Quarterly chapter quizzes; Chapter Performance Tasks; Chapter Projects;
Focus Mathematical Concepts & PacingDistricts should consider listing prerequisites skills. Concepts that include a focus on relationships and representation might be listed as grade level appropriate.
Prerequisite skills: write a function that describes a relationship between two quantities; find inverse functions; interpret the parameters in a linear or exponential function in terms of a context; represent data on two quantitative variables on a scatter plot and describe how the variables are related; distinguish between correlation and causation; use structure of an expression to identify ways to rewrite it; use function notation, evaluate functions for inputs in their domains, and interpret statements that use function notation in terms of a context
Unit Focus: Create equations and inequalities in one variable and use them to solve problems Solve linear equations and inequalities in one variable, including equations with coefficients represented by letters Graph the solutions to linear inequality in two variables as a half-plane, and graph the solution set to a system of linear inequalities in two variables as the intersection of the
corresponding half-planes Determine the number of solutions a system of linear equations has Solve and apply systems of linear equations Solve real-world problems involving systems of equations Multiply and divide monomials using the properties of exponents Simplify expressions using the multiplication properties of exponents Simplify expressions containing negative an zero exponents Evaluate, rewrite, and solve equations involving expressions with rational exponents Simplify square roots by applying the Product and Quotient Properties of Square Roots
15 | P a g e Major Clusters | Additional Clusters | * Benchmarked Standard Board approved 8/14/18Supporting | Key:

Oldmans Township School Algebra 1 Curriculum
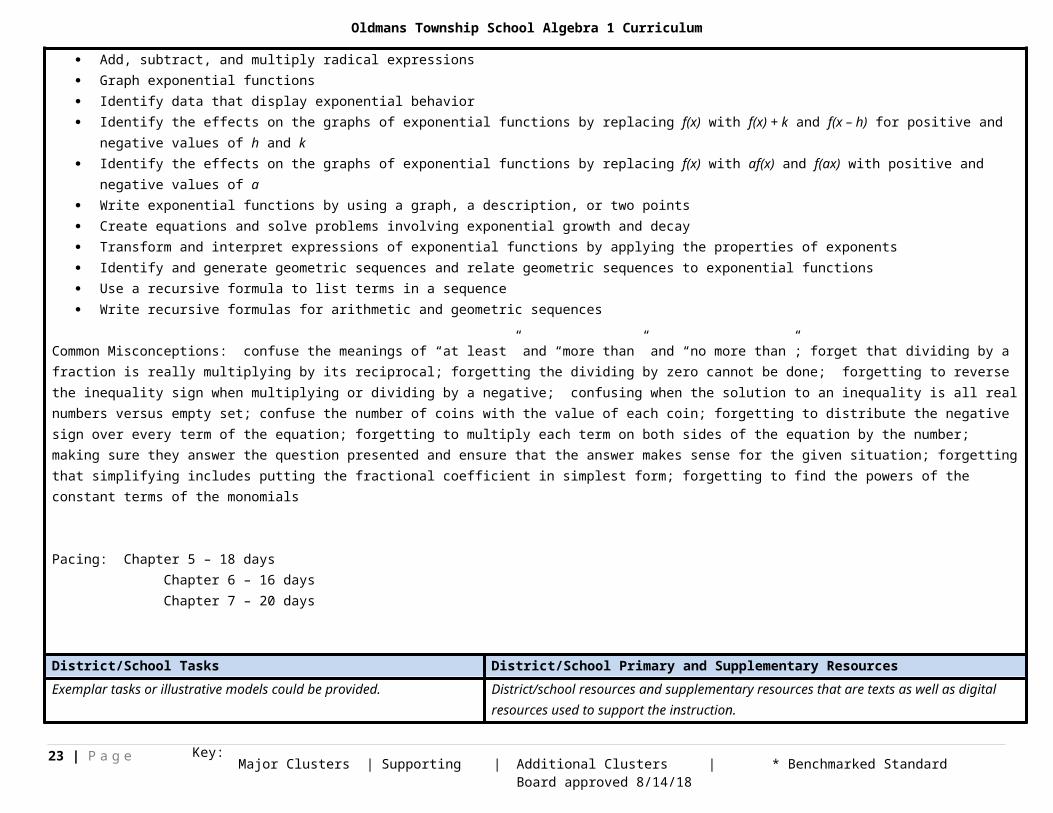
Add, subtract, and multiply radical expressions Graph exponential functions Identify data that display exponential behavior Identify the effects on the graphs of exponential functions by replacing f(x) with f(x) + k and f(x – h) for positive and negative values of h and k Identify the effects on the graphs of exponential functions by replacing f(x) with af(x) and f(ax) with positive and negative values of a Write exponential functions by using a graph, a description, or two points Create equations and solve problems involving exponential growth and decay Transform and interpret expressions of exponential functions by applying the properties of exponents Identify and generate geometric sequences and relate geometric sequences to exponential functions Use a recursive formula to list terms in a sequence Write recursive formulas for arithmetic and geometric sequences
Common Misconceptions: confuse the meanings of “at least” and “more than” and “no more than”; forget that dividing by a fraction is really multiplying by its reciprocal; forgetting the dividing by zero cannot be done; forgetting to reverse the inequality sign when multiplying or dividing by a negative; confusing when the solution to an inequality is all real numbers versus empty set; confuse the number of coins with the value of each coin; forgetting to distribute the negative sign over every term of the equation; forgetting to multiply each term on both sides of the equation by the number; making sure they answer the question presented and ensure that the answer makes sense for the given situation; forgetting that simplifying includes putting the fractional coefficient in simplest form; forgetting to find the powers of the constant terms of the monomials
Pacing: Chapter 5 – 18 days Chapter 6 – 16 days Chapter 7 – 20 days
District/School Tasks District/School Primary and Supplementary ResourcesExemplar tasks or illustrative models could be provided.
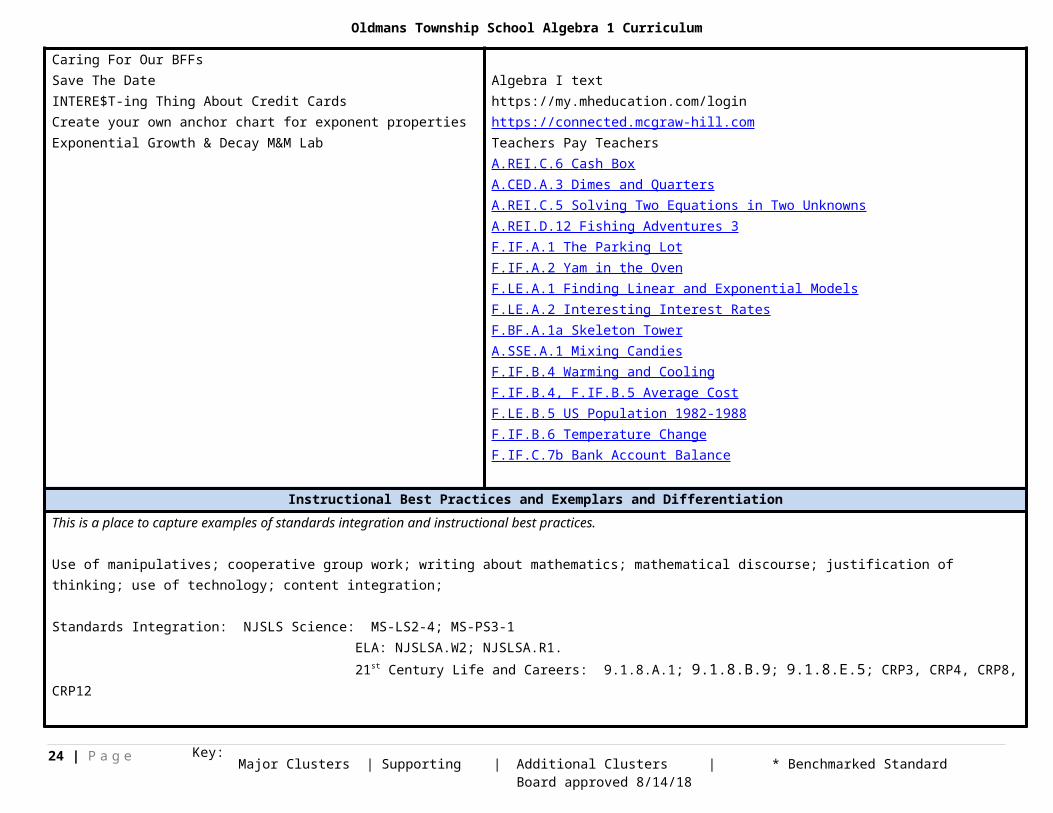
Caring For Our BFFsSave The DateINTERE$T-ing Thing About Credit CardsCreate your own anchor chart for exponent propertiesExponential Growth & Decay M&M Lab
District/school resources and supplementary resources that are texts as well as digital resources used to support the instruction.
Algebra I texthttps://my.mheducation.com/loginhttps://connected.mcgraw-hill.comTeachers Pay TeachersA.REI.C.6 Cash BoxA.CED.A.3 Dimes and QuartersA.REI.C.5 Solving Two Equations in Two UnknownsA.REI.D.12 Fishing Adventures 3F.IF.A.1 The Parking LotF.IF.A.2 Yam in the Oven
16 | P a g e Major Clusters | Additional Clusters | * Benchmarked Standard Board approved 8/14/18Supporting | Key:
Oldmans Township School Algebra 1 Curriculum
F.LE.A.1 Finding Linear and Exponential ModelsF.LE.A.2 Interesting Interest RatesF.BF.A.1a Skeleton TowerA.SSE.A.1 Mixing CandiesF.IF.B.4 Warming and CoolingF.IF.B.4, F.IF.B.5 Average CostF.LE.B.5 US Population 1982-1988F.IF.B.6 Temperature ChangeF.IF.C.7b Bank Account Balance
Instructional Best Practices and Exemplars and DifferentiationThis is a place to capture examples of standards integration and instructional best practices.
Use of manipulatives; cooperative group work; writing about mathematics; mathematical discourse; justification of thinking; use of technology; content integration;
Standards Integration: NJSLS Science: MS-LS2-4; MS-PS3-1 ELA: NJSLSA.W2; NJSLSA.R1. 21st Century Life and Careers: 9.1.8.A.1; 9.1.8.B.9; 9.1.8.E.5; CRP3, CRP4, CRP8, CRP12 Differentiation: Skills Practice, Word Problem Practice, Study Guide and Intervention, Study Notebook, Enrichment, Differentiated Homework Options, Extension Activities, Personal Tutors, BrainPop, eToolkit, Geometer’s Sketchpad, Desmos, MathTV.com, Learnsmart, Aleks
Unit 3 Algebra 1
Content Standards Suggested Standards for Mathematical Practice
Critical Knowledge & Skills
A.APR.A.1. Understand that polynomials form a system analogous to the integers, namely, they are closed under the operations of addition, subtraction, and multiplication; add, subtract, and multiply polynomials.A.SSE.A.2. Use the structure of an expression to identify ways to
MP.2 Reason abstractly and quantitatively.
MP.7 Look for and make use of structure.
Concept(s):
Polynomials form a system analogous to the integers. Polynomials are closed under the operations of addition, subtraction, and
multiplication. Students are able to:
add and subtract polynomials.
17 | P a g e Major Clusters | Additional Clusters | * Benchmarked Standard Board approved 8/14/18Supporting | Key:
Oldmans Township School Algebra 1 Curriculum
Unit 3 Algebra 1
Content Standards Suggested Standards for Mathematical Practice
Critical Knowledge & Skills
rewrite it.For example, see x4 - y4 as (x2)2 - (y2)2, thus recognizing it as a difference of squares that can be factored as (x2 - y2)(x2 + y2).
multiply polynomials. recognize numerical expressions as a difference of squares and rewrite the expression
as the product of sums/differences. recognize polynomial expressions in one variable as a difference of squares and
rewrite the expression as the product of sums/differences.
Learning Goal 1: Add, subtract, and multiply polynomials, relating these to arithmetic operations with integers. Factor to produce equivalent forms of quadratic expressions in one variable.
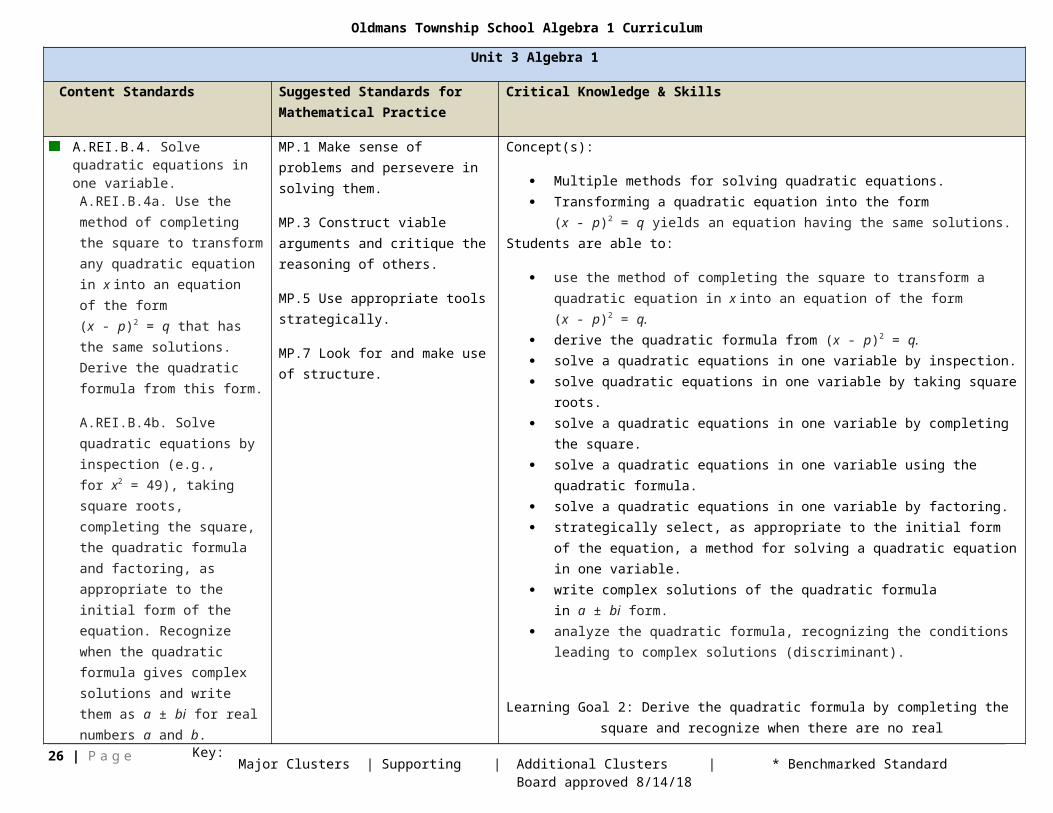
A.REI.B.4. Solve quadratic equations in one variable.
A.REI.B.4a. Use the method of completing the square to transform any quadratic equation in x into an equation of the form (x - p)2 = q that has the same solutions. Derive the quadratic formula from this form.
A.REI.B.4b. Solve quadratic equations by inspection (e.g., for x2 = 49), taking square roots, completing the square, the quadratic formula and factoring, as appropriate to the initial form of the equation. Recognize when the quadratic formula gives complex solutions and write them as a ± bi for real numbers a and b.
MP.1 Make sense of problems and persevere in solving them.
MP.3 Construct viable arguments and critique the reasoning of others.
MP.5 Use appropriate tools strategically.
MP.7 Look for and make use of structure.
Concept(s):
Multiple methods for solving quadratic equations. Transforming a quadratic equation into the form (x - p)2 = q yields an equation having
the same solutions.Students are able to:
use the method of completing the square to transform a quadratic equation in x into an equation of the form (x - p)2 = q.
derive the quadratic formula from (x - p)2 = q. solve a quadratic equations in one variable by inspection. solve quadratic equations in one variable by taking square roots. solve a quadratic equations in one variable by completing the square. solve a quadratic equations in one variable using the quadratic formula. solve a quadratic equations in one variable by factoring. strategically select, as appropriate to the initial form of the equation, a method for
solving a quadratic equation in one variable. write complex solutions of the quadratic formula in a ± bi form. analyze the quadratic formula, recognizing the conditions leading to complex solutions
(discriminant).
Learning Goal 2: Derive the quadratic formula by completing the square and recognize when there are no real solutions.
18 | P a g e Major Clusters | Additional Clusters | * Benchmarked Standard Board approved 8/14/18Supporting | Key:
Oldmans Township School Algebra 1 Curriculum
Unit 3 Algebra 1
Content Standards Suggested Standards for Mathematical Practice
Critical Knowledge & Skills
Learning Goal 3: Solve quadratic equations in one variable using a variety of methods (including inspection, taking square roots, factoring, completing the square, and the quadratic formula) and write complex solutions in a ± bi form.
A.CED.A.1. Create equations and inequalities in one variable and use them to solve problems. Include equations arising from linear functions and quadratic functions, and simple rational and exponential functions.
MP 2 Reason abstractly and quantitatively.
MP.6 Attend to precision.
MP.7 Look for and make use of structure.
Concept(s): No new concept(s) introduced
Students are able to:
create quadratic equations in one variable. use quadratic equations to solve real world problems.
Learning Goal 4: Create quadratic equations in one variable and use them to solve problems.
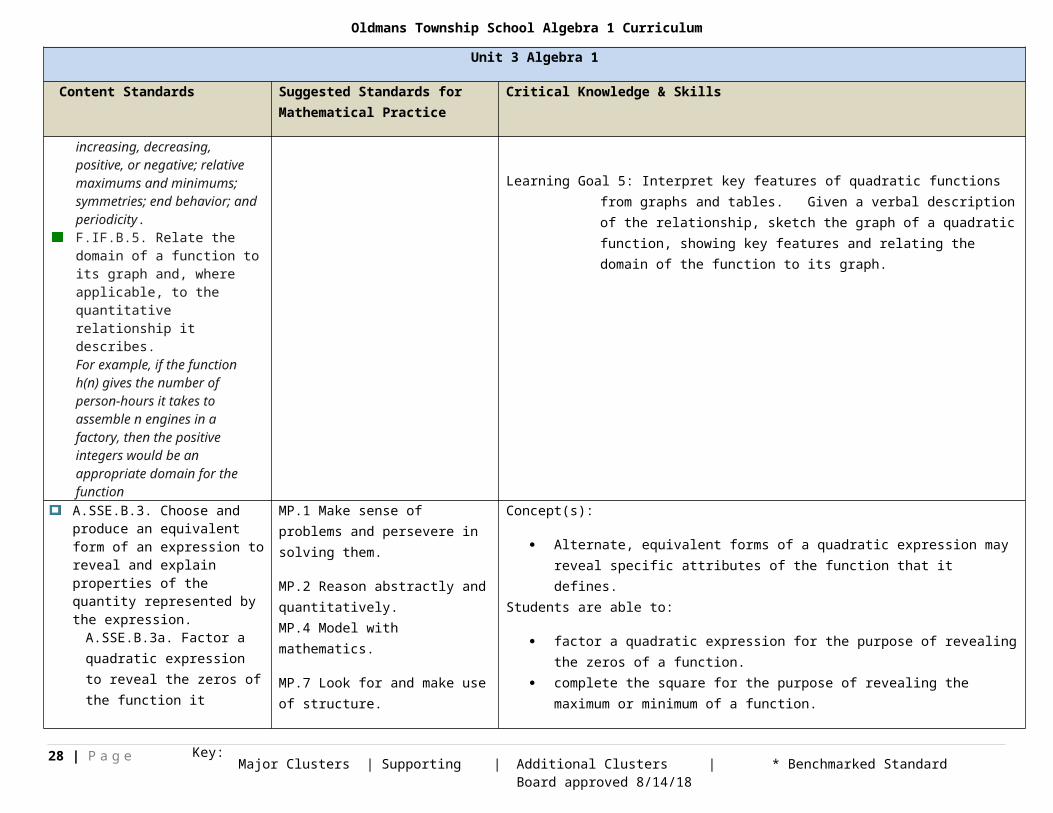
F.IF.B.4. For a function that models a relationship between two quantities, interpret key features of graphs and tables in terms of the quantities, and sketch graphs showing key features given a verbal description of the relationship. Key features include: intercepts; intervals where the function is increasing, decreasing, positive, or negative; relative maximums and minimums; symmetries; end behavior; and periodicity.F.IF.B.5. Relate the domain of a function to its graph and, where applicable, to the quantitative relationship it describes. For example, if the function h(n) gives the number of person-hours it takes to assemble n engines in a factory, then the positive integers would be an appropriate domain for the function
MP.4 Model with mathematics.
MP.6 Attend to precision.
Concept(s): No new concept(s) introduced
Students are able to:
interpret maximum/minimum and intercepts of quadratic functions from graphs and tables in the context of the problem.
sketch graphs of quadratic functions given a verbal description of the relationship between the quantities.
identify intercepts and intervals where function is increasing/decreasing determine the practical domain of a function.
Learning Goal 5: Interpret key features of quadratic functions from graphs and tables. Given a verbal description of the relationship, sketch the graph of a quadratic function, showing key features and relating the domain of the function to its graph.
A.SSE.B.3. Choose and produce an MP.1 Make sense of problems and Concept(s):
19 | P a g e Major Clusters | Additional Clusters | * Benchmarked Standard Board approved 8/14/18Supporting | Key:
Oldmans Township School Algebra 1 Curriculum
Unit 3 Algebra 1
Content Standards Suggested Standards for Mathematical Practice
Critical Knowledge & Skills
equivalent form of an expression to reveal and explain properties of the quantity represented by the expression.
A.SSE.B.3a. Factor a quadratic expression to reveal the zeros of the function it defines.
A.SSE.B.3b. Complete the square in a quadratic expression to reveal the maximum or minimum value of the function it defines.
persevere in solving them.
MP.2 Reason abstractly and quantitatively. MP.4 Model with mathematics.
MP.7 Look for and make use of structure.
Alternate, equivalent forms of a quadratic expression may reveal specific attributes of the function that it defines.
Students are able to:
factor a quadratic expression for the purpose of revealing the zeros of a function. complete the square for the purpose of revealing the maximum or minimum of a
function.
Learning Goal 6: Use factoring and completing the square to produce equivalent forms of quadratic expressions in one variable that highlight particular properties such as the zeros or the maximum or minimum value of the function.
F.BF.A.1. Write a function that describes a relationship between two quantities.
F.BF.A.1a: Determine an explicit expression, a recursive process, or steps for calculation from a context.
MP.2 Reason abstractly and quantitatively. MP.4 Model with mathematics.
Concept(s): No new concept(s) introduced
Students are able to:
given a context, write explicit expressions, a recursive process or steps for calculation for quadratic relationships.
Learning Goal 7: Given a context, write an explicit expression, a recursive process or steps for calculation for quadratic relationships.
F.IF.C.7. Graph functions expressed symbolically and show key features of the graph, by hand in simple cases and using technology for more complicated cases.
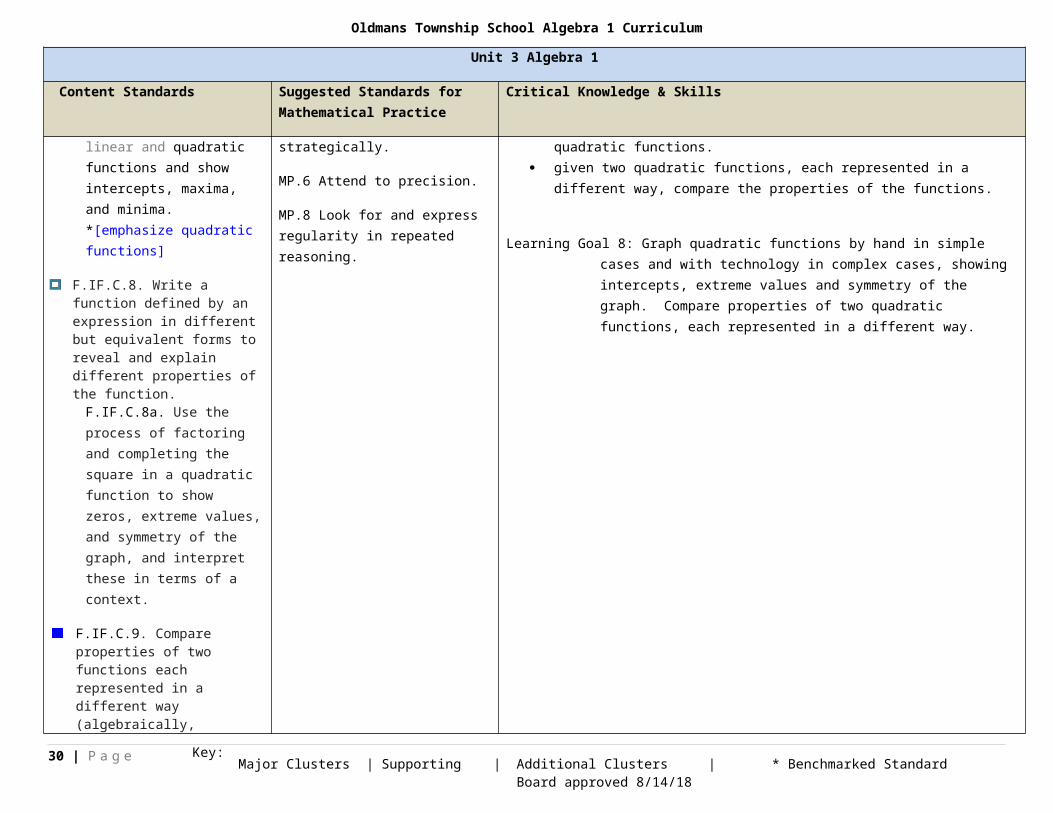
F.IF.C.7a. Graph linear and quadratic functions and show intercepts, maxima, and minima. *[emphasize quadratic functions]
F.IF.C.8. Write a function defined
MP.1 Make sense of problems and persevere in solving them.
MP.3 Construct viable arguments and critique the reasoning of others.
MP.5 Use appropriate tools strategically.
MP.6 Attend to precision.
Concept(s): No new concept(s) introduced
Students are able to:
graph quadratic functions expressed symbolically. graph more complicated cases of quadratic functions using technology. identify and describe key features of the graphs of quadratic functions. given two quadratic functions, each represented in a different way, compare the
properties of the functions.
20 | P a g e Major Clusters | Additional Clusters | * Benchmarked Standard Board approved 8/14/18Supporting | Key:
Oldmans Township School Algebra 1 Curriculum
Unit 3 Algebra 1
Content Standards Suggested Standards for Mathematical Practice
Critical Knowledge & Skills
by an expression in different but equivalent forms to reveal and explain different properties of the function.
F.IF.C.8a. Use the process of factoring and completing the square in a quadratic function to show zeros, extreme values, and symmetry of the graph, and interpret these in terms of a context.
F.IF.C.9. Compare properties of two functions each represented in a different way (algebraically, graphically, numerically in tables, or by verbal descriptions). For example, given a graph of one quadratic function and an algebraic expression for another, say which has the larger maximum.
MP.8 Look for and express regularity in repeated reasoning.
Learning Goal 8: Graph quadratic functions by hand in simple cases and with technology in complex cases, showing intercepts, extreme values and symmetry of the graph. Compare properties of two quadratic functions, each represented in a different way.
F.IF.B.6. Calculate and interpret the average rate of change of a function (presented symbolically or as a table) over a specified interval. Estimate the rate of change from a graph.F.LE.A.3. Observe using graphs and tables that a quantity increasing exponentially eventually exceeds a quantity increasing linearly, quadratically, or (more generally) as a polynomial function.
MP.1 Make sense of problems and persevere in solving them.MP.4 Model with mathematics.
MP.5 Use appropriate tools strategically.
MP.7 Look for and make use of structure.
Concept(s):
A quantity increasing exponentially eventually exceeds a quantity increasing quadratically.
Students are able to:
calculate the rate of change of a quadratic function from a table of values or from a function presented symbolically.
estimate the rate of change from a graph of a quadratic function. analyze graphs and tables to compare rates of change of exponential and quadratic
functions.
Learning Goal 9: Calculate and interpret the average rate of change of a quadratic function presented symbolically or as a table. Estimate and compare the rates of change from graphs of quadratic and exponential functions.
21 | P a g e Major Clusters | Additional Clusters | * Benchmarked Standard Board approved 8/14/18Supporting | Key:
Oldmans Township School Algebra 1 Curriculum
Unit 3 Algebra 1
Content Standards Suggested Standards for Mathematical Practice
Critical Knowledge & Skills
F.BF.B.3. Identify the effect on the graph of replacing f(x) by f(x) + k, k f(x), f(kx), and f(x + k) for specific values of k (both positive and negative); find the value of k given the graphs. Experiment with cases and illustrate an explanation of the effects on the graph using technology. Include recognizing even and odd functions from their graphs and algebraic expressions for them.
MP.3 Construct viable arguments and critique the reasoning of others.
MP.5 Use appropriate tools strategically.
MP.7 Look for and make use of structure.
Concept(s):
Characteristics of even and odd functions in graphs and algebraic expressions Vertical and horizontal shifts
Students are able to:
perform transformations on graphs of linear and quadratic functions. identify the effect on the graph of replacing f(x) by
f(x) + k; k f(x); f(kx); and f(x + k) for specific values of k (both positive and negative).
identify the effect on the graph of combinations of transformations. given the graph, find the value of k. illustrate an explanation of the effects on linear and quadratic graphs using technology. recognize even and odd functions from their graphs and from algebraic expressions for
them.
Learning Goal 10: Identify the effects of transformations and combinations of transformations [f(x) + k, k f(x), f(kx), and f(x + k)] on a function; find the value of k given the graph.
A.REI.D.11. Explain why the x-coordinates of the points where the graphs of the equations y = f(x) and y = g(x) intersect are the solutions of the equation f(x) = g(x); find the solutions approximately, e.g., using technology to graph the functions, make tables of values, or find successive approximations. Include cases where f(x) and/or g(x) are linear, polynomial, rational, absolute value, exponential, and logarithmic functions.*
MP.1 Make sense of problems and persevere in solving them.
MP.5 Use appropriate tools strategically.
Concept(s): No new concept(s) introduced
Students are able to:
approximate the solution(x) to a system of equations comprised of a linear and a quadratic function by using technology to graph the functions, by making a table of values and/or by finding successive approximations.
Learning Goal 11: Find approximate solutions of f(x) = g(x), where f(x) is a linear function and g(x) is a quadratic function by making a table of values, using technology to graph and finding successive approximations.
A.APR.B.3. Identify zeros of polynomials when suitable
MP.7 Look for and make use of Concept(s):
22 | P a g e Major Clusters | Additional Clusters | * Benchmarked Standard Board approved 8/14/18Supporting | Key:
Oldmans Township School Algebra 1 Curriculum
Unit 3 Algebra 1
Content Standards Suggested Standards for Mathematical Practice
Critical Knowledge & Skills
factorizations are available, and use the zeros to construct a rough graph of the function defined by the polynomial. *[Algebra 1: limit to quadratic and cubic functions in which linear and quadratic factors are available]
structure. General shape(s) and end behavior of cubic functionsStudents are able to:
find the zeros of a polynomial (quadratic and cubic). test domain intervals to determine where f(x) is greater than or less than zero. use zeros of a function to sketch a graph.
Learning Goal 12: Identify zeros of cubic functions when suitable factorizations are available and use the zeros to construct a rough graph of the function. (*cubic functions are presented as the product of a linear and a quadratic factor)
N.RN.B.3. Explain why the sum or product of two rational numbers is rational; that the sum of a rational number and an irrational number is irrational; and that the product of a nonzero rational number and an irrational number is irrational.
MP.3 Construct viable arguments and critique the reasoning of others.
MP.6 Attend to precision.
Concept(s):
The sum or product of two rational numbers is rational. The sum of a rational number and an irrational number is irrational. The product of a nonzero rational number and an irrational number is irrational.
Students are able to:
explain and justify conclusions regarding sums and products of two rational numbers.. explain and justify conclusions regarding the sum of a rational and irrational number. explain and justify conclusions regarding the product of a nonzero rational and
irrational number.
Learning Goal 13: Explain and justify conclusions about sums and products of rational and irrational numbers.
Unit 3 Algebra 1 What This May Look LikeDistrict/School Formative Assessment Plan District/School Summative Assessment PlanFormative assessment informs instruction and is ongoing throughout a unit to determine how students are progressing against the standards.
Teacher Observation; Interactive Student Guide Pages; Lesson Quizzes; Additional Practice pages; Math Tools and Games; Benchmark Test; Preparing for Assessment pages; Self-check Quizzes; Ticket out the Door; Study Guide and
Summative assessment is an opportunity for students to demonstrate mastery of the skills taught during a particular unit.
Mid-chapter quizzes/tests; Quarterly chapter quizzes; Chapter Performance Tasks; Chapter Projects;
23 | P a g e Major Clusters | Additional Clusters | * Benchmarked Standard Board approved 8/14/18Supporting | Key:
Oldmans Township School Algebra 1 Curriculum
Review; Practice Tests; Check Your Understanding;
Focus Mathematical Concepts & PacingDistricts should consider listing prerequisites skills. Concepts that include a focus on relationships and representation might be listed as grade level appropriate.
Prerequisite skills: Construct linear and exponential functions, including arithmetic and geometric sequences, given a graph, a description of a relationship, or two input-output pairs; use the structure of an expression to identify ways to rewrite it; factor a quadratic expression to reveal the zeros of the function it defines; understand that polynomials form a system analogous to the integers, namely, they are closed under the operations of addition, subtraction, and multiplication; add, subtract, and multiply polynomials
Unit Focus: Write polynomials in standard form Add and subtract polynomials Multiply a polynomial by a monomial Solve equations involving the products of monomials and polynomials Multiply binomials by using the FOIL method and polynomials using the Distributive Property Find the square of sums and differences Find the product of a sum and a difference Use the Distributive Property to factor polynomials Factor polynomials by grouping Factor trinomials of the form x2+bx+c Factor trinomials of the from a x2+bx+c Factor binomials that are the difference of squares and that are perfect squares Analyze the characteristics of graphs of quadratic functions Graph quadratic functions Apply translations, dilations, and reflections to quadratic functions Solve quadratic equations (estimate solutions when graphing) by graphing and by algebraic methods Solve systems of linear and quadratic equations by graphing and by algebraic methods Identify linear, quadratic, and exponential functions from given data Write equations that model data Combine functions by using addition, subtraction, and multiplication
Common Misconceptions: combining unlike terms; on a graphing calculator two graphs may coincide in the standard viewing window, but students should check the table to verify identical y-values; forgetting to include the GCF that they factored from the trinomial in front of the other two factors; understanding that parabolas are curved, not straight;
Pacing: Chapter 8 – 18 days Chapter 9 – 17 days
24 | P a g e Major Clusters | Additional Clusters | * Benchmarked Standard Board approved 8/14/18Supporting | Key:

Oldmans Township School Algebra 1 Curriculum
District/School Tasks District/School Primary and Supplementary ResourcesExemplar tasks or illustrative models could be provided.
Predicting Projectiles3 . . . 2 . . . 1 . . . Blast Off! Quadratic Functions ChainCreate your own Foldable (students use the 4 ways to solve a quadratic function to create their own foldable)
District/school resources and supplementary resources that are texts as well as digital resources used to support the instruction.
Algebra I texthttps://my.mheducation.com/loginhttps://connected.mcgraw-hill.comTeachers Pay TeachersA.APR.A.1 Powers of 11A.SSE.A.2 Equivalent ExpressionsA.REI.B.4 Visualizing Completing the SquareA.REI.B.4 Braking DistanceA.REI.B.4 Two Squares are EqualF.IF.B.4 Words – Tables - GraphsF.IF.B.5 The restaurantA.SSE.B.3 Profit of a companyA.SSE.B.3 Rewriting a Quadratic ExpressionF.IF.C.7a Graphs of Quadratic FunctionsF.IF.C.8a Springboard DiveF.IF.C.8a Which Function?F.IF.B.9 Throwing BaseballsF.IF.B.6 Mathemafish PopulationF.LE.A.3 Population and Food SupplyF.BF.B.3 Identifying Even and Odd FunctionsF.BF.B.3 Transforming the graph of a functionA.REI.D.11 Introduction to Polynomials – College FundA.APR.B.3 Graphing from Factors 1N.RN.B.3 Operations with Rational and Irrational Numbers
Instructional Best Practices and Exemplars and DifferentiationThis is a place to capture examples of standards integration and instructional best practices.
25 | P a g e Major Clusters | Additional Clusters | * Benchmarked Standard Board approved 8/14/18Supporting | Key:
Oldmans Township School Algebra 1 Curriculum
Use of manipulatives; cooperative group work; writing about mathematics; mathematical discourse; justification of thinking; use of technology; content integration;
Standards Integration: NJSLS Science: MS-LS2-1; ELA: NJSLSA.W2; NJSLSA.R1. 21st Century Life and Careers: 9.1.8.C.4; 9.1.8.C.5; CRP3, CRP4, CRP8, CRP12; Differentiation: Skills Practice, Word Problem Practice, Study Guide and Intervention, Study Notebook, Enrichment, Differentiated Homework Options, Extension Activities, Personal Tutors, BrainPop, eToolkit, Geometer’s Sketchpad, Desmos, MathTV.com, Learnsmart, Aleks
Unit 4 Algebra 1
Content & Practice Standards Critical Knowledge & Skills
S.ID.A.1. Represent data with plots on the real number line (dot plots, histograms, and box plots).
MP.1 Make sense of problems and persevere in solving them.
MP 2 Reason abstractly and quantitatively. MP.4 Model with mathematics.
MP.5 Use appropriate tools strategically.
MP.6 Attend to precision.
Concept(s): No new concept(s) introduced
Students are able to:
represent data with dot plots on the real number line. represent data with histograms on the real number line. represent data with box plots on the real number line.
Learning Goal 1: Represent data with plots (dot plots, histograms, and box plots) on the real number line.
S.ID.A.2. Use statistics appropriate to the shape of the data distribution to compare center (median, mean) and spread (interquartile range, standard deviation) of two or more different data sets.S.ID.A.3. Interpret differences in shape, center, and spread in the context of the data sets, accounting for possible effects of extreme data points (outliers).
MP.1 Make sense of problems and persevere in solving them.
MP 2 Reason abstractly and quantitatively. MP.4 Model with mathematics.
MP.5 Use appropriate tools strategically.
MP.6 Attend to precision.
Concept(s):
Appropriate use of a statistic depends on the shape of the data distribution. Standard deviation
Students are able to:
represent two or more data sets with plots and use appropriate statistics to compare their center and spread.
interpret differences in shape, center, and spread in context. explain possible effects of extreme data points (outliers) when summarizing data and
interpreting shape, center and spread.
Learning Goal 2: Compare center and spread of two or more data sets, interpreting differences in shape, center, and spread in the context of the data, taking into account the
26 | P a g e Major Clusters | Additional Clusters | * Benchmarked Standard Board approved 8/14/18Supporting | Key:

Oldmans Township School Algebra 1 Curriculum
Unit 4 Algebra 1
Content & Practice Standards Critical Knowledge & Skills
effects of outliers.
S.ID.B.5. Summarize categorical data for two categories in two-way frequency tables. Interpret relative frequencies in the context of the data (including joint, marginal, and conditional relative frequencies). Recognize possible associations and trends in the data.
MP.1 Make sense of problems and persevere in solving them.
MP.5 Use appropriate tools strategically.
MP.7 Look for and make use of structure.
Concept(s):
Categorical variables represent types of data which may be divided into groups.Students are able to:
construct two-way frequency tables for categorical data. interpret joint, marginal and conditional relative frequencies in context. explain possible associations between categorical data in two-way tables. identify and describe trends in the data.
Learning Goal 3: Summarize and interpret categorical data for two categories in two-way frequency tables; explain possible associations and trends in the data.
S.ID.B.6. Represent data on two quantitative variables on a scatter plot, and describe how the variables are related.
S.ID.B.6a. Fit a function to the data (including the use of technology); use functions fitted to data to solve problems in the context of the data. Use given functions or choose a function suggested by the context. Emphasize linear, quadratic, and exponential models.
S.ID.B.6b. Informally assess the fit of a function by plotting and analyzing residuals, including with the use of technology.
MP.1 Make sense of problems and persevere in solving them.
MP 2 Reason abstractly and quantitatively. MP.4 Model with mathematics.
MP.5 Use appropriate tools strategically.
MP.6 Attend to precision.
Concept(s): No new concept(s) introduced
Students are able to:
fit a function to data using technology. solve problems using functions fitted to data (prediction equations). interpret the intercepts of models in context. plot residuals of linear and non-linear functions. analyze residuals in order to informally evaluate the fit of linear and non-linear
functions.
Learning Goal 4: Fit functions to data using technology, plot residuals and informally assess the fit of linear and non-linear functions by analyzing residuals.
F.IF.B.4. For a function that models a relationship between two quantities, interpret key features of
MP.4 Model with mathematics. Concept(s): No new concept(s) introduced
27 | P a g e Major Clusters | Additional Clusters | * Benchmarked Standard Board approved 8/14/18Supporting | Key:
Oldmans Township School Algebra 1 Curriculum
Unit 4 Algebra 1
Content & Practice Standards Critical Knowledge & Skills
graphs and tables in terms of the quantities, and sketch graphs showing key features given a verbal description of the relationship. Key features include: intercepts; intervals where the function is increasing, decreasing, positive, or negative; relative maximums and minimums; symmetries; end behavior; and periodicity.F.IF.B.5. Relate the domain of a function to its graph and, where applicable, to the quantitative relationship it describes. For example, if the function h(n) gives the number of person-hours it takes to assemble n engines in a factory, then the positive integers would be an appropriate domain for the function.
MP.6 Attend to precision. Students are able to:
interpret maximum/minimum and intercepts of functions from graphs and tables in the context of the problem.
sketch graphs of functions given a verbal description of the relationship between the quantities.
identify intercepts and intervals where function is increasing/decreasing. determine the practical domain of a function .
Learning Goal 5: Interpret key features of functions from graphs and tables. Given a verbal description of the relationship, sketch the graph of a function, showing key features and relating the domain of the function to its graph.
Unit 4 Algebra 1 What This May Look LikeDistrict/School Formative Assessment Plan District/School Summative Assessment PlanFormative assessment informs instruction and is ongoing throughout a unit to determine how students are progressing against the standards.
Teacher Observation; Interactive Student Guide Pages; Lesson Quizzes; Additional Practice pages; Math Tools and Games; Benchmark Test; Preparing for Assessment pages; Self-check Quizzes; Ticket out the Door; Study Guide and Review; Practice Tests; Check Your Understanding;
Summative assessment is an opportunity for students to demonstrate mastery of the skills taught during a particular unit.
Mid-chapter quizzes/tests; Quarterly chapter quizzes; Chapter Performance Tasks; Chapter Projects;
Focus Mathematical Concepts & PacingDistricts should consider listing prerequisites skills. Concepts that include a focus on relationships and representation might be listed as grade level appropriate.
Prerequisite skills: Solve quadratic equations by inspection, taking square roots, completing the square, the quadratic formulas, and factoring, as appropriate to the initial form of the equation; recognize when the quadratic formula gives complex solutions and write them as a± bi for real numbers a and b; graph linear and quadratic functions and show intercepts, maxima, and minima; identify the effect on the graph of replacing f(x) by f(x) + k, kf(x), f(kx), and f(x + k) for specific values of k (both positive and negative); find the value of k
28 | P a g e Major Clusters | Additional Clusters | * Benchmarked Standard Board approved 8/14/18Supporting | Key:

Oldmans Township School Algebra 1 Curriculum
given the graphs; experiment with cases and illustrate an explanation of the effects on the graph using technology
Unit Focus: Represent sets of data by using measures of center and percentiles Represent data by suing dot plots Determine whether a discrete or continuous graphical representation is appropriate, and then create the bar graph or histogram Calculate measure of spread Analyze data sets using statistics Describe the shape of a distribution Use the shapes of distributions to select appropriate statistics Determine the effect that transformations of data have on measure of central tendency and variation Compare data using measures of central tendency and variation Summarize data in two-way frequency tables and in two-way relative frequency tables
Common Misconceptions: forgetting to put data in numerical order when finding the median; confuse negatively and positively skewed; having the marginal frequencies add to more or less than 100% and the error is mathematical, not due to a reasonable rounding error;
Pacing: Chapter 10 – 18 days
District/School Tasks District/School Primary and Supplementary ResourcesExemplar tasks or illustrative models could be provided.
Food Service
District/school resources and supplementary resources that are texts as well as digital resources used to support the instruction.
Algebra I texthttps://my.mheducation.com/loginhttps://connected.mcgraw-hill.comTeachers Pay TeachersS.ID.A.1-3 Haircut CostsS.ID.A.1-3 Speed TrapS.ID.A.2-3 Measuring Variability in a Data SetS.ID.A.3 Identifying OutliersS.ID.B.5 Support for a Longer School Day?S.ID.B.6 Laptop Battery Charge 2F.IF.B.4 The AquariumF.IF.B.4 ContainersF.IF.B.4-5 The Canoe Trip, Variation 2
Instructional Best Practices and Exemplars and Differentiation
29 | P a g e Major Clusters | Additional Clusters | * Benchmarked Standard Board approved 8/14/18Supporting | Key:
Oldmans Township School Algebra 1 Curriculum
This is a place to capture examples of standards integration and instructional best practices.
Use of manipulatives; cooperative group work; writing about mathematics; mathematical discourse; justification of thinking; use of technology; content integration;
Standards Integration: NJSLS Science: MS-PS3-5; MS-LS2-1; MS-LS2-4 ELA: NJSLSA.W2; NJSLSA.R1. 21st Century Life and Careers: 9.1.8.E.1; CRP3, CRP4, CRP8, CRP12; Health & Physical Education: 2.1.8.B.3; 2.1.8.B.4 Differentiation: Skills Practice, Word Problem Practice, Study Guide and Intervention, Study Notebook, Enrichment, Differentiated Homework Options, Extension Activities, Personal Tutors, BrainPop, eToolkit, Geometer’s Sketchpad, Desmos, MathTV.com, Learnsmart, Aleks
30 | P a g e Major Clusters | Additional Clusters | * Benchmarked Standard Board approved 8/14/18Supporting | Key: