Embed Size (px)
Citation preview
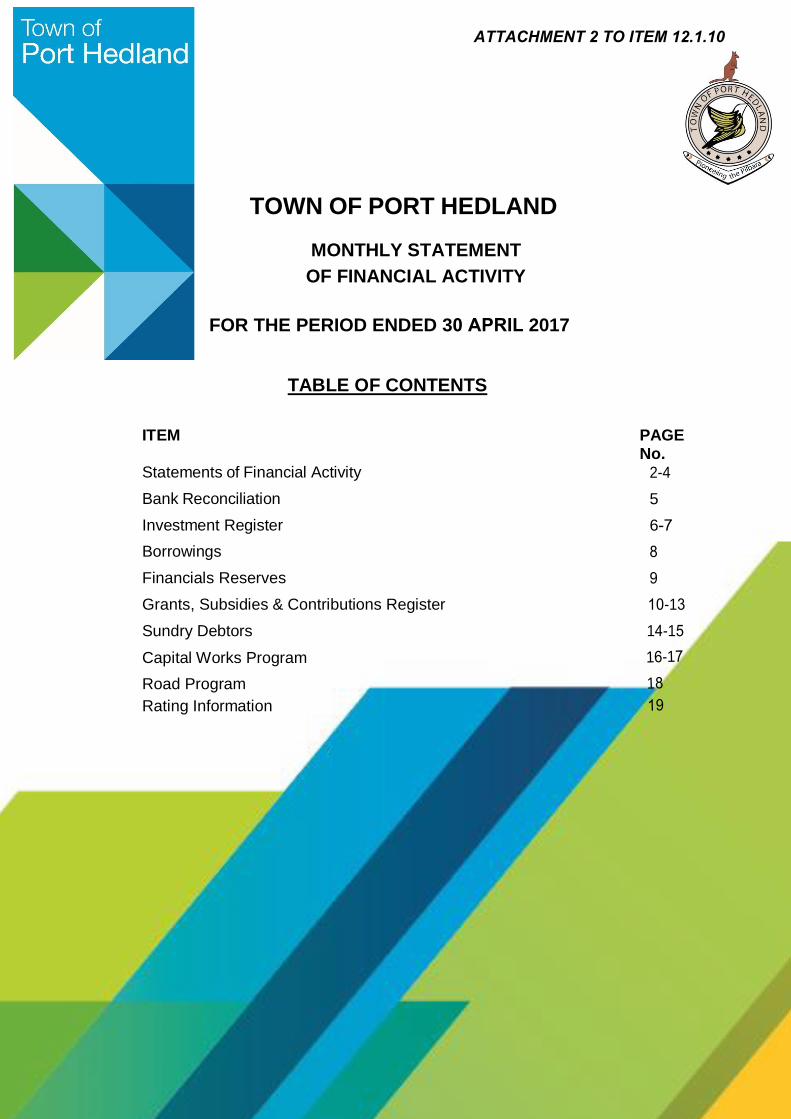
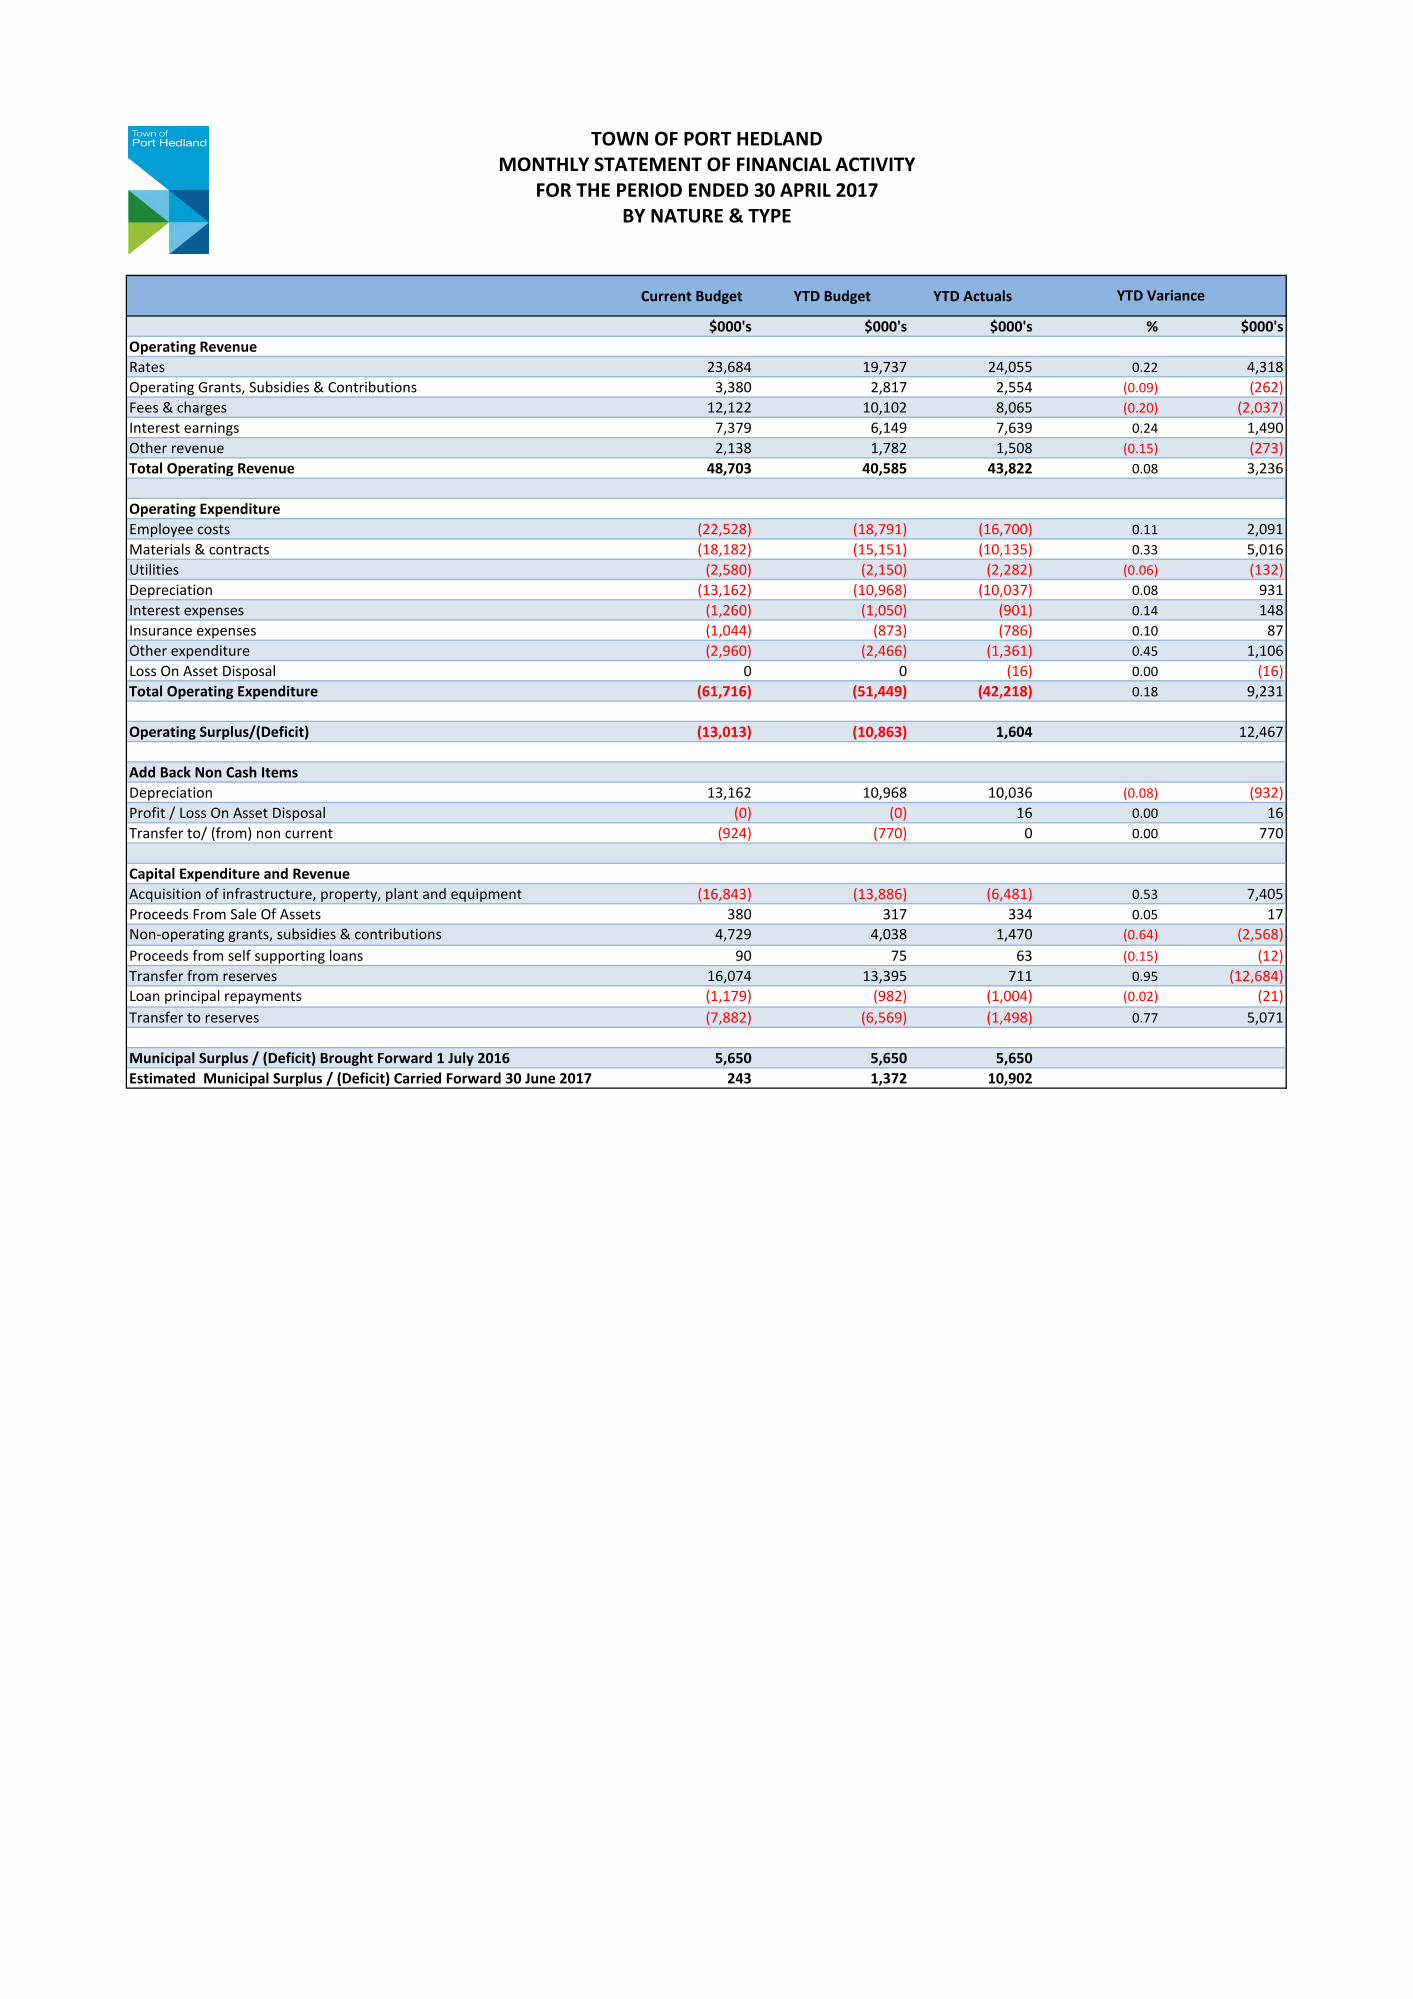
TOWN OF PORT HEDLAND
MONTHLY STATEMENT OF FINANCIAL ACTIVITY
FOR THE PERIOD ENDED 30 APRIL 2017
TABLE OF CONTENTS
ITEM PAGE No.
Statements of Financial Activity
Bank Reconciliation
Investment Register
Borrowings
Financials Reserves
2-4
5
6-789
Grants, Subsidies & Contributions Register 10-13Sundry Debtors 14-15
Capital Works Program
Road Program
Rating Information
16-17
1819
ATTACHMENT 2 TO ITEM 12.1.10
Current Budget YTD Budget YTD Actuals
$000's $000's $000's % $000'sOperating RevenueRates 23,684 19,737 24,055 0.22 4,318Operating Grants, Subsidies & Contributions 3,380 2,817 2,554 (0.09) (262)Fees & charges 12,122 10,102 8,065 (0.20) (2,037)Interest earnings 7,379 6,149 7,639 0.24 1,490Other revenue 2,138 1,782 1,508 (0.15) (273)Total Operating Revenue 48,703 40,585 43,822 0.08 3,236
Operating ExpenditureEmployee costs (22,528) (18,791) (16,700) 0.11 2,091Materials & contracts (18,182) (15,151) (10,135) 0.33 5,016Utilities (2,580) (2,150) (2,282) (0.06) (132)Depreciation (13,162) (10,968) (10,037) 0.08 931Interest expenses (1,260) (1,050) (901) 0.14 148Insurance expenses (1,044) (873) (786) 0.10 87Other expenditure (2,960) (2,466) (1,361) 0.45 1,106Loss On Asset Disposal 0 0 (16) 0.00 (16)Total Operating Expenditure (61,716) (51,449) (42,218) 0.18 9,231
Operating Surplus/(Deficit) (13,013) (10,863) 1,604 12,467
Add Back Non Cash ItemsDepreciation 13,162 10,968 10,036 (0.08) (932)Profit / Loss On Asset Disposal (0) (0) 16 0.00 16Transfer to/ (from) non current (924) (770) 0 0.00 770
Capital Expenditure and RevenueAcquisition of infrastructure, property, plant and equipment (16,843) (13,886) (6,481) 0.53 7,405Proceeds From Sale Of Assets 380 317 334 0.05 17Non-operating grants, subsidies & contributions 4,729 4,038 1,470 (0.64) (2,568)Proceeds from self supporting loans 90 75 63 (0.15) (12)Transfer from reserves 16,074 13,395 711 0.95 (12,684)Loan principal repayments (1,179) (982) (1,004) (0.02) (21)Transfer to reserves (7,882) (6,569) (1,498) 0.77 5,071
Municipal Surplus / (Deficit) Brought Forward 1 July 2016 5,650 5,650 5,650Estimated Municipal Surplus / (Deficit) Carried Forward 30 June 2017 243 1,372 10,902
TOWN OF PORT HEDLANDMONTHLY STATEMENT OF FINANCIAL ACTIVITY
FOR THE PERIOD ENDED 30 APRIL 2017
YTD Variance
BY NATURE & TYPE
Current Budget YTD Budget YTD Actuals$000's $000's $000's % $000's
Operating RevenueGeneral Purpose Funding 33,943 28,286 33,027 0.17 4,741Governance 2 1 2 0.00 0Law, Order & Public Safety 239 199 459 1.31 261Health 480 400 104 (0.74) (296)Education & Welfare 185 154 162 0.05 7Housing 532 443 188 (0.58) (256)Community Amenities 9,233 7,694 6,170 (0.20) (1,524)Recreation & Culture 2,184 1,820 1,834 0.01 15Transport 205 170 9 (0.95) (161)Economic Services 886 738 957 0.30 219Other Property & Services 1,195 995 909 (0.09) (87)Total Operating Revenue 49,083 40,902 43,822 0.07 2,919
Operating ExpenditureGeneral Purpose Funding (723) (603) (549) 0.09 53Governance (3,188) (2,665) (2,287) 0.14 378Law, Order & Public Safety (2,505) (2,088) (1,678) 0.20 409Health (1,280) (1,067) (901) 0.16 166Education & Welfare (3,592) (2,993) (2,397) 0.20 596Housing (555) (462) (382) 0.17 81Community Amenities (10,010) (8,352) (5,228) 0.37 3,124Recreation & Culture (22,574) (18,810) (14,753) 0.22 4,058Transport (14,410) (12,008) (8,974) 0.25 3,034Economic Services (1,824) (1,520) (1,291) 0.15 229Other Property & Services (1,435) (1,197) (3,779) (2.16) (2,582)Total Operating Expenditure (62,096) (51,765) (42,218) 0.18 9,547
Operating Surplus/(Deficit) (13,013) (10,863) 1,604 12,466
Add Back Non Cash ItemsDepreciation 13,162 10,968 10,036 (0.08) (932)(Profit)/ Loss on Disposal of Assets (0) (0) 16 43.78 16Transfers to / (from) Non-current (924) (770) 0 0.00 770
Capital Expenditure and RevenueAcquisition of infrastructure, property, plant and equipment (16,843) (13,886) (6,481) 0.53 7,405Proceeds from disposal of assets 380 317 334 0.05 17Non-operating grants, subsidies and contributions 4,729 4,038 1,470 (0.64) (2,568)Proceeds from self supporting loans 90 75 63 (0.15) (12)Transfer from reserves 16,074 13,395 711 (0.95) (12,684)Loan principal repayments (1,179) (982) (1,004) (0.02) (21)Transfer to reserves (7,882) (6,569) (1,498) 0.77 5,071
Municipal Surplus / (Deficit) Brought Forward 1 July 2016 5,650 5,650 5,650Municipal Surplus / (Deficit) Carried Forward 30 June 2017 243 1,372 10,902
YTD Variance
TOWN OF PORT HEDLANDMONTHLY STATEMENT OF FINANCIAL ACTIVITY
FOR THE PERIOD ENDED 30 APRIL 2017BY PROGRAM
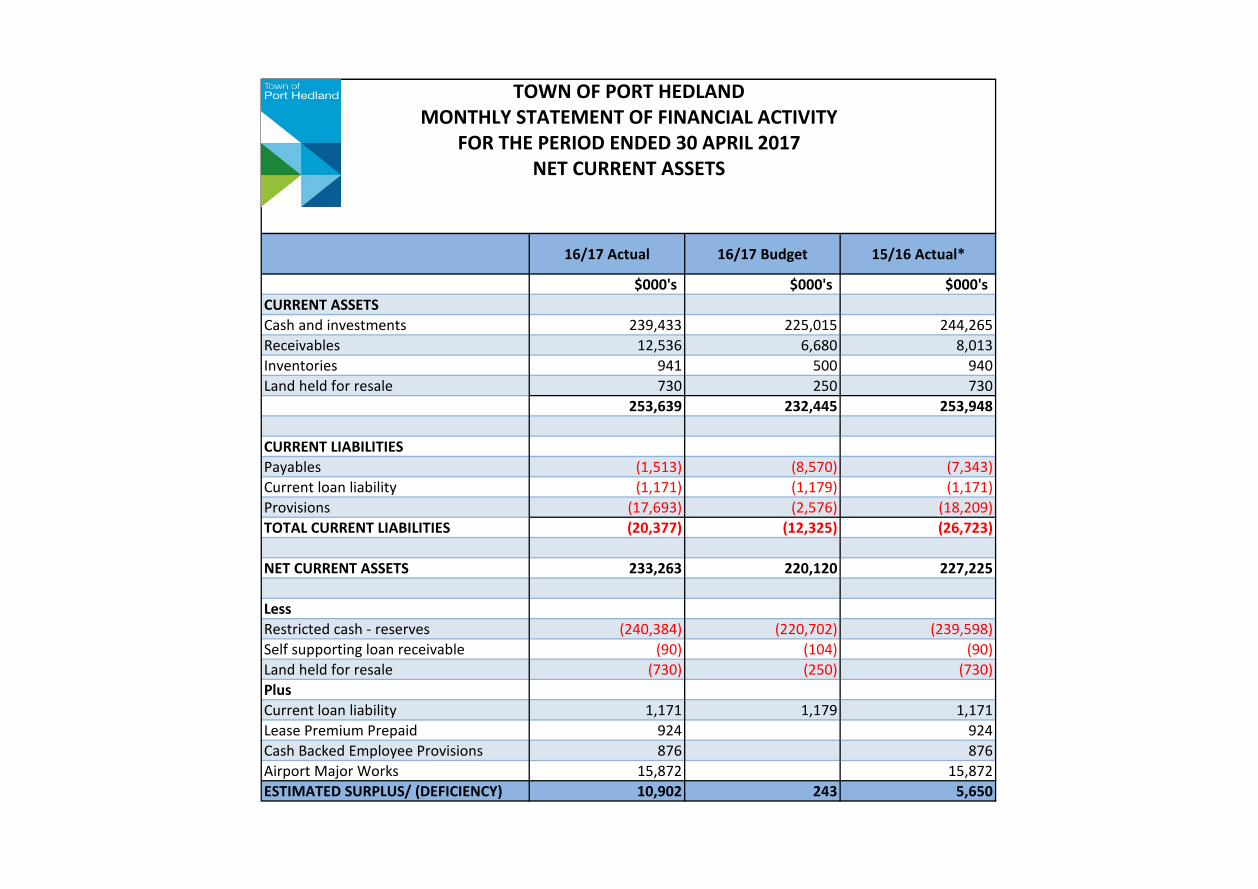
16/17 Actual 16/17 Budget 15/16 Actual*
$000's $000's $000'sCURRENT ASSETSCash and investments 239,433 225,015 244,265Receivables 12,536 6,680 8,013Inventories 941 500 940Land held for resale 730 250 730
253,639 232,445 253,948
CURRENT LIABILITIESPayables (1,513) (8,570) (7,343)Current loan liability (1,171) (1,179) (1,171)Provisions (17,693) (2,576) (18,209)TOTAL CURRENT LIABILITIES (20,377) (12,325) (26,723)
NET CURRENT ASSETS 233,263 220,120 227,225
LessRestricted cash - reserves (240,384) (220,702) (239,598)Self supporting loan receivable (90) (104) (90)Land held for resale (730) (250) (730)PlusCurrent loan liability 1,171 1,179 1,171Lease Premium Prepaid 924 924Cash Backed Employee Provisions 876 876Airport Major Works 15,872 15,872ESTIMATED SURPLUS/ (DEFICIENCY) 10,902 243 5,650
TOWN OF PORT HEDLANDMONTHLY STATEMENT OF FINANCIAL ACTIVITY
NET CURRENT ASSETSFOR THE PERIOD ENDED 30 APRIL 2017
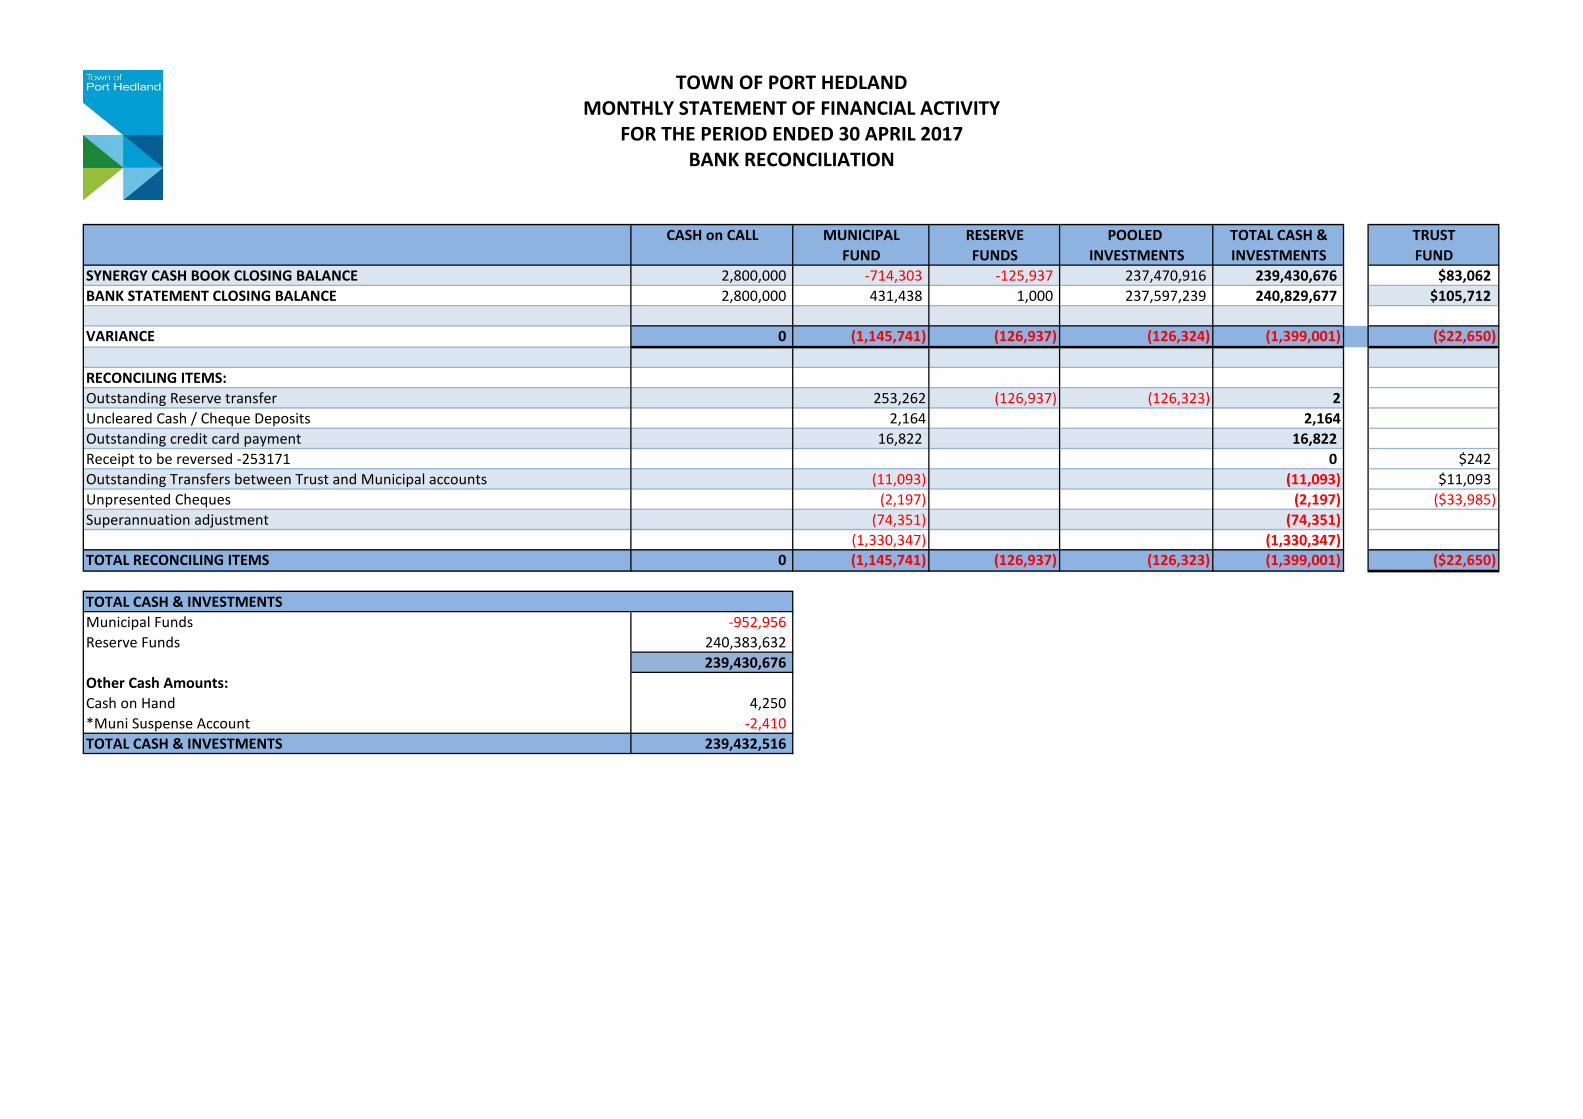
CASH on CALL MUNICIPAL RESERVE POOLED TOTAL CASH & TRUSTFUND FUNDS INVESTMENTS INVESTMENTS FUND
SYNERGY CASH BOOK CLOSING BALANCE 2,800,000 -714,303 -125,937 237,470,916 239,430,676 $83,062BANK STATEMENT CLOSING BALANCE 2,800,000 431,438 1,000 237,597,239 240,829,677 $105,712
VARIANCE 0 (1,145,741) (126,937) (126,324) (1,399,001) ($22,650)
RECONCILING ITEMS:Outstanding Reserve transfer 253,262 (126,937) (126,323) 2Uncleared Cash / Cheque Deposits 2,164 2,164Outstanding credit card payment 16,822 16,822Receipt to be reversed -253171 0 $242Outstanding Transfers between Trust and Municipal accounts (11,093) (11,093) $11,093Unpresented Cheques (2,197) (2,197) ($33,985)Superannuation adjustment (74,351) (74,351)
(1,330,347) (1,330,347)TOTAL RECONCILING ITEMS 0 (1,145,741) (126,937) (126,323) (1,399,001) ($22,650)
TOTAL CASH & INVESTMENTSMunicipal Funds -952,956 Reserve Funds 240,383,632
239,430,676Other Cash Amounts:Cash on Hand 4,250*Muni Suspense Account -2,410 TOTAL CASH & INVESTMENTS 239,432,516
FOR THE PERIOD ENDED 30 APRIL 2017MONTHLY STATEMENT OF FINANCIAL ACTIVITY
TOWN OF PORT HEDLAND
BANK RECONCILIATION

Summary of Portfolio by Financial Institutions (including At Call account)
Institution Principal % of PortfolioAverage Interest
Rate
National Australia Bank 31,873,883 13.3% 2.62%
ANZ 78,202,176 32.5% 2.70%
Bank of Queensland 18,200,000 7.6% 2.71%
Bendigo Bank 5,000,000 2.1% 2.85%
Westpac 81,321,180 33.8% 2.86%
ME Bank 9,400,000 3.9% 2.70%
Rural Bank 5,000,000 2.1% 2.70%
Intech Bank 5,000,000 2.1% 2.78%
Beyond Bank 6,400,000 2.7% 2.72%
TOTAL 240,397,239 100% 3.08%
Summary of Portfolio by Credit Ratings (including At Call account)
Credit Rating Principal % of Portfolio Policy Limit
A1+ 191,397,239 80% 100%
A-2 23,200,000 10% 20%
BBB 25,800,000 11% 20%
Total 240,397,239 100%
Local Government (Financial Management) Regulations 1996, Part 2 s. 6.10 Regulation 8 (3) states that money from different accounts may be placed in a common investment authorised by the Act. The Town of Port Hedland Investment Policy stipulates that direct investments with "A-1+" ratings can be a maximum of 100% of the portfolio. For "A-1" rated Authorised Deposit Institutions (ADI), the maximum that can be invested is 60% of the portfolio while "A-2" rated ADI, the maximum that can be invested is 20% of the portfolio. The policy also states that only a maximum of 35% of the portfolio can be placed with each instituition with a rating of "A-1+", whilst ADIs with a rating of "A-1" can have 20% each and ADIs with "A-2" rating can hold up to 10% of the portfolio.
TOWN OF PORT HEDLANDMONTHLY STATEMENT OF FINANCIAL ACTIVITY
FOR THE PERIOD ENDED 30 APRIL 2017INVESTMENT REGISTER
13.3%
32.5%
7.6%2.1%
33.8%
3.9%
2.1%
Summary of Portfolio by Financial Institutions (including At Call account)
National Australia Bank
ANZ
Bank of Queensland
Bendigo Bank
Westpac
ME Bank
Rural Bank
0.173315342
0.3309782280.0839959540.020894516
0.004178903
0.344848025
Summary of Portfolio by Financial Institutions (including At Call account)
National Australia Bank
ANZ
Bank of Queensland
Bendigo Bank
ING Bank Australia
Westpac
0.20611503
0.3015599710.095094560.020062143
0.010031072
0.0040124290.020062143
0.329821638
Summary of Portfolio by Financial Institutions (including At Call account)
National Australia Bank
ANZ
Bank of Queensland
Bendigo Bank
Commonwealth Bank
ING Bank Australia
AMP
Westpac
20.1%
31.3%10.6%
2.1%1.0%
0.4%2.1%
31.7%
Summary of Portfolio by Financial Institutions (including At Call account)
National Australia Bank
ANZ
Bank of Queensland
Bendigo Bank
Commonwealth Bank
ING Bank Australia
AMP
Westpac
0.19122928
0.3169095760.0950049640.020043241
0.010021621
0.0040086480.020043241
0.329510888
Summary of Portfolio by Financial Institutions (including At Call account)
National Australia Bank
ANZ
Bank of Queensland
Bendigo Bank
Commonwealth Bank
ING Bank Australia
AMP
Westpac
17%
33%
8%2%1%
35%
2%2%
Summary of Portfolio by Financial Institutions (including At Call account)
National Australia Bank
ANZ
Bank of Queensland
Bendigo Bank
ING Bank Australia
Westpac
ME Bank
Beyond Bank
0.165456709
0.323688201
0.0831963140.020695601
0.336598133
Summary of Portfolio by Financial Institutions (including At Call account)
National Australia Bank
ANZ
Bank of Queensland
Bendigo Bank
Westpac
0.20611503
0.3015599710.095094560.020062143
0.010031072
0.004012429
0.020062143
0.329821638
Summary of Portfolio by Financial Institutions (including At Call account)
National Australia Bank
ANZ
Bank of Queensland
Bendigo Bank
Commonwealth Bank
ING Bank Australia
AMP
Westpac
20.1%
31.3%10.6%
2.1%1.0%
0.4%
2.1%
31.7%
Summary of Portfolio by Financial Institutions (including At Call account)
National Australia Bank
ANZ
Bank of Queensland
Bendigo Bank
Commonwealth Bank
ING Bank Australia
AMP
Westpac
0.19122928
0.316909576
0.0950049640.0200432410.010021621
0.004008648
0.020043241
0.329510888
Summary of Portfolio by Financial Institutions (including At Call account)
National Australia Bank
ANZ
Bank of Queensland
Bendigo Bank
Commonwealth Bank
ING Bank Australia
AMP
Westpac
17%
32%
8%2%
34%
2%2%
1% 2%
Summary of Portfolio by Financial Institutions (including At Call account)
National Australia Bank
ANZ
Bank of Queensland
Bendigo Bank
Westpac
ME Bank
Rural Bank
Intech Bank
Beyond Bank
0.165456709
0.323688201
0.0831963140.020695601
0.336598133
Summary of Portfolio by Financial Institutions (including At Call account)
National Australia Bank
ANZ
Bank of Queensland
Bendigo Bank
Westpac
0.20611503
0.3015599710.095094560.020062143
0.010031072
0.004012429
0.020062143
0.329821638
Summary of Portfolio by Financial Institutions (including At Call account)
National Australia Bank
ANZ
Bank of Queensland
Bendigo Bank
Commonwealth Bank
ING Bank Australia
AMP
Westpac
20.1%
31.3%10.6%
2.1%1.0%
0.4%
2.1%
31.7%
Summary of Portfolio by Financial Institutions (including At Call account)
National Australia Bank
ANZ
Bank of Queensland
Bendigo Bank
Commonwealth Bank
ING Bank Australia
AMP
Westpac
0.19122928
0.316909576
0.0950049640.0200432410.010021621
0.004008648
0.020043241
0.329510888
Summary of Portfolio by Financial Institutions (including At Call account)
National Australia Bank
ANZ
Bank of Queensland
Bendigo Bank
Commonwealth Bank
ING Bank Australia
AMP
Westpac
13%
32%
8%2%
34%
4% 2%2% 3%
Summary of Portfolio by Financial Institutions (including At Call account)
National Australia Bank
ANZ
Bank of Queensland
Bendigo Bank
Westpac
ME Bank
Rural Bank
Intech Bank
Beyond Bank
TOWN OF PORT HEDLANDMONTHLY STATEMENT OF FINANCIAL ACTIVITY
FOR THE PERIOD ENDED 30 APRIL 2017Detailed Portfolio Balances
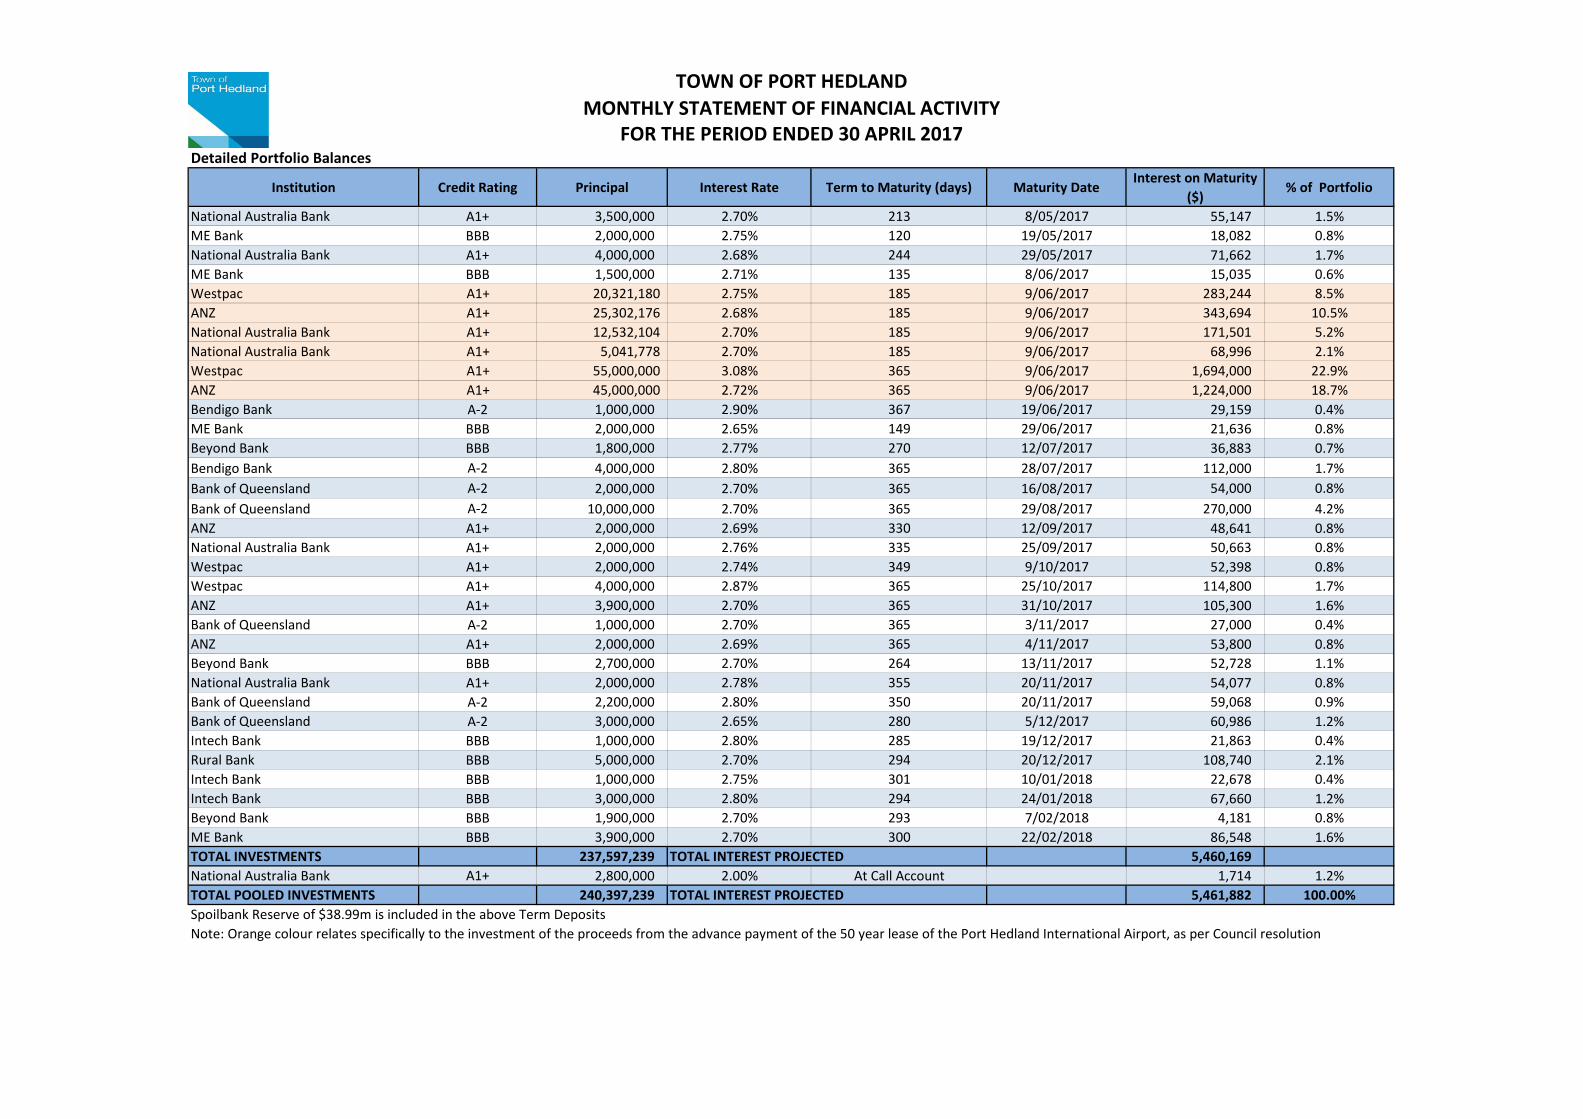
Institution Credit Rating Principal Interest Rate Term to Maturity (days) Maturity DateInterest on Maturity
($)% of Portfolio
National Australia Bank A1+ 3,500,000 2.70% 213 8/05/2017 55,147 1.5%ME Bank BBB 2,000,000 2.75% 120 19/05/2017 18,082 0.8%National Australia Bank A1+ 4,000,000 2.68% 244 29/05/2017 71,662 1.7%ME Bank BBB 1,500,000 2.71% 135 8/06/2017 15,035 0.6%Westpac A1+ 20,321,180 2.75% 185 9/06/2017 283,244 8.5%ANZ A1+ 25,302,176 2.68% 185 9/06/2017 343,694 10.5%National Australia Bank A1+ 12,532,104 2.70% 185 9/06/2017 171,501 5.2%National Australia Bank A1+ 5,041,778 2.70% 185 9/06/2017 68,996 2.1%Westpac A1+ 55,000,000 3.08% 365 9/06/2017 1,694,000 22.9%ANZ A1+ 45,000,000 2.72% 365 9/06/2017 1,224,000 18.7%Bendigo Bank A-2 1,000,000 2.90% 367 19/06/2017 29,159 0.4%ME Bank BBB 2,000,000 2.65% 149 29/06/2017 21,636 0.8%Beyond Bank BBB 1,800,000 2.77% 270 12/07/2017 36,883 0.7%Bendigo Bank A-2 4,000,000 2.80% 365 28/07/2017 112,000 1.7%Bank of Queensland A-2 2,000,000 2.70% 365 16/08/2017 54,000 0.8%Bank of Queensland A-2 10,000,000 2.70% 365 29/08/2017 270,000 4.2%ANZ A1+ 2,000,000 2.69% 330 12/09/2017 48,641 0.8%National Australia Bank A1+ 2,000,000 2.76% 335 25/09/2017 50,663 0.8%Westpac A1+ 2,000,000 2.74% 349 9/10/2017 52,398 0.8%Westpac A1+ 4,000,000 2.87% 365 25/10/2017 114,800 1.7%ANZ A1+ 3,900,000 2.70% 365 31/10/2017 105,300 1.6%Bank of Queensland A-2 1,000,000 2.70% 365 3/11/2017 27,000 0.4%ANZ A1+ 2,000,000 2.69% 365 4/11/2017 53,800 0.8%Beyond Bank BBB 2,700,000 2.70% 264 13/11/2017 52,728 1.1%National Australia Bank A1+ 2,000,000 2.78% 355 20/11/2017 54,077 0.8%Bank of Queensland A-2 2,200,000 2.80% 350 20/11/2017 59,068 0.9%Bank of Queensland A-2 3,000,000 2.65% 280 5/12/2017 60,986 1.2%Intech Bank BBB 1,000,000 2.80% 285 19/12/2017 21,863 0.4%Rural Bank BBB 5,000,000 2.70% 294 20/12/2017 108,740 2.1%Intech Bank BBB 1,000,000 2.75% 301 10/01/2018 22,678 0.4%Intech Bank BBB 3,000,000 2.80% 294 24/01/2018 67,660 1.2%Beyond Bank BBB 1,900,000 2.70% 293 7/02/2018 4,181 0.8%ME Bank BBB 3,900,000 2.70% 300 22/02/2018 86,548 1.6%TOTAL INVESTMENTS 237,597,239 TOTAL INTEREST PROJECTED 5,460,169National Australia Bank A1+ 2,800,000 2.00% At Call Account 1,714 1.2%TOTAL POOLED INVESTMENTS 240,397,239 TOTAL INTEREST PROJECTED 5,461,882 100.00%Spoilbank Reserve of $38.99m is included in the above Term DepositsNote: Orange colour relates specifically to the investment of the proceeds from the advance payment of the 50 year lease of the Port Hedland International Airport, as per Council resolution
`
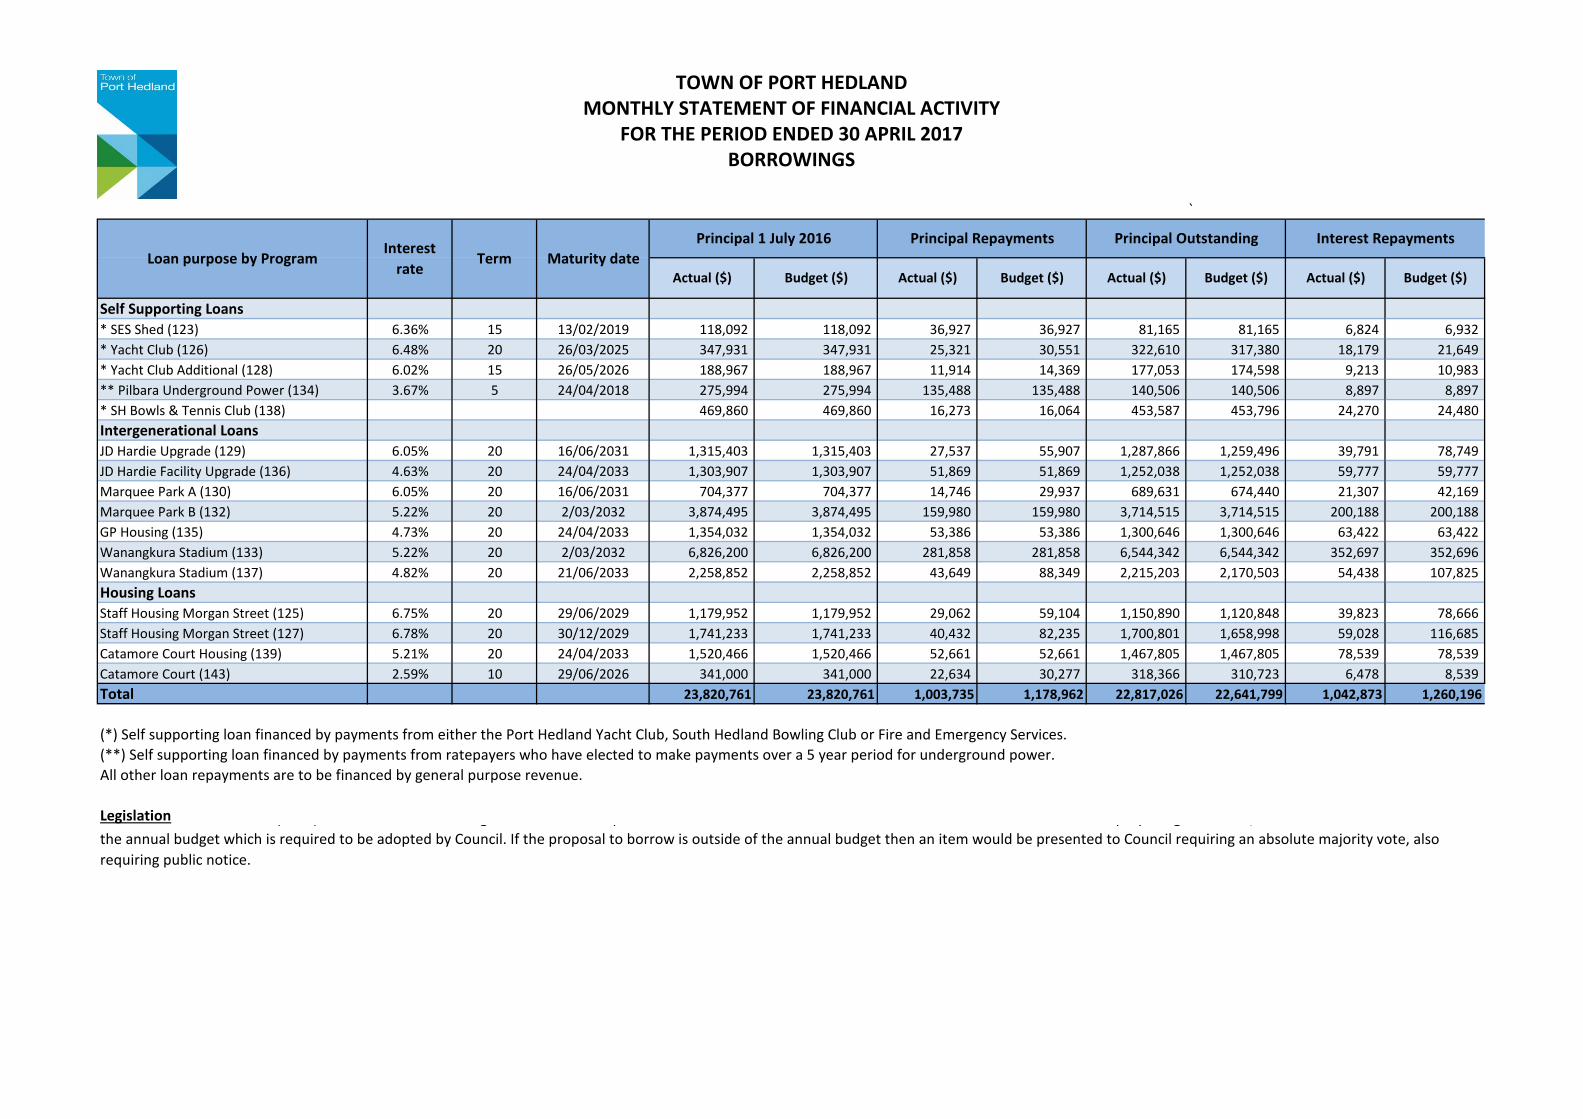
Self Supporting Loans* SES Shed (123) 6.36% 15 13/02/2019 118,092 118,092 36,927 36,927 81,165 81,165 6,824 6,932* Yacht Club (126) 6.48% 20 26/03/2025 347,931 347,931 25,321 30,551 322,610 317,380 18,179 21,649* Yacht Club Additional (128) 6.02% 15 26/05/2026 188,967 188,967 11,914 14,369 177,053 174,598 9,213 10,983** Pilbara Underground Power (134) 3.67% 5 24/04/2018 275,994 275,994 135,488 135,488 140,506 140,506 8,897 8,897* SH Bowls & Tennis Club (138) 469,860 469,860 16,273 16,064 453,587 453,796 24,270 24,480Intergenerational LoansJD Hardie Upgrade (129) 6.05% 20 16/06/2031 1,315,403 1,315,403 27,537 55,907 1,287,866 1,259,496 39,791 78,749JD Hardie Facility Upgrade (136) 4.63% 20 24/04/2033 1,303,907 1,303,907 51,869 51,869 1,252,038 1,252,038 59,777 59,777Marquee Park A (130) 6.05% 20 16/06/2031 704,377 704,377 14,746 29,937 689,631 674,440 21,307 42,169Marquee Park B (132) 5.22% 20 2/03/2032 3,874,495 3,874,495 159,980 159,980 3,714,515 3,714,515 200,188 200,188GP Housing (135) 4.73% 20 24/04/2033 1,354,032 1,354,032 53,386 53,386 1,300,646 1,300,646 63,422 63,422Wanangkura Stadium (133) 5.22% 20 2/03/2032 6,826,200 6,826,200 281,858 281,858 6,544,342 6,544,342 352,697 352,696Wanangkura Stadium (137) 4.82% 20 21/06/2033 2,258,852 2,258,852 43,649 88,349 2,215,203 2,170,503 54,438 107,825Housing LoansStaff Housing Morgan Street (125) 6.75% 20 29/06/2029 1,179,952 1,179,952 29,062 59,104 1,150,890 1,120,848 39,823 78,666Staff Housing Morgan Street (127) 6.78% 20 30/12/2029 1,741,233 1,741,233 40,432 82,235 1,700,801 1,658,998 59,028 116,685Catamore Court Housing (139) 5.21% 20 24/04/2033 1,520,466 1,520,466 52,661 52,661 1,467,805 1,467,805 78,539 78,539Catamore Court (143) 2.59% 10 29/06/2026 341,000 341,000 22,634 30,277 318,366 310,723 6,478 8,539Total 23,820,761 23,820,761 1,003,735 1,178,962 22,817,026 22,641,799 1,042,873 1,260,196
(*) Self supporting loan financed by payments from either the Port Hedland Yacht Club, South Hedland Bowling Club or Fire and Emergency Services.(**) Self supporting loan financed by payments from ratepayers who have elected to make payments over a 5 year period for underground power.All other loan repayments are to be financed by general purpose revenue.
Legislation ( ) g q p p g , the annual budget which is required to be adopted by Council. If the proposal to borrow is outside of the annual budget then an item would be presented to Council requiring an absolute majority vote, also requiring public notice.
TOWN OF PORT HEDLAND
BORROWINGS
Principal 1 July 2016 Interest RepaymentsPrincipal Outstanding
FOR THE PERIOD ENDED 30 APRIL 2017
Budget ($)Budget ($)
MONTHLY STATEMENT OF FINANCIAL ACTIVITY
Actual ($) Budget ($) Actual ($)Actual ($)
Principal RepaymentsLoan purpose by Program
Interest rate
Term Maturity dateBudget ($) Actual ($)
Budget Actual Budget Actual Budget Actual Budget Actual$000's $000's $000's $000's $000's $000's $000's $000's
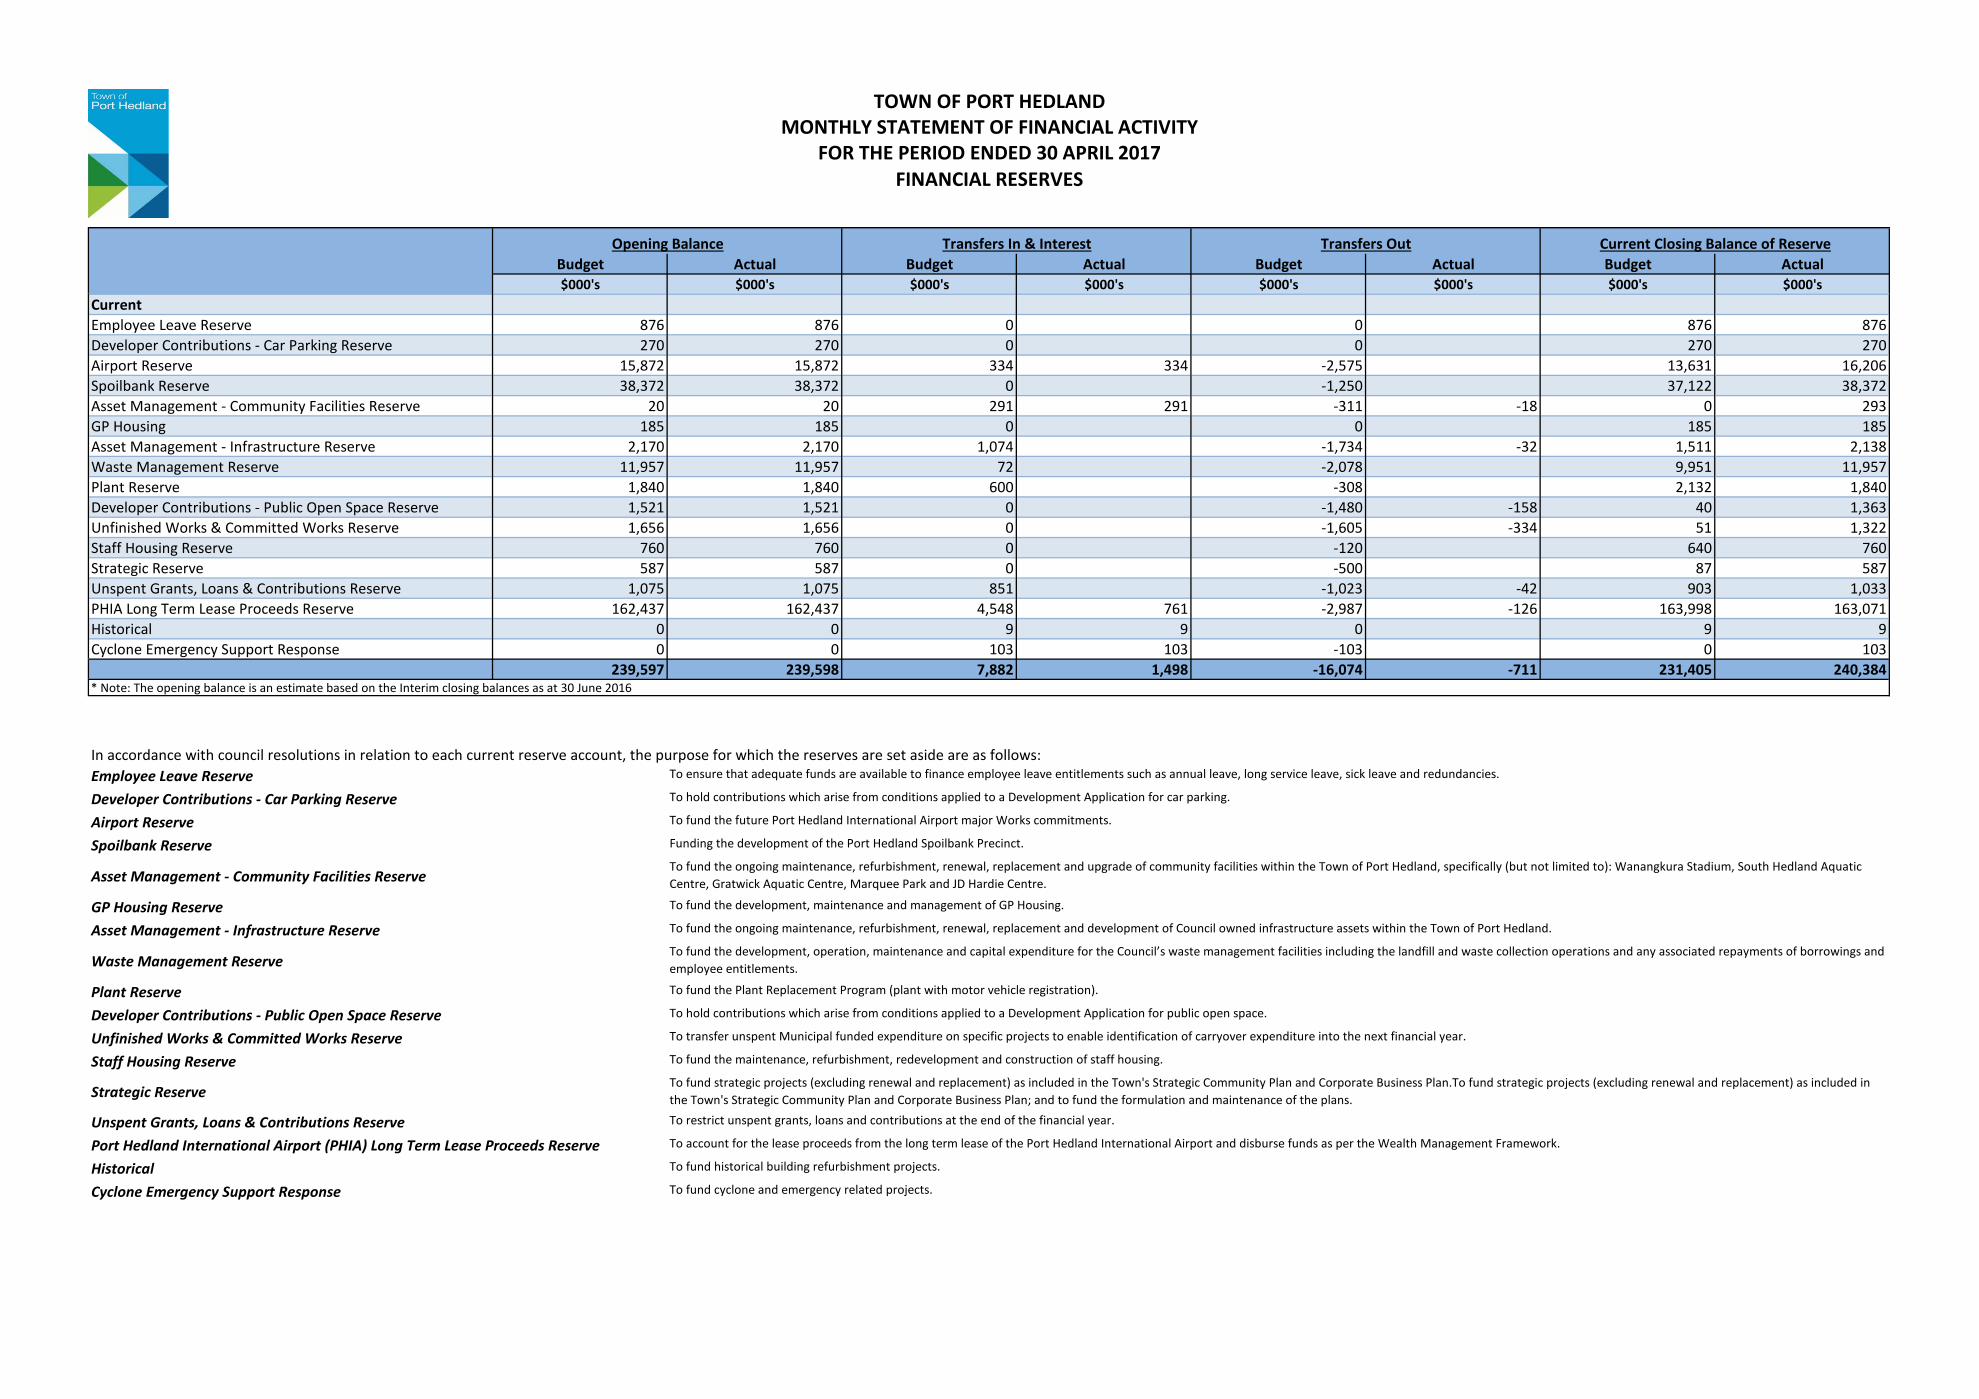
CurrentEmployee Leave Reserve 876 876 0 0 876 876Developer Contributions - Car Parking Reserve 270 270 0 0 270 270Airport Reserve 15,872 15,872 334 334 -2,575 13,631 16,206Spoilbank Reserve 38,372 38,372 0 -1,250 37,122 38,372Asset Management - Community Facilities Reserve 20 20 291 291 -311 -18 0 293GP Housing 185 185 0 0 185 185Asset Management - Infrastructure Reserve 2,170 2,170 1,074 -1,734 -32 1,511 2,138Waste Management Reserve 11,957 11,957 72 -2,078 9,951 11,957Plant Reserve 1,840 1,840 600 -308 2,132 1,840Developer Contributions - Public Open Space Reserve 1,521 1,521 0 -1,480 -158 40 1,363Unfinished Works & Committed Works Reserve 1,656 1,656 0 -1,605 -334 51 1,322Staff Housing Reserve 760 760 0 -120 640 760Strategic Reserve 587 587 0 -500 87 587Unspent Grants, Loans & Contributions Reserve 1,075 1,075 851 -1,023 -42 903 1,033PHIA Long Term Lease Proceeds Reserve 162,437 162,437 4,548 761 -2,987 -126 163,998 163,071Historical 0 0 9 9 0 9 9Cyclone Emergency Support Response 0 0 103 103 -103 0 103
239,597 239,598 7,882 1,498 -16,074 -711 231,405 240,384* Note: The opening balance is an estimate based on the Interim closing balances as at 30 June 2016
In accordance with council resolutions in relation to each current reserve account, the purpose for which the reserves are set aside are as follows:
GP Housing ReserveAsset Management - Infrastructure Reserve
Waste Management Reserve
Plant ReserveDeveloper Contributions - Public Open Space Reserve
Employee Leave ReserveDeveloper Contributions - Car Parking ReserveAirport Reserve Spoilbank Reserve
Asset Management - Community Facilities Reserve
To fund the development, maintenance and management of GP Housing.
To fund the ongoing maintenance, refurbishment, renewal, replacement and development of Council owned infrastructure assets within the Town of Port Hedland.
To fund the development, operation, maintenance and capital expenditure for the Council’s waste management facilities including the landfill and waste collection operations and any associated repayments of borrowings and employee entitlements.
To fund the Plant Replacement Program (plant with motor vehicle registration).
To hold contributions which arise from conditions applied to a Development Application for public open space.
To ensure that adequate funds are available to finance employee leave entitlements such as annual leave, long service leave, sick leave and redundancies.
To hold contributions which arise from conditions applied to a Development Application for car parking.
To fund the future Port Hedland International Airport major Works commitments.
Funding the development of the Port Hedland Spoilbank Precinct.
To fund the ongoing maintenance, refurbishment, renewal, replacement and upgrade of community facilities within the Town of Port Hedland, specifically (but not limited to): Wanangkura Stadium, South Hedland Aquatic Centre, Gratwick Aquatic Centre, Marquee Park and JD Hardie Centre.
TOWN OF PORT HEDLAND
FOR THE PERIOD ENDED 30 APRIL 2017MONTHLY STATEMENT OF FINANCIAL ACTIVITY
Opening Balance
FINANCIAL RESERVES
Current Closing Balance of ReserveTransfers OutTransfers In & Interest
To transfer unspent Municipal funded expenditure on specific projects to enable identification of carryover expenditure into the next financial year.
To fund the maintenance, refurbishment, redevelopment and construction of staff housing.
To fund strategic projects (excluding renewal and replacement) as included in the Town's Strategic Community Plan and Corporate Business Plan.To fund strategic projects (excluding renewal and replacement) as included in the Town's Strategic Community Plan and Corporate Business Plan; and to fund the formulation and maintenance of the plans.
Unfinished Works & Committed Works ReserveStaff Housing Reserve
Strategic Reserve
To restrict unspent grants, loans and contributions at the end of the financial year.
To account for the lease proceeds from the long term lease of the Port Hedland International Airport and disburse funds as per the Wealth Management Framework.
To fund historical building refurbishment projects.
To fund cyclone and emergency related projects.
Unspent Grants, Loans & Contributions ReservePort Hedland International Airport (PHIA) Long Term Lease Proceeds ReserveHistoricalCyclone Emergency Support Response
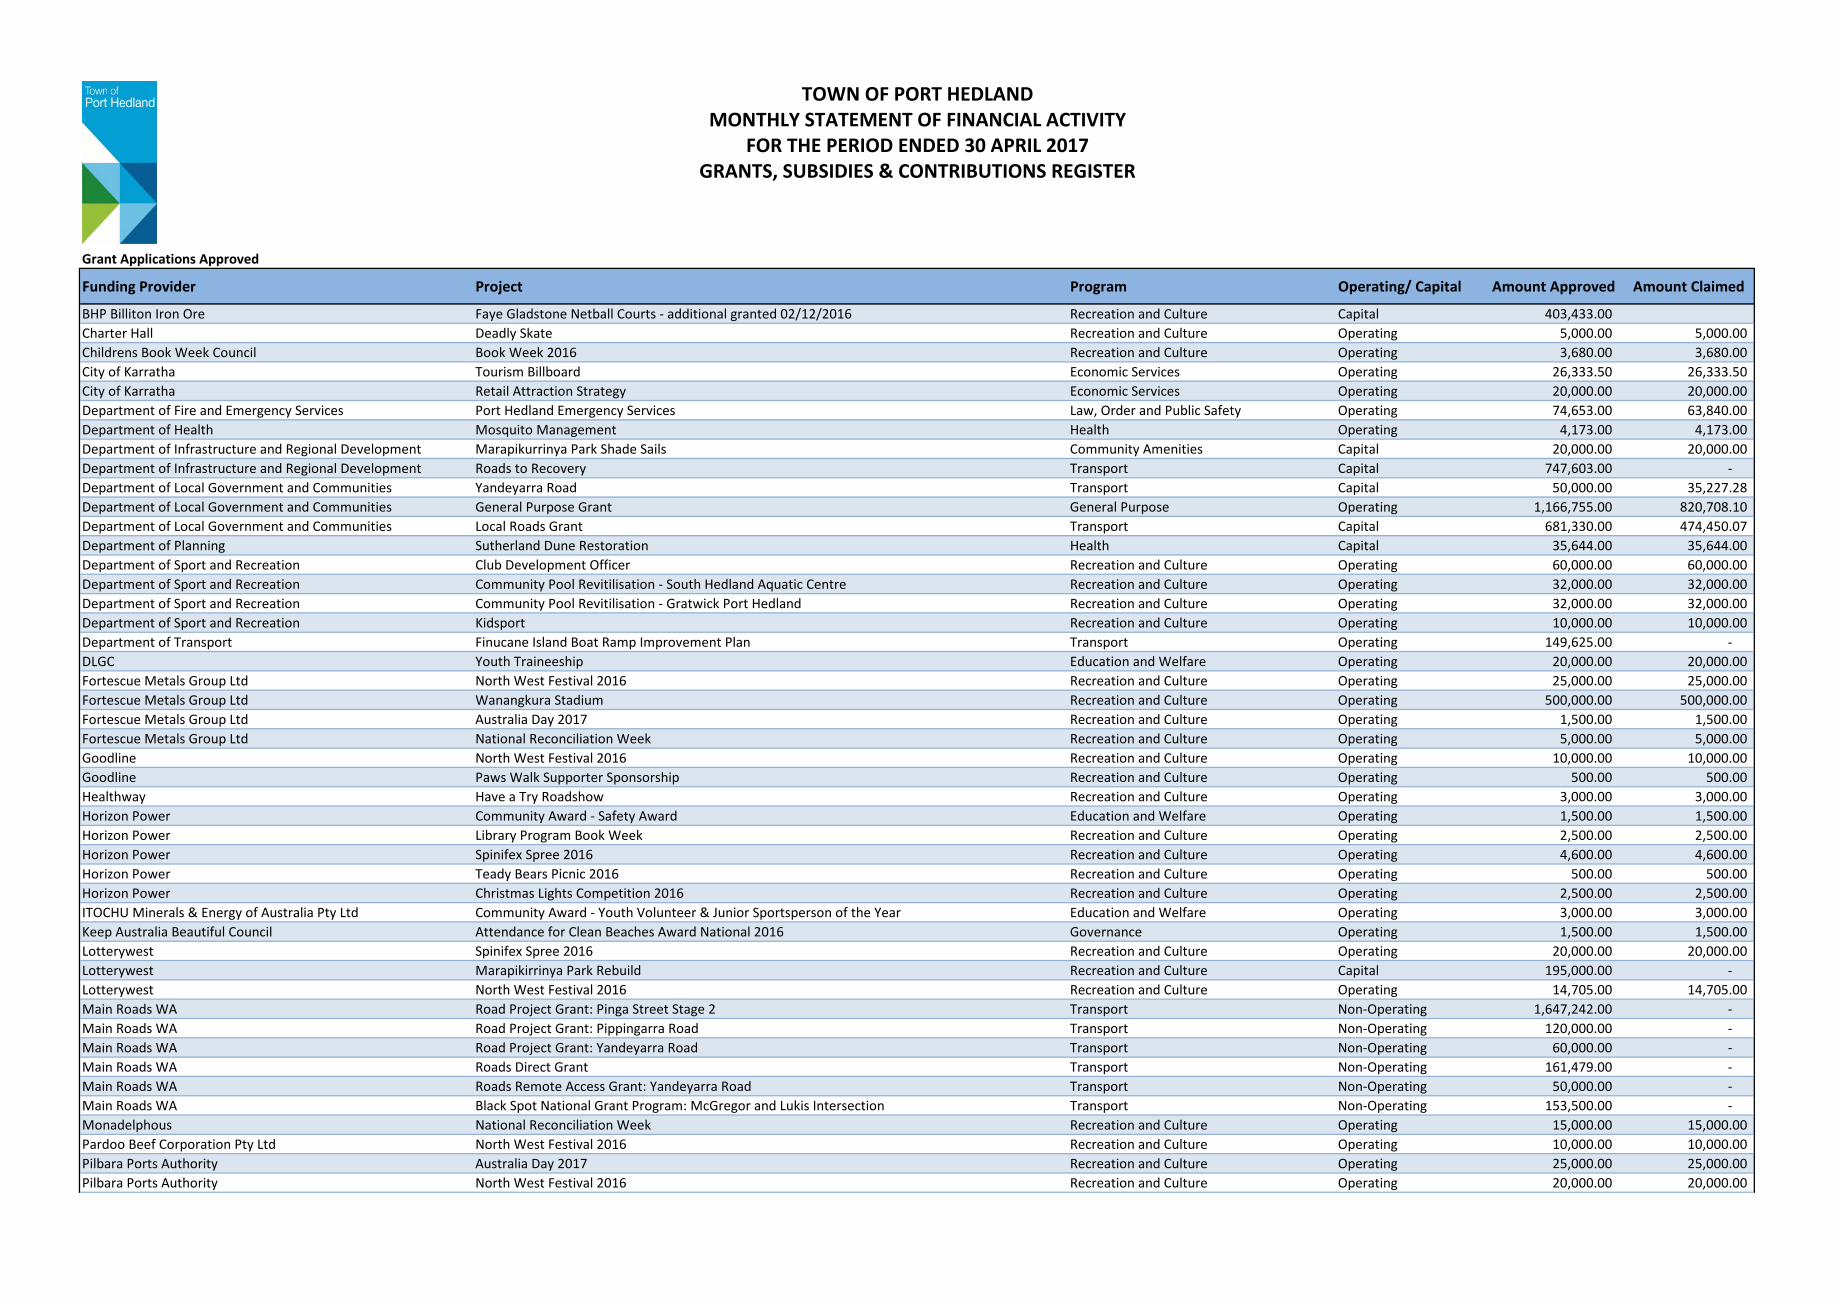
Grant Applications Approved
Funding Provider Project Program Operating/ Capital Amount Approved Amount Claimed
BHP Billiton Iron Ore Faye Gladstone Netball Courts - additional granted 02/12/2016 Recreation and Culture Capital 403,433.00 Charter Hall Deadly Skate Recreation and Culture Operating 5,000.00 5,000.00 Childrens Book Week Council Book Week 2016 Recreation and Culture Operating 3,680.00 3,680.00 City of Karratha Tourism Billboard Economic Services Operating 26,333.50 26,333.50 City of Karratha Retail Attraction Strategy Economic Services Operating 20,000.00 20,000.00 Department of Fire and Emergency Services Port Hedland Emergency Services Law, Order and Public Safety Operating 74,653.00 63,840.00 Department of Health Mosquito Management Health Operating 4,173.00 4,173.00 Department of Infrastructure and Regional Development Marapikurrinya Park Shade Sails Community Amenities Capital 20,000.00 20,000.00 Department of Infrastructure and Regional Development Roads to Recovery Transport Capital 747,603.00 - Department of Local Government and Communities Yandeyarra Road Transport Capital 50,000.00 35,227.28 Department of Local Government and Communities General Purpose Grant General Purpose Operating 1,166,755.00 820,708.10 Department of Local Government and Communities Local Roads Grant Transport Capital 681,330.00 474,450.07 Department of Planning Sutherland Dune Restoration Health Capital 35,644.00 35,644.00 Department of Sport and Recreation Club Development Officer Recreation and Culture Operating 60,000.00 60,000.00 Department of Sport and Recreation Community Pool Revitilisation - South Hedland Aquatic Centre Recreation and Culture Operating 32,000.00 32,000.00 Department of Sport and Recreation Community Pool Revitilisation - Gratwick Port Hedland Recreation and Culture Operating 32,000.00 32,000.00 Department of Sport and Recreation Kidsport Recreation and Culture Operating 10,000.00 10,000.00 Department of Transport Finucane Island Boat Ramp Improvement Plan Transport Operating 149,625.00 - DLGC Youth Traineeship Education and Welfare Operating 20,000.00 20,000.00 Fortescue Metals Group Ltd North West Festival 2016 Recreation and Culture Operating 25,000.00 25,000.00 Fortescue Metals Group Ltd Wanangkura Stadium Recreation and Culture Operating 500,000.00 500,000.00 Fortescue Metals Group Ltd Australia Day 2017 Recreation and Culture Operating 1,500.00 1,500.00 Fortescue Metals Group Ltd National Reconciliation Week Recreation and Culture Operating 5,000.00 5,000.00 Goodline North West Festival 2016 Recreation and Culture Operating 10,000.00 10,000.00 Goodline Paws Walk Supporter Sponsorship Recreation and Culture Operating 500.00 500.00 Healthway Have a Try Roadshow Recreation and Culture Operating 3,000.00 3,000.00 Horizon Power Community Award - Safety Award Education and Welfare Operating 1,500.00 1,500.00 Horizon Power Library Program Book Week Recreation and Culture Operating 2,500.00 2,500.00 Horizon Power Spinifex Spree 2016 Recreation and Culture Operating 4,600.00 4,600.00 Horizon Power Teady Bears Picnic 2016 Recreation and Culture Operating 500.00 500.00 Horizon Power Christmas Lights Competition 2016 Recreation and Culture Operating 2,500.00 2,500.00 ITOCHU Minerals & Energy of Australia Pty Ltd Community Award - Youth Volunteer & Junior Sportsperson of the Year Education and Welfare Operating 3,000.00 3,000.00 Keep Australia Beautiful Council Attendance for Clean Beaches Award National 2016 Governance Operating 1,500.00 1,500.00 Lotterywest Spinifex Spree 2016 Recreation and Culture Operating 20,000.00 20,000.00 Lotterywest Marapikirrinya Park Rebuild Recreation and Culture Capital 195,000.00 - Lotterywest North West Festival 2016 Recreation and Culture Operating 14,705.00 14,705.00 Main Roads WA Road Project Grant: Pinga Street Stage 2 Transport Non-Operating 1,647,242.00 - Main Roads WA Road Project Grant: Pippingarra Road Transport Non-Operating 120,000.00 - Main Roads WA Road Project Grant: Yandeyarra Road Transport Non-Operating 60,000.00 - Main Roads WA Roads Direct Grant Transport Non-Operating 161,479.00 - Main Roads WA Roads Remote Access Grant: Yandeyarra Road Transport Non-Operating 50,000.00 - Main Roads WA Black Spot National Grant Program: McGregor and Lukis Intersection Transport Non-Operating 153,500.00 - Monadelphous National Reconciliation Week Recreation and Culture Operating 15,000.00 15,000.00 Pardoo Beef Corporation Pty Ltd North West Festival 2016 Recreation and Culture Operating 10,000.00 10,000.00 Pilbara Ports Authority Australia Day 2017 Recreation and Culture Operating 25,000.00 25,000.00 Pilbara Ports Authority North West Festival 2016 Recreation and Culture Operating 20,000.00 20,000.00
TOWN OF PORT HEDLANDMONTHLY STATEMENT OF FINANCIAL ACTIVITY
FOR THE PERIOD ENDED 30 APRIL 2017GRANTS, SUBSIDIES & CONTRIBUTIONS REGISTER
TOWN OF PORT HEDLANDMONTHLY STATEMENT OF FINANCIAL ACTIVITY
FOR THE PERIOD ENDED 30 APRIL 2017GRANTS, SUBSIDIES & CONTRIBUTIONS REGISTER
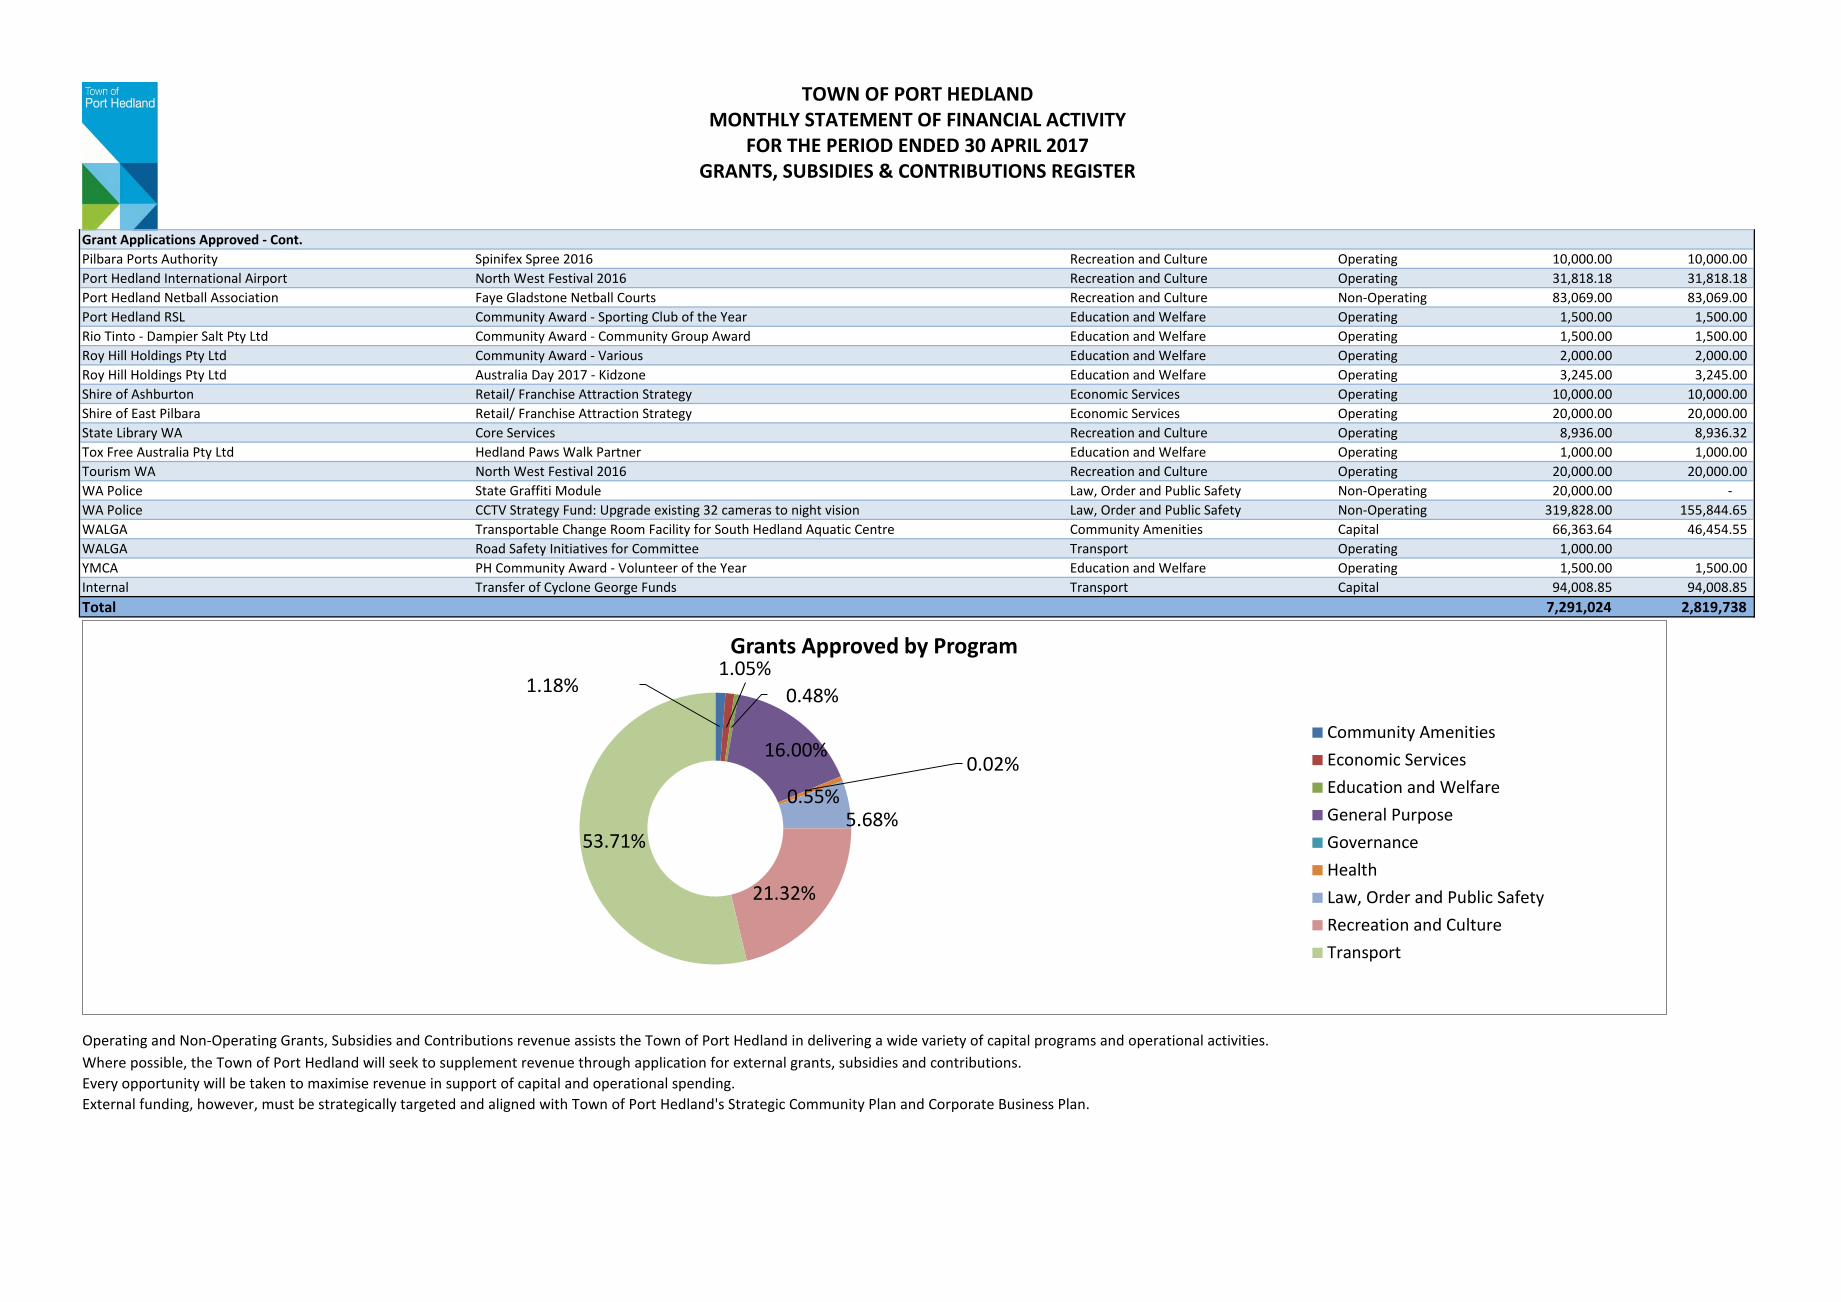
Grant Applications Approved - Cont.Pilbara Ports Authority Spinifex Spree 2016 Recreation and Culture Operating 10,000.00 10,000.00 Port Hedland International Airport North West Festival 2016 Recreation and Culture Operating 31,818.18 31,818.18 Port Hedland Netball Association Faye Gladstone Netball Courts Recreation and Culture Non-Operating 83,069.00 83,069.00 Port Hedland RSL Community Award - Sporting Club of the Year Education and Welfare Operating 1,500.00 1,500.00 Rio Tinto - Dampier Salt Pty Ltd Community Award - Community Group Award Education and Welfare Operating 1,500.00 1,500.00 Roy Hill Holdings Pty Ltd Community Award - Various Education and Welfare Operating 2,000.00 2,000.00 Roy Hill Holdings Pty Ltd Australia Day 2017 - Kidzone Education and Welfare Operating 3,245.00 3,245.00 Shire of Ashburton Retail/ Franchise Attraction Strategy Economic Services Operating 10,000.00 10,000.00 Shire of East Pilbara Retail/ Franchise Attraction Strategy Economic Services Operating 20,000.00 20,000.00 State Library WA Core Services Recreation and Culture Operating 8,936.00 8,936.32 Tox Free Australia Pty Ltd Hedland Paws Walk Partner Education and Welfare Operating 1,000.00 1,000.00 Tourism WA North West Festival 2016 Recreation and Culture Operating 20,000.00 20,000.00 WA Police State Graffiti Module Law, Order and Public Safety Non-Operating 20,000.00 - WA Police CCTV Strategy Fund: Upgrade existing 32 cameras to night vision Law, Order and Public Safety Non-Operating 319,828.00 155,844.65 WALGA Transportable Change Room Facility for South Hedland Aquatic Centre Community Amenities Capital 66,363.64 46,454.55 WALGA Road Safety Initiatives for Committee Transport Operating 1,000.00 YMCA PH Community Award - Volunteer of the Year Education and Welfare Operating 1,500.00 1,500.00 Internal Transfer of Cyclone George Funds Transport Capital 94,008.85 94,008.85 Total 7,291,024 2,819,738
Where possible, the Town of Port Hedland will seek to supplement revenue through application for external grants, subsidies and contributions. Every opportunity will be taken to maximise revenue in support of capital and operational spending.External funding, however, must be strategically targeted and aligned with Town of Port Hedland's Strategic Community Plan and Corporate Business Plan.
Operating and Non-Operating Grants, Subsidies and Contributions revenue assists the Town of Port Hedland in delivering a wide variety of capital programs and operational activities.
1.18%1.05%
0.48%
16.00%0.02%
0.55%5.68%
21.32%
53.71%
Grants Approved by Program
Community AmenitiesEconomic ServicesEducation and WelfareGeneral PurposeGovernanceHealthLaw, Order and Public SafetyRecreation and CultureTransport
TOWN OF PORT HEDLANDMONTHLY STATEMENT OF FINANCIAL ACTIVITY
FOR THE PERIOD ENDED 30 APRIL 2017GRANTS, SUBSIDIES & CONTRIBUTIONS REGISTER
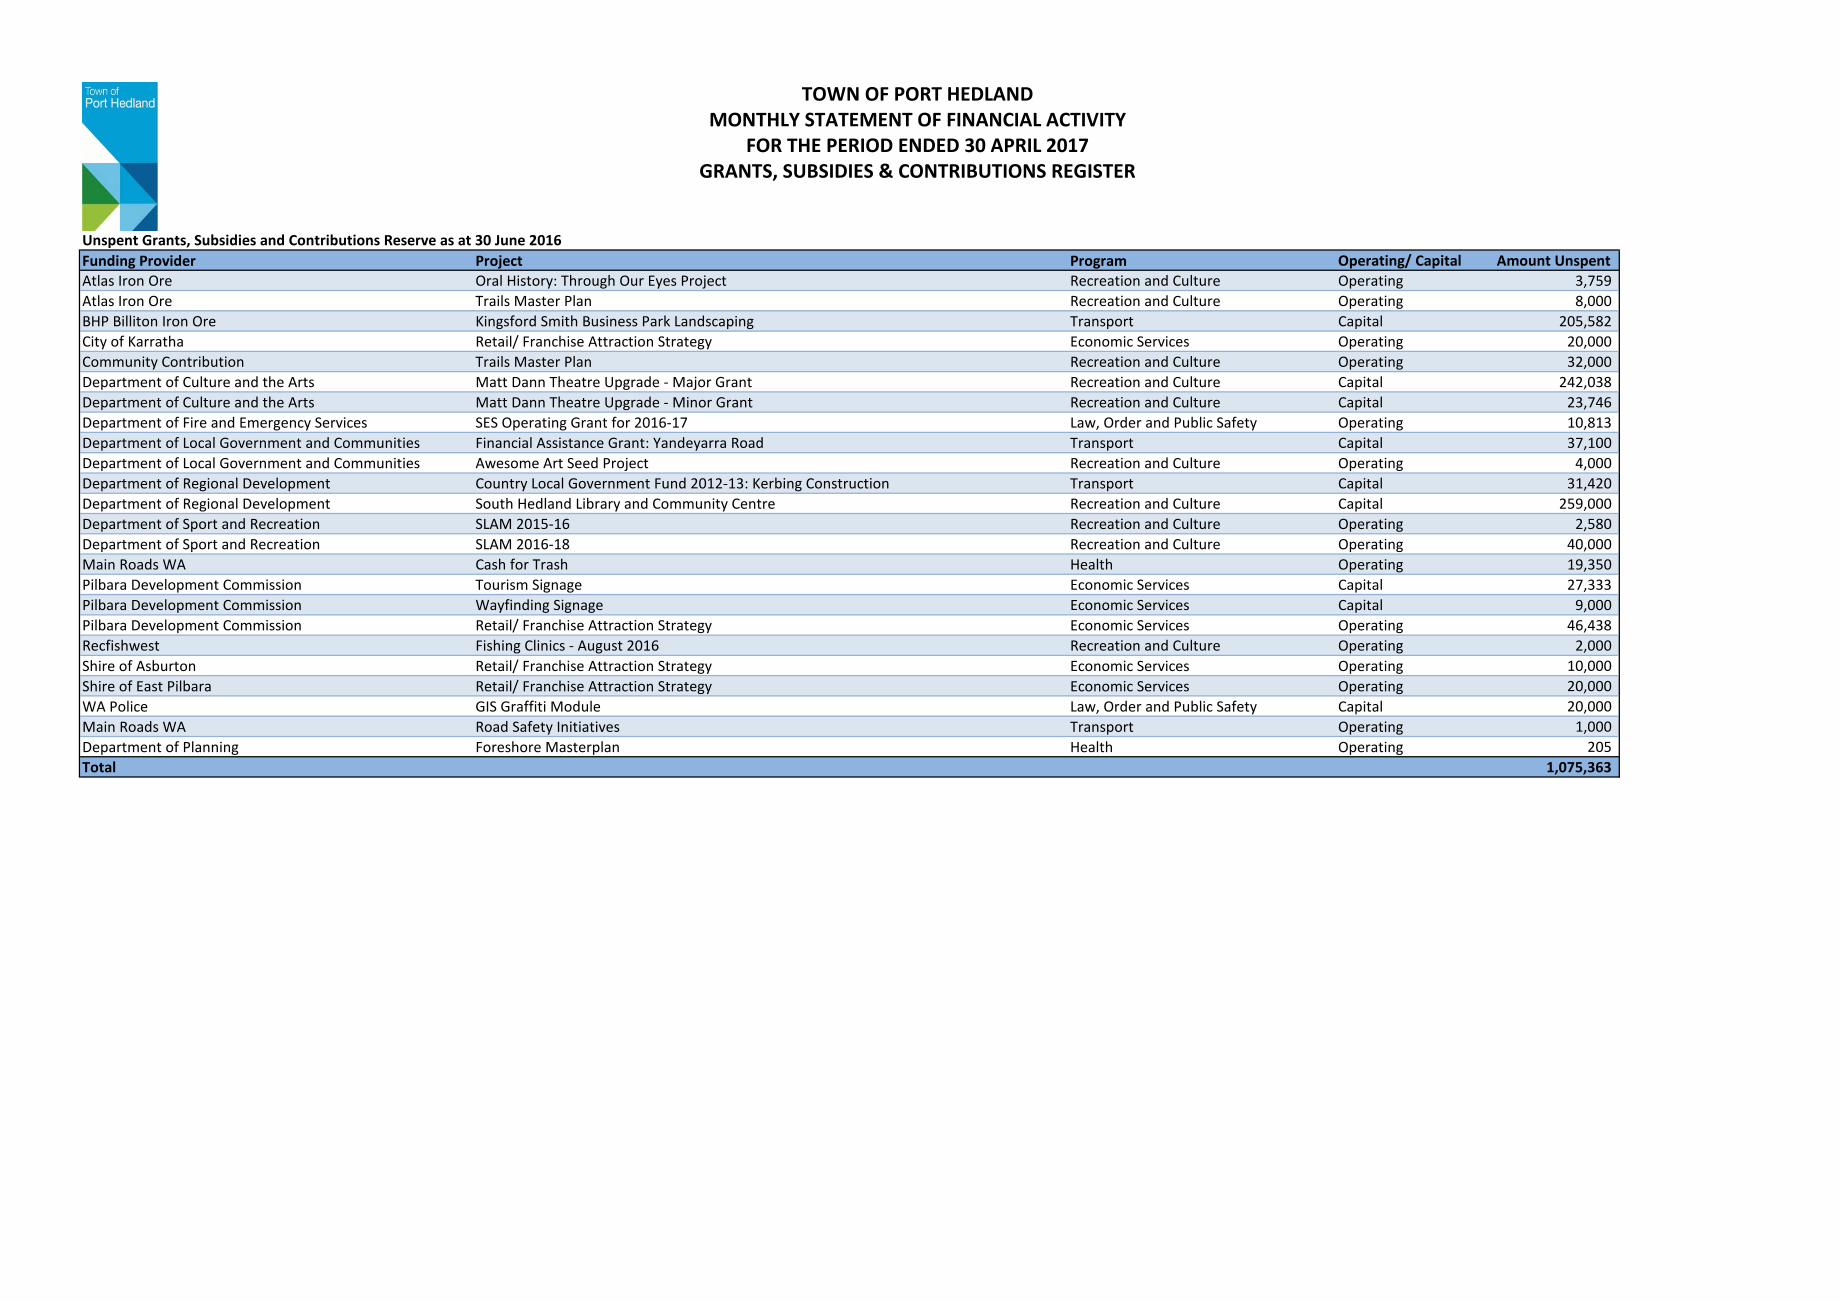
Unspent Grants, Subsidies and Contributions Reserve as at 30 June 2016Funding Provider Project Program Operating/ Capital Amount Unspent Atlas Iron Ore Oral History: Through Our Eyes Project Recreation and Culture Operating 3,759 Atlas Iron Ore Trails Master Plan Recreation and Culture Operating 8,000 BHP Billiton Iron Ore Kingsford Smith Business Park Landscaping Transport Capital 205,582 City of Karratha Retail/ Franchise Attraction Strategy Economic Services Operating 20,000 Community Contribution Trails Master Plan Recreation and Culture Operating 32,000 Department of Culture and the Arts Matt Dann Theatre Upgrade - Major Grant Recreation and Culture Capital 242,038 Department of Culture and the Arts Matt Dann Theatre Upgrade - Minor Grant Recreation and Culture Capital 23,746 Department of Fire and Emergency Services SES Operating Grant for 2016-17 Law, Order and Public Safety Operating 10,813 Department of Local Government and Communities Financial Assistance Grant: Yandeyarra Road Transport Capital 37,100 Department of Local Government and Communities Awesome Art Seed Project Recreation and Culture Operating 4,000 Department of Regional Development Country Local Government Fund 2012-13: Kerbing Construction Transport Capital 31,420 Department of Regional Development South Hedland Library and Community Centre Recreation and Culture Capital 259,000 Department of Sport and Recreation SLAM 2015-16 Recreation and Culture Operating 2,580 Department of Sport and Recreation SLAM 2016-18 Recreation and Culture Operating 40,000 Main Roads WA Cash for Trash Health Operating 19,350 Pilbara Development Commission Tourism Signage Economic Services Capital 27,333 Pilbara Development Commission Wayfinding Signage Economic Services Capital 9,000 Pilbara Development Commission Retail/ Franchise Attraction Strategy Economic Services Operating 46,438 Recfishwest Fishing Clinics - August 2016 Recreation and Culture Operating 2,000 Shire of Asburton Retail/ Franchise Attraction Strategy Economic Services Operating 10,000 Shire of East Pilbara Retail/ Franchise Attraction Strategy Economic Services Operating 20,000 WA Police GIS Graffiti Module Law, Order and Public Safety Capital 20,000 Main Roads WA Road Safety Initiatives Transport Operating 1,000 Department of Planning Foreshore Masterplan Health Operating 205 Total 1,075,363

TOWN OF PORT HEDLANDMONTHLY STATEMENT OF FINANCIAL ACTIVITY
FOR THE PERIOD ENDED 30 APRIL 2017GRANTS, SUBSIDIES & CONTRIBUTIONS REGISTER
Grant Applications Submitted (1 July 2016 to 30 June 2017)Funding Provider Project Program Operating/ Capital Status Amount Applied
Children's Week WA Children's Week Recreation & Culture Operating Declined 1,839 Children's Book Council of Australia Children's Book Week Recreation & Culture Operating Pending 3,000 Department of Environmental Regulation Community & Industry Engagement Program - Tip Shop & Transfer Station Economic Services Capital Declined 574,917 Department of Fire & Emergency Services LGGS Health Capital & Operating Pending 71,486 Deparment of Local Government & Communities Senior's Morning Tea Recreation & Culture Operating Declined 1,000 Department of Infrastructure and Regional Development Heavy Vehicle Safety and Productivity Programme - Round 5 - Pinga Street Stage 2 Transport Capital Declined 1,464,000
Department of Infrastructure and Regional DevelopmentHeavy Vehicle Safety and Productivity Programme - Round 5 - Wedgefield Industrial Precinct Transport Capital Declined 2,306,540
Department of Local Government & Communities Country Local Government Fund - Youth Development Traineeship Program Governance Operating Part Declined 48,273 Department of Planning Coastwest Grants - Goode St Foreshore - Seawall works Economic Services Capital Pending 100,000 Department of Sport and Recreation Club Development Officer - 1 July 2017-30 June 2020 Recreation & Culture Operating Pending 163,636 Festivals Australia Program North West Festival 2017 Recreation & Culture Operating Pending 100,000 FMG Spinifex Spree 2017 Recreation & Culture Operating Pending 5,000 Lotterywest Spinifex Spree and North West Festival 2017 Recreation & Culture Operating Pending 32,602 Main Roads WA Black Spot National Grant Program: Murdoch and Brolga Way Intersection Transport Capital Pending 205,500 Main Roads WA Black Spot National Grant Program: Murdoch Drive and Masters Way Intersection Transport Capital Pending 205,500 Grant Applications Submitted (1 July 2016 to 30 June 2017)Department of Transport Goode Street Foreshore Erosion Economic Services Capital Pending 300,000 Main Roads WA Blackspot State Grant Program: Styles Road Transport Capital Pending 113,334 Main Roads WA Blackspot State Grant Program: Styles Road Roundabout Transport Capital Pending 409,389 Main Roads WA Blackspot State Grant Program: Sutherland Street Transport Capital Pending 127,000 Pilbara Development Commission Coastal Hazard Risk Management Plant Economic Services Operating Declined 250,000 Rio Tinto North West Festival 2017 Recreation & Culture Operating Pending 25,000 Total 6,508,016
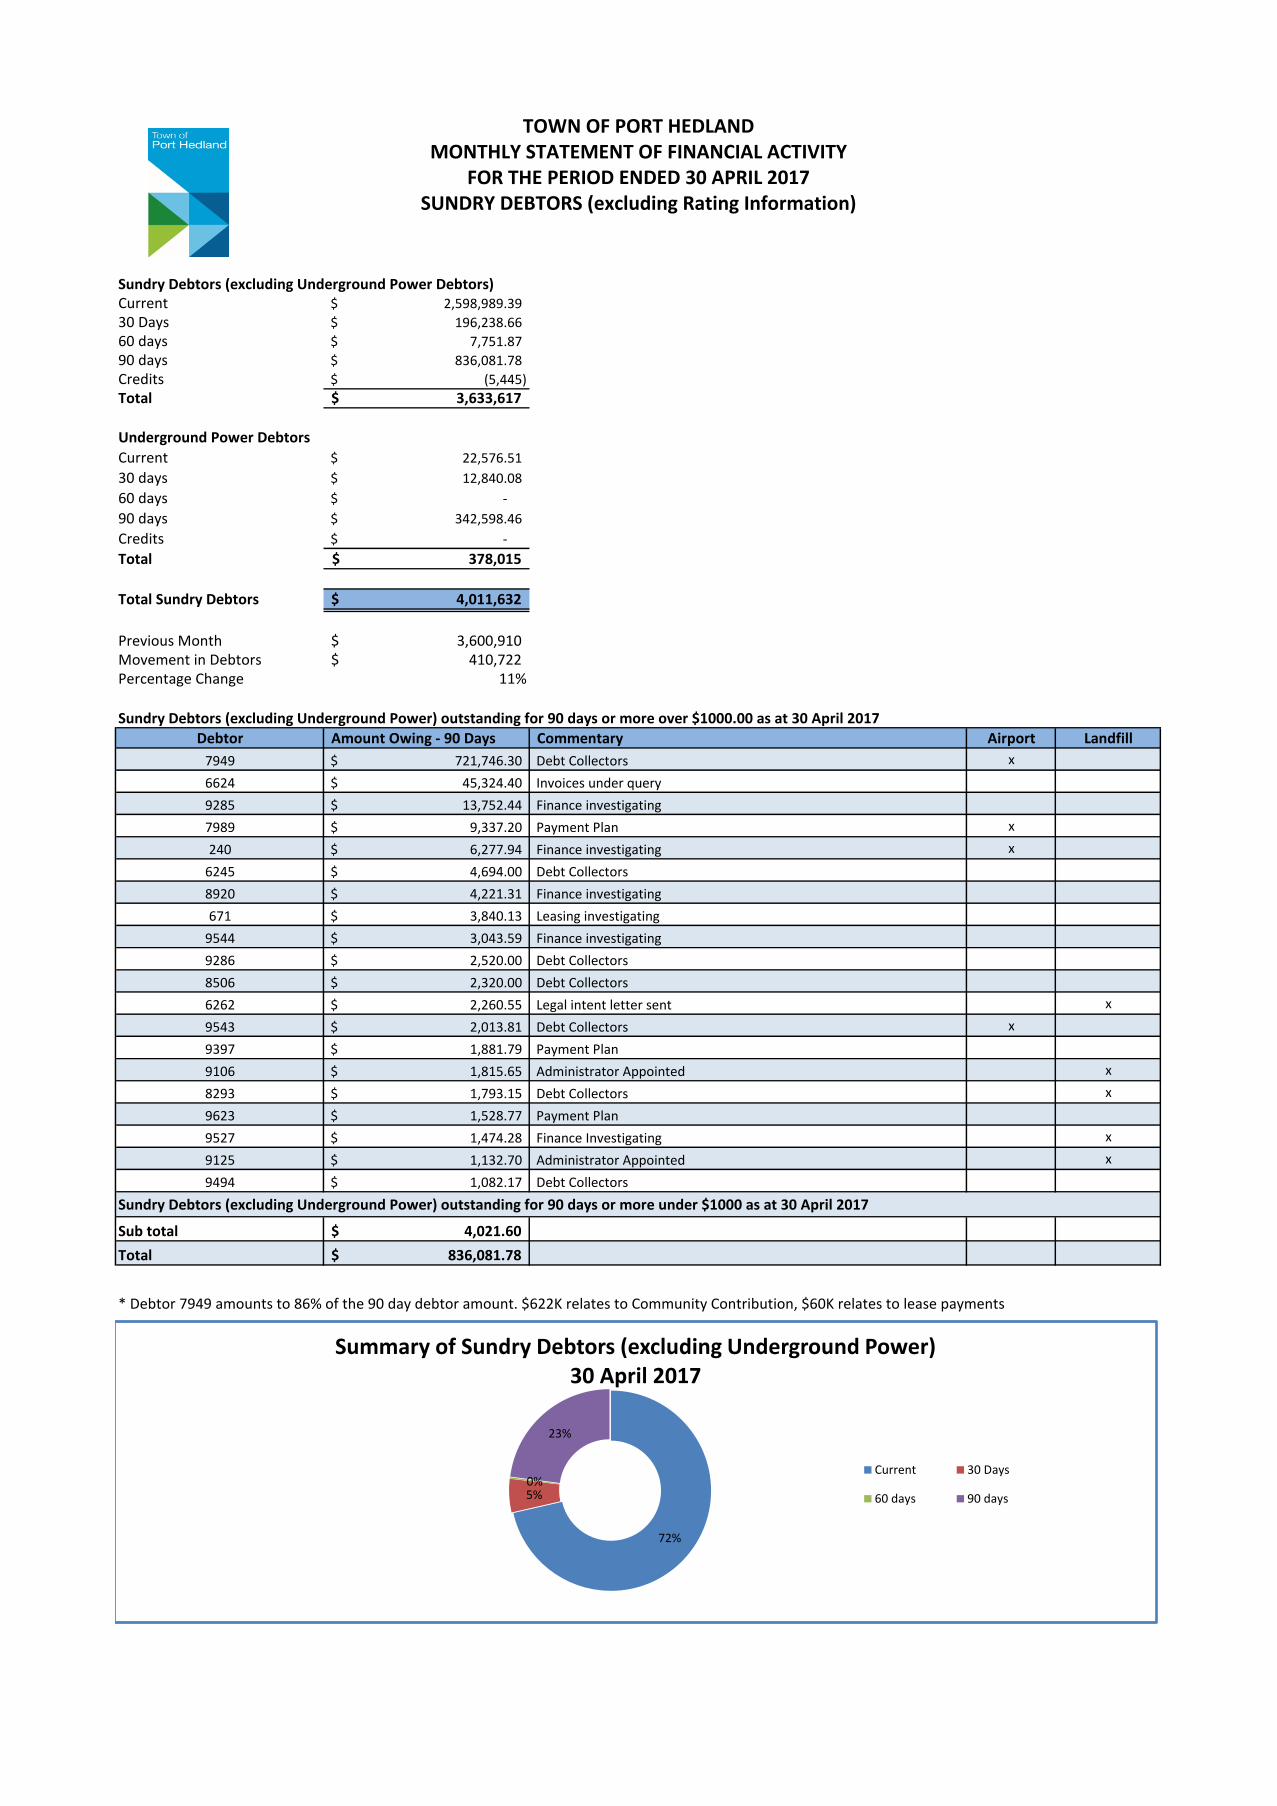
Sundry Debtors (excluding Underground Power Debtors)Current 2,598,989.39$
30 Days 196,238.66$
60 days 7,751.87$
90 days 836,081.78$
Credits (5,445)$
Total 3,633,617$
Underground Power Debtors
Current 22,576.51$
30 days 12,840.08$
60 days -$
90 days 342,598.46$
Credits -$
Total 378,015$
Total Sundry Debtors 4,011,632$
Previous Month 3,600,910$ Movement in Debtors 410,722$ Percentage Change 11%
Debtor Amount Owing - 90 Days Commentary Airport Landfill
7949 721,746.30$ Debt Collectors x
6624 45,324.40$ Invoices under query
9285 13,752.44$ Finance investigating
7989 9,337.20$ Payment Plan x
240 6,277.94$ Finance investigating x
6245 4,694.00$ Debt Collectors
8920 4,221.31$ Finance investigating
671 3,840.13$ Leasing investigating
9544 3,043.59$ Finance investigating
9286 2,520.00$ Debt Collectors
8506 2,320.00$ Debt Collectors
6262 2,260.55$ Legal intent letter sent x
9543 2,013.81$ Debt Collectors x
9397 1,881.79$ Payment Plan
9106 1,815.65$ Administrator Appointed x
8293 1,793.15$ Debt Collectors x
9623 1,528.77$ Payment Plan
9527 1,474.28$ Finance Investigating x
9125 1,132.70$ Administrator Appointed x
9494 1,082.17$ Debt Collectors
Sundry Debtors (excluding Underground Power) outstanding for 90 days or more under $1000 as at 30 April 2017
Sub total 4,021.60$
Total 836,081.78$
* Debtor 7949 amounts to 86% of the 90 day debtor amount. $622K relates to Community Contribution, $60K relates to lease payments
TOWN OF PORT HEDLANDMONTHLY STATEMENT OF FINANCIAL ACTIVITY
FOR THE PERIOD ENDED 30 APRIL 2017SUNDRY DEBTORS (excluding Rating Information)
Sundry Debtors (excluding Underground Power) outstanding for 90 days or more over $1000.00 as at 30 April 2017
72%
5%0%
23%
Summary of Sundry Debtors (excluding Underground Power) 30 April 2017
Current 30 Days
60 days 90 days
TOWN OF PORT HEDLANDMONTHLY STATEMENT OF FINANCIAL ACTIVITY
FOR THE PERIOD ENDED 30 APRIL 2017SUNDRY DEBTORS (excluding Rating Information)
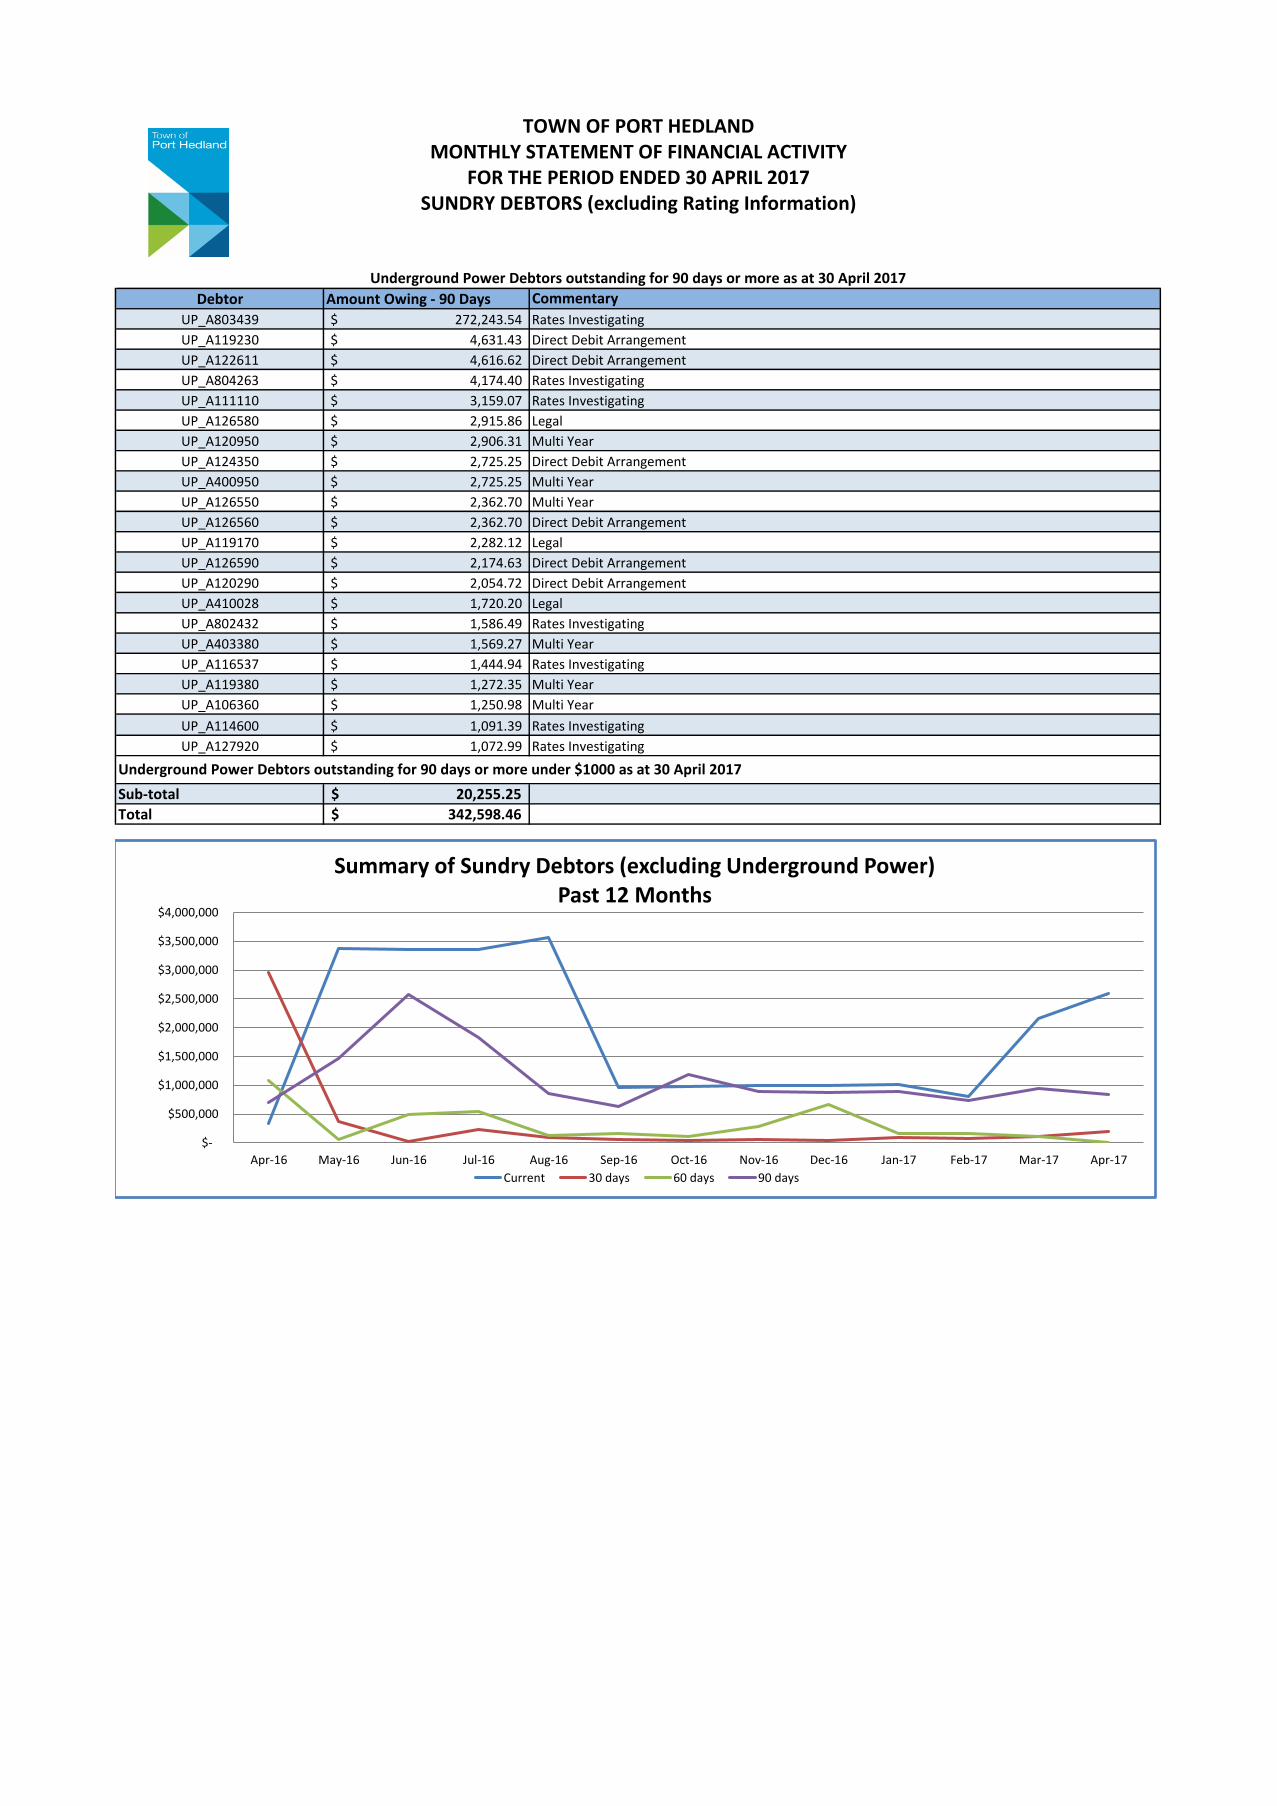
Debtor Amount Owing - 90 Days
UP_A803439 272,243.54$
UP_A119230 4,631.43$
UP_A122611 4,616.62$
UP_A804263 4,174.40$
UP_A111110 3,159.07$
UP_A126580 2,915.86$
UP_A120950 2,906.31$
UP_A124350 2,725.25$
UP_A400950 2,725.25$
UP_A126550 2,362.70$
UP_A126560 2,362.70$
UP_A119170 2,282.12$
UP_A126590 2,174.63$
UP_A120290 2,054.72$
UP_A410028 1,720.20$
UP_A802432 1,586.49$
UP_A403380 1,569.27$
UP_A116537 1,444.94$
UP_A119380 1,272.35$
UP_A106360 1,250.98$
UP_A114600 1,091.39$
UP_A127920 1,072.99$
Sub-total 20,255.25$
Total 342,598.46$
Underground Power Debtors outstanding for 90 days or more under $1000 as at 30 April 2017
Rates Investigating
Direct Debit Arrangement
Legal
Direct Debit Arrangement
Direct Debit Arrangement
Legal
Rates Investigating
Multi Year
Rates Investigating
Multi Year
Multi Year
Rates Investigating
Multi Year
Underground Power Debtors outstanding for 90 days or more as at 30 April 2017
Commentary
Rates Investigating
Direct Debit Arrangement
Direct Debit Arrangement
Rates Investigating
Rates Investigating
Legal
Multi Year
Direct Debit Arrangement
Multi Year
$-
$500,000
$1,000,000
$1,500,000
$2,000,000
$2,500,000
$3,000,000
$3,500,000
$4,000,000
Apr-16 May-16 Jun-16 Jul-16 Aug-16 Sep-16 Oct-16 Nov-16 Dec-16 Jan-17 Feb-17 Mar-17 Apr-17
Summary of Sundry Debtors (excluding Underground Power)Past 12 Months
Current 30 days 60 days 90 days
Capital ProjectAsset
ClassAsset Classification Budget 2016/17 Current Budget
Total YTD Actuals
(Excluding Orders)Municipal Funded Reserve Funded Sale of Assets
Grants, Subsidies &
Contributions
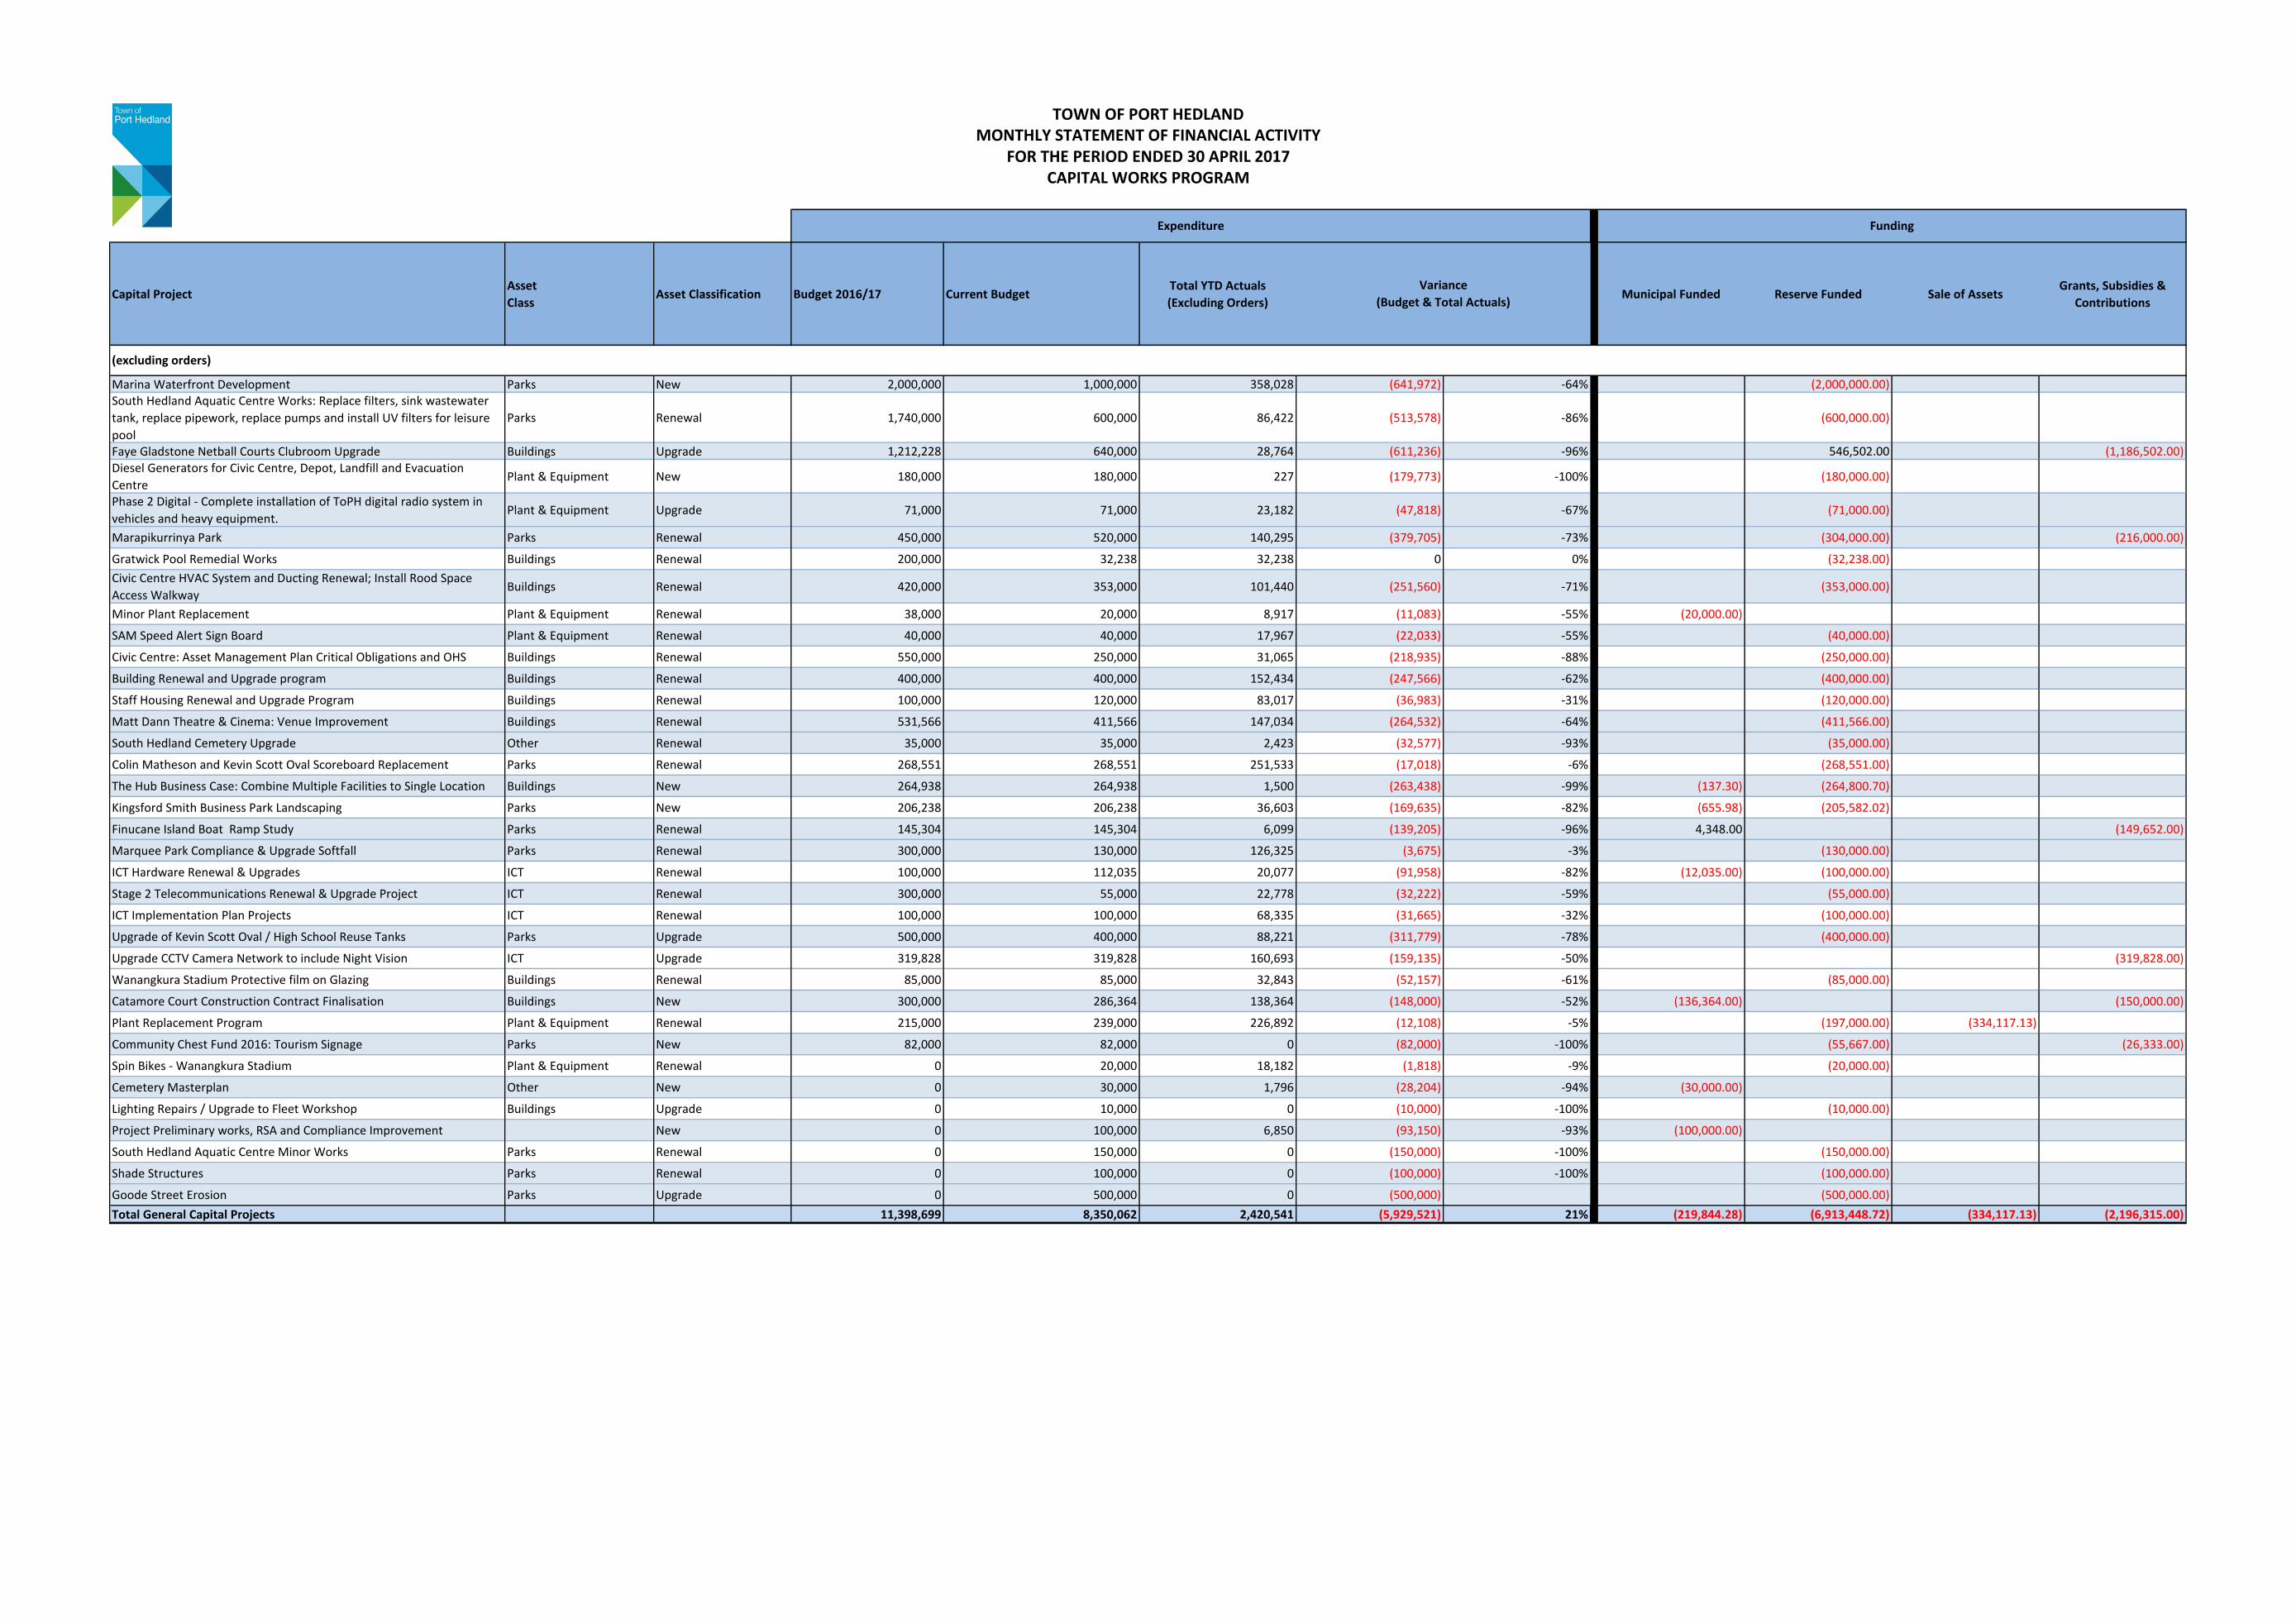
Marina Waterfront Development Parks New 2,000,000 1,000,000 358,028 (641,972) -64% (2,000,000.00)South Hedland Aquatic Centre Works: Replace filters, sink wastewater
tank, replace pipework, replace pumps and install UV filters for leisure
pool
Parks Renewal 1,740,000 600,000 86,422 (513,578) -86% (600,000.00)
Faye Gladstone Netball Courts Clubroom Upgrade Buildings Upgrade 1,212,228 640,000 28,764 (611,236) -96% 546,502.00 (1,186,502.00)
Diesel Generators for Civic Centre, Depot, Landfill and Evacuation
CentrePlant & Equipment New 180,000 180,000 227 (179,773) -100% (180,000.00)
Phase 2 Digital - Complete installation of ToPH digital radio system in
vehicles and heavy equipment.Plant & Equipment Upgrade 71,000 71,000 23,182 (47,818) -67% (71,000.00)
Marapikurrinya Park Parks Renewal 450,000 520,000 140,295 (379,705) -73% (304,000.00) (216,000.00)
Gratwick Pool Remedial Works Buildings Renewal 200,000 32,238 32,238 0 0% (32,238.00)
Civic Centre HVAC System and Ducting Renewal; Install Rood Space
Access WalkwayBuildings Renewal 420,000 353,000 101,440 (251,560) -71% (353,000.00)
Minor Plant Replacement Plant & Equipment Renewal 38,000 20,000 8,917 (11,083) -55% (20,000.00)
SAM Speed Alert Sign Board Plant & Equipment Renewal 40,000 40,000 17,967 (22,033) -55% (40,000.00)
Civic Centre: Asset Management Plan Critical Obligations and OHS Buildings Renewal 550,000 250,000 31,065 (218,935) -88% (250,000.00)
Building Renewal and Upgrade program Buildings Renewal 400,000 400,000 152,434 (247,566) -62% (400,000.00)
Staff Housing Renewal and Upgrade Program Buildings Renewal 100,000 120,000 83,017 (36,983) -31% (120,000.00)
Matt Dann Theatre & Cinema: Venue Improvement Buildings Renewal 531,566 411,566 147,034 (264,532) -64% (411,566.00)
South Hedland Cemetery Upgrade Other Renewal 35,000 35,000 2,423 (32,577) -93% (35,000.00)
Colin Matheson and Kevin Scott Oval Scoreboard Replacement Parks Renewal 268,551 268,551 251,533 (17,018) -6% (268,551.00)
The Hub Business Case: Combine Multiple Facilities to Single Location Buildings New 264,938 264,938 1,500 (263,438) -99% (137.30) (264,800.70)
Kingsford Smith Business Park Landscaping Parks New 206,238 206,238 36,603 (169,635) -82% (655.98) (205,582.02)
Finucane Island Boat Ramp Study Parks Renewal 145,304 145,304 6,099 (139,205) -96% 4,348.00 (149,652.00)
Marquee Park Compliance & Upgrade Softfall Parks Renewal 300,000 130,000 126,325 (3,675) -3% (130,000.00)
ICT Hardware Renewal & Upgrades ICT Renewal 100,000 112,035 20,077 (91,958) -82% (12,035.00) (100,000.00)
Stage 2 Telecommunications Renewal & Upgrade Project ICT Renewal 300,000 55,000 22,778 (32,222) -59% (55,000.00)
ICT Implementation Plan Projects ICT Renewal 100,000 100,000 68,335 (31,665) -32% (100,000.00)
Upgrade of Kevin Scott Oval / High School Reuse Tanks Parks Upgrade 500,000 400,000 88,221 (311,779) -78% (400,000.00)
Upgrade CCTV Camera Network to include Night Vision ICT Upgrade 319,828 319,828 160,693 (159,135) -50% (319,828.00)
Wanangkura Stadium Protective film on Glazing Buildings Renewal 85,000 85,000 32,843 (52,157) -61% (85,000.00)
Catamore Court Construction Contract Finalisation Buildings New 300,000 286,364 138,364 (148,000) -52% (136,364.00) (150,000.00)
Plant Replacement Program Plant & Equipment Renewal 215,000 239,000 226,892 (12,108) -5% (197,000.00) (334,117.13)
Community Chest Fund 2016: Tourism Signage Parks New 82,000 82,000 0 (82,000) -100% (55,667.00) (26,333.00)
Spin Bikes - Wanangkura Stadium Plant & Equipment Renewal 0 20,000 18,182 (1,818) -9% (20,000.00)
Cemetery Masterplan Other New 0 30,000 1,796 (28,204) -94% (30,000.00)
Lighting Repairs / Upgrade to Fleet Workshop Buildings Upgrade 0 10,000 0 (10,000) -100% (10,000.00)
Project Preliminary works, RSA and Compliance Improvement New 0 100,000 6,850 (93,150) -93% (100,000.00)
South Hedland Aquatic Centre Minor Works Parks Renewal 0 150,000 0 (150,000) -100% (150,000.00)
Shade Structures Parks Renewal 0 100,000 0 (100,000) -100% (100,000.00)
Goode Street Erosion Parks Upgrade 0 500,000 0 (500,000) (500,000.00)
Total General Capital Projects 11,398,699 8,350,062 2,420,541 (5,929,521) 21% (219,844.28) (6,913,448.72) (334,117.13) (2,196,315.00)
Variance
(Budget & Total Actuals)
(excluding orders)
TOWN OF PORT HEDLANDMONTHLY STATEMENT OF FINANCIAL ACTIVITY
FOR THE PERIOD ENDED 30 APRIL 2017CAPITAL WORKS PROGRAM
Expenditure Funding

Capital ProjectAsset
ClassAsset Classification Budget 2016/17 Current Budget
Total YTD Actuals
(Excluding Orders)Municipal Funded Reserve Funded Sale of Assets
Grants, Subsidies &
Contributions
Variance
(Budget & Total Actuals)
TOWN OF PORT HEDLANDMONTHLY STATEMENT OF FINANCIAL ACTIVITY
FOR THE PERIOD ENDED 30 APRIL 2017CAPITAL WORKS PROGRAM
Expenditure Funding
Pinga Street - Rehabilitation of Existing Pavement Roads Renewal 2,470,863 2,155,801 719,651 (1,436,150) -58% 0.00 (718,744.45) (1,437,057.00)
Road Reseal Program Roads Renewal 1,250,000 1,129,140 419,234 (709,906) -57% (381,537.00) (747,603.00)
McGregor, Athol, Cooke Point Roundabout Rehabilitation Roads Renewal 500,000 300,000 36,908 (263,092) -53% (300,000.00) 0.00
Wise Terrace Roads Upgrade 135,000 135,000 123,863 (11,137) -8% (135,000.00)
Yandeyarra Road Roads Renewal 197,100 456,265 294,817 (161,448) -82% (59,165.00) (37,100.00) (360,000.00)
Pippingarra Road Resheeting Roads Renewal 180,000 5,835 835 (5,000) -3% (5,835.00) 0.00
South Hedland Town Centre Stage 2 Landscaping Roads Upgrade 1,206,400 1,206,400 990,980 (215,420) -18% (1,206,400.00)
Wedgefield Road & Drainage Strategy Drainage Upgrade 57,863 29,442 29,442 0 0% (29,442.00)
Drainage Construction Wanangkura Stadium & Faye Gladstone Netball
CourtsDrainage Upgrade 437,085 437,085 22,548 (414,537) -95% (437,085.00)
Rebuild Flood Pumps Stage 1 Plant & Equipment Renewal 10,000 10,000 8,728 (1,272) -13% (10,000.00)
Unsealed Road Resheeting Program Roads Renewal 250,000 250,000 1,782 (248,218) -99% (250,000.00)
Kennedy St / Parker St Intersection Drainage Upgrade 280,000 140,000 72,531 (67,469) -24% (140,000.00)
Footpath Construction Roads Upgrade 58,000 58,000 2,654 (55,346) -95% (58,000.00) 0.00
Styles Road Roundabout (Design) Roads Upgrade 65,000 65,000 30,800 (34,200) -53% (65,000.00)
Total Road Program 7,665,026 6,415,683 2,792,488 3,623,195 36% (198,000.00) (3,673,023.45) 0.00 (2,544,660.00)
Transfer Station Capital Works and 20kL Landfill Fuel Tank; Drainage for
Minor Capital Works, Tip Shop and Transfer StationLandfill New 710,715 300,000 99,767 (610,948) -86% (300,000.00)
Septage Pond Remedial Works Landfill Upgrade 70,990 70,990 0 (70,990) -100% (70,990.00)
South Hedland Water Treatment Plant Landfill Upgrade 1,056,594 1,056,594 654,255 (402,339) -38% (1,056,594.00)
Windblown Litter Solution Landfill New 158,933 158,933 135,760 (23,173) -15% (158,933.00)
ICT Hardware Landfill ICT New 59,921 59,921 869 (59,052) -99% (59,921.00)
Central Control Irrigation Waste Water System Parks New 431,106 431,106 377,400 (53,706) -12% (431,106.00)
Total Waste Projects 2,488,259 2,077,544 1,268,052 (1,220,207) 51% 0.00 (2,077,544.00) 0.00 0.00
TOTAL Capital Works Program 21,551,984 16,843,289 6,481,081 (3,526,532) 30% (417,844.28) (12,664,016.17) (334,117.13) (4,740,975.00)
ROAD PROGRAM
WASTE PROJECTS

Roads Program Capital ExpenditureCurrent Budget
2016/17Total YTD
ActualsFederal
Roads to Recovery
Federal Indigenous Access Road Grant
(Financial Assistance Grant)
Federal Indigenous Access Road Grant
Carry Forward
(Unspent Grants Reserve)
Regional Road Group Program Funding Remote
Access Roads
Regional Road Group Program Funding Road Project Grants
Country Local Government Fund
(Unspent Grants Reserve)
CARRY FORWARD / Unfinished
Works & Committed Works
Reserve
Asset Management
Reserve
PHIA Lease Proceeds Reserve
Developer Contribution
ReserveMunicipal
Other Grant Income
Pinga Street - Rehabilitation of Existing Pavement
2,155,801 719,651 (1,437,057) (80,000) (638,744)
Pinga Street and Cajarina Road Drainage Works
0 0
South Hedland Aquatic Centre Car Park 0 0
Road Reseal Program 1,129,140 419,234 (747,603) (381,537)
McGregor, Athol, Cooke Point Roundabout Rehabilitation
300,000 36,908 (300,000)
Wise Terrace 135,000 123,863 (31,420) (103,580)
Yandeyarra Road 456,265 294,817 (200,000) (50,000) (37,100) (50,000) (60,000) (59,165)
Pippingarra Road Resheeting 5,835 835 (5,835)
South Hedland Town Centre Stage 2 Landscaping
1,206,400 990,980 (1,206,400)
Wedgefield Road & Drainage Strategy 29,442 29,443 (29,442)
Shoata Road (Design) 37,715 37,715 (37,715)
Drainage Construction Wanangkura Stadium & Faye Gladstone Netball Courts
437,085 22,548 (140,186) (296,899)
Rebuild Flood Pumps Stage 1 10,000 8,728 (10,000)
Unsealed Road Resheeting Program 250,000 1,782 (250,000)
Kennedy St / Parker St Intersection 140,000 72,531 (140,000)
Footpath Construction 58,000 2,654 (58,000) (62,726)
Styles Road Roundabout (Design)* 65,000 30,800 (65,000)
TOTAL Expenditure 6,415,683 2,792,488 (947,603) (50,000) (37,100) (50,000) (1,497,057) (31,420) (287,343) (103,580) (2,007,180) (1,206,400) (198,000) (62,726)
TOWN OF PORT HEDLANDMONTHLY STATEMENT OF FINANCIAL ACTIVITY
FOR THE PERIOD ENDED 30 APRIL 2017
FEDERAL FUNDING SOURCESEXPENDITURE STATE FUNDING SOURCES INTERNAL FUNDING SOURCES
ROAD PROGRAM
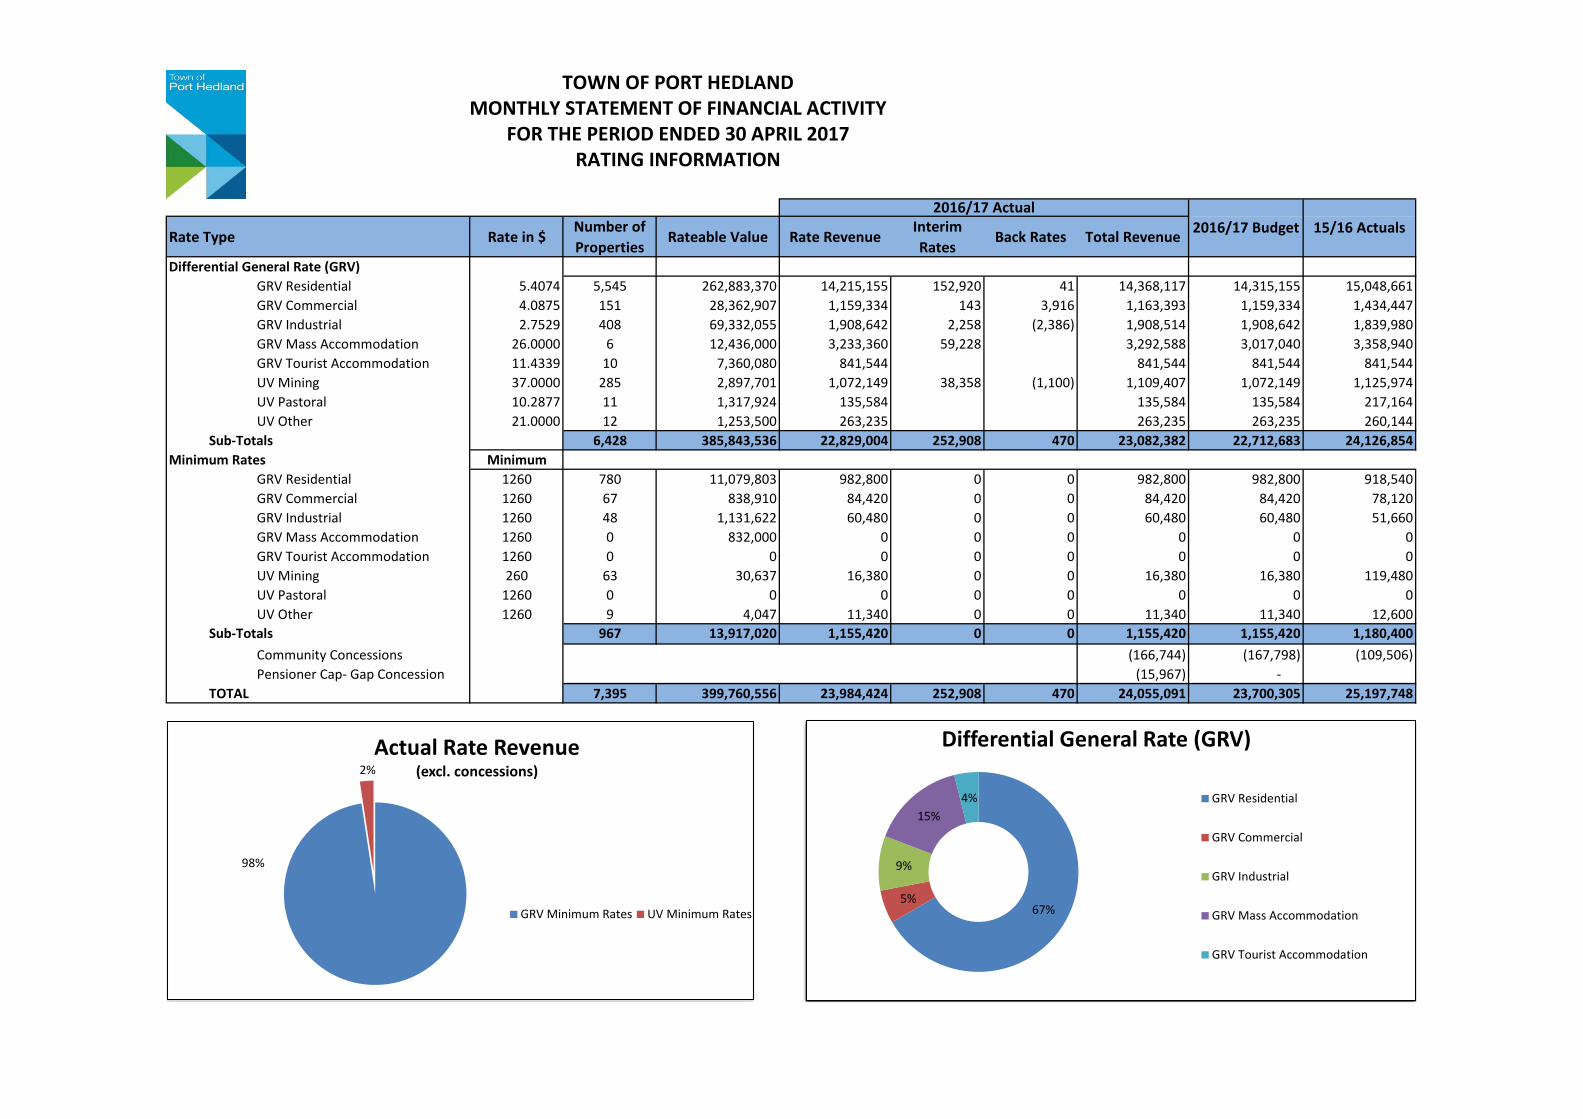
Rate Type Rate in $Number of Properties
Rateable Value Rate RevenueInterim Rates
Back Rates Total Revenue
Differential General Rate (GRV)GRV Residential 5.4074 5,545 262,883,370 14,215,155 152,920 41 14,368,117 14,315,155 15,048,661GRV Commercial 4.0875 151 28,362,907 1,159,334 143 3,916 1,163,393 1,159,334 1,434,447GRV Industrial 2.7529 408 69,332,055 1,908,642 2,258 (2,386) 1,908,514 1,908,642 1,839,980GRV Mass Accommodation 26.0000 6 12,436,000 3,233,360 59,228 3,292,588 3,017,040 3,358,940GRV Tourist Accommodation 11.4339 10 7,360,080 841,544 841,544 841,544 841,544UV Mining 37.0000 285 2,897,701 1,072,149 38,358 (1,100) 1,109,407 1,072,149 1,125,974UV Pastoral 10.2877 11 1,317,924 135,584 135,584 135,584 217,164UV Other 21.0000 12 1,253,500 263,235 263,235 263,235 260,144
Sub-Totals 6,428 385,843,536 22,829,004 252,908 470 23,082,382 22,712,683 24,126,854Minimum Rates Minimum
GRV Residential 1260 780 11,079,803 982,800 0 0 982,800 982,800 918,540GRV Commercial 1260 67 838,910 84,420 0 0 84,420 84,420 78,120GRV Industrial 1260 48 1,131,622 60,480 0 0 60,480 60,480 51,660GRV Mass Accommodation 1260 0 832,000 0 0 0 0 0 0GRV Tourist Accommodation 1260 0 0 0 0 0 0 0 0UV Mining 260 63 30,637 16,380 0 0 16,380 16,380 119,480UV Pastoral 1260 0 0 0 0 0 0 0 0UV Other 1260 9 4,047 11,340 0 0 11,340 11,340 12,600
Sub-Totals 967 13,917,020 1,155,420 0 0 1,155,420 1,155,420 1,180,400Community Concessions (166,744) (167,798) (109,506) Pensioner Cap- Gap Concession (15,967) -
TOTAL 7,395 399,760,556 23,984,424 252,908 470 24,055,091 23,700,305 25,197,748
2016/17 Budget 15/16 Actuals
TOWN OF PORT HEDLANDMONTHLY STATEMENT OF FINANCIAL ACTIVITY
FOR THE PERIOD ENDED 30 APRIL 2017RATING INFORMATION
2016/17 Actual
98%
2%Actual Rate Revenue
(excl. concessions)
GRV Minimum Rates UV Minimum Rates 67%5%
9%
15%4%
Differential General Rate (GRV)
GRV Residential
GRV Commercial
GRV Industrial
GRV Mass Accommodation
GRV Tourist Accommodation


![TOWN OF PORT HEDLAND ORDINARY COUNCIL · PDF fileOver the last 12 months I have had troubles with my Councillor emails and I ... Minolta] Port Hedland, WA JH Computers $101,728 Hardware](https://img.pdfslide.us/doc/110x75/5aba09c17f8b9ad13d8e5e55/town-of-port-hedland-ordinary-council-the-last-12-months-i-have-had-troubles.jpg)