Embed Size (px)
Citation preview

TOWN OF ORWELLVISION FOR THE FUTURE
Adopted by Town BoardFebruary 13, 2001
2
SUMMARY
The Town of Orwell Vision for the Future identifies goals, objectives andstrategies for the immediate and long range protection, enhancement anddevelopment of the Town’s resources. Written by the Planning Board, withinput from the Town Board, the Vision for the Future attempts to translate thecomments received from a 199x survey of the town’s citizens into a sharedvision for Orwell’s future.
The Vision for the Future is intended to help the Town prioritize decisions andinvestments, secure grant and loan funding, and negotiate with public agenciesinterested in development projects in Orwell.

3
TABLE OF CONTENTS

1
PART I - COMMUNITY PROFILE
LOCATION
The Town of Orwell is located in northeastern Oswego County on the westernflank of the Tug Hill plateau (see map 1). The town encompassesapproximately 42.4 square miles or 27,136 acres. Bordering towns includeBoylston, Redfield, Williamstown, Albion, Richland and Sandy Creek. Orwell isapproximately 24 miles east of the City of Oswego and approx. 33 miles northof the City of Syracuse.
Map 1
Hamlet of Orwell
Townof Orwell
Oswego County
County Route 2County Route 22

2
HISTORY
Early Settlement (1790-1870)
The land now known as the Town of Orwell was part of an enormous tract ofland, comprising most of present day upstate New York, that was ceded to theState of New York by the Iroquois after the revolutionary war. The portion ofthis territory north of the Salmon River and west of the Adirondack mountains,a tract of approximately four million acres, was purchased from the state in1791 by Alexander Macomb and several associates. This tract became knownas the Macomb tract or Macomb’s purchase. The portion of the Macomb tractbounded by the Black River to the north and east was then sold and eventuallycame to be known as the Boylston Tract after its one time owner, ThomasBoylston. When this tract was surveyed into townships, what is now Orwellbecame township #11, also called Longinus. On February 28, 1817, the Townof Orwell was officially recognized by the state legislature. It was reportedlynamed by John Reynolds, the first supervisor, after his former home of Orwell,Vermont. In 1820, 488 people were reported to be living in the town. Thepopulation would grow steadily for the next 60 years.
The town’s early settlers were lured from New England by the prospect of cheapland and clean water. Hardwood-forested land reportedly sold for $1.50 anacre and softwood-forested land for $1.00 an acre. As settlers slowly came tothe town, a typical 19th century agrarian economy developed. The land wascleared to accommodate agriculture. Forests were felled, stumps were burned,and stones were removed to become barn foundations, stone walls and bridges.Hamlets began to develop at road intersections and road and streamintersections (flowing water being necessary to power mills). The hamlets ofMoscow (now Orwell or Orwell Corners), named for the Russian capital, andPekin (also called Molino), named for Peking, the Chinese capital, were the firstto develop. Moscow developed at the intersection of the road from Rome toSackets Harbor (now County Route 22) and the road to Pulaski (now CountyRoute 2). Pekin developed where what came to be known as Pekin Brookcrossed the Rome - Sackets Harbor Road. Churches, schools, and storeseventually sprang up at these locations providing goods and services to theircommunities. As new roads were built, other hamlets, including Chateaugay,Vorea, New Scriba and Pine Meadows, developed.
Early industry in the town was based on abundant natural resources. Maplesyrup production, a skill brought to the region from New England, and shinglemaking made use of the forest resource, as did potash and charcoalproduction. Stream driven mills began to appear along the Salmon River andPekin Brook in the early 1800’s. The first saw mill was built around 1810,allowing the town’s logging and lumber industries to grow. The first fullyfunctional gristmill began operation in 1835 - eliminating the need for a trip toPulaski, which could take up to two days. Early agriculture in the town waswheat and grain based until the Erie Canal opened in 1829. Because the canalallowed farmers from the midwest to flood eastern markets with cheaper grain,the farmers of Orwell turned to the production of dairy products, especiallycheese. The first cheese factory was built in 1853 and it is reported that about

3
ten such factories existed in the town in the 1870s. Cheese was drawn byhorse to Port Ontario to be shipped to Canada and then England. Otherimportant industries included tanning (making use of an ample supply ofhemlock bark), blacksmithing, ice harvesting and chair and ladder building.
Turn of the Twentieth Century (1871-1930)
The town’s population declined significantly during this period after peaking at1,550 in 1880. This decline was echoed throughout the communities of TugHill as residents were drawn to the surrounding cities where employment wasplentiful in the nation’s newly emerging industrial economy.
Orwell’s landscape also underwent a dramatic change during this period withthe construction of the Salmon River hydroelectric project, undertaken from1912 to 1930. The river was dammed at Stillwater and Lighthouse Hill,creating two reservoirs, the larger of which is seven miles in length. Water wasdiverted from its natural course over Salmon River Falls by a 7,800’ long, 12’diameter pipeline or ‘penstock’ that connected the upper and lower reservoirs,creating an energy producing water drop or ‘head’ of 285 feet. The LighthouseHill facility is capable of producing over 26 million kilowatt hours of electricityper year and the Stillwater facility is capable of producing around 81 million.
The Present and Beyond (1931- )
The mid to late twentieth century has seen the town’s population rebound tolate nineteenth century levels after bottoming out at 663 in 1960. This periodhas also witnessed Orwell’s transformation from a community were peoplecame to work the land to a community where people come to enjoy the solitudeof rural life. This shift is evidenced by a marked decrease in farming activity, aworkforce that has become increasingly dependent on employment sourcesoutside the town and the development of second home or ‘camp’ communitiesalong the town’s water bodies.
The decline of agriculture, especially family farming, is a nationwidephenomenon that is particularly evident in Orwell. The 1850 Census reportedthat 139 farms existed in the town. In 1999, there were less than 20 (several ofwhich were inactive). The majority of this abandoned farmland has revertedback to forest, either naturally or with the help of the New York Statereforestation program of the late 1920s. Chateaugay and Salmon River StateForests were created at this time contributing 3,800 acres of forest cover to thetown’s landscape.
Employment sources within the town are scarce today compared with thoseavailable during Orwell’s first growth era. Along with farms, commercialoperations are also few. Real property data suggests that there were less thanten tax parcels used for commercial purposes in 1995. 1990 Census dataindicates that only 17% of Orwell residents with jobs actually worked in Orwellthat year. These conditions have negative impacts in that they result in a

4
somewhat stagnant tax base and force many residents to commute, sometimeslong distances, to work. However, these conditions have positive impacts, aswell, in that they contribute to the preservation of Orwell’s pristine naturalsetting and rural qualities.
The creation of the Salmon River and Lighthouse Hill Reservoirs, along with thefour season recreational resources of Orwell’s state forests have made the townattractive for the development of vacation home communities. Theconstruction of Interstate 81 in the late 1960s, which put Orwell’s recreationaland scenic assets within easy reach of the residents of the Syracusemetropolitan area to the south, helped spur continued development of thisnature. The first vacation community in the Town of Orwell was the areaknown as Little America, which developed in the 1930s on the north shore ofthe Salmon River Reservoir. Lorton Lake, in the southeastern corner of thetown was created by the impoundment of Beaver Dam Brook in the late 1950s.Vacation homes now dot its two mile shoreline. Other developing vacationhome communities include the Four Seasons resort on the Lighthouse HillReservoir and the Salmon Shores development just west of Little America onthe Salmon River Reservoir. The announcement by Niagara Mohawk in theearly 1990s of their plans to sell much of the land acquired during the SalmonRiver hydroelectric project means that substantial amounts of land withfrontage on the reservoirs will be available for development in the future.
Sources: Crisfield Johnson, History of Oswego County, 1789 - 1877Betty D. Martin, Orwell Remembered, volumes I & IIJudith Wellman, Landmarks of Oswego County
DEMOGRAPHICS
Population
The population of the town has grown steadily over the last 30 years from 663in 1960 to 1,171 in 1990 (an average increase of 17% every ten years). Themost dramatic period of growth during this timespan was between 1970 and1980 when the population grew from 836 to 1,116 (up 33%). If the average tenyear growth rate (17%) were to continue, the town’s population in the year2000 would be 1,370. The Oswego County Department of Planning andCommunity Development has projected a 2000 population of 1,347 for Orwell.

5
Figure 1
Populat ion Change (1 9 6 0 - 1 9 9 0 )w/ 2 0 0 0 proje c t ion
02 0 04 0 06 0 08 0 0
1 0 0 01 2 0 01 4 0 0
1 9 6 0 1 9 7 0 1 9 8 0 1 9 9 0 2 0 0 0
Source: U.S. Census and Oswego Cnty. Dept. of Planning
Regional Population
A comparison of populations and growth rates between Orwell and the sixtowns surrounding it (Boylston, Redfield, Williamstown, Albion, Richland andSandy Creek) reveals that Richland had the greatest population in the ‘region’with 5,917 (40% of the seven town total) in 1990. Orwell’s population of 1,171ranked fifth (8%) - followed by Redfield (564 or 4%) and Boylston (443 or 3%),the least populated town in the ‘region.’ During the 1980s, the fastest growingof the seven towns was Redfield, whose population increased 35%. Orwellranked last with a growth rate of 5%.
Figure 2
Alb ion Boyls ton Orwe ll Red field Rich la n d S a n d y Crk W's town0
1 0 0 02 0 0 03 0 0 04 0 0 05 0 0 06 0 0 0
Alb ion Boyls ton Orwe ll Red field Rich la n d S a n d y Crk W's town
Populat ion in Adjac e nt Towns (1 9 8 0 -1 9 9 0 )
1 9 8 01 9 9 0
Source: U.S. Census

6
Households
The number of households (persons living together in the same dwelling unit,whether related or not) grew from 322 to 349 (an increase of 8%) between 1980and 1990. Average household size decreased slightly, from 3.47 to 3.36, duringthat period. The number of families (a subset of households) grew from 263 in1980 to 277 in 1990 (an increase of 5%).
Age
A comparison of the size of age groups (or cohorts) between 1980 and 1990indicates a more evenly distributed population in 1990 (compare the peaks andvalleys of the 1980 line in Figure 3 to the smoother profile of the 1990 line).The age groups of 25-34, 35-44 and 45-54 grew while the age groups of 5-14,15-24 and 55-64 declined. The groups of 0-4, 65-74 and 75+ remained stable.
Figure 3
Age Dis t ribut ion
0
50
100
150
200
250
0 -4 5 =1 4 1 5-2 4 2 5 -34 3 5 -44 4 5-5 4 5 5 -64 6 5-7 4 75 +
1 9 8 01 9 9 0
Source: U.S. Census
Net Migration and Deaths
Increases or decreases in age group size due to in and out migrations anddeaths can be examined by comparing the size of each 1980 age group with itssize, ten years later, in 1990. Figure 4 illustrates these changes. A decline inthe 5-14 age group (18%) likely indicates out migrations. The growth of the 25-34 and 45-54 groups (26% and 49%, respectively) probably indicates in-migrations while marked decline in the 55-64 and 65-74 groups (45% and 89%,respectively) may indicate out-migrations and deaths.

7
Figure 4
Change in 1 9 8 0 Age Groups(1 9 8 0 - 1 9 9 0 )
-8 0-6 0-4 0-2 0
02 04 06 0
0-4 5=1 4 15 -24 25 -3 4 35 -44 45 -5 4 5 5-6 4 65 -7 4
Source: U.S. Census
Income
Figure 5 illustrates changes in census-reported income figures for Orwell andOswego County for 1979 and 1989. The 1979 data is adjusted for inflationusing the consumer price index. Median household income in the towndecreased during this period from $22,849 to $22,400 (down 2%). Medianhousehold income in the county increased from $27,627 to $29,083 (up 5%).The number of persons living below the poverty level decreased from 272 in1980 (24% of the population) to 239 in 1990 (20% of the population).
Figure 5Median Household Income
1979 figures adjusted by CPIto 1989 Dollars
Town of Orwell1979 $22,8491989 $22,400% Change -2%
Oswego County1979 $27,6271989 $29,083% Change +5%
Source: U.S. Census
Educational Achievement
The level of educational achievement within the town escalated between 1980and 1990. According to census reports, the number of high school graduatesincreased from 236 in 1980 to 281 in 1990 (up 19%). The number of people

8
reporting completion of a bachelor’s degree grew from 42 in 1980 to 54 in 1990(up 29%).
Employment
The number of employed people (over 16) in the town grew from 332 in 1980 to381 in 1990, (up 15%). Oswego County’s number of employed people alsoincreased, from 41,761 in 1980 to 51,881 in 1990 (up 24.2%).
The leading sources of employment among Orwell residents in 1990 weremanufacturing (durable and nondurable) (21%), professional and related services(21%) and retail trade (18%). Between 1980 and 1990, the town experiencedpercentage decreases in employment in agriculture, forestry, fisheries andmining (-14%), manufacturing (-20%), professional and related services (-10%),and finance, insurance and real estate (-33%). Within that same period,increases occurred in employment in construction (+6%), transportation (+19%),wholesale trade (+22%), retail trade (+168%), communications and public utilities(+27%), business and repair services (+1,050%), and personal, entertainment andrecreation services (+167%). Employment in public administration remained thesame.
Figure 6Employment by Occupation - 1990
Occupation Number ofworkers
Agriculture, forestry, fisheries, mining 25Construction 38Manufacturing, nondurable 27Manufacturing, durable 52Transportation 19Public Utilities 14Wholesale Trade 11Retail Trade 67Finance, insurance, real estate 2Professional and related services 72Public Services 16Source: U.S. Census
Place of Work
The 1990 census reported that only 17% of the town’s workers (55 people)worked within the town’s boundaries. The average reported travel time to workwas 27 minutes. Figure 7 compares employment location and commutingbehavior for towns in the ‘region.’

9
Figure 7Town Percentage of Workers with
Jobs Located in Town ofResidence
Average Travel Time to Work
Albion 14% 27 min.Boylston 29% 33 min.Orwell 17% 27 min.Redfield 6% 30 min.Richland 77% 21 min.SandyCreek
56% 23 min.
W’stown 36% 26 min.Source: U.S. Census
FINANCE
During the first half of the 90s, real property taxes amounted to about threequarters of the town’s revenues (see Figure 8). When spending is broken downby function (see Figure 9), transportation has been the town’s major expenditure.When spending is broken down by object, the major expenditures have been forpersonal services and contractual expenditures (see Figure 10).
Figure 8Revenues
73%
7%0%
12%4%4%
Property TaxesStateFederalOther Govt.InterestAll Other
Source: NYS Comptroller’s Office

10
Figure 9Expenditures by Function
13%
6%0%1%
74%
0%2%4% Gen. Gov.FireOPSHealthTrans.EACRHCS
Source: NYS Comptroller’s Office
Figure 10Expenditures by Object
36%
7%47%
10%0%
PersonalEmp. Ben.ContractsECODebt.
Source: NYS Comptroller’s Office
11
NATURAL RESOURCES
Information about natural resources in the town has been compiled in ANatural Resources Inventory for the Town of Orwell, Oswego CountyEnvironmental Management Council and Oswego County Planning Board,January 1984. This report includes inventories and maps of climate, geology,physiography and topography, soils, hydrology, land use, vegetation, wildlife,and significant natural areas. The natural resources inventory is intended to“identify and discuss areas where natural resources pose limits to varioustypes of land use.”
HOUSING
Total Units
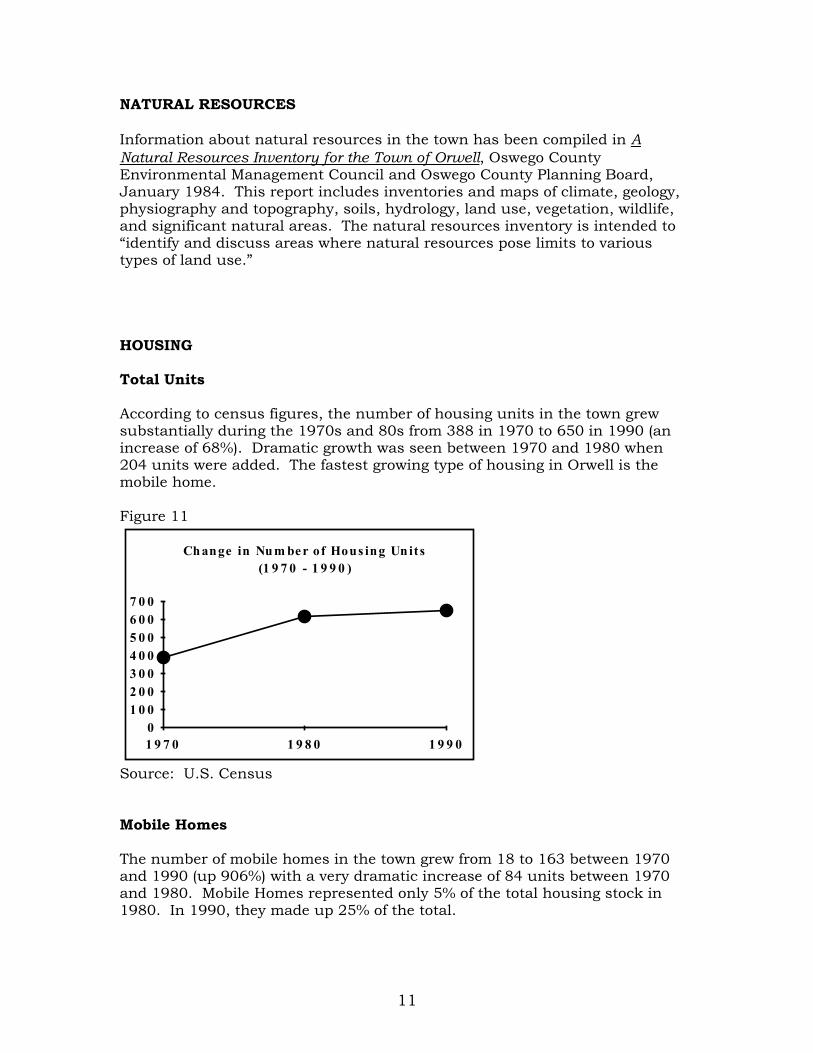
According to census figures, the number of housing units in the town grewsubstantially during the 1970s and 80s from 388 in 1970 to 650 in 1990 (anincrease of 68%). Dramatic growth was seen between 1970 and 1980 when204 units were added. The fastest growing type of housing in Orwell is themobile home.
Figure 11
Change in Num be r of Hous ing Un it s(1 9 7 0 - 1 9 9 0 )
01 0 02 0 03 0 04 0 05 0 06 0 07 0 0
1 9 7 0 1 9 8 0 1 9 9 0
Source: U.S. Census
Mobile Homes
The number of mobile homes in the town grew from 18 to 163 between 1970and 1990 (up 906%) with a very dramatic increase of 84 units between 1970and 1980. Mobile Homes represented only 5% of the total housing stock in1980. In 1990, they made up 25% of the total.

12
Figure 12
Rat io of Mobile Hom e s t o Total Unit s(1 9 7 0 - 1 9 9 0 )
01 0 02 0 03 0 04 0 05 0 06 0 07 0 0
1 9 7 0 1 9 8 0 1 9 9 0
Othe r Unit sMobile Hom e s
Source: U.S. Census
Seasonal Homes
The last 25 years has also seen a major increase in the number of seasonal,vacation homes from 141 in 1970 to 266 in 1990 with all but one of those unitsadded between 1970 and 1980.
Figure 13
Rat io of Se as onal Hom e s t o Total Unit s(1 9 7 0 - 1 9 9 0 )
01 0 02 0 03 0 04 0 05 0 06 0 07 0 0
1 9 7 0 1 9 8 0 1 9 9 0
Othe r Unit sSe as onalHom e s
Source: U.S. Census
Age and Value of Housing Stock
The median year of construction for housing structures in the town is 1950.As Figure 14 indicates, the majority of housing structures (42%) were builtbefore 1939. The median housing structure value was $46,700 in 1990.

13
Figure 14
39 OR EARLIER 40 - 4950 - 5960 - 6970 - 7980 - 90
Source: U.S. Census
HISTORIC RESOURCES
An inventory of historic structures in the Town of Orwell has been undertakenby the Heritage Foundation of Oswego. Listed here are the included houses,commercial, public, and agricultural sites, churches and cemeteries, andengineering structures.
Figure 15 HOUSES
HOUSE DATE MAPNO.
LOCATION DESCRIPTION
Donald H. ClarkHouse
1840 1 C.R. 2,Orwellhamlet
A 1½ story Greek revivalhouse with double wing andan exceptionally wide frieze.
Earl MeeksHouse
1890 2 C.R. 22,Orwellhamlet
A two story Queen Annehouse with decorative bargeboard and unusual design ina gable point, built byWilliam Lattimer.
Edgett House 1873 3 C.R. 2,oppositeElem. School
A two story wood clapboardItalianate house with acupola and paired brackets.
George ThomasHouse
1850 4 C.R. 2,Orwellhamlet
A two story Greek Revivalhouse
James R. EllisHouse
1880 5 C.R. 2,Orwellhamlet
A two story, brick CountryQueen Anne house built bylocal mason Victor

14
Waggoner.Richard PotterHouse
1830s 6 C.R. 52, nearTubbs Rd.
A two-story, five-bayFederal-style residencefeaturing a Palladianwindow.
Sabine House 1880s 7 Falls Rd. A 2½ story Queen Anneresidence with decorativebarge board, varigatedshingles and ‘cone’ porchroof.
Figure 16 COMMERCIAL, PUBLIC AND AGRICULTURAL SITES
BUILDING ORSITE
DATE MAPNO.
LOCATION DESCRIPTION
A. E. OlmsteadStore
1883 8 C.R. 22,Orwellhamlet
A brick Italianatecommercial block withcurved brick lintels withkeystones.
Beryle GreenfieldHouse
1850 9 C.R. 2 andBeechervilleRd.
A Greek Revival farmhouse,barn.
Charles HiltonFarm
1850 10 C.R. 2 A Federal-style house, dairybarn, silos, and machineshed.
Hugh HiltonFarm Barn
late19thcentury
11 Falls Rd. A board and batten sidedbarn with a stonefoundation.
Herbert JeanesStore
1860 12 C.R. 2,Orwellhamlet
A two story, clapboard,Italianate house with singlebrackets (converted to storein 1922).
OrwellElementarySchool
1949-1952
13 C.R. 2,Orwellhamlet
A one-story brick school.
Orwell Town Hall 1906-1909
14 C.R.s. 2 & 22 A two-story square buildingwith an impressiveclocktower, built by WilliamLattimer, local carpenter.
Unity Acres 1912 15 C.R. 22, westof Jerry LookRd.
A former county sanitariumopened as a shelter forhomeless men in the early1970s.
Van Camp Farm 1830 16 C.R. 52 A Federal-style house, alongwith a dairy barn, silo,smoke house and horsebarn.

15
Figure 17 CHURCHES AND CEMETERIES
BUILDING ORSITE
DATE MAPNO.
LOCATION DESCRIPTION
ChateaugayCemetery
1830 17 C.R. 2 andBeechervilleRd.
-
Gilbert HillCemetery
1810 18 C.R. 22,north ofOrwellhamlet
-
Merrill WaggonerFarm Cemetery
1850 19 C.R. 2, westof Orwellhamlet
-
Orwell Cemetery 1875 20 C.R. 2,Orwellhamlet
-
Orwell UnionChurch
1844 21 C.R. 22,Orwellhamlet
A Greek Revival church withQueen Anne elements.
Pekin Cemetery 1811 22 C.R. 22 -Pine MeadowsChurch
1898 23 PineMeadows Rd.and Gay Dr.
A rectangular shapedchurch with front entranceand tower at an angle acrossfront corner.
Potter Cemetery 1820 24 off C.R. 52,south ofOrwellhamlet
-
St. MartinDeporresCemetery, UnityAcres
1970 25 C.R. 2, westof Orwellhamlet
-
Vorea CommunityChurch
1897 26 WaggonerRd. and C.R.50
A rectangular gable roofedchurch with vestibule, belltower and Sunday schoolannex.
Figure 18 ENGINEERING STRUCTURES
STRUCTUREOR SITE
DATE MAPNO.
LOCATION DESCRIPTION
Highway Culvert,New Scriba Dr.
1960s 27 east of C.R.22
A dry stone wallembankment.

16
Lighthouse HillDam andHydroelectricFacility
1930 28 C.R. 22,betweenAltmar andBennett’sBridges
A hydroelectric complexincluding a 2500’ dam andpower plant.
“Bennett’sBridges”
1930s 29 C.R. 22 A concrete bridge overSalmon River
Stillwater Bridge 1913 30 Dam Rd. An iron truss bridge overSalmon River (closed).
Stillwater Dam 1914 31 AboveStillwaterBridge
A 600’ dam and 7,800’penstock
Salmon RiverRes.HydroelectricFacility
1914 32 C.R. 22 atBennett’sBridges
A hydroelectric complexincluding a wooden surgetank and power plant.

17
Map 2
18
2218 5
20 1 13 12144
3
C.R. 22
C.R. 2
2627
102515 19
16
24
917
6722 30
31
23
2829
32
see Hamlet Inset
11
C.R. 2
C.R. 22

18
PUBLIC WATER SUPPLY
History
The hamlet of Orwell has been provided with public water for over 100 years. Aprivately owned system served the community from the 1880s to the late1970s. The system distributed water to the hamlet from a collection basin anda small spring at the base of a gravel slope approximately one-half milenortheast of the hamlet. The town acquired the system in 1979 and created awater district. Modifications to the original system were made in 1985 and1988, including construction of a new infiltration gallery and well andinstallation of new treatment and distribution facilities. Water flows by gravityfrom a standpipe at the original source site to the hamlet’s approximately 250residents.
Source
Three groundwater sources on an 8.42 acre site tap into the Tug Hill aquifer, a47-mile deposit of sand and gravel that underlies the western andsouthwestern sides of the Tug Hill plateau. An infiltration gallery (added in1985) and springhouse (original) are permitted by the New York State Dept. ofEnvironmental Conservation to take 60,000 gallons per day from the ground. Ashallow well (installed in 1988) supplements the yields of the gallery andspringhouse.
Distribution
Raw water is treated in a pump building on site and stored in a 158,000 gallonstandpipe (constructed in 1985). The treated water then flows by gravitythrough a 10” main to the hamlet water district. As of 1992, there wereapproximately 100 service connections to the system. Total demand wasmeasured at 20,000 gallons per day.
Quality
Quality of the Orwell water supply has generally been quite good. A waterquality violation did occur when the chlorination system failed in 1990,resulting in excess levels of coliform.

19
SCHOOL DISTRICTS
The Town of Orwell is served by two school districts, Sandy Creek in thenorthern half and Altmar-Parish-Williamstown in the southern half.
The Sandy Creek Central School District operates two elementary schools -Orwell and Sandy Creek - and Sandy Creek High School. Total enrollment was1,227 in 1995/96, with a staff of 154. The district’s operating budget was$8,190,786.
Altmar - Parish - Williamstown Central Schools operates three elementaryschools - Altmar, Parish and Williamstown - and Altmar - Parish -Williamstown Middle/High School. Total enrollment was 1,874 in 1995/96,with a staff of 272. The district’s operating budget was $15,147,195.
Map 3

20
ROADS
Orwell is serviced by approximately 60 miles of public roads. Of this total,approximately 22 miles (37%) are under county jurisdiction and approx. 38(63%) are under town jurisdiction (see Figure 19). Orwell joins Boylston andRedfield as one of three Oswego County towns with no state highway mileage.
LAND USE
Population Density
The Town of Orwell is a rural town, based on a generally accepted ruralpopulation density standard of 150 persons or less per square mile. Populationdensity has increased from 20 persons per square mile in 1970 to 26 in 1980and 28 in 1990.
Figure 19
Change s in Populat ion De ns it y(1 9 7 0 - 1 9 9 0 )
05
1 01 52 02 53 0
1 9 7 0 1 9 8 0 1 9 9 0
Source: U.S. Census
Land Cover
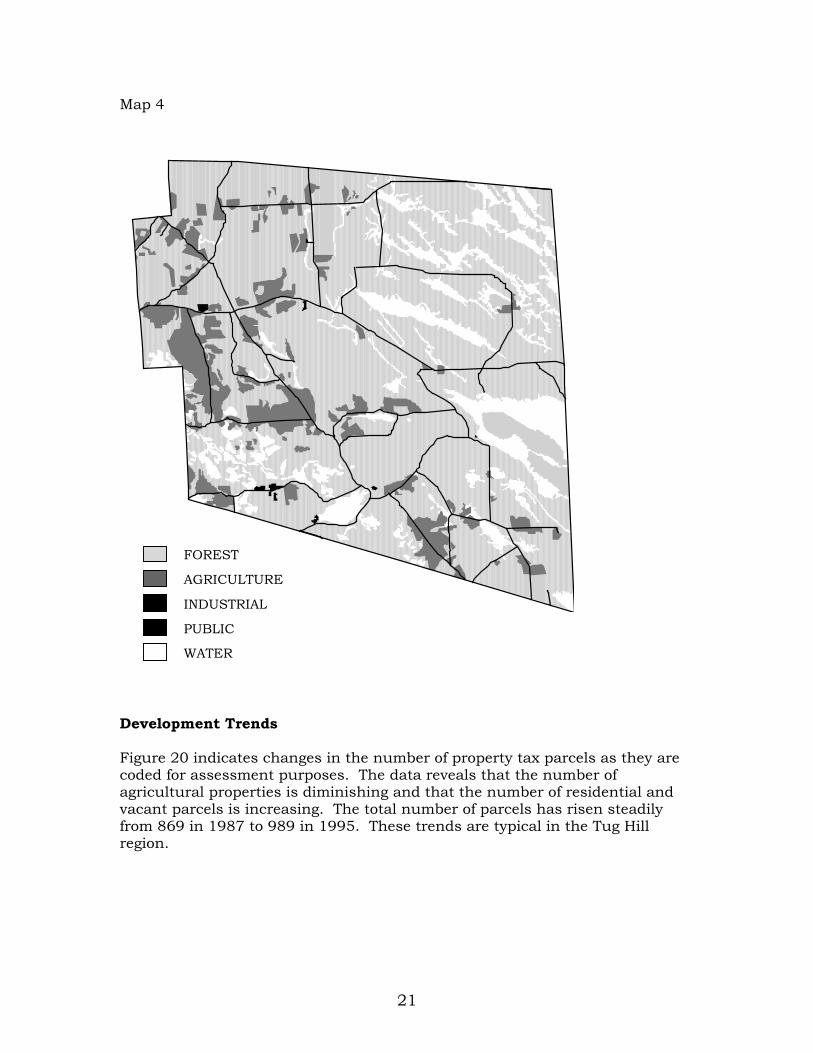
A land cover analysis completed by the Oswego County Department of Planningin 1984 (see Map 4) reveals that the overwhelming majority of Orwell’s landsurface is covered by forest and water. Also of note is the location ofagricultural land almost exclusively in the western portion of the town.
21
Map 4
Development Trends
Figure 20 indicates changes in the number of property tax parcels as they arecoded for assessment purposes. The data reveals that the number ofagricultural properties is diminishing and that the number of residential andvacant parcels is increasing. The total number of parcels has risen steadilyfrom 869 in 1987 to 989 in 1995. These trends are typical in the Tug Hillregion.
FOREST
AGRICULTURE
INDUSTRIAL
PUBLIC
WATER

22
Figure 201987 1991 1995
Agriculture 40 29 29
Residential 534 581 626
Vacant 145 159 190
Commercial 5 7 7
Recreation 0 0 0
Community Svcs. 19 17 15
Industrial 1 1 1
Public Service 24 25 24
Forest/Conservation
101 94 97
TOTAL 869 913 989
Source: Oswego Cnty. Office of Real Property Svcs.
WILDLIFE
The Town of Orwell’s diverse habitats, including agricultural fields, wetlands,shrubland, and dense hardwood and coniferous forests sustain an abundanceof wildlife.
Big Game Animals
White tail deer, probably the largest resident wildlife species in the town,inhabit deciduous forests in the warmer months of the year and seek shelterfrom Tug Hill’s rigorous winters in coniferous forests. An important deerwintering area is located just to the north of the town in the Otto Mills area ofthe Town of Redfield. Orwell’s managed forests and abundant wetlands areconsidered ideal Moose habitats. Moose, the largest member of the deer family,were, at one time, a resident species in the area, but now are only occasionallysighted as they travel between Canada and the Adirondacks.
23
Fur-bearing Animals
Beaver, a common and frequently bothersome species, dwell in the town’swetland areas, a habitat they help create. Fisher live in coniferous forest areasand travel along streams. Coyotes, also controversial, and red and gray foxesinhabit the town as do mink, muskrat, otter and snowshoe hare.
Birds
The town’s wetlands provide occasional homes for a variety of avian speciesincluding black duck, mallard, osprey, wood duck, and hooded merganser. TheSalmon River Reservoir provides habitat for bald eagles, buffleheads, coots,goldeneyes, loons, oldsquaws and scaups. The town’s shrubland and forestmay be home to pileated woodpecker, ruffed grouse, turkey and Americanwoodcock.
Fish
Orwell, John O’Hara and Pekin Brooks are home to salmon in the fall andsteelhead and rainbow trout in the spring. The Salmon River Reservoir is hometo largemouth bass and pan fish. Brook and brown trout can be found in allthe town’s streams.
Source: Tug Hill Commission, Tug Hill Working Lands
STATE FORESTS AND UNIQUE AREAS
The NYS Reforestation Law of 1929 and the Federal Resettlement Program of1935 led to the creation of numerous state forests in New York. 14 suchforests, most of which at one time were active agricultural lands, were createdin eastern Oswego County. A 15th state forest, Hall Island was created in theearly 1990s from former Niagara Mohawk lands. Hall Island State Forest, alongwith Chateaugay State Forest and Salmon River State Forest, are locatedentirely or partially in the Town of Orwell. Their combined size (acreage withinthe town) of approximately 4,055 acres constitutes about 15% of the town’stotal acreage. The Salmon River Falls area, formerly owned by Niagara Mohawkwas acquired by the Department of Environmental Conservation anddesignated as a unique area in the early 90s.
Chateaugay State Forest
Chateaugay State Forest is located in the north/central part of the townbetween County Route 2 and the Boylston town border. The forest’s 3,346acres consist of approximately 450 acres of conifer plantations, approximately2,760 acres of second growth hardwood and mixed forests and approximately100 acres of wetland with swamp forests. Chateaugay is used for thecultivation of forest products and recreation, including fishing and hiking andcross-country skiing on seven miles of trails.

24
Hall Island State Forest
Hall Island State Forest is located along the southern shoreline of the SalmonRiver Reservoir. The approximately 2,075 acre forest is located in Redfield andOrwell and is made up of land originally acquired by Niagara Mohawk duringthe Salmon River hydroelectric project. Recreational trails are underdevelopment.
Salmon River State Forest
Salmon River State Forest is located north of the Salmon River Reservoir. Theforest is predominantly situated in the Town of Redfield, but extends intoOrwell, where it meets the reservoir’s shoreline for roughly one mile. Theforest’s approximately 2,033 acres are comprised of approx. 285 acres of coniferplantations, approx. 1,728 acres of hardwood and mixed second growth forestand approx. 20 acres of wetlands. Salmon River State Forest provides forcamping, hiking, cross-county skiing and snowmobiling as well as fishing.
Salmon River Falls Unique Area
The Salmon River Falls Unique Area consists of the 76 acre parcel thatsurrounds the falls. Access to the areas is along Falls Rd. The site featuresparking, hiking trails and magnificent views of the Salmon River Falls.
Source: Weeks, John A., Cox, Donald C., Natural Areas of Oswego County

25
PART II – GOALS
A. PRESERVE RURAL CHARACTER
The town’s rural character is regarded highly by its citizens and should bepreserved. The existing development pattern of vast, open acreages of farm andforest land interspersed with compact hamlet communities is an efficient andattractive one. New development should be encouraged, but should becarefully planned to fit into and compliment this pattern. Careful developmentplanning is especially important in the town’s fragile waterfront areas. A wellmaintained scenic environment not only improves the quality of residential lifefor the town’s residents, but has economic benefits as well - improving Orwell’smarketability as a tourism destination.
Objectives
1. Promote the orderly growth of the town while restricting development aslittle as possible
2. Preserve low population densities in the relatively undeveloped areas ofthe town and higher densities in the developed areas
3. Maintain the compatibility of neighboring land uses and prevent landuse nuisances
4. Encourage development that compliments the architectural character ofneighboring structures
5. Preserve open space
6. Prevent overdevelopment of waterfront areas, especially those along theSalmon River Reservoirs and Lorton Lake
7. Protect scenic views
Strategies
The town can best implement the above objectives by the formulation andadoption of rational development laws, in particular land use and subdivisionlaws. A land use law would allow the town to control the location, density,siting and design compatibility of new development. A subdivision law wouldallow the town to review proposals for the subdivision of land, ensuring thatgrowth occurs in an orderly fashion and as much open space is preserved aspossible. The 200’ conservation easement along the Salmon River held byNYSDEC should be supported by the town.

26
B. PROTECT NATURAL RESOURCES
Orwell is blessed with an abundance of diverse natural features, such asstreams, wetlands and forests, that require protection if they are to remainunspoiled. Development and land use activities should be undertaken in a waythat minimizes impacts on these resources. On some sites, developmentshould be avoided altogether, as it can create problems such as erosion,flooding and groundwater contamination. It must be recognized that the lessnatural features, such as slopes and drainageways, are altered, the lessexpensive development is to undertake and to maintain.
Objectives
1. Protect groundwater from septic system and other contamination
2. Conserve soil resources by preventing contamination and erosion
3. Protect forest lands
4. Protect surface water quality of lakes and streams
5. Protect wetlands and floodplains
6. Protect farmland
7. Protect wildlife habitats
Strategies
The town can best implement the above objectives with land use andsubdivision laws that ensure that land is developed according to standards fordesign and density that protect important natural features, such as qualitysoils, slopes, forest and farmland, drainageways and floodplains. The townwould also benefit from enrollment in the National Flood Insurance Program(administered by FEMA). Participation would make flood insurance available totown residents. It is also worth noting that a variety of state programs aimed toprotect natural resources are in effect. NYS Public Health Law Article 75mandates that soils be suitable for septic system development before suchdevelopment is allowed on individual lots (note: enforcement of Article 75 is aresponsibility of the town). NYS Environmental Law Articles 24 and 36 protectwetlands and floodplains, respectively. The State Environmental QualityReview Act (SEQR) helps to ensure that actions which require discretionaryjudgments by permitting bodies are evaluated in terms of their environmentalimpacts. Finally, the town should do everything it can to encourage publiceducation and participation in natural resources stewardship.

27
C. PROTECT HISTORIC RESOURCES
The town’s historic buildings and sites provide a three dimensional history ofits past. For example, the proliferation of greek revival farm houses indicatesthat the town grew rapidly during the early 1800s. Historic resources alsocontribute greatly to the town’s sense of place and identity. As these resourcesare demolished or abandoned, this identity is slowly chipped away. Theburden of protecting these properties lies primarily with individual landowners.However, if such structures and sites are properly maintained, the entire townstands to gain.
Objectives
1. Protect important buildings and sites from demolition or insensitivealteration
2. Promote rehabilitation of buildings and sites through education andtechnical assistance
Strategies
The town can implement the above objectives by maintaining a detailedinventory of the historic resources within the town. This information can beused in the evaluation of future land use proposals (via the SEQR process) andin possible application for placement on the State or National Registers ofHistoric Places. The town could encourage the participation of private propertyowners in historic property preservation by serving as a clearinghouse forhistoric preservation educational materials. The town could help preserve thehistory of its historic settlement areas (such as Pekin and Vorea) by erectingroadside “place name” signs in those areas.
D. ENHANCE AND MAINTAIN THE HAMLET OF ORWELL
The hamlet of Orwell has historically been the “urban” center of the town. Itslocation at the intersection of Rts. 2 and 22, its public water system, schooland town buildings, and its development friendly soils make it the logical placeto channel residential and commercial growth. This growth should occur in acompact, concentric pattern rather than a sprawling, linear one. This willcompliment the historic development pattern, preserve the hamlet’s“walkability,” and ensure efficient utilization of the town’s water system.
Objectives
1. Encourage residential growth in the town to occur in the hamlet
2. Promote the establishment of diverse commercial uses
3. Maintain the traditional development pattern
28
4. Control signage
5. Encourage infill development on vacant lots at the hamlet’s center
6. Maintain and enhance the streetscape, public buildings and publicspaces
Strategies
The town can implement the above objectives through a variety of actions. Aland use law could help create an incentive for the location of residential andcommercial growth in the hamlet by allowing higher development densitiesthere than would be allowed in the more rural parts of the town. Such lawcould also help the town to assure that new development is of a style andcharacter fitting with the present development pattern. Adoption of asubdivision law could help ensure that new roads are built in a way that bestfits the existing townscape. Development of a streetscape improvement plancould provide direction for future public improvements such as sidewalks,street trees and parking facilities. A kiosk located in the vicinity of the TownHall could be used to advertise upcoming events. Finally, the town can set apositive example of property maintenance and pride by making sure that itsbuildings, grounds and sidewalks are well kept.
E. ENHANCE HOUSING OPPORTUNITIES
The availability of safe, affordable housing is of utmost importance to thetown’s future. Decent housing is not only a key contributor to the quality oflife of current residents, but is also necessary if the town is to attract newbusiness and industry. While factors that contribute to the cost of housing arelargely outside the control of local government, there are measures the towncan take to keep costs down.
Objectives
1. Protect the availability of affordable housing by helping to keep lotacquisition and improvement costs low
2. Allow a wide variety of housing options within the town
3. Promote housing maintenance and appearance
Strategies
The town can implement the above objectives in several ways. The townshould consider applying for housing rehabilitation and/or homeownershipassistance funding from programs such as CDBG (Community DevelopmentBlock Grant) and HOME (an Oswego County sponsored housing rehabilitationprogram is currently being implemented in the town). Maintenance of housing
29
and property can be implemented by consistent enforcement of the NYSUniform Fire Prevention and Building Code.
F. ENHANCE THE ECONOMIC BASE
The town should seek to improve economic opportunities for its residents. Theexpansion of job opportunities would allow residents to work closer to theirhomes and reduce their need to commute long distances. A brighter economicfuture would also create an incentive for young people to remain in the town.A diverse economic base should be sought as it is more likely to survive thefluctuations in the national economy, such as rising gas prices or falling pricesfor agricultural products, that can wreak havoc on non-diverse localeconomies.
Objectives
1. Promote the development of value-added natural resource basedindustries
2. Promote tourism and related service businesses
3. Protect commercial property values and investments
4. Channel commercial growth to the hamlet area
Strategies
The town can best implement the above objectives by identifying key sites forcommercial development and by creating a stable and predictable builtenvironment. An up to date inventory of appropriate vacant land and buildingswith commercial development potential can help the town market itself tobusiness investors. Industries that make use of locally produced forestproducts should be particularly sought. Tourism is also an industry that couldmake use of the town’s existing resources. The town can promote tourism byproviding information about recreation opportunities via a brochure andpossibly a kiosk in the hamlet that could direct travelers to various sites.Businesses, such as restaurants, inns and campgrounds, that provide servicesto visiting snowmobilers, fishermen, skiers and boaters should be sought.Because business only thrives in a stable environment, the existence ofrational land use controls would help convince potential investors that theirenvironment will be protected. Such controls can also help channelcommercial development to the hamlet where the proper infrastructure is inplace to service it. With proper direction, the town can absorb the costs ofgrowth with an increased tax base.

30
G. PROTECT TRANSPORTATION AND INFRASTRUCTURE INVESTMENTS
The town’s taxpayers have invested a great amount in the construction of manymiles of public roads. The public water system (in the hamlet of Orwell), whilefunded with federal tax monies, is the result of the investment of large amountsof time and energy from townspeople. Action must be taken to protect theseinvestments and utilize these infrastructures efficiently. Proper functioning ofboth systems is vital to the economic future of the town. Uncontrolleddevelopment along major roads can lead to a proliferation of curb cuts andincreased traffic leading to a loss of the roads’ proper function. Costs to usersof the public water system can be lowered by encouraging new developmentalong or near existing water lines. The water system is worthless, however, ifthe source groundwater is not protected.
Objectives
1. Preserve highway function by controlling strip development and curbcuts
2. Minimize road development and maintenance costs
3. Ensure that the public water system is protected
4. Expand the number of users on the existing lines of the hamlet watersystem if capacity allows
Strategies
The town can best implement the above objectives by proper land use planningand regulation. Transportation issues can be addressed by controlling thedensity of development along important roads, particularly County Routes 2and 22, and discouraging the development of new roads. Also, the ability toreview site development plans would allow the town to have a say in how sitesare developed in terms of access to important roads. Development should becarefully controlled in the vicinity of low volume, seasonal or abandoned roadswhere increased density could lead to the necessity of upgrading and reopeningthem. Public water supply protection can be addressed by prohibiting landuses that have the potential to pollute the supply. The town can also serve as aclearinghouse for good aquifer management information, having recentlycompleted work on watershed rules and regulations. The expansion of userson the existing water system can be accomplished by allowing increaseddensities in the area served by the system. However, care must be taken tostudy the capacity of the system and the effects increased use would have onthe septic capacity of the soils in the area.
H. ENHANCE AND PROTECT RECREATION RESOURCES
Orwell features a variety of four season recreational resources within itsborders. These include forests and trails for hiking, skiing, and snowmobiling

31
and lakes and streams for fishing and boating. These assets greatly improvethe quality of life for residents of the town and also attract people from out oftown, either tourists or vacation home buyers. The town’s economy can benefitgreatly from the marketing of this wealth of recreational opportunity. At thesame time, care must be taken to ensure that an influx of tourists doesn’tbecome a negative experience for the town.
Objectives
1. Promote the protection of state forests and unique areas
2. Enhance the appropriate recreation opportunities of the Salmon Rivercorridor
3. Improve group/family oriented active recreation facilities for thecommunity
Strategies
The town can best implement the above objectives by several actions. Thetown should play an active role in the DEC’s development of managementplans for the state owned lands that make up such a large percentage ofOrwell’s total land area. The town should also proactively plan for appropriatedevelopment of multi-use recreational opportunities in the Salmon Rivercorridor. Recreation opportunities for groups and families could be enhancedby investigating the development of the town’s 25 acre parcel on Rt. 22 or theproperty opposite the town hall for the development of active recreational(ballfields, playgrounds) facilities.

32
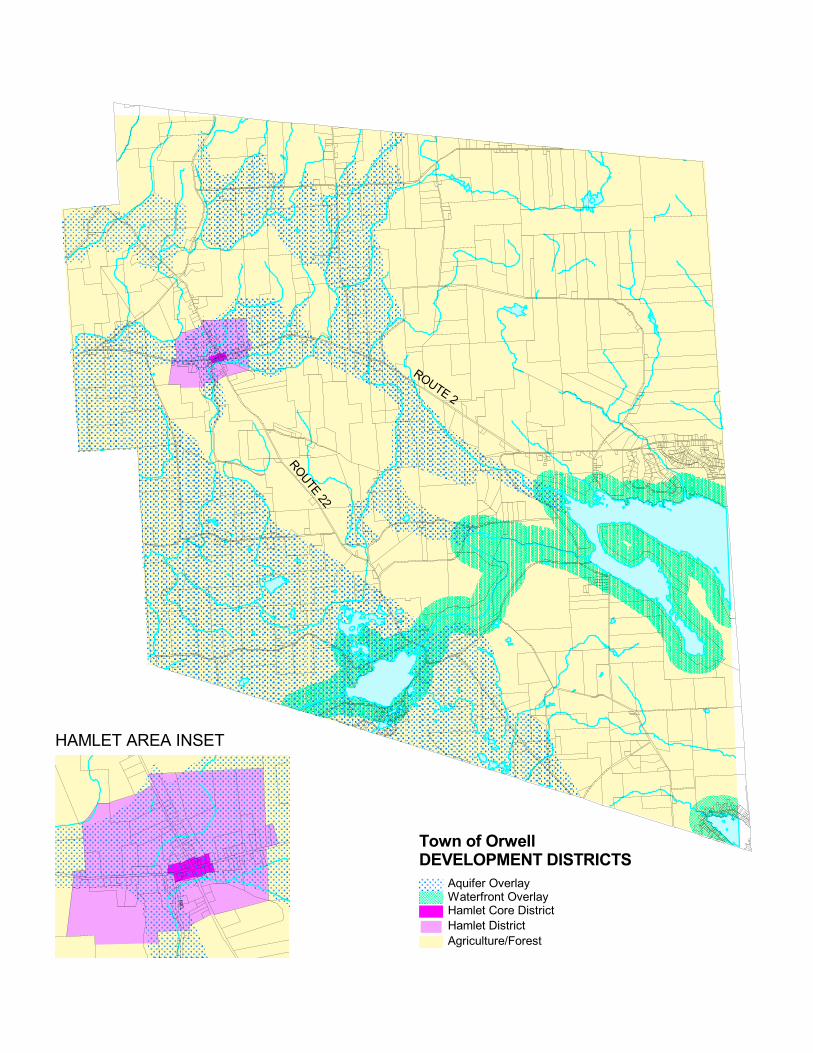
PART III – DEVELOPMENT DISTRICTS
PLANNING STUDIES
A number of study maps were created to help the planning board identifycurrent development patterns and determine development suitability indifferent parts of the town. The maps are attached as appendix B and aredescribed as follows:
Land Use – includes tax parcels color coded by Real Property System (RPS) landuse code
Land Cover – includes delineation of developed areas, ag land and vegetation
Population Density (Winter) - includes delineation of development intensity
Population Density (Summer) - includes delineation of development intensity
Soil Suitability – includes soil types coded by their suitability for septic systems
Slope – includes delineation of landform slope
Development Constraints – includes features that prohibit development(wetlands, flood hazard areas, public lands, etc.)
DEVELOPMENT DISTRICT DELINEATION
Using the study maps as a reference, the planning board delineated areas ofsimilar character. The board then identified existing conditions in each ofthese districts and produced recommendations for their future developmentthat are true to the goals stated in Part II.

33
HAMLET DISTRICT
Location/General DescriptionThe hamlet district is the area roughly within 1500’ to 2000’ of the intersectionof Rts. 2 and 22. This approx. 290 acre area encompasses the public watersystem’s distribution lines and the 35 mph speed zones on Rts. 2 & 22. Mostof the district is within about 5 minutes walking distance from the intersection.The hamlet district includes a subdistrict: the hamlet “core” (see illustration 1).The “core” includes the properties with commercial and institutional useslocated very near the intersection. The hamlet district is characterized by highdensity development on small lots (generally about half an acre). Buildings aretypically two story structures and are setback about 25’ from road right-of-ways creating a strong sense of enclosure along the street.
Illustration 1
5 m
inut
e wa
lk
CORE
RT. 2
RT. 22

34
EXISTING CONDITIONSDistrict Size: 290 acresLand Uses:
agriculturecommercial (retail)industrialinstitutional (church, school, government building)open spaceresidential (single-family, two-family, mobile home)
Median Lot Size: 0.4 acresBuilding Setbacks:
Front: 10’ - 30’Rear: 50’ - 100’Side: 15’ - 45’
Dwelling Units/Acre: 0.35Net DU/Acre (not including open space at periphery of district): 1.5Public Open Space/Acre: 0.002Water: public systemSewage: private septic systems
RECOMMENDATIONSThe hamlet district’s development pattern is a relatively good one. Newdevelopment should respect and reinforce the existing context. Commercialuses should be encouraged and concentrated in the “core” subdistrict. Therest of the district should remain residential. The existing building density aswell as the lot sizes and configurations are considered appropriate for smallsettlements like Orwell. The pattern of small lot sizes may, however, be aproblem in Orwell due to the lack of a public sewer system. Analysis ofgroundwater recharge and surface water runoff conditions in the townindicates the need for a minimum lot size of approximately 60,000 square feet(in most of the district) to prevent contamination of groundwater by septicsystem effluent (see Appendix A). In the absence of a public system,development that compliments the existing high density pattern can becarefully accommodated on larger lots if buildings are sited in such a way thatthe lots can someday be subdivided to create smaller lots if a public sewersystem is ever put in place (see illus. 2). As the hamlet grows, newdevelopment should occur first on vacant lots along existing roads and nextalong new roads. Any new roads should be carefully planned to create amodified grid pattern consisting of 200’ to 900’ blocks (see illus. 3).

35
Illustration 2
Illustration 3
EXAMPLE OF BLOCK LENGTHS IN BOONVILLE, NY
690'
370'
780'
400'
620'
460'
900'
740'
485'
285 '
335'
835 '
615'
600'
260'
200'
460'
285 '
620'
500 '
445 '

36
AGRICULTURE/FOREST DISTRICT
This area includes all parts of the town not in the Hamlet District. TheAgriculture/Forestry district is predominantly characterized by open space(much of it in state reforestation areas), agricultural land (active and inactive)and low density residential development. Several churches and smallcommercial operations are sprinkled throughout the district. Building typesinclude 19th century farmhouses and structures, mobile homes and vacationcamps.
EXISTING CONDITIONSDistrict Size: 25,768 acresLand Uses:
agricultureforestryindustrialinstitutional (church, school, government building)open spacerecreationresidential (single-family, two-family, mobile home)
Median Lot Size: 1.8Dwelling Units/Acre: 0.02Water: private wellsSewage: private septic systems
RECOMMENDATIONSThe low density, farm, forest and residential character of the Agriculture/ForestDistrict should be preserved. A wide variety of land uses are appropriate here –however, uses which are detrimental to farm and forestland production shouldnot be allowed. Land subdivision should be somewhat limited in this district.This will accomplish three objectives: 1) the preservation of large parcels ofland that are suited for natural resource production; 2) the reduced detrimentto road function (increased curb cuts and traffic); and 3) the protection of therural/open space character of the town. This is not to say that this districtshouldn’t be developed – just less developed than the hamlet district.

37
WATERFRONT OVERLAY
The waterfront overlay district includes the land within 1000’ of the shorelinesof the Upper and Lower Salmon River Reservoirs, Lorton Lake and theremainder of the Salmon River. Included in this district are pockets of highdensity second home development. These areas have probably beenoverdeveloped, especially in terms of lot size (with regard to groundwatercontamination prevention). The minimum recommended lot size (approx. 2.0acres in most of the overlay) has been drastically exceeded here (quarter-acrelot sizes are typical). Since these areas are located in the Agriculture/ForestDistrict, all of the standards of that district apply here, however these areas areunique and require special treatment. Special issues here include protection ofthe water resource and protection of scenic resources.
AQUIFER OVERLAY
The Aquifer Overlay District includes all land that directly overlays the Tug HillAquifer in the Town of Orwell. This area was delineated by a 1988 UnitedStates Geological Survey (USGS) study. The study indicates that water on theland surface drains directly into the aquifer due to the presence of sand andgravel surficial geology. The object here is to restrict land uses that maypotentially contaminate the aquifer.
ROUTE 2
ROUTE 22
MILL
HAMLET AREA INSET
Town of OrwellDEVELOPMENT DISTRICTS
Agriculture/ForestHamlet DistrictHamlet Core DistrictWaterfront OverlayAquifer Overlay

38
APPENDIX A

Minimum Lot Sizesn/aSOIL GROUP A - 60000 s.f.SOIL GROUP B - 60000 s.f.SOIL GROUP C - 2.0 acresSOIL GROUP D - not suitable
WaterbodiesStreamsTax Parcels
Town of OrwellMINIMUM LOT SIZES(PARCELS W/ CONVENTIONAL SEPTIC SYSTEMS)
N0.5 0 0.5 1
Miles
COUNTY RT. 2
COUNTY RT. 22

39
APPENDIX B

Tax ParcelsAgriculturalResidentialVacantCommercialRecreationCommunity ServicesIndustrialPublic ServiceForest/Conservation
WaterbodiesRoadsTown Boundary
Town of OrwellLAND USE
N0.5 0 0.5 1
MilesSource: NYS Office of Real Property Svcs.

VegetationDeciduous ForestConiferous ForestConifer PlantationSuccessional FieldShrublandOpen FieldDeveloped AreaWetlandsWater
WaterbodiesStreamsTax Parcels
Town of OrwellLAND COVER
N0.5 0 0.5 1
MilesSource: Oswego County Planning Dept.
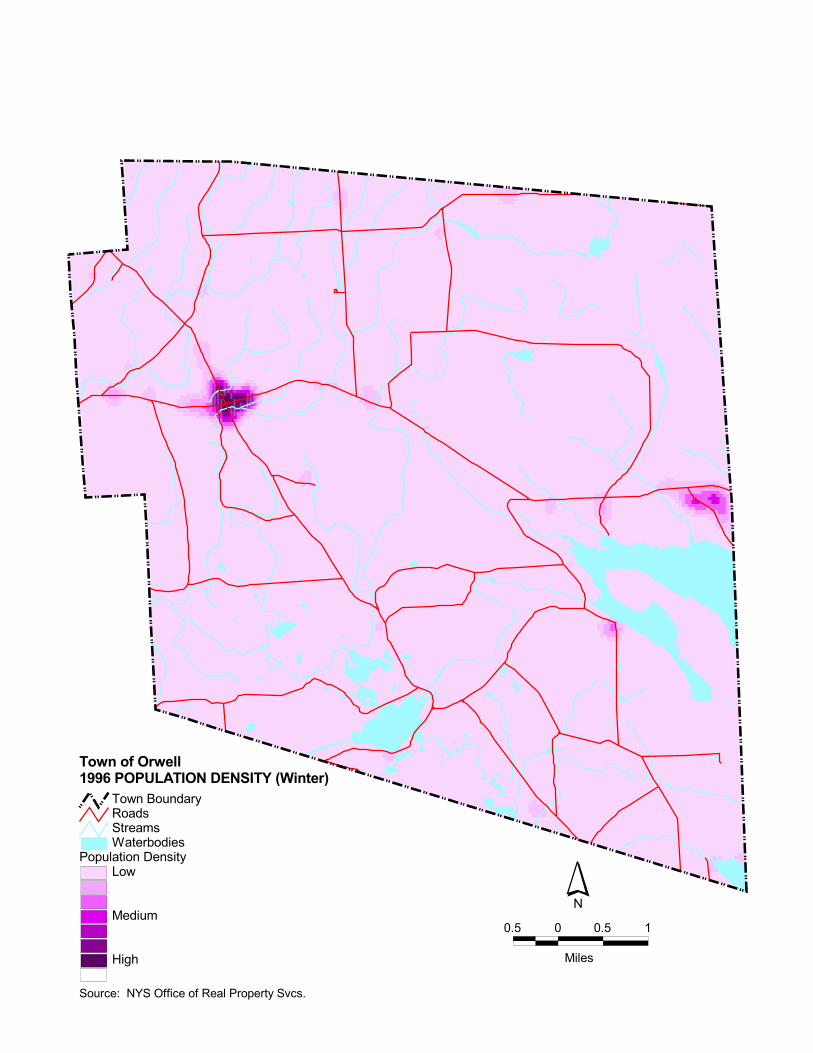
Source: NYS Office of Real Property Svcs.
Town of Orwell1996 POPULATION DENSITY (Winter)
Population DensityLow
Medium
High
WaterbodiesStreamsRoadsTown Boundary
N0.5 0 0.5 1
Miles

N0.5 0 0.5 1
Miles
Population DensityLow
Medium
High
WaterbodiesStreamsRoadsTown Boundary
Town of Orwell1996 POPULATION DENSITY (Summer)
Source: NYS Office of Real Property Svcs.

Soils by Limitations for Septic Systems-SlightModerateSevere
WaterbodiesStreamsTax Parcels
Town of OrwellSEPTIC SYSTEM SUITABILITY
Source: Oswego County Soil Survey
N0.5 0 0.5 1
Miles

Town of OrwellSLOPES
Source: NYS DEC
Slopes0 - 1010 - 1515 - 2020 - 2530 - 90No Data
WaterbodiesStreamsTax Parcels
N0.5 0 0.5 1
Miles

CemetariesPublic LandsFEMA Flood Hazard AreasWaterbodiesStreamsDEC Regulated WetlandsTax Parcels
Town of OrwellDEVELOPMENT CONSTRAINTS
N0.5 0 0.5 1
Miles
40
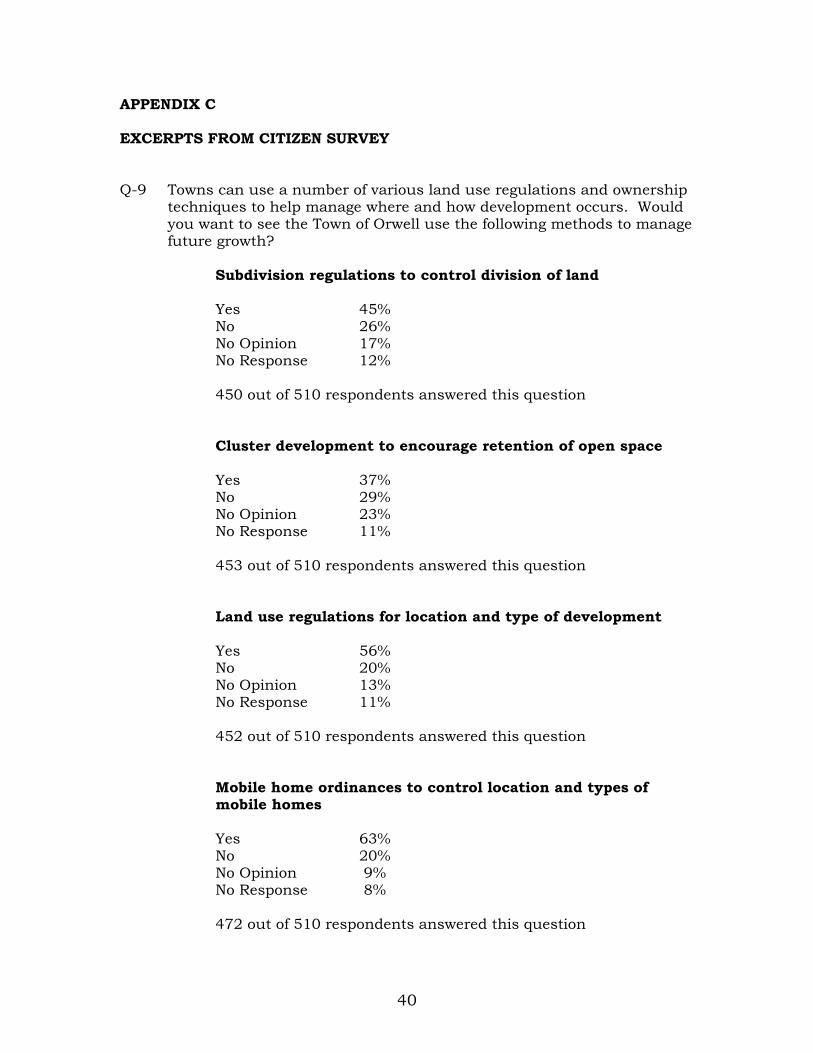
APPENDIX C
EXCERPTS FROM CITIZEN SURVEY
Q-9 Towns can use a number of various land use regulations and ownershiptechniques to help manage where and how development occurs. Wouldyou want to see the Town of Orwell use the following methods to managefuture growth?
Subdivision regulations to control division of land
Yes 45%No 26%No Opinion 17%No Response 12%
450 out of 510 respondents answered this question
Cluster development to encourage retention of open space
Yes 37%No 29%No Opinion 23%No Response 11%
453 out of 510 respondents answered this question
Land use regulations for location and type of development
Yes 56%No 20%No Opinion 13%No Response 11%
452 out of 510 respondents answered this question
Mobile home ordinances to control location and types ofmobile homes
Yes 63%No 20%No Opinion 9%No Response 8%
472 out of 510 respondents answered this question

41
Sign control ordinance
Yes 44%No 18%No Opinion 26%No Response 12%
449 out of 510 respondents answered this question
Purchase or donation of conservation easements from willing sellersto restrict development
Yes 51%No 18%No Opinion 19%No Response 11%
454 out of 510 respondents answered this question
Preferential tax assessments to owners of important or sensitivelands to discourage inappropriate development
Yes 49%No 24%No Opinion 17%No Response 10%
458 out of 510 respondents answered this question
Q-10 Is the open storage of junk around the town a problem?
Yes 40%No 45%No Response 15%