Embed Size (px)
Citation preview
Town of Chatham 2012
New York State Department of Environmental Conservation
Hudson River Estuary Program
21 South Putts Corners Road
New Paltz, NY 12561
Phone: (845)256-3016 • Fax: (845)255-3649
Website: http://www.dec.ny.gov/lands/4920.html
This summary was completed upon request to provide information to the Town of Chatham for
land use planning and decision-making. It identifies many of the most critical aspects and
locations of the Town’s local water resources based on information available to the New York
State Department of Environmental Conservation (NYSDEC) and the New York State Water
Resource Institute at Cornell University. It should not be considered a complete inventory
because it is based only on existing information gleaned from various complementary, but not
comprehensive, sources.
This Water Resource Summary complements the Habitat Summary from the Biodiversity
Outreach Coordinator of the Hudson River Estuary Program. The summaries compile
information on many natural resources, providing the Town of Chatham one source of useful
information for town land use and planning decisions. Additional general information about
water resources and the state of the waters of the Hudson Valley can be found on NYSDEC’s
webpages, starting with http://www.dec.ny.gov/lands/5098.html. If you have any questions about
this summary, or want to know if it needs to be updated, please contact Andrew Meyer who
works on municipal watershed issues.
Central to the information in this document is the concept of watersheds. A watershed is
all the land that water flows across or under on its way to specific point, such as a river, lake,
stream or bay. Precipitation flows through the landscape into intermittent streams, kills, creeks,
rivers, aquifers, wetlands and floodplains of the Hudson Valley, connecting the landscape to
form the watersheds of the Hudson River estuary and providing many necessities and vital
benefits to human communities. When these water resources are working with functioning and
healthy ecosystems, they deliver clean drinking water, filter pollutants, comprise habitat for
plants and animals, absorb floodwaters, provide numerous recreation opportunities and have
inspired citizens for thousands of years living in the Hudson Valley. Local municipalities have a
critical role to play in restoring and maintaining the waters of the Hudson Valley. To maintain
our water for future generations, impacts to water resources need to be considered in the
local decision-making process.

2
This document was created by NYSDEC Hudson River Estuary Program and New York State Water
Resource Institute at Cornell University. The Hudson River Estuary Program
(http://www.dec.ny.gov/lands/4920.html) protects and improves the historic and scenic Hudson River watershed for
all its residents. The program was created in 1987 and extends from the Federal Dam at Troy to the Verrazano
Narrows. Its core mission is to:
• ensure clean water,
• protect and restore fish and wildlife habitats,
• provide recreation in and on the water,
• adapt to climate change, and
• conserve the scenic landscape.
The Hudson River Estuary Program is a project funded by the NYS Environmental Protection Fund. The New York
State Water Resources Institute at Cornell University (http://wri.eas.cornell.edu/) seeks to foster an understanding of
the critical connections between us and the waters of New York State, and to empower communities to make
informed decisions about land use that minimize impacts to our water resources, including drinking water supplies,
floodplains, and aquatic habitats.

3
............................................................................................................................. 4
................................................................................................ 6
Land Cover........................................................................................................................... 10
Impervious Cover ......................................................................................................... 12
Forest Cover ................................................................................................................. 13
Agricultural Lands ........................................................................................................ 14
Aquifers ................................................................................................................................ 18
Floodplains and Riparian Buffers ....................................................................................... 21
............................................................ 25
Waterbody Classification ..................................................................................................... 25
Waterbody Assessments ....................................................................................................... 29
Lake Assessments ......................................................................................................... 29
Stream Assessments - Biomonitoring ........................................................................... 29
Waterbody Impairment ........................................................................................................ 33
......................................................................................................... 36
Stormwater Management ..................................................................................................... 36
Post-Construction Stormwater M anagement and Green Infrastructure ...................... 37
SPDES Permits and Wastewater ......................................................................................... 39
Dams and other Aquatic Barriers ........................................................................................ 40
............................................................................................... 43
.......................................... 48
Figure 1: Example watershed……………………………………………………..………………6
Figure 2: Greater Stockport Creek Watershed and Subwatersheds………………….…………...8
Figure 3: Subwatersheds in the Town of Chatham ……………………...…………………….…9
Figure 4: Land Cover and Land Use in the Town of Chatham ………….…………..………….15
Figure 5: Impervious Cover and Forest Cover in the Town of Chatham ………..…..…………16
Figure 6: Aquifers in the Town of Chatham………….…………………………….…..……….19
Figure 7: Buffer functions…………………………………………………………………….…22
Figure 8: Stream bank regulation……………………………………………………....………..24
Figure 9: Waterbody Classifications in the Town of Chatham……………………………….....26
Figure 10: Biomonitoring Samples in the Town of Chatham…………………………………...30
Figure 11: Waterbody Impairment in the Town of Chatham……………….…………………...33
Figure 12: Barriers to Aquatic Connectivity in the Town of Chatham……….….….……….….40
4
Table 1: Subwatersheds and land cover/land use in the Town of Chatham, NY ......................... 15 Table 2: Stream and Waterbody Classifications in the Town of Chatham, NY .......................... 27 Table 3: NYSDEC Stream Biomonitoring Unit Data in the Town of Chatham .......................... 30 Table 4: Stream Segments and Impacted Uses in the Town of Chatham .................................... 34
Effective conservation, of which
watershed management is an important
component, occurs across property and
political boundaries and requires a broader
view of natural landscapes. This document
will help to identify areas of your town
where important resources exist and overlap.
This summary is especially useful for setting
priorities that support town planning through
open space plans, comprehensive plans,
natural resource inventories, and for
developing critical environmental areas.
Communities can incorporate their
summaries directly into local plans or use
the information to write their own
documents. This summary goes hand-in-
hand with the Habitat Summary also
provided by the Hudson River Estuary
Program, and together can provide critical
information to local land use decisions.
If used to its fullest potential, a
familiar and objective inventory can make
the development review process faster and
cheaper for all those involved. Though this
summary does not contain the detail needed
for site planning, it is useful for
environmental reviews in several ways.
First, by identifying high-quality water
resources at the town-wide scale, it helps
land use decision-makers and applicants
place a proposed site plan in the context of
the larger watershed. Second, the town can
ask applicants to address how their proposed
actions will affect the water resources
identified in this summary. When town
representatives and applicants identify areas
and issues of concern at the very beginning
of the planning process—before time and
money have been invested in plans that
ultimately need to be changed—the whole
review process can function more smoothly
and quickly. And third, the summary
informs environmental review by
highlighting areas that might need more
detailed assessments. While this summary is
limited to existing information and is
therefore not a substitute for on-the-ground
surveys and assessments, it provides a
starting point for recognizing high-quality
water resources in your town, as well as
water resources that should be considered
for restoration efforts.
This summary is broken up into three
categories: watershed characteristics of the
town, water quality standards and
assessments, and the current status of water
infrastructure in the town. These categories
are broken into several topics. Each topic
begins with a description and an
investigation of potential impacts to our
region’s water quality. Each section then
lists resources that can help municipalities
improve the quality of our water resources.
And lastly, information specifically about
Chatham’s water resources is contained in
blue boxes, for easy navigation. You will
find links throughout this document that will
direct you to internet resources, and there is
a reference section at the end. External
hyperlinks as well as typed websites have
been provided. All mentions of Figures and
Tables are also internally hyperlinked.
Lastly, maps are provided for many of the
topics showing information for the Town of
5
Chatham. When viewed as a pdf, these maps
have layers that can be turned on and off, to
clarify the most important components
depending on the need. The maps are not for
jurisdictional or regulatory purposes; please
contact your local NYSDEC environmental
permits staff with regulatory questions.
Also, please note that some of the water
resources identified in this document are
protected by state or federal programs. We
recommend the town continue to work with
the DEC Region 4 office in Schenectady and
other appropriate agencies on issues
involving regulated resources.
Limitations of the maps in this summary
It is important that users of the maps in this
summary, and users of geographic
information systems (GIS) data in general,
understand the limitations of maps and GIS
information. GIS data originate from many
different sources, produced at different times
and for different purposes. GIS data are
often collected or developed from remote-
sensed information (i.e., aerial photographs,
satellite imagery) or derived from paper
maps. For these reasons, GIS data can
contain all the inaccuracies of the original
data, in addition to any errors from
converting the data to digital GIS
information. Therefore, maps created using
GIS data are not a substitute for surveys and
direct knowledge.
It is also important to emphasize that
this summary contains the most up-to-date
information that is available at the time it
was produced but new information is always
being collected. The datasets contained here
could change in important ways in the
future. However, as this Water Resource
Summary illustrates, using GIS to map
information at the townwide-scale can help
local decision-makers understand potential
impacts, see patterns and relationships in
their communities, and make better
decisions as a result.

6
Figure 1: Watersheds are defined by the land that drains to a particular point in the
landscape and are separated from one another by topographic divides. Smaller sub-
watersheds are nested within larger watersheds.
Watersheds and Subwatersheds
A watershed is all the land that water flows
across or under on its way to a common
point such as a river, lake, stream or bay.
Watersheds are divided by high points on
the land, such as ridges, mountains, and hills
(Figure 1). Management of water resources
are ideally accomplished within a watershed
context. The appropriate watershed scale
changes depending on the land use questions
under consideration. Watershed planning
units can encompass everything from the
small watershed of two intermittent streams
that drain an individual parcel to the much
larger Hudson River watershed, about
13,500 square miles. Both eventually flow
out to the Atlantic Ocean.
Standard watershed
boundaries for the entire US
have been created through the
United States Geologic
Survey’s (USGS’s) National
Hydrography Dataset
(http://nhd.usgs.gov/) in a
nested hierarchy by size.
These regions each have a
Hydrologic Unit Code (HUC),
and in this summary we use
size 12 HUC subwatershed
boundaries (delineated to
encompass under 40,000
acres, about 60 square miles,
each). These HUC 12
subwatersheds are the finest-
scale data available for New York State
through the USGS. They can be the most
useful watershed units for municipalities
because they often match the scale of the
potential impacts and the authority of towns
to eliminate or mitigate them.
There is a very strong relationship
between land use and water quality in our
streams, wetlands, and waterbodies. Land
and water are connected through the
interactions of water, sediment, organisms,
and chemical components. Healthy
watersheds, including both land and
water resources, can recharge
groundwater, reduce erosion and flooding
impacts, minimize public infrastructure
and water treatment costs, and be more
resilient to climate change—all ecosystem
services that directly benefit our
communities and cost less than the
alternatives (See
http://water.epa.gov/polwaste/nps/watershed
/ecoben_factsheet.cfm for more
information).
7
A watershed is “that area
of land, a bounded
hydrologic system, within
which all living things are
inextricably linked by
their common water
course and where, as
humans settled, simple
logic demanded that they
become part of a
community.”
-John Wesley Powell-
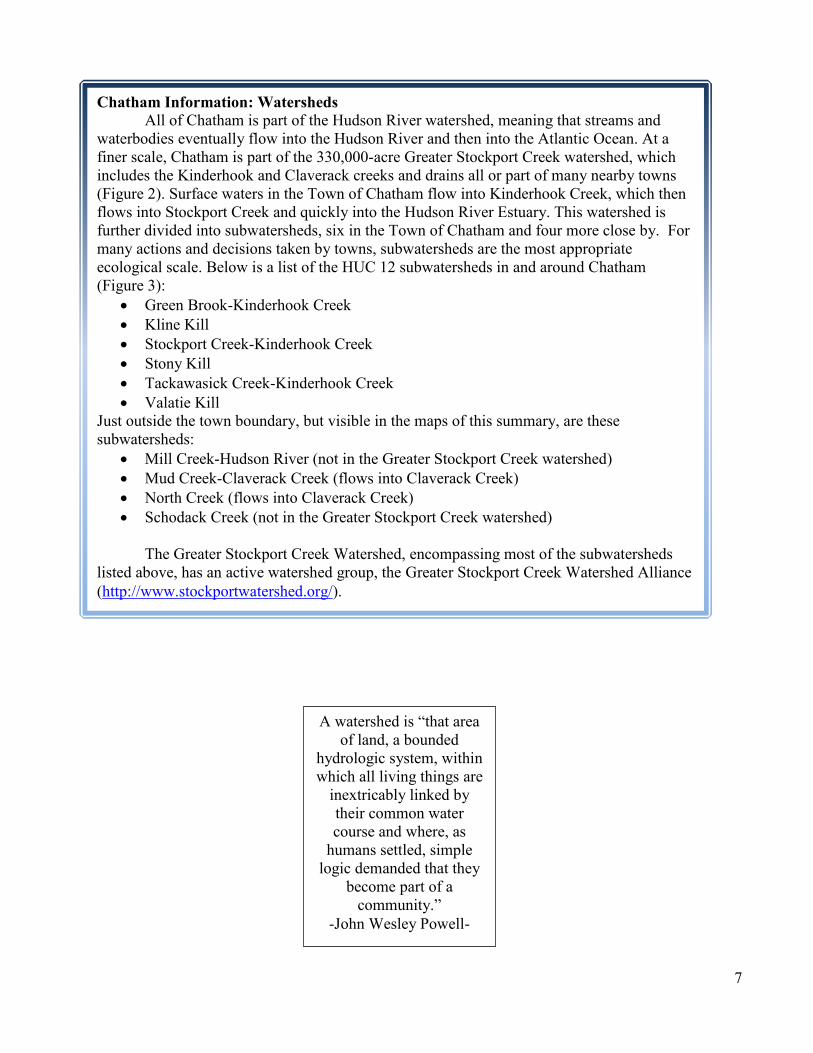
Chatham Information: Watersheds
All of Chatham is part of the Hudson River watershed, meaning that streams and
waterbodies eventually flow into the Hudson River and then into the Atlantic Ocean. At a
finer scale, Chatham is part of the 330,000-acre Greater Stockport Creek watershed, which
includes the Kinderhook and Claverack creeks and drains all or part of many nearby towns
(Figure 2). Surface waters in the Town of Chatham flow into Kinderhook Creek, which then
flows into Stockport Creek and quickly into the Hudson River Estuary. This watershed is
further divided into subwatersheds, six in the Town of Chatham and four more close by. For
many actions and decisions taken by towns, subwatersheds are the most appropriate
ecological scale. Below is a list of the HUC 12 subwatersheds in and around Chatham
(Figure 3):
Green Brook-Kinderhook Creek
Kline Kill
Stockport Creek-Kinderhook Creek
Stony Kill
Tackawasick Creek-Kinderhook Creek
Valatie Kill
Just outside the town boundary, but visible in the maps of this summary, are these
subwatersheds:
Mill Creek-Hudson River (not in the Greater Stockport Creek watershed)
Mud Creek-Claverack Creek (flows into Claverack Creek)
North Creek (flows into Claverack Creek)
Schodack Creek (not in the Greater Stockport Creek watershed)
The Greater Stockport Creek Watershed, encompassing most of the subwatersheds
listed above, has an active watershed group, the Greater Stockport Creek Watershed Alliance
(http://www.stockportwatershed.org/).

Hous
aton ic
River
Wy n ants Kill
Potic
Cr
Stony Kill
Vloman Kil l
Valat
ie Kil lK line Kill
Hannacrois Cr
North
Cr
West BkBlack River
Taghkanic Cr
Green River
One squethaw Cr
Indian Cr
Vl o ck ie Kill
Sawy
erKil
l
Coxsack
ie Cr
Pu n sit Cr
Sh in gleKil
l
Normans Kill
Klein Kill
Agawam uck Cr
Black Bk
Fox Cr
Wyoman ockCr
Bash
bish Bk
Frisbee Cr
Green BkStu
yvesant Bk
Kaaterskill Cr
Catskill Cr
Moordener Kill
Roeliff Jansen Kill
Clave
rack C
r
Kinder
hook C
reek
Tack
awas
ick C
r
Eightm
ile C
r
Beaver K
ill
Figure 2: Th e Grea ter Sto ckpo rt Creek Wa tersh ed, Subw a tersh edsa nd Ma jo r Strea m s in th e To w n o f Ch a th a m , Co lum bia Co unty, NY
³0 3 61.5 Miles
Th is m a p sh o w s strea m s a nd w a tersh eds in a nd a ro und th e To w n o f Ch a th a m , Co lum bia Co unty. Subw a tersh ed a re sh o w n a s w ell a s th e o utline o f th e Grea ter Sto ckpo rt Creek w a tersh ed. Th is m a p w a s pro duced a s pa rt o f a Wa ter Reso urce Sum m a ry fo r th e To w n. Fo r m o re info rm a tio n, plea se co nta ct NYSDEC's Hudso n River Estu a ry Pro gra m w a tersh ed specia lists a t (845) 256‐3016.
Data Sources: No rth ea st Aqua tic Ha bita t Cla ssifica tio n System (EPA, USGS, a nd TNC) (2010) fo r Ma ssa ch usetts strea m sUSGS Na tio na l Hydro gra ph y Da ta set fo r New Yo rk strea m s a nd a ll Hydro lo gic Unit Co de 10 w a tersh ed a nd 12 subw a tersh eds (2008)
Ma p Crea ted 2012
Water Resource Instituteof New York State
1:380,000
§̈¦I-87
§̈¦I-90
LegendMajor streamInterstate or ParkwayTown of ChathamVillage boundaryTown boundaryCounty boundaryGreater Stockport Creek Watershed
1TSP

Stony Kill
Kline Kill
Valatie Kill
Green Brook-Kinderhook Creek
Stockport Creek-Kinderhook Creek
Schodack Creek
Tackawasick Creek-Kinderhook Creek
Mud Creek-Claverack Creek
Mill Creek-Hudson River
North Creek
State Route 66S tony Ki ll
Ind ian CrKlineKill
Gre en B k
Valatie Kill
Frisbee Cr
Kinderhook
Creek
State Route 203
State Hwy 295
Fig ure 3: Subw atersh eds in th eTow n of Ch ath am, Columbia Coun ty, NY
³0 1 20.5 Miles
Th is map sh ow s streams, w aterbodies an d w atersh eds in an d aroun d th e Tow nof Ch ath am, Columbia Coun ty. Subw atersh ed boun daries are sh ow n . Due to limitation s of th e available data, man y in termitten t an d some p eren n ial streams are missin g .Th is map w as p roduced as p art of a Water Resource Summary for th e Tow n . For more in formation , p lease con tact NY SDEC's Hudson River Estuary Prog ram w atersh ed sp ecialists at (845) 256‐3016.
Data Sources: USGS Nation al Hydrog rap h y Dataset for streams an d w aterbodies an d Hydrolog ic Un it Code 12 subw atersh eds (2008)NY S Office of CSCIC (2011) for road data
Map Created 2012
LegendMinor streamMajor streamInterstate or ParkwayUS, State, and County RoadsLocal StreetsTown of ChathamCounty boundaryVillage boundaryTown boundaryGreen Brook-Kinderhook CreekKline KillMill Creek-Hudson RiverMud Creek-Claverack CreekNorth CreekSchodack CreekStockport Creek-Kinderhook CreekStony KillTackawasick Creek-Kinderhook CreekValatie Kill
1TSP
Water Resource Instituteof New York State
§̈¦I-90
10
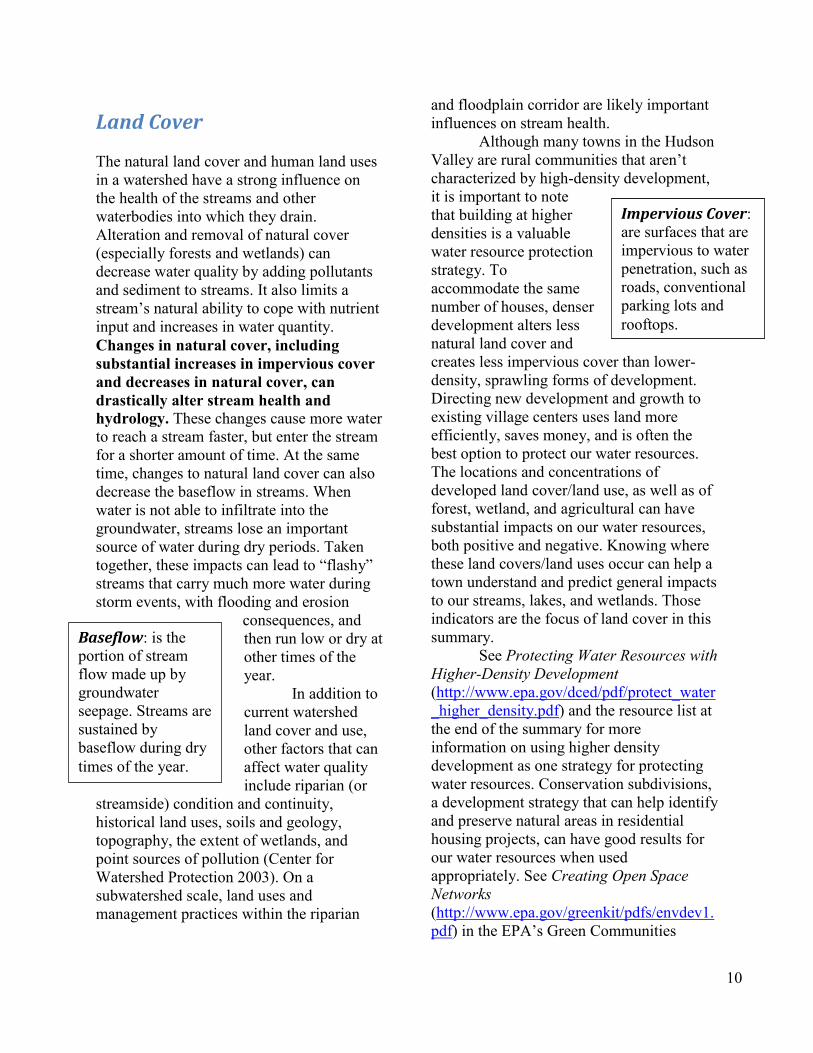
Impervious Cover:
are surfaces that are
impervious to water
penetration, such as
roads, conventional
parking lots and
rooftops.
Baseflow: is the
portion of stream
flow made up by
groundwater
seepage. Streams are
sustained by
baseflow during dry
times of the year.
Land Cover
The natural land cover and human land uses
in a watershed have a strong influence on
the health of the streams and other
waterbodies into which they drain.
Alteration and removal of natural cover
(especially forests and wetlands) can
decrease water quality by adding pollutants
and sediment to streams. It also limits a
stream’s natural ability to cope with nutrient
input and increases in water quantity.
Changes in natural cover, including
substantial increases in impervious cover
and decreases in natural cover, can
drastically alter stream health and
hydrology. These changes cause more water
to reach a stream faster, but enter the stream
for a shorter amount of time. At the same
time, changes to natural land cover can also
decrease the baseflow in streams. When
water is not able to infiltrate into the
groundwater, streams lose an important
source of water during dry periods. Taken
together, these impacts can lead to “flashy”
streams that carry much more water during
storm events, with flooding and erosion
consequences, and
then run low or dry at
other times of the
year.
In addition to
current watershed
land cover and use,
other factors that can
affect water quality
include riparian (or
streamside) condition and continuity,
historical land uses, soils and geology,
topography, the extent of wetlands, and
point sources of pollution (Center for
Watershed Protection 2003). On a
subwatershed scale, land uses and
management practices within the riparian
and floodplain corridor are likely important
influences on stream health.
Although many towns in the Hudson
Valley are rural communities that aren’t
characterized by high-density development,
it is important to note
that building at higher
densities is a valuable
water resource protection
strategy. To
accommodate the same
number of houses, denser
development alters less
natural land cover and
creates less impervious cover than lower-
density, sprawling forms of development.
Directing new development and growth to
existing village centers uses land more
efficiently, saves money, and is often the
best option to protect our water resources.
The locations and concentrations of
developed land cover/land use, as well as of
forest, wetland, and agricultural can have
substantial impacts on our water resources,
both positive and negative. Knowing where
these land covers/land uses occur can help a
town understand and predict general impacts
to our streams, lakes, and wetlands. Those
indicators are the focus of land cover in this
summary.
See Protecting Water Resources with
Higher-Density Development
(http://www.epa.gov/dced/pdf/protect_water
_higher_density.pdf) and the resource list at
the end of the summary for more
information on using higher density
development as one strategy for protecting
water resources. Conservation subdivisions,
a development strategy that can help identify
and preserve natural areas in residential
housing projects, can have good results for
our water resources when used
appropriately. See Creating Open Space
Networks
(http://www.epa.gov/greenkit/pdfs/envdev1.
pdf) in the EPA’s Green Communities
11
Chatham Information: Land Use and Land Cover
Figure 4 shows land use/land cover data within the Town of Chatham from the National
Land Cover Database (NLCD). Much of the town is agricultural (including areas with
cultivated crops and pasture/hay) or forested, with low-intensity development in many
places. The location of various land uses in relation to streams or lakes can be significant for
water quality. For example, development adjacent to a stream or near sensitive waterbodies
can lead to water quality impacts. For a summary of land cover and land use by
subwatershed and for the town as a whole, see Table 1. Town of Chatham code requires
conservation subdivisions as the standard practice for major subdivisions and or on parcels
greater than 50 acres seeking subdivision into three or more parcels.
The Columbia County Hazard Mitigation Plan (http://www.columbiacountyny.com/
documents/misc/columbia_hazard_mitigation_plan.pdf) notes that almost every town in the
County is losing farmland and forests to residential and commercial uses. The Town of
Chatham identified farmland-to-residential development as the overarching trend in the
town. Residential development in former agricultural areas could be leading to a number of
impacts to the habitats and water resources of the town commonly associated with sprawling
forms of development, including habitat fragmentation, alteration of perennial and
intermittent stream channels, water quality issues, loss or shrinking of riparian and wetland
buffers, and others. See resources above for techniques to help address these impacts.
toolbox
(http://www.epa.gov/greenkit/index.htm) for
more information. Another important tool to
minimize impacts from loss of natural cover
and increases in impervious cover is the use
of green infrastructure practices; see the
Green Infrastructure section below. See the
accompanying Habitat Summary for more
discussion on minimizing impacts from
development to our habitats and water
resources.
Information on land cover and land
use comes from the National Land Cover
Dataset (NLCD, http://www.mrlc.gov/),
which contains land cover and land use
information for the entire United States.
There are important limitations to the
NLCD; please see the Appendix 1 for more
information on the NLCD data. Used in an
appropriate manner, the land cover/land use
data can be a useful tool to understand
patterns of land use in towns and to identify
areas of concern where land use could be
impacting our water resources.

12
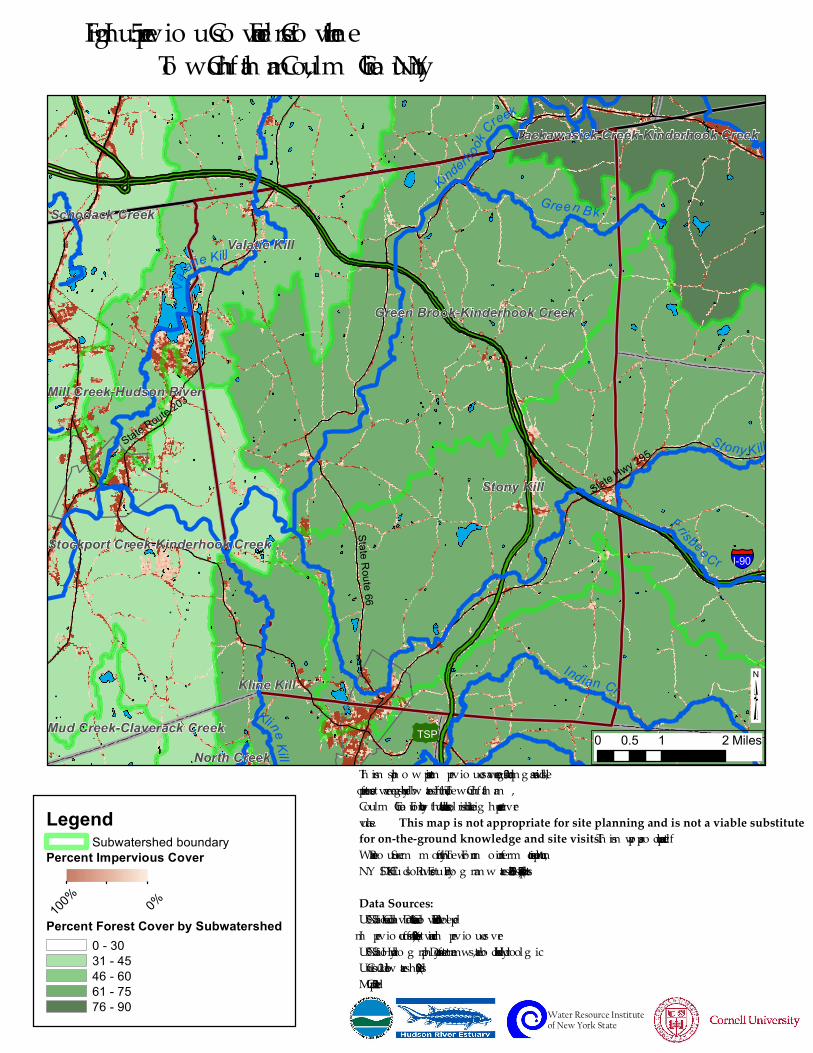
Chatham Information: Impervious Cover
As a whole, the Town of Chatham does not have high impervious surface cover
(Table 1). Of the watersheds shown in Figure 3, the Stockport Creek-Kinderhook Creek
subwatershed has the highest average impervious cover, at 3.5%. Impervious cover could
still be of concern in certain localized areas, such as in the Village of Chatham or around
Kinderhook Lake and Smith Pond (Figure 5; also see the section below on Waterbody
Impairment and Table 4). When impervious cover amounts are relatively small, as they are in
Chatham, other factors such as riparian condition, forest and wetland cover, agriculture, and
point-sources of pollution become most important for addressing watershed-scale water
quality issues.
Impervious Cover Impervious surfaces are places where
precipitation can’t infiltrate into the soil and
recharge groundwater, resulting in increases
in stormwater runoff. Conventional roofs,
parking lots, driveways, sidewalks, and
roads are common impervious surfaces.
Impervious surface cover can be used as a
proxy for development within a watershed to
look for associated changes to water quality.
Research has found that increases in
impervious cover are linked to degradation
in water quality and aquatic habitat value
and an increase in flooding problems (Walsh
et al. 2005).
While the location and configuration
of impervious surfaces in a watershed are
significant, research strongly suggests that a
critical threshold of impervious cover (often
about 10%) exists beyond which the
probability of stream degradation is greatly
increased (National Research Council 2008,
Walsh et al. 2005). And, in research
undertaken in several small Dutchess
County watersheds, impacts to nutrient
levels in streams have been found when
watersheds are less than 5% impervious
(Cunningham et al 2009). In the Hudson
Valley, impacts associated with impervious
cover, such as urban/storm runoff and
municipal discharges, are a leading cause of
impairment to our streams and lakes (Bureau
of Watershed Assessment and Management,
Division of Water, NYSDEC 2008). For
more information on these impacts see the
Waterbody Impairment section in this
summary. For more information on
stormwater, see the Water Infrastructure
section.
On a site-specific scale, there are
many actions that can be taken by
homeowners and developers and encouraged
by planning boards to minimize impervious
cover and promote best stormwater
management practices. See Protection
Water Quality with Smart Growth Strategies
and Natural Stormwater Management in
Sussex County, Delaware
(http://www.epa.gov/dced/pdf/
2009_0106_sussex_county.pdf) for a good
introduction to site-specific actions for
minimizing impervious cover. See Appendix
1 for information on areas that have
collected fine-scale impervious cover
information.

13
Chatham Information: Forest Cover
Table 1 shows forest cover by subwatershed, which ranges from 42% to 83% in and
around the Town of Chatham (see also Figure 3). The importance of large forests, the
landscape context of forests, forest quality, and the value of forests for rare species are all
addressed in the accompanying Habitat Summary.
Clear-cutting in Chatham could be subject to NYSDEC permitting authority if it is
within the 100 foot setback of a state-regulated wetland, though firewood collection and
selective cutting do not need permits in this zone. Also, clear-cutting is subject to a
Stormwater Pollution Discharge Elimination System (SPDES) general permit if it disturbs
more than one acre, though on-going silviculture with a forest management plan is exempt.
For general harvesting info see http://www.dec.ny.gov/lands/5242.html, and for more
detailed information on timber harvesting and NYSDEC permits, see the stormwater permit
frequently asked questions (http://www.dec.ny.gov/docs/water_pdf/constrfaq.pdf). For more
information on stormwater pollution prevention plans (SWPPPs), see the Stormwater
Management section of this summary. Permits may also be required from the NYSDEC
and/or the Army Corps of Engineers for stream crossings.
For guidance on the regulation of specific sites, contact the NYSDEC for the most
precise information. For the Town of Chatham, Steven Swenson (1-607-652-2645,
stswenso@ gw.dec.state.ny.us) is the NYSDEC biologist responsible for state regulation in
the protection of surface water resources.
Forest Cover Forests are one of the most beneficial land
covers in our region for many reasons, and
their benefits to our water resources are well
established. Conserving and managing
forests are necessary to provide clean
drinking water for us and future generations
and critical habitat for numerous plants and
animals. Research has shown that
watersheds with greater percentages of
forest cover can save significant drinking
water treatment costs. For more information,
see an Environmental Protection Agency
(EPA) fact sheet on the economic benefits of
healthy watersheds (http://water.epa.gov
/polwaste/nps/watershed/upload/economic_b
enefits_factsheet3.pdf).
More information on the value of
local forests can be found in the Habitat
Resource Summary. Helpful resources to
guide forest management for water quality
benefits include the Center for Watershed
Protection’s Watershed Forestry Resource
Guide (http://www.forestsfor
watersheds.org/forests-and-drinking-water/),
which offers a summary of projects that
explore links between forest cover and
economic benefits to our communities. The
NYSDEC Division of Lands and Forests’
Forest Stewardship Program
(http://www.dec.ny.gov/lands/45934.html)
provides technical assistance and resources
to private forest owners to guide them in
their use and management of forest lands.
Cornell Cooperative Extension’s Forest
Connect (http://www2.dnr.cornell.edu/ext
/forestconnect/) website also offers valuable
information, geared to private forest owners
and elected officials. The Municipal
Official’s Guide to Forestry in New York
State
(http://www2.dnr.cornell.edu/ext/info/pubs/
management/MunicipalOfficialsGuide
ToForestry.pdf) provides a useful guide to
promoting healthy forestry through local
planning and zoning efforts.

14
Chatham Information: Agricultural Lands
In the Town of Chatham, subwatersheds vary from 6% to 36% agricultural land cover
(see Table 1), including pasture/hay and cultivated crops (NLCD 2006). Agricultural
practices may be negatively affecting streams and waterbodies in Chatham’s subwatersheds
(see the section below on Waterbody Impairment and Table 3), but agricultural impacts to
our waters are very dependent on the individual management of farms, so outreach to local
farmers involving best management practices has an important role in improving water
quality.
Thousands have lived
without love, not one
without water.
-W.H. Auden-
Agricultural Lands Farms are a critical part of our communities
and have many economic and social
benefits. However, agriculture is also one of
the biggest sources of impacts to water
quality in the Hudson River Estuary
watershed (Bureau of Watershed
Assessment and Management, Division of
Water, NYSDEC 2008), and together with
urban/storm runoff, accounts for more than
two-thirds of the impacts to our streams.
Farms can impact streams by contributing
nutrients, pesticides, sediment and bacteria
to streams, or by altering stream flow. The
effects of agriculture on streams can be
managed through best management practices
that reduce soil erosion and fertilizer and
pesticide applications, which can make their
way to our streams and other waterbodies.
For information on minimizing the
impacts of agricultural land uses to our
streams, local resources include the
Columbia County Soil and Water
Conservation District
(http://www.ccswcd.org/) and the USDA-
Natural Resources Conservation Service
(http://www.ny.nrcs.usda.gov). The
Farmscape Ecology Program
(http://hawthornevalleyfarm .org/fep/),
based in Ghent, NY, provides many sources
of information about agricultural ecology
and on-farm biodiversity. Also, the
Agricultural Environmental Management
(http://www.nys-
soilandwater.org/aem/index.html) program
of the NYS Soil and Water Conservation
Committee is an incentive-based program
that assists farmers with common-sense,
cost-effective and science-based decisions to
help farms meet their business needs and
conserve the State’s natural resources.

15
The health of our waters is
the principal measure of
how we live on the land.
-Luna Leopold-
Table 1: Subwatersheds and land cover/land use in the Town of Chatham, NY
Subwatershed Area
(square
miles)
Impervious Surface
(%) (mean %
imperviousness of each
pixel)
Forest Cover
(%)
Agricultural lands
(%) (including pasture/hay
and cultivated crops)
Green Brook-
Kinderhook Creek 30 1.0% 63% 23%
Kline Kill 39 1.0% 63% 27%
Stockport Creek-
Kinderhook Creek 25 3.5% 42% 36%
Stony Kill 43 1.6% 65% 20%
Tackawasick
Creek-Kinderhook
Creek
50 0.7% 83% 6%
Valatie Kill 40 2.2% 52% 22%
Average for the
Town of Chatham 54 1.5% 54% 30%

S tony Kill
Ind ian Cr
Valatie K ill
KlineKill
Gre en B k
Frisbee Cr
Kinderhook C
reek
North
Cr
State Route 66State Route 203
State Hwy 295
Fig ure 4: Lan d Co ve r an d Lan d U se , in cludin g Fo re sts, Ag riculture ,an d Impe rvio us Co ve r, To w n o f Chatham, Co lumbia Co un ty, NY
³0 1 20.5 Miles
This map sho w s stre ams, an d lan duse /lan dco ve r data fo r the To w n o f Chatham, Co lumbia Co un ty. Lan duse an d lan dco ve r in fo rmatio n is n o t appro priate fo r site scale plan n in g . This map w as pro duce d as part o f a Wate r Re so urce s Summary fo r the To w n . Fo r mo re in fo rmatio n , ple ase co n tact NYSDEC's Hudso n Rive r Estuary Pro g ram w ate rshe d sp e cialists at (845) 256‐3016.
Data Sources: U SGS Natio n al Hydro g raphy Datase t (2008) fo r stre amsU SGS Natio n al Lan dco ve r Database (2006) fo r lan d use an d lan d co ve r data
Map Cre ate d 2012
§̈¦I-90
1TSP
Water Resource Instituteof New York State
LegendMajor streamMinor streamTown of Chatham
NLCD Landcover (2006)Open WaterDeveloped, Open SpaceDeveloped, Low IntensityDeveloped, Medium IntensityDeveloped, High IntensityBarren Land (Rock/Sand/Clay)Deciduous ForestEvergreen ForestMixed ForestShrub/ScrubGrassland/HerbaceousPasture/HayCultivated CropsWoody WetlandsEmergent Herbaceous Wetlands
Stony Kill
Kline Kill
Valatie Kill
Green Brook-Kinderhook Creek
Schodack Creek
Stockport Creek-Kinderhook Creek
Tackawasick Creek-Kinderhook Creek
Mud Creek-Claverack Creek
Mill Creek-Hudson River
North Creek
St ony K ill
Ind ian CrKlineKill
Gre en B k
Valatie Kill
Frisbee Cr
Kinderhook
Creek
State Route 66State Route 203
State Hwy 295
Fig ure 5: Im pervio us Co ver and Fo rest Co ver in th eTo w n o f Ch ath am , Co lum bia Co unty, NY
³0 1 20.5 Miles
Th is m ap sh o w s percent im pervio us co ver, averag ed in 30sq m g rids, as w ell as percent fo rest co ver averag ed by subw atersh ed, fo r th e To w n o f Ch ath am , Co lum bia Co unty. Fo r bo th datasets, darker co lo rs indicate h ig h er percent co ver values. This map is not appropriate for site planning and is not a viable substitute for on-the-ground knowledge and site visits. Th is m ap w as pro duced as part o f a Water Reso urce Sum m ary fo r th e To w n. Fo r m o re info rm atio n, please co ntact NY SDEC's Hudso n River Estuary Pro g ram w atersh ed specialists at (845) 256‐3016.
Data Sources: USGS Natio nal Land Co ver Database Land Co ver and Percent Develo ped Im pervio usness (2006) fo r fo rest co ver and im pervio us co verUSGS Natio nal Hydro g raph y Dataset fo r stream s, w aterbo dies and Hydro lo g ic Unit Co de 12 subw atersh eds (2008)Map Created 2012
LegendSubwatershed boundary
Percent Impervious Cover
100% 0%
Percent Forest Cover by Subwatershed0 - 3031 - 4546 - 6061 - 7576 - 90
§̈¦I-90
1TSP
Water Resource Instituteof New York State

18
Chatham Information: Aquifers (USGS)
Figure 6 shows two classes of known, mapped aquifers, which differ in the yield
associated with each class. Chatham has both high- and medium-yield aquifers that supply
water for both people and streams (Figure 6). Chatham has over 1,700 acres of high-yield
and 8,500 acres of mid-yield aquifers. Certain land uses are inappropriate in areas that have
been identified as important to a community’s drinking water supply, and towns should seek
to site potentially harmful land uses in the least sensitive areas. Many streams in Chatham,
including the Kinderhook, Valatie Kill, Stony Kill, Kline Kill and Indian Creek are underlain
by aquifers, making development choices along streams even more important to the Town.
A more detailed analysis than what we provide here is required to identify more
specific potential threats to Chatham’s aquifers and groundwater resources.
Aquifers
Aquifers are saturated underground areas
that can yield usable amounts of water to
wells and springs. Many Hudson Valley
communities depend on drinking water
extracted from aquifers, both through
municipal and private wells. Aquifers are
critically important water resources for
present and future generations who will need
continued access to clean water.
Groundwater, which includes aquifers and
other underground water, is particularly
important during dry periods of the year
because it can be a constant source of water
moving into our streams and rivers.
Aquifers can become polluted in
many ways, including unintentional
chemical spills, intentional addition of
chemicals to the landscape, as well as
improperly spaced or poorly functioning
septic systems. Unsustainable aquifer
extraction and consumption that exceeds
recharge can result in wells running dry,
with the associated expense of digging
deeper wells or buying water. Excessive
extraction can also harm aquatic organisms
by changing the stream flows and water
temperatures they rely on for survival and
successful reproduction.
An overlay district is one form of
aquifer protection that can come from a
municipality. A district can help protect
aquifers in a number of ways, including
setting up buffer requirements around wells,
requiring maintenance of wastewater
treatment facilities, including septic systems,
and identifying appropriate land uses in
aquifer recharge areas. Examples of
municipal aquifer protection in New York
are gathered in PACE Land Use Law
Center’s Gaining Ground database
(http://landuse.law.pace.edu/SPT--
BrowseResources.php?ParentId=410).
Aquifer protection should be tailored to
local needs. Contact a watershed specialist
to help you navigate this resource.
USGS Aquifer Maps Aquifers in the state were mapped by
the USGS in partnership with the NYSDEC.
Because the scale of the original aquifer
maps is 1:250,000, these maps indicate only
the general location of the unconsolidated
aquifers; they are not intended for detailed
site evaluations. See Appendix 1 for more
information on the USGS aquifer maps.
Other Sources Sources of data for groundwater
information also include: well reports,
published groundwater studies, unpublished
consultant reports, well constructors, county
health departments, and source water
assessment reports. In addition, the
organizations listed below can provide
valuable information and services for
protecting aquifers and other groundwater

19
Chatham Information: Aquifers
Chatham has been working with the New York Rural Water Association to get more
detailed information on groundwater and aquifers in the town. This process is still underway.
For more information on this project, contact Steven Winkley, Water Resource Specialist at
the New York Rural Water Association ([email protected]).
When the well is dry, we
know the worth of water
-Benjamin Franklin-
resources.
Groundwater quality monitoring in
New York State is done through a
partnership between the NYSDEC Division
of Water and the USGS. The Ambient
Groundwater Monitoring Program
(http://www.dec.ny.gov/lands/36117.html)
seeks to assess and report on the quality of
the state’s groundwater, identify long-term
groundwater quality trends, characterize
naturally occurring conditions, and establish
an initial statewide comprehensive
groundwater quality baseline. The Lower
Hudson River drainage basin (which
includes the Town of Chatham) is
undergoing a study over the next three years.
Contact Scott Kishbaugh
([email protected]) for more
information on the program or the locations
of their groundwater quality sampling.
Dutchess County’s Waste and
Wastewater Authority recently
commissioned a countywide aquifer
recharge rate analysis. In Dutchess, the rates
can be used to calculate sustainable septic
densities, helping to prevent aquifers from
becoming contaminated through septic
outflow that is too dense. The report,
Dutchess County Aquifer Recharge Rates &
Sustainable Septic System Density
Recommendations, can be found at:
http://www.co.dutchess.ny.us/CountyGov/D
epartments/Planning/16891.htm and is a
useful document for towns that are
interested in starting a similar process.
The New York Rural Water
Association (http://www.nyruralwater.org/)
is a not-for-profit organization that helps
public and private rural water and
wastewater systems provide safe drinking
water and protect the environment at an
affordable cost to the user. They can help
communities identify areas where
groundwater protection is appropriate, look
for potential conflicts between land use and
groundwater resources, address wellhead or
groundwater protection plans, assess
wastewater treatment systems, and offer
many other services. Contact them (Phone:
518-828-3155 Email:
[email protected]) for information
on conducting a finer-scale analysis of your
community’s aquifer and groundwater
resources.

State Route 66S tony Kill
Ind ian Cr
Valatie K ill
KlineKill
Gre en B k
Frisbee Cr
Kinderhook Creek
State Route 203
State Hwy 295
Fig ure 6: Aquife rs in theTow n of Chatham , Colum bia County, NY
³0 1 20.5 Miles
This m ap show s stre am s, w ate rbodie s and k now n aquife rs for the Tow n of Chatham ,Colum bia County. Aquife rs w e re de fine d as "Hig h Y ie ld" (>100 g pm ) and as "Mid Y ie ld (10 to 100 g pm ). Aquifers were mapped at a very course scale(1:250,000) and are for general information only; this map should not be used at the site plan scale. This m ap w as produce d as part of a Wate r Re source s Sum m ary for the Tow n. For m ore inform ation, ple ase contact NY SDEC's Hudson Rive r Estuary Prog ram w ate rshe d spe cialists at (845) 256‐3016.
Data Sources: NY SDEC Bure au of Wate r Re source s Manag e m e nt (2008) for aquife r dataU SGS National Hydrog raphy Datase t (2008) for stre am s and w ate rbodie s
Map Cre ate d 2012
LegendMinor streamMajor stream
Main Unconsolidated Aquifers (1:250,000)Unconfined, High YieldUnconfined, Mid Yield
§̈¦I-90
1TSP
Water Resource Instituteof New York State

21
Floodplain regulation: Local
governments are the
primary enforcer of
floodplain
regulations
Floodplains and Riparian Buffers
Floodplains and riparian buffers provide
many critical functions for a healthy stream
and its watershed. Successful stream
management done at a watershed scale
needs to include the condition and
connection of a stream to its floodplain and
shoreline. Life at the Water’s Edge: Living
in Harmony With Your Backyard Stream
(http://www.epa.gov/ecopage/aquatic/
lifedge.pdf) is an accessible document for
private property owners that address
floodplains, buffers, and other stream
management concepts. CatskillStreams.org
is a useful website for information on stream
stewardship, and links to many other
projects dealing with connections between
streams and watersheds. The Chemung
County Soil and Water Conservation
District created a very useful document that
provides an overview of streams and stream
processes in a watershed context. The
document, Stream Processes, A Guide to
Living in Harmony with Streams (Chemung
County Soil and Water Conservation
District 2006), can be found on the
Chemung County Soil and Water
Conservation District
(http://www.chemungcountyswcd.com/)
website, under stream guide.
Floodplains
Floodplains are low-lying areas, often next
to streams and rivers that are inundated
when there are heavy precipitation or snow
melt events. Floodplains are naturally
connected to streams, but they can extend
far from their stream or river and don't
necessarily have to be alongside streams.
Flooding is a natural process, and is one way
that a stream reacts to an increase in water
coming into the stream. Streams of all sizes
can have floodplains at various locations
along its length; the total size, distance from
the stream, and connection to streams can
vary greatly with topography and other local
conditions. Floodplains perform many
important functions:
prevention of erosion,
habitat for wildlife,
temporary storage of floodwaters,
moderation of peak flows,
maintenance of water quality,
recharge of groundwater,
recreational opportunities,
and aesthetic benefits.
When left in a natural state,
floodplains act as a type of natural
infrastructure, providing a safety zone
between people and the damaging waters of
a flood. Building in floodplains increases the
risk of property damage and loss of life. The
locations of floodplain boundaries can
change over time and in response to
changing weather patterns, changes in land
use in and around the floodplain and in the
surrounding watershed, obstructions in the
floodway, stream projects (including dams
and levees), and natural stream processes.
The Federal Emergency
Management Administration (FEMA) has
developed detailed floodplain maps for the
National Flood Insurance Program
(http://www.fema.gov/national-flood-
insurance-program). These Flood Insurance
Rate Maps (FIRM) maps show areas that are
estimated to have a one percent chance or
greater probability of the being inundated in
any given year (commonly referred to as the
100-year flood). Areas with 0.2% chance of
flooding in a given year (500-year flood) are
also included in
FIRM maps. While
these maps can
provide a valuable
planning tool, it is
important to note
that FIRM maps are

22
Chatham Information: Floodplains
Based on FIRM maps, 5.3% of Chatham is within a 100-year floodplain and 5.5% is
within a 500-year floodplain. Columbia County Multi-Jurisdictional Hazard Mitigation Plan
(http://www.columbiacountyny.com/documents/misc/columbia_hazard_mitigation_plan.pdf)
identifies 45 properties (43 residences and 2 commercial) and 4 critical infrastructures sites
at risk for flood damage in Chatham, representing over $159 million dollars in possible flood
related losses. The most current FIRM maps that cover the Town of Chatham have effective
dates between 1982 and1993. FEMA has recently updated many flood hazard maps across
the country to reflect physical changes in floodplains, new data, and modeling capabilities.
However, at the time of this writing, no update has been scheduled for Columbia County. An
overview map of floodplains in Chatham is available at: http://chathamnewyork.us/wp-
content/uploads/2012/06/4-WaterFeatures1.pdf. FEMA data is available at
http://www.fema.gov/national-flood-insurance-program/map-service-center (see Map
Service Center link).
Riparian: describes
the ecosystems that
occur along a water
body, the
transitional area
influenced by the
land and water.
only estimates based on the data and
modeling technology available at the time of
mapping. Due to the unpredictable nature of
some kinds of floods, maps also don't show
many areas subject to flooding from
localized drainage problems including
undersized culverts, ice jams, or sheet
flooding down a slope.
Communities that adopt floodplain
management ordinances in accordance with
FEMA guidelines can qualify for federal
flood insurance and many different kinds of
disaster assistance. FEMA requires that local
laws for flood damage prevention contain
specific standards for any development in
federally mapped Special Flood Hazard
Areas (generally this is the 100-year
floodplain). In partnership with federal and
local governments, NYSDEC’s Bureau of
Dams and Flood
Protection provides
technical assistance
to communities for
the administration of
local floodplain
regulations, including
a model local law for
flood damage protection. More information
is available at
http://www.dec.ny.gov/lands/24267.html or
contact the Bureau at 518-402-8185 or

23
Riparian Buffers:
Riparian areas include streambanks,
lakeshores, wetlands, and floodplains. A
riparian buffer, also known as stream buffer,
is the vegetated area between a waterbody
and human activity, often used to protect the
stream from various detrimental influences.
A healthy, vegetated riparian buffer helps
improve stream health and water quality by:
filtering and slowing pollution
runoff,
preventing soil erosion,
providing upland habitat,
contributing essential nutrients to the
food chain,
providing woody debris for in-stream
habitat,
and shading the stream to keep water
temperatures down.
Buffers can also help absorb and
slow flood waters to protect human life and
property. Varying buffer widths provide
differing functions to support human needs
and the ecosystem (see Figure 7). We
recommend at least a 300-foot buffer for
streams. Narrower buffers could still provide
viable functions and critical protections, and
wider buffers could still be very important to
habitat connectivity and other wildlife
concerns. Protecting existing buffers and
restoring degraded ones can help protect
streams.
Municipalities can protect buffers
and floodplains by enacting local
watercourse buffer ordinances and
conservation overlays, and implementing
buffer and floodplain protections through
State Environmental Quality Reviews
(SEQR). Municipalities can also encourage
property landowners to allow native trees,
shrubs and vegetation to grow along
streams. More information on these
techniques is available in the NYSDEC
Handbook: Conserving Natural Areas and
Wildlife in Your Community: Smart Growth
Strategies for Protecting the
Biological Diversity of New
York's Hudson River Valley
(http://www.dec.ny.gov
/lands/50083.html). The
Hudson Estuary Trees for
Tribs (http://www.dec.ny.gov
/lands/43668.html) program
provides free native trees and
shrubs and technical assistance
for replanting riparian areas. In
agricultural areas, the United
States Department of
Agriculture Conservation
Reserve Enhancement
Program (CREP)
(http://www.fsa.usda.gov
/FSA/webapp?area=home&
subject=copr&topic=cep) offers
support to increased conservation practices
such as filter strips and forested buffers.
Figure 7: Buffer function based on width
24
Chatham Information: Riparian Buffers
Using a coarse estimation based on the land cover within 300 feet of Chatham’s
mapped streams (but see the NLCD section in Appendix 1 for important limitations of the
data) the riparian areas in Chatham are 62% natural cover (47% forests, 7% shrub/scrub and
5% wetlands), 27% agricultural (24% pasture, 27% cultivated) and 11% developed. The
large proportion of agricultural cover might reveal opportunities for the community to assist
farmers with the identification of best management practices to minimize the impact on
streams. See the previous section on Agricultural Lands for more resources.
More detailed studies would be needed to identify specific opportunities for
protection and restoration of riparian areas in Chatham.

25
In this section, we report information
on waterbody classification, assessment, and
impairment. A waterbody’s classification,
along with its assessment results, leads to an
understanding of its health and can lead to
the designation of the stream or waterbody
as impaired. This Summary is not a
regulatory document; questions about the
classification and impairment of specific
streams should be directed to the
NYSDEC regional office. The maps
displayed here show unofficial stream
segment and waterbody information, but are
largely consistent with the official version.
The following information on water
quality is collected and displayed for
particular streams and waterbodies, but it’s
important to remember that stream
management should take place in a
watershed context. The effects of land use
on streams, and stream health on everything
from habitat to real estate values, highlight
the critical connection between the two.
Waterbody Classification
The NYSDEC’s classification of a
waterbody designates the “best uses” that it
should be supporting. Waterbodies are
classified by letters: A, B, C, or D for
freshwater. (For more information about
classifications, see:
http://www.dec.ny.gov/chemical/23853.html
.) For each class, the designated best uses
are defined as:
Class A, AA, A-S, or AA-S – water
supply, primary and secondary
contact recreation, and fishing
Class B – primary and secondary
contact recreation, fishing
Class C – fishing and wildlife
propagation
Class D – fishing
Waterbodies with classifications A,
B, or C may also have an associated
standard of (T), indicating that these are
trout waters, or (TS), indicating that these
are trout spawning waters. For more
information about the best uses designated
for each classification, see:
http://www.dec.ny.gov/regs/4592.html. The
NYSDEC recognizes that some waterbodies
have an existing quality that is better than
their assigned classification, and uses an
antidegredation policy to protect and
maintain high-quality streams.
NYSDEC also establishes water
quality standards, specific to particular
parameters and pollutants, to protect the
uses associated with these classifications.
Standards can be numerical or narrative. For
example, dissolved oxygen has a numerical
standard of no less than 7.0 mg/L in trout
spawning waters. Turbidity has a narrative
water quality standard, which states that
there should be “no increase that will cause
a substantial visible contrast to natural
conditions.” Information on surface water
and groundwater quality standards can be
found in at
http://www.dec.ny.gov/regs/4590.html. If
waterbodies are not supporting the standards
for their best uses, they may be listed on the
Priority Waterbody List as Impaired (see
Waterbody Impairment section below).
Activities allowed in and around
waterbodies are regulated based on their
classification and standard. C(T), C(TS), and
all types of B and A streams (as well as
water bodies under 10 acres located in the
course of these streams) are collectively
referred to as “protected streams,” and are
subject to the stream protection provisions
of the Protection of Waters
26
Stream protection from
NYSDEC: streams of
class C(T) or higher and
their bed and banks are
regulated by NYSDEC.
Wetlands contiguous to
those streams may also
be regulated.
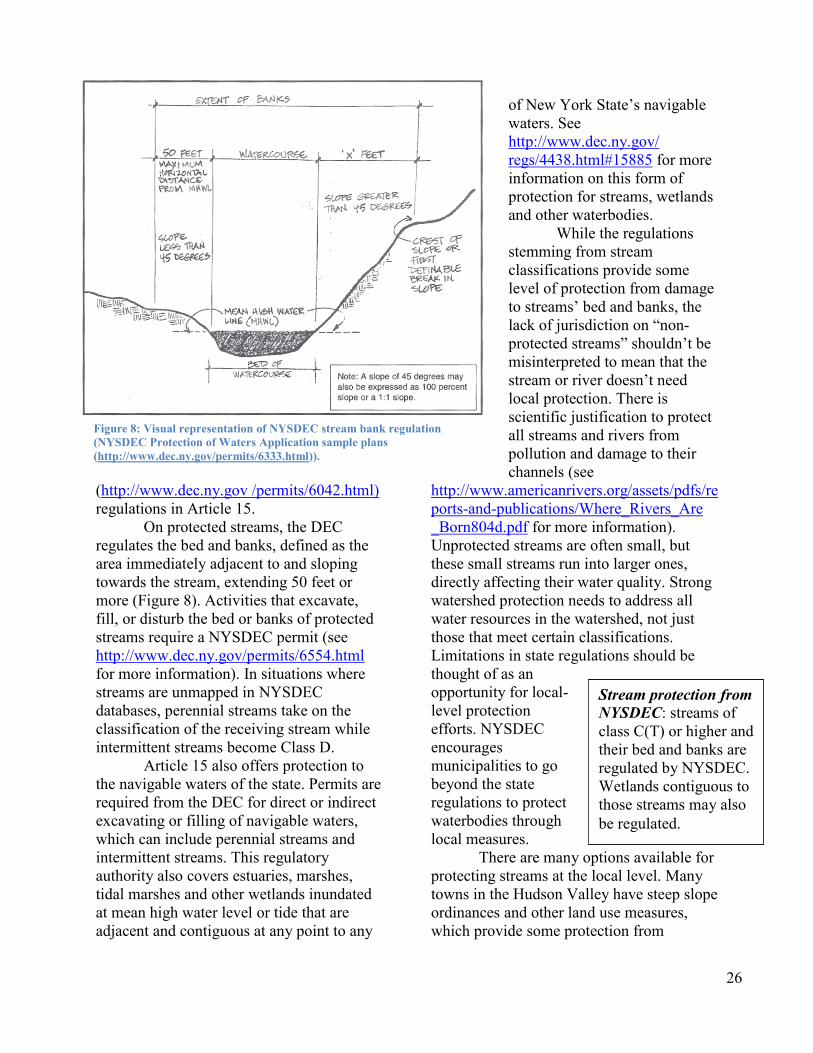
Figure 8: Visual representation of NYSDEC stream bank regulation
(NYSDEC Protection of Waters Application sample plans
(http://www.dec.ny.gov/permits/6333.html)).
(http://www.dec.ny.gov /permits/6042.html)
regulations in Article 15.
On protected streams, the DEC
regulates the bed and banks, defined as the
area immediately adjacent to and sloping
towards the stream, extending 50 feet or
more (Figure 8). Activities that excavate,
fill, or disturb the bed or banks of protected
streams require a NYSDEC permit (see
http://www.dec.ny.gov/permits/6554.html
for more information). In situations where
streams are unmapped in NYSDEC
databases, perennial streams take on the
classification of the receiving stream while
intermittent streams become Class D.
Article 15 also offers protection to
the navigable waters of the state. Permits are
required from the DEC for direct or indirect
excavating or filling of navigable waters,
which can include perennial streams and
intermittent streams. This regulatory
authority also covers estuaries, marshes,
tidal marshes and other wetlands inundated
at mean high water level or tide that are
adjacent and contiguous at any point to any
of New York State’s navigable
waters. See
http://www.dec.ny.gov/
regs/4438.html#15885 for more
information on this form of
protection for streams, wetlands
and other waterbodies.
While the regulations
stemming from stream
classifications provide some
level of protection from damage
to streams’ bed and banks, the
lack of jurisdiction on “non-
protected streams” shouldn’t be
misinterpreted to mean that the
stream or river doesn’t need
local protection. There is
scientific justification to protect
all streams and rivers from
pollution and damage to their
channels (see
http://www.americanrivers.org/assets/pdfs/re
ports-and-publications/Where_Rivers_Are
_Born804d.pdf for more information).
Unprotected streams are often small, but
these small streams run into larger ones,
directly affecting their water quality. Strong
watershed protection needs to address all
water resources in the watershed, not just
those that meet certain classifications.
Limitations in state regulations should be
thought of as an
opportunity for local-
level protection
efforts. NYSDEC
encourages
municipalities to go
beyond the state
regulations to protect
waterbodies through
local measures.
There are many options available for
protecting streams at the local level. Many
towns in the Hudson Valley have steep slope
ordinances and other land use measures,
which provide some protection from
27
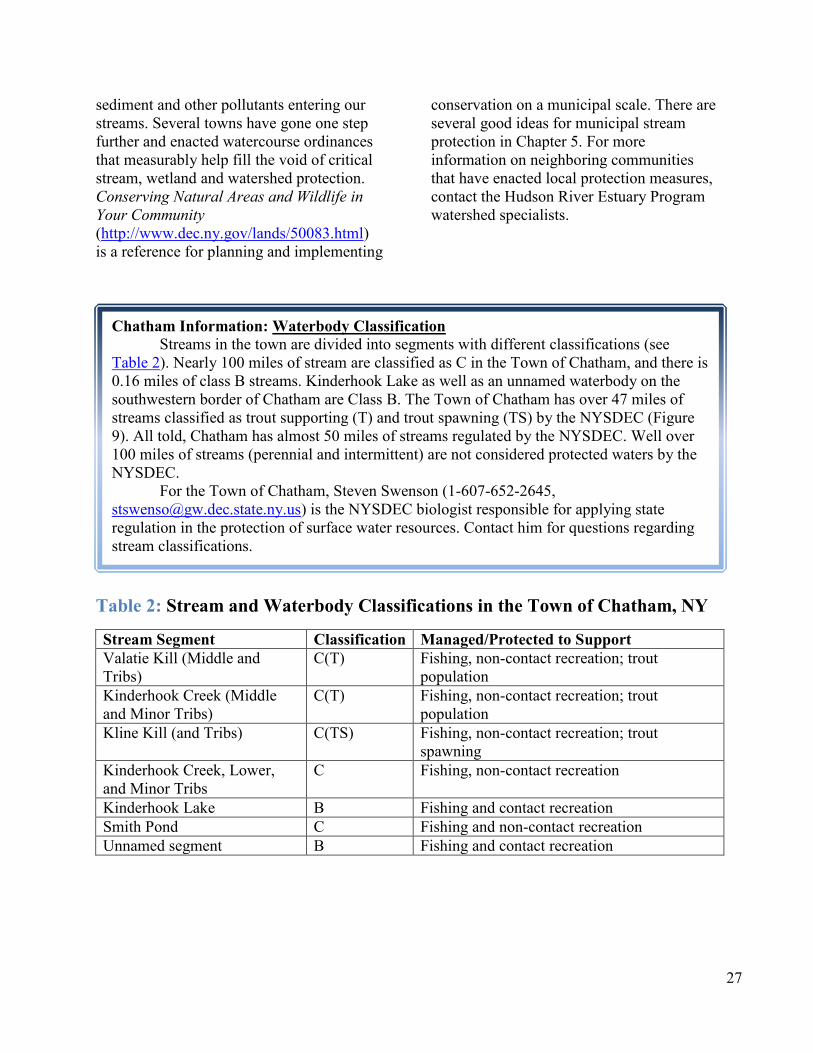
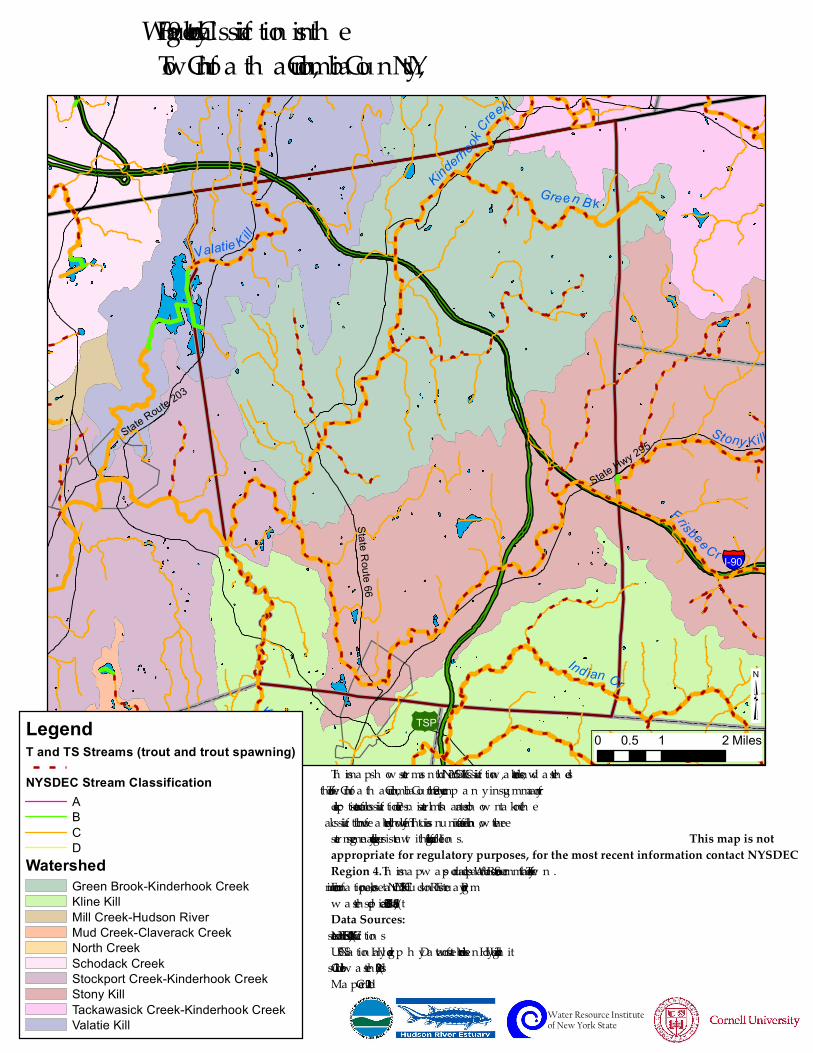
Chatham Information: Waterbody Classification
Streams in the town are divided into segments with different classifications (see
Table 2). Nearly 100 miles of stream are classified as C in the Town of Chatham, and there is
0.16 miles of class B streams. Kinderhook Lake as well as an unnamed waterbody on the
southwestern border of Chatham are Class B. The Town of Chatham has over 47 miles of
streams classified as trout supporting (T) and trout spawning (TS) by the NYSDEC (Figure
9). All told, Chatham has almost 50 miles of streams regulated by the NYSDEC. Well over
100 miles of streams (perennial and intermittent) are not considered protected waters by the
NYSDEC.
For the Town of Chatham, Steven Swenson (1-607-652-2645,
[email protected]) is the NYSDEC biologist responsible for applying state
regulation in the protection of surface water resources. Contact him for questions regarding
stream classifications.
sediment and other pollutants entering our
streams. Several towns have gone one step
further and enacted watercourse ordinances
that measurably help fill the void of critical
stream, wetland and watershed protection.
Conserving Natural Areas and Wildlife in
Your Community
(http://www.dec.ny.gov/lands/50083.html)
is a reference for planning and implementing
conservation on a municipal scale. There are
several good ideas for municipal stream
protection in Chapter 5. For more
information on neighboring communities
that have enacted local protection measures,
contact the Hudson River Estuary Program
watershed specialists.
Table 2: Stream and Waterbody Classifications in the Town of Chatham, NY
Stream Segment Classification Managed/Protected to Support
Valatie Kill (Middle and
Tribs)
C(T) Fishing, non-contact recreation; trout
population
Kinderhook Creek (Middle
and Minor Tribs)
C(T) Fishing, non-contact recreation; trout
population
Kline Kill (and Tribs) C(TS) Fishing, non-contact recreation; trout
spawning
Kinderhook Creek, Lower,
and Minor Tribs
C Fishing, non-contact recreation
Kinderhook Lake B Fishing and contact recreation
Smith Pond C Fishing and non-contact recreation
Unnamed segment B Fishing and contact recreation
State Route 66Stony Kill
Ind ian Cr
Valatie K ill
KlineKill
Gre en B k
Frisbee Cr
Kinderh
ook Creek
North
Cr
State Route 203
State Hwy 295
Figure 9: Wa terbody Cla ssifica tion s in th eTow n of Ch a th a m, Columbia Coun ty, NY
³0 1 20.5 Miles
Th is ma p sh ow s strea ms a n d th eir NYSDEC cla ssifica tion , w a terbodies, a n d w a tersh eds for th e Tow n of Ch a th a m, Columbia Coun ty. See th e a ccomp a n yin g summa ry for a descrip tion of strea m cla ssifica tion s. Peren n ia l strea ms th a t a re n ot sh ow n ta k e on th e cla ssifica tion of th e w a terbody th ey flow in to. Th is is a n un officia l version , h ow ever th estrea m segmen ts a re la rgely con sisten t w ith th e officia l regula tion s. This map is not appropriate for regulatory purposes, for the most recent information contact NYSDEC Region 4.Th is ma p w a s p roduced a s p a rt of a Wa ter Resource Summa ry for th e Tow n . For more in forma tion , p lea se con ta ct NYS DEC's Hudson River Estua ry Progra m w a tersh ed sp ecia lists a t (845) 256‐3016.Data Sources: NYSDEC (2010) for strea m cla ssifica tion sUSGS Na tion a l Hydrogra p h y Da ta set for w a terbodies a n d Hydrologic Un it Code 12 subw a tersh eds (2008)Ma p Crea ted 2012
LegendT and TS Streams (trout and trout spawning)
NYSDEC Stream ClassificationABCD
WatershedGreen Brook-Kinderhook CreekKline KillMill Creek-Hudson RiverMud Creek-Claverack CreekNorth CreekSchodack CreekStockport Creek-Kinderhook CreekStony KillTackawasick Creek-Kinderhook CreekValatie Kill
§̈¦I-90
1TSP
Water Resource Instituteof New York State

29
Biomonitoring uses the abundance and kind of aquatic organisms as a measure of waterbody health.
Waterbody Assessments Lake Assessments Lakes, ponds, and reservoirs are monitored
through the Lake Classification and
Inventory and through the Citizens
Statewide Lake Assessment Program. The
former program is conducted by NYSDEC
staff and the latter is directed by NYSDEC
but run by volunteers from lake associations.
Contact Scott Kishbaugh
([email protected]), Program
Manager, for more information about these
programs and to find out if information has
been collected for lakes, ponds, and
reservoirs in the Town of Chatham.
Diet for a Small Lake: The Expanded
Guide to New York State Lake and
Watershed Management
(http://www.dec.ny.gov/chemical/82123.htm
l) is a compendium of information about the
ecology, monitoring, and management of
lakes and watersheds in New York State.
The guide is written for both lake residents
and professionals.
Stream Assessments - Biomonitoring Benthic macroinvertebrates (including
aquatic insects, worms, clams, snails, and
crustaceans) can be used to assess and
monitor the water quality of a stream.
Biological monitoring, or biomonitoring, in
this way provides an excellent indicator of
overall water quality at a particular site
because macroinvertebrates are sensitive to
many environmental impacts and are less
mobile than fish. Biomonitoring can
integrate the chemical, physical, and
biological features of a stream, providing a
more comprehensive characterization than
each of these measures alone.
Stream biomonitoring represents an
important measure of overall water quality;
identifying healthy stream segments is key
to protecting them. Caution is warranted to
avoid impacting these healthy, non-impacted
streams through land use disturbances and
activities. Once streams are impacted,
restoring them is difficult and expensive.
NYSDEC Stream Biomonitoring Unit Data NYSDEC measures and
characterizes waterbody health in two basic
ways: best uses and stream biomonitoring.
For more information on waterbody
characterization based on best uses, see next
section on Waterbody Impairment. While
best uses characterize stream health for its
effect on human uses, stream biomonitoring
is a good measure of stream health through
aquatic ecology. NYSDEC’s Stream
Biomonitoring Unit
(http://www.dec.ny.gov/chemical/23847.htm
l) conducts biomonitoring sampling
throughout New York
State.
Based on the
number and kinds of
macroinvertebrates, each
sample receives a
Biological Assessment
Profile (BAP) score
between 1 and 10 (with
10 being the healthiest). BAP scores are
divided into four water quality impairment
categories:
Severe – BAP score from 0 to 2.5
Moderate – BAP score from 2.5 to 5
Slight – BAP score from 5 to 7.5
Non-impacted – BAP score from 7.5
to 10
Biomonitoring sites are selected for a
number of reasons. See Appendix 1 for more
information on their selection criteria.
Regional trends from 30 years of
biomonitoring data (1972-2002) in New
York State were published in this report:
http://www.dec.ny.gov/chemical/78979.html
. Stream biomonitoring data is also available
to the public. Contact the Hudson River
30
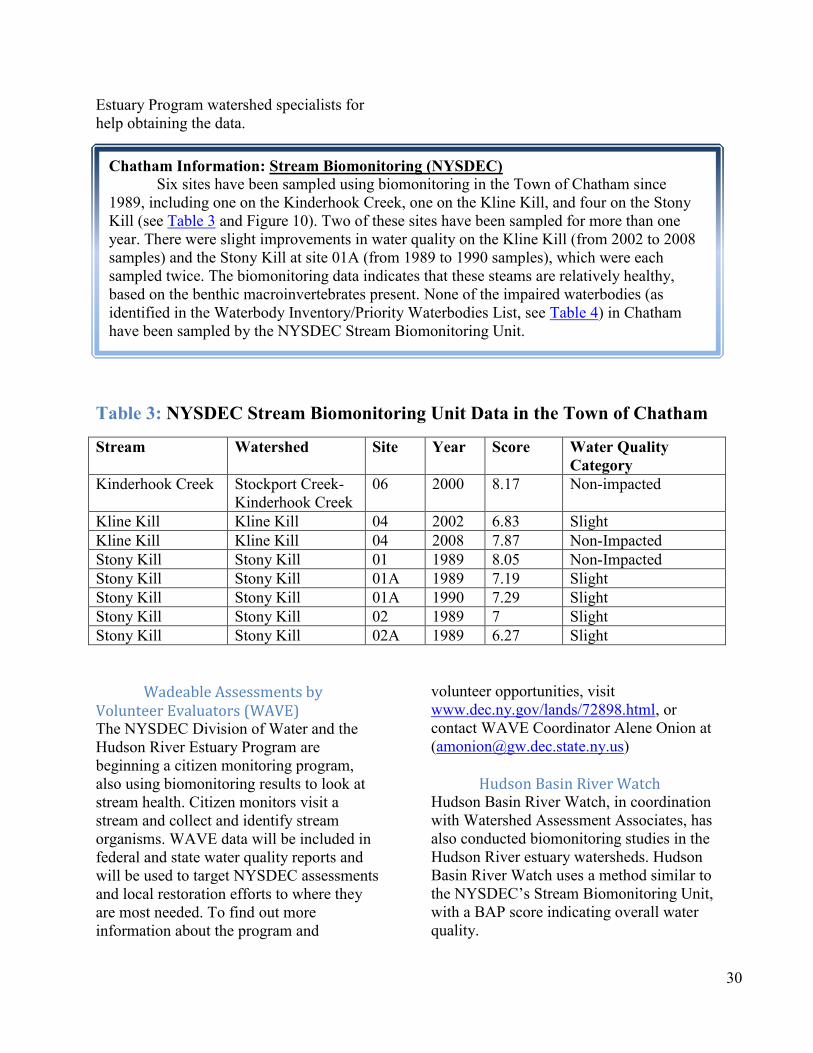
Chatham Information: Stream Biomonitoring (NYSDEC)
Six sites have been sampled using biomonitoring in the Town of Chatham since
1989, including one on the Kinderhook Creek, one on the Kline Kill, and four on the Stony
Kill (see Table 3 and Figure 10). Two of these sites have been sampled for more than one
year. There were slight improvements in water quality on the Kline Kill (from 2002 to 2008
samples) and the Stony Kill at site 01A (from 1989 to 1990 samples), which were each
sampled twice. The biomonitoring data indicates that these steams are relatively healthy,
based on the benthic macroinvertebrates present. None of the impaired waterbodies (as
identified in the Waterbody Inventory/Priority Waterbodies List, see Table 4) in Chatham
have been sampled by the NYSDEC Stream Biomonitoring Unit.
Estuary Program watershed specialists for
help obtaining the data.
Table 3: NYSDEC Stream Biomonitoring Unit Data in the Town of Chatham
Stream Watershed Site Year Score Water Quality
Category
Kinderhook Creek Stockport Creek-
Kinderhook Creek
06 2000 8.17 Non-impacted
Kline Kill Kline Kill 04 2002 6.83 Slight
Kline Kill Kline Kill 04 2008 7.87 Non-Impacted
Stony Kill Stony Kill 01 1989 8.05 Non-Impacted
Stony Kill Stony Kill 01A 1989 7.19 Slight
Stony Kill Stony Kill 01A 1990 7.29 Slight
Stony Kill Stony Kill 02 1989 7 Slight
Stony Kill Stony Kill 02A 1989 6.27 Slight
Wadeable Assessments by Volunteer Evaluators (WAVE) The NYSDEC Division of Water and the
Hudson River Estuary Program are
beginning a citizen monitoring program,
also using biomonitoring results to look at
stream health. Citizen monitors visit a
stream and collect and identify stream
organisms. WAVE data will be included in
federal and state water quality reports and
will be used to target NYSDEC assessments
and local restoration efforts to where they
are most needed. To find out more
information about the program and
volunteer opportunities, visit
www.dec.ny.gov/lands/72898.html, or
contact WAVE Coordinator Alene Onion at
Hudson Basin River Watch Hudson Basin River Watch, in coordination
with Watershed Assessment Associates, has
also conducted biomonitoring studies in the
Hudson River estuary watersheds. Hudson
Basin River Watch uses a method similar to
the NYSDEC’s Stream Biomonitoring Unit,
with a BAP score indicating overall water
quality.

31
Chatham Information: Stream Biomonitoring (Hudson Basin River Watch)
Hudson Basin River Watch (HBRW) conducted stream biomonitoring of the
Stockport Creek watershed, including the Kinderhook Creek watershed in 2006 and 2001
(see Figure 10). Both Watershed Report Cards are available here:
http://www.stockportwatershed.org/resources.html
HBRW sampled 10 sites in the Greater Stockport Creek watershed in 2011, and two
of them (including one in the Town of Chatham) were slightly impacted while the other eight
were non-impacted. HBRW sampled one site on the Stony Kill, downstream of the Village
wastewater treatment facility, in 2006 and in 2011. Their results showed that the Biological
Assessment Profile score was slightly impacted in both years, though it increased from 5.85
in 2006 to 7.4 in 2011.
In every glass of water we
drink, some of the water has
already passed through
fishes, tress, bacteria,
worms in the soil, and many
other organisms, including
people…. Living systems
cleanse the water and make
it fit, among other things,
for human consumption.
-Elliot A. Norse-

!!
!!
!!
!!
!!!!!!
!!
!!
!!!!
!!
!!
!!
!!
!!
!!
!!
!!
!!
State Route 66S tony Kill
Ind ian CrKlineKill
Kinderhook
Creek
Gre en B k
Valatie K ill
Frisbee Cr
State Route 203
State Hwy 295
Figure 10: Biomon itorin g Sa mp les in th eTow n of Ch a th a m, Columbia Coun ty, NY
³0 1 20.5 Miles
Th is ma p sh ow s w a ter qua lity in forma tion ba sed on biomon itorin g results ta k en a tp a rticula r loca tion s in th e Tow n of Ch a th a m, Columbia Coun ty. See th e a ccomp a n yin g summa ry for a descrip tion of biomon itorin g results. Th is ma p w a s p roduced a s p a rt of a Wa ter Resource Summa ry for th e Tow n . For more in forma tion , p lea se con ta ct NYSDEC's Hudson River Estu a ry Progra m w a tersh edsp ecia lists a t (845) 256‐3016.
Data Sources: New York Sta te Dep a rtmen t of En viron men ta l Con serva tion , Division of Wa ter,Strea m Biomon itorin g Un it a n d Hudson Ba sin River Wa tch for biomon itorin g results (up to 2011)USGS Na tion a l Hydrogra p h y Da ta se for strea ms, w a terbodies a n d Hydrologic Un it Code 12 w a tersh eds (2008)Ma p Crea ted 2012
LegendMinor streamMajor stream
Biomonitoring scores(category of most recent sample)!! non-impacted!! slight!! moderate!! severe
§̈¦I-90
1TSP
Water Resource Instituteof New York State

33
Chatham Information: Waterbody Impairment
There are ten waterbody segments from the WI/PWL that cover the Town of
Chatham (Table 4, Figure 11). Two of these (Valatie Kill, Middle and Tribs, and Kinderhook
Lake) are considered “impaired,” and are on the New York State 303(d) list of impaired
waterbodies. The Valatie Kill, Middle and Tribs, and Kinderhook Lake are impaired for fish
consumption. Kinderhook Lake is also listed as a Waterbody with Impairment Requiring
TMDL Development due to phosphorus.
Kinderhook Creek, Middle and Minor Tribs, and Kline Kill and Tribs are both listed
as No Known Impacts. This designation infers that these streams were found to be generally
healthy.
Waterbody Inventory/Priority Waterbodies List: is
the best way to access
the state’s information
on water quality.
Access it at Lower
Hudson River Basin
WI/PWL
Waterbody Impairment
The Waterbody Inventory/Priority
Waterbodies List (WI/PWL) is a document
that lists New York State waterbodies and
information about their water quality. It is
published by the NYSDEC Division of
Water. The WI/PWL categorizes
rivers/streams, lakes/reservoirs, and
estuaries and indicates whether they are
meeting their “best uses” based on their
NYSDEC classification (see previous
section on Waterbody Classification).
There are two components to the
WI/PWL: the Waterbody Inventory and the
Priority Waterbodies List. The Waterbody
Inventory (WI) is a comprehensive list of
water quality information for waterbodies in
the state. The Priority Waterbodies List
(PWL) is a subset of waterbodies from this
inventory that experience water quality
impacts that can range from possible threats
and minor impacts to impairment of
designated best uses. Impairment is
determined based on NYSDEC’s monitoring
(including biomonitoring, for more
information, see the previous Stream
Assessment-Biomonitoring section) and
other available information. Impaired waters
that do not meet applicable water quality
standards are considered for inclusion on the
state’s Clean Water Act Section 303(d) List.
To better assess water quality at a regional
scale, most waterbodies are divided into
segments based on classification, size, and
land use/character. Each of these segments
is categorized as:
Impaired Waters,
Waters with Minor Impacts,
Threatened Waterbodies,
Waterbodies with Impacts Needing
Verification,
Waterbodies with No Known
Impacts, or
Unassessed Waterbodies.
Waterbodies
characterized as
Impaired, Waters
with Minor Impacts,
or Threatened
Waterbodies are
assigned to the
Priority Waterbodies
List. These water
quality categories
are used by DEC to
determine whether a waterbody will be
included on the federal 303(d) list of
impaired waters, and if it needs a Total
Maximum Daily Load (TMDL) to be
developed to support restoration. The
WI/PWL is available on the NYSDEC
website. The Lower Hudson River Basin
WI/PWL
(http://www.dec.ny.gov/chemical/36740.htm
l) is the section that covers the Hudson River
estuary watershed.

34
Table 4: Stream Segments and Impacted Uses in the Town of Chatham (from the Waterbody Inventory/Priority Waterbody List, NYSDEC DOW 2008)
Stream Segment ID Class Water Quality
Uses Impacted Pollutants Pollutant Source 303(d) List?
Notes
Valatie Kill, Middle,
and Tribs
1310-
0003
C(T), C Impaired Impaired: Fish
consumption and
recreation
Known: Priority
organics (PCBs)
Known: Landfill/land
disp (Dewey Loeffel);
Suspected:
toxic/contaminated
sediments
Yes Dewey Loeffel hazardous waste
disposal site
Valatie Kill, Lower,
and Minor Tribs
1310-
0023
C Unassessed
Kinderhook Creek,
Middle, and Minor
Tribs
1310-
0017
C (TS),
C(T), C
No known
impacts
No use
impairment
No Aquatic life support is fully
supported, but may be affected by
occasional high temperatures
Kline Kill and Tribs 1310-
0028
C(TS),
C(T), C
No known
Impact
No use
impairment
No
Kinderhook Creek,
Lower, and Minor
Tribs
1310-
0021
C(T), C Minor
impacts
Stressed: Aquatic
life, recreation,
and
habitat/hydrology
Suspected: Nutrients,
thermal changes;
Possible: metals
(lead)
Suspected:
Agriculture, habitat
modification;
Possible:
Toxic/contaminated
sediment
No Nutrient loadings from
agricultural and other nonpoint
sources. Aquatic habitat in the
stream may also be affected by
elevated temperatures and the
removal of riparian vegetation.
Stony Kill and Tribs 1310-
0031
C(TS),
C(T), C
Unassessed No
Kinderhook Lake 1310-
0002
B Impaired Impaired: Fish
consumption and
recreation;
Stressed: Aquatic
life, aesthetics
Known: Algal/weed
growth (vegetation),
nutrients
(phosphorus), priority
organics (PCBs);
Possible:
D.O./oxygen demand
Suspected: On-site
septic systems,
toxic/contaminated
sediments, agriculture,
landfill/land disp
(Dewey Loeffel),
urban/storm runoff
Yes PCB contamination, aquatic weed
and algal growth, and low water
transparency
Smith Pond 1310-
0009
C Needs
verification
Stressed:
Recreation
(possible)
Suspected:
Algal/weed growth;
Possible: Nutrients,
salts, silt/sediment
Suspected:
Urban/storm runoff;
Possible: On-site
septic systems
No Excessive aquatic vegetation
and/or algal growth
Southerland Pond 1310-
0032
C Unassessed No
Bachus Pond 1310-
0034
C Unassessed No

State Route 66State Route 203
State Hwy 295
Fig ure 11: W aterbo dy Im p airm ent Inf o rm atio n f ro m th e Prio rityW aterbo dies List f o r th e To w n o f Ch ath am , Co lum bia Co unty, NY
³0 1 20.5 Miles
Th is m ap sh o w s stream s and w aterbo dies and th eir NYSDEC im p act assessm entsfro m th e W aterbo dy Invento ry/Prio rity W aterbo dy List f o r th e To w n o f Ch ath am ,Co lum bia Co unty. Th ese seg m ents do n't necessarily alig n w ith w atersh ed bo undaries. See Table 4 in th e acco m p anying sum m ary f o r a descrip tio n o f stream assessm ents and th eir im p airm ent. This map is not appropriate for regulatory purposes, for the most recent information contact NYSDEC Region 4. Th is m ap w as p ro duced as p art o f a W ater Reso urce Sum m ary f o r th e To w n. Fo r m o re info rm atio n, p lease co ntact NYSDEC's Hudso n River Estuary Pro g ram w atersh ed sp ecialists at (845) 256‐3016.Data Sources: NYSDEC, Divisio n o f W ater (2008) fo r W aterbo dy Invento ry/Prio rity W aterbo dy List assessm entsUSGS Natio nal Hydro g rap h y Dataset (2008) f o r w aterbo dies and Hydro lo g ic Unit Co de 12 subw atersh ed bo undariesMap Created 2012
LegendPriority Waterbody List stream
Impaired SegmentMinor ImpactsThreatenedThreatened (Possible)Need VerificationNo Known ImpactUnAssessed
Priority Waterbody List lake/reservoirImpaired SegmentMinor ImpactsThreatenedThreatened (Possible)Need VerificationNo Known ImpactUnAssessed
§̈¦I-90
1TSP
Water Resource Instituteof New York State
Kinderhook Creek, Middle, and Minor Tribs
Kline Kill and Tribs
Kinderhook Creek, Lower, and Minor Tribs
Valatie Kill, Middle, and Tribs
Valatie Kill, Lower, and Tribs
Stony Kill and Tribs
Kinderhook Lake
Southerland Pond
Smith Pond
Bacchus Pond

36
Chatham Information: Stormwater Management (MS4)
Even in rural areas, stormwater management is important for protecting high-quality
streams. Although the Town of Chatham, along with the rest of Columbia County, is not
currently designated as an MS4, the six minimum control measures and other strategies could
be useful for protecting water quality.
Stormwater Management
Municipal Separated Storm Sewer System
(MS4)
A Municipal Separated Storm Sewer System
(MS4) is a stormwater collection and
conveyance system owned by a state, city,
town, village, or other public entity that is
not part of a sewage treatment plant or
combined sewer system. The MS4 program
provides a regulatory framework for
municipalities to better manage stormwater
and nonpoint source pollution. Regulated
MS4 areas are “urbanized areas” (areas with
at least 50,000 people and at least 1,000
people per square mile as determined by the
US Census), but also include other
designated areas.
Currently the MS4 program is in
Phase II, which the Environmental
Protection Agency (EPA) issued in 1999.
Regulated MS4s are required to obtain a
State Pollutant Discharge Elimination
System (SPDES) permit (GP-0-10-002)
from the NYSDEC and develop a
stormwater management program. For more
information about the MS4 permit, see:
http://www.dec.ny.gov/chemical/43150.html
.
Municipalities with regulated MS4
areas are required to implement and report
on six Minimum Control Measures:
Public education/outreach
Public participation/involvement
Illicit discharge detection and
elimination
Construction site runoff control
Post-construction runoff control
Pollution prevention/good
housekeeping
For more information from the EPA
about the MS4 regulatory program, see:
http://cfpub.epa.gov/npdes/stormwater/muni
c.cfm. For more information about
stormwater from the NYSDEC, see:
http://www.dec.ny.gov/chemical/8468.html
Construction Stormwater Management
The SPDES General Permit for Stormwater
Discharges from Construction Activity (GP-
0-10-001) is required to be obtained by the
owner or operator of a construction project
if the project disturbs one acre or more of
land. As part of this permit, the
owner/operator must complete a Stormwater
Pollution Prevention Plan (SWPPP). For
more information on the Stormwater Permit
for Construction Activities, see:
http://www.dec.ny.gov/chemical/43133.html
.
In MS4 communities, a
representative of the municipality’s MS4
program must review and accept the SWPPP
before it is submitted to the NYSDEC. The
municipal engineer and/or planner will
review SWPPPs and provide comments to
the planning board, zoning board, or

37
Chatham Information: Stormwater Management (Construction)
In the Town of Chatham, Kinderhook Lake is designated as a waterbody impaired by
pollutants related to construction activities, so Stormwater Pollution Prevention Plans
(SWPPPs) describing post-construction stormwater management are required for all
development projects that disturb one or more acres of land within its watershed.
In the rest of the town, SWPPPs describing post-construction stormwater
management are required for single-family residential projects that disturb five or more acres
and multi-family or commercial projects that disturb one or more acres.
Green Infrastructure:
weaves natural processes
into the built
environment, providing
not only stormwater
management, but also
flood mitigation, air
quality management, and
much more.
municipal governing board. Planning boards
can also review SWPPPs submitted with site
plans. All SWPPPs should describe the
erosion and sediment controls that will be
used on-site during construction, based on
the technical information in the NYS
Standards and Specifications for Erosion
and Sediment Control
(http://www.dec.ny.gov/chemical/29066.htm
l).
The SWPPPs may also be required to
describe the post-construction stormwater
management practices that will be
implemented, based on the standards in the
NYS Stormwater Management Design
Manual
(http://www.dec.ny.gov/chemical/29072.htm
l). Generally, post-construction stormwater
management is required if projects disturb
five acres or more for single-family
residential projects or one acre or more for
multi-family or commercial projects. See
http://www.dec.ny.gov/docs/water_pdf/gpsc
onspmt10.pdf Appendix B for details on
where post-construction stormwater
management is required. (For more
information on post-construction stormwater
management, see the Green Infrastructure
section below.)
If sites are located within the
watershed of a 303(d) listed waterbody
impaired by pollutants related to
construction activity (such as sediment or
nutrients), then single family residential
projects that disturb one acre or more of land
will also require a SWPPP with post-
construction stormwater management.
Post-Construction Stormwater Management
and Green Infrastructure
The New York State Stormwater Design
Manual
(http://www.dec.ny.gov/chemical/29072.htm
l) provides information on how to select,
locate, size, and design stormwater
management practices to comply with NYS
standards for post-construction stormwater
management. It also includes a planning
process to follow when managing
stormwater in new development and
redevelopment projects.
This process includes:
1. Site planning to
preserve natural
features and
reduce impervious
surface cover,
2. Calculating the
amount of runoff
that will be
produced on-site
(based on a typical
storm),
38
Chatham Information: Stormwater Management (Green Infrastructure)
The revised NYSDEC Stormwater Management Design Manual (2010) increased the
importance of implementing green infrastructure practices for new development. The Town
of Chatham Planning Board should understand green infrastructure practices and regulations,
because these practices are strongly encouraged for developments that require post-
construction stormwater management. Different practices are appropriate for different sites,
and it's essential that these practices are sized/designed correctly, constructed appropriately,
and well-maintained.
3. Reducing runoff by implementing green
infrastructure and other stormwater
management practices that allow
stormwater to infiltrate on-site,
4. Using standard stormwater management
practices to treat the rest of the
stormwater that is produced, and
5. Designing volume and peak rate control
practices, where required.
Green infrastructure practices
maintain or restore stormwater’s natural
flow patterns at a site by allowing runoff to
infiltrate into the soil. On a regional scale,
green infrastructure includes preserving and
restoring natural landscape features, along
with reducing impervious surface cover. At
the site scale, green infrastructure includes
practices that capture stormwater runoff,
such as rain gardens, vegetated swales,
green roofs, pervious pavement, and rain
barrels. These practices allow water to soak
into the soil, be used by plants, or be reused.
(For more information and a full list of
green infrastructure practices, see Chapter 5
of the NYS Stormwater Management
Design Manual:
http://www.dec.ny.gov/docs/water_pdf/swd
m2010chptr5.pdf.)
Green infrastructure and other
stormwater practices that reduce runoff
should be able to infiltrate the full volume of
stormwater produced by the site being
developed (the calculation from Step 2,
known as the Water Quality Volume). If that
can’t be done, the designer must provide
justifications and identify the specific site
limitations. The rest of the stormwater
volume should be treated by standard
stormwater practices (described in Chapter 6
of the NYS Stormwater Management
Design Manual:
http://www.dec.ny.gov/docs/water_pdf/swd
mchapter6.pdf).
At the municipal scale, it is
important to ensure that local laws don’t
restrict the green infrastructure practices that
can be implemented. The New York State
Better Site Design Code and Ordinance
Worksheet
(http://www.dec.ny.gov/docs/remediation_h
udson_pdf/cownys.pdf) is a useful tool to
assess potential barriers to green
infrastructure.
The Hudson River Estuary
Program’s Green Infrastructure Examples
website
(http://www.dec.ny.gov/lands/58930.html)
has regional examples of green
infrastructure demonstration sites, including
several practices in Columbia County. Other
helpful resources include the Columbia
County Soil and Water Conservation
District (http://www.ccswcd.org/) and
Cornell Cooperative Extension for Columbia
and Greene Counties
(http://www.ccecolumbiagreene.org/).
39
Chatham Information: SPDES and Wastewater
Within the Town of Chatham there are several SPDES permit locations listed in the
ECHO database (most are in the Village of Chatham). Information about the Village Sewage
Treatment Plant (SPDES ID# NY0023582), including compliance reports, effluent charts,
pollutant loading reports and water quality reports can be found through this website.
Contact the NYSDEC Region 4 Water Engineer in Schenectady (518-357-2045) for
SPDES permit requirements and more information.
SPDES Permits and Wastewater
NYSDEC recognizes that point-source
pollution is still a significant concern in
New York State. To ensure permit
compliance, NYSDEC wants to be involved
early in the process of planning new
facilities or upgrading existing ones. New
York State uses the State Pollutant
Discharge Elimination System (SPDES) to
control wastewater and stormwater
discharges in accordance with the Clean
Water Act. The NYS program regulates
discharges to groundwater and surface water
(http://www.dec.ny.gov/permits/6054.html).
SPDES permit compliance status
information is available from the EPA’s
Enforcement and Compliance History
Online (ECHO, (http://www.epa-
echo.gov/echo/) website. ECHO is a web-
based tool that provides public access to
permit, inspection, violation, enforcement
action, and penalty information from the
past three years. ECHO offers the most
comprehensive way of searching for SPDES
locations and information about individual
SPDES permitted facilities. The easiest way
to access data on this web site is to enter a
zipcode into the search tool in the upper left
of the opening webpage. Each resulting
pinpoint on the map can be clicked on for
individualized information.
New York Water Environment
Association (NYWEA) is another good
source for information dealing with
wastewater treatment at the municipal level.
Together with the DEC, they have created
the Handbook on Wastewater Management
for Local Representatives
(http://www.dec.ny.gov/chemical/33879.htm
l). NYWEA is currently updating the
handbook and plans to make the updated
version available from their website
(www.nywea.org) by October 2012.
40
Dams and other Aquatic Barriers
Just as many forest-dwelling species
are negatively impacted by forest
fragmentation from roads and structures,
barriers in streams can isolate and severely
limit the range of aquatic species and other
organisms that use stream corridors. As
mills and road crossings were added to the
streams of the Hudson Valley, dams and
culverts damaged, blocked off, and cut up
the habitat for organisms like our native
brook trout. Stream barriers can also have
serious effects on local flooding and water
quality. Streams flowing into undersized
culverts can flood, and in some cases
overtake and washout, the road during heavy
precipitation or snowmelt events.
Barrier impacts on our plants and
animals (especially fish, mussels,
amphibians and reptiles) can result in local
extinction, potentially leading to global
extinction of some of our indigenous and
rare mussel species (NYSDEC 2008,
NYSDEC 2010). Currently, it’s estimated
that the Northeast has an average of 7 dams
and 106 road-stream crossings per 100 miles
of river (Anderson and Olivero Sheldon
2011). The Hudson River watershed has
over 2300 dams (NYSDEC Inventory of
Dams 2009).
Impacts from aquatic barriers can include:
flooding hazards due to plugged
culverts and impounded water;
decreased navigational and
recreational uses
altered sediment and nutrient
processes;
changes in water quality (e.g. water
temperature);
reduced dispersal of young animals,
resulting in increased competition
and reduced gene flow;
lost access to important, upstream
habitats;
increased road kills from increased
attempts to cross the road; and
increased hazard to motorists
because of animal road crossings.
There are no comprehensive
inventories of dams or culverts in New York
State. The New York State Inventory of
Dams and the National Hydrography
Dataset both record some dam information,
but many dams, especially small ones, are
missing or not collected in these datasets.
Assessments done by the Estuary Program
in trial watersheds indicate that perhaps
twice as many dams exists than are recorded
in the NYS Dam Inventory. It is important
to note that “dams” can be defined in many
ways. We are concerned with artificial
structures that eliminate or negatively affect
the movement of aquatic and semi-aquatic
organisms such as migratory and resident
fish, mussels, and amphibians, whereas the
NYS Inventory of Dams uses size and
hazard thresholds to define dams. Culvert
datasets do not exist on any standard,
county-, or state-wide scale in New York.
For this reason, the accompanying map does
not include culverts, though they can be a
critical source of aquatic fragmentation. The
Estuary Program is collecting information
on aquatic barriers, specifically ones that are
important to the migratory fish, resident fish,
mussels and amphibians that live in the
Hudson Valley. Check with a watershed
specialist for the most recent information.
In the planning phase of stream
work, owners should consult with the US
Army Corps of Engineers (ACOE) and
NYSDEC early in the design process for
permit requirements. For the best watershed
management, ecological considerations
should be applied to all road crossings, not
just those that are under DEC or ACOE
jurisdictions. Information is available on

41
Chatham Information: Aquatic Connectivity
Figure 12 shows that the Town of Chatham has 17 dams included on the NYSDEC
Inventory of Dams or the National Hydrography Dataset. Many small dams and all the
culverts are missing from the map. There is likely a culvert almost anywhere a road crosses a
stream, though some streams are spanned with bridges. Small dams and culverts have the
potential to be just as important to aquatic connectivity as the inventoried dams in Figure 12.
Given the limitations to the existing datasets, it’s not possible to identify either the most-
connected streams in Chatham or the most-fragmented streams. In new development
projects, or in planned replacement projects, the town should emphasize designing and
installing culverts that do not act as aquatic barriers or flooding constriction points.
In Region 4 of the NYSDEC, which covers Columbia County, culverts need to be
sized to accommodate a Q50 storm event and must be embedded 20%. NYSDEC also
strongly encourages culverts that span the bank-full width or greater, to minimize potential
stream constriction.
NYSDEC’s stream crossing website (http://
www.dec.ny.gov/permits/49066.html).
Culverts at Road Crossings
Every time a road crosses a stream or
river, there is the potential of a hydrologic
modification and aquatic barrier. Roads that
cross streams should be installed and
maintained to have as little impact as
possible to the hydrology of the stream as
well as the plants and animals that use the
stream and floodplains. Bridges, open-
bottom arches and similar structures that
completely span the waterway and
associated floodplain/riparian areas are
generally the preferred approach whenever
feasible (New Hampshire Stream Crossing
Guidelines 2009). Stream Processes, A
Guide to Living in Harmony with Streams
(Chemung County Soil and Water
Conservation District 2006,
http://www.chemungcountyswcd.com/)
anticipates many of the positive and
negative issues associated with barrier
mitigation and removal.
Dam Replacement or Removal
Dams can be aquatic barriers, and
can be a hazard to public safety as well as an
insurance liability. See Information for Dam
Owners
(http://www.dec.ny.gov/lands/66952.html)
for common problems involving dam
maintenance, as well as the Owners
Guidance Manual
(http://www.dec.ny.gov/lands/4991.html)
for an introduction to the responsibilities of
dam owners. Many dams are also unwanted
and unused, and present opportunities for
stream restoration and habitat connectivity.
However, dam removal is a complex
endeavor, and should not be undertaken
without first contacting a stream
professional. There are many reasons why
dam removals could harm the in-stream
biodiversity and hydrology, including
facilitating the spread of invasive species
and releasing potentially contaminated
sediment into the stream. The Dam Removal
and Barrier Mitigation in New York State:
Preliminary Guidance for Dam Owners and
Project Applicants
(http://www.dec.ny.gov/docs/remediation_h
udson_pdf/damremoval.pdf) is a useful
guide to a well-planned dam removal
process.

State Route 66S tony Kill
Ind ian CrKlineKill
Gre en B k
Valatie K ill
Frisbee Cr
Kinderhook Creek
State Route 203
State Hwy 295
Figure 12: Barrie rs to Aquatic Conne ctivity in theT ow n of Chatham , Colum bia County, NY
³0 1 20.5 Miles
T his m ap show s som e m an-m ad e barrie rs to m ove m e nt of fish, m usse ls and othe r aquatic organism s that re ly on fre e -flow ing, conne cte d stre am s in the T ow n of Chatham , Colum bia County. T he m ap show s k now n locations of d am s base d on tw o pote ntially d uplicative d atase ts; but m any d am s are m issing. Also, this m ap d oe sn't show culve rts, though the y can pre se nt se rious barrie rs to m any spe cie s w he n not size d and place d corre ctly and lik e ly e x ist at the m ajority of place s w he re a road crosse s a stre am . T his m ap w as prod uce d as part of a Wate r Re source Sum m ary for the T ow n. For m ore inform ation, ple ase contact NYSDEC's Hud son Rive r Estuary Program w ate rshe d spe cialists at (845) 256‐3016.
Data Sources: NYSDEC (2009) and National Hyd rography Datase t (2008) for d am locationsUSGS National Hyd rography Datase t (2008) for stre am s, w ate rbod ie s and Hyd rologic Unit Cod e 12 subw ate rshe d sMap Cre ate d 2012
LegendNYSDEC Inventory of Dams
ED National Hydrography Dataset damsMinor streamMajor stream
§̈¦I-90
1TSP
Water Resource Instituteof New York State
43
Center for Watershed Protection. 2003. Impacts of Impervious Cover on Aquatic Systems. Watershed Protection
Research Monographs No.1 pp158
Ecology and Environment, Inc. 2008. Columbia County Multi-Jurisdictional Hazard Mitigation Plan. Columbia
County Emergency Management Office, 85 Industrial Tract Hudson, NY 12534. pp127.
http://www.columbiacountyny.com/documents/misc/columbia_hazard_mitigation_plan.pdf
Environmental Protection Agency, Office of Sustainable Communities Smart Growth Program. 2006. Protecting
Water Resources with Higher-Density Development. pp 45
http://www.epa.gov/dced/pdf/protect_water_higher_density.pdf
EPA Green Communities document, Creating Open Space Networks:
http://www.epa.gov/greenkit/pdfs/envdev1.pdf
EPA Greenkit toolbox: http://www.epa.gov/greenkit/index.htm
Greater Stockport Creek Watershed Alliance: http://www.stockportwatershed.org/
National Hydrography Dataset: http://nhd.usgs.gov/
NYSDEC Bureau of Watershed Assessment and Management, Division of Water. 2007. The Lower Hudson River
Basin Waterbody Inventory and Priority Waterbodies List. 238 pp plus Appendices
Cunningham M.A., C.M. O’Reilly, K.M. Menking,, D.P. Gillikin, K.C. Smith, C.M Foley, S.L Belli, A.M.
Pregnall, M.A. Schlessman, and P. Batur. 2009. The Suburban Stream Syndrome: Evaluating
Land Use and Stream Impairments in the Suburbs. Physical Geography. 30, 3, pp 269-284.
EPA. 2009. Protecting Water Quality with Smart Growth Strategies and Natural Stormwater Management
in Sussex County, Delaware. EPA-NOAA Smart Growth Implementation Assistance for Coastal
Communities for Sussex County, Delaware.
http://www.epa.gov/dced/pdf/2009_0106_sussex_county.pdf
National Research Council, Committee on Reducing Stormwater Discharge Contributions to Water
Pollution. 2008. Urban Stormwater Management in the United States. Water Science and
Technology Board, Division of Earth and Life Studies of the National Research Council. National
Academies Press, Washington D.C., pp 529.
http://www.epa.gov/npdes/pubs/nrc_stormwaterreport.pdf
Walsh C.J., A.H. Roy, J.W. Feminella, P.D. Cottingham, P.M Groffman, and R.P Morgan III. 2005 The
Urban Stream Syndrome: Current Knowledge and the Search For A Cure. Journal o f the North
American Benthological Society, 24(3):706-723 pp18
Center for Watershed Protection’s Watershed Forestry Resource Guide
(http://www.forestsforwatersheds.org/forests-and-drinking-water/
44
Cornell Cooperative Extension’s Forest Connect (http://www2.dnr.cornell.edu/ext/forestconnect/
EPA Economic Benefits of Healthy Watersheds
(http://water.epa.gov/polwaste/nps/watershed/upload/economic_benefits_ factsheet2.pdf
The Municipal Official’s Guide to Forestry in New York State
(http://www2.dnr.cornell.edu/ext/info/pubs/management/MunicipalOfficialsGuide ToForestry.pdf
NYSDEC Division of Lands and Forests’ Forest Stewardship Program
(http://www.dec.ny.gov/lands/45934.html
NYSDEC SPDES general permit frequently asked questions:
http://www.dec.ny.gov/docs/water_pdf/constrfaq.pdf
Agricultural Environmental Management (http://www.nys-soilandwater.org/aem/index.html
Columbia County Soil and Water Conservation District (http://www.ccswcd.org/
Farmscape Ecology Program (http://hawthornevalleyfarm.org/fep/
NYSDEC Bureau of Watershed Assessment and Management, Division of Water. 2007. The Lower
Hudson River Basin Waterbody Inventory and Priority Waterbodies List. 238 pp plus Appendices
Dutchess County Aquifer Recharge Rates & Sustainable Septic System Density Recommendations:
http://www.co.dutchess.ny.us/CountyGov/Departments/Planning/16891.htm
New York Rural Water Association (http://www.nyruralwater.org/
NYSDEC Division of Water and USGS’s Ambient Groundwater Monitoring Program
(http://www.dec.ny.gov/lands/36117.html
PACE Land Use Law Center’s Gaining Ground database entries on Aquifer Protection in New York:
http://landuse.law.pace.edu/SPT--BrowseResources.php?ParentId=410
USGS’s New York Water Science Center (ny.water.usgs.gov), and a map of Hudson Valley places with finer-scale
aquifer information can be found at ny.water.usgs.gov/projects/bgag/aquifer.maps/ aquifer1.maps.html
ACOE National Flood Risk Management Risk Reduction Program – Army Corps of Engineers
http://www.nfrmp.us/index.cfm
The Association of State Floodplain Managers http://www.floods.org/
Catskill Streams – (great primer on Riparian Buffer and links to more in-depth information)
http://www.catskillstreams.org/stewardship_streamside_rb.html

45
Columbia County Multi-Jurisdictional Hazard Mitigation Plan, May 2008, ECOLOGY AND ENVIRONMENT,
INC. http://www.columbiacountyny.com/documents/misc/columbia_hazard_mitigation_plan.pdf (accessed
August 2012)
Emergency Watershed protection program –NRCS (floodplain easements and funding towards repair of watershed
impairments) http://www.nrcs.usda.gov/wps/portal/nrcs/main/national/programs/landscape/ewpp )
EPA links to Life at the Water’s Edge, Living in Harmony with Your Backyard Stream:
http://www.epa.gov/ecopage/aquatic/lifedge.pdf
Flood Smart- the Official Site of the NFIP: http://www.floodsmart.gov/floodsmart/
Hudson Estuary Trees for Tribs (offers free trees and shrubs for streamside planting)-
http://www.dec.ny.gov/lands/43668.html
New York State Floodplain and Stormwater Managers Association - http://ny.floods.org/
NYSDEC (helps to implement state floodplain mapping and assists communities with the NFIP):
http://www.dec.ny.gov/lands/24267.html
Stream Processes, A Guide to Living in Harmony with Streams (Chemung County Soil and Water Conservation
District 2006), on the Chemung County Soil and Water Conservation District:
http://www.chemungcountyswcd.com/
Stream stewardship information at CatskillStreams.org
American Rivers: Where Rivers Are Born: The Scientific Imperative for Defending Small Streams and Wetlands
http://www.americanrivers.org/assets/pdfs/reports-and-publications/Where_Rivers_Are_Born804d.pdf
NYSDEC Conserving Natural Areas and Wildlife in Your Community http://www.dec.ny.gov/lands/50083.html
NYSDEC information about water classifications: http://www.dec.ny.gov/chemical/23853.html
NYSDEC information about best uses for waterbodies: http://www.dec.ny.gov/regs/4592.html
NYSDEC information on surface water and groundwater quality standards: http://www.dec.ny.gov/regs/4590.html
NYSDEC information on the Protection of Waters Program (Article 15): http://www.dec.ny.gov/permits/6042.html
NYSDEC information on protection for streams, wetlands and other waterbodies:
http://www.dec.ny.gov/regs/4438.html#15885
Diet for a Small Lake: The Expanded Guide to New York State Lake and Watershed Management
(http://www.dec.ny.gov/chemical/82123.html

46
Hudson Basin River Watch’s Watershed Report Cards from 2006 and 2011 for the Greater Stockport Creek
watershed: http://www.stockportwatershed.org/resources.html
NYSDEC Stream Biomonitoring Unit (http://www.dec.ny.gov/chemical/23847.html
NYSDEC information on regional trends from 30 years of biomonitoring data (1972-2002):
http://www.dec.ny.gov/chemical/78979.html
NYSDEC information about the WAVE (Wadeable Assessments by Volunteer Evaluators) program:
www.dec.ny.gov/lands/72898.html
NYSDEC Waterbody Inventory/Priority Waterbody List for the Lower Hudson River Basin:
http://www.dec.ny.gov/chemical/36740.html
Columbia County Soil and Water Conservation District: http://www.ccswcd.org/
Cornell Cooperative Extension for Columbia and Greene Counties http://www.ccecolumbiagreene.org/
EPA information on the MS4 regulatory program: http://cfpub.epa.gov/npdes/stormwater/munic.cfm.
Hudson River Estuary Program green infrastructure example: http://www.dec.ny.gov/lands/58930.html
NYSDEC information on the MS4 program: http://www.dec.ny.gov/chemical/43150.html
NYSDEC information about stormwater: http://www.dec.ny.gov/chemical/8468.html
NYSDEC information on the stormwater permit for construction activities:
http://www.dec.ny.gov/chemical/43133.html
NYSDEC information on where post-construction stormwater management is required:
http://www.dec.ny.gov/docs/water_pdf/gpsconspmt10.pdf (Appendix B)
NYSDEC Standards and Specifications for Erosion and Sediment Control:
http://www.dec.ny.gov/chemical/29066.html
NYSDEC Stormwater Management Design Manual: http://www.dec.ny.gov/chemical/29072.html
EPA Enforcement and Compliance History Online (ECHO): http://www.epa-echo.gov/echo/
New York Water Environment Association (NYWEA): www.nywea.org
NYSDEC information on State Pollution Discharge Elimination System: http://www.dec.ny.gov/permits/6054.html
47
NYSDEC, US EPA Region 2, and Environmental Finance Center at Syracuse University. 2007. Handbook on
Wastewater Management for Local Representatives. pp. 128 plus Appendices. Can be accessed at
http://www.dec.ny.gov/chemical/33879.html
NYSDEC information dealing with wastewater treatment at the municipal level, Handbook on Wastewater
Management for Local Representatives: (http://www.dec.ny.gov/chemical/33879.html
Anderson, M.G. and Olivero Sheldon, A. 2011. Conservation Status of Fish, Wildlife, and Natural Habitats
in the Northeast Landscape: Implementation of the Northeast Monitoring Framework. The Nature
Conservancy, Eastern Conservation Science. 289 pp.
NYSDEC Inventory of Dams is available at: http://www.dec.ny.gov/lands/4991.html
NYSDEC information on stream crossing guidelines: http://www.dec.ny.gov/permits/49066.html
NYSDEC information for dam owners: http://www.dec.ny.gov/lands/66952.html
NYSDEC dam owners guidance manual: http://www.dec.ny.gov/lands/4991.html
NYSDEC New York Barrier Mitigation Forum of the New York State Nonpoint Source Hydrologic and Habitat
Modification Workgroup. 2010. Dam Removal and Barrier Mitigation in New York State, Preliminary
Guide for Dam Owners and Project Applicants. 50pp.
NYSDEC, Nonpoint Source Coordinating Committee—Hydrologic and Habitat Modification Workgroup. 2008. A
strategy for removing or mitigating dams in New York State and lessons learned in the Upper Susquehanna
Watershed. Prepared by USFWS, 3817 Luker Road Cortland, New York 13045. 37pp.
NYSDOT TNC draft final report 2011
University of New Hampshire, New Hampshire Stream Crossing Guidelines, May 2009,
http://www.unh.edu/erg/stream_restoration/nh_stream_crossing_guidelines_unh_web_rev_2.pdf

48
Landcover
The National Land Cover Dataset (NLCD, http://www.mrlc.gov/) has land cover and land
use information for the entire United States at a 30 square meter resolution. Each 30X30m square
is given a land cover/land use class. For impervious cover, the values of each square represent
the proportion of urban impervious surface estimated for that cell. Accuracy assessments are
underway for the 2006 dataset (used in this summary), but the 2001 NCLD was found to have a
country-wide accuracy of about 80%, with variations by geography and by identified class. It is
critical to note that the NLCD dataset is most reliable at regional scales and has important
limitations at our subwatershed scale. It should not be used for site planning and is not a
viable substitute for on-the-ground knowledge and site visits—the data is not necessarily
accurate at particular locations in the town, and does not collect information on many important
habitat types. Read more about the applications and limitations on the NLCD factsheet
(http://pubs.usgs.gov/fs/2012/3020/). Used in an appropriate manner, the land cover/land use
data can be a useful tool to understand patterns of land use in towns and to identify areas of
concern where land use could be impacting our water resources.
Aquifers
Aquifers were mapped by the USGS in partnership with the NYSDEC in New York State
in the mid-1980s. They show significant unconsolidated aquifers: those that consist of sand and
gravel and yield large supplies of water to wells. Bedrock aquifers, although significant in some
areas, were not addressed. Because the scale of the original aquifer maps is 1:250,000, these
maps indicate only the general location of the unconsolidated aquifers; they are not intended
for detailed site evaluations. Determination of the precise location of aquifer boundaries or of
well yields may require additional data, according to authors of the source maps. Figure 4 is
included as a general indication of where aquifers have been identified.
Figure 4 shows two classes of aquifers:
o UNCONFINED AQUIFER, Mid Yield (10 to 100 gallons per minute) - Sand and
gravel with saturated zone generally less than 10 ft thick. Thicker deposits with
less permeable silty sand and gravel may also be included. Yields in areas
adjacent to streams may exceed 100 gal/min through pumping-induced
infiltration, but these areas are too small to show at 1:250,000 scale.
o UNCONFINED AQUIFER, High Yield (More than 100 gallons per minute) -
Sand and gravel of high transmisivity with saturated thickness greater than 10 ft.
Many such areas are associated with a surface water source that can provide
pumping-induced recharge
There are a limited number of places in the Hudson Valley where aquifers have been
mapped at a 1:24000 scale, a much finer scale. Information on these locations and this project
can be found on the USGS’s New York Water Science Center (ny.water.usgs.gov) website, and a
map of these locations can be found here: ny.water.usgs.gov/projects/bgag/aquifer.maps/
aquifer1.maps.html.
Impervious Cover
NLCD impervious cover information is not fine-scale enough to be useful at the site plan
scale, determining impervious cover amounts and locations on particular parcels or projects. It is
49
possible to collect impervious cover information at a more useful scale for planning at the
subwatershed or finer scale. Several counties have undertaken their own, fine-scale, impervious
cover mapping that will enable them to direct watershed management actions to the parts of our
communities that need it most. Contact a watershed specialist at the Hudson River Estuary
Program for more information.
Stream Assessments-Biomonitoring
The Stream Biomonitoring Unit chooses sample sites to meet several goals:
characterizing regional reference sites, monitoring long-term sites, assessing unassessed waters,
and monitoring sites that are of departmental, regional and/or public interest. Sites are also
selected randomly within a region to provide a more unbiased dataset. Targeted sites make up
approximately 60% of sites, while random sites comprise 40%.

As a local government, you can use home rule authority to protect natural areas. The following are
general conservation principles that you can use in land use planning and decision-making to conserve
important natural resources that create a sustainable, resilient future for the Hudson River Estuary and its
watershed. The 2010-2014 Hudson River Estuary Action Agenda identifies specific natural resources as critical
for local protection, including areas important for fish and wildlife, clean water, scenery, the local economy,
recreational opportunities and adaptation to climate change. For more information on the Action Agenda, visit
www.dec.ny.gov/lands/4920.html.
The principles are intended to be broad guidelines that can be tailored to your local situation. In general,
concentrated development that is sited to avoid important resources and leaves large undisturbed areas intact is
better than low density development for protecting water quality and quantity, wildlife, and habitat. When
development is sited in this way, your community is better prepared for floods, droughts, sea level rise and
other environmental issues. As you apply the principles, consider natural resources at all scales: site-scale (e.g.,
project review), municipal-scale (e.g., comprehensive plans, zoning codes, open space plans) and regional scale
(e.g., watershed plans, county plans), and remember that natural systems cross political and property
boundaries. For help applying the principles in your community, contact the Hudson River Estuary Program.
to support the Estuary and
provide community benefits. Key resources identified in the Hudson River Estuary Action Agenda:
Hudson River tidal wetlands, shoreline, and plant beds are filters for pollution, nurseries for
the River’s fish, and habitats for rare plants and animals.
Wetlands throughout the watershed clean water, store flood water, feed streams and
groundwater, and are important habitat for fish, plants, and wildlife.
Streams, floodplains, and stream corridors store flood water, recharge ground water, clean
water, and are important fish and wildlife habitat.
Forests clean air, keep water clean and abundant, provide timber and carbon storage and are
important habitat for fish and wildlife.
Shrublands and grasslands, including working farms, are an important part of rural character,
store carbon, and provide important habitat for plants and wildlife, especially birds.
Broad connections between natural areas across property and political boundaries allow for
movement of water and wildlife.
, including site-based project
review and local planning, as well as intermunicipal and regional efforts. Use existing local and regional
science-based information where available, and collect new information where appropriate.
wherever possible. Larger areas are
better able to adapt to disturbances such as fire, floods, blowdowns, invasive species and climate change.
Protect contiguous areas in large, circular or broadly-shaped configurations within the larger landscape.
wherever possible. These rural
land uses are scenic and economic resources that can support the health of the Estuary and natural resources
in its watershed when local farmers and woodland owners use best management practices.
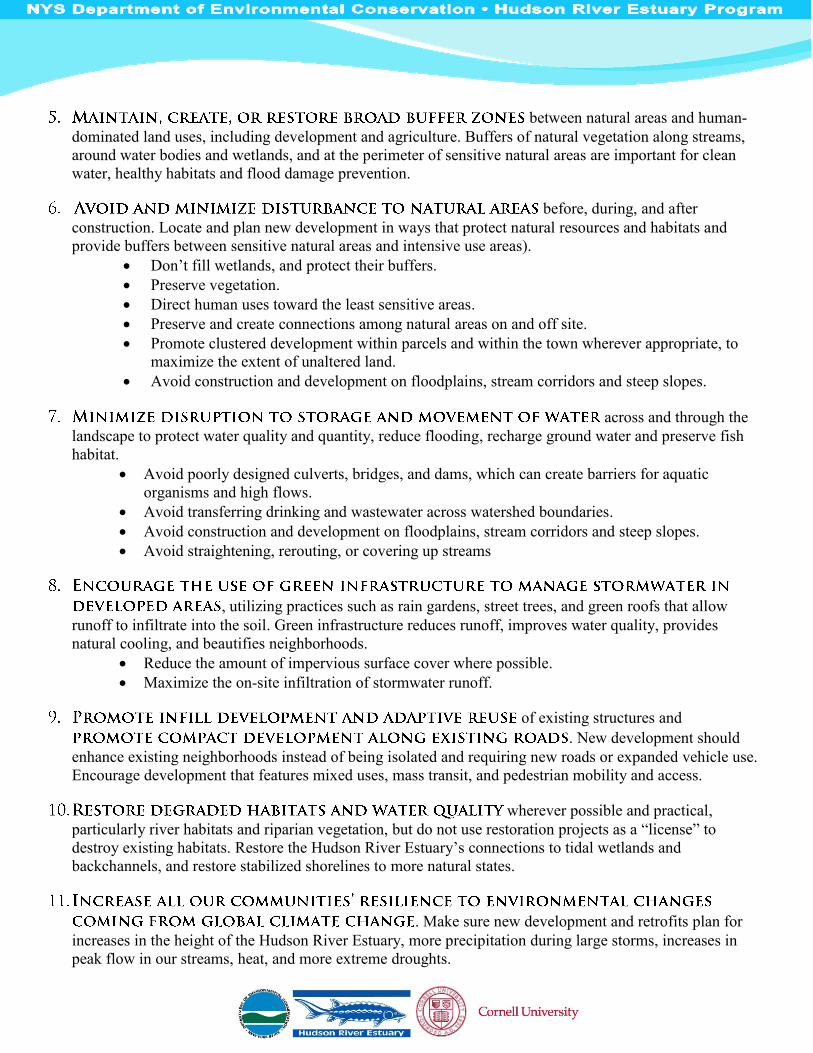
between natural areas and human-
dominated land uses, including development and agriculture. Buffers of natural vegetation along streams,
around water bodies and wetlands, and at the perimeter of sensitive natural areas are important for clean
water, healthy habitats and flood damage prevention.
before, during, and after
construction. Locate and plan new development in ways that protect natural resources and habitats and
provide buffers between sensitive natural areas and intensive use areas).
Don’t fill wetlands, and protect their buffers.
Preserve vegetation.
Direct human uses toward the least sensitive areas.
Preserve and create connections among natural areas on and off site.
Promote clustered development within parcels and within the town wherever appropriate, to
maximize the extent of unaltered land.
Avoid construction and development on floodplains, stream corridors and steep slopes.
across and through the
landscape to protect water quality and quantity, reduce flooding, recharge ground water and preserve fish
habitat.
Avoid poorly designed culverts, bridges, and dams, which can create barriers for aquatic
organisms and high flows.
Avoid transferring drinking and wastewater across watershed boundaries.
Avoid construction and development on floodplains, stream corridors and steep slopes.
Avoid straightening, rerouting, or covering up streams
, utilizing practices such as rain gardens, street trees, and green roofs that allow
runoff to infiltrate into the soil. Green infrastructure reduces runoff, improves water quality, provides
natural cooling, and beautifies neighborhoods.
Reduce the amount of impervious surface cover where possible.
Maximize the on-site infiltration of stormwater runoff.
of existing structures and
. New development should
enhance existing neighborhoods instead of being isolated and requiring new roads or expanded vehicle use.
Encourage development that features mixed uses, mass transit, and pedestrian mobility and access.
wherever possible and practical,
particularly river habitats and riparian vegetation, but do not use restoration projects as a “license” to
destroy existing habitats. Restore the Hudson River Estuary’s connections to tidal wetlands and
backchannels, and restore stabilized shorelines to more natural states.
. Make sure new development and retrofits plan for
increases in the height of the Hudson River Estuary, more precipitation during large storms, increases in
peak flow in our streams, heat, and more extreme droughts.