Embed Size (px)
Citation preview
Town Centres 2013
June 2013
Prepared by: Prepared for:
Accent Chiswick Gate 598-608 Chiswick High Road London W4 5RT
Transport for London 13th Floor, Windsor House 42-50 Victoria Street London SW1H 0TL
Contact: Chris Heywood Contact: Emily Price E-mail: [email protected] Tel: 020 8742 2211 Fax: 020 8742 1991
File name: J:\2541 Town Centres Study 2013\WP\2541rep03.doc
Registered in London No. 2231083 Accent Marketing & Research Limited Registered Address: 30 City Road, London, EC1Y 2AB
CONTENTS Executive Summary .................................................................................................................... i
1. INTRODUCTION ............................................................................................................. 1 1.1 Background ....................................................................................................................... 1 1.2 Objectives .......................................................................................................................... 1
2. METHODOLOGY ............................................................................................................ 2 2.1 Introduction ....................................................................................................................... 2 2.2 Method ............................................................................................................................... 3 2.3 Retail Park Pilot ................................................................................................................. 5 2.4 Hackney ............................................................................................................................. 5
3. FINDINGS ........................................................................................................................ 7 3.1 Introduction ....................................................................................................................... 7 3.2 Purpose of Visit ................................................................................................................. 9 3.3 Time Spent in Town Centre ............................................................................................ 13 3.4 Frequency of Visiting ...................................................................................................... 15 3.5 Mode of Transport ........................................................................................................... 18 3.6 Attitudes to and Use of Bus ............................................................................................. 28 3.7 Encouraging Cycling ....................................................................................................... 38 3.8 Attitudes towards Town Centres ..................................................................................... 39 3.9 Use of Other Shopping Centres ....................................................................................... 45 3.10 Oxford Street/Regent Street ............................................................................................ 47 3.11 Shopping and Expenditure in the Area ............................................................................ 49 3.12 Average Spend ................................................................................................................ 52 3.13 Online Shopping .............................................................................................................. 58 3.14 Respondent Characteristics ............................................................................................. 61
4. RETAIL PARK PILOT FINDINGS ............................................................................... 75 4.1 Introduction ..................................................................................................................... 75 4.2 Purpose of Visit ............................................................................................................... 75 4.3 Time Spent ...................................................................................................................... 78 4.4 Frequency of Visiting ...................................................................................................... 79 4.5 Mode of Transport ........................................................................................................... 80 4.6 Attitudes to and Use of Bus ............................................................................................. 86 4.7 Attitudes towards Retail Park .......................................................................................... 87 4.8 Use of Other Shopping Centres ....................................................................................... 87 4.9 Shopping and Expenditure in the Area ............................................................................ 88 4.10 Average Spend ................................................................................................................ 89 4.11 Online Shopping .............................................................................................................. 91 4.12 Respondent Characteristics ............................................................................................. 93
5. HACKNEY ................................................................................................................... 102 5.1 Introduction ................................................................................................................... 102 5.2 Visitor Survey Additional Questions............................................................................. 102 5.3 Business Interviews ....................................................................................................... 106 5.4 An interview with the Town Centre Manager ............................................................... 110 Appendix A: Paper Version of Questionnaire
Appendix B: Key Results by Town Centre

Appendix C: Response and Weighting Factors
Appendix D: Retail Park Sampling Method
Appendix E: Paper version of Retail Park Questionnaire
Appendix F: Hackney Business Questionnaire
Appendix G: Town Centre Manager Topic Guide
Accent Town Centres 2013 report FINAL REPORT TO USECH08.05.13 Page i of iii
EXECUTIVE SUMMARY Introduction TfL commissioned research to establish the contribution made by bus users and other modes to the economic health and viability of town centres across London. This research follows previous town centres studies in 2011, 2009, 2003-4 and 1999. The locations varied between studies although a few were covered in one or more. The locations were always a mix of regional, local and international town centres. Method Face-to-face research was conducted on-street with a sample of about 300 visitors to each of 14 town centres. Central London: Aldgate, Oxford Street/Regent Street Inner London: Bethnal Green, Hackney, Harlesden, Kingsland High Street,
Hornchurch, Shepherds Bush, Wood Green Outer London: Bromley, Ealing Broadway, Hounslow, Kingston, Romford Town. Fieldwork was conducted between 5 March and 12 April 2013. 4,345 interviews were conducted, about 300 at each town centre except Hackney where there was a booster of 160 interviews. Main Findings Purpose of Visit
The majority of visitors to most town centres lived and/or worked more than ten minutes walk from the town centre.
Shopping was the main reason for visiting the town centres: for 75% it was one of the purposes and for 60% the main purpose. Eating and drinking out was also important being mentioned by 23% but was only the main purpose for 7%.
Time Spent in Town Centre
69% of visitors were planning to spend at least one hour in the town centre with 45% spending between one and three hours.
Those who walked and cycled to the area tended to spend less time in the town centre. Those who travelled by train/Tube (83%), car (80%) and bus (67%) were planning to spend more than an hour in the town centre.
Frequency of Visiting
77% of visitors were visiting the area once a week or more often. The average number of visits per month was 11.3.
Those who walk to the area are the most frequent visitors (49% visit five days a week or more) followed by train/Tube users (31%) and bus users (28%). Car users visit less often (17%).
Accent Town Centres 2013 report FINAL REPORT TO USECH08.05.13 Page ii of iii
Shopping and Expenditure in the Area 45% were shopping for groceries and food, 29% were shopping for clothes or
footwear, 19% were using a service and 16% were eating out. The average spend was £37 on the day of interview which is similar to the usual
spend per visit (£34). The average spend per week was £69. The mean monthly spend is £277
Average spend per visit by mode was car £46, train/Tube £41, bus £32, walk £25 and cycle £22.
Average spend per week by mode was walk £86, bus £73, car £62, train/Tube £48 and cycle £48
Average spend per month by mode was walk £346, bus £292, train/Tube £239, car £247 and cycle £190.
Mode of Transport
34% use bus to access the town centre, 27% walk, 13% use train/Tube, 12% use car and 2% cycle.
50% use the Tube to go to Central London (5-9% elsewhere). 20% use car in Outer London town centres compared to 10% in Inner London and 2% in Central London.
The main reason for using each mode is: car: quicker (27%), bus: cheaper (29%), train/Tube: quicker (54%), cycle: need/enjoy the exercise (34%) and walk: live very close by (37%).
Walking was the most frequently used mode. The weekly mean frequency for the different modes was: car 1.8, bus 2.7, train/Tube 2.3, bicycle 2.6 and walk 3.8.
Car drivers were satisfied with the ease of access to town centre by car and the number of parking spaces provided (mean scores of 7.5 and 7.3 respectively on a scale from 0, very dissatisfied to 10, very satisfied).
Attitudes to and Use of Bus
76% sometimes use the bus to travel in the area of the town centre Bus use increased by 3% compared to twelve months ago Bus customers were most positive about the ease of getting on and off the bus
(mean score 7.98) and the convenience of bus stops (7.71). Bus users were least satisfied with value for money (6.83) and the level of crowding on the bus (7.0)
There was strong agreement that there should be stricter bus lane enforcement (mean score 7.71), that bus stops are conveniently located (7.43) and for goods vehicles not to be allowed in bus lanes (6.97)
The top three single factors that would encourage greater use of the bus were more regular/frequent buses (11%), lower fares (10%) and faster journeys (6%).
Attitudes towards Town Centres
The main ways that the town centres could be improved were better range of shops (32%), to make the streets cleaner (27%) and improving shops/better quality shops (21%). 18% said nothing could be done.
67% of town centre visitors felt very safe and 29% felt fairly safe during the day. Of those who went out in the town centre after dark, only 30% said they felt very safe and 42% fairly safe.
Accent Town Centres 2013 report FINAL REPORT TO USECH08.05.13 Page iii of iii
Oxford Street/Regent Street Oxford Street is visited because of its shopping facilities: 36% considered it to
be the best shopping area, 20% were visiting a particular shop and 18% cited ‘more/better/bigger range of shops’
29% were aware of the changes to travel around Tottenham Court Road Of those who were aware 43% knew it was because of building rail/Crossrail
station 39% had used the diagonal crossing at Oxford Circus and there were very high
levels of satisfaction with both the safety and ease of crossing the road on the diagonal crossing.
Accent Town Centres 2013 report FINAL REPORT TO USECH31.05.13 Page 1 of 111
1. INTRODUCTION
1.1 Background
TfL has made significant improvements to and investment in the transport infrastructure in London resulting in high levels of bus use as well as increasing levels of cycle and walking trips. TfL commissioned research to establish the contribution made by bus users and other modes to the economic health and viability of town centres across London. This research follows previous town centres studies in 2011, 2009, 2003-4 and 1999.
1.2 Objectives
The main objective of the research is to determine the shopping behaviour, frequency and spend of visitors by different modes in selected town centres. Other specific objectives are: to look at modal split, catchment area by mode and perceptions of accessibility to compare the shopping behaviour and contribution of bus passengers to car users
and users of other modes including walk and cycle.
Accent Town Centres 2013 report FINAL REPORT TO USECH31.05.13 Page 2 of 111
2. METHODOLOGY
2.1 Introduction
The research was conducted on-street with a sample of visitors to each of the selected town centres The research was undertaken in 14 locations around London. These were selected by TfL in order to provide a range of different types of centre in terms of economic mix, scale of retail activity/presence of major stores, transport networks, road layout, traffic flow, parking provision etc as well as allowing for some comparisons with previous Town Centres surveys. In addition, some of the sites were chosen as they had town centre schemes planned. The locations were: Aldgate Bethnal Green Bromley Ealing Hackney Harlesden Hornchurch Hounslow Kingsland High Street Kingston Oxford Street/Regent Street Romford Town Shepherds Bush Wood Green. Bromley, Kingston and Oxford Street/Regent Street were also surveyed in 2011, 2009 and 2004. Ealing, Hackney, Harlesden and Wood Green were also surveyed in 2011 and Romford was also surveyed in 2009. For analysis purpose these were grouped as follows: Central London: Aldgate, Oxford Street/Regent Street Inner London: Bethnal Green, Hackney, Harlesden, Kingsland High Street,
Hornchurch, Shepherds Bush, Wood Green Outer London: Bromley, Ealing Broadway, Hounslow, Kingston, Romford Town. In addition, analysis was undertaken by the town centre categories as used in the London Plan. International: Oxford Street/Regent Street Metropolitan: Bromley, Ealing, Wood Green, Kingston, Hounslow, Romford
Town, Shepherds Bush Major: Kingsland High Street, Hackney District: Bethnal Green, Harlesden, Hornchurch.
Accent Town Centres 2013 report FINAL REPORT TO USECH31.05.13 Page 3 of 111
Aldgate was unclassified as not included as a town centre in the London Plan.
2.2 Method
Face-to-face interviews using a Computer Aided Personal Interview (CAPI) questionnaire programmed for Personal Digital Assistants (PDAs) were undertaken for the majority of the fieldwork. This was supplemented with face-to-face interviews using paper questionnaires for just 29 interviews1. At each town centre interviewing was conducted at three2 Enumeration Points (EPs) in order to ensure that all parts of the centre were included and all types of visitor were covered. For each town centre a map was used as show material during the interviews. The maps showed the specific area of interest that respondents should consider when completing the interview. Also shown on the maps were the locations where the interviewers stood to conduct the fieldwork (the Enumeration Points (EP).
Respondents were selected using a random 1 in 3 approach. All interviews were conducted with adult visitors to the area. Visitors were described as anyone visiting the town centre (as shown on a map) to use the shops or facilities (ie retail based facilities/services, entertainment etc) of the town centre at the time of interview. Those just passing through (eg on their way to work, just happen to live/work in the area and not using the shops/facilities at that time) were excluded (except at Oxford Street/Regent Street). The core fieldwork was conducted between 5 March and 12 April 2013. The target was 300 interviews in each of the town centres, except Hackney where the target was 450: 4,350 interviews in total. In practice 4,345 interviews were conducted as follows: Aldgate 291 Bethnal Green 290 Bromley 304 Ealing Broadway 307 Hackney 460 Harlesden 299 Kingsland High Street 289 Hornchurch 308 Hounslow 306 Kingston 298 Oxford Street/Regent Street 296 Romford Town 300
1 for technical reasons eg when PDA did not work 2 except Harlesden where there were two EPs
Accent Town Centres 2013 report FINAL REPORT TO USECH31.05.13 Page 4 of 111
Shepherds Bush 301 Wood Green 297 Interviews were spread over different days and times in order to provide a spread of different types of visitor to the town centre locations. Interview shift times were: Weekdays: 08:00-14:00 and 12:00 to 18:00 Saturdays: 10:00-16:00 and 12:00 to 18:00 Sundays: 11:00-17:00. Enumeration Points Where the town centre had been covered before we used the same EPs as before. There was one exception: at Hackney where EP1 was moved a third of the way up Amhurst Road and EP3 was added in Mare Street. For ‘new’ town centres3 the selection of the locations was on the basis that they provided good customer traffic flow, eg central points within the town. Weighting The target distribution of interviews was 70% weekday, 20% Saturday and 10% Sunday. The achieved interview distribution was 73% weekday, 19% Saturday and 8% Sunday. Weights were applied so that the data matched the target distribution by weekdays, Saturdays and Sundays. Details of the weighting factors applied to the data are included in Appendix C. In addition, the data from Hackney was weighted from 463 to 300 interviews for the overall analysis so that Hackney responses were not over represented in the overall analysis. The resulting overall weighted sample size was 4,185. Questionnaire The questionnaire was based on the one used in the previous Town Centre surveys. The previous questionnaires were mainly based on the impact of bus service improvements. This research focused less on bus and included the following ‘new’ areas: Satisfaction with waiting facilities at the bus stop Use of pedestrian information signs
If yes, ease of use and whether information on the signs was helpful ease of movement around the area A copy of the paper version of the final questionnaire is included in Appendix A.
3 Aldgate, Bethnal Green, Hornchurch, Hounslow, Kingsland High Street, Shepherds Bush
Accent Town Centres 2013 report FINAL REPORT TO USECH31.05.13 Page 5 of 111
2.3 Retail Park Pilot
In the town centres research to date retail parks had not been covered. Transport for London wished to address this omission. However, as much of the standard town centre questionnaire was not applicable and because the sampling of respondents was necessarily different a pilot study was undertaken at Tottenham Hale retail park. Sampling was undertaken at six EPs and at each the interviewer covered the entrances to all the stores in their area so that, over the whole of the research, all stores were evenly sampled. Details of the sampling method are included in Appendix D and a copy of the paper version of the questionnaire is included in Appendix E. The fieldwork was conducted between 27 March and 7 April 2013.
2.4 Hackney
At Hackney town centre, because of the planned pedestrianisation of Narrow Way leading to the rerouting of some buses some additional research was undertaken. This comprised: A booster of 150 interviews to the visitor survey and some additional questions Fifteen interviews with retail and catering outlet managers in the town centre An interview with the Town Centre Manager. The method for each of these is described below: A booster of 150 on street interviews with some additional questions A booster of 150 interviews to make the planned total 450 interviews. An ‘after’ survey is planned for autumn 2013 with a similar sample size to gauge the impact of the changes and the larger sample size will allow for robust ‘before’ and ‘after’ comparisons to be made. The questionnaire included the following additional questions for Hackney town centre respondents: For bus users:
bus number used Which stop got off at Satisfaction with the amount of time it took to walk from the bus stop to where
you wanted to go today’ Which roads visited or planned to visit. The Hackney Town Centre results are integrated within the main findings presented in Chapter 3. The additional questions for Hackney respondents are reported on in Chapter 4.
Accent Town Centres 2013 report FINAL REPORT TO USECH31.05.13 Page 6 of 111
Fifteen interviews with retail and catering outlet managers in the town centre The interviews were undertaken face-to-face with managers of retail and catering establishments in Mare Street (both the northern part ‘Narrow Way’ and the southern part). Minimum and achieved quotas on business type are shown below: Business Type Minimum Achieved
Retail 5 7 Catering 5 8
Size of Business Sole Trader 1 1 2 to 4 2 4 5 to 9 2 6 10 to 20 1 2 20+ 1 2
A copy of the questionnaire is included in Appendix F. An interview with the Town Centre Manager The town centre manager for Hackney, Hannah Dalgleish, was interviewed to ascertain her views on the town centre as a whole and specifically on the impacts of the proposed pedestrianisation. The interview was conducted by telephone on 10 April 2013. The topic guide is attached as Appendix G.
Accent Town Centres 2013 report FINAL REPORT TO USECH31.05.13 Page 7 of 111
3. FINDINGS
3.1 Introduction
This chapter sets out the findings of the 2013 Town Centre study. The findings are based on interviews at the following 14 town centres: Aldgate Bethnal Green Bromley Ealing Broadway Hackney Harlesden Kingsland High Street Hornchurch Hounslow Kingston Oxford Street/Regent Street Romford Town Shepherds Bush Wood Green. The weighted overall sample size was 4,185. Changes over time A similar research approach and questionnaire has been used in the last four phases of town centres studies (2013, 2011, 2009 and 2003-4) and this provides an opportunity for temporal comparisons.
Accent Town Centres 2013 report FINAL REPORT TO USECH31.05.13 Page 8 of 111
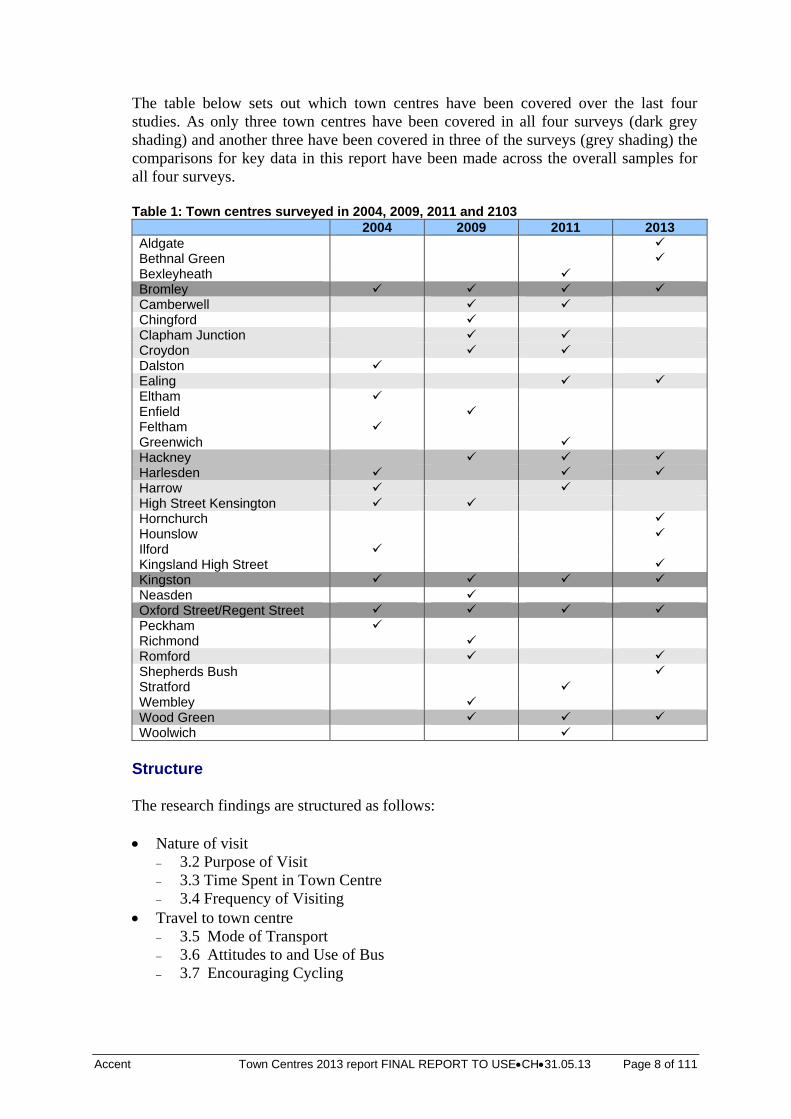
The table below sets out which town centres have been covered over the last four studies. As only three town centres have been covered in all four surveys (dark grey shading) and another three have been covered in three of the surveys (grey shading) the comparisons for key data in this report have been made across the overall samples for all four surveys. Table 1: Town centres surveyed in 2004, 2009, 2011 and 2103 2004 2009 2011 2013 Aldgate Bethnal Green Bexleyheath Bromley Camberwell Chingford Clapham Junction Croydon Dalston Ealing Eltham Enfield Feltham Greenwich Hackney Harlesden Harrow High Street Kensington Hornchurch Hounslow Ilford Kingsland High Street Kingston Neasden Oxford Street/Regent Street Peckham Richmond Romford Shepherds Bush Stratford Wembley Wood Green Woolwich
Structure The research findings are structured as follows: Nature of visit
3.2 Purpose of Visit 3.3 Time Spent in Town Centre 3.4 Frequency of Visiting
Travel to town centre 3.5 Mode of Transport 3.6 Attitudes to and Use of Bus 3.7 Encouraging Cycling
Accent Town Centres 2013 report FINAL REPORT TO USECH31.05.13 Page 9 of 111
Attitudes
3.8 Attitudes towards Town Centres 3.9 Use of Other Shopping Centres
Oxford Street/Regent Street Goods purchased and spend
3.11 Shopping and Expenditure in the Area 3.12 Average Spend 3.13 Online Shopping
Respondent Characteristics. Appendix B contains data on demographics, mode of access, frequency of visit, main purpose, spend and town centre improvements by town centre. Further data is available on request.
3.2 Purpose of Visit
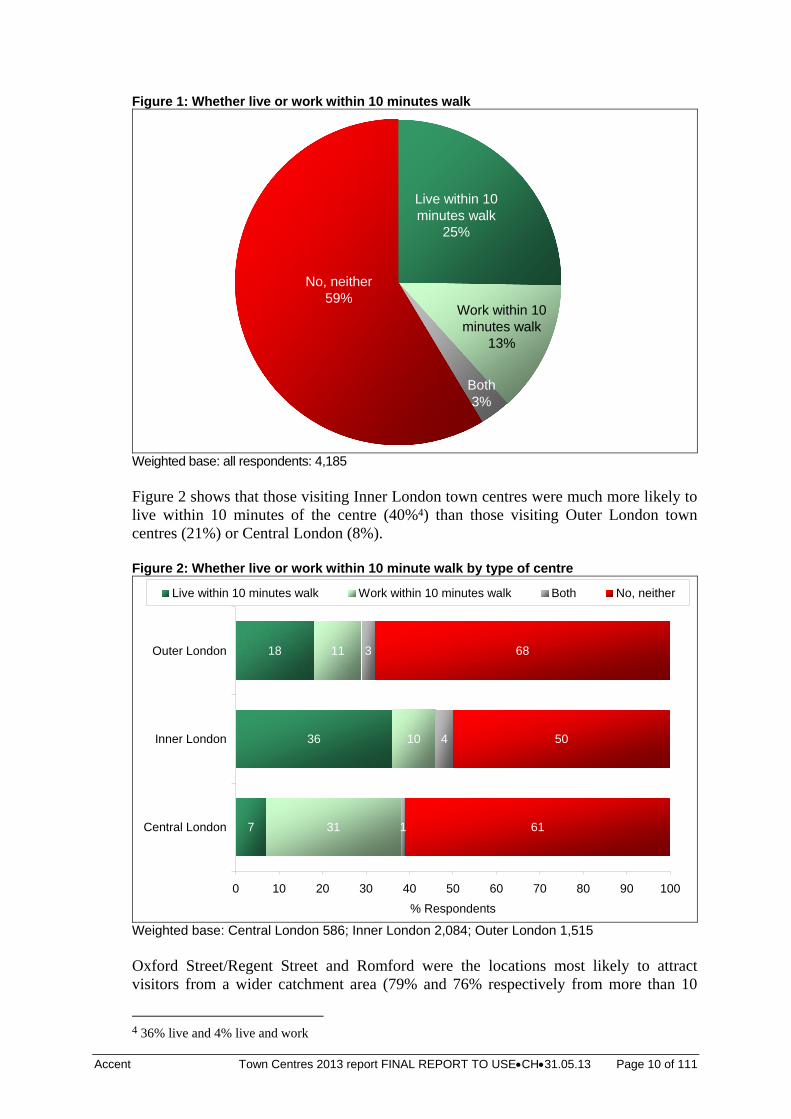
Summary The majority of visitors to most town centres lived and/or worked more than ten minutes walk from the town centre. Visitors to Inner London town centres were much more likely to live within 10 minutes of the centre (40%) than those visiting Outer London town centres (21%) or Central London (8%). Shopping was the main reason for visiting the town centres: for 75% it was one of the purposes and for 60% the main purpose. Eating and drinking out was also important being mentioned by 23% but was only the main purpose for 7%. The town centres are used by both those who live and work in the area and by visitors from outside the area. The majority (59%) do not live or work within 10 minutes walk of the town centre but 25% live in the area, 13% work in the area and 3% both live and work within 10 minutes walk of the town centre.
Accent Town Centres 2013 report FINAL REPORT TO USECH31.05.13 Page 10 of 111
Figure 1: Whether live or work within 10 minutes walk
Both3%
Work within 10 minutes walk
13%
Live within 10 minutes walk
25%
No, neither59%
Weighted base: all respondents: 4,185 Figure 2 shows that those visiting Inner London town centres were much more likely to live within 10 minutes of the centre (40%4) than those visiting Outer London town centres (21%) or Central London (8%). Figure 2: Whether live or work within 10 minute walk by type of centre
7
36
18
31
10
11
1
4
3
61
50
68
0 10 20 30 40 50 60 70 80 90 100
Central London
Inner London
Outer London
% Respondents
Live within 10 minutes walk Work within 10 minutes walk Both No, neither
Weighted base: Central London 586; Inner London 2,084; Outer London 1,515 Oxford Street/Regent Street and Romford were the locations most likely to attract visitors from a wider catchment area (79% and 76% respectively from more than 10
4 36% live and 4% live and work
Accent Town Centres 2013 report FINAL REPORT TO USECH31.05.13 Page 11 of 111
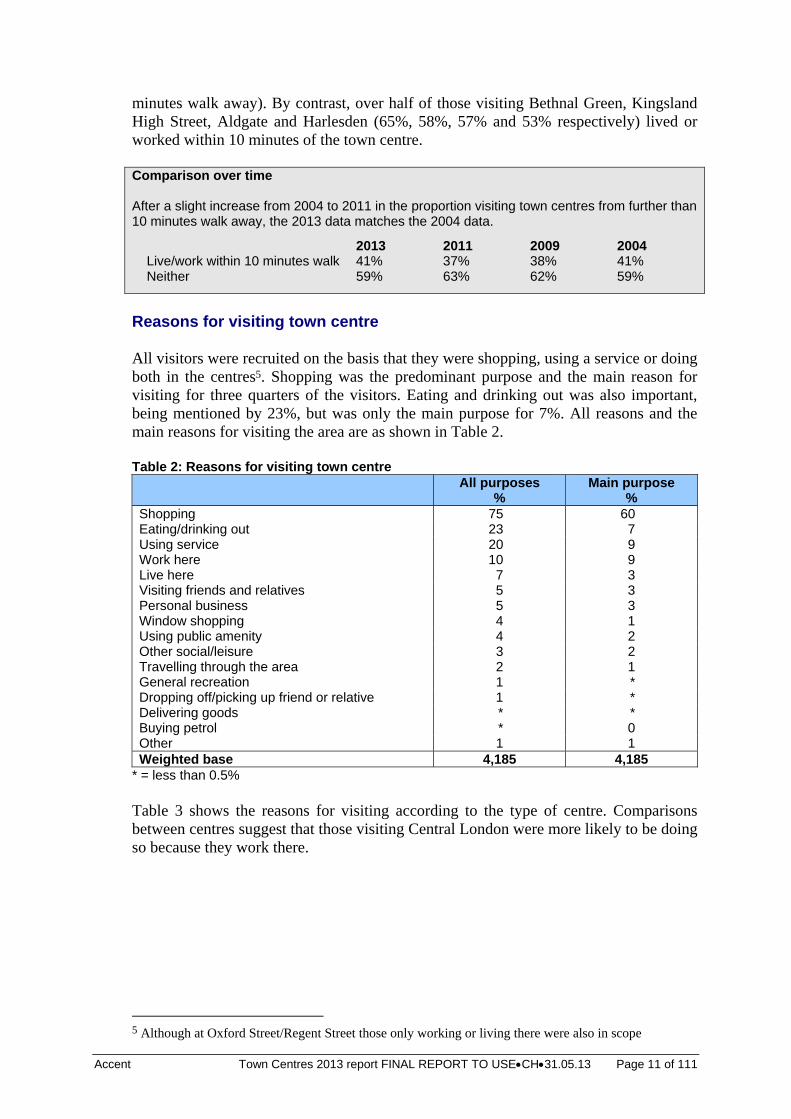
minutes walk away). By contrast, over half of those visiting Bethnal Green, Kingsland High Street, Aldgate and Harlesden (65%, 58%, 57% and 53% respectively) lived or worked within 10 minutes of the town centre. Comparison over time After a slight increase from 2004 to 2011 in the proportion visiting town centres from further than 10 minutes walk away, the 2013 data matches the 2004 data.
2013 2011 2009 2004 Live/work within 10 minutes walk 41% 37% 38% 41% Neither 59% 63% 62% 59%
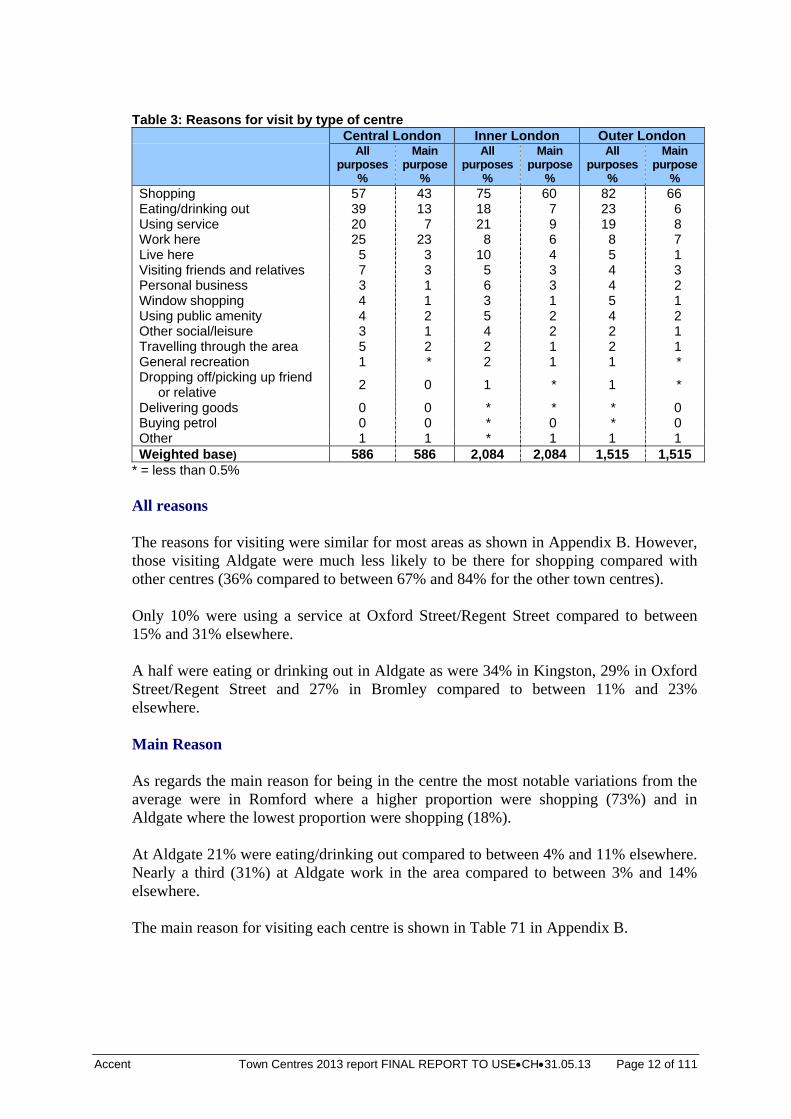
Reasons for visiting town centre All visitors were recruited on the basis that they were shopping, using a service or doing both in the centres5. Shopping was the predominant purpose and the main reason for visiting for three quarters of the visitors. Eating and drinking out was also important, being mentioned by 23%, but was only the main purpose for 7%. All reasons and the main reasons for visiting the area are as shown in Table 2. Table 2: Reasons for visiting town centre
All purposes
% Main purpose
% Shopping 75 60 Eating/drinking out 23 7 Using service 20 9 Work here 10 9 Live here 7 3 Visiting friends and relatives 5 3 Personal business 5 3 Window shopping 4 1 Using public amenity 4 2 Other social/leisure 3 2 Travelling through the area 2 1 General recreation 1 * Dropping off/picking up friend or relative 1 * Delivering goods * * Buying petrol * 0 Other 1 1 Weighted base 4,185 4,185
* = less than 0.5% Table 3 shows the reasons for visiting according to the type of centre. Comparisons between centres suggest that those visiting Central London were more likely to be doing so because they work there.
5 Although at Oxford Street/Regent Street those only working or living there were also in scope
Accent Town Centres 2013 report FINAL REPORT TO USECH31.05.13 Page 12 of 111
Table 3: Reasons for visit by type of centre
Central London Inner London Outer London
All
purposes %
Main purpose
%
All purposes
%
Main purpose
%
All purposes
%
Main purpose
% Shopping 57 43 75 60 82 66 Eating/drinking out 39 13 18 7 23 6 Using service 20 7 21 9 19 8 Work here 25 23 8 6 8 7 Live here 5 3 10 4 5 1 Visiting friends and relatives 7 3 5 3 4 3 Personal business 3 1 6 3 4 2 Window shopping 4 1 3 1 5 1 Using public amenity 4 2 5 2 4 2 Other social/leisure 3 1 4 2 2 1 Travelling through the area 5 2 2 1 2 1 General recreation 1 * 2 1 1 * Dropping off/picking up friend
or relative 2 0 1 * 1 *
Delivering goods 0 0 * * * 0 Buying petrol 0 0 * 0 * 0 Other 1 1 * 1 1 1 Weighted base) 586 586 2,084 2,084 1,515 1,515
* = less than 0.5% All reasons The reasons for visiting were similar for most areas as shown in Appendix B. However, those visiting Aldgate were much less likely to be there for shopping compared with other centres (36% compared to between 67% and 84% for the other town centres). Only 10% were using a service at Oxford Street/Regent Street compared to between 15% and 31% elsewhere. A half were eating or drinking out in Aldgate as were 34% in Kingston, 29% in Oxford Street/Regent Street and 27% in Bromley compared to between 11% and 23% elsewhere. Main Reason As regards the main reason for being in the centre the most notable variations from the average were in Romford where a higher proportion were shopping (73%) and in Aldgate where the lowest proportion were shopping (18%). At Aldgate 21% were eating/drinking out compared to between 4% and 11% elsewhere. Nearly a third (31%) at Aldgate work in the area compared to between 3% and 14% elsewhere. The main reason for visiting each centre is shown in Table 71 in Appendix B.
Accent Town Centres 2013 report FINAL REPORT TO USECH31.05.13 Page 13 of 111
Comparison over time Main changes over time are that shopping has increased since 2011 after falling from 2004 to 2011 and ‘work here’ and ‘live here’ have decreased since 2011.
Main reason 2013 2011 2009 2004 Shopping 60% 53% 58% 64% Eating/drinking out 7% 5% 7% 3% Using services 9% 8% 10% 8% Live here 3% 6% 2% 4% Work here 9% 10% 3% 7% Personal business 3% 4% 4% 3% Window shopping 1% 2% 2% 1% Visiting friends and relatives 3% 3% 2% 1% Using public amenity 2% 3% 4% 1% Other social/leisure 2% 2% 5% 1%
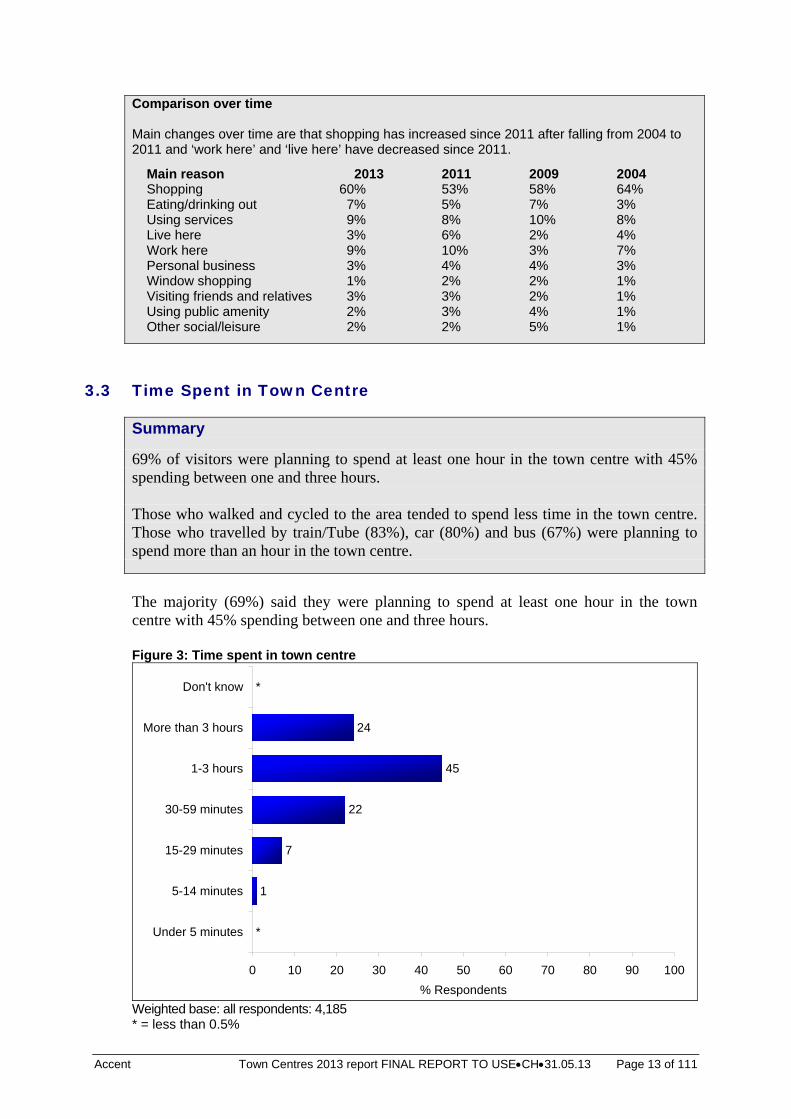
3.3 Time Spent in Town Centre
Summary
69% of visitors were planning to spend at least one hour in the town centre with 45% spending between one and three hours. Those who walked and cycled to the area tended to spend less time in the town centre. Those who travelled by train/Tube (83%), car (80%) and bus (67%) were planning to spend more than an hour in the town centre.
The majority (69%) said they were planning to spend at least one hour in the town centre with 45% spending between one and three hours. Figure 3: Time spent in town centre
1
7
22
45
24
*
*
0 10 20 30 40 50 60 70 80 90 100
Under 5 minutes
5-14 minutes
15-29 minutes
30-59 minutes
1-3 hours
More than 3 hours
Don't know
% Respondents Weighted base: all respondents: 4,185 * = less than 0.5%
Accent Town Centres 2013 report FINAL REPORT TO USECH31.05.13 Page 14 of 111
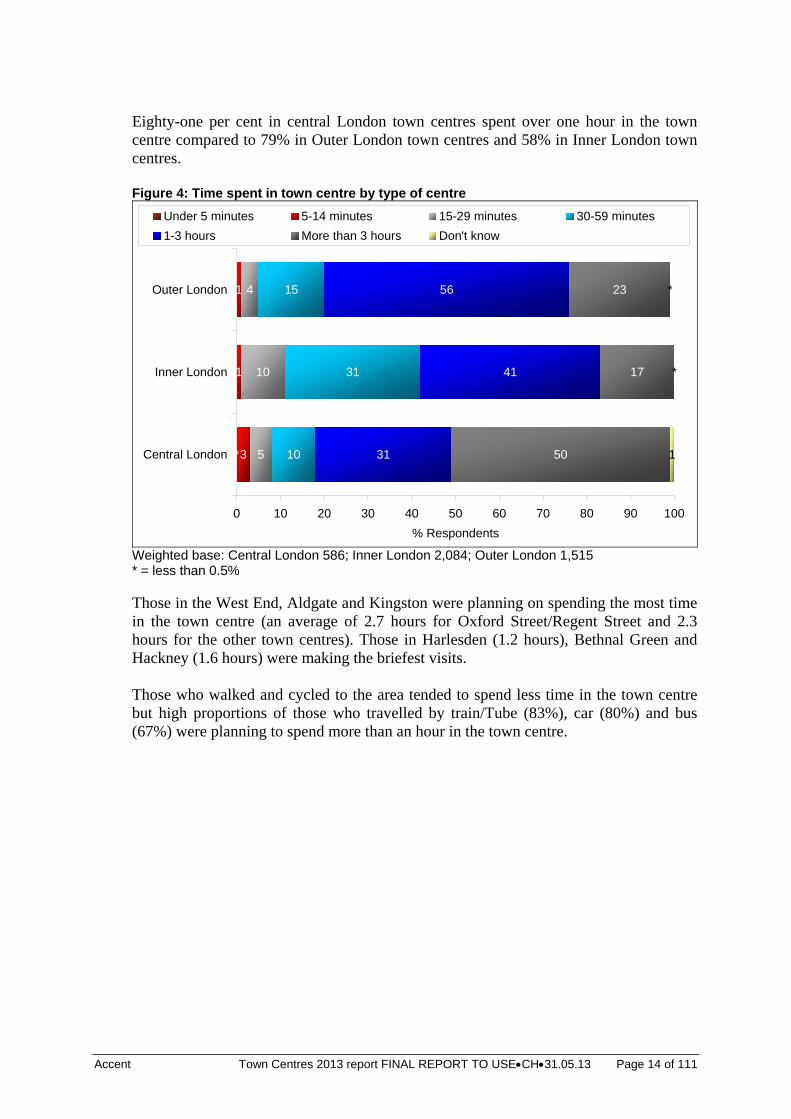
Eighty-one per cent in central London town centres spent over one hour in the town centre compared to 79% in Outer London town centres and 58% in Inner London town centres. Figure 4: Time spent in town centre by type of centre
3
1
1
5
10
4
10
31
15
31
41
56
50
17
23
1*
*
*
0 10 20 30 40 50 60 70 80 90 100
Central London
Inner London
Outer London
% Respondents
Under 5 minutes 5-14 minutes 15-29 minutes 30-59 minutes
1-3 hours More than 3 hours Don't know
Weighted base: Central London 586; Inner London 2,084; Outer London 1,515 * = less than 0.5% Those in the West End, Aldgate and Kingston were planning on spending the most time in the town centre (an average of 2.7 hours for Oxford Street/Regent Street and 2.3 hours for the other town centres). Those in Harlesden (1.2 hours), Bethnal Green and Hackney (1.6 hours) were making the briefest visits. Those who walked and cycled to the area tended to spend less time in the town centre but high proportions of those who travelled by train/Tube (83%), car (80%) and bus (67%) were planning to spend more than an hour in the town centre.
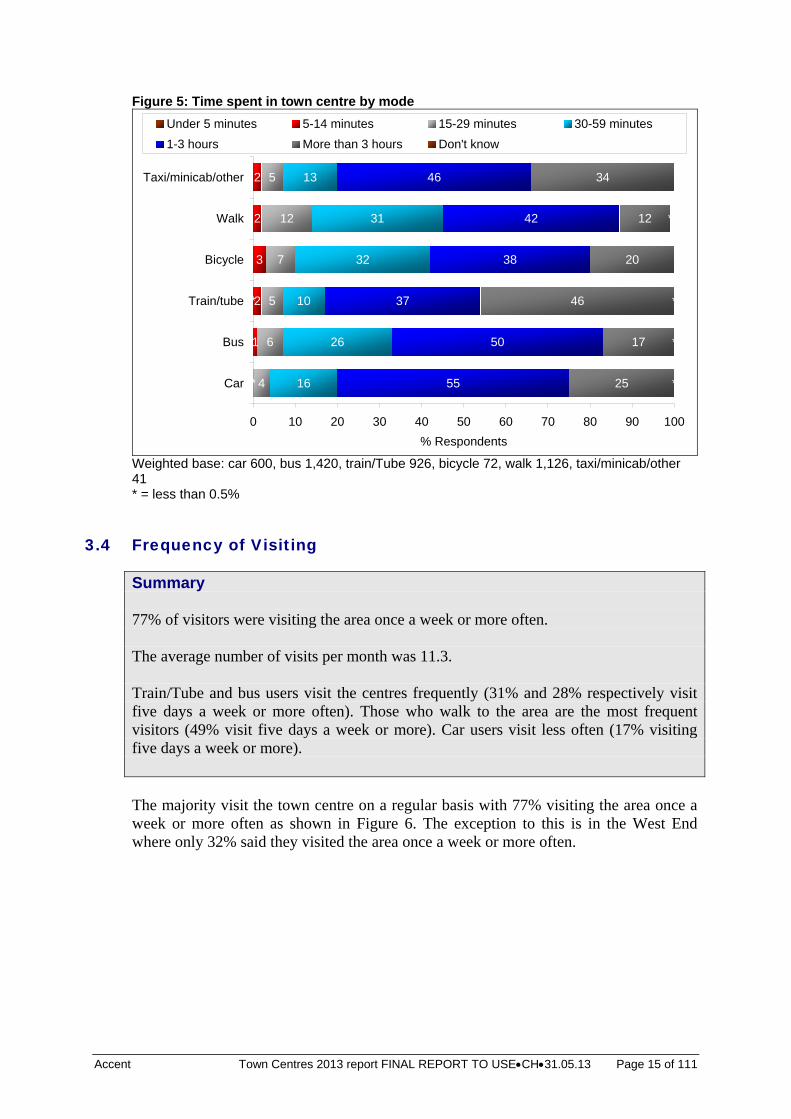
Accent Town Centres 2013 report FINAL REPORT TO USECH31.05.13 Page 15 of 111
Figure 5: Time spent in town centre by mode
1
2
3
2
2
4
6
5
7
12
5
16
26
10
32
31
13
55
50
37
38
42
46
25
17
46
20
12
34
*
* *
*
*
*
0 10 20 30 40 50 60 70 80 90 100
Car
Bus
Train/tube
Bicycle
Walk
Taxi/minicab/other
% Respondents
Under 5 minutes 5-14 minutes 15-29 minutes 30-59 minutes
1-3 hours More than 3 hours Don't know
Weighted base: car 600, bus 1,420, train/Tube 926, bicycle 72, walk 1,126, taxi/minicab/other 41 * = less than 0.5%
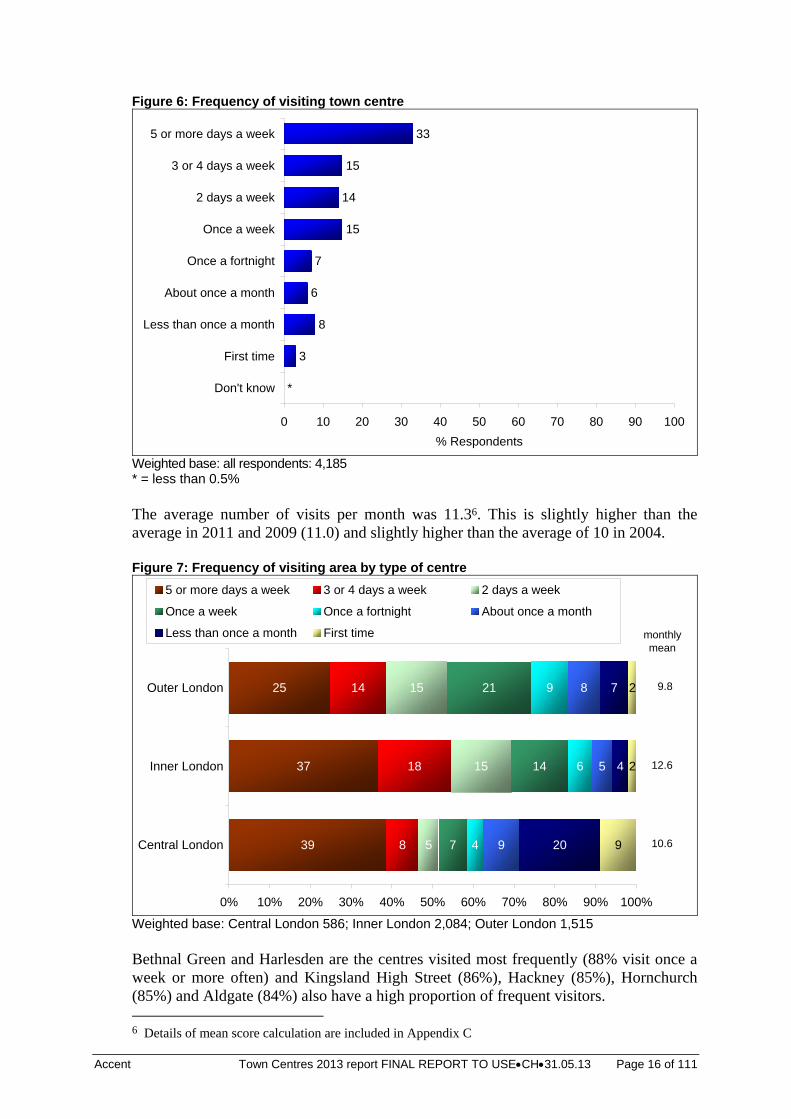
3.4 Frequency of Visiting
Summary 77% of visitors were visiting the area once a week or more often. The average number of visits per month was 11.3. Train/Tube and bus users visit the centres frequently (31% and 28% respectively visit five days a week or more often). Those who walk to the area are the most frequent visitors (49% visit five days a week or more). Car users visit less often (17% visiting five days a week or more). The majority visit the town centre on a regular basis with 77% visiting the area once a week or more often as shown in Figure 6. The exception to this is in the West End where only 32% said they visited the area once a week or more often.
Accent Town Centres 2013 report FINAL REPORT TO USECH31.05.13 Page 16 of 111
Figure 6: Frequency of visiting town centre
3
8
6
7
15
14
15
33
*
0 10 20 30 40 50 60 70 80 90 100
Don't know
First time
Less than once a month
About once a month
Once a fortnight
Once a week
2 days a week
3 or 4 days a week
5 or more days a week
% Respondents
Weighted base: all respondents: 4,185 * = less than 0.5% The average number of visits per month was 11.36. This is slightly higher than the average in 2011 and 2009 (11.0) and slightly higher than the average of 10 in 2004. Figure 7: Frequency of visiting area by type of centre
39
37
25
8
18
14
5
15
15
7
14
21
4
6
9
9
5
8
20
4
7
9
2
2
0% 10% 20% 30% 40% 50% 60% 70% 80% 90% 100%
Central London
Inner London
Outer London
5 or more days a week 3 or 4 days a week 2 days a week
Once a week Once a fortnight About once a month
Less than once a month First time
9.8
12.6
10.6
monthly mean
Weighted base: Central London 586; Inner London 2,084; Outer London 1,515 Bethnal Green and Harlesden are the centres visited most frequently (88% visit once a week or more often) and Kingsland High Street (86%), Hackney (85%), Hornchurch (85%) and Aldgate (84%) also have a high proportion of frequent visitors. 6 Details of mean score calculation are included in Appendix C
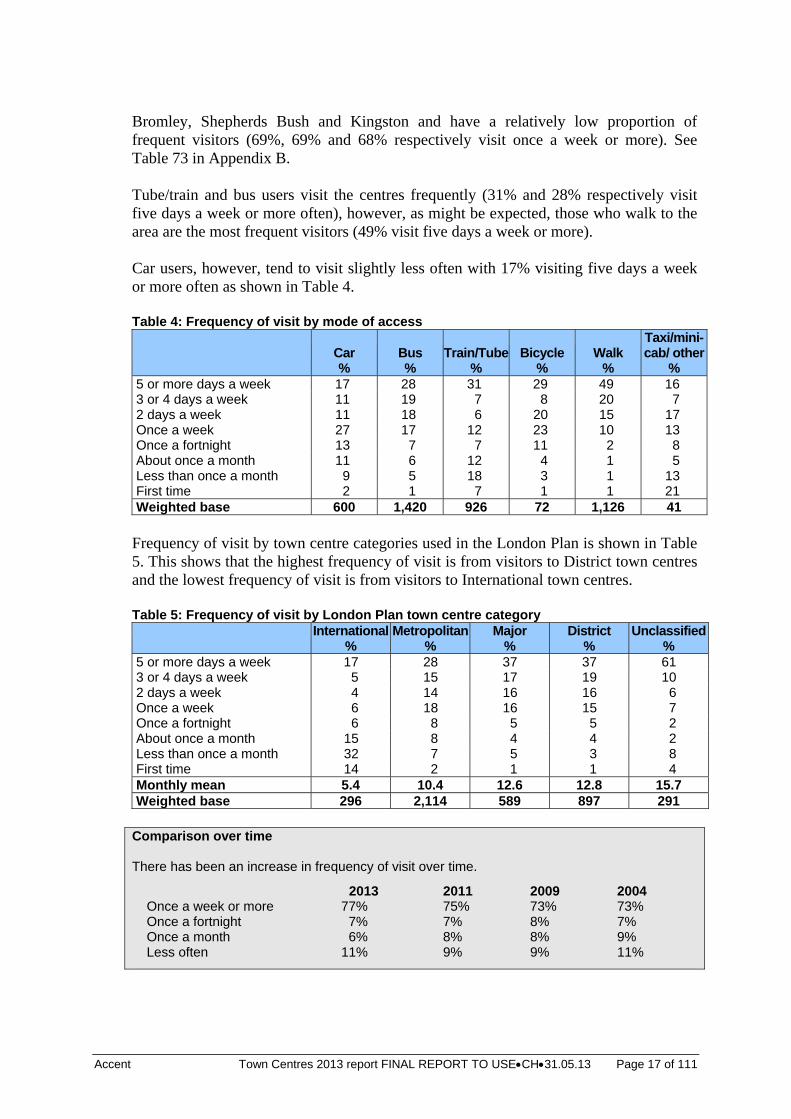
Accent Town Centres 2013 report FINAL REPORT TO USECH31.05.13 Page 17 of 111
Bromley, Shepherds Bush and Kingston and have a relatively low proportion of frequent visitors (69%, 69% and 68% respectively visit once a week or more). See Table 73 in Appendix B. Tube/train and bus users visit the centres frequently (31% and 28% respectively visit five days a week or more often), however, as might be expected, those who walk to the area are the most frequent visitors (49% visit five days a week or more). Car users, however, tend to visit slightly less often with 17% visiting five days a week or more often as shown in Table 4. Table 4: Frequency of visit by mode of access
Car %
Bus %
Train/Tube%
Bicycle %
Walk %
Taxi/mini-cab/ other
% 5 or more days a week 17 28 31 29 49 16 3 or 4 days a week 11 19 7 8 20 7 2 days a week 11 18 6 20 15 17 Once a week 27 17 12 23 10 13 Once a fortnight 13 7 7 11 2 8 About once a month 11 6 12 4 1 5 Less than once a month 9 5 18 3 1 13 First time 2 1 7 1 1 21 Weighted base 600 1,420 926 72 1,126 41
Frequency of visit by town centre categories used in the London Plan is shown in Table 5. This shows that the highest frequency of visit is from visitors to District town centres and the lowest frequency of visit is from visitors to International town centres. Table 5: Frequency of visit by London Plan town centre category
International
% Metropolitan
% Major
% District
% Unclassified
% 5 or more days a week 17 28 37 37 61 3 or 4 days a week 5 15 17 19 10 2 days a week 4 14 16 16 6 Once a week 6 18 16 15 7 Once a fortnight 6 8 5 5 2 About once a month 15 8 4 4 2 Less than once a month 32 7 5 3 8 First time 14 2 1 1 4 Monthly mean 5.4 10.4 12.6 12.8 15.7 Weighted base 296 2,114 589 897 291
Comparison over time There has been an increase in frequency of visit over time.
2013 2011 2009 2004 Once a week or more 77% 75% 73% 73% Once a fortnight 7% 7% 8% 7% Once a month 6% 8% 8% 9% Less often 11% 9% 9% 11%
Accent Town Centres 2013 report FINAL REPORT TO USECH31.05.13 Page 18 of 111
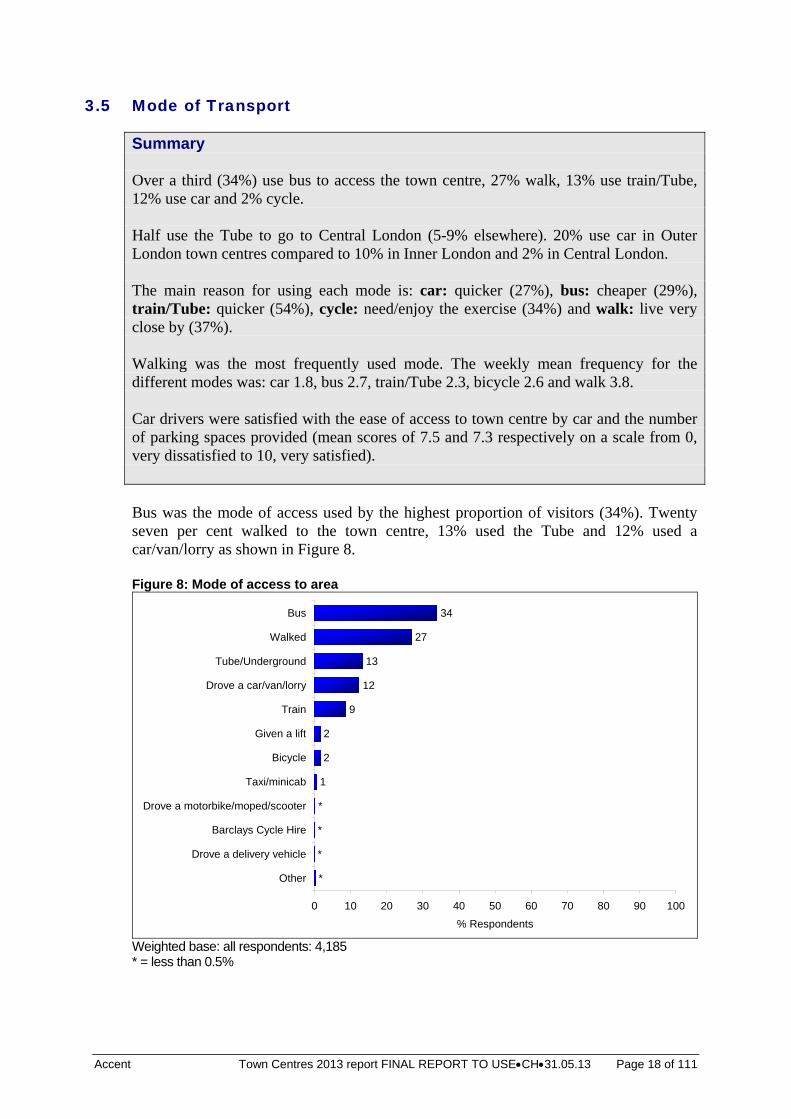
3.5 Mode of Transport
Summary Over a third (34%) use bus to access the town centre, 27% walk, 13% use train/Tube, 12% use car and 2% cycle. Half use the Tube to go to Central London (5-9% elsewhere). 20% use car in Outer London town centres compared to 10% in Inner London and 2% in Central London. The main reason for using each mode is: car: quicker (27%), bus: cheaper (29%), train/Tube: quicker (54%), cycle: need/enjoy the exercise (34%) and walk: live very close by (37%). Walking was the most frequently used mode. The weekly mean frequency for the different modes was: car 1.8, bus 2.7, train/Tube 2.3, bicycle 2.6 and walk 3.8. Car drivers were satisfied with the ease of access to town centre by car and the number of parking spaces provided (mean scores of 7.5 and 7.3 respectively on a scale from 0, very dissatisfied to 10, very satisfied). Bus was the mode of access used by the highest proportion of visitors (34%). Twenty seven per cent walked to the town centre, 13% used the Tube and 12% used a car/van/lorry as shown in Figure 8. Figure 8: Mode of access to area
1
2
2
9
12
13
27
34
*
*
*
*
0 10 20 30 40 50 60 70 80 90 100
Other
Drove a delivery vehicle
Barclays Cycle Hire
Drove a motorbike/moped/scooter
Taxi/minicab
Bicycle
Given a lift
Train
Drove a car/van/lorry
Tube/Underground
Walked
Bus
% Respondents
Weighted base: all respondents: 4,185 * = less than 0.5%
Accent Town Centres 2013 report FINAL REPORT TO USECH31.05.13 Page 19 of 111
Almost three quarters (74%7) of those who lived within a ten minute walk of the town centre walked there. Table 6: Mode of access to area by whether live or work within 10 minutes walk of centre
Live
% Work
% Both
% Neither
% Drove a car/van/lorry 3 12 12 17 Drove a motorbike/moped/scooter * 1 1 * Drove a delivery vehicle 0 * 0 * Given a lift * 1 1 2 Bus 16 26 18 44 Tube/Underground 1 26 5 16 Train * 22 1 10 Bicycle 1 3 2 2 Barclays Cycle Hire 0 * 0 * Walked 76 10 61 8 Taxi/minicab * * 0 1 Other 1 * 0 * Weighted base 1,063 550 133 2,437
* = less than 0.5% Figure 9 shows that the most popular means of transport used to reach Central London was the Tube (50%). A fifth drove to the Outer London town centres compared to 10% for Inner London and just 2% for Central London. Over a third (36%) walked to the town centre in Inner London compared to 21% in Outer London and 12% in Central London. Figure 9: Mode of access to area by type of centre
17
35
39
12
36
21
50
9
5
2
10
20
15
7
9
2
2
1
2
2
1
1
1
* *
*
*
*1
*
*
0% 10% 20% 30% 40% 50% 60% 70% 80% 90% 100%
Central London
Inner London
Outer London
Bus Walked Tube/Underground
Drove a car/van/lorry Train Given a lift
Bicycle Taxi/minicab Drove a motorbike/moped/scooter
Barclays Cycle Hire Drove a delivery vehicle Other
Weighted base: Central London 586; Inner London 2,084; Outer London 1,515 * = less than 0.5% Walking was the predominant means of accessing the town centre in Bethnal Green (52%), Harlesden (44%) and Kingsland High Street (40%). Tube was the predominant means of accessing Oxford Street/Regent Street (62%) and Aldgate (38%). At all other centres bus was the predominant means of access.
7 Weighted average of 76% who live within 10 minutes walk and 61% who live and work within 10 minutes walk
Accent Town Centres 2013 report FINAL REPORT TO USECH31.05.13 Page 20 of 111
Bus use was highest in Bromley, Hackney and Romford (43%) and lowest in Oxford Street/Regent Street (12%). This represents a large fall in bus use: it was 24% in 2011, 2009 and 2004. Tube use was particularly high in Oxford Street/Regent Street (62%) and there is no Tube service in Bromley, Kingsland High Street, Romford, Hornchurch, Hackney and Kingsland High Street. Car use was highest in Hornchurch (33%), Romford (30%), Kingston (25%) and Bromley (24%) and very low in Oxford Street/Regent Street (1%), Aldgate (2%), Hackney (3%), Shepherds Bush (4%) and Bethnal Green (4%). Train use was highest in Hackney (17%) and Aldgate (16%) and very low in Hornchurch (less than 0.5%), Harlesden (2%), Bethnal Green (3%) and Hounslow (3%). Walking as an access mode was highest at Bethnal Green (52%), Harlesden (44%) and Kingsland High Street (40%) and lowest at Oxford Street/Regent Street (7%) and Romford (11%). In Kingsland High Street, 7% mentioned cycle. See Table 72 in Appendix B for a full breakdown. Comparison over time There has been a steady decrease in car use over time. The largest change since 2011 is an increase in Train/Tube use.
2013 2011 2009 2004 Bus 34% 36% 38% 34% Walk 27% 28% 25% 29% Car 12% 14% 16% 20% Train/Tube 22% 17% 17% 14% Bicycle 2% 2% 2% 1%
Characteristics of users of different modes Bus users were more likely to be retired and have lower household incomes than other mode users. Car users were more likely to be older and have higher household incomes than other mode users. Train and Tube users were more likely to be younger and non White than other mode users. Cyclists were more likely to be male, White and working than other mode users. See Table 7.
Accent Town Centres 2013 report FINAL REPORT TO USECH31.05.13 Page 21 of 111
Table 7: Profile of mode users
Car %
Bus %
Train/ Tube
% Bicycle
% Walk
% Age 16-34 25 40 49 47 39 35-44 25 18 19 15 18 45-59 33 20 22 31 25 60+ 16 20 9 5 17 Gender Male 37 37 45 68 44 Female 63 62 54 31 56 Employment status Working 72 54 77 87 55 Student 3 11 10 4 11 Not working 11 14 5 4 17 Retired 12 19 6 4 16 Ethnic group White 74 62 67 84 62 Asian 9 14 12 1 13 Black 12 19 13 11 19 Mixed/Other 3 4 6 3 5 Household income* Under £20,000 9 38 19 23 39 £20,000-£34,999 28 34 25 23 29 £35,000-£74,999 49 23 43 50 28 £75,000 or over 14 5 13 5 5 Weighted base 600 1,420 926 72 1,126
* after excluding don’t knows and refuseds Why Modes used The reasons for choosing to travel by the particular mode used to access the area are shown in Table 8. Train/Tube in particular were considered to be quicker (69%), as were car (52%) and bicycle (45%). Car, bus and train/Tube were considered to be easier/more convenient than other modes. Train/Tube were also considered to be more direct (39%). A high proportion travelled by bus because it was cheaper (41%), with 13% saying it was the only mode available. Over four tenths of those who walked (41%) said they lived close by and 18% said they need/enjoy the exercise. Over half (51%) of those who cycled said they need/enjoy the exercise, 45% said it was quicker and 42% cited low cost.
Accent Town Centres 2013 report FINAL REPORT TO USECH31.05.13 Page 22 of 111
Table 8: Reasons for using chosen method of transport rather than any other method of transport to access area by mode
Car %
Bus %
Train/ Tube
% Bicycle
% Walk
% Quicker 52 32 69 45 37 More direct 29 30 39 16 20 Cheaper/less expensive 10 41 9 42 19 Easier/more convenient 34 25 26 14 11 Live very close by 2 4 1 11 41 More relaxing/comfortable 20 9 10 4 5 Only method possible 2 13 6 0 4 Going to more than one place 17 4 4 10 5 Need/enjoy exercise/healthy * 1 0 51 18 Avoids parking difficulties 2 7 6 13 3 No car/can`t drive 1 11 2 1 3 Had heavy bags/shopping to carry 12 2 * 0 1 Safer 4 5 3 1 1 Weather issues 9 3 2 0 2 Travelling with children 6 2 1 0 1 Avoid the congestion charge * * 1 0 0 Weighted base 600 1,420 926 72 1,126 Note: More than one answer may be given, so percentages may add up to more than 100% * = less than 0.5% The main reasons for choosing to travel by the particular mode used to access the area are shown in Table 9. The main reasons for each mode are: car: quicker (27%) bus: cheaper (29%) train/Tube: quicker (54%) cycle: need/enjoy the exercise (34%) walk: live very close by (37%). Table 9: Main reason for using chosen method of transport rather than any other method of transport to access area
Car %
Bus %
Train/ Tube
% Bicycle
% Walk
% Quicker 27 16 54 24 18 Cheaper/less expensive 3 29 3 22 9 Easier/more convenient 21 13 11 5 5 More direct 12 12 16 1 7 Live very close by 0 2 * 5 37 Only method possible 2 11 5 0 3 Need/enjoy exercise/healthy 0 * 0 34 13 More relaxing/comfortable 7 2 2 1 2 Going to more than one place 10 1 2 3 3 No car/can't drive 1 7 1 0 1 Avoids parking difficulties 1 3 2 4 1 Weather issues 4 1 1 0 1 Had heavy bags/shopping to carry 8 1 0 0 * Travelling with children 4 1 * 0 1 Safer 1 1 * 0 0 Avoid the congestion charge 0 * * 0 0 Weighted base 600 1,420 926 72 1,126 * = less than 0.5%
Accent Town Centres 2013 report FINAL REPORT TO USECH31.05.13 Page 23 of 111
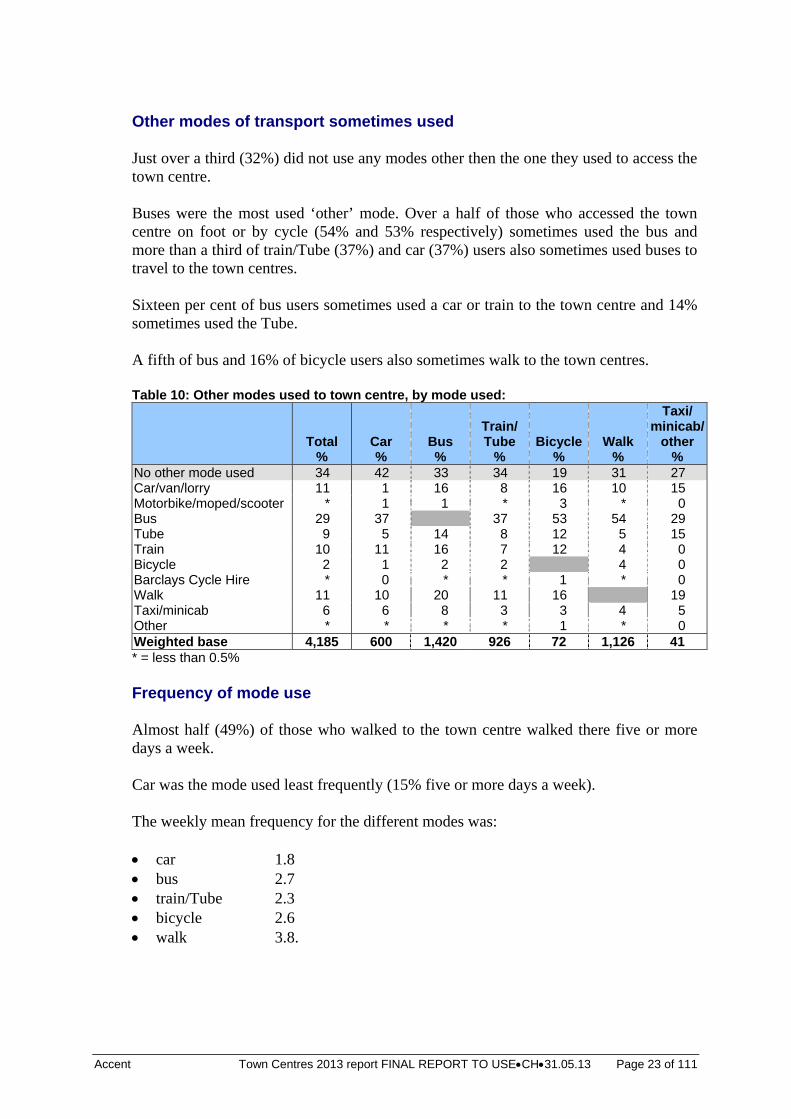
Other modes of transport sometimes used Just over a third (32%) did not use any modes other then the one they used to access the town centre. Buses were the most used ‘other’ mode. Over a half of those who accessed the town centre on foot or by cycle (54% and 53% respectively) sometimes used the bus and more than a third of train/Tube (37%) and car (37%) users also sometimes used buses to travel to the town centres. Sixteen per cent of bus users sometimes used a car or train to the town centre and 14% sometimes used the Tube. A fifth of bus and 16% of bicycle users also sometimes walk to the town centres. Table 10: Other modes used to town centre, by mode used:
Total
% Car %
Bus %
Train/ Tube
% Bicycle
% Walk
%
Taxi/ minicab/
other %
No other mode used 34 42 33 34 19 31 27 Car/van/lorry 11 1 16 8 16 10 15 Motorbike/moped/scooter * 1 1 * 3 * 0 Bus 29 37 37 53 54 29 Tube 9 5 14 8 12 5 15 Train 10 11 16 7 12 4 0 Bicycle 2 1 2 2 4 0 Barclays Cycle Hire * 0 * * 1 * 0 Walk 11 10 20 11 16 19 Taxi/minicab 6 6 8 3 3 4 5 Other * * * * 1 * 0 Weighted base 4,185 600 1,420 926 72 1,126 41 * = less than 0.5% Frequency of mode use Almost half (49%) of those who walked to the town centre walked there five or more days a week. Car was the mode used least frequently (15% five or more days a week). The weekly mean frequency for the different modes was: car 1.8 bus 2.7 train/Tube 2.3 bicycle 2.6 walk 3.8.
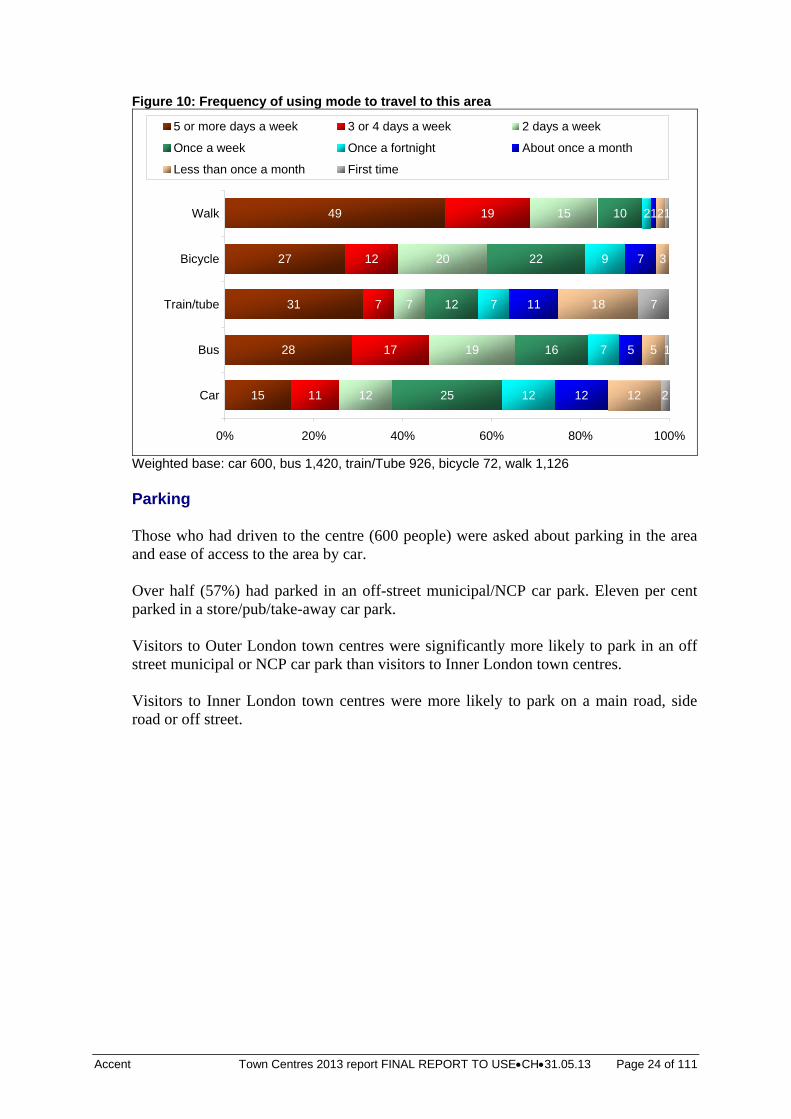
Accent Town Centres 2013 report FINAL REPORT TO USECH31.05.13 Page 24 of 111
Figure 10: Frequency of using mode to travel to this area
15
28
31
27
49
11
17
7
12
19
12
19
7
20
15
25
16
12
22
10
12
7
7
9
2
12
5
11
7
1
12
5
18
3
2
2
1
7
1
0% 20% 40% 60% 80% 100%
Car
Bus
Train/tube
Bicycle
Walk
5 or more days a week 3 or 4 days a week 2 days a week
Once a week Once a fortnight About once a month
Less than once a month First time
Weighted base: car 600, bus 1,420, train/Tube 926, bicycle 72, walk 1,126 Parking Those who had driven to the centre (600 people) were asked about parking in the area and ease of access to the area by car. Over half (57%) had parked in an off-street municipal/NCP car park. Eleven per cent parked in a store/pub/take-away car park. Visitors to Outer London town centres were significantly more likely to park in an off street municipal or NCP car park than visitors to Inner London town centres. Visitors to Inner London town centres were more likely to park on a main road, side road or off street.
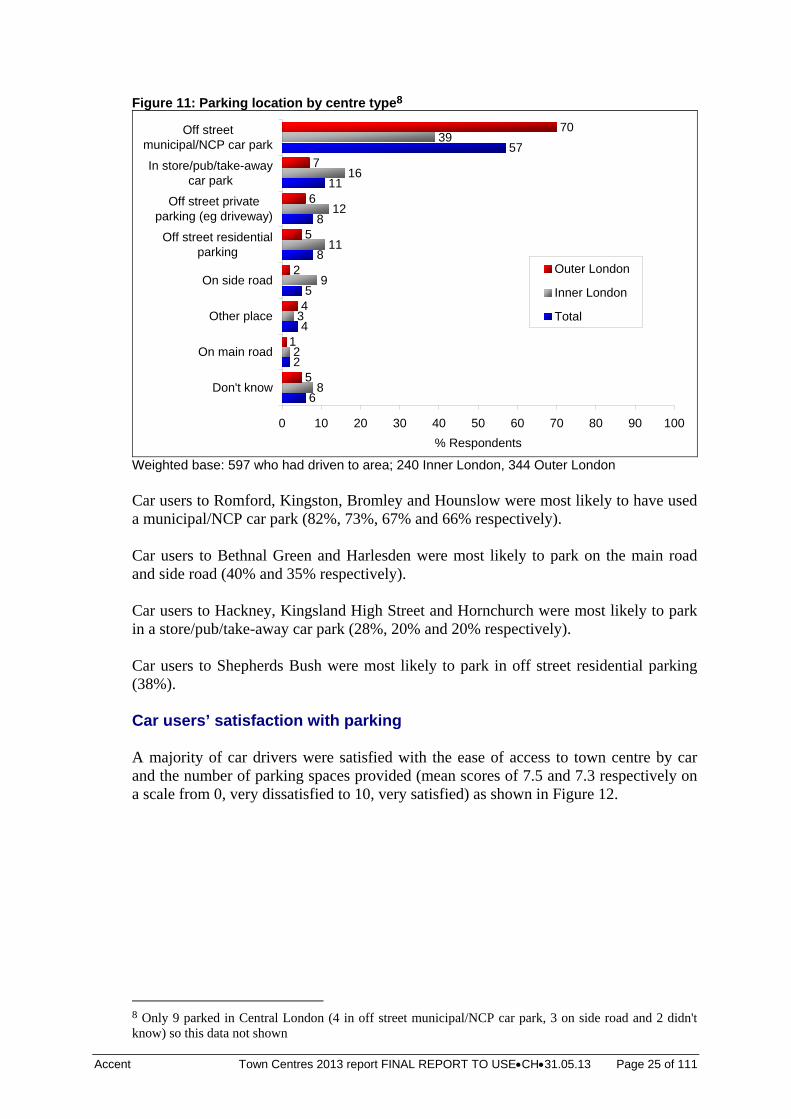
Accent Town Centres 2013 report FINAL REPORT TO USECH31.05.13 Page 25 of 111
Figure 11: Parking location by centre type8
6
2
4
5
8
8
11
57
8
2
3
9
11
12
16
39
5
1
4
2
5
6
7
70
0 10 20 30 40 50 60 70 80 90 100
Don't know
On main road
Other place
On side road
Off street residentialparking
Off street privateparking (eg driveway)
In store/pub/take-awaycar park
Off streetmunicipal/NCP car park
% Respondents
Outer London
Inner London
Total
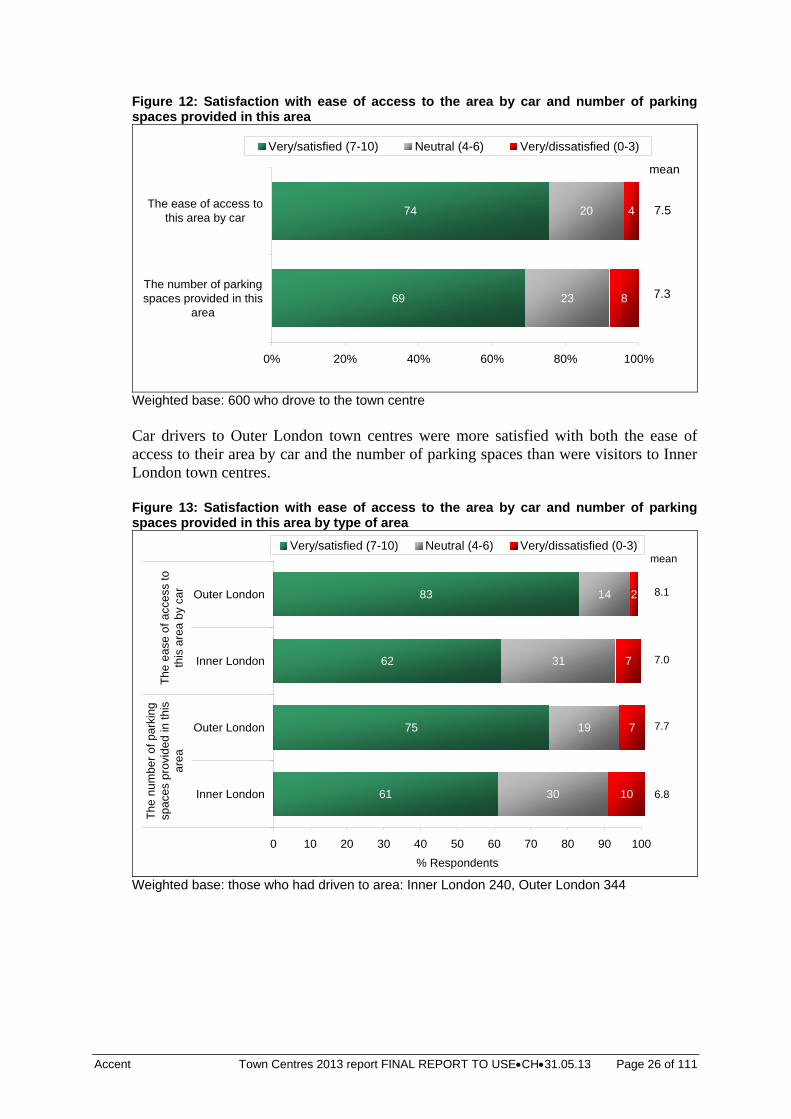
Weighted base: 597 who had driven to area; 240 Inner London, 344 Outer London Car users to Romford, Kingston, Bromley and Hounslow were most likely to have used a municipal/NCP car park (82%, 73%, 67% and 66% respectively). Car users to Bethnal Green and Harlesden were most likely to park on the main road and side road (40% and 35% respectively). Car users to Hackney, Kingsland High Street and Hornchurch were most likely to park in a store/pub/take-away car park (28%, 20% and 20% respectively). Car users to Shepherds Bush were most likely to park in off street residential parking (38%). Car users’ satisfaction with parking A majority of car drivers were satisfied with the ease of access to town centre by car and the number of parking spaces provided (mean scores of 7.5 and 7.3 respectively on a scale from 0, very dissatisfied to 10, very satisfied) as shown in Figure 12.
8 Only 9 parked in Central London (4 in off street municipal/NCP car park, 3 on side road and 2 didn't know) so this data not shown
Accent Town Centres 2013 report FINAL REPORT TO USECH31.05.13 Page 26 of 111
Figure 12: Satisfaction with ease of access to the area by car and number of parking spaces provided in this area
69
74
23
20
8
4
0% 20% 40% 60% 80% 100%
The number of parkingspaces provided in this
area
The ease of access tothis area by car
Very/satisfied (7-10) Neutral (4-6) Very/dissatisfied (0-3)
7.5
7.3
mean
Weighted base: 600 who drove to the town centre Car drivers to Outer London town centres were more satisfied with both the ease of access to their area by car and the number of parking spaces than were visitors to Inner London town centres. Figure 13: Satisfaction with ease of access to the area by car and number of parking spaces provided in this area by type of area
61
75
62
83
30
19
31
14
10
7
7
2
0 10 20 30 40 50 60 70 80 90 100
Inner London
Outer London
Inner London
Outer London
Th
e n
um
be
r o
f p
ark
ing
spa
ces
pro
vid
ed
in t
his
are
aT
he
ea
se o
f a
cce
ss t
oth
is a
rea
by
car
% Respondents
Very/satisfied (7-10) Neutral (4-6) Very/dissatisfied (0-3)
6.8
7.7
7.0
8.1
mean
Weighted base: those who had driven to area: Inner London 240, Outer London 344
Accent Town Centres 2013 report FINAL REPORT TO USECH31.05.13 Page 27 of 111
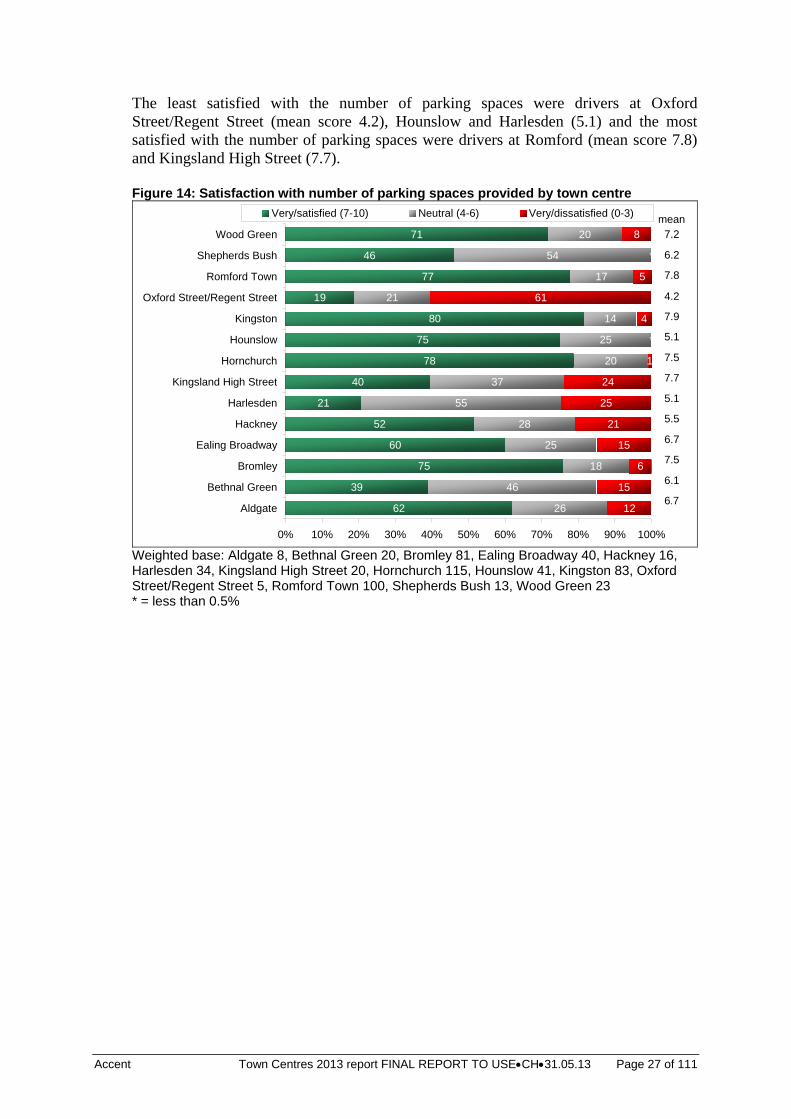
The least satisfied with the number of parking spaces were drivers at Oxford Street/Regent Street (mean score 4.2), Hounslow and Harlesden (5.1) and the most satisfied with the number of parking spaces were drivers at Romford (mean score 7.8) and Kingsland High Street (7.7). Figure 14: Satisfaction with number of parking spaces provided by town centre
62
39
75
60
52
21
40
78
75
80
19
77
46
71
26
46
18
25
28
55
37
20
25
14
21
17
54
20
15
6
15
21
25
24
1
4
61
5
8
*
*
12
0% 10% 20% 30% 40% 50% 60% 70% 80% 90% 100%
Aldgate
Bethnal Green
Bromley
Ealing Broadway
Hackney
Harlesden
Kingsland High Street
Hornchurch
Hounslow
Kingston
Oxford Street/Regent Street
Romford Town
Shepherds Bush
Wood Green
Very/satisfied (7-10) Neutral (4-6) Very/dissatisfied (0-3)
7.2
6.2
7.8
4.2
7.9
5.1
7.5
7.7
5.1
5.5
6.7
7.5
6.1
6.7
mean
Weighted base: Aldgate 8, Bethnal Green 20, Bromley 81, Ealing Broadway 40, Hackney 16, Harlesden 34, Kingsland High Street 20, Hornchurch 115, Hounslow 41, Kingston 83, Oxford Street/Regent Street 5, Romford Town 100, Shepherds Bush 13, Wood Green 23 * = less than 0.5%
Accent Town Centres 2013 report FINAL REPORT TO USECH31.05.13 Page 28 of 111
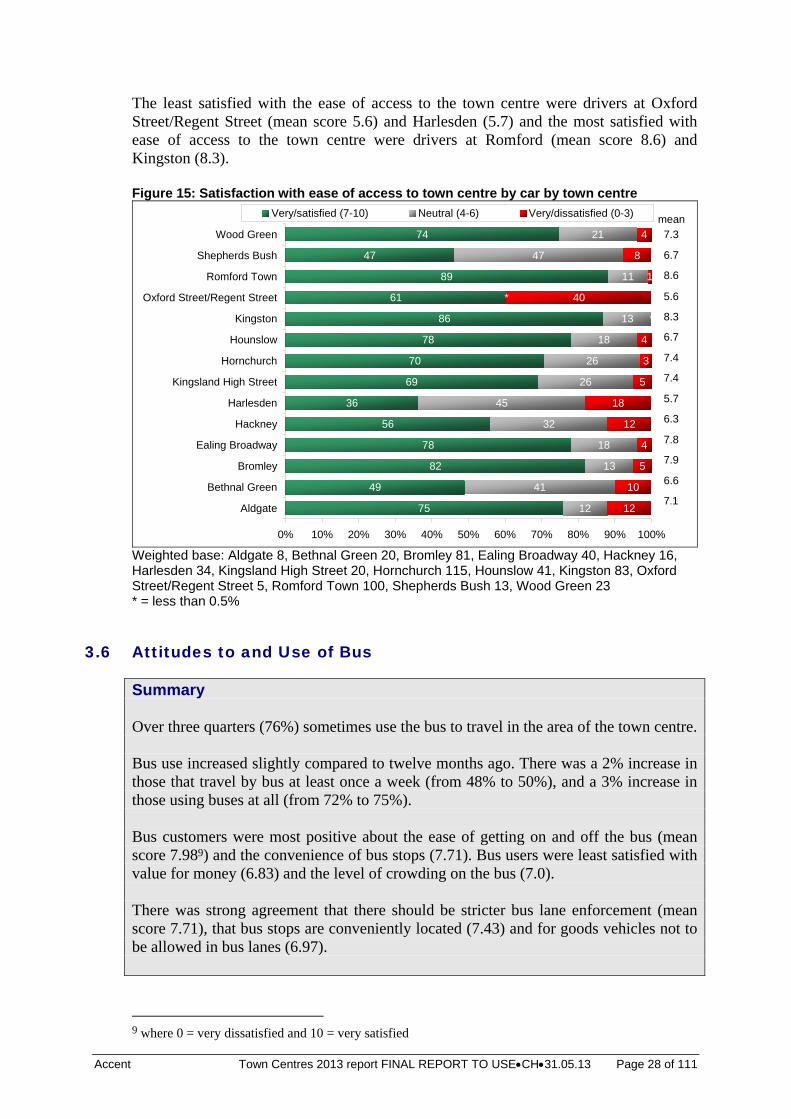
The least satisfied with the ease of access to the town centre were drivers at Oxford Street/Regent Street (mean score 5.6) and Harlesden (5.7) and the most satisfied with ease of access to the town centre were drivers at Romford (mean score 8.6) and Kingston (8.3). Figure 15: Satisfaction with ease of access to town centre by car by town centre
75
49
82
78
56
36
69
70
78
86
61
89
47
74
12
41
13
18
32
45
26
26
18
13
11
47
21
10
5
4
12
18
5
3
40
1
4
*
*
4
8
12
0% 10% 20% 30% 40% 50% 60% 70% 80% 90% 100%
Aldgate
Bethnal Green
Bromley
Ealing Broadway
Hackney
Harlesden
Kingsland High Street
Hornchurch
Hounslow
Kingston
Oxford Street/Regent Street
Romford Town
Shepherds Bush
Wood Green
Very/satisfied (7-10) Neutral (4-6) Very/dissatisfied (0-3)
7.3
6.7
8.6
5.6
8.3
6.7
7.4
7.4
5.7
6.3
7.8
7.9
6.6
7.1
mean
Weighted base: Aldgate 8, Bethnal Green 20, Bromley 81, Ealing Broadway 40, Hackney 16, Harlesden 34, Kingsland High Street 20, Hornchurch 115, Hounslow 41, Kingston 83, Oxford Street/Regent Street 5, Romford Town 100, Shepherds Bush 13, Wood Green 23 * = less than 0.5%
3.6 Attitudes to and Use of Bus
Summary Over three quarters (76%) sometimes use the bus to travel in the area of the town centre. Bus use increased slightly compared to twelve months ago. There was a 2% increase in those that travel by bus at least once a week (from 48% to 50%), and a 3% increase in those using buses at all (from 72% to 75%). Bus customers were most positive about the ease of getting on and off the bus (mean score 7.989) and the convenience of bus stops (7.71). Bus users were least satisfied with value for money (6.83) and the level of crowding on the bus (7.0). There was strong agreement that there should be stricter bus lane enforcement (mean score 7.71), that bus stops are conveniently located (7.43) and for goods vehicles not to be allowed in bus lanes (6.97).
9 where 0 = very dissatisfied and 10 = very satisfied
Accent Town Centres 2013 report FINAL REPORT TO USECH31.05.13 Page 29 of 111
The top three single factors that would encourage greater use of the bus were more regular/frequent buses (11%), lower fares (10%) and faster journeys (6%).
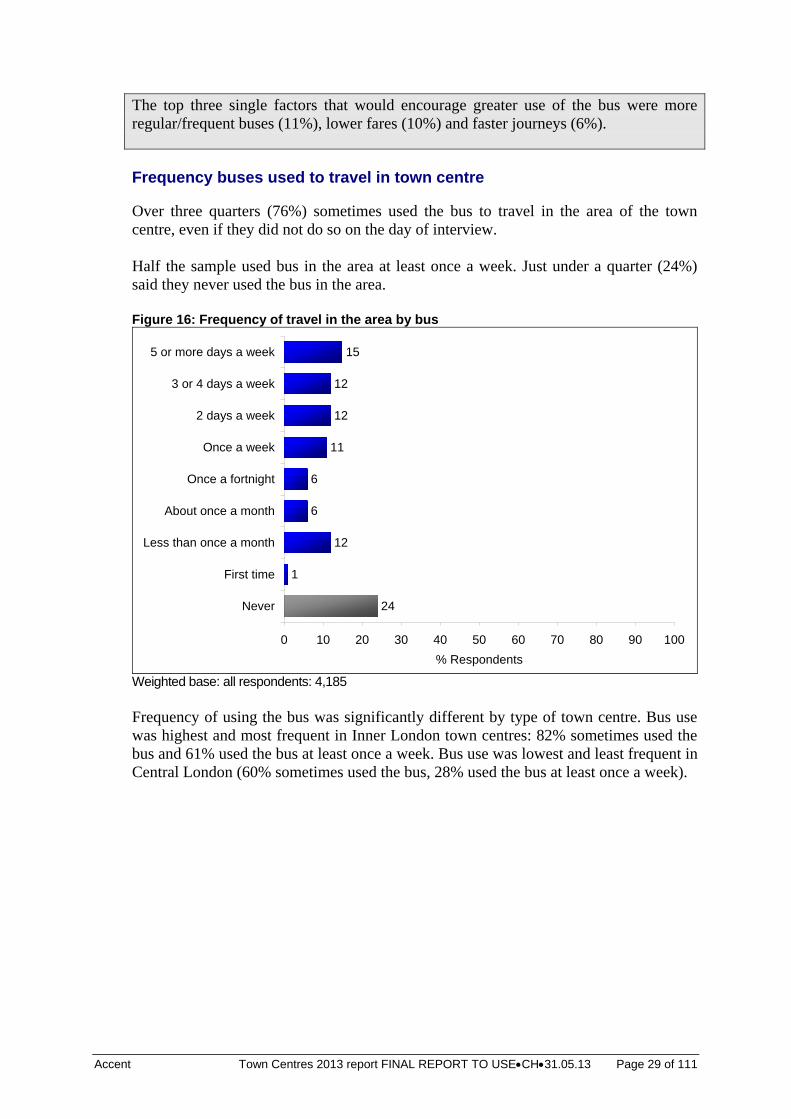
Frequency buses used to travel in town centre Over three quarters (76%) sometimes used the bus to travel in the area of the town centre, even if they did not do so on the day of interview. Half the sample used bus in the area at least once a week. Just under a quarter (24%) said they never used the bus in the area. Figure 16: Frequency of travel in the area by bus
24
1
12
6
6
11
12
12
15
0 10 20 30 40 50 60 70 80 90 100
Never
First time
Less than once a month
About once a month
Once a fortnight
Once a week
2 days a week
3 or 4 days a week
5 or more days a week
% Respondents
Weighted base: all respondents: 4,185 Frequency of using the bus was significantly different by type of town centre. Bus use was highest and most frequent in Inner London town centres: 82% sometimes used the bus and 61% used the bus at least once a week. Bus use was lowest and least frequent in Central London (60% sometimes used the bus, 28% used the bus at least once a week).
Accent Town Centres 2013 report FINAL REPORT TO USECH31.05.13 Page 30 of 111
Figure 17: Frequency of travel in the area by bus by type of centre
12
18
12
6
15
10
5
16
11
5
12
13
3
6
6
8
5
7
18
11
13
3
1
1
40
18
27
0% 20% 40% 60% 80% 100%
Central London
Inner London
Outer London
5 or more days a week 3 or 4 days a week 2 days a week
Once a week Once a fortnight About once a month
Less than once a month First time Never
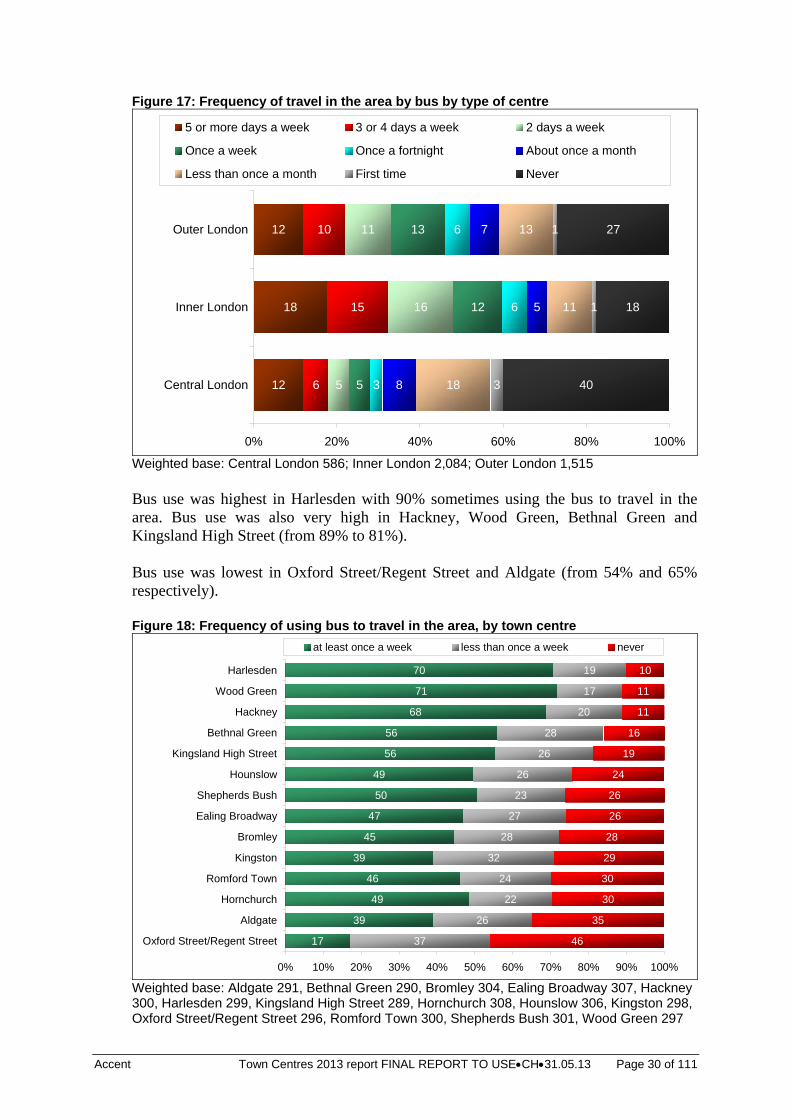
Weighted base: Central London 586; Inner London 2,084; Outer London 1,515 Bus use was highest in Harlesden with 90% sometimes using the bus to travel in the area. Bus use was also very high in Hackney, Wood Green, Bethnal Green and Kingsland High Street (from 89% to 81%). Bus use was lowest in Oxford Street/Regent Street and Aldgate (from 54% and 65% respectively). Figure 18: Frequency of using bus to travel in the area, by town centre
17
39
49
46
39
45
47
50
49
56
56
68
71
70
37
26
22
24
32
28
27
23
26
26
28
20
17
19
35
30
30
29
28
26
26
19
16
11
10
24
11
46
0% 10% 20% 30% 40% 50% 60% 70% 80% 90% 100%
Oxford Street/Regent Street
Aldgate
Hornchurch
Romford Town
Kingston
Bromley
Ealing Broadway
Shepherds Bush
Hounslow
Kingsland High Street
Bethnal Green
Hackney
Wood Green
Harlesden
at least once a week less than once a week never
Weighted base: Aldgate 291, Bethnal Green 290, Bromley 304, Ealing Broadway 307, Hackney 300, Harlesden 299, Kingsland High Street 289, Hornchurch 308, Hounslow 306, Kingston 298, Oxford Street/Regent Street 296, Romford Town 300, Shepherds Bush 301, Wood Green 297
Accent Town Centres 2013 report FINAL REPORT TO USECH31.05.13 Page 31 of 111
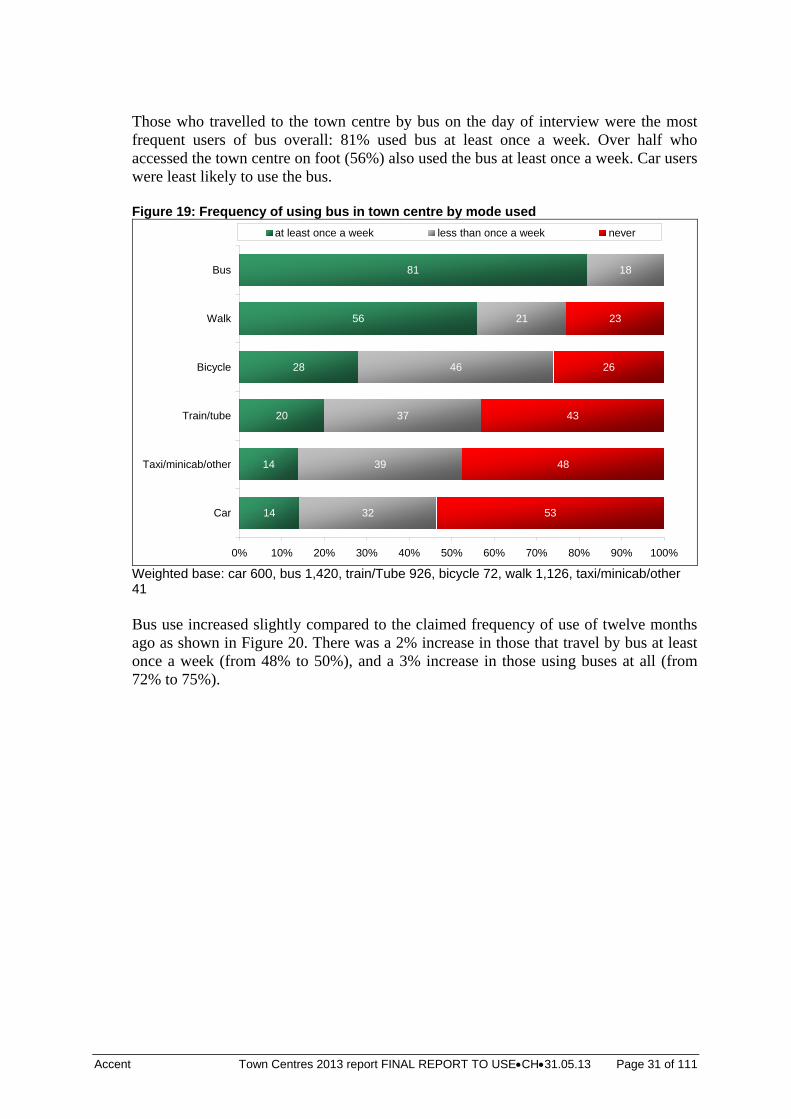
Those who travelled to the town centre by bus on the day of interview were the most frequent users of bus overall: 81% used bus at least once a week. Over half who accessed the town centre on foot (56%) also used the bus at least once a week. Car users were least likely to use the bus. Figure 19: Frequency of using bus in town centre by mode used
14
14
20
28
56
81
32
39
37
46
21
18
48
43
26
23
53
0% 10% 20% 30% 40% 50% 60% 70% 80% 90% 100%
Car
Taxi/minicab/other
Train/tube
Bicycle
Walk
Bus
at least once a week less than once a week never
Weighted base: car 600, bus 1,420, train/Tube 926, bicycle 72, walk 1,126, taxi/minicab/other 41 Bus use increased slightly compared to the claimed frequency of use of twelve months ago as shown in Figure 20. There was a 2% increase in those that travel by bus at least once a week (from 48% to 50%), and a 3% increase in those using buses at all (from 72% to 75%).
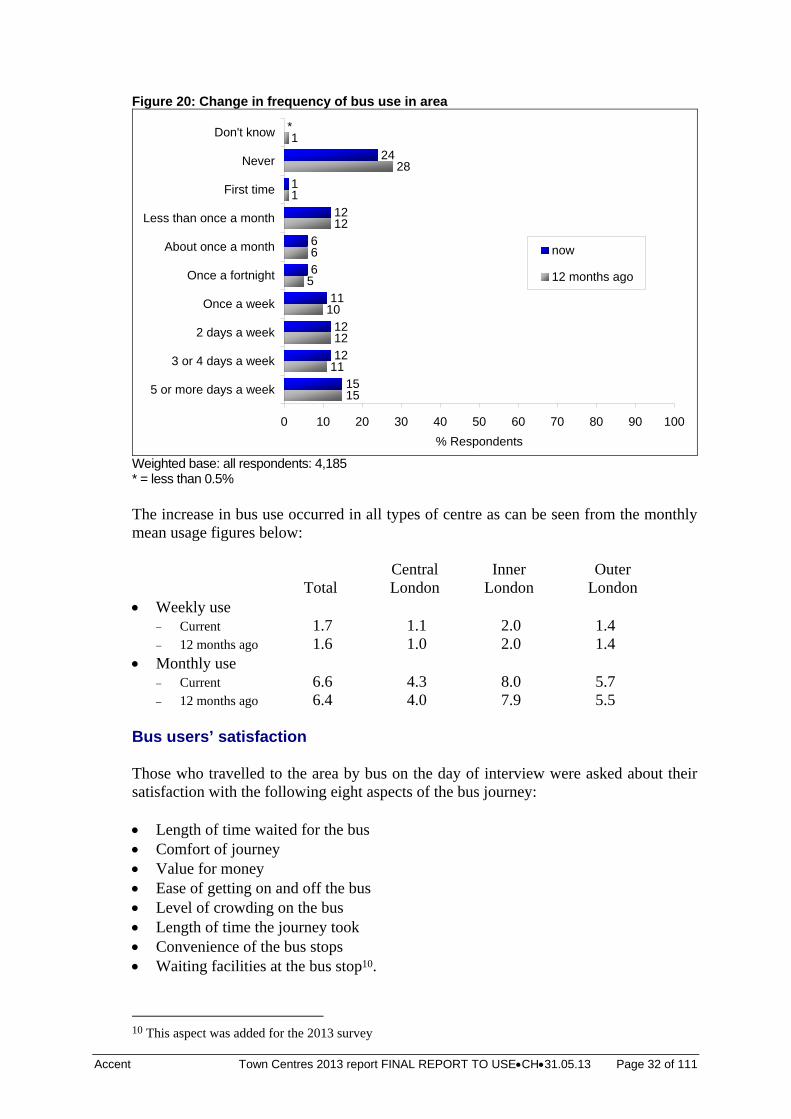
Accent Town Centres 2013 report FINAL REPORT TO USECH31.05.13 Page 32 of 111
Figure 20: Change in frequency of bus use in area
15
11
12
10
5
6
12
1
28
1
15
12
12
11
6
6
12
1
24
*
0 10 20 30 40 50 60 70 80 90 100
5 or more days a week
3 or 4 days a week
2 days a week
Once a week
Once a fortnight
About once a month
Less than once a month
First time
Never
Don't know
% Respondents
now
12 months ago
Weighted base: all respondents: 4,185 * = less than 0.5% The increase in bus use occurred in all types of centre as can be seen from the monthly mean usage figures below: Central Inner Outer Total London London London Weekly use
Current 1.7 1.1 2.0 1.4 12 months ago 1.6 1.0 2.0 1.4
Monthly use Current 6.6 4.3 8.0 5.7 12 months ago 6.4 4.0 7.9 5.5
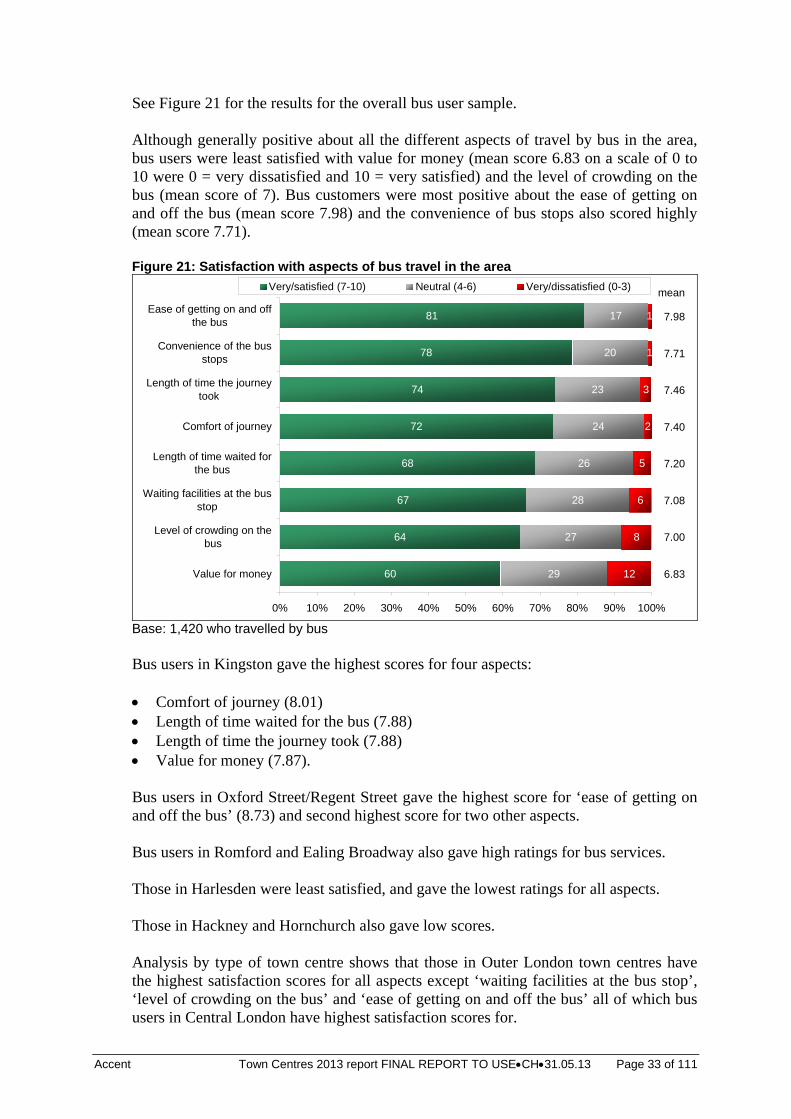
Bus users’ satisfaction Those who travelled to the area by bus on the day of interview were asked about their satisfaction with the following eight aspects of the bus journey: Length of time waited for the bus Comfort of journey Value for money Ease of getting on and off the bus Level of crowding on the bus Length of time the journey took Convenience of the bus stops Waiting facilities at the bus stop10.
10 This aspect was added for the 2013 survey
Accent Town Centres 2013 report FINAL REPORT TO USECH31.05.13 Page 33 of 111
See Figure 21 for the results for the overall bus user sample. Although generally positive about all the different aspects of travel by bus in the area, bus users were least satisfied with value for money (mean score 6.83 on a scale of 0 to 10 were 0 = very dissatisfied and 10 = very satisfied) and the level of crowding on the bus (mean score of 7). Bus customers were most positive about the ease of getting on and off the bus (mean score 7.98) and the convenience of bus stops also scored highly (mean score 7.71). Figure 21: Satisfaction with aspects of bus travel in the area
60
64
67
68
72
74
78
81
29
27
28
26
24
23
20
17
8
6
5
2
3
1
1
12
0% 10% 20% 30% 40% 50% 60% 70% 80% 90% 100%
Value for money
Level of crowding on thebus
Waiting facilities at the busstop
Length of time waited forthe bus
Comfort of journey
Length of time the journeytook
Convenience of the busstops
Ease of getting on and offthe bus
Very/satisfied (7-10) Neutral (4-6) Very/dissatisfied (0-3)
7.98
mean
7.71
7.46
7.40
7.20
7.08
7.00
6.83
Base: 1,420 who travelled by bus Bus users in Kingston gave the highest scores for four aspects: Comfort of journey (8.01) Length of time waited for the bus (7.88) Length of time the journey took (7.88) Value for money (7.87). Bus users in Oxford Street/Regent Street gave the highest score for ‘ease of getting on and off the bus’ (8.73) and second highest score for two other aspects. Bus users in Romford and Ealing Broadway also gave high ratings for bus services. Those in Harlesden were least satisfied, and gave the lowest ratings for all aspects. Those in Hackney and Hornchurch also gave low scores. Analysis by type of town centre shows that those in Outer London town centres have the highest satisfaction scores for all aspects except ‘waiting facilities at the bus stop’, ‘level of crowding on the bus’ and ‘ease of getting on and off the bus’ all of which bus users in Central London have highest satisfaction scores for.
Accent Town Centres 2013 report FINAL REPORT TO USECH31.05.13 Page 34 of 111
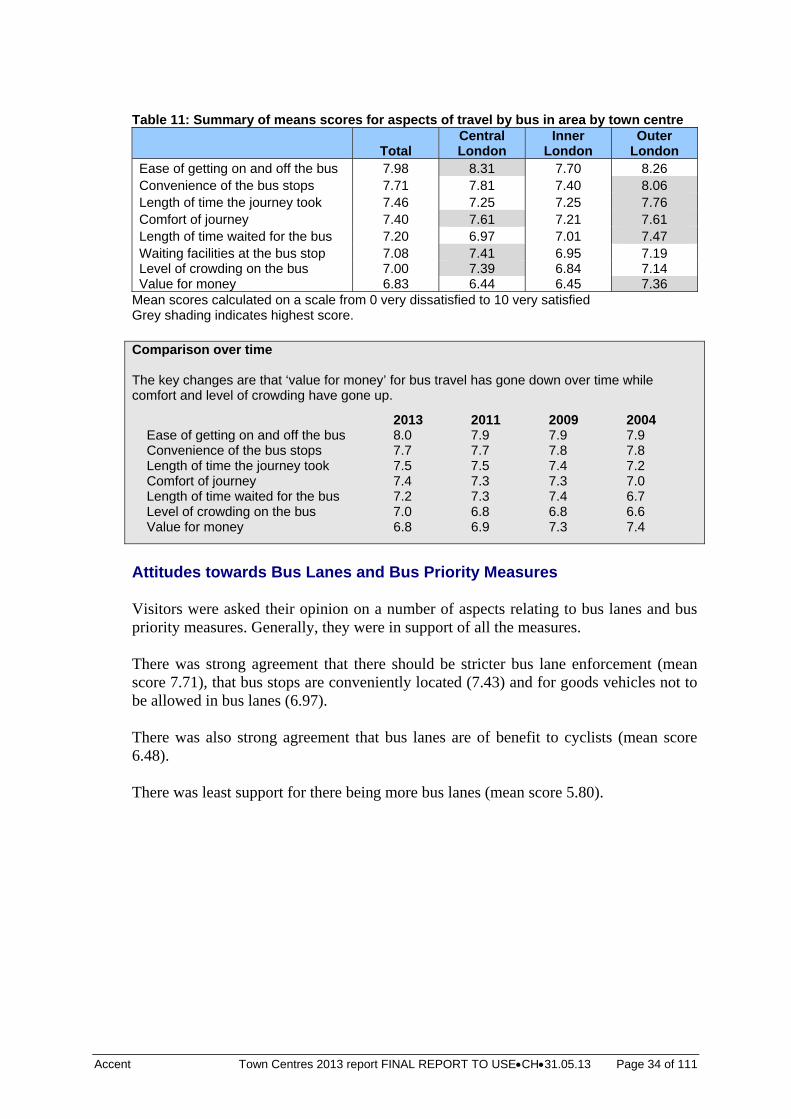
Table 11: Summary of means scores for aspects of travel by bus in area by town centre
Total Central London
Inner London
Outer London
Ease of getting on and off the bus 7.98 8.31 7.70 8.26 Convenience of the bus stops 7.71 7.81 7.40 8.06 Length of time the journey took 7.46 7.25 7.25 7.76 Comfort of journey 7.40 7.61 7.21 7.61 Length of time waited for the bus 7.20 6.97 7.01 7.47 Waiting facilities at the bus stop 7.08 7.41 6.95 7.19 Level of crowding on the bus 7.00 7.39 6.84 7.14 Value for money 6.83 6.44 6.45 7.36
Mean scores calculated on a scale from 0 very dissatisfied to 10 very satisfied Grey shading indicates highest score. Comparison over time The key changes are that ‘value for money’ for bus travel has gone down over time while comfort and level of crowding have gone up.
2013 2011 2009 2004 Ease of getting on and off the bus 8.0 7.9 7.9 7.9 Convenience of the bus stops 7.7 7.7 7.8 7.8 Length of time the journey took 7.5 7.5 7.4 7.2 Comfort of journey 7.4 7.3 7.3 7.0 Length of time waited for the bus 7.2 7.3 7.4 6.7 Level of crowding on the bus 7.0 6.8 6.8 6.6 Value for money 6.8 6.9 7.3 7.4
Attitudes towards Bus Lanes and Bus Priority Measures Visitors were asked their opinion on a number of aspects relating to bus lanes and bus priority measures. Generally, they were in support of all the measures. There was strong agreement that there should be stricter bus lane enforcement (mean score 7.71), that bus stops are conveniently located (7.43) and for goods vehicles not to be allowed in bus lanes (6.97). There was also strong agreement that bus lanes are of benefit to cyclists (mean score 6.48). There was least support for there being more bus lanes (mean score 5.80).
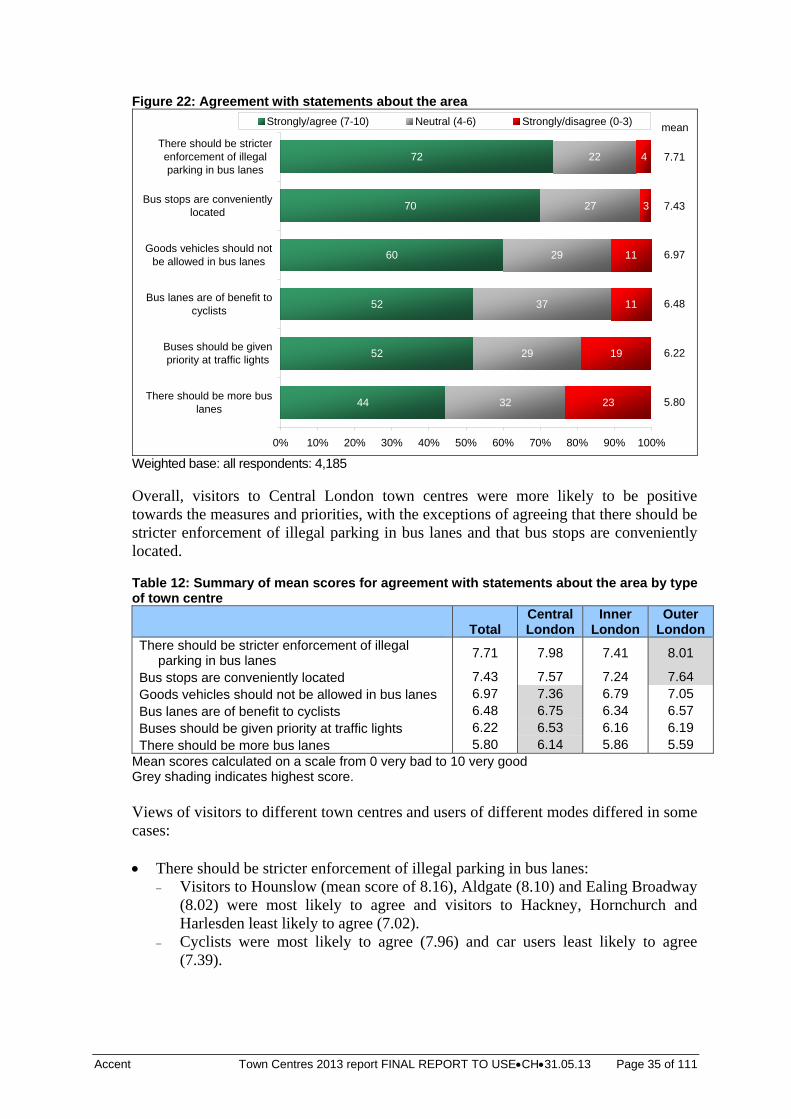
Accent Town Centres 2013 report FINAL REPORT TO USECH31.05.13 Page 35 of 111
Figure 22: Agreement with statements about the area
44
52
52
60
70
72
32
29
37
29
27
22
19
11
11
3
4
23
0% 10% 20% 30% 40% 50% 60% 70% 80% 90% 100%
There should be more buslanes
Buses should be givenpriority at traffic lights
Bus lanes are of benefit tocyclists
Goods vehicles should notbe allowed in bus lanes
Bus stops are convenientlylocated
There should be stricterenforcement of illegalparking in bus lanes
Strongly/agree (7-10) Neutral (4-6) Strongly/disagree (0-3)
7.71
mean
7.43
6.97
6.48
6.22
5.80
Weighted base: all respondents: 4,185 Overall, visitors to Central London town centres were more likely to be positive towards the measures and priorities, with the exceptions of agreeing that there should be stricter enforcement of illegal parking in bus lanes and that bus stops are conveniently located. Table 12: Summary of mean scores for agreement with statements about the area by type of town centre
Total Central London
Inner London
Outer London
There should be stricter enforcement of illegal parking in bus lanes
7.71 7.98 7.41 8.01
Bus stops are conveniently located 7.43 7.57 7.24 7.64 Goods vehicles should not be allowed in bus lanes 6.97 7.36 6.79 7.05 Bus lanes are of benefit to cyclists 6.48 6.75 6.34 6.57 Buses should be given priority at traffic lights 6.22 6.53 6.16 6.19 There should be more bus lanes 5.80 6.14 5.86 5.59
Mean scores calculated on a scale from 0 very bad to 10 very good Grey shading indicates highest score. Views of visitors to different town centres and users of different modes differed in some cases: There should be stricter enforcement of illegal parking in bus lanes:
Visitors to Hounslow (mean score of 8.16), Aldgate (8.10) and Ealing Broadway (8.02) were most likely to agree and visitors to Hackney, Hornchurch and Harlesden least likely to agree (7.02).
Cyclists were most likely to agree (7.96) and car users least likely to agree (7.39).
Accent Town Centres 2013 report FINAL REPORT TO USECH31.05.13 Page 36 of 111
Goods vehicles should not be allowed in bus lanes:
Visitors to Aldgate (7.48) and Shepherds Bush (7.46) were most likely to agree and visitors to Harlesden least likely to agree (6.10).
Cyclists were most likely to agree (7.69) and car users least likely to agree (6.42).
Bus lanes are of benefit to cyclists:
Visitors to Ealing Broadway (6.91) and Oxford Street/Regent Street (6.81) were most likely to agree and visitors to Hornchurch least likely to agree (5.7).
Cyclists were most likely to agree (8.09) and car users least likely to agree (6.20).
Buses should be given priority at traffic lights:
Visitors to Kingsland High Street (6.87) and Ealing Broadway (6.80) were most likely to agree and visitors to Hornchurch least likely to agree (5.29).
Cyclists were most likely to agree (6.92) and car users least likely to agree (5.06)
There should be more bus lanes:
Visitors to Aldgate (6.52) and Kingsland High Street (6.51) were most likely to agree and visitors to Hornchurch least likely to agree (4.71).
Cyclists were most likely to agree (6.51) and car users least likely to agree (4.64).
Bus stops are conveniently located: Visitors to Ealing Broadway (6.91) and Kingsland High Street (7.85) were most
likely to agree and visitors to Hornchurch least likely to agree (4.71). Cyclists were most likely to agree (7.69) and users of taxis/minicabs or other
modes were least likely to agree (4.40). Comparison over time There has been an increase in agreement on most statements regarding bus lanes and bus priority measures since 2011
Net agreement 2013 2011 2009 There should be stricter enforcement of illegal parking in bus lanes 72% 67% 69% Bus stops are conveniently located 70% 69% 70% Goods vehicles should not be allowed in bus lanes 60% 48% 57% Bus lanes are of benefit to cyclists 52% 45% 53% Buses should be given priority at traffic lights 52% 54% 42% There should be more bus lanes 44% 45% 39%
Encouraging More Bus Use Almost half (49%) mentioned some improvements that could encourage (greater) bus use. Making buses more regular (19%), faster journeys (15%), lower fares (15%), more reliable buses (14%) and more direct bus routes (13%) were the most frequently suggested ways in which bus use could be encouraged as shown in Table 13 below. 2.7 improvements were mentioned on average by each respondent.
Accent Town Centres 2013 report FINAL REPORT TO USECH31.05.13 Page 37 of 111
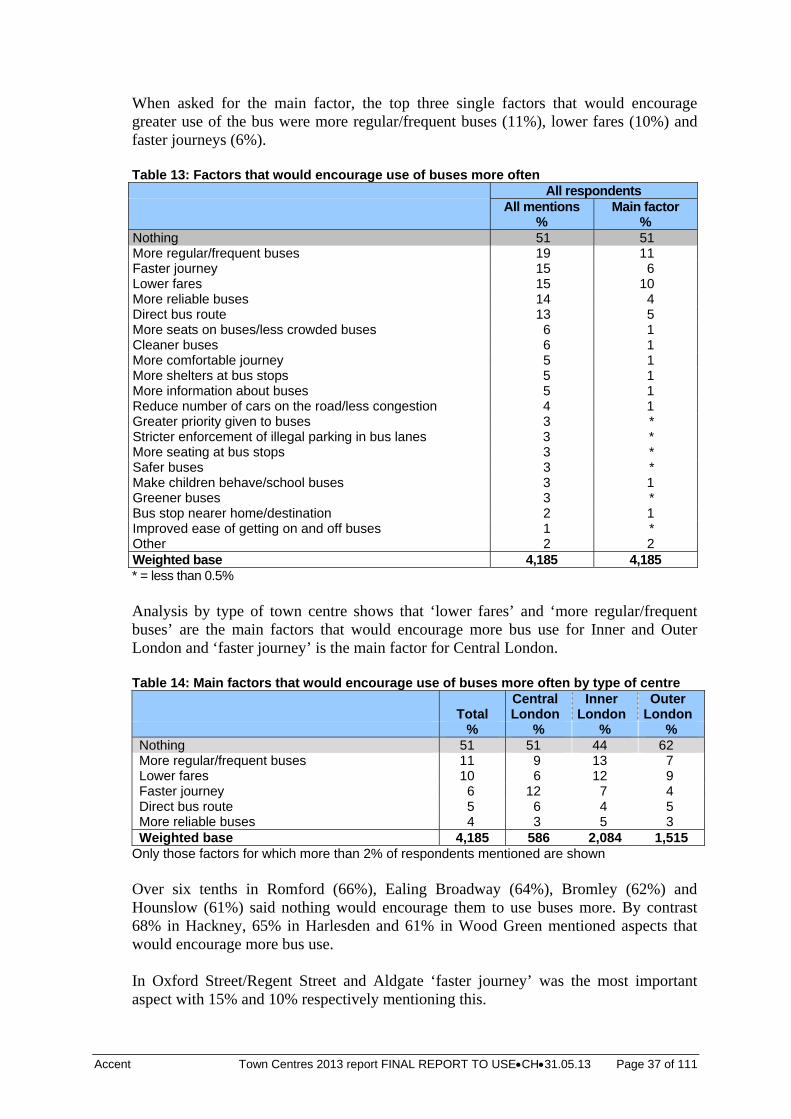
When asked for the main factor, the top three single factors that would encourage greater use of the bus were more regular/frequent buses (11%), lower fares (10%) and faster journeys (6%). Table 13: Factors that would encourage use of buses more often All respondents All mentions
% Main factor
% Nothing 51 51 More regular/frequent buses 19 11 Faster journey 15 6 Lower fares 15 10 More reliable buses 14 4 Direct bus route 13 5 More seats on buses/less crowded buses 6 1 Cleaner buses 6 1 More comfortable journey 5 1 More shelters at bus stops 5 1 More information about buses 5 1 Reduce number of cars on the road/less congestion 4 1 Greater priority given to buses 3 * Stricter enforcement of illegal parking in bus lanes 3 * More seating at bus stops 3 * Safer buses 3 * Make children behave/school buses 3 1 Greener buses 3 * Bus stop nearer home/destination 2 1 Improved ease of getting on and off buses 1 * Other 2 2 Weighted base 4,185 4,185 * = less than 0.5% Analysis by type of town centre shows that ‘lower fares’ and ‘more regular/frequent buses’ are the main factors that would encourage more bus use for Inner and Outer London and ‘faster journey’ is the main factor for Central London. Table 14: Main factors that would encourage use of buses more often by type of centre
Total Central London
Inner London
Outer London
% % % % Nothing 51 51 44 62 More regular/frequent buses 11 9 13 7 Lower fares 10 6 12 9 Faster journey 6 12 7 4 Direct bus route 5 6 4 5 More reliable buses 4 3 5 3 Weighted base 4,185 586 2,084 1,515
Only those factors for which more than 2% of respondents mentioned are shown Over six tenths in Romford (66%), Ealing Broadway (64%), Bromley (62%) and Hounslow (61%) said nothing would encourage them to use buses more. By contrast 68% in Hackney, 65% in Harlesden and 61% in Wood Green mentioned aspects that would encourage more bus use. In Oxford Street/Regent Street and Aldgate ‘faster journey’ was the most important aspect with 15% and 10% respectively mentioning this.
Accent Town Centres 2013 report FINAL REPORT TO USECH31.05.13 Page 38 of 111
In Harlesden, Kingston, Shepherds Bush and Wood Green ‘more regular/frequent buses’ was the most often mentioned aspect that would encourage more bus use. In Bethnal Green, Bromley, Hackney, Kingsland High Street, Hornchurch and Hounslow ‘lower fares’ was the most often mentioned aspect that would encourage more bus use.
3.7 Encouraging Cycling
Summary In total, 4% cycled to the town centre or sometimes cycle to the area of the town centre. Over two thirds (71%) said nothing would encourage them to cycle. The three main improvements which would encourage more cycling were ‘more dedicated cycle paths’ (13%), ‘more cycle lanes on the roads’ (13%) and ‘less road traffic’ (12%). Respondents were shown a card with the following list of potential improvements and asked which would encourage them to cycle more often in the area: (More) cycle lanes on the roads (More) dedicated cycle paths Less road traffic Free on-road cycle training Bicycle hire scheme (Better) bicycle parking facilities in this area (Better) bicycle parking facilities at / near your home None of these / nothing. Over a quarter (29%) of town centre visitors mentioned at least one thing that might encourage them to cycle more often in the area. The three main improvements were ‘more dedicated cycle paths’ (13%), ‘more cycle lanes on the roads’ (13%) and ‘less road traffic’ (12%). Over three quarters of visitors to Romford (80%), Wood Green (78%) and Hornchurch (77%) said nothing would encourage them to cycle. Visitors to the following town centres were most likely to mention one or more things that would encourage them to cycle: Ealing Broadway (36%), Kingsland High Street (35%), Bethnal Green (35%) and Shepherds Bush (34%). ‘(More) dedicated cycle paths’ and ‘less road traffic’ were mentioned most in Hackney (23% and 19% respectively). ‘(More) cycle lanes on the roads’ was mentioned most in Kingsland High Street (20%). Bicycle hire scheme was mentioned most in Harlesden (10%).
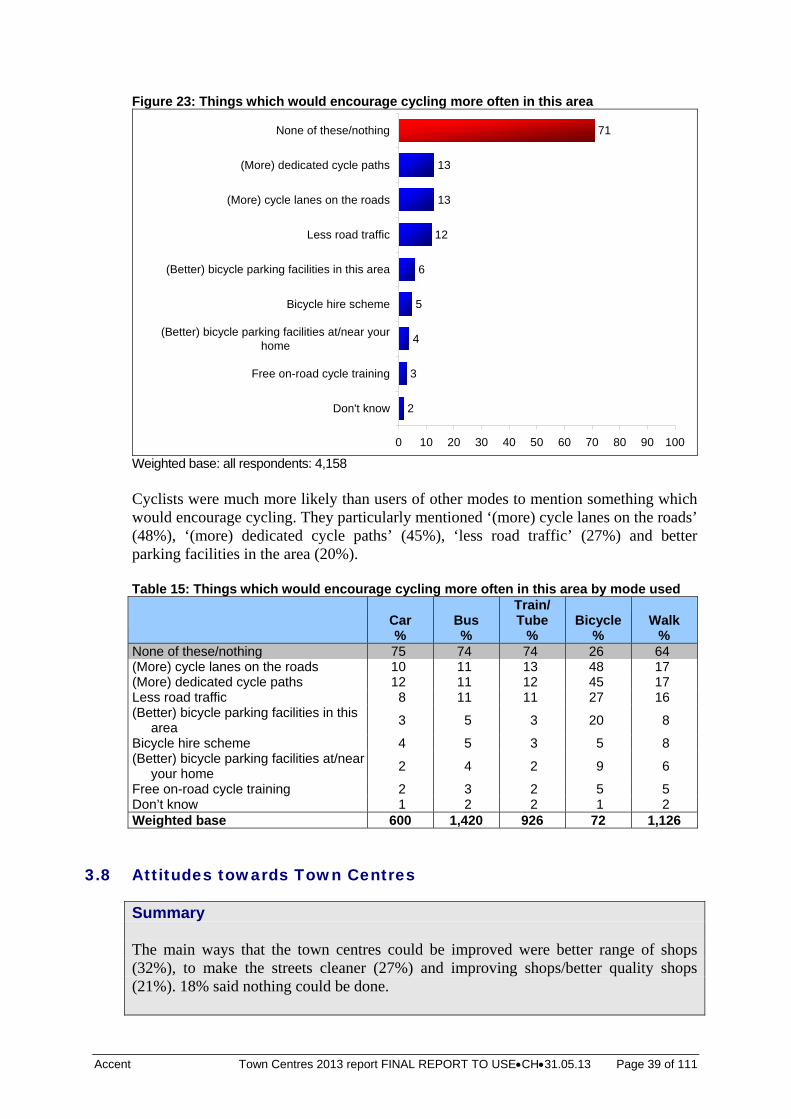
Accent Town Centres 2013 report FINAL REPORT TO USECH31.05.13 Page 39 of 111
Figure 23: Things which would encourage cycling more often in this area
2
3
4
5
6
12
13
13
71
0 10 20 30 40 50 60 70 80 90 100
Don't know
Free on-road cycle training
(Better) bicycle parking facilities at/near yourhome
Bicycle hire scheme
(Better) bicycle parking facilities in this area
Less road traffic
(More) cycle lanes on the roads
(More) dedicated cycle paths
None of these/nothing
Weighted base: all respondents: 4,158 Cyclists were much more likely than users of other modes to mention something which would encourage cycling. They particularly mentioned ‘(more) cycle lanes on the roads’ (48%), ‘(more) dedicated cycle paths’ (45%), ‘less road traffic’ (27%) and better parking facilities in the area (20%). Table 15: Things which would encourage cycling more often in this area by mode used
Car %
Bus %
Train/ Tube
% Bicycle
% Walk
% None of these/nothing 75 74 74 26 64 (More) cycle lanes on the roads 10 11 13 48 17 (More) dedicated cycle paths 12 11 12 45 17 Less road traffic 8 11 11 27 16 (Better) bicycle parking facilities in this
area 3 5 3 20 8
Bicycle hire scheme 4 5 3 5 8 (Better) bicycle parking facilities at/near
your home 2 4 2 9 6
Free on-road cycle training 2 3 2 5 5 Don’t know 1 2 2 1 2 Weighted base 600 1,420 926 72 1,126
3.8 Attitudes towards Town Centres
Summary The main ways that the town centres could be improved were better range of shops (32%), to make the streets cleaner (27%) and improving shops/better quality shops (21%). 18% said nothing could be done.
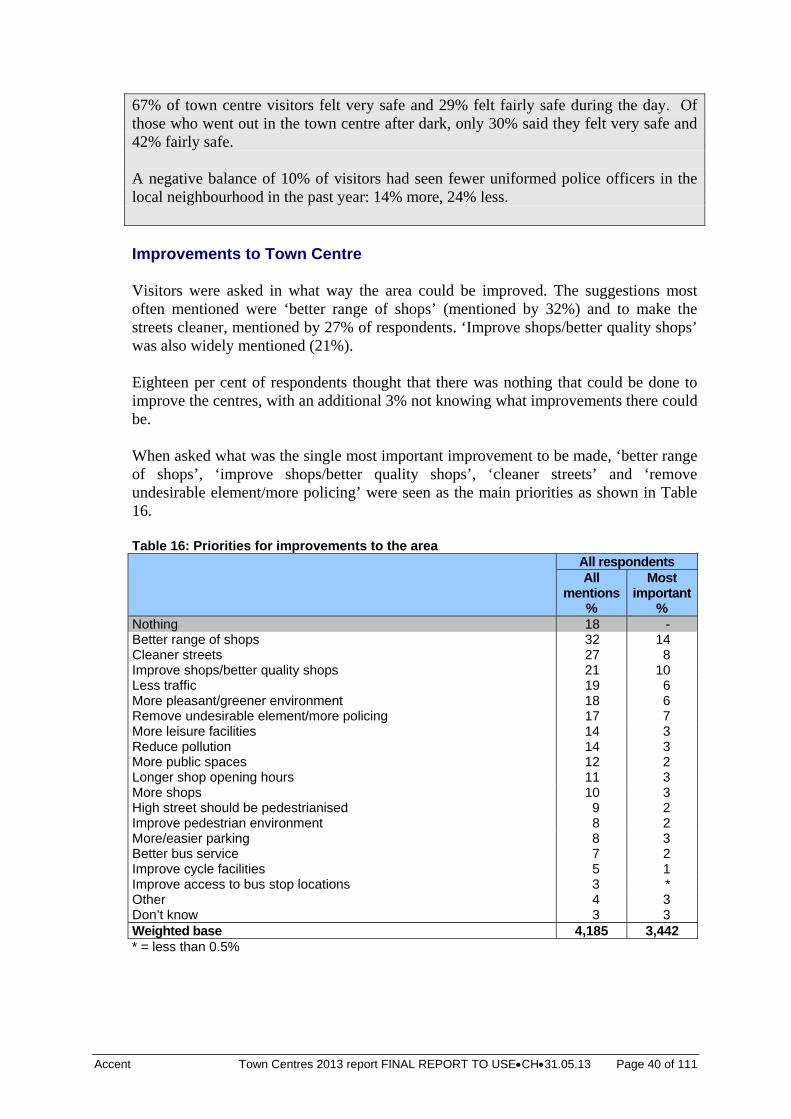
Accent Town Centres 2013 report FINAL REPORT TO USECH31.05.13 Page 40 of 111
67% of town centre visitors felt very safe and 29% felt fairly safe during the day. Of those who went out in the town centre after dark, only 30% said they felt very safe and 42% fairly safe. A negative balance of 10% of visitors had seen fewer uniformed police officers in the local neighbourhood in the past year: 14% more, 24% less. Improvements to Town Centre Visitors were asked in what way the area could be improved. The suggestions most often mentioned were ‘better range of shops’ (mentioned by 32%) and to make the streets cleaner, mentioned by 27% of respondents. ‘Improve shops/better quality shops’ was also widely mentioned (21%). Eighteen per cent of respondents thought that there was nothing that could be done to improve the centres, with an additional 3% not knowing what improvements there could be. When asked what was the single most important improvement to be made, ‘better range of shops’, ‘improve shops/better quality shops’, ‘cleaner streets’ and ‘remove undesirable element/more policing’ were seen as the main priorities as shown in Table 16. Table 16: Priorities for improvements to the area All respondents
All mentions
%
Most important
% Nothing 18 - Better range of shops 32 14 Cleaner streets 27 8 Improve shops/better quality shops 21 10 Less traffic 19 6 More pleasant/greener environment 18 6 Remove undesirable element/more policing 17 7 More leisure facilities 14 3 Reduce pollution 14 3 More public spaces 12 2 Longer shop opening hours 11 3 More shops 10 3 High street should be pedestrianised 9 2 Improve pedestrian environment 8 2 More/easier parking 8 3 Better bus service 7 2 Improve cycle facilities 5 1 Improve access to bus stop locations 3 * Other 4 3 Don’t know 3 3 Weighted base 4,185 3,442 * = less than 0.5%
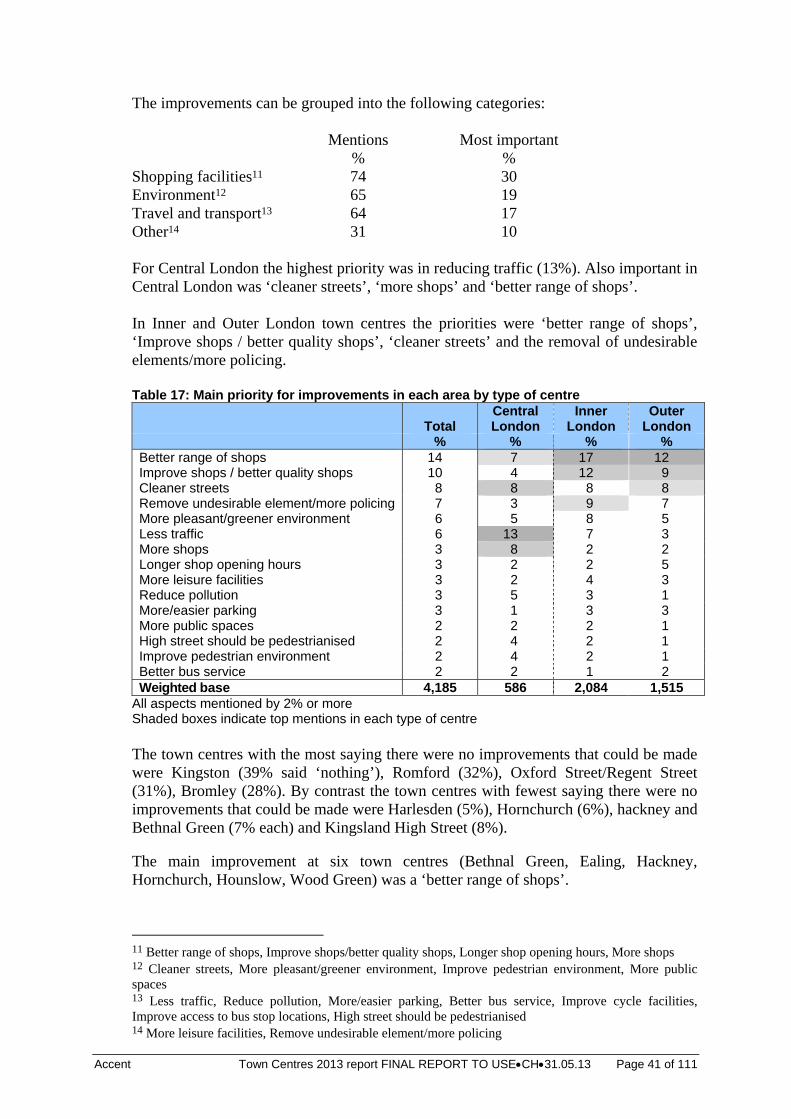
Accent Town Centres 2013 report FINAL REPORT TO USECH31.05.13 Page 41 of 111
The improvements can be grouped into the following categories: Mentions Most important % % Shopping facilities11 74 30 Environment12 65 19 Travel and transport13 64 17 Other14 31 10 For Central London the highest priority was in reducing traffic (13%). Also important in Central London was ‘cleaner streets’, ‘more shops’ and ‘better range of shops’. In Inner and Outer London town centres the priorities were ‘better range of shops’, ‘Improve shops / better quality shops’, ‘cleaner streets’ and the removal of undesirable elements/more policing. Table 17: Main priority for improvements in each area by type of centre
Total Central London
Inner London
Outer London
% % % %Better range of shops 14 7 17 12 Improve shops / better quality shops 10 4 12 9 Cleaner streets 8 8 8 8 Remove undesirable element/more policing 7 3 9 7 More pleasant/greener environment 6 5 8 5 Less traffic 6 13 7 3 More shops 3 8 2 2 Longer shop opening hours 3 2 2 5 More leisure facilities 3 2 4 3 Reduce pollution 3 5 3 1 More/easier parking 3 1 3 3 More public spaces 2 2 2 1 High street should be pedestrianised 2 4 2 1 Improve pedestrian environment 2 4 2 1 Better bus service 2 2 1 2 Weighted base 4,185 586 2,084 1,515
All aspects mentioned by 2% or more Shaded boxes indicate top mentions in each type of centre The town centres with the most saying there were no improvements that could be made were Kingston (39% said ‘nothing’), Romford (32%), Oxford Street/Regent Street (31%), Bromley (28%). By contrast the town centres with fewest saying there were no improvements that could be made were Harlesden (5%), Hornchurch (6%), hackney and Bethnal Green (7% each) and Kingsland High Street (8%). The main improvement at six town centres (Bethnal Green, Ealing, Hackney, Hornchurch, Hounslow, Wood Green) was a ‘better range of shops’.
11 Better range of shops, Improve shops/better quality shops, Longer shop opening hours, More shops 12 Cleaner streets, More pleasant/greener environment, Improve pedestrian environment, More public spaces 13 Less traffic, Reduce pollution, More/easier parking, Better bus service, Improve cycle facilities, Improve access to bus stop locations, High street should be pedestrianised 14 More leisure facilities, Remove undesirable element/more policing
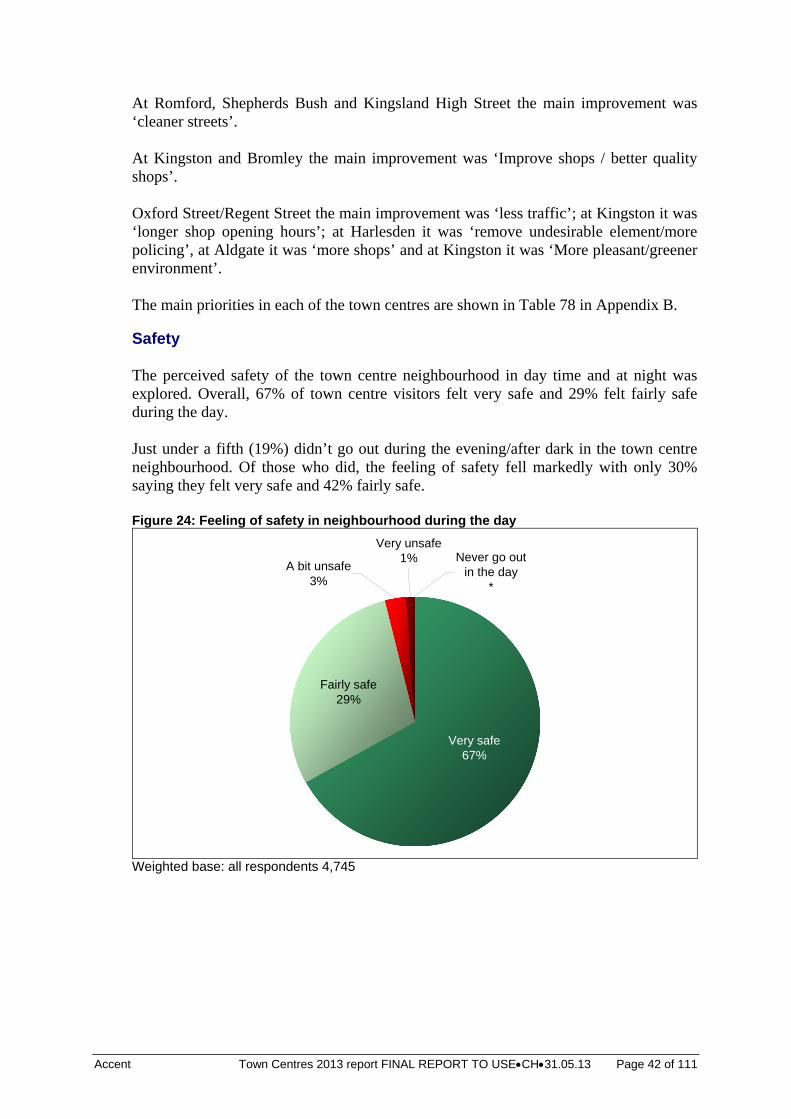
Accent Town Centres 2013 report FINAL REPORT TO USECH31.05.13 Page 42 of 111
At Romford, Shepherds Bush and Kingsland High Street the main improvement was ‘cleaner streets’. At Kingston and Bromley the main improvement was ‘Improve shops / better quality shops’. Oxford Street/Regent Street the main improvement was ‘less traffic’; at Kingston it was ‘longer shop opening hours’; at Harlesden it was ‘remove undesirable element/more policing’, at Aldgate it was ‘more shops’ and at Kingston it was ‘More pleasant/greener environment’. The main priorities in each of the town centres are shown in Table 78 in Appendix B. Safety The perceived safety of the town centre neighbourhood in day time and at night was explored. Overall, 67% of town centre visitors felt very safe and 29% felt fairly safe during the day. Just under a fifth (19%) didn’t go out during the evening/after dark in the town centre neighbourhood. Of those who did, the feeling of safety fell markedly with only 30% saying they felt very safe and 42% fairly safe. Figure 24: Feeling of safety in neighbourhood during the day
Very unsafe1% Never go out
in the day*
A bit unsafe3%
Very safe67%
Fairly safe29%
Weighted base: all respondents 4,745
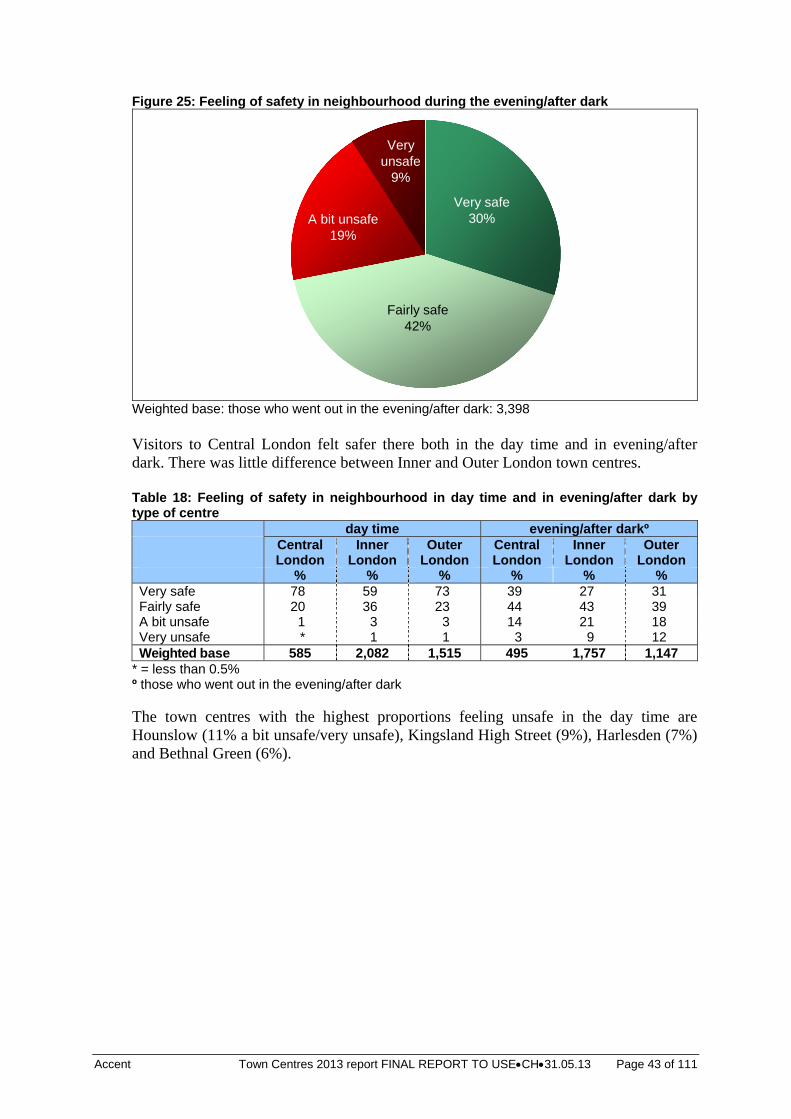
Accent Town Centres 2013 report FINAL REPORT TO USECH31.05.13 Page 43 of 111
Figure 25: Feeling of safety in neighbourhood during the evening/after dark
Very unsafe
9%
A bit unsafe19%
Very safe30%
Fairly safe42%
Weighted base: those who went out in the evening/after dark: 3,398 Visitors to Central London felt safer there both in the day time and in evening/after dark. There was little difference between Inner and Outer London town centres. Table 18: Feeling of safety in neighbourhood in day time and in evening/after dark by type of centre day time evening/after darkº Central
London Inner
London Outer
London Central London
Inner London
Outer London
% % % % % %Very safe 78 59 73 39 27 31 Fairly safe 20 36 23 44 43 39 A bit unsafe 1 3 3 14 21 18 Very unsafe * 1 1 3 9 12 Weighted base 585 2,082 1,515 495 1,757 1,147
* = less than 0.5% º those who went out in the evening/after dark The town centres with the highest proportions feeling unsafe in the day time are Hounslow (11% a bit unsafe/very unsafe), Kingsland High Street (9%), Harlesden (7%) and Bethnal Green (6%).
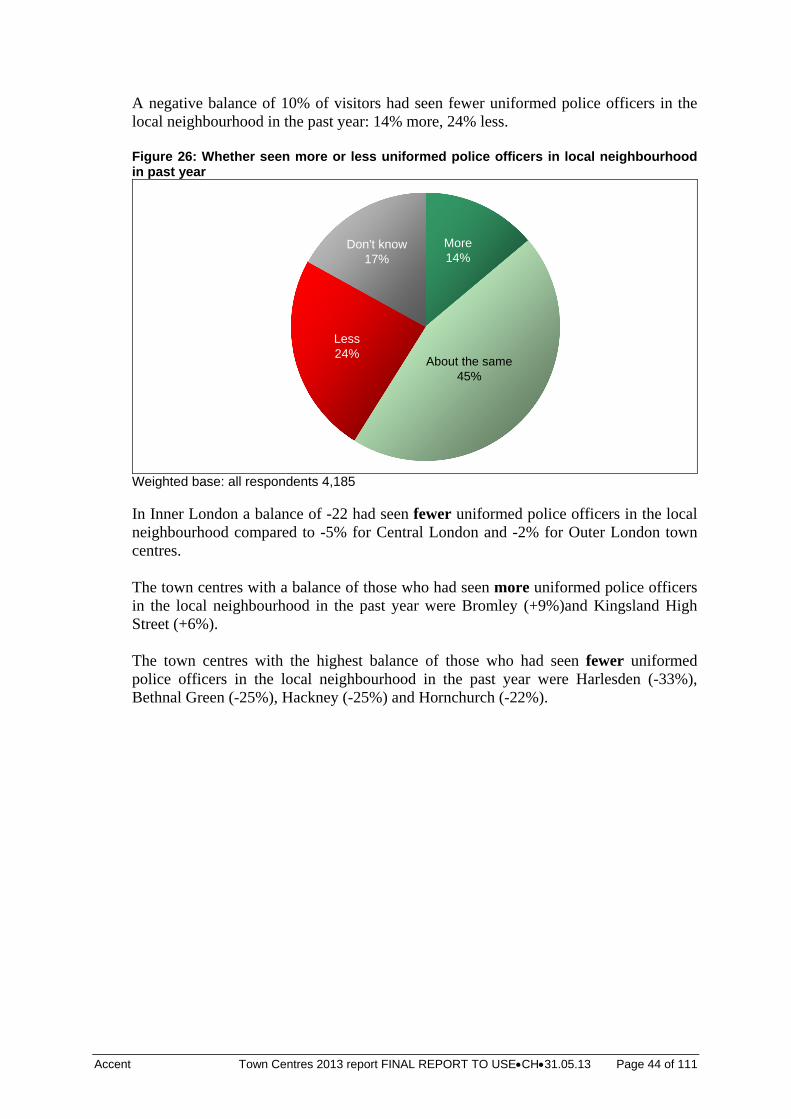
Accent Town Centres 2013 report FINAL REPORT TO USECH31.05.13 Page 44 of 111
A negative balance of 10% of visitors had seen fewer uniformed police officers in the local neighbourhood in the past year: 14% more, 24% less. Figure 26: Whether seen more or less uniformed police officers in local neighbourhood in past year
About the same45%
More14%
Less24%
Don't know17%
Weighted base: all respondents 4,185 In Inner London a balance of -22 had seen fewer uniformed police officers in the local neighbourhood compared to -5% for Central London and -2% for Outer London town centres. The town centres with a balance of those who had seen more uniformed police officers in the local neighbourhood in the past year were Bromley (+9%)and Kingsland High Street (+6%). The town centres with the highest balance of those who had seen fewer uniformed police officers in the local neighbourhood in the past year were Harlesden (-33%), Bethnal Green (-25%), Hackney (-25%) and Hornchurch (-22%).
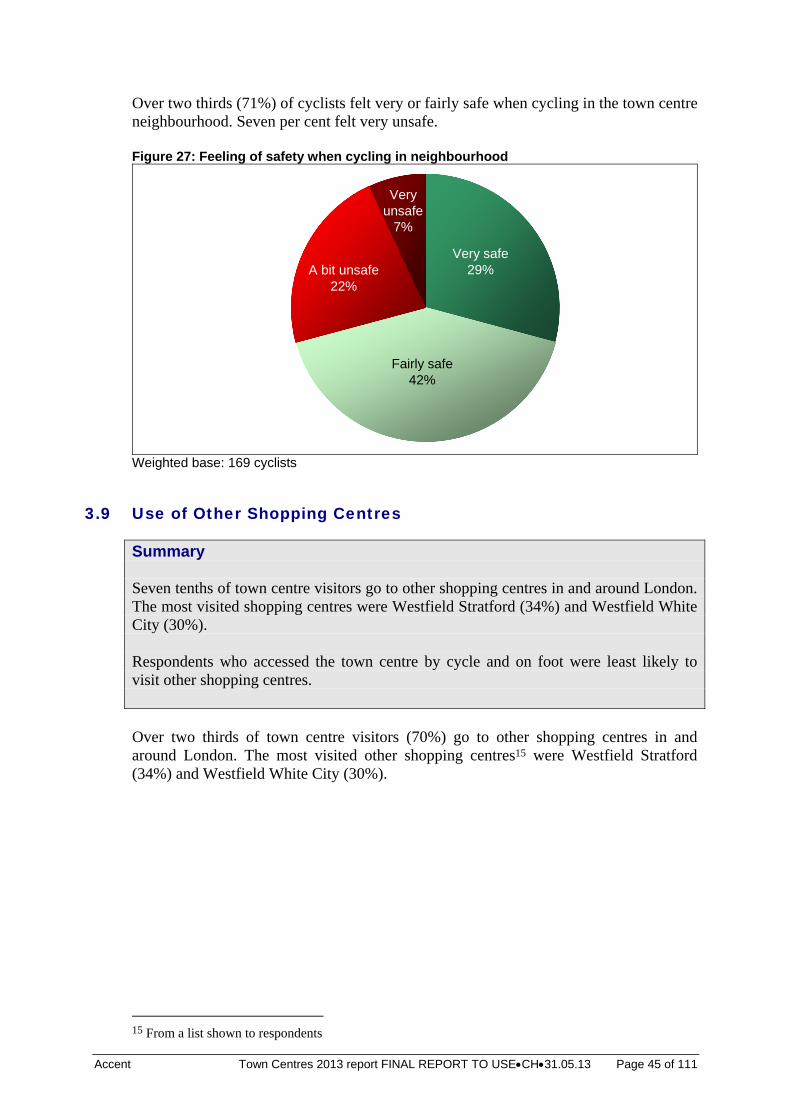
Accent Town Centres 2013 report FINAL REPORT TO USECH31.05.13 Page 45 of 111
Over two thirds (71%) of cyclists felt very or fairly safe when cycling in the town centre neighbourhood. Seven per cent felt very unsafe. Figure 27: Feeling of safety when cycling in neighbourhood
Very unsafe
7%
A bit unsafe22%
Very safe29%
Fairly safe42%
Weighted base: 169 cyclists
3.9 Use of Other Shopping Centres
Summary Seven tenths of town centre visitors go to other shopping centres in and around London. The most visited shopping centres were Westfield Stratford (34%) and Westfield White City (30%). Respondents who accessed the town centre by cycle and on foot were least likely to visit other shopping centres. Over two thirds of town centre visitors (70%) go to other shopping centres in and around London. The most visited other shopping centres15 were Westfield Stratford (34%) and Westfield White City (30%).
15 From a list shown to respondents
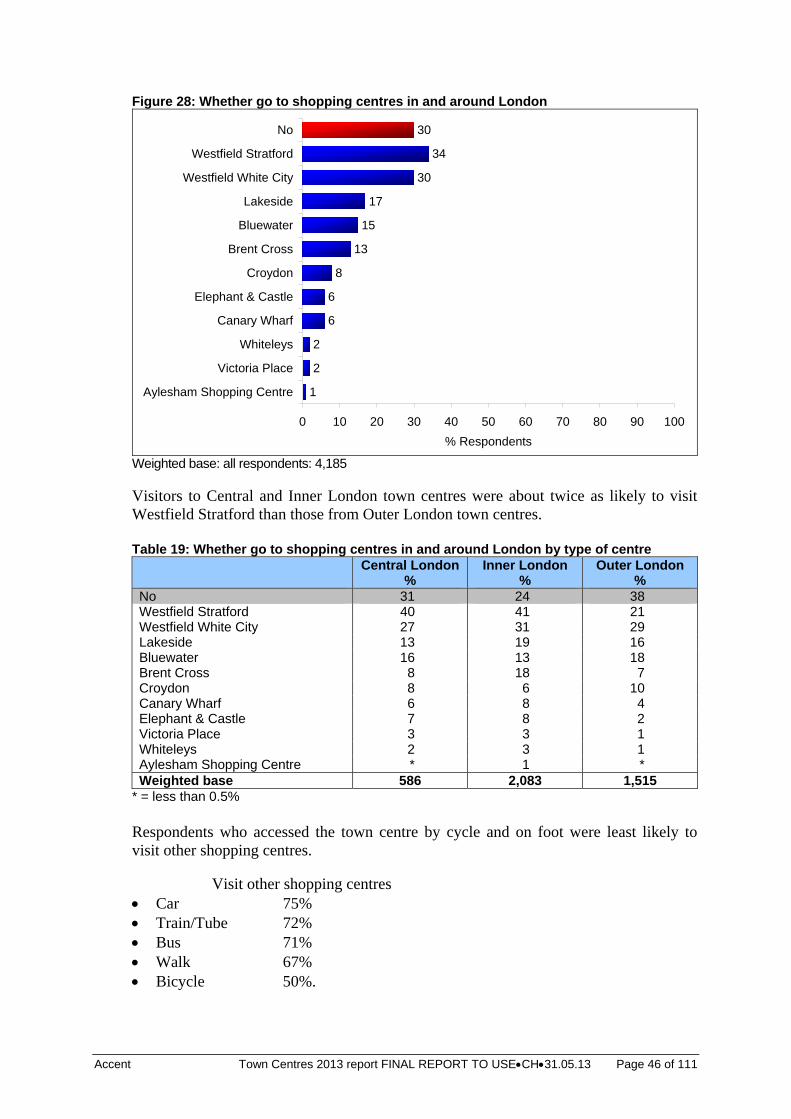
Accent Town Centres 2013 report FINAL REPORT TO USECH31.05.13 Page 46 of 111
Figure 28: Whether go to shopping centres in and around London
1
2
2
6
6
8
13
15
17
30
34
30
0 10 20 30 40 50 60 70 80 90 100
Aylesham Shopping Centre
Victoria Place
Whiteleys
Canary Wharf
Elephant & Castle
Croydon
Brent Cross
Bluewater
Lakeside
Westfield White City
Westfield Stratford
No
% Respondents
Weighted base: all respondents: 4,185 Visitors to Central and Inner London town centres were about twice as likely to visit Westfield Stratford than those from Outer London town centres. Table 19: Whether go to shopping centres in and around London by type of centre
Central London
% Inner London
% Outer London
% No 31 24 38 Westfield Stratford 40 41 21 Westfield White City 27 31 29 Lakeside 13 19 16 Bluewater 16 13 18 Brent Cross 8 18 7 Croydon 8 6 10 Canary Wharf 6 8 4 Elephant & Castle 7 8 2 Victoria Place 3 3 1 Whiteleys 2 3 1 Aylesham Shopping Centre * 1 * Weighted base 586 2,083 1,515
* = less than 0.5% Respondents who accessed the town centre by cycle and on foot were least likely to visit other shopping centres.
Visit other shopping centres Car 75% Train/Tube 72% Bus 71% Walk 67% Bicycle 50%.
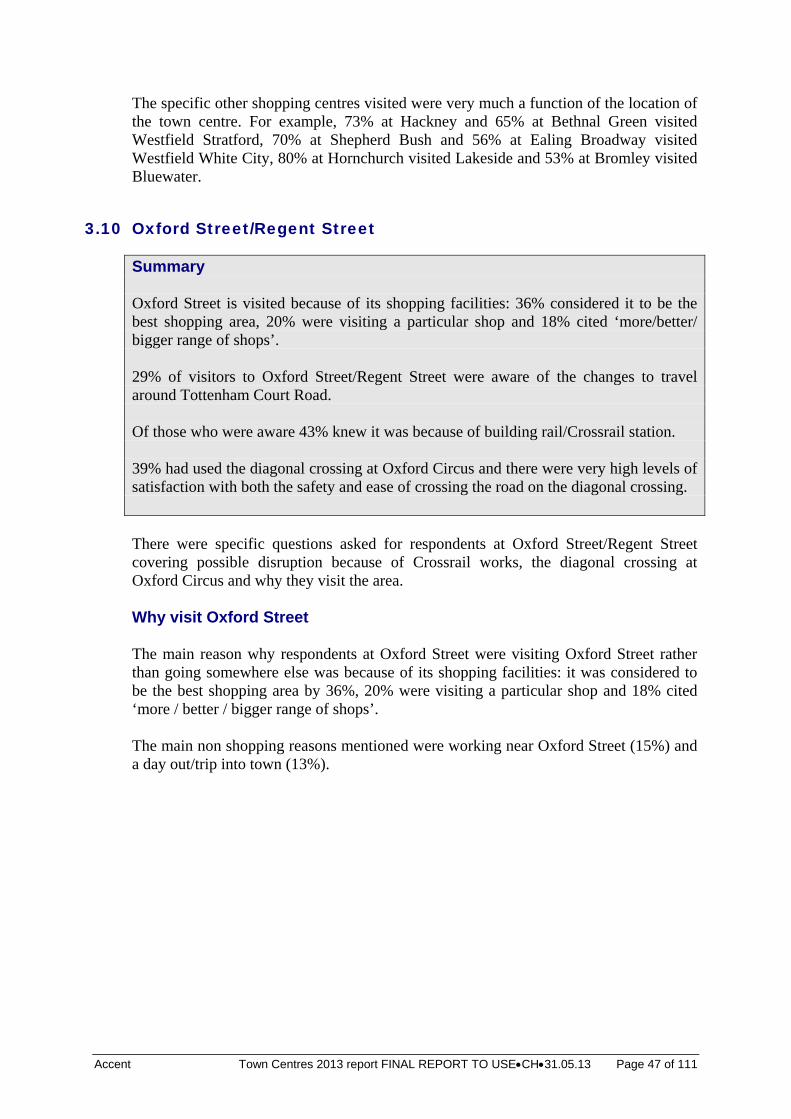
Accent Town Centres 2013 report FINAL REPORT TO USECH31.05.13 Page 47 of 111
The specific other shopping centres visited were very much a function of the location of the town centre. For example, 73% at Hackney and 65% at Bethnal Green visited
Westfield Stratford, 70% at Shepherd Bush and 56% at Ealing Broadway visited Westfield White City, 80% at Hornchurch visited Lakeside and 53% at Bromley visited Bluewater.
3.10 Oxford Street/Regent Street
Summary Oxford Street is visited because of its shopping facilities: 36% considered it to be the best shopping area, 20% were visiting a particular shop and 18% cited ‘more/better/ bigger range of shops’. 29% of visitors to Oxford Street/Regent Street were aware of the changes to travel around Tottenham Court Road. Of those who were aware 43% knew it was because of building rail/Crossrail station. 39% had used the diagonal crossing at Oxford Circus and there were very high levels of satisfaction with both the safety and ease of crossing the road on the diagonal crossing. There were specific questions asked for respondents at Oxford Street/Regent Street covering possible disruption because of Crossrail works, the diagonal crossing at Oxford Circus and why they visit the area. Why visit Oxford Street The main reason why respondents at Oxford Street were visiting Oxford Street rather than going somewhere else was because of its shopping facilities: it was considered to be the best shopping area by 36%, 20% were visiting a particular shop and 18% cited ‘more / better / bigger range of shops’. The main non shopping reasons mentioned were working near Oxford Street (15%) and a day out/trip into town (13%).
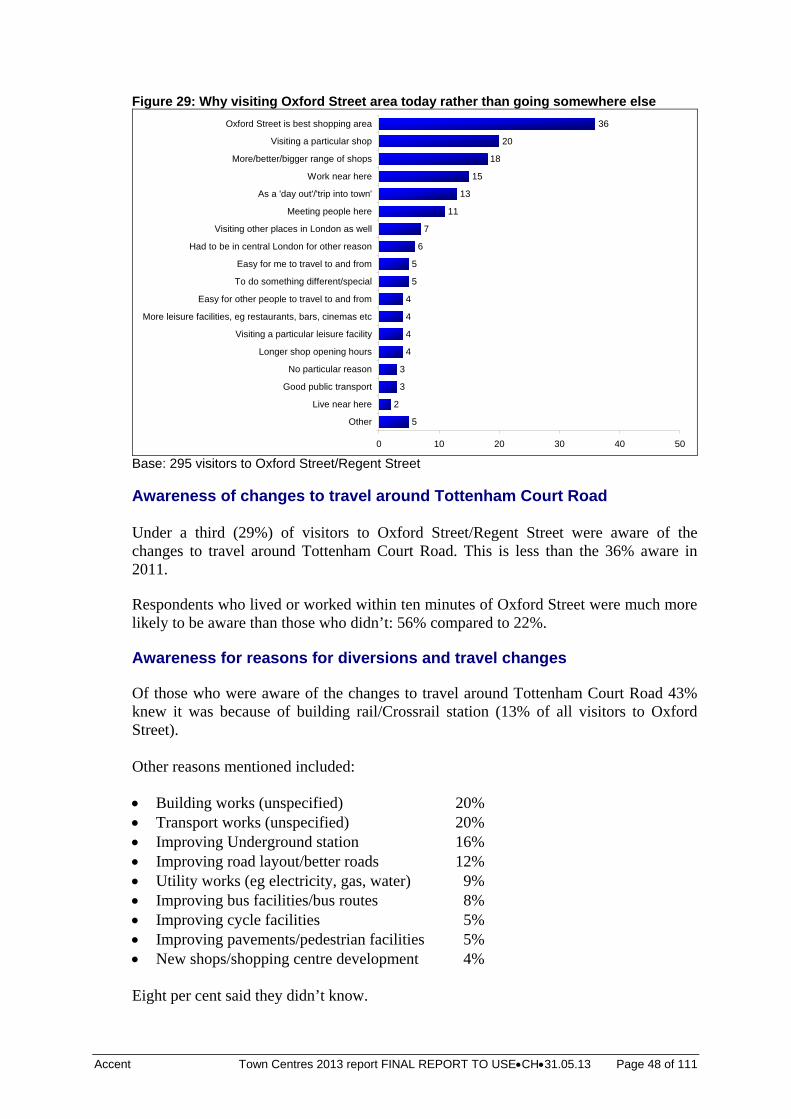
Accent Town Centres 2013 report FINAL REPORT TO USECH31.05.13 Page 48 of 111
Figure 29: Why visiting Oxford Street area today rather than going somewhere else
5
2
3
3
4
4
4
4
5
5
6
7
11
13
15
18
20
36
0 10 20 30 40 50
Other
Live near here
Good public transport
No particular reason
Longer shop opening hours
Visiting a particular leisure facility
More leisure facilities, eg restaurants, bars, cinemas etc
Easy for other people to travel to and from
To do something different/special
Easy for me to travel to and from
Had to be in central London for other reason
Visiting other places in London as well
Meeting people here
As a 'day out'/'trip into town'
Work near here
More/better/bigger range of shops
Visiting a particular shop
Oxford Street is best shopping area
Base: 295 visitors to Oxford Street/Regent Street Awareness of changes to travel around Tottenham Court Road Under a third (29%) of visitors to Oxford Street/Regent Street were aware of the changes to travel around Tottenham Court Road. This is less than the 36% aware in 2011. Respondents who lived or worked within ten minutes of Oxford Street were much more likely to be aware than those who didn’t: 56% compared to 22%. Awareness for reasons for diversions and travel changes Of those who were aware of the changes to travel around Tottenham Court Road 43% knew it was because of building rail/Crossrail station (13% of all visitors to Oxford Street). Other reasons mentioned included: Building works (unspecified) 20% Transport works (unspecified) 20% Improving Underground station 16% Improving road layout/better roads 12% Utility works (eg electricity, gas, water) 9% Improving bus facilities/bus routes 8% Improving cycle facilities 5% Improving pavements/pedestrian facilities 5% New shops/shopping centre development 4% Eight per cent said they didn’t know.
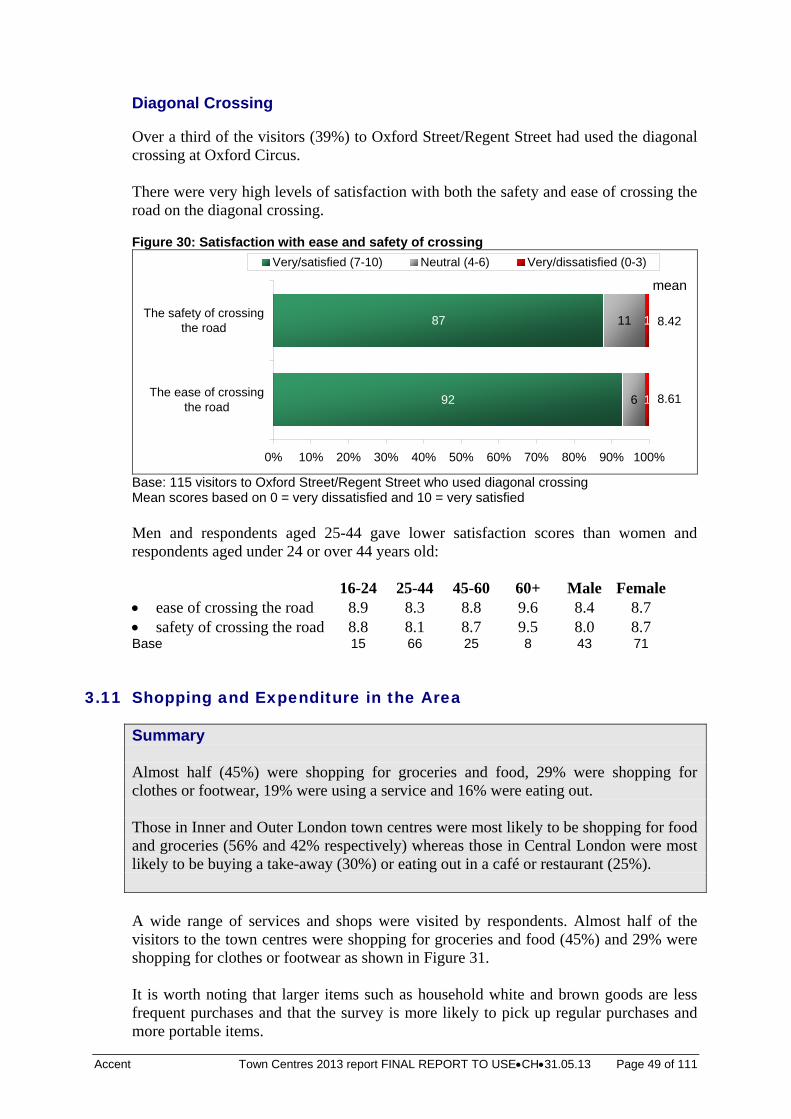
Accent Town Centres 2013 report FINAL REPORT TO USECH31.05.13 Page 49 of 111
Diagonal Crossing Over a third of the visitors (39%) to Oxford Street/Regent Street had used the diagonal crossing at Oxford Circus. There were very high levels of satisfaction with both the safety and ease of crossing the road on the diagonal crossing. Figure 30: Satisfaction with ease and safety of crossing
92
87
6
11 1
1
0% 10% 20% 30% 40% 50% 60% 70% 80% 90% 100%
The ease of crossingthe road
The safety of crossingthe road
Very/satisfied (7-10) Neutral (4-6) Very/dissatisfied (0-3)
8.42
mean
8.61
Base: 115 visitors to Oxford Street/Regent Street who used diagonal crossing Mean scores based on 0 = very dissatisfied and 10 = very satisfied Men and respondents aged 25-44 gave lower satisfaction scores than women and respondents aged under 24 or over 44 years old: 16-24 25-44 45-60 60+ Male Female ease of crossing the road 8.9 8.3 8.8 9.6 8.4 8.7 safety of crossing the road 8.8 8.1 8.7 9.5 8.0 8.7 Base 15 66 25 8 43 71
3.11 Shopping and Expenditure in the Area
Summary Almost half (45%) were shopping for groceries and food, 29% were shopping for clothes or footwear, 19% were using a service and 16% were eating out. Those in Inner and Outer London town centres were most likely to be shopping for food and groceries (56% and 42% respectively) whereas those in Central London were most likely to be buying a take-away (30%) or eating out in a café or restaurant (25%). A wide range of services and shops were visited by respondents. Almost half of the visitors to the town centres were shopping for groceries and food (45%) and 29% were shopping for clothes or footwear as shown in Figure 31. It is worth noting that larger items such as household white and brown goods are less frequent purchases and that the survey is more likely to pick up regular purchases and more portable items.
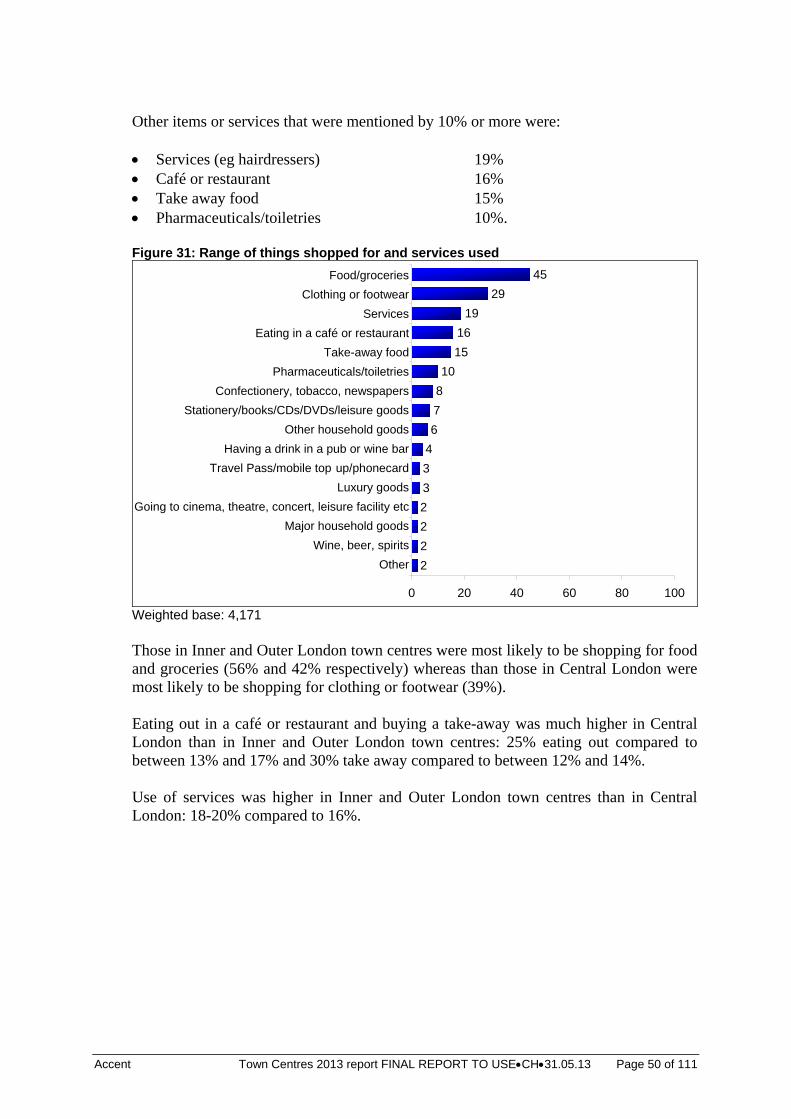
Accent Town Centres 2013 report FINAL REPORT TO USECH31.05.13 Page 50 of 111
Other items or services that were mentioned by 10% or more were: Services (eg hairdressers) 19% Café or restaurant 16% Take away food 15% Pharmaceuticals/toiletries 10%. Figure 31: Range of things shopped for and services used
2
2
2
2
3
3
4
6
7
8
10
15
16
19
29
45
0 20 40 60 80 100
Other
Major household goods
Luxury goods
Having a drink in a pub or wine bar
Stationery/books/CDs/DVDs/leisuregoods
Pharmaceuticals/toiletries
Eating in a café or restaurant
Clothing or footwear
Weighted base: 4,171 Those in Inner and Outer London town centres were most likely to be shopping for food and groceries (56% and 42% respectively) whereas than those in Central London were most likely to be shopping for clothing or footwear (39%). Eating out in a café or restaurant and buying a take-away was much higher in Central London than in Inner and Outer London town centres: 25% eating out compared to between 13% and 17% and 30% take away compared to between 12% and 14%. Use of services was higher in Inner and Outer London town centres than in Central London: 18-20% compared to 16%.
Food/groceries
Clothing or footwear
Services
Eating in a café or restaurant
Take-away food
Pharmaceuticals/toiletries
Confectionery, tobacco, newspapers
Stationery/books/CDs/DVDs/leisure goods
Other household goods
Having a drink in a pub or wine bar
Travel Pass/mobile top up/phonecard
Luxury goods
Going to cinema, theatre, concert, leisure facility etc
Major household goods
Wine, beer, spirits
Other
Accent Town Centres 2013 report FINAL REPORT TO USECH31.05.13 Page 51 of 111
Table 20: Range of shopping and services by type of centre
Total Central London
Inner London
Outer London
% % % % Food/groceries 45 15 56 42 Clothing or footwear 29 39 19 39 Services 19 16 20 18 Eating in a café or restaurant 16 25 13 17 Take-away food 15 30 14 12 Pharmaceuticals/toiletries 10 9 10 11 Confectionery, tobacco, newspapers 8 8 8 8 Stationery/books/CDs/DVDs/leisure
goods 7 6 4 11
Other household goods 6 2 6 9 Having a drink in a pub or wine bar 4 9 3 3 Luxury goods 3 6 2 4 Travel Pass/mobile top up/phonecard 3 3 3 2 Wine, beer, spirits 2 1 3 2 Major household goods 2 1 3 1 Going to cinema, theatre, concert,
leisure facility etc 2 3 2 2
Other 2 3 1 2 Weighted base 4,171 572 2,084 1,515
More than one answer may be given so totals may not add to 100% Food/grocery shopping was most mentioned at nine of the fourteen town centres (Bethnal Green, Ealing Broadway, Hackney, Harlesden, Kingsland High Street, Hornchurch, Hounslow, Shepherds Bush and Wood Green) and least mentioned at Oxford Street. Clothing or footwear shopping was most mentioned at four of the other five town centres (Bromley, Kingston, Oxford Street/Regent Street and Romford). Take away food was most mentioned at Aldgate. Analysis by town centre categories used in the London Plan is shown in Table 21. This shows that food/grocery shopping was most mentioned at District and Major town centres (64% and 52% respectively) and least mentioned at International town centres (9%). Clothing or footwear shopping was most mentioned at International town centres (73%) and least mentioned at District town centres (8%).
Accent Town Centres 2013 report FINAL REPORT TO USECH31.05.13 Page 52 of 111
Table 21: Range of shopping and services by London Plan town centre category
Inter-national
%
Metro-politan
% Major
% District
%
Unclassif-ied %
Food/groceries 9 43 52 64 21 Clothing or footwear 73 36 24 8 6 Services 10 18 22 20 22 Eating in a café or restaurant 33 16 12 12 18 Take-away food 15 13 17 11 44 Pharmaceuticals/toiletries 10 9 9 13 9 Confectionery, tobacco, newspapers 5 7 7 9 10 Stationery/books/CDs/DVDs/leisure
goods 11 9 4 4 1
Other household goods 3 8 5 7 0 Having a drink in a pub or wine bar 9 3 3 3 9 Luxury goods 12 4 1 1 1 Travel Pass/mobile top up/phonecard 3 2 3 3 4 Wine, beer, spirits 1 3 2 3 2 Major household goods 2 2 2 3 0 Going to cinema, theatre, concert,
leisure facility etc 6 2 2 2 1
Other 2 2 2 2 4 Weighted base 282 2,114 589 897 291
3.12 Average Spend
Summary The average spend was £37 on the day of interview which is similar to the usual spend per visit (£34). The average spend per week was £69. The average spend per month was £277. Average spend per visit by mode was car £46, train/Tube £41, bus £32, walk £25 and cycle £22. Average spend per week by mode was walk £86, bus £73, car £62, train/Tube £48 and cycle £48. Average spend per month by mode was walk £346, bus £292, train/Tube £239, car £247 and cycle £190.
Visitors were asked how much they anticipated spending in the centre during their visit and also how much they spend on average per visit. An average total spend per week was then calculated based on the frequency of visiting the centre. It should be noted that respondents were asked how much they had spent according to broad bands of expenditure. In order to calculate the average spend figures mid point values were applied to the bands and full details of these values are provided in Appendix C. Overall the average spend was £37 on the day of interview which is similar to the usual spend per visit (£34). The average spend per week was £69 and the average spend per month was £277.
Accent Town Centres 2013 report FINAL REPORT TO USECH31.05.13 Page 53 of 111
Table 22: Average spend
Spend today
%
Average spend per visit
%
Average total spend per
week* %
Average total spend per
month* %
Nothing 5 2 2 2 Under £5 11 9 7 2 £5-£19.99 31 33 21 5 £20-£49.99 30 33 25 9 £50-£99.99 15 14 25 15 £100+ 8 6 19 68 Mean £37 £34 £69 £277 Base 4,094 3,949 3,947 3,947
* excludes those who did not give an expenditure or frequency of visiting area. Those who visit Inner London spend the most on average per week (£78) and month (£312) although they spend less per visit that those who visit Central London since they visit more often. Table 23: Average spend today, per visit and per week by type of centre Central London Inner London Outer London
Sp
end
to
day
Ave
rag
e sp
end
p
er v
isit
Ave
rag
e to
tal
spen
d p
er w
eek*
Ave
rag
e to
tal
spen
d p
er m
on
th*
Sp
end
to
day
Ave
rag
e sp
end
p
er v
isit
Ave
rag
e to
tal
spen
d p
er w
eek*
Ave
rag
e to
tal
spen
d p
er m
on
th*
Sp
end
to
day
Ave
rag
e sp
end
p
er v
isit
Ave
rag
e to
tal
spen
d p
er w
eek*
Ave
rag
e to
tal
spen
d p
er m
on
th*
% % % % % % % % % % % %Nothing 4 3 4 4 5 3 3 3 5 1 1 1 Under £5 14 16 11 4 10 7 6 2 10 9 8 1 £5 - £19.99 29 27 32 6 35 36 16 4 27 31 23 5 £20 - £49.99 17 17 25 12 33 37 25 7 30 34 27 11 £50 - £99.99 17 11 13 22 12 12 27 12 18 16 26 16 £100+ 20 16 15 52 4 3 24 73 10 5 15 65 Mean £54 £40 £58 £232 £30 £29 £78 £312 £41 £35 £60 £242Base1 567 516 518 518 2061 2019 2,019 2,019 1466 1409 1,411 1,4111. except refused and don’t know Oxford Street/Regent Street (£87), Romford (£48) and Kingston (£48) were the town centres with the highest levels of spend on the day of interview. Oxford Street/Regent Street and Kingston were also the locations with the highest levels of spend on average. Visitors to Aldgate (£21) and Bethnal Green (£22) spent the least. Those visiting Hornchurch spend the most on average per week and month (£98 and £391 respectively), with those visiting Wood Green (£92 and £368) and Harlesden (£87 and £350) also having high average weekly and monthly spends. Those visiting Bromley (£56 and £226) and Aldgate (£57 and £229) spent least on average. Those in Oxford Street/Regent Street tend not to be such regular visitors to the area and this is reflected in the average spend per week and month (£59 and £238) and only below the average of £69 per week and £277 per month. This would indicate that places such as Hornchurch attract more locally based and regular shoppers for goods such as groceries and household goods whereas those in the West End visit more for luxury
Accent Town Centres 2013 report FINAL REPORT TO USECH31.05.13 Page 54 of 111
goods such as clothes and footwear. The average spend by visitors at each centre is shown in Table 74, Table 75, Table 76 and Table 77 in Appendix B. Spend by Mode Those who travelled by car were also high spenders on the day of the interview (43% spent £50 or more). In comparison, only 19% of those who travelled by bus and 12% of those who walked to the centre spent £50 or more. Those who travelled by bus spent an average of £33 on the day of interview. Those who travelled by car spent the most on average on the day of interview (£54) but those who travelled by train/Tube were also high spenders (£45 on average). Those who cycled and walked to the centre spent the least (£27). These figures are shown in Table 24. Table 24: Average spend by mode on day
Car %
Bus %
Train/Tube%
Bicycle %
Walked %
Taxi/ minicab/
other %
Nothing 4 5 5 12 5 3 Under £5 5 10 15 13 10 8 £5 - £19.99 20 28 31 33 42 13 £20 - £49.99 27 37 19 28 31 36 £50 - £99.99 27 14 16 10 8 23 £100+ 16 5 14 4 4 18 Mean £54 £33 £45 £27 £27 £61 Base1 584 1,380 907 69 1,116 39 1. except refused and don’t know A similar pattern was found in the average spend per visit, with 36% of car drivers/passengers spending an average of £50 or more per visit. With respect to the overall average spend per visit, car drivers/passengers spent £46, train/Tube passengers £41, bus customers £32, those who walk £25 and those who cycle £22. Table 25: Average spend by mode per visit
Car %
Bus %
Train/Tube%
Bicycle %
Walked %
Taxi/ minicab/
other %
Nothing 2 2 4 6 1 * Under £5 5 8 13 16 8 8 £5 - £19.99 20 31 31 41 44 18 £20 - £49.99 33 41 21 29 34 46 £50 - £99.99 28 12 13 9 9 15 £100+ 8 4 11 1 2 5 Mean £46 £32 £41 £22 £25 £46 Base1 560 1353 845 70 1084 36 * = less than 0.5% 1. except refused and don’t know If the frequency of visiting the area is taken into account, however, there is a more even distribution of spend by mode. The total average spend per week by mode (see Table 26) shows that those who walk to the area tend to spend most on average per week (£86
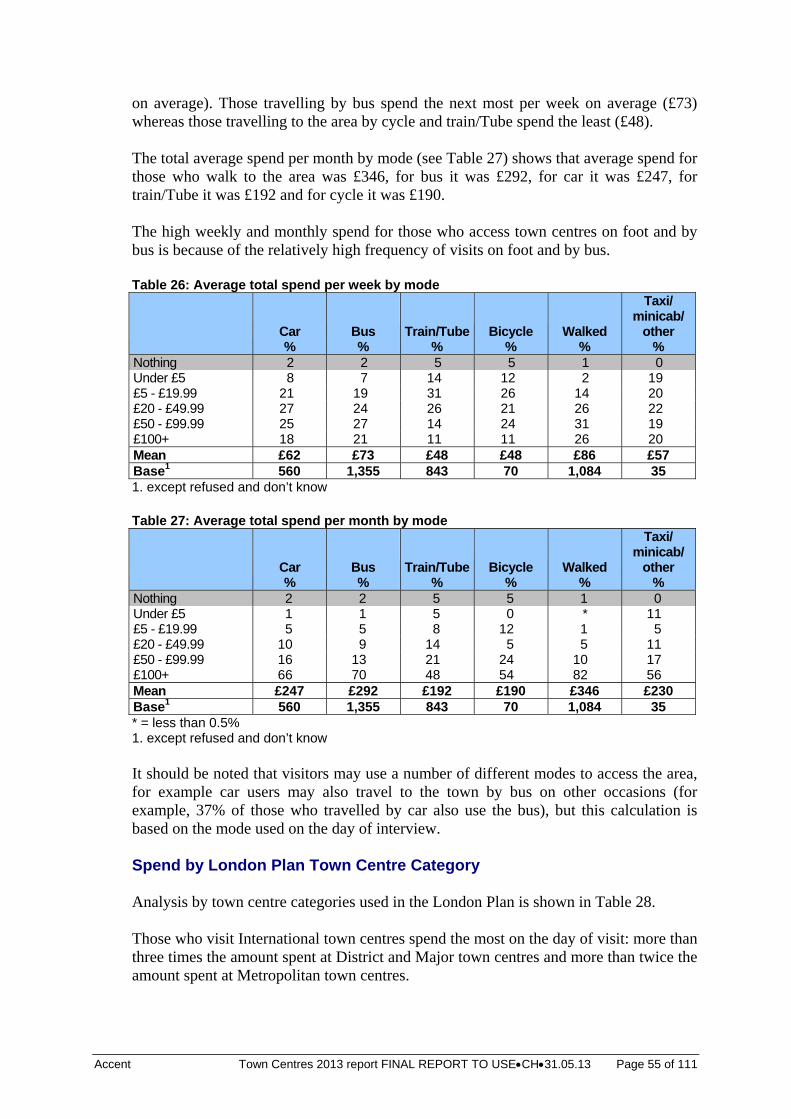
Accent Town Centres 2013 report FINAL REPORT TO USECH31.05.13 Page 55 of 111
on average). Those travelling by bus spend the next most per week on average (£73) whereas those travelling to the area by cycle and train/Tube spend the least (£48). The total average spend per month by mode (see Table 27) shows that average spend for those who walk to the area was £346, for bus it was £292, for car it was £247, for train/Tube it was £192 and for cycle it was £190. The high weekly and monthly spend for those who access town centres on foot and by bus is because of the relatively high frequency of visits on foot and by bus. Table 26: Average total spend per week by mode
Car %
Bus %
Train/Tube%
Bicycle %
Walked %
Taxi/ minicab/
other %
Nothing 2 2 5 5 1 0 Under £5 8 7 14 12 2 19 £5 - £19.99 21 19 31 26 14 20 £20 - £49.99 27 24 26 21 26 22 £50 - £99.99 25 27 14 24 31 19 £100+ 18 21 11 11 26 20 Mean £62 £73 £48 £48 £86 £57 Base1 560 1,355 843 70 1,084 35 1. except refused and don’t know Table 27: Average total spend per month by mode
Car %
Bus %
Train/Tube%
Bicycle %
Walked %
Taxi/ minicab/
other %
Nothing 2 2 5 5 1 0 Under £5 1 1 5 0 * 11 £5 - £19.99 5 5 8 12 1 5 £20 - £49.99 10 9 14 5 5 11 £50 - £99.99 16 13 21 24 10 17 £100+ 66 70 48 54 82 56 Mean £247 £292 £192 £190 £346 £230 Base1 560 1,355 843 70 1,084 35 * = less than 0.5% 1. except refused and don’t know It should be noted that visitors may use a number of different modes to access the area, for example car users may also travel to the town by bus on other occasions (for example, 37% of those who travelled by car also use the bus), but this calculation is based on the mode used on the day of interview. Spend by London Plan Town Centre Category Analysis by town centre categories used in the London Plan is shown in Table 28. Those who visit International town centres spend the most on the day of visit: more than three times the amount spent at District and Major town centres and more than twice the amount spent at Metropolitan town centres.
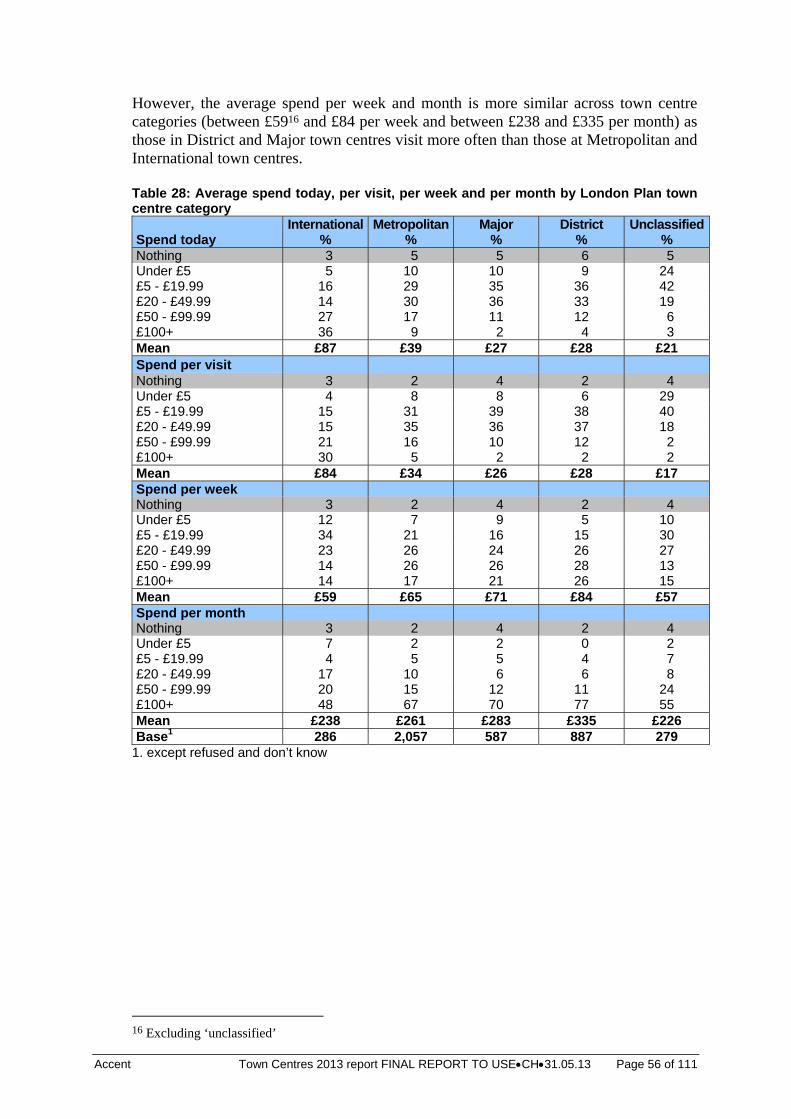
Accent Town Centres 2013 report FINAL REPORT TO USECH31.05.13 Page 56 of 111
However, the average spend per week and month is more similar across town centre categories (between £5916 and £84 per week and between £238 and £335 per month) as those in District and Major town centres visit more often than those at Metropolitan and International town centres. Table 28: Average spend today, per visit, per week and per month by London Plan town centre category
Spend today International
% Metropolitan
% Major
% District
% Unclassified
% Nothing 3 5 5 6 5 Under £5 5 10 10 9 24 £5 - £19.99 16 29 35 36 42 £20 - £49.99 14 30 36 33 19 £50 - £99.99 27 17 11 12 6 £100+ 36 9 2 4 3 Mean £87 £39 £27 £28 £21 Spend per visit Nothing 3 2 4 2 4 Under £5 4 8 8 6 29 £5 - £19.99 15 31 39 38 40 £20 - £49.99 15 35 36 37 18 £50 - £99.99 21 16 10 12 2 £100+ 30 5 2 2 2 Mean £84 £34 £26 £28 £17 Spend per week Nothing 3 2 4 2 4 Under £5 12 7 9 5 10 £5 - £19.99 34 21 16 15 30 £20 - £49.99 23 26 24 26 27 £50 - £99.99 14 26 26 28 13 £100+ 14 17 21 26 15 Mean £59 £65 £71 £84 £57 Spend per month Nothing 3 2 4 2 4 Under £5 7 2 2 0 2 £5 - £19.99 4 5 5 4 7 £20 - £49.99 17 10 6 6 8 £50 - £99.99 20 15 12 11 24 £100+ 48 67 70 77 55 Mean £238 £261 £283 £335 £226 Base1 286 2,057 587 887 279
1. except refused and don’t know
16 Excluding ‘unclassified’
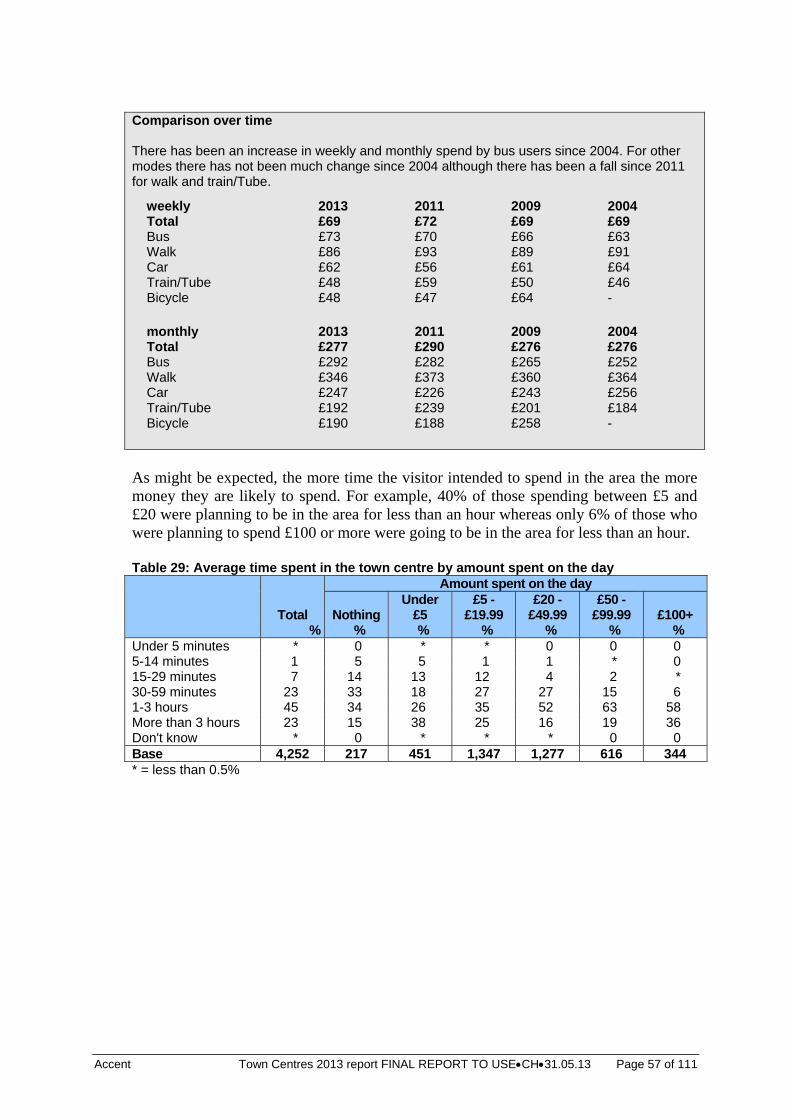
Accent Town Centres 2013 report FINAL REPORT TO USECH31.05.13 Page 57 of 111
Comparison over time There has been an increase in weekly and monthly spend by bus users since 2004. For other modes there has not been much change since 2004 although there has been a fall since 2011 for walk and train/Tube.
weekly 2013 2011 2009 2004 Total £69 £72 £69 £69 Bus £73 £70 £66 £63 Walk £86 £93 £89 £91 Car £62 £56 £61 £64 Train/Tube £48 £59 £50 £46 Bicycle £48 £47 £64 -
monthly 2013 2011 2009 2004 Total £277 £290 £276 £276 Bus £292 £282 £265 £252 Walk £346 £373 £360 £364 Car £247 £226 £243 £256 Train/Tube £192 £239 £201 £184 Bicycle £190 £188 £258 -
As might be expected, the more time the visitor intended to spend in the area the more money they are likely to spend. For example, 40% of those spending between £5 and £20 were planning to be in the area for less than an hour whereas only 6% of those who were planning to spend £100 or more were going to be in the area for less than an hour. Table 29: Average time spent in the town centre by amount spent on the day
Total
%
Amount spent on the day
Nothing %
Under £5 %
£5 - £19.99
%
£20 - £49.99
%
£50 - £99.99
% £100+
% Under 5 minutes * 0 * * 0 0 0 5-14 minutes 1 5 5 1 1 * 0 15-29 minutes 7 14 13 12 4 2 * 30-59 minutes 23 33 18 27 27 15 6 1-3 hours 45 34 26 35 52 63 58 More than 3 hours 23 15 38 25 16 19 36 Don't know * 0 * * * 0 0 Base 4,252 217 451 1,347 1,277 616 344 * = less than 0.5%
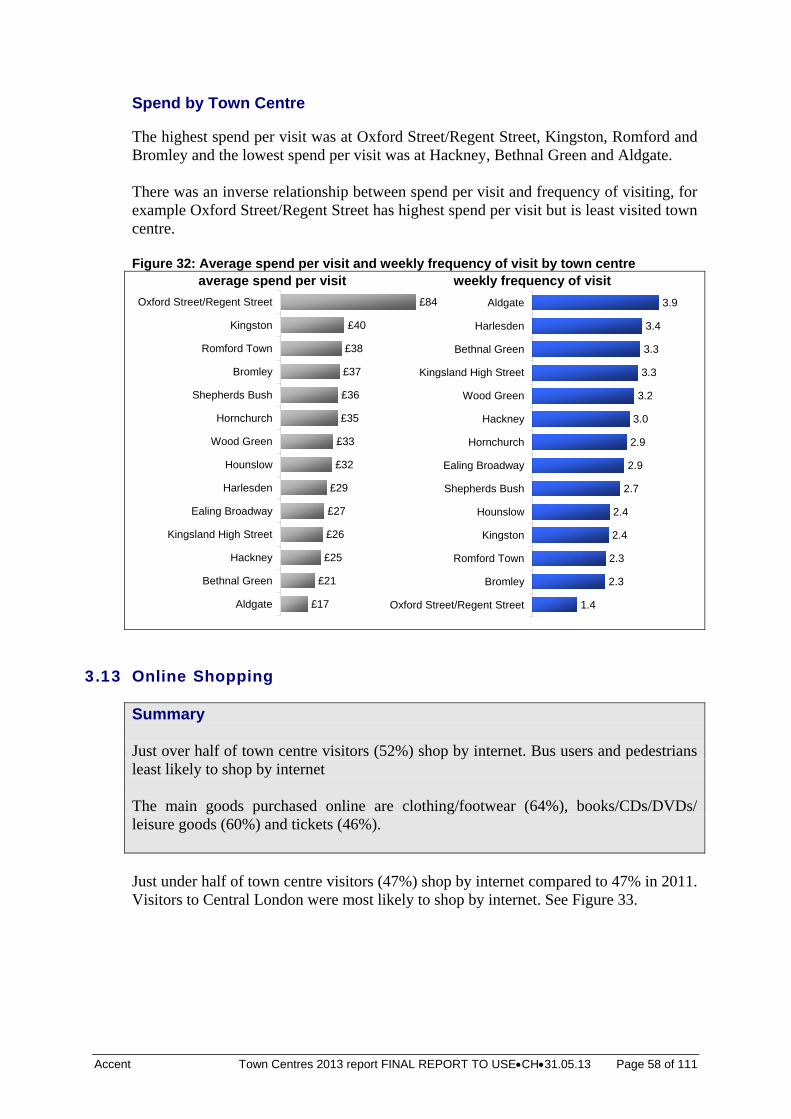
Accent Town Centres 2013 report FINAL REPORT TO USECH31.05.13 Page 58 of 111
Spend by Town Centre The highest spend per visit was at Oxford Street/Regent Street, Kingston, Romford and Bromley and the lowest spend per visit was at Hackney, Bethnal Green and Aldgate. There was an inverse relationship between spend per visit and frequency of visiting, for example Oxford Street/Regent Street has highest spend per visit but is least visited town centre. Figure 32: Average spend per visit and weekly frequency of visit by town centre average spend per visit weekly frequency of visit
£17
£21
£25
£26
£27
£29
£32
£33
£35
£36
£37
£38
£40
£84
Aldgate
Bethnal Green
Hackney
Kingsland High Street
Ealing Broadway
Harlesden
Hounslow
Wood Green
Hornchurch
Shepherds Bush
Bromley
Romford Town
Kingston
Oxford Street/Regent Street
3.13 Online Shopping
Summary Just over half of town centre visitors (52%) shop by internet. Bus users and pedestrians least likely to shop by internet The main goods purchased online are clothing/footwear (64%), books/CDs/DVDs/ leisure goods (60%) and tickets (46%). Just under half of town centre visitors (47%) shop by internet compared to 47% in 2011. Visitors to Central London were most likely to shop by internet. See Figure 33.
1.4
2.3
2.3
2.4
2.4
2.7
2.9
2.9
3.0
3.2
3.3
3.3
3.4
3.9
Oxford Street/Regent Street
Bromley
Romford Town
Kingston
Hounslow
Shepherds Bush
Ealing Broadway
Hornchurch
Hackney
Wood Green
Kingsland High Street
Bethnal Green
Harlesden
Aldgate
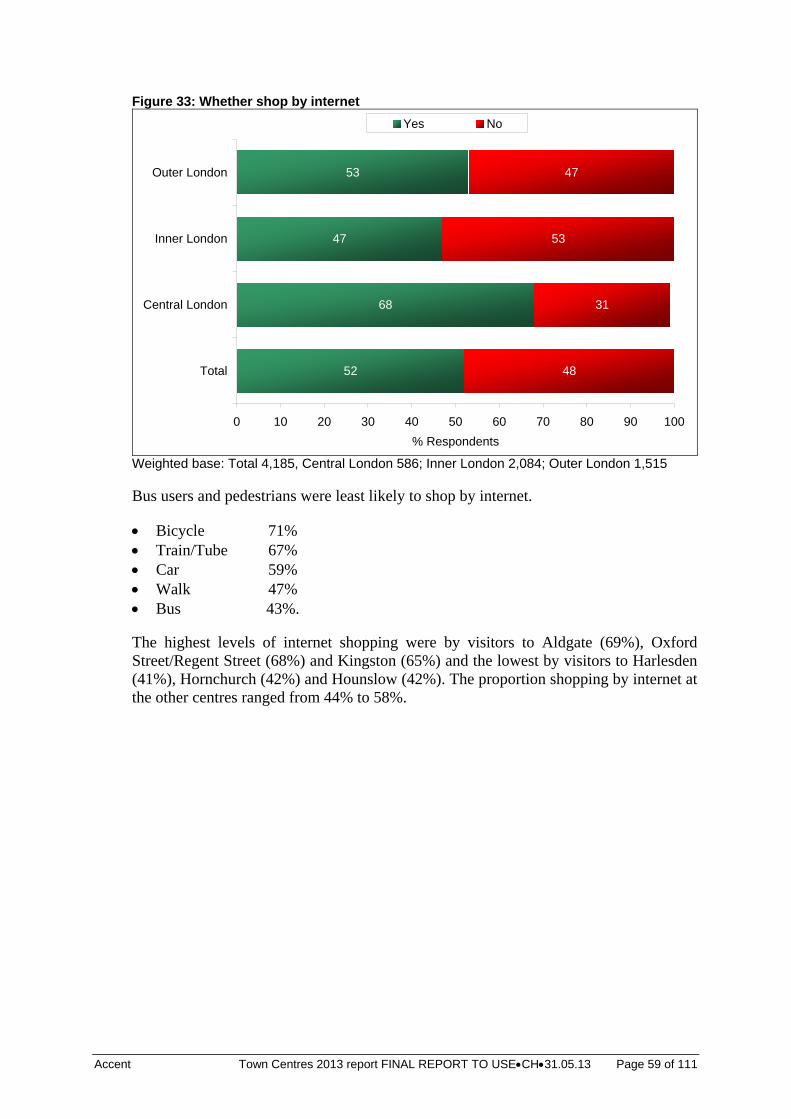
Accent Town Centres 2013 report FINAL REPORT TO USECH31.05.13 Page 59 of 111
Figure 33: Whether shop by internet
52
68
47
53
48
31
53
47
0 10 20 30 40 50 60 70 80 90 100
Total
Central London
Inner London
Outer London
% Respondents
Yes No
Weighted base: Total 4,185, Central London 586; Inner London 2,084; Outer London 1,515 Bus users and pedestrians were least likely to shop by internet.
Bicycle 71% Train/Tube 67% Car 59% Walk 47% Bus 43%. The highest levels of internet shopping were by visitors to Aldgate (69%), Oxford Street/Regent Street (68%) and Kingston (65%) and the lowest by visitors to Harlesden (41%), Hornchurch (42%) and Hounslow (42%). The proportion shopping by internet at the other centres ranged from 44% to 58%.
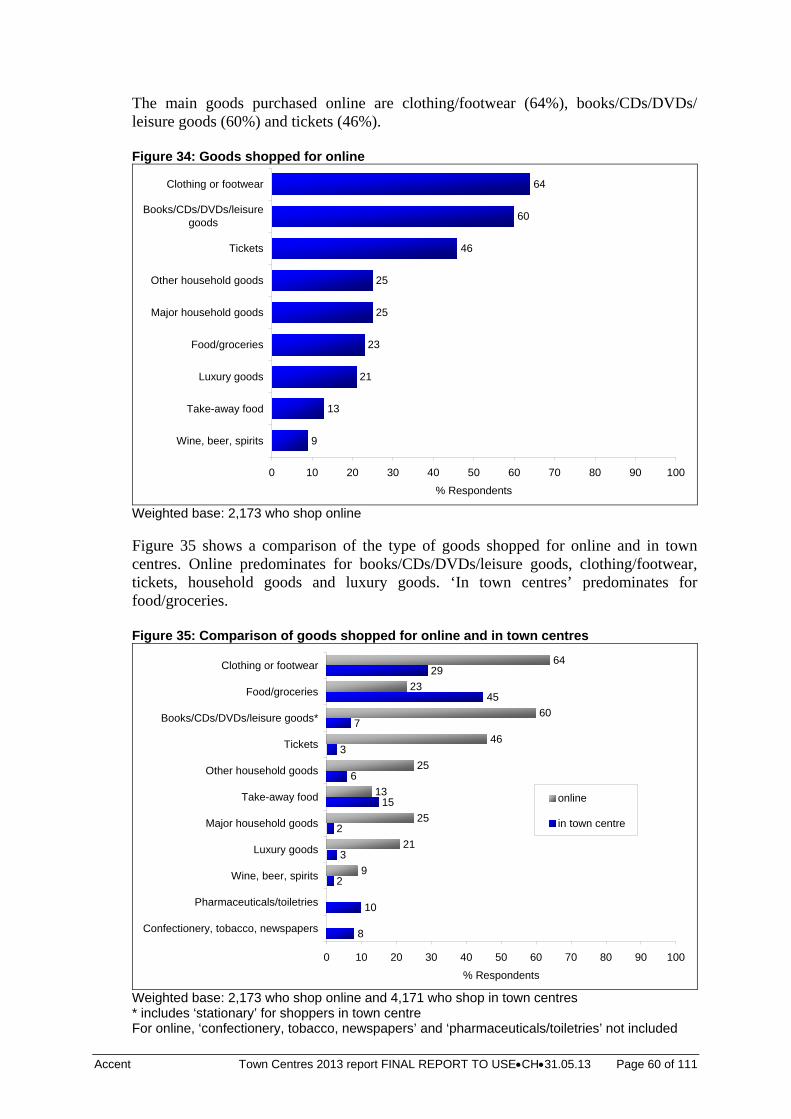
Accent Town Centres 2013 report FINAL REPORT TO USECH31.05.13 Page 60 of 111
The main goods purchased online are clothing/footwear (64%), books/CDs/DVDs/ leisure goods (60%) and tickets (46%). Figure 34: Goods shopped for online
9
13
21
23
25
25
46
60
64
0 10 20 30 40 50 60 70 80 90 100
Wine, beer, spirits
Take-away food
Luxury goods
Food/groceries
Major household goods
Other household goods
Tickets
Books/CDs/DVDs/leisuregoods
Clothing or footwear
% Respondents
Weighted base: 2,173 who shop online Figure 35 shows a comparison of the type of goods shopped for online and in town centres. Online predominates for books/CDs/DVDs/leisure goods, clothing/footwear, tickets, household goods and luxury goods. ‘In town centres’ predominates for food/groceries. Figure 35: Comparison of goods shopped for online and in town centres
8
10
2
3
2
15
6
3
7
45
29
9
21
25
13
25
46
60
23
64
0 10 20 30 40 50 60 70 80 90 100
Confectionery, tobacco, newspapers
Pharmaceuticals/toiletries
Wine, beer, spirits
Luxury goods
Major household goods
Take-away food
Other household goods
Tickets
Books/CDs/DVDs/leisure goods*
Food/groceries
Clothing or footwear
% Respondents
online
in town centre
Weighted base: 2,173 who shop online and 4,171 who shop in town centres * includes ‘stationary’ for shoppers in town centre For online, ‘confectionery, tobacco, newspapers’ and ‘pharmaceuticals/toiletries’ not included
Accent Town Centres 2013 report FINAL REPORT TO USECH31.05.13 Page 61 of 111
3.14 Respondent Characteristics
Summary 58% of town centre visitors were female. There was an even spread of ages, with similar proportions in the four age groups under 55 years. 65% were from a White background, 17% from a Black and 12% from an Asian background. 62% were employed either full time (45%), or part time (17%). 14% were retired and 9% were students. The town centre sample tends to have lower household incomes than the background London population. 44% of town centre visitors had access to a car that they could have used to travel to the town centre. 91% of town centre visitors live in London: 38% in Inner London Boroughs and 53% in Outer London Boroughs. 33% of visitors to Central London are from outside London including 14% from outside the UK. 7% had a long-term physical or mental disability which limits daily activities or work they could do. Gender Overall, the majority of respondents were female (58%). There were marginally fewer men in the Outer London town centres than in either Central London or Inner London centres – see Figure 36.
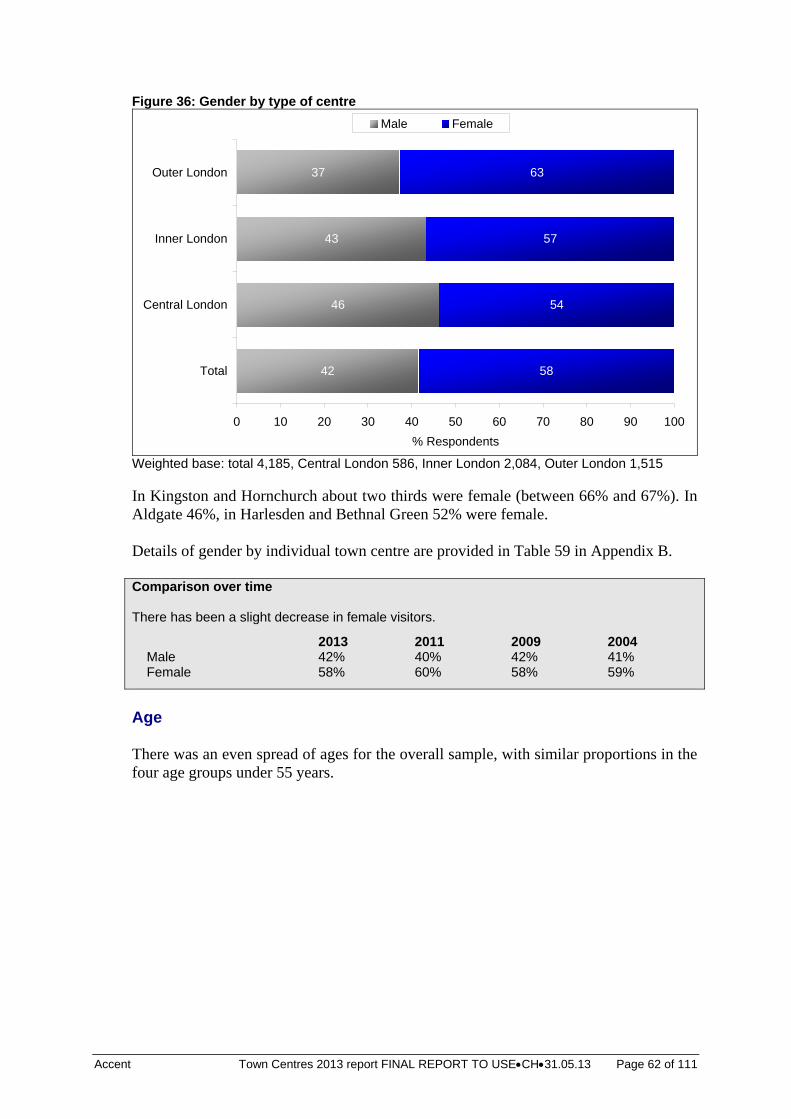
Accent Town Centres 2013 report FINAL REPORT TO USECH31.05.13 Page 62 of 111
Figure 36: Gender by type of centre
42
46
43
37
58
54
57
63
0 10 20 30 40 50 60 70 80 90 100
Total
Central London
Inner London
Outer London
% Respondents
Male Female
Weighted base: total 4,185, Central London 586, Inner London 2,084, Outer London 1,515 In Kingston and Hornchurch about two thirds were female (between 66% and 67%). In Aldgate 46%, in Harlesden and Bethnal Green 52% were female. Details of gender by individual town centre are provided in Table 59 in Appendix B. Comparison over time There has been a slight decrease in female visitors.
2013 2011 2009 2004 Male 42% 40% 42% 41% Female 58% 60% 58% 59%
Age There was an even spread of ages for the overall sample, with similar proportions in the four age groups under 55 years.
Accent Town Centres 2013 report FINAL REPORT TO USECH31.05.13 Page 63 of 111
Figure 37: Age
17
22
19
16
8
6
8
3
0 10 20 30 40 50 60 70 80 90 100
16-24
25-34
35-44
45-54
55-59
60-64
65-74
75 or over
% Respondents
Weighted base: Total sample 4,185 The Central London locations had a slightly younger age profile than the Inner or Outer London town centres, with 18% aged over 55 years old compared to 22% in Inner London town centres and 29% in Outer London town centres. See Figure 38. Figure 38: Age by type of centre
15
16
20
27
23
20
20
22
15
19
16
16
10
8
7
4
5
7
3
7
10
1
2
5
0% 10% 20% 30% 40% 50% 60% 70% 80% 90% 100%
Central London
Inner London
Outer London
16-24 25-34 35-44 45-54 55-59 60-64 65-74 75 or over
Weighted base: Central London 586, Inner London 2,084, Outer London 1,515 In Romford, Hornchurch and Bromley the profile was older than in the other locations with over a fifth (23%-27%) aged over 60. The profile in Wood Green, Aldgate and Oxford Street/Regent Street is younger than the average with 7%-8% aged over 60. Details of age by individual town centre are provided in Table 60 in Appendix B.
Accent Town Centres 2013 report FINAL REPORT TO USECH31.05.13 Page 64 of 111
Comparison over time There is a very similar age profile to 2011.
2013 2011 2009 2004 16-24 17% 17% 23% 18% 25-34 22% 22% 22% 22% 35-44 19% 19% 20% 22% 45-54 16% 17% 12% 55-64 14% 13% 11% 65-74 8% 8% 7% 75+ 3% 4% 3% *aged 45 or older. Different age ranges used
Ethnicity Just under two thirds of the sample (65%) is from a White background, 17% from a Black and 12% from an Asian background as shown in Figure 39. Figure 39: Ethnicity
1
3
17
12
65
0 10 20 30 40 50 60 70 80 90 100
Chinese or other ethnicbackground
Mixed
Black or Black British
Asian or Asian British
White
% Respondents
Weighted base: Total sample 4,185
45%*
Accent Town Centres 2013 report FINAL REPORT TO USECH31.05.13 Page 65 of 111
Analysis by type of town centres shows that the Central and Outer London town centres have a higher proportion of White visitors than Inner London town centres– 74% and 77% respectively compared to 54% in Inner London. There are more black visitors in Inner London town centres than elsewhere: 26% compared to between 7% and 10%. Figure 40: Ethnicity by type of centre
74
54
77
10
14
11
10
26
7
3
4
3
2
1
1
0% 10% 20% 30% 40% 50% 60% 70% 80% 90% 100%
Central London
Inner London
Outer London
White Asian or Asian British
Black or Black British Mixed
Chinese or other ethnic background
Weighted base: Central London 586, Inner London 2,084, Outer London 1,515 In Kingston 88% were from a White background. At Bromley, Kingston and Romford the proportion from a White background was also much higher than average (between 83% and 86%). Less than half in Harlesden (29%) were from a White background. In Harlesden 47% of respondents were from a Black ethnic group as were 37% from Hackney, 29% from Kingsland High Street and 28% from Wood Green. In Hounslow 32% were from an Asian background. Details of ethnicity by individual town centre are provided in Table 61 in Appendix B. Comparison over time There are fewer White visitors and more Asian visitors in 2013 than in 2011.
2013 2011 2009 2004 White 65% 71% 69% 70% Black or Black British 17% 16% 16% 12% Asian or Asian British 12% 6% 9% 12% Mixed 3% 5% 4% 1% Other 1% 1% 1% 2%
Employment status The majority of those who took part in the survey were employed either full time (45%), or part time (17%). Fourteen per cent were retired and 9% were students.
Accent Town Centres 2013 report FINAL REPORT TO USECH31.05.13 Page 66 of 111
Figure 41: Employment Status
1
4
14
4
5
9
17
45
*
0 10 20 30 40 50 60 70 80 90 100
Other
Looking after family and home
Retired
Not working and not looking for work
Not working, but looking for work
A part time student
A full time student
Working part time (less than 30 hours a week)
Working full time (30+ hours a week)
% Respondents
Weighted base: Total sample 4,185 * = less than 0.5% Those in Central London town centres were much more likely to be employed full time than those in suburban town centres – 64% compared to 43% or 41%. Those in Central London were also less likely to be retired than those in suburban town centres. See Figure 42. Figure 42: Employment Status by type of centre
64
43
41
14
19
15
9
8
11
3
6
4
2
5
3
5
13
19
1
4
5 1
*
*
0% 10% 20% 30% 40% 50% 60% 70% 80% 90% 100%
Central London
Inner London
Outer London
Working full time (30+ hours a week) Working part time (less than 30 hours a week)A full time student Not working, but looking for workNot working and not looking for work RetiredLooking after family and home Other
Weighted base: Central London 586, Inner London 2,084, Outer London 1,515 * = less than 0.5%
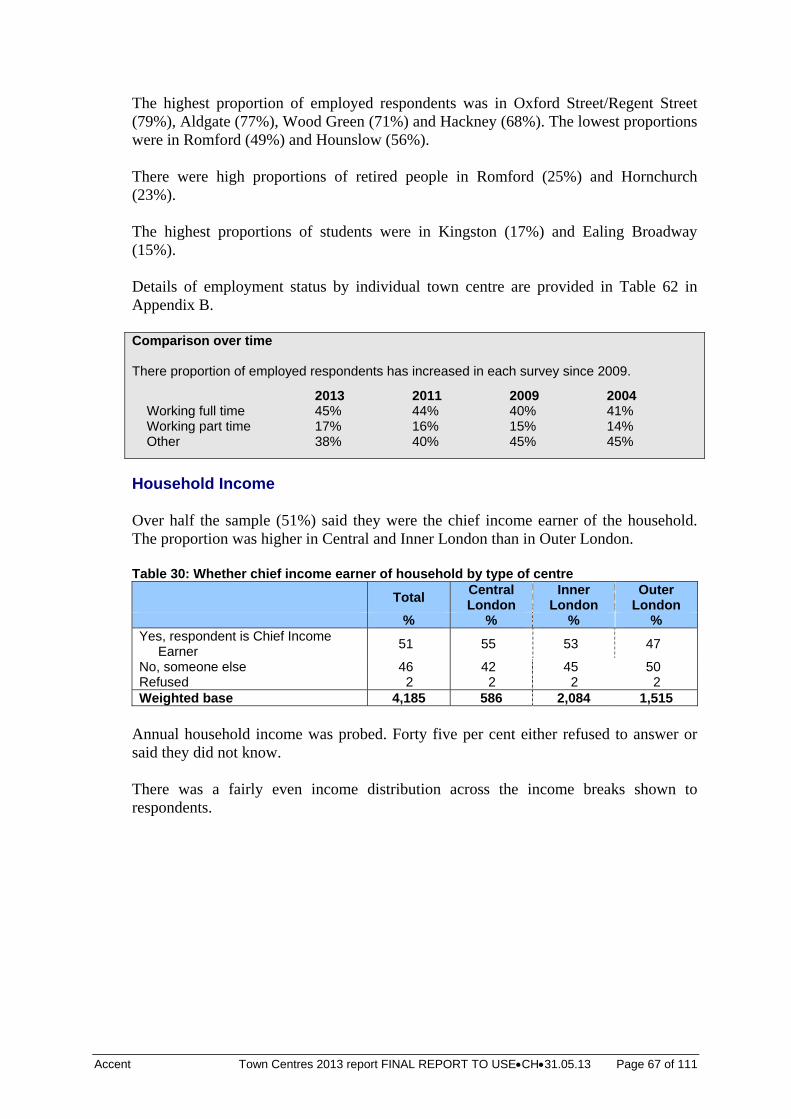
Accent Town Centres 2013 report FINAL REPORT TO USECH31.05.13 Page 67 of 111
The highest proportion of employed respondents was in Oxford Street/Regent Street (79%), Aldgate (77%), Wood Green (71%) and Hackney (68%). The lowest proportions were in Romford (49%) and Hounslow (56%). There were high proportions of retired people in Romford (25%) and Hornchurch (23%). The highest proportions of students were in Kingston (17%) and Ealing Broadway (15%). Details of employment status by individual town centre are provided in Table 62 in Appendix B. Comparison over time There proportion of employed respondents has increased in each survey since 2009.
2013 2011 2009 2004 Working full time 45% 44% 40% 41% Working part time 17% 16% 15% 14% Other 38% 40% 45% 45%
Household Income Over half the sample (51%) said they were the chief income earner of the household. The proportion was higher in Central and Inner London than in Outer London. Table 30: Whether chief income earner of household by type of centre
Total Central London
Inner London
Outer London
% % % % Yes, respondent is Chief Income
Earner 51 55 53 47
No, someone else 46 42 45 50 Refused 2 2 2 2 Weighted base 4,185 586 2,084 1,515
Annual household income was probed. Forty five per cent either refused to answer or said they did not know. There was a fairly even income distribution across the income breaks shown to respondents.
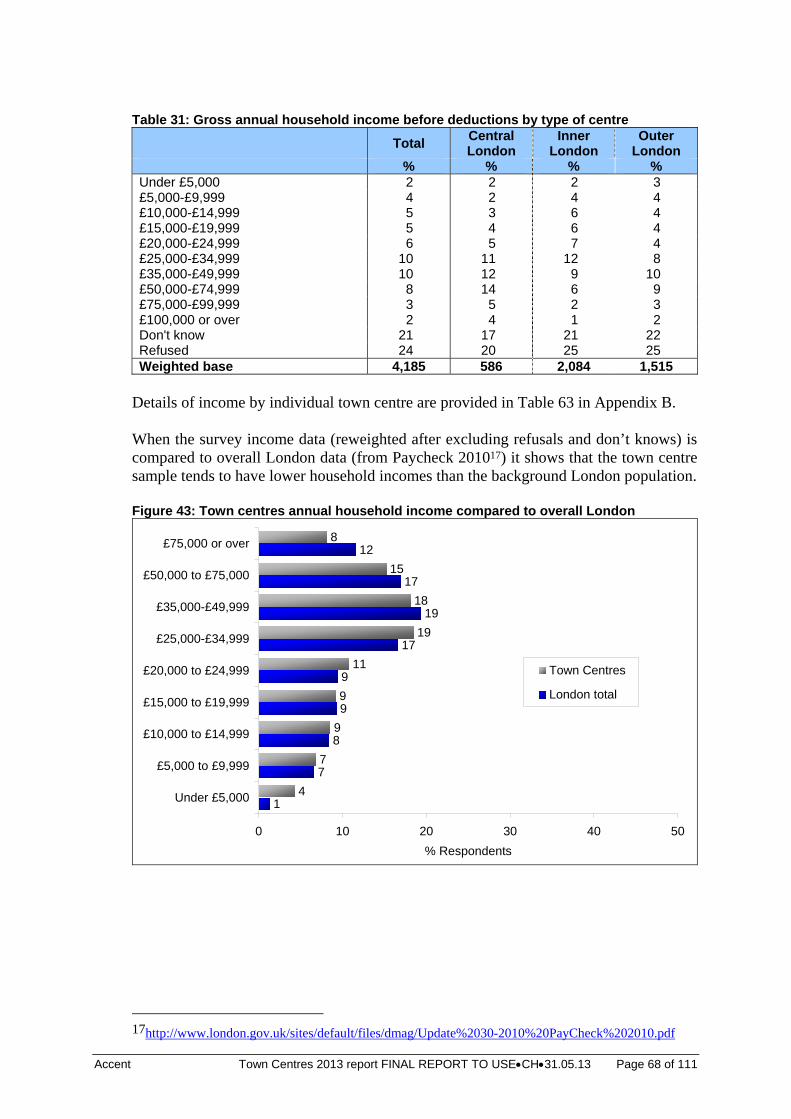
Accent Town Centres 2013 report FINAL REPORT TO USECH31.05.13 Page 68 of 111
Table 31: Gross annual household income before deductions by type of centre
Total Central London
Inner London
Outer London
% % % % Under £5,000 2 2 2 3 £5,000-£9,999 4 2 4 4 £10,000-£14,999 5 3 6 4 £15,000-£19,999 5 4 6 4 £20,000-£24,999 6 5 7 4 £25,000-£34,999 10 11 12 8 £35,000-£49,999 10 12 9 10 £50,000-£74,999 8 14 6 9 £75,000-£99,999 3 5 2 3 £100,000 or over 2 4 1 2 Don't know 21 17 21 22 Refused 24 20 25 25 Weighted base 4,185 586 2,084 1,515
Details of income by individual town centre are provided in Table 63 in Appendix B. When the survey income data (reweighted after excluding refusals and don’t knows) is compared to overall London data (from Paycheck 201017) it shows that the town centre sample tends to have lower household incomes than the background London population. Figure 43: Town centres annual household income compared to overall London
1
7
8
9
9
17
19
17
12
4
7
9
9
11
19
18
15
8
0 10 20 30 40 50
Under £5,000
£5,000 to £9,999
£10,000 to £14,999
£15,000 to £19,999
£20,000 to £24,999
£25,000-£34,999
£35,000-£49,999
£50,000 to £75,000
£75,000 or over
% Respondents
Town Centres
London total
17http://www.london.gov.uk/sites/default/files/dmag/Update%2030-2010%20PayCheck%202010.pdf
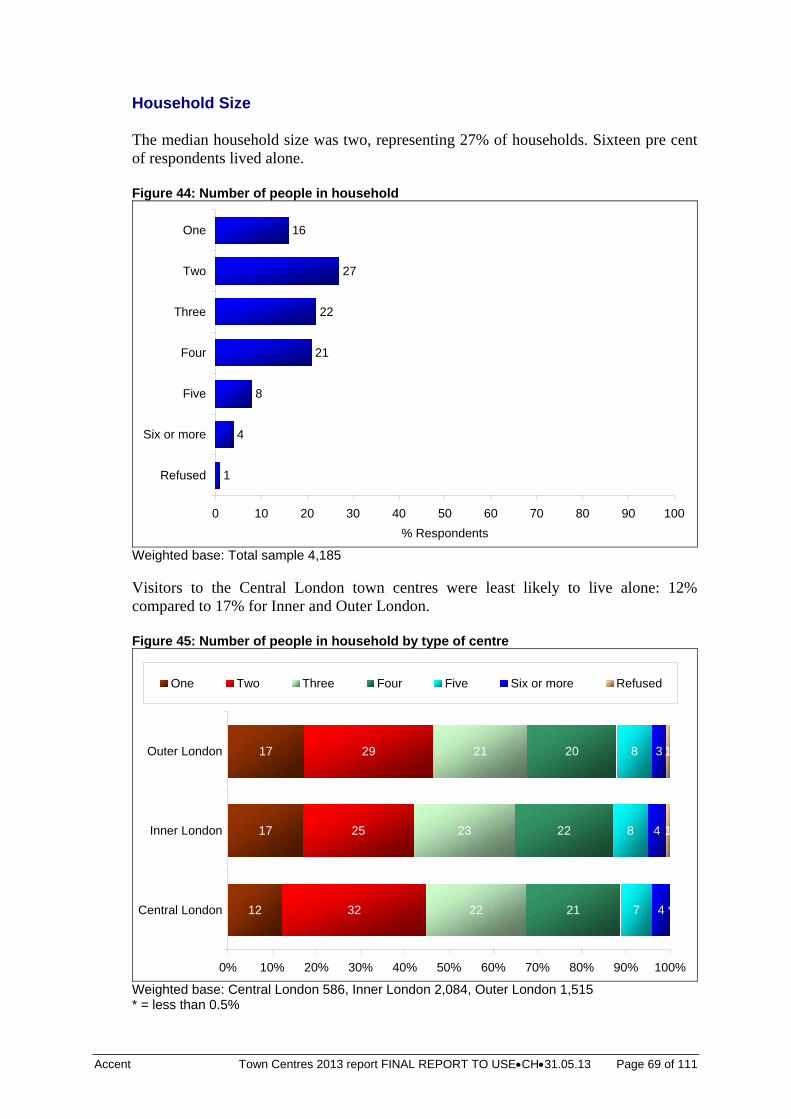
Accent Town Centres 2013 report FINAL REPORT TO USECH31.05.13 Page 69 of 111
Household Size The median household size was two, representing 27% of households. Sixteen pre cent of respondents lived alone. Figure 44: Number of people in household
1
4
8
21
22
27
16
0 10 20 30 40 50 60 70 80 90 100
Refused
Six or more
Five
Four
Three
Two
One
% Respondents
Weighted base: Total sample 4,185 Visitors to the Central London town centres were least likely to live alone: 12% compared to 17% for Inner and Outer London. Figure 45: Number of people in household by type of centre
12
17
17
32
25
29
22
23
21
21
22
20
7
8
8
4
4
3
1
1
*
0% 10% 20% 30% 40% 50% 60% 70% 80% 90% 100%
Central London
Inner London
Outer London
One Two Three Four Five Six or more Refused
Weighted base: Central London 586, Inner London 2,084, Outer London 1,515 * = less than 0.5%
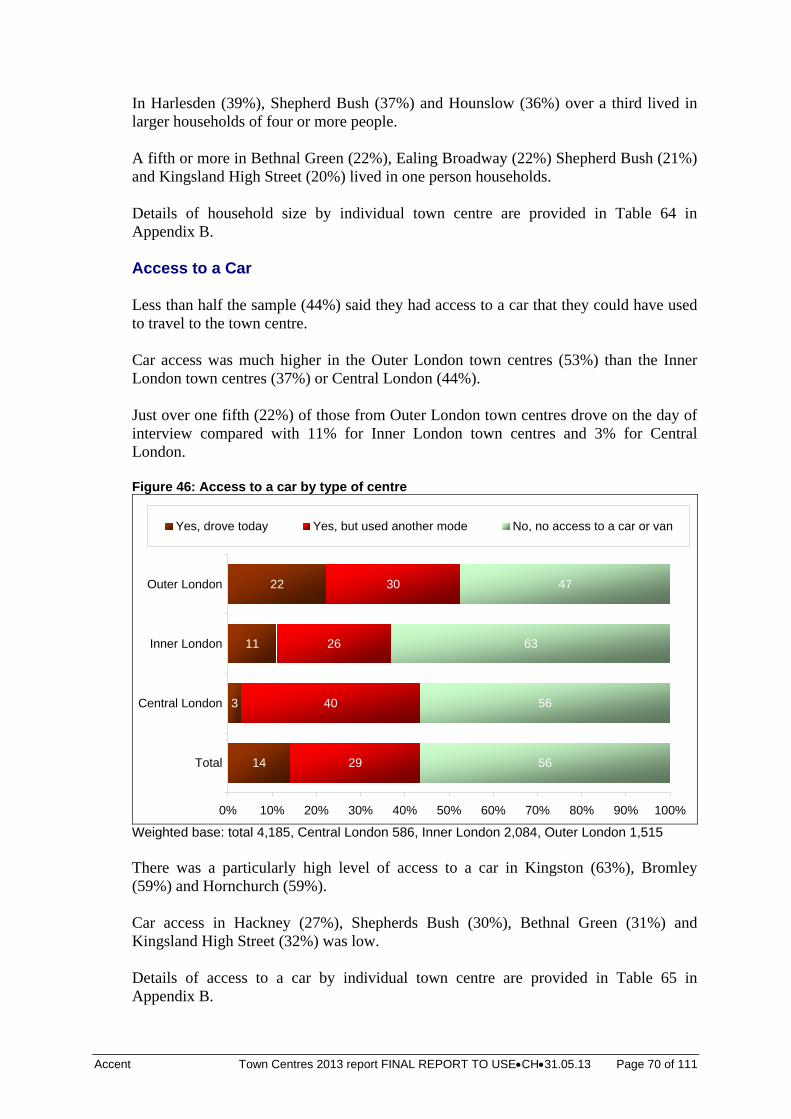
Accent Town Centres 2013 report FINAL REPORT TO USECH31.05.13 Page 70 of 111
In Harlesden (39%), Shepherd Bush (37%) and Hounslow (36%) over a third lived in larger households of four or more people. A fifth or more in Bethnal Green (22%), Ealing Broadway (22%) Shepherd Bush (21%) and Kingsland High Street (20%) lived in one person households. Details of household size by individual town centre are provided in Table 64 in Appendix B. Access to a Car Less than half the sample (44%) said they had access to a car that they could have used to travel to the town centre. Car access was much higher in the Outer London town centres (53%) than the Inner London town centres (37%) or Central London (44%). Just over one fifth (22%) of those from Outer London town centres drove on the day of interview compared with 11% for Inner London town centres and 3% for Central London. Figure 46: Access to a car by type of centre
14
3
11
22
29
40
26
30
56
56
63
47
0% 10% 20% 30% 40% 50% 60% 70% 80% 90% 100%
Total
Central London
Inner London
Outer London
Yes, drove today Yes, but used another mode No, no access to a car or van
Weighted base: total 4,185, Central London 586, Inner London 2,084, Outer London 1,515 There was a particularly high level of access to a car in Kingston (63%), Bromley (59%) and Hornchurch (59%). Car access in Hackney (27%), Shepherds Bush (30%), Bethnal Green (31%) and Kingsland High Street (32%) was low. Details of access to a car by individual town centre are provided in Table 65 in Appendix B.
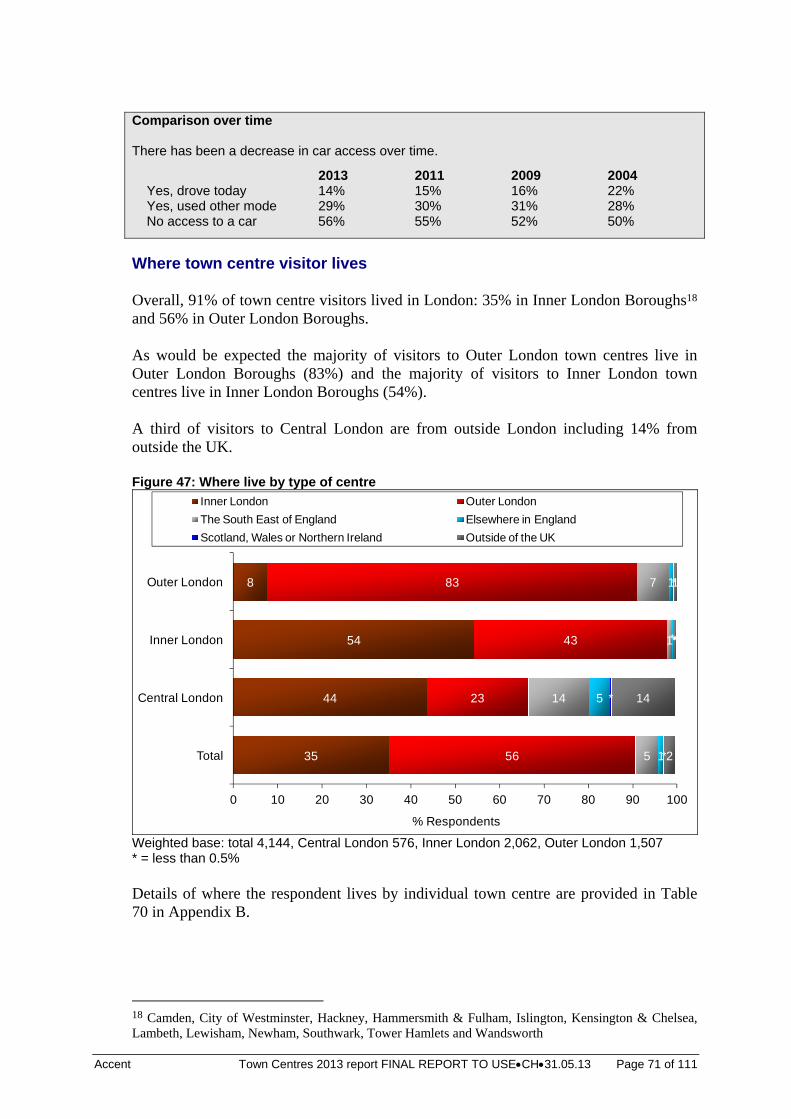
Accent Town Centres 2013 report FINAL REPORT TO USECH31.05.13 Page 71 of 111
Comparison over time There has been a decrease in car access over time.
2013 2011 2009 2004 Yes, drove today 14% 15% 16% 22% Yes, used other mode 29% 30% 31% 28% No access to a car 56% 55% 52% 50%
Where town centre visitor lives Overall, 91% of town centre visitors lived in London: 35% in Inner London Boroughs18 and 56% in Outer London Boroughs. As would be expected the majority of visitors to Outer London town centres live in Outer London Boroughs (83%) and the majority of visitors to Inner London town centres live in Inner London Boroughs (54%). A third of visitors to Central London are from outside London including 14% from outside the UK. Figure 47: Where live by type of centre
35
44
54
8
56
23
43
83
5
14
1
7
1
5
*
1
*
*
*
*
2
14
*
1
0 10 20 30 40 50 60 70 80 90 100
Total
Central London
Inner London
Outer London
% Respondents
Inner London Outer London
The South East of England Elsewhere in England
Scotland, Wales or Northern Ireland Outside of the UK
Weighted base: total 4,144, Central London 576, Inner London 2,062, Outer London 1,507 * = less than 0.5% Details of where the respondent lives by individual town centre are provided in Table 70 in Appendix B.
18 Camden, City of Westminster, Hackney, Hammersmith & Fulham, Islington, Kensington & Chelsea, Lambeth, Lewisham, Newham, Southwark, Tower Hamlets and Wandsworth
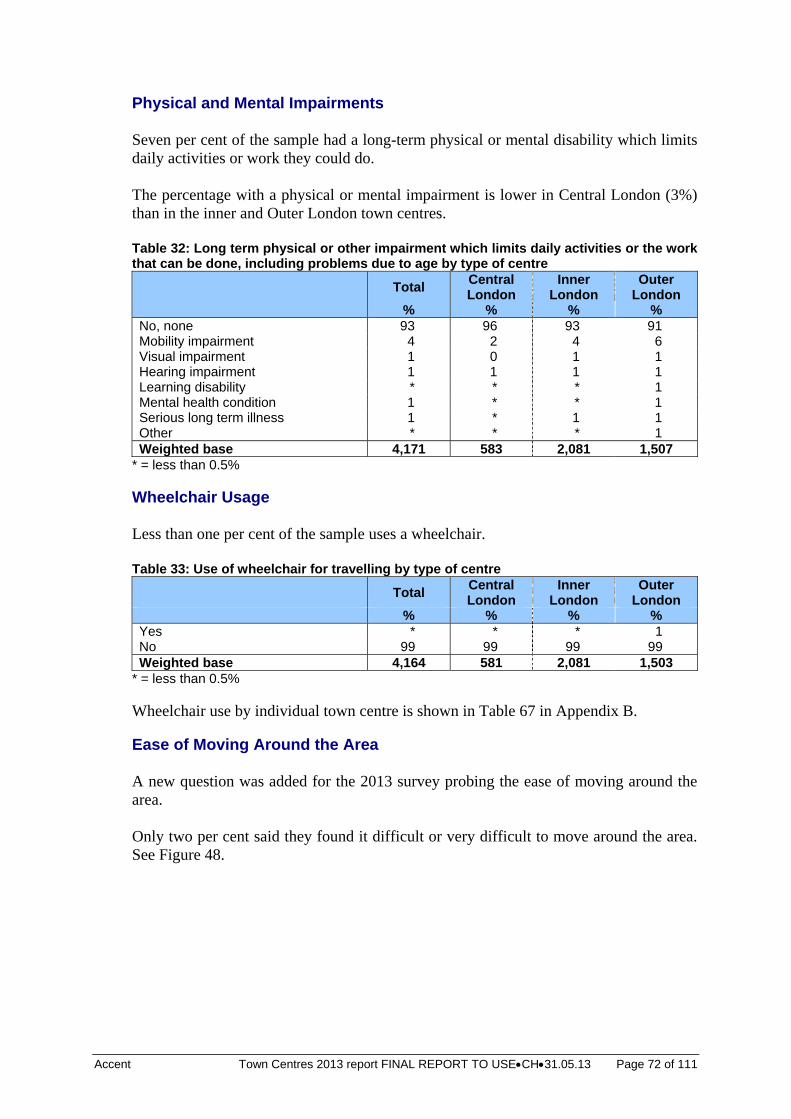
Accent Town Centres 2013 report FINAL REPORT TO USECH31.05.13 Page 72 of 111
Physical and Mental Impairments Seven per cent of the sample had a long-term physical or mental disability which limits daily activities or work they could do. The percentage with a physical or mental impairment is lower in Central London (3%) than in the inner and Outer London town centres. Table 32: Long term physical or other impairment which limits daily activities or the work that can be done, including problems due to age by type of centre
Total Central London
Inner London
Outer London
% % % % No, none 93 96 93 91 Mobility impairment 4 2 4 6 Visual impairment 1 0 1 1 Hearing impairment 1 1 1 1 Learning disability * * * 1 Mental health condition 1 * * 1 Serious long term illness 1 * 1 1 Other * * * 1 Weighted base 4,171 583 2,081 1,507
* = less than 0.5% Wheelchair Usage Less than one per cent of the sample uses a wheelchair. Table 33: Use of wheelchair for travelling by type of centre
Total Central London
Inner London
Outer London
% % % % Yes * * * 1 No 99 99 99 99 Weighted base 4,164 581 2,081 1,503
* = less than 0.5% Wheelchair use by individual town centre is shown in Table 67 in Appendix B. Ease of Moving Around the Area A new question was added for the 2013 survey probing the ease of moving around the area. Only two per cent said they found it difficult or very difficult to move around the area. See Figure 48.
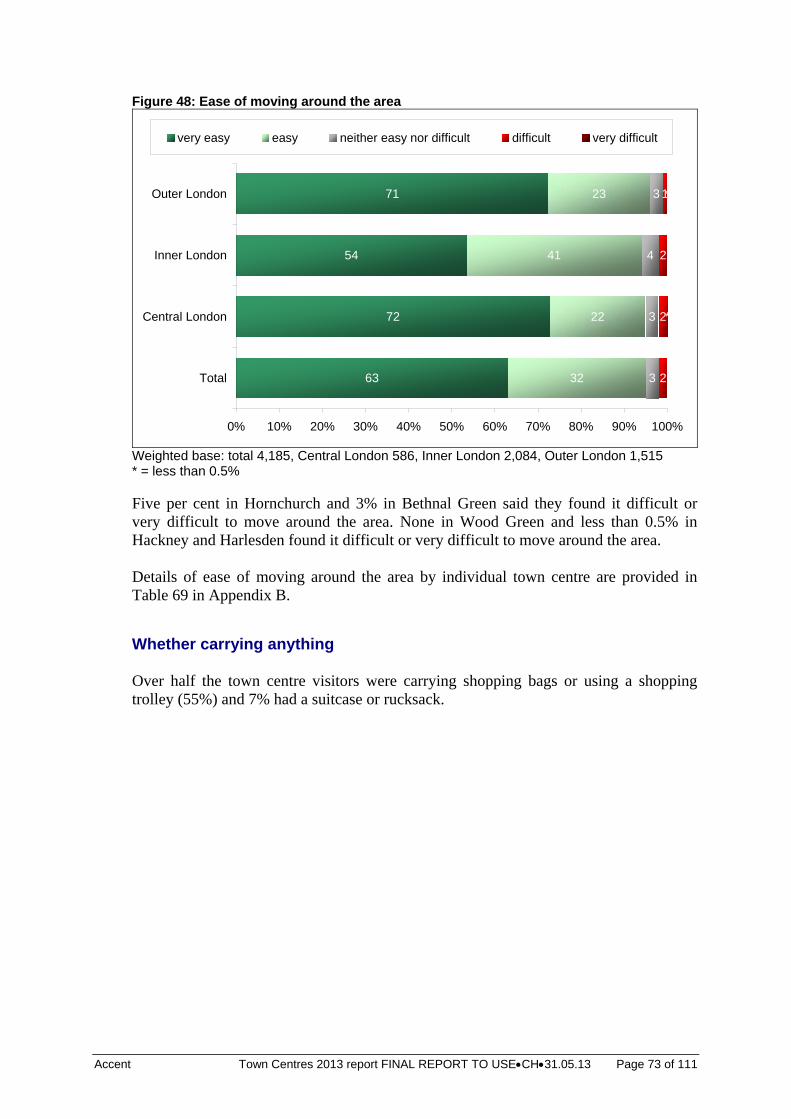
Accent Town Centres 2013 report FINAL REPORT TO USECH31.05.13 Page 73 of 111
Figure 48: Ease of moving around the area
63
72
54
71
32
22
41
23
3
3
4
3
2
2
2
1*
1
*
0% 10% 20% 30% 40% 50% 60% 70% 80% 90% 100%
Total
Central London
Inner London
Outer London
very easy easy neither easy nor difficult difficult very difficult
Weighted base: total 4,185, Central London 586, Inner London 2,084, Outer London 1,515 * = less than 0.5% Five per cent in Hornchurch and 3% in Bethnal Green said they found it difficult or very difficult to move around the area. None in Wood Green and less than 0.5% in Hackney and Harlesden found it difficult or very difficult to move around the area. Details of ease of moving around the area by individual town centre are provided in Table 69 in Appendix B. Whether carrying anything Over half the town centre visitors were carrying shopping bags or using a shopping trolley (55%) and 7% had a suitcase or rucksack.
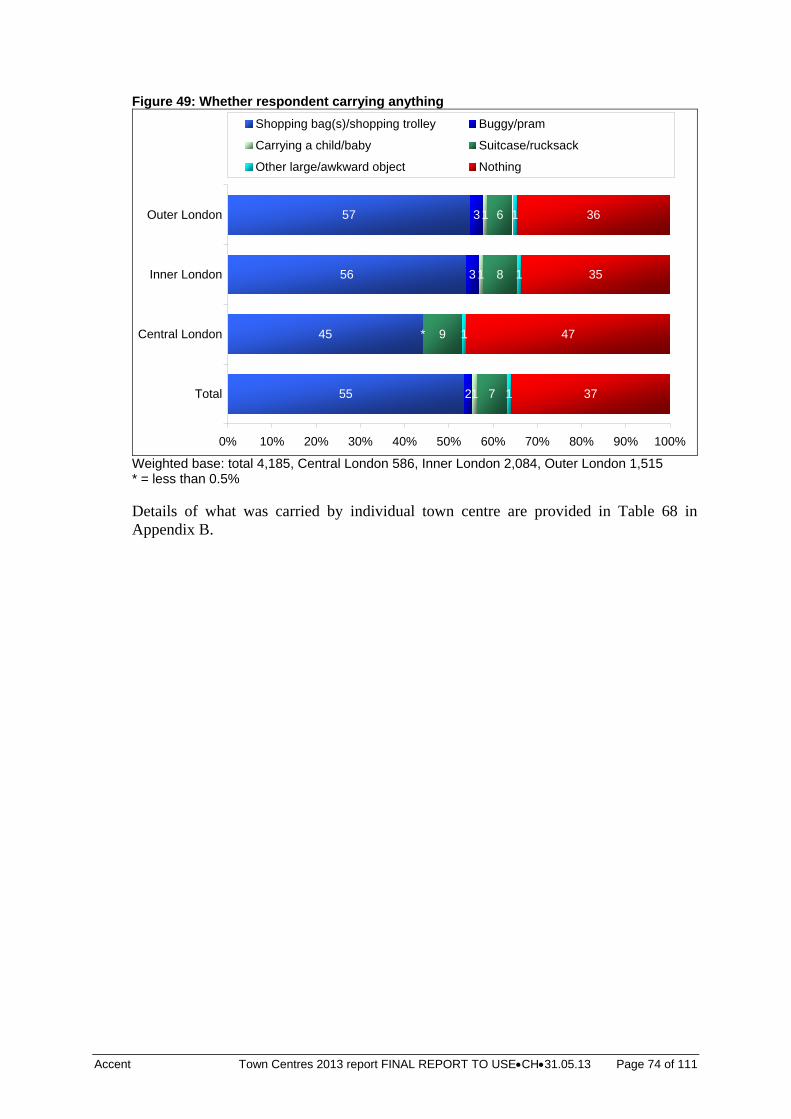
Accent Town Centres 2013 report FINAL REPORT TO USECH31.05.13 Page 74 of 111
Figure 49: Whether respondent carrying anything
55
45
56
57
2
3
3
1
1
1
7
9
8
6
1
1
1
1
37
47
35
36
*
0% 10% 20% 30% 40% 50% 60% 70% 80% 90% 100%
Total
Central London
Inner London
Outer London
Shopping bag(s)/shopping trolley Buggy/pram
Carrying a child/baby Suitcase/rucksack
Other large/awkward object Nothing
Weighted base: total 4,185, Central London 586, Inner London 2,084, Outer London 1,515 * = less than 0.5% Details of what was carried by individual town centre are provided in Table 68 in Appendix B.
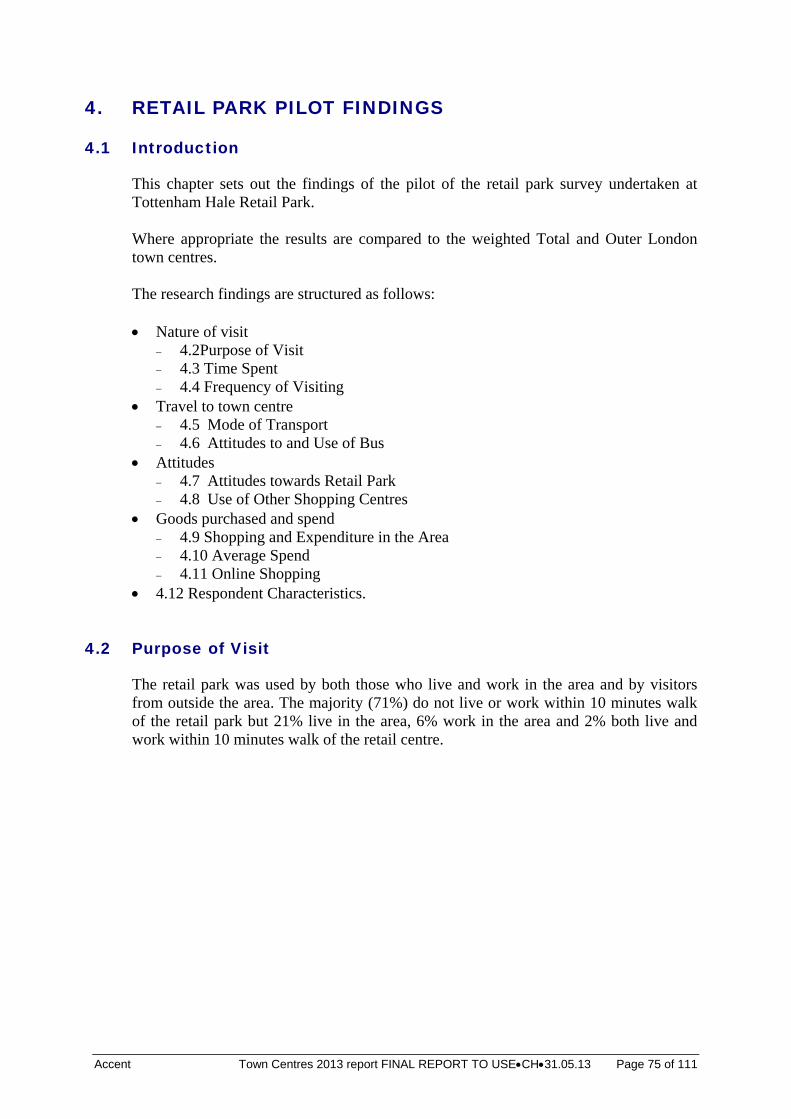
Accent Town Centres 2013 report FINAL REPORT TO USECH31.05.13 Page 75 of 111
4. RETAIL PARK PILOT FINDINGS
4.1 Introduction
This chapter sets out the findings of the pilot of the retail park survey undertaken at Tottenham Hale Retail Park. Where appropriate the results are compared to the weighted Total and Outer London town centres. The research findings are structured as follows: Nature of visit
4.2Purpose of Visit 4.3 Time Spent 4.4 Frequency of Visiting
Travel to town centre 4.5 Mode of Transport 4.6 Attitudes to and Use of Bus
Attitudes 4.7 Attitudes towards Retail Park 4.8 Use of Other Shopping Centres
Goods purchased and spend 4.9 Shopping and Expenditure in the Area 4.10 Average Spend 4.11 Online Shopping
4.12 Respondent Characteristics.
4.2 Purpose of Visit
The retail park was used by both those who live and work in the area and by visitors from outside the area. The majority (71%) do not live or work within 10 minutes walk of the retail park but 21% live in the area, 6% work in the area and 2% both live and work within 10 minutes walk of the retail centre.
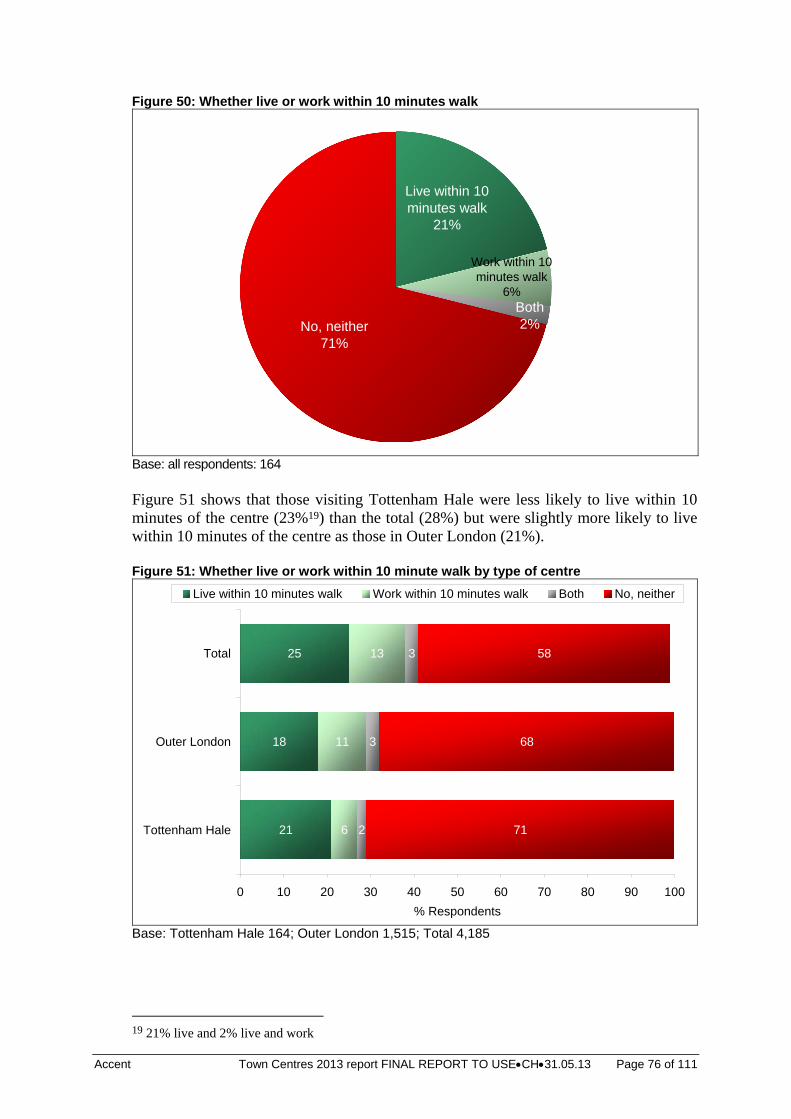
Accent Town Centres 2013 report FINAL REPORT TO USECH31.05.13 Page 76 of 111
Figure 50: Whether live or work within 10 minutes walk
Live within 10 minutes walk
21%
Work within 10 minutes walk
6%Both2%No, neither
71%
Base: all respondents: 164 Figure 51 shows that those visiting Tottenham Hale were less likely to live within 10 minutes of the centre (23%19) than the total (28%) but were slightly more likely to live within 10 minutes of the centre as those in Outer London (21%). Figure 51: Whether live or work within 10 minute walk by type of centre
21
18
25
6
11
13
2
3
3
71
68
58
0 10 20 30 40 50 60 70 80 90 100
Tottenham Hale
Outer London
Total
% Respondents
Live within 10 minutes walk Work within 10 minutes walk Both No, neither
Base: Tottenham Hale 164; Outer London 1,515; Total 4,185
19 21% live and 2% live and work
Accent Town Centres 2013 report FINAL REPORT TO USECH31.05.13 Page 77 of 111
Reasons for visiting All visitors were recruited on the basis that they were shopping, using a service or doing both in the retail park. Shopping was the predominant purpose and the main reason for visiting for almost nine in ten visitors. Eating and drinking out was also important, being mentioned by 20%, but was only the main purpose for 3%. All reasons and the main reasons for visiting the area are as shown in Table 34. Table 34: Reasons for visiting retail park
All purposes
% Main purpose
% Shopping 92 87 Eating/drinking out 20 3 Visiting friends and relatives 9 5 Work here 4 3 Window shopping 3 1 Other social/leisure 1 1 General recreation 1 1 Base 164 164
Table 35 shows the reasons for visiting according to the type of centre. Unsurprisingly, comparisons between centres suggest that those visiting the Tottenham Hale Retail Park were more likely to be doing so for shopping than those visiting other centres. They were also somewhat more likely to be visiting friends and/or relatives. Table 35: Reasons for visit by type of centre
Retail Park All Outer London
All
purposes %
Main purpose
%
All purposes
%
Main purpose
%
All purposes
%
Main purpose
% Shopping 92 87 75 60 82 66 Eating/drinking out 20 3 23 7 23 6 Using service - - 20 9 19 8 Work here 4 3 10 9 8 7 Live here 0 0 7 3 5 1 Visiting friends and relatives
9 5 5 3 4 3
Personal business - - 5 3 4 2 Window shopping 3 1 4 1 5 1 Using public amenity - - 4 2 4 2 Other social/leisure 1 1 3 2 2 1 Travelling through the area
- - 2 1 2 1
General recreation 1 1 1 * 1 * Dropping off/picking up
friend or relative - - 1 * 1 *
Delivering goods 0 0 * * * 0 Buying petrol 0 0 * 0 * 0 Other 0 0 1 1 1 1 Weighted base) 164 164 4,185 4,185 1,515 1,515
* = less than 0.5% - = not applicable
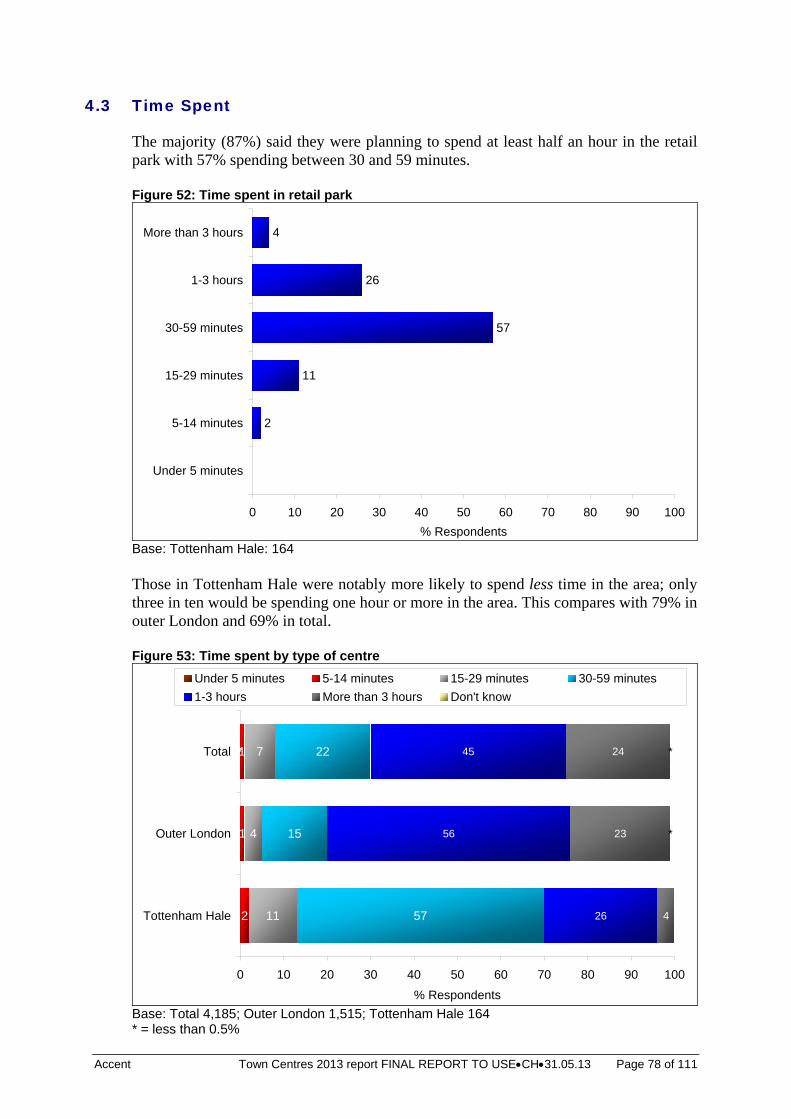
Accent Town Centres 2013 report FINAL REPORT TO USECH31.05.13 Page 78 of 111
4.3 Time Spent
The majority (87%) said they were planning to spend at least half an hour in the retail park with 57% spending between 30 and 59 minutes. Figure 52: Time spent in retail park
2
11
57
26
4
0 10 20 30 40 50 60 70 80 90 100
Under 5 minutes
5-14 minutes
15-29 minutes
30-59 minutes
1-3 hours
More than 3 hours
% Respondents Base: Tottenham Hale: 164 Those in Tottenham Hale were notably more likely to spend less time in the area; only three in ten would be spending one hour or more in the area. This compares with 79% in outer London and 69% in total. Figure 53: Time spent by type of centre
2
1
11
4
7
57
15
22
26
56
45
4
23
24*1
*
*
0 10 20 30 40 50 60 70 80 90 100
Tottenham Hale
Outer London
Total
% Respondents
Under 5 minutes 5-14 minutes 15-29 minutes 30-59 minutes
1-3 hours More than 3 hours Don't know
Base: Total 4,185; Outer London 1,515; Tottenham Hale 164 * = less than 0.5%
Accent Town Centres 2013 report FINAL REPORT TO USECH31.05.13 Page 79 of 111
4.4 Frequency of Visiting
Just over half visit the Tottenham Hale Retail Park on a regular basis; 55% visit the area once a week or more often as shown in Figure 54. Around one in ten (9%) visit the retail park five or more days a week. Figure 54: Frequency of visiting retail park
6
12
20
7
26
11
9
9
0 10 20 30 40 50 60 70 80 90 100
First time
Less than once a month
About once a month
Once a fortnight
Once a week
2 days a week
3 or 4 days a week
5 or more days a week
% Respondents Base: Tottenham Hale: 164 The average number of visits per month was 5.5. Tottenham Hale was visited much less frequently than other centres in Outer London (average number of visits 9.8 per month) and when compared with the total (11.2). Figure 55: Frequency of visiting area by type of centre
9
25
33
9
14
15
11
15
14
26
21
15
7
9
7
20
8
6
12
7
8
6
2
3
0% 10% 20% 30% 40% 50% 60% 70% 80% 90% 100%
Tottenham Hale
Outer London
Total
5 or more days a week 3 or 4 days a week 2 days a week
Once a week Once a fortnight About once a month
Less than once a month First time
11.2
9.8
5.5
monthly mean
Base: Total 4,185; Outer London 1,515; Tottenham Hale 164
Accent Town Centres 2013 report FINAL REPORT TO USECH31.05.13 Page 80 of 111
4.5 Mode of Transport
Mode used Driving a car, van or lorry was the mode of transport used by the highest proportion of visitors (37%). One in four walked to the retail park, 17% used the bus, 9% used the tube/Underground and 7% used the train, as shown in Figure 56. Figure 56: Mode of access to area
4
1
7
9
17
25
37
0 10 20 30 40 50 60 70 80 90 100
Other
Given a lift
Train
Tube/Underground
Bus
Walked
Drove a car/van/lorry
% Respondents
Base: Tottenham Hale: 164 When compared with other types of centres, those visiting Tottenham Hale Retail Park were notably more likely to drive to reach the centre. More than one third drove to Tottenham Hale (37%), compared with 20% of those visiting a centre in Outer London and 12% of the total. By comparison, bus was more commonly used by those visiting Outer London (39%) and the total (34%) than those visiting Tottenham Hale (17%).
Accent Town Centres 2013 report FINAL REPORT TO USECH31.05.13 Page 81 of 111
Figure 57: Mode of access to area by type of centre
17
39
34
25
21
27
37
20
12
9
5
13
7
9
9
2
2
1
2
2
5* *
*
*
*
*
*
0% 10% 20% 30% 40% 50% 60% 70% 80% 90% 100%
Tottenham Hale
Outer London
Total
Bus Walked Drove a car/van/lorry
Tube/Underground Train Bicycle
Given a lift Other Taxi/minicab
Drove a motorbike/moped/scooter Drove a delivery vehicle Barclays Cycle Hire
Base: Total 4,185; Outer London 1,515; Tottenham Hale 164 * = less than 0.5% Why Modes used Respondents were shown a showcard with possible reasons for choosing to travel by the particular mode used to access the area. Table 36 below shows the findings. The most frequently mentioned reasons for choosing to travel by that particular mode were a perception that the mode chosen was quicker (54% mentioned this reason) and easier/more convenient (mentioned by 49%). Other common reasons for choosing the mode of transport included that the mode was more direct (26%) and/or more relaxing/comfortable (21%). Table 36: Reasons for using chosen method of transport rather than any other method of transport to access area
% Quicker 54 Easier/more convenient 49 More direct 26 More relaxing/comfortable 21 Cheaper/less expensive 14 Live very close by 13 Going to more than one place 13 Had heavy bags/shopping to carry 12 Only method possible 4 Safer 4 Need/enjoy exercise/healthy 2 Weather issues 2 Avoids parking difficulties 1 No car/can`t drive 1 Travelling with children 1 Other 2 base 164 Note: More than one answer may be given, so percentages may add up to more than 100%
Accent Town Centres 2013 report FINAL REPORT TO USECH31.05.13 Page 82 of 111
Table 37: Reasons for using chosen method of transport rather than any other method of transport to access area by main modes
Total Car Bus Train/
tube Walk
Quicker 54 56 46 63 54 Easier/more convenient 49 54 39 67 41 More direct 26 18 32 41 22 More relaxing/comfortable 21 21 14 30 22 Cheaper/less expensive 14 10 39 4 12 Live very close by 13 2 * * 39 Going to more than one place 13 28 7 7 * Had heavy bags/shopping to carry 12 20 18 4 2 Safer 4 2 * 22 * Only method possible 4 5 11 * 2 Weather issues 2 2 7 * 2 Need/enjoy exercise/healthy 2 * * * 7 Avoids parking difficulties 1 * * 4 * Travelling with children 1 3 * * * No car/can’t drive 1 * 4 4 0 Other 2 2 0 0 5 Base 164 61 28 27 41 * = less than 0.5% The fact that the means of transport was ‘quicker’ was the most frequently mentioned among most modes (except for train/tube where ‘easier/more convenient’ was a slightly more popular reason). Notable differences among the different modes are that drivers were much more likely than others to cite ‘going to one place’ (28%, compared with 7% of both bus and train/tube users and no walkers) as a reason. Many more car (20%) and bus users (18%) mentioned having heavy bags or shopping to carry as a reason than train/tube users (4%) and those who walked (2%). The fact that the journey was cheaper was also a key reason for bus users (39%), while this was not the case for others. Train/tube users were more likely to cite their choice as ‘easier/more convenient’ (67%), ‘more direct’ (41%) and ‘safer’ (22%) than others. Among those who walked to the retail park, the fact that they lived close by was a key reason for their choice (39%); this reason was only mentioned by 2% of those who drove and none of the bus users or walkers. It is worth noting that, compared to the total sample, visitors to Tottenham Hale Retail Park were more likely to: travel by car because it is easier/more convenient (54% compared to 34% of the
total) travel by bus because it is quicker (46% compared to 32% of the total) or
easier/more convenient (39% cf 26%) travel by train/tube because it is easier/more convenient (67% cf 26%) or more
relaxing/comfortable (30% cf 10%) or safer (22% cf 3%) walk because it is quicker (54% cf 37%), easier/more convenient (41% cf 11%) or
more relaxing/comfortable (22% cf 5%), The main reasons for choosing to travel by the particular mode used to access the area are shown in Table 38. The main reasons are ease/convenience (24%) and that the chosen mode was quicker (23%).
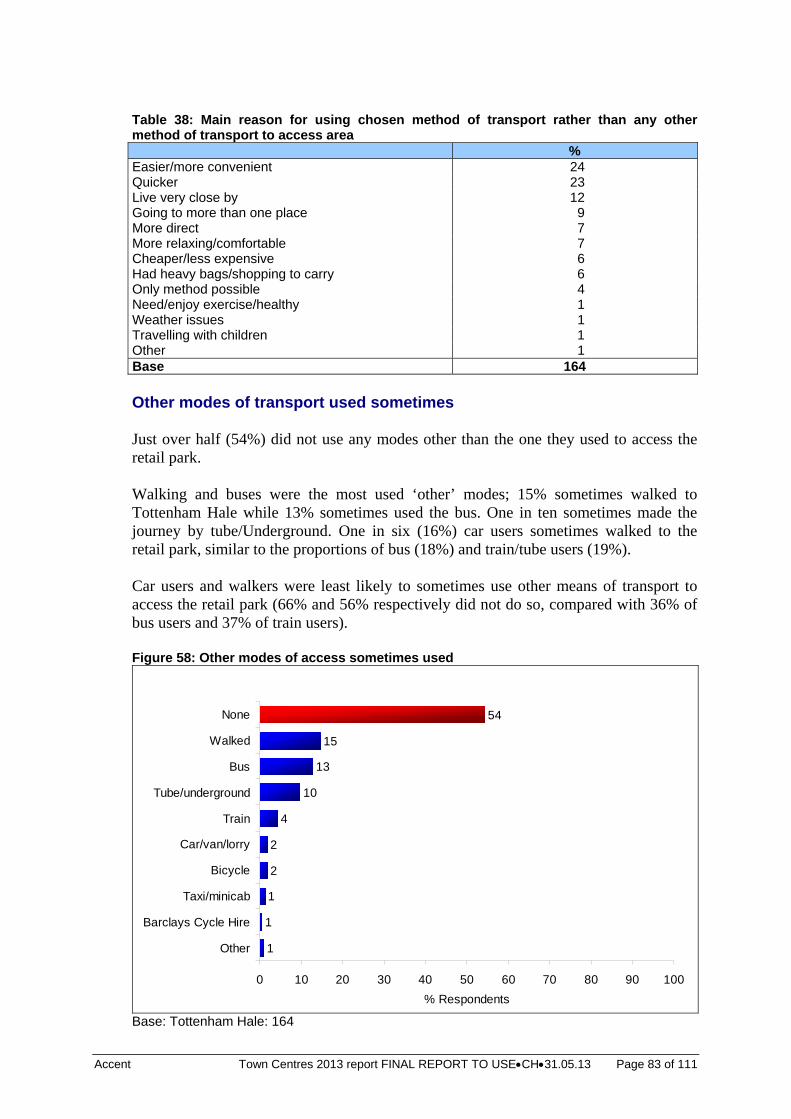
Accent Town Centres 2013 report FINAL REPORT TO USECH31.05.13 Page 83 of 111
Table 38: Main reason for using chosen method of transport rather than any other method of transport to access area
% Easier/more convenient 24 Quicker 23 Live very close by 12 Going to more than one place 9 More direct 7 More relaxing/comfortable 7 Cheaper/less expensive 6 Had heavy bags/shopping to carry 6 Only method possible 4 Need/enjoy exercise/healthy 1 Weather issues 1 Travelling with children 1 Other 1 Base 164 Other modes of transport used sometimes Just over half (54%) did not use any modes other than the one they used to access the retail park. Walking and buses were the most used ‘other’ modes; 15% sometimes walked to Tottenham Hale while 13% sometimes used the bus. One in ten sometimes made the journey by tube/Underground. One in six (16%) car users sometimes walked to the retail park, similar to the proportions of bus (18%) and train/tube users (19%). Car users and walkers were least likely to sometimes use other means of transport to access the retail park (66% and 56% respectively did not do so, compared with 36% of bus users and 37% of train users). Figure 58: Other modes of access sometimes used
1
1
1
2
2
4
10
13
15
54
0 10 20 30 40 50 60 70 80 90 100
Other
Barclays Cycle Hire
Taxi/minicab
Bicycle
Car/van/lorry
Train
Tube/underground
Bus
Walked
None
% Respondents
Base: Tottenham Hale: 164
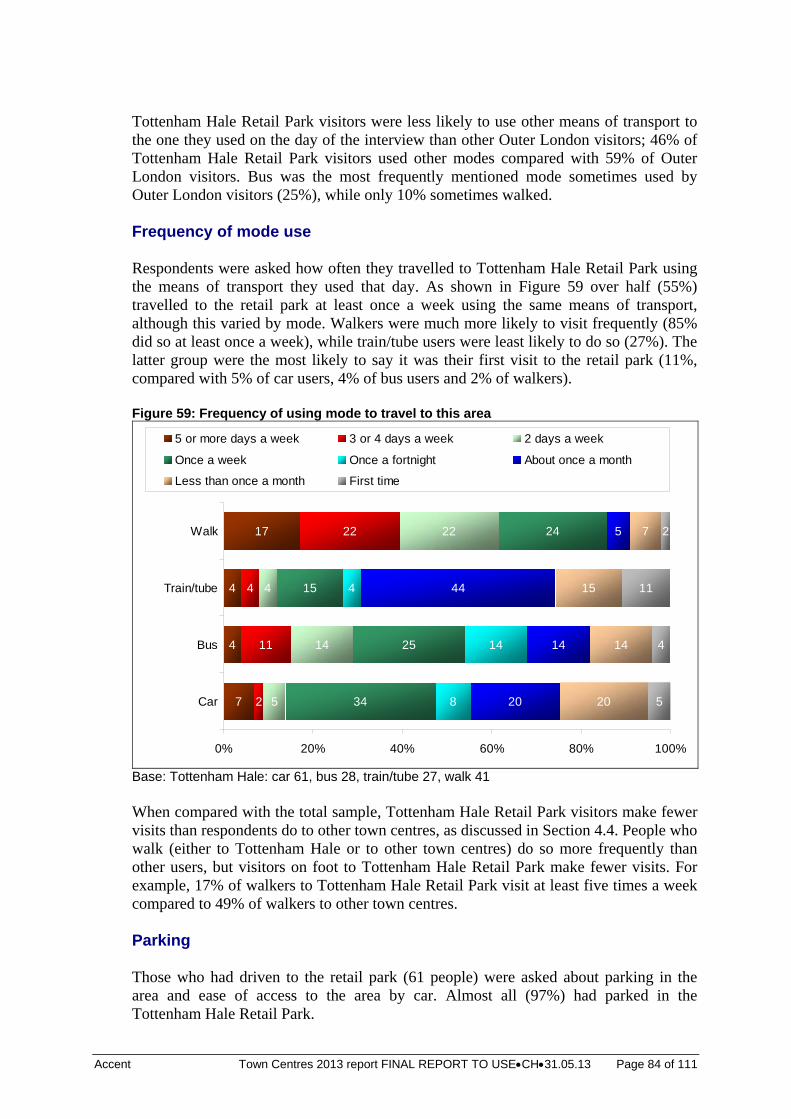
Accent Town Centres 2013 report FINAL REPORT TO USECH31.05.13 Page 84 of 111
Tottenham Hale Retail Park visitors were less likely to use other means of transport to the one they used on the day of the interview than other Outer London visitors; 46% of Tottenham Hale Retail Park visitors used other modes compared with 59% of Outer London visitors. Bus was the most frequently mentioned mode sometimes used by Outer London visitors (25%), while only 10% sometimes walked. Frequency of mode use Respondents were asked how often they travelled to Tottenham Hale Retail Park using the means of transport they used that day. As shown in Figure 59 over half (55%) travelled to the retail park at least once a week using the same means of transport, although this varied by mode. Walkers were much more likely to visit frequently (85% did so at least once a week), while train/tube users were least likely to do so (27%). The latter group were the most likely to say it was their first visit to the retail park (11%, compared with 5% of car users, 4% of bus users and 2% of walkers). Figure 59: Frequency of using mode to travel to this area
7
4
4
17
2
11
4
22
5
14
4
22
34
25
15
24
8
14
4
20
14
44
5
20
14
15
7
5
4
11
2
0% 20% 40% 60% 80% 100%
Car
Bus
Train/tube
Walk
5 or more days a week 3 or 4 days a week 2 days a week
Once a week Once a fortnight About once a month
Less than once a month First time
Base: Tottenham Hale: car 61, bus 28, train/tube 27, walk 41 When compared with the total sample, Tottenham Hale Retail Park visitors make fewer visits than respondents do to other town centres, as discussed in Section 4.4. People who walk (either to Tottenham Hale or to other town centres) do so more frequently than other users, but visitors on foot to Tottenham Hale Retail Park make fewer visits. For example, 17% of walkers to Tottenham Hale Retail Park visit at least five times a week compared to 49% of walkers to other town centres. Parking Those who had driven to the retail park (61 people) were asked about parking in the area and ease of access to the area by car. Almost all (97%) had parked in the Tottenham Hale Retail Park.
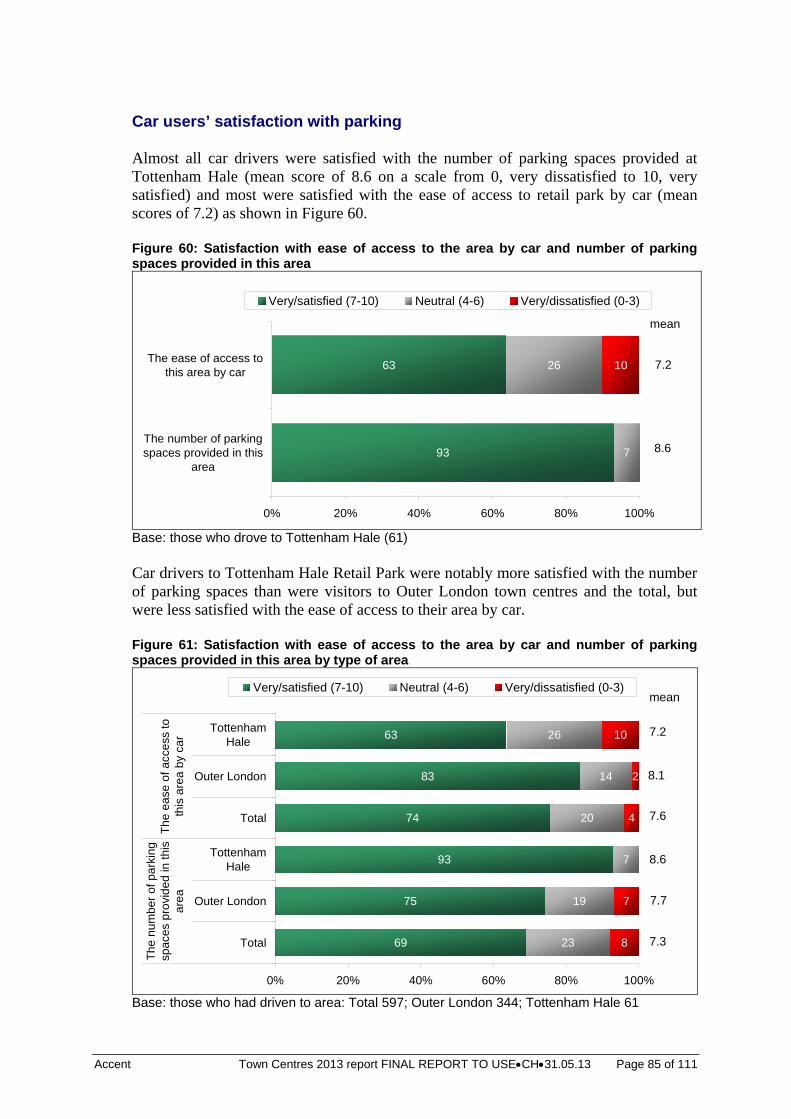
Accent Town Centres 2013 report FINAL REPORT TO USECH31.05.13 Page 85 of 111
Car users’ satisfaction with parking Almost all car drivers were satisfied with the number of parking spaces provided at Tottenham Hale (mean score of 8.6 on a scale from 0, very dissatisfied to 10, very satisfied) and most were satisfied with the ease of access to retail park by car (mean scores of 7.2) as shown in Figure 60. Figure 60: Satisfaction with ease of access to the area by car and number of parking spaces provided in this area
93
63
7
26 10
0% 20% 40% 60% 80% 100%
The number of parkingspaces provided in this
area
The ease of access tothis area by car
Very/satisfied (7-10) Neutral (4-6) Very/dissatisfied (0-3)
7.2
8.6
mean
Base: those who drove to Tottenham Hale (61) Car drivers to Tottenham Hale Retail Park were notably more satisfied with the number of parking spaces than were visitors to Outer London town centres and the total, but were less satisfied with the ease of access to their area by car. Figure 61: Satisfaction with ease of access to the area by car and number of parking spaces provided in this area by type of area
69
75
93
74
83
63
23
19
7
20
14
26
8
7
4
2
10
0% 20% 40% 60% 80% 100%
Total
Outer London
TottenhamHale
Total
Outer London
TottenhamHale
Th
e n
um
be
r o
f pa
rkin
gsp
ace
s p
rovi
de
d in
this
area
Th
e e
ase
of a
cce
ss to
this
are
a b
y ca
r
Very/satisfied (7-10) Neutral (4-6) Very/dissatisfied (0-3)
7.2
mean
7.3
7.7
8.6
7.6
8.1
Base: those who had driven to area: Total 597; Outer London 344; Tottenham Hale 61
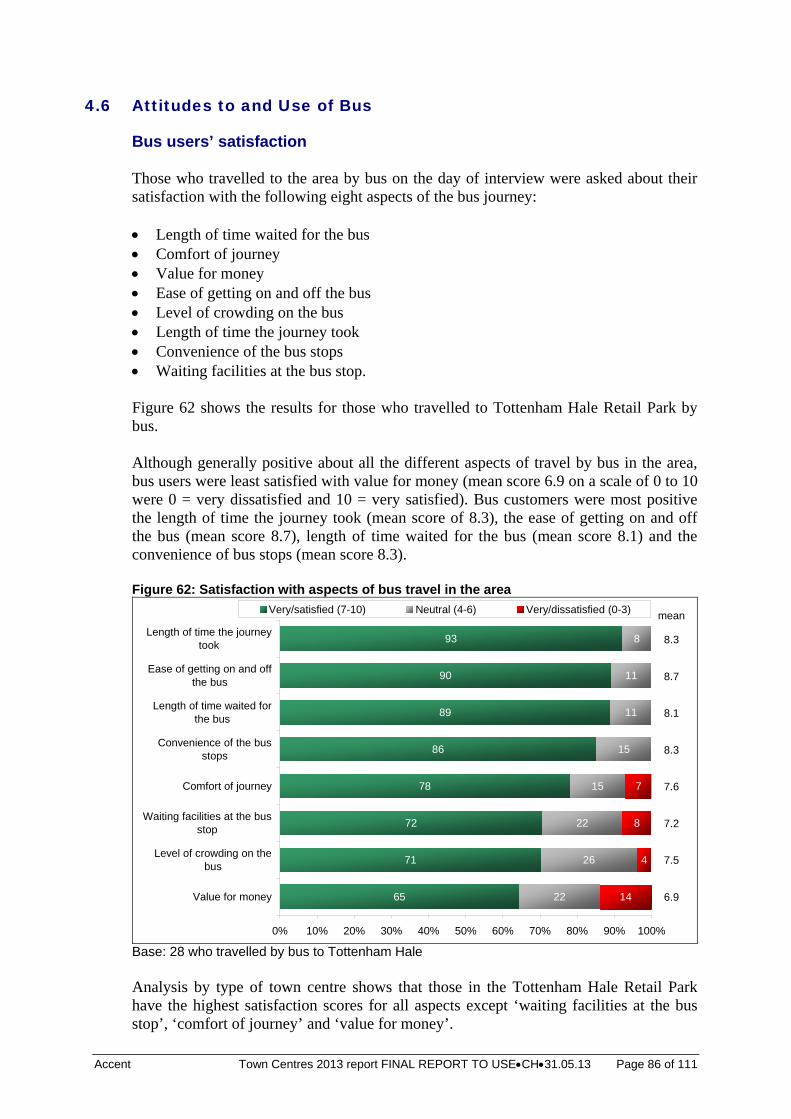
Accent Town Centres 2013 report FINAL REPORT TO USECH31.05.13 Page 86 of 111
4.6 Attitudes to and Use of Bus
Bus users’ satisfaction Those who travelled to the area by bus on the day of interview were asked about their satisfaction with the following eight aspects of the bus journey: Length of time waited for the bus Comfort of journey Value for money Ease of getting on and off the bus Level of crowding on the bus Length of time the journey took Convenience of the bus stops Waiting facilities at the bus stop. Figure 62 shows the results for those who travelled to Tottenham Hale Retail Park by bus. Although generally positive about all the different aspects of travel by bus in the area, bus users were least satisfied with value for money (mean score 6.9 on a scale of 0 to 10 were 0 = very dissatisfied and 10 = very satisfied). Bus customers were most positive the length of time the journey took (mean score of 8.3), the ease of getting on and off the bus (mean score 8.7), length of time waited for the bus (mean score 8.1) and the convenience of bus stops (mean score 8.3). Figure 62: Satisfaction with aspects of bus travel in the area
65
71
72
78
86
89
90
93
22
26
22
15
15
11
11
8
4
8
7
14
0% 10% 20% 30% 40% 50% 60% 70% 80% 90% 100%
Value for money
Level of crowding on thebus
Waiting facilities at the busstop
Comfort of journey
Convenience of the busstops
Length of time waited forthe bus
Ease of getting on and offthe bus
Length of time the journeytook
Very/satisfied (7-10) Neutral (4-6) Very/dissatisfied (0-3)
8.3
mean
8.7
8.1
8.3
7.6
7.2
7.5
6.9
Base: 28 who travelled by bus to Tottenham Hale Analysis by type of town centre shows that those in the Tottenham Hale Retail Park have the highest satisfaction scores for all aspects except ‘waiting facilities at the bus stop’, ‘comfort of journey’ and ‘value for money’.
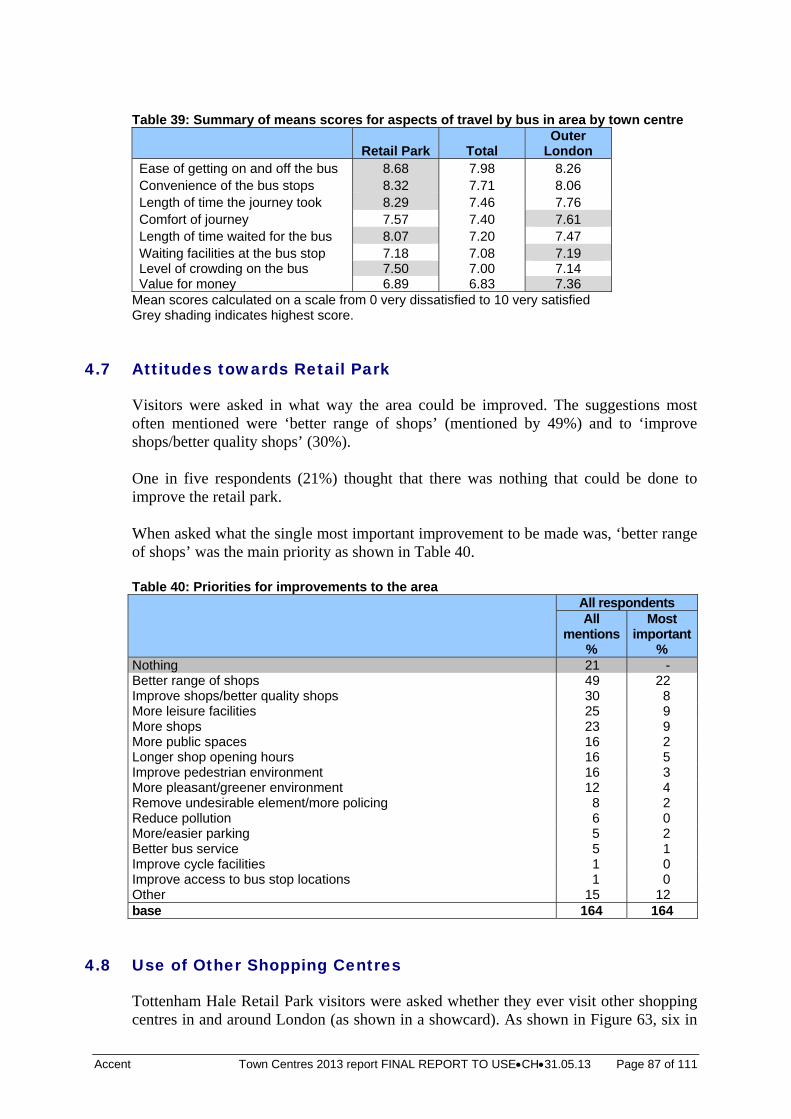
Accent Town Centres 2013 report FINAL REPORT TO USECH31.05.13 Page 87 of 111
Table 39: Summary of means scores for aspects of travel by bus in area by town centre
Retail Park Total Outer
London Ease of getting on and off the bus 8.68 7.98 8.26 Convenience of the bus stops 8.32 7.71 8.06 Length of time the journey took 8.29 7.46 7.76 Comfort of journey 7.57 7.40 7.61 Length of time waited for the bus 8.07 7.20 7.47 Waiting facilities at the bus stop 7.18 7.08 7.19 Level of crowding on the bus 7.50 7.00 7.14 Value for money 6.89 6.83 7.36
Mean scores calculated on a scale from 0 very dissatisfied to 10 very satisfied Grey shading indicates highest score.
4.7 Attitudes towards Retail Park
Visitors were asked in what way the area could be improved. The suggestions most often mentioned were ‘better range of shops’ (mentioned by 49%) and to ‘improve shops/better quality shops’ (30%). One in five respondents (21%) thought that there was nothing that could be done to improve the retail park. When asked what the single most important improvement to be made was, ‘better range of shops’ was the main priority as shown in Table 40. Table 40: Priorities for improvements to the area All respondents
All mentions
%
Most important
% Nothing 21 - Better range of shops 49 22 Improve shops/better quality shops 30 8 More leisure facilities 25 9 More shops 23 9 More public spaces 16 2 Longer shop opening hours 16 5 Improve pedestrian environment 16 3 More pleasant/greener environment 12 4 Remove undesirable element/more policing 8 2 Reduce pollution 6 0 More/easier parking 5 2 Better bus service 5 1 Improve cycle facilities 1 0 Improve access to bus stop locations 1 0 Other 15 12 base 164 164
4.8 Use of Other Shopping Centres
Tottenham Hale Retail Park visitors were asked whether they ever visit other shopping centres in and around London (as shown in a showcard). As shown in Figure 63, six in
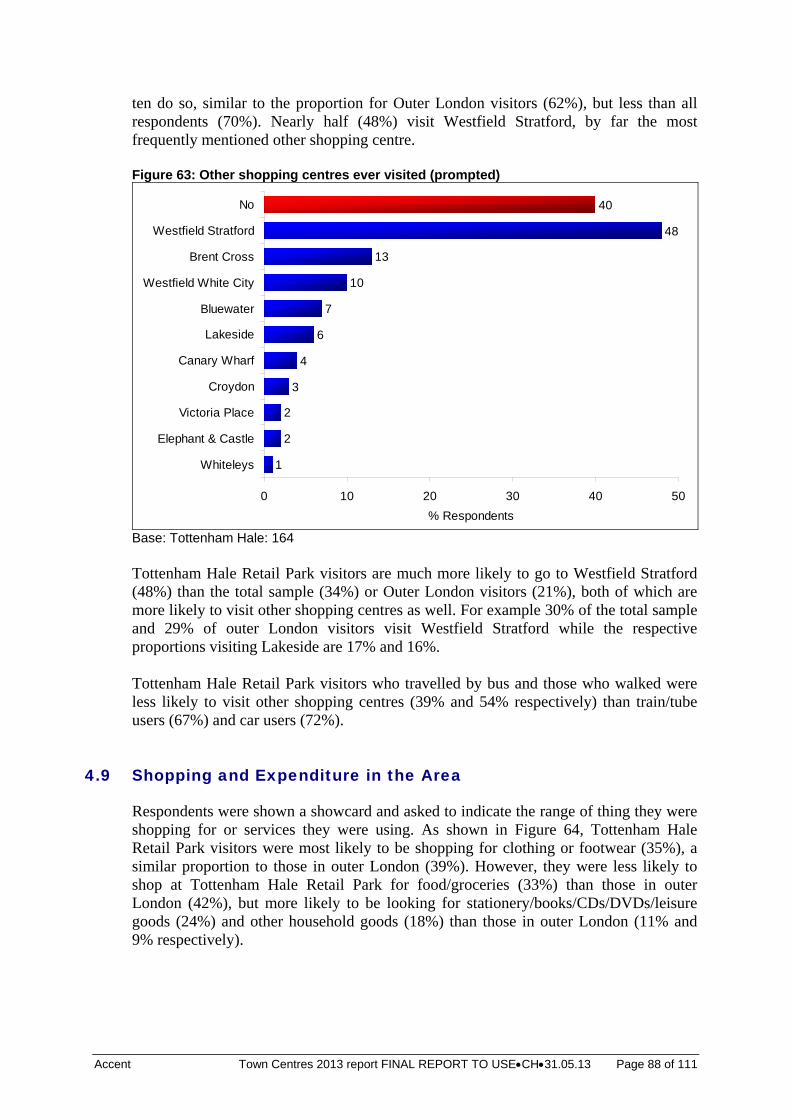
Accent Town Centres 2013 report FINAL REPORT TO USECH31.05.13 Page 88 of 111
ten do so, similar to the proportion for Outer London visitors (62%), but less than all respondents (70%). Nearly half (48%) visit Westfield Stratford, by far the most frequently mentioned other shopping centre. Figure 63: Other shopping centres ever visited (prompted)
1
2
2
3
4
6
7
10
13
48
40
0 10 20 30 40 50
Whiteleys
Elephant & Castle
Victoria Place
Croydon
Canary Wharf
Lakeside
Bluewater
Westfield White City
Brent Cross
Westfield Stratford
No
% Respondents
Base: Tottenham Hale: 164 Tottenham Hale Retail Park visitors are much more likely to go to Westfield Stratford (48%) than the total sample (34%) or Outer London visitors (21%), both of which are more likely to visit other shopping centres as well. For example 30% of the total sample and 29% of outer London visitors visit Westfield Stratford while the respective proportions visiting Lakeside are 17% and 16%. Tottenham Hale Retail Park visitors who travelled by bus and those who walked were less likely to visit other shopping centres (39% and 54% respectively) than train/tube users (67%) and car users (72%).
4.9 Shopping and Expenditure in the Area
Respondents were shown a showcard and asked to indicate the range of thing they were shopping for or services they were using. As shown in Figure 64, Tottenham Hale Retail Park visitors were most likely to be shopping for clothing or footwear (35%), a similar proportion to those in outer London (39%). However, they were less likely to shop at Tottenham Hale Retail Park for food/groceries (33%) than those in outer London (42%), but more likely to be looking for stationery/books/CDs/DVDs/leisure goods (24%) and other household goods (18%) than those in outer London (11% and 9% respectively).
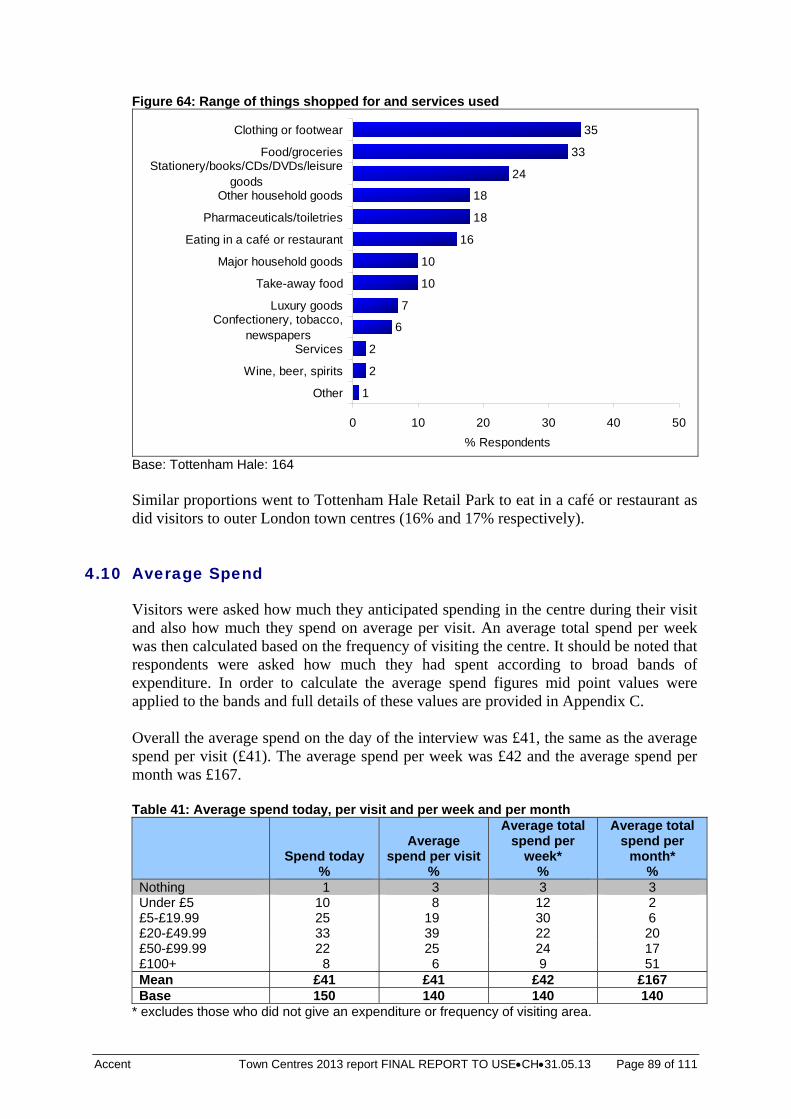
Accent Town Centres 2013 report FINAL REPORT TO USECH31.05.13 Page 89 of 111
Figure 64: Range of things shopped for and services used
1
2
2
6
7
10
10
16
18
18
24
33
35
0 10 20 30 40 50
Other
Wine, beer, spirits
Services
Confectionery, tobacco,newspapers
Luxury goods
Take-away food
Major household goods
Eating in a café or restaurant
Pharmaceuticals/toiletries
Other household goods
Stationery/books/CDs/DVDs/leisuregoods
Food/groceries
Clothing or footwear
% Respondents
Base: Tottenham Hale: 164 Similar proportions went to Tottenham Hale Retail Park to eat in a café or restaurant as did visitors to outer London town centres (16% and 17% respectively).
4.10 Average Spend
Visitors were asked how much they anticipated spending in the centre during their visit and also how much they spend on average per visit. An average total spend per week was then calculated based on the frequency of visiting the centre. It should be noted that respondents were asked how much they had spent according to broad bands of expenditure. In order to calculate the average spend figures mid point values were applied to the bands and full details of these values are provided in Appendix C. Overall the average spend on the day of the interview was £41, the same as the average spend per visit (£41). The average spend per week was £42 and the average spend per month was £167. Table 41: Average spend today, per visit and per week and per month
Spend today
%
Average spend per visit
%
Average total spend per
week* %
Average total spend per
month* %
Nothing 1 3 3 3 Under £5 10 8 12 2 £5-£19.99 25 19 30 6 £20-£49.99 33 39 22 20 £50-£99.99 22 25 24 17 £100+ 8 6 9 51 Mean £41 £41 £42 £167 Base 150 140 140 140
* excludes those who did not give an expenditure or frequency of visiting area.
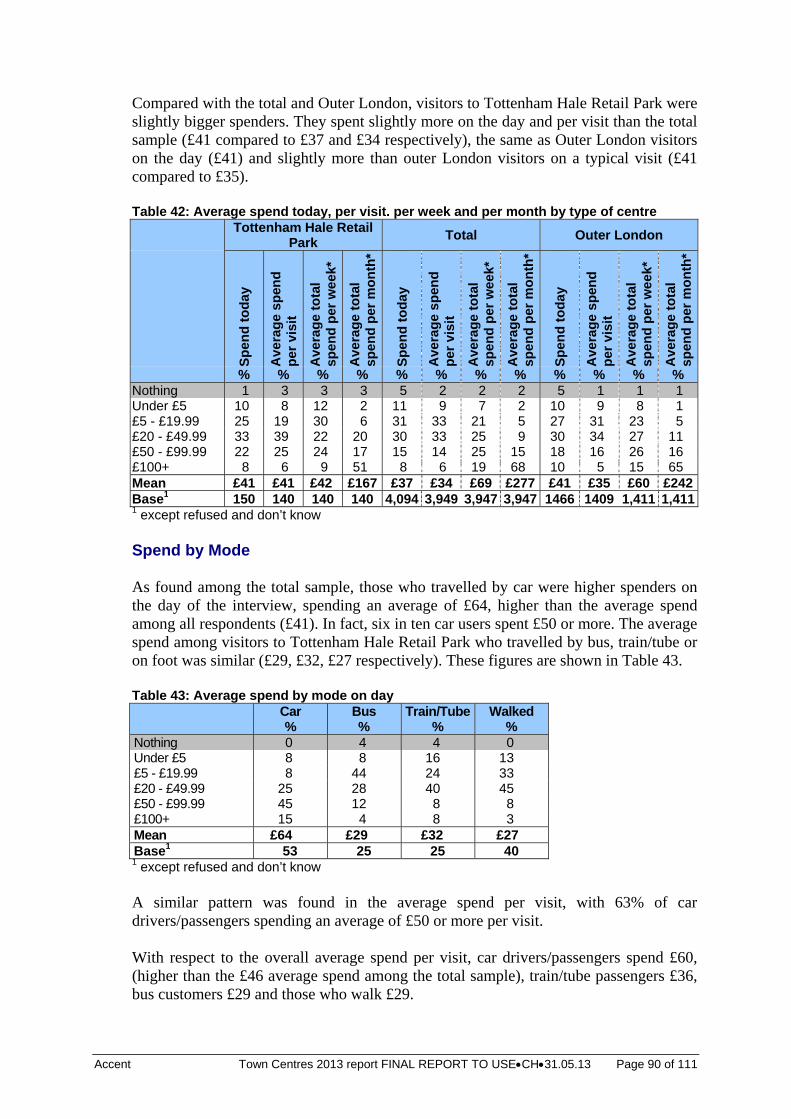
Accent Town Centres 2013 report FINAL REPORT TO USECH31.05.13 Page 90 of 111
Compared with the total and Outer London, visitors to Tottenham Hale Retail Park were slightly bigger spenders. They spent slightly more on the day and per visit than the total sample (£41 compared to £37 and £34 respectively), the same as Outer London visitors on the day (£41) and slightly more than outer London visitors on a typical visit (£41 compared to £35). Table 42: Average spend today, per visit. per week and per month by type of centre Tottenham Hale Retail
Park Total Outer London
S
pen
d t
od
ay
Ave
rag
e sp
end
p
er v
isit
Ave
rag
e to
tal
spen
d p
er w
eek*
Ave
rag
e to
tal
spen
d p
er m
on
th*
Sp
end
to
day
Ave
rag
e sp
end
p
er v
isit
Ave
rag
e to
tal
spen
d p
er w
eek*
Ave
rag
e to
tal
spen
d p
er m
on
th*
Sp
end
to
day
Ave
rag
e sp
end
p
er v
isit
Ave
rag
e to
tal
spen
d p
er w
eek*
Ave
rag
e to
tal
spen
d p
er m
on
th*
% % % % % % % % % % % % Nothing 1 3 3 3 5 2 2 2 5 1 1 1 Under £5 10 8 12 2 11 9 7 2 10 9 8 1 £5 - £19.99 25 19 30 6 31 33 21 5 27 31 23 5 £20 - £49.99 33 39 22 20 30 33 25 9 30 34 27 11 £50 - £99.99 22 25 24 17 15 14 25 15 18 16 26 16 £100+ 8 6 9 51 8 6 19 68 10 5 15 65 Mean £41 £41 £42 £167 £37 £34 £69 £277 £41 £35 £60 £242Base1 150 140 140 140 4,094 3,949 3,947 3,947 1466 1409 1,411 1,4111 except refused and don’t know Spend by Mode As found among the total sample, those who travelled by car were higher spenders on the day of the interview, spending an average of £64, higher than the average spend among all respondents (£41). In fact, six in ten car users spent £50 or more. The average spend among visitors to Tottenham Hale Retail Park who travelled by bus, train/tube or on foot was similar (£29, £32, £27 respectively). These figures are shown in Table 43. Table 43: Average spend by mode on day
Car %
Bus %
Train/Tube%
Walked %
Nothing 0 4 4 0 Under £5 8 8 16 13 £5 - £19.99 8 44 24 33 £20 - £49.99 25 28 40 45 £50 - £99.99 45 12 8 8 £100+ 15 4 8 3 Mean £64 £29 £32 £27 Base1 53 25 25 40 1 except refused and don’t know A similar pattern was found in the average spend per visit, with 63% of car drivers/passengers spending an average of £50 or more per visit. With respect to the overall average spend per visit, car drivers/passengers spend £60, (higher than the £46 average spend among the total sample), train/tube passengers £36, bus customers £29 and those who walk £29.
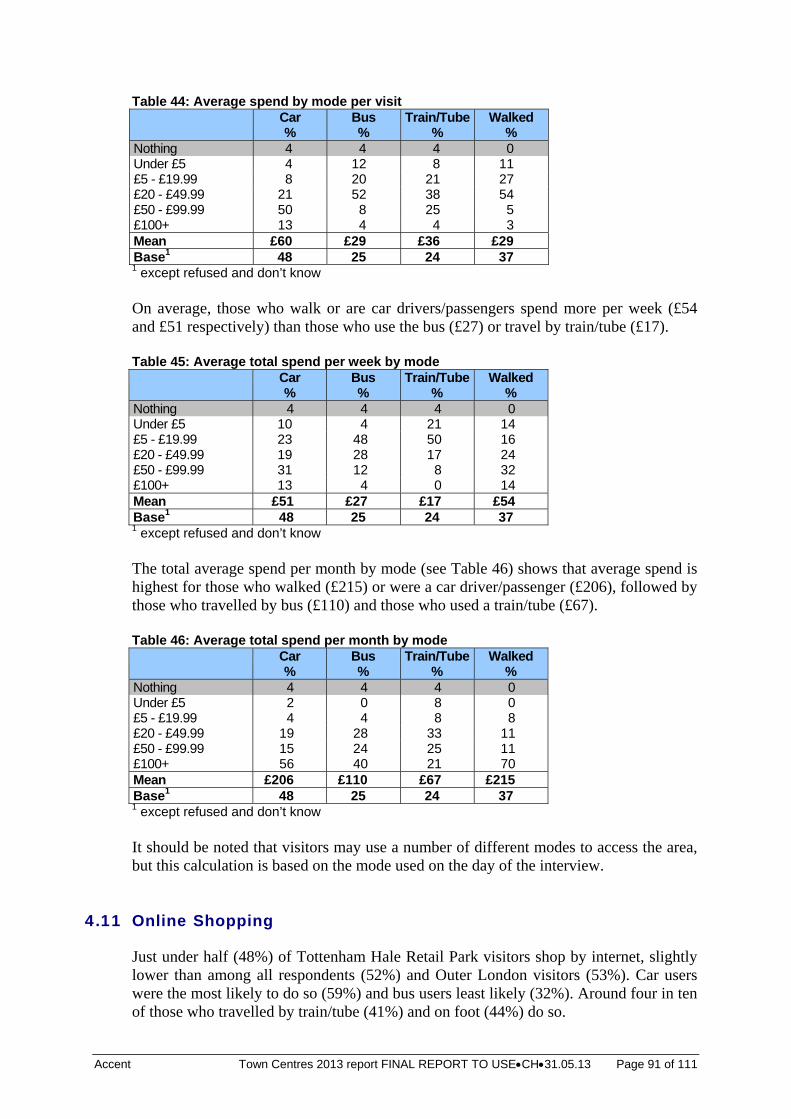
Accent Town Centres 2013 report FINAL REPORT TO USECH31.05.13 Page 91 of 111
Table 44: Average spend by mode per visit
Car %
Bus %
Train/Tube%
Walked %
Nothing 4 4 4 0 Under £5 4 12 8 11 £5 - £19.99 8 20 21 27 £20 - £49.99 21 52 38 54 £50 - £99.99 50 8 25 5 £100+ 13 4 4 3 Mean £60 £29 £36 £29 Base1 48 25 24 37 1 except refused and don’t know On average, those who walk or are car drivers/passengers spend more per week (£54 and £51 respectively) than those who use the bus (£27) or travel by train/tube (£17). Table 45: Average total spend per week by mode
Car %
Bus %
Train/Tube%
Walked %
Nothing 4 4 4 0 Under £5 10 4 21 14 £5 - £19.99 23 48 50 16 £20 - £49.99 19 28 17 24 £50 - £99.99 31 12 8 32 £100+ 13 4 0 14 Mean £51 £27 £17 £54 Base1 48 25 24 37 1 except refused and don’t know The total average spend per month by mode (see Table 46) shows that average spend is highest for those who walked (£215) or were a car driver/passenger (£206), followed by those who travelled by bus (£110) and those who used a train/tube (£67). Table 46: Average total spend per month by mode
Car %
Bus %
Train/Tube%
Walked %
Nothing 4 4 4 0 Under £5 2 0 8 0 £5 - £19.99 4 4 8 8 £20 - £49.99 19 28 33 11 £50 - £99.99 15 24 25 11 £100+ 56 40 21 70 Mean £206 £110 £67 £215 Base1 48 25 24 37 1 except refused and don’t know It should be noted that visitors may use a number of different modes to access the area, but this calculation is based on the mode used on the day of the interview.
4.11 Online Shopping
Just under half (48%) of Tottenham Hale Retail Park visitors shop by internet, slightly lower than among all respondents (52%) and Outer London visitors (53%). Car users were the most likely to do so (59%) and bus users least likely (32%). Around four in ten of those who travelled by train/tube (41%) and on foot (44%) do so.
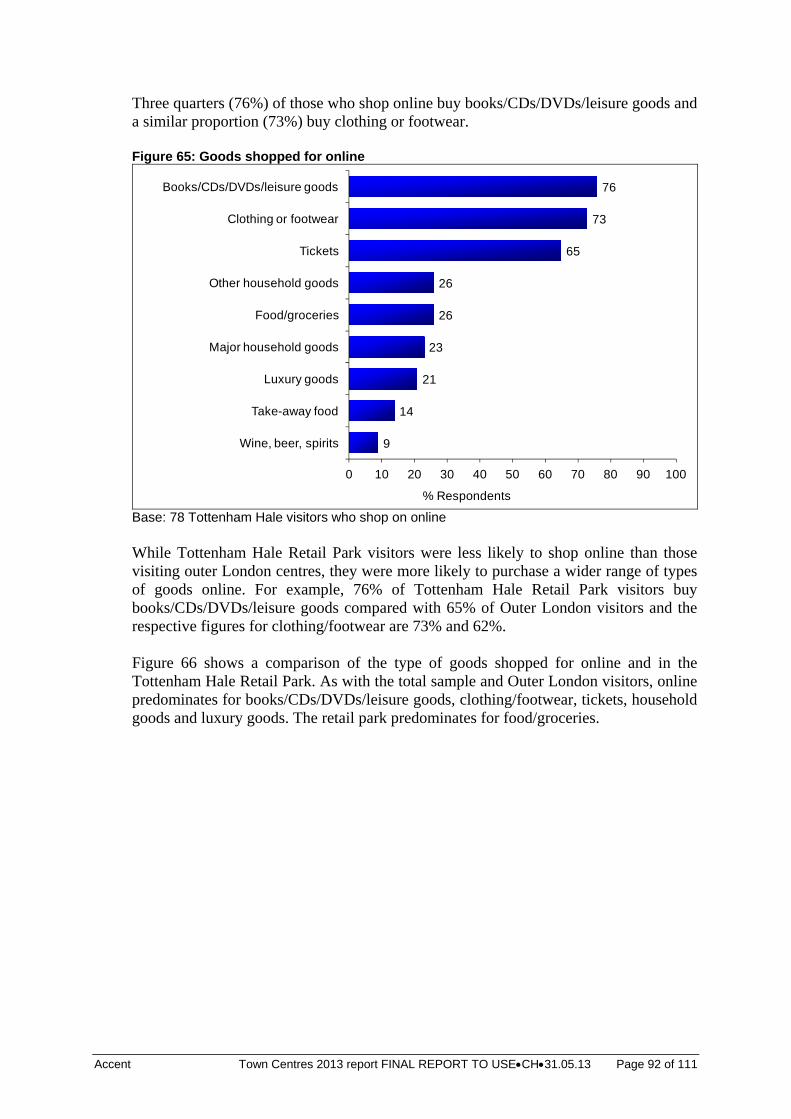
Accent Town Centres 2013 report FINAL REPORT TO USECH31.05.13 Page 92 of 111
Three quarters (76%) of those who shop online buy books/CDs/DVDs/leisure goods and a similar proportion (73%) buy clothing or footwear. Figure 65: Goods shopped for online
9
14
21
23
26
26
65
73
76
0 10 20 30 40 50 60 70 80 90 100
Wine, beer, spirits
Take-away food
Luxury goods
Major household goods
Food/groceries
Other household goods
Tickets
Clothing or footwear
Books/CDs/DVDs/leisure goods
% Respondents
Base: 78 Tottenham Hale visitors who shop on online While Tottenham Hale Retail Park visitors were less likely to shop online than those visiting outer London centres, they were more likely to purchase a wider range of types of goods online. For example, 76% of Tottenham Hale Retail Park visitors buy books/CDs/DVDs/leisure goods compared with 65% of Outer London visitors and the respective figures for clothing/footwear are 73% and 62%. Figure 66 shows a comparison of the type of goods shopped for online and in the Tottenham Hale Retail Park. As with the total sample and Outer London visitors, online predominates for books/CDs/DVDs/leisure goods, clothing/footwear, tickets, household goods and luxury goods. The retail park predominates for food/groceries.
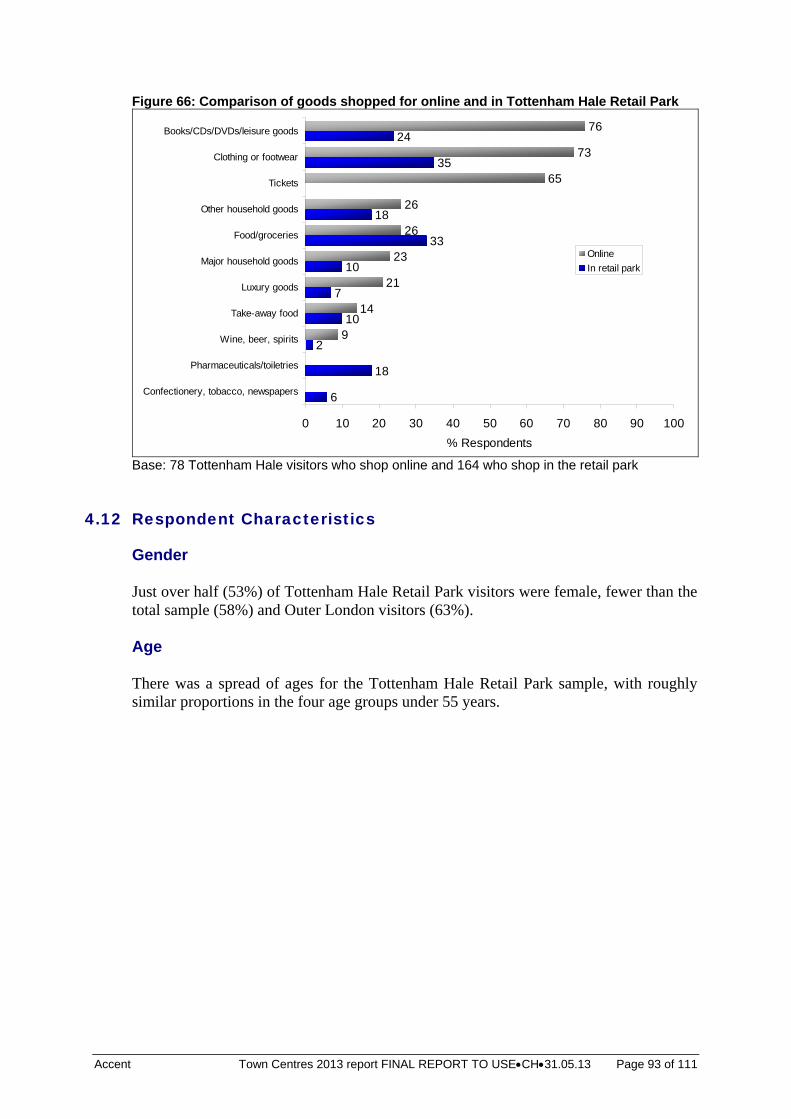
Accent Town Centres 2013 report FINAL REPORT TO USECH31.05.13 Page 93 of 111
Figure 66: Comparison of goods shopped for online and in Tottenham Hale Retail Park
6
18
2
10
7
10
33
18
35
24
9
14
21
23
26
26
65
73
76
0 10 20 30 40 50 60 70 80 90 100
Confectionery, tobacco, newspapers
Pharmaceuticals/toiletries
Wine, beer, spirits
Take-away food
Luxury goods
Major household goods
Food/groceries
Other household goods
Tickets
Clothing or footwear
Books/CDs/DVDs/leisure goods
% Respondents
Online
In retail park
Base: 78 Tottenham Hale visitors who shop online and 164 who shop in the retail park
4.12 Respondent Characteristics
Gender Just over half (53%) of Tottenham Hale Retail Park visitors were female, fewer than the total sample (58%) and Outer London visitors (63%). Age There was a spread of ages for the Tottenham Hale Retail Park sample, with roughly similar proportions in the four age groups under 55 years.
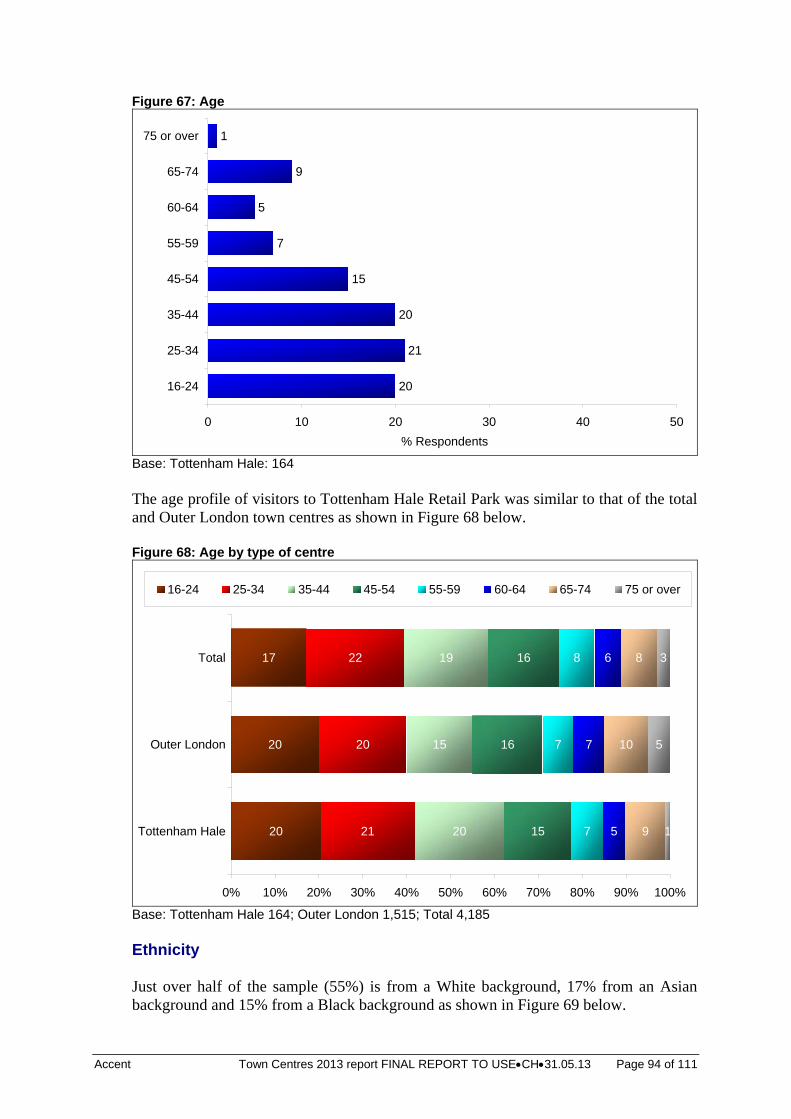
Accent Town Centres 2013 report FINAL REPORT TO USECH31.05.13 Page 94 of 111
Figure 67: Age
20
21
20
15
7
5
9
1
0 10 20 30 40 50
16-24
25-34
35-44
45-54
55-59
60-64
65-74
75 or over
% Respondents
Base: Tottenham Hale: 164 The age profile of visitors to Tottenham Hale Retail Park was similar to that of the total and Outer London town centres as shown in Figure 68 below. Figure 68: Age by type of centre
20
20
17
21
20
22
20
15
19
15
16
16
7
7
8
5
7
6
9
10
8
1
5
3
0% 10% 20% 30% 40% 50% 60% 70% 80% 90% 100%
Tottenham Hale
Outer London
Total
16-24 25-34 35-44 45-54 55-59 60-64 65-74 75 or over
Base: Tottenham Hale 164; Outer London 1,515; Total 4,185 Ethnicity Just over half of the sample (55%) is from a White background, 17% from an Asian background and 15% from a Black background as shown in Figure 69 below.
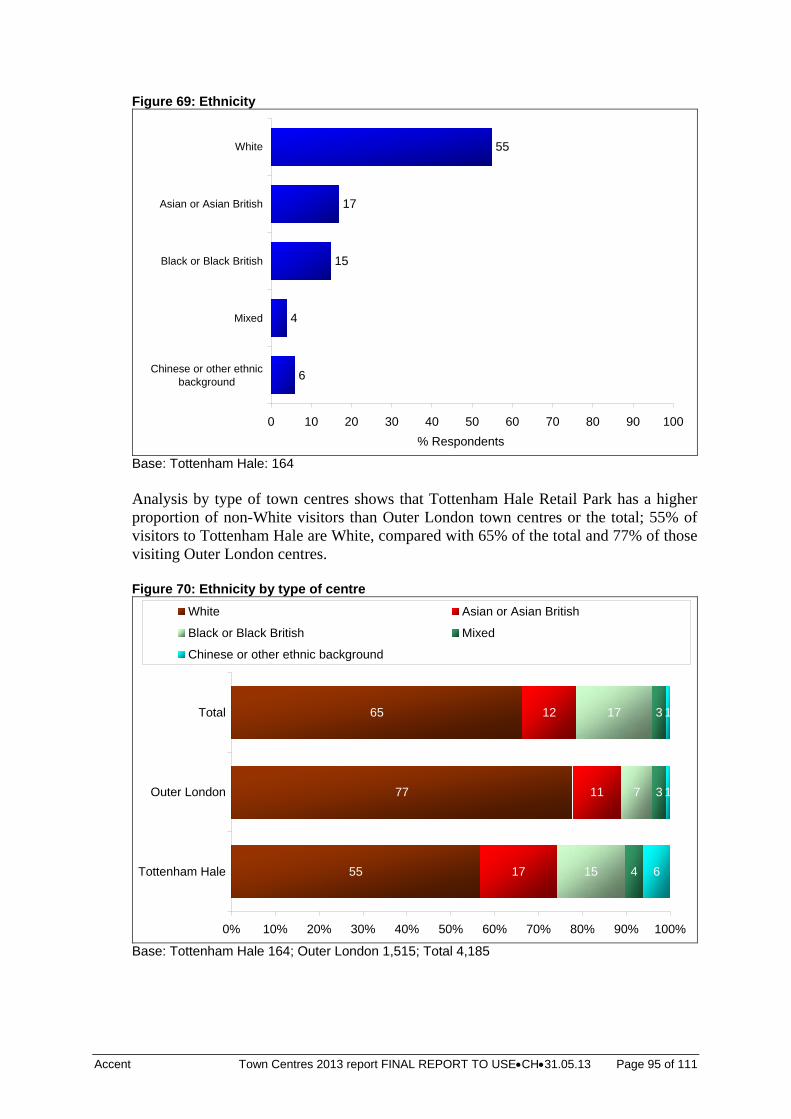
Accent Town Centres 2013 report FINAL REPORT TO USECH31.05.13 Page 95 of 111
Figure 69: Ethnicity
6
4
15
17
55
0 10 20 30 40 50 60 70 80 90 100
Chinese or other ethnicbackground
Mixed
Black or Black British
Asian or Asian British
White
% Respondents
Base: Tottenham Hale: 164 Analysis by type of town centres shows that Tottenham Hale Retail Park has a higher proportion of non-White visitors than Outer London town centres or the total; 55% of visitors to Tottenham Hale are White, compared with 65% of the total and 77% of those visiting Outer London centres. Figure 70: Ethnicity by type of centre
55
77
65
17
11
12
15
7
17
4
3
3
6
1
1
0% 10% 20% 30% 40% 50% 60% 70% 80% 90% 100%
Tottenham Hale
Outer London
Total
White Asian or Asian British
Black or Black British Mixed
Chinese or other ethnic background
Base: Tottenham Hale 164; Outer London 1,515; Total 4,185
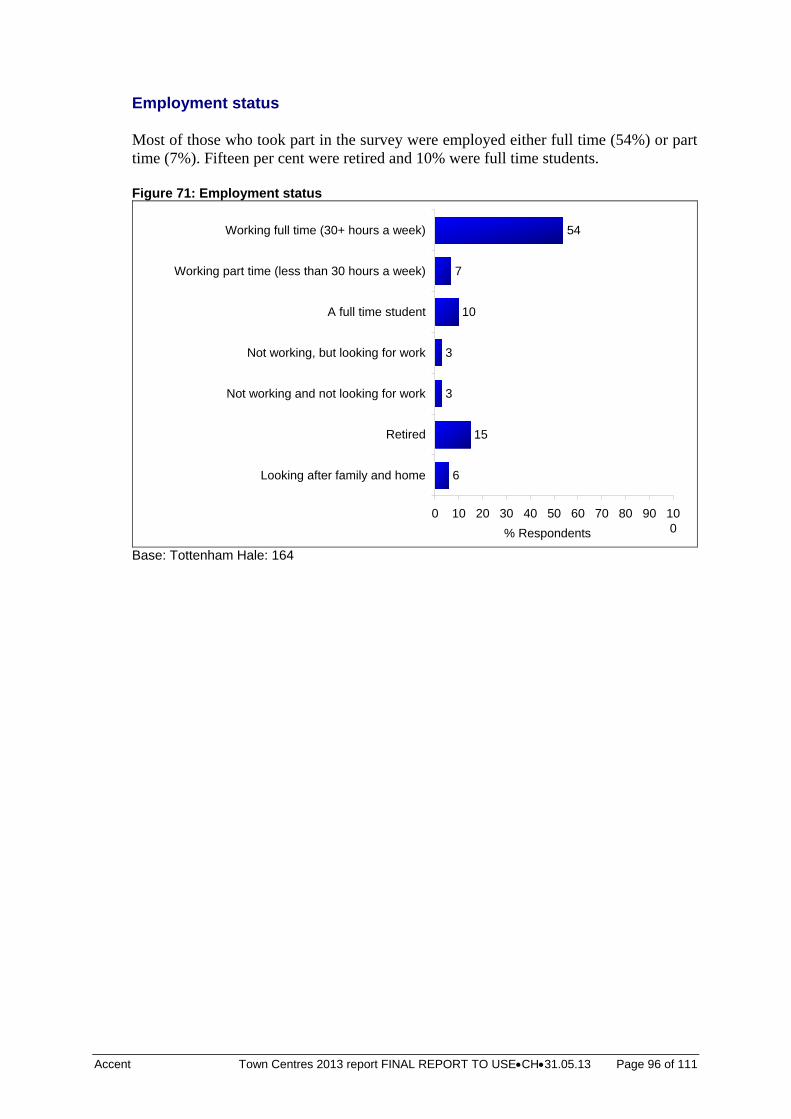
Accent Town Centres 2013 report FINAL REPORT TO USECH31.05.13 Page 96 of 111
Employment status Most of those who took part in the survey were employed either full time (54%) or part time (7%). Fifteen per cent were retired and 10% were full time students. Figure 71: Employment status
6
15
3
3
10
7
54
0 10 20 30 40 50 60 70 80 90 100
Looking after family and home
Retired
Not working and not looking for work
Not working, but looking for work
A full time student
Working part time (less than 30 hours a week)
Working full time (30+ hours a week)
% Respondents
Base: Tottenham Hale: 164
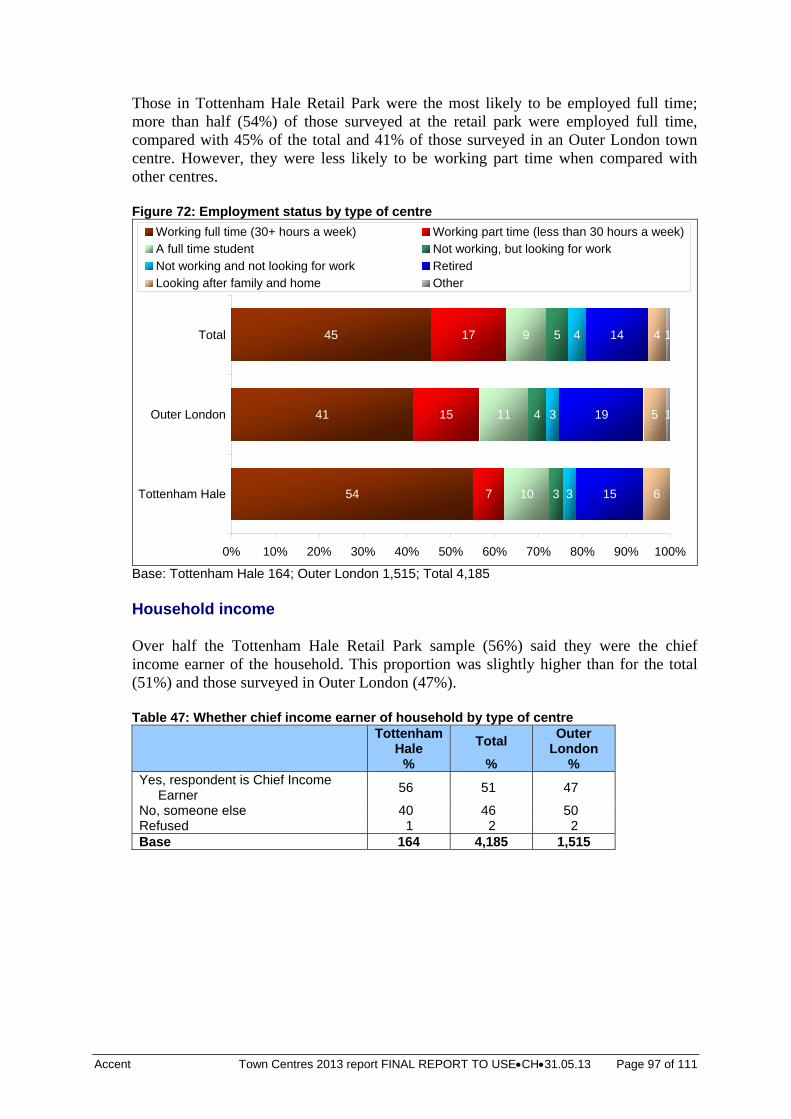
Accent Town Centres 2013 report FINAL REPORT TO USECH31.05.13 Page 97 of 111
Those in Tottenham Hale Retail Park were the most likely to be employed full time; more than half (54%) of those surveyed at the retail park were employed full time, compared with 45% of the total and 41% of those surveyed in an Outer London town centre. However, they were less likely to be working part time when compared with other centres. Figure 72: Employment status by type of centre
54
41
45
7
15
17
10
11
9
3
4
5
3
3
4
15
19
14
6
5
4
1
1
0% 10% 20% 30% 40% 50% 60% 70% 80% 90% 100%
Tottenham Hale
Outer London
Total
Working full time (30+ hours a week) Working part time (less than 30 hours a week)A full time student Not working, but looking for workNot working and not looking for work RetiredLooking after family and home Other
Base: Tottenham Hale 164; Outer London 1,515; Total 4,185 Household income Over half the Tottenham Hale Retail Park sample (56%) said they were the chief income earner of the household. This proportion was slightly higher than for the total (51%) and those surveyed in Outer London (47%). Table 47: Whether chief income earner of household by type of centre Tottenham
Hale Total
Outer London
% % % Yes, respondent is Chief Income
Earner 56 51 47
No, someone else 40 46 50 Refused 1 2 2 Base 164 4,185 1,515
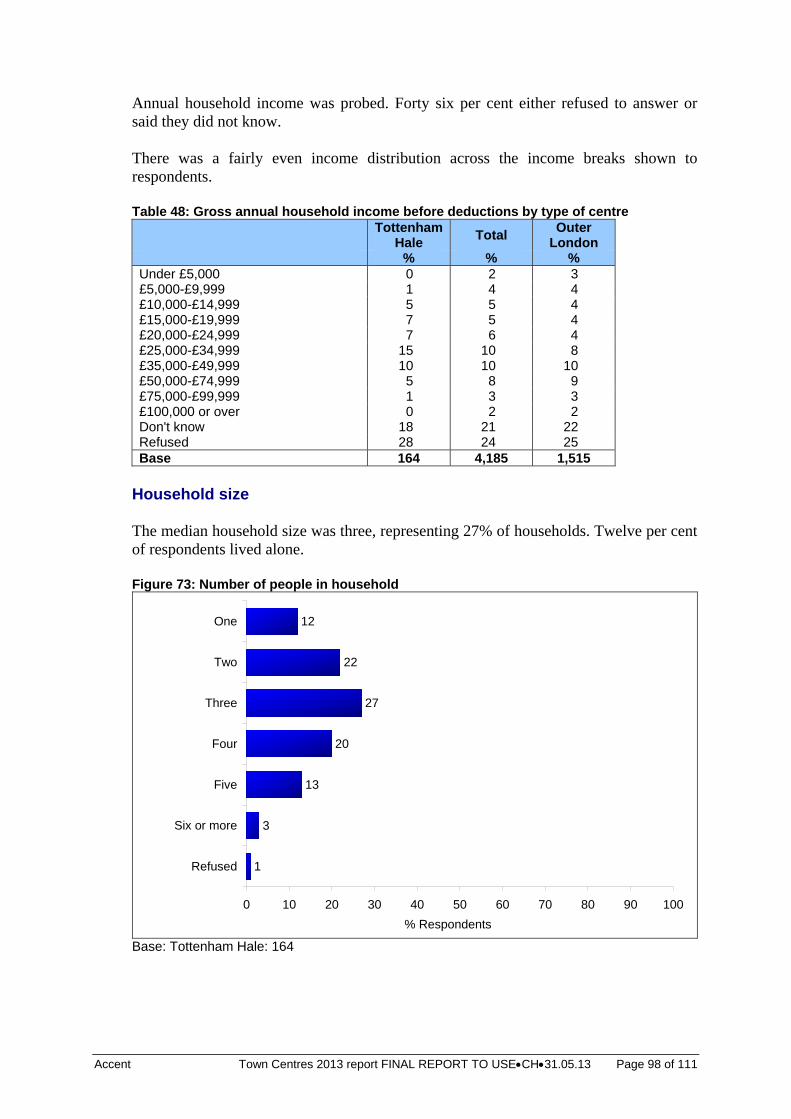
Accent Town Centres 2013 report FINAL REPORT TO USECH31.05.13 Page 98 of 111
Annual household income was probed. Forty six per cent either refused to answer or said they did not know. There was a fairly even income distribution across the income breaks shown to respondents. Table 48: Gross annual household income before deductions by type of centre Tottenham
Hale Total
Outer London
% % % Under £5,000 0 2 3 £5,000-£9,999 1 4 4 £10,000-£14,999 5 5 4 £15,000-£19,999 7 5 4 £20,000-£24,999 7 6 4 £25,000-£34,999 15 10 8 £35,000-£49,999 10 10 10 £50,000-£74,999 5 8 9 £75,000-£99,999 1 3 3 £100,000 or over 0 2 2 Don't know 18 21 22 Refused 28 24 25 Base 164 4,185 1,515
Household size The median household size was three, representing 27% of households. Twelve per cent of respondents lived alone. Figure 73: Number of people in household
1
3
13
20
27
22
12
0 10 20 30 40 50 60 70 80 90 100
Refused
Six or more
Five
Four
Three
Two
One
% Respondents
Base: Tottenham Hale: 164
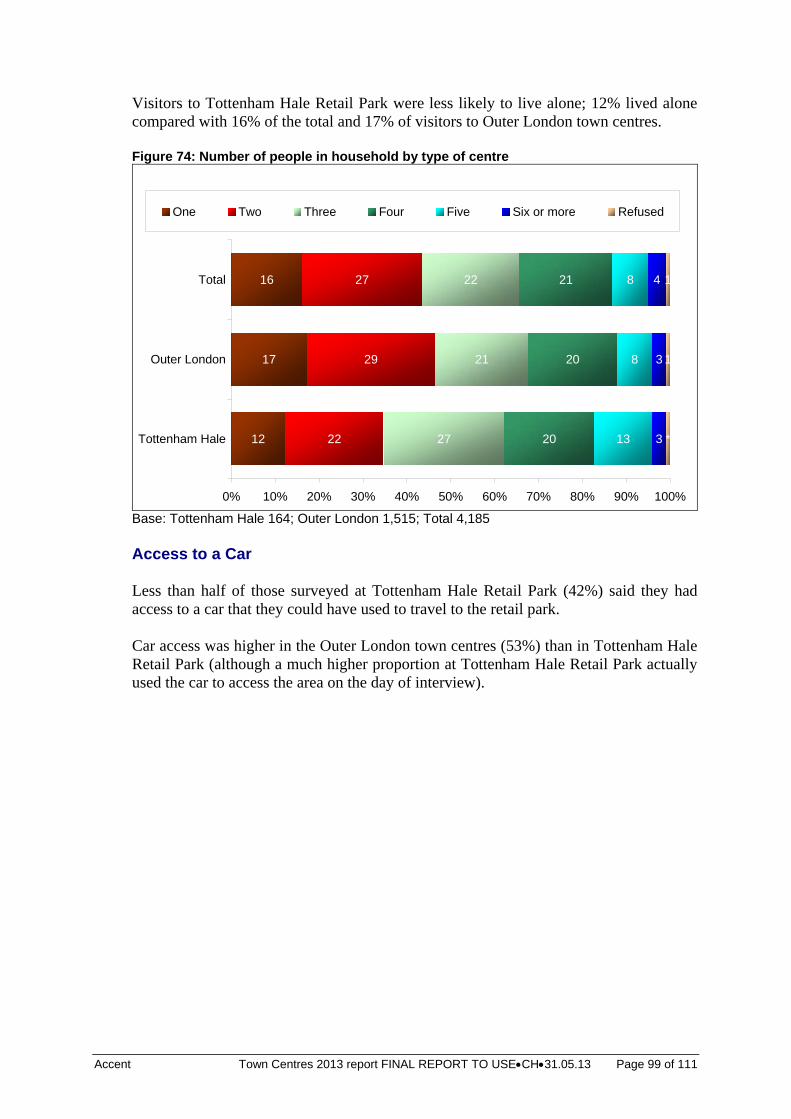
Accent Town Centres 2013 report FINAL REPORT TO USECH31.05.13 Page 99 of 111
Visitors to Tottenham Hale Retail Park were less likely to live alone; 12% lived alone compared with 16% of the total and 17% of visitors to Outer London town centres. Figure 74: Number of people in household by type of centre
12
17
16
22
29
27
27
21
22
20
20
21
13
8
8
3
3
4
1
1
*
0% 10% 20% 30% 40% 50% 60% 70% 80% 90% 100%
Tottenham Hale
Outer London
Total
One Two Three Four Five Six or more Refused
Base: Tottenham Hale 164; Outer London 1,515; Total 4,185 Access to a Car Less than half of those surveyed at Tottenham Hale Retail Park (42%) said they had access to a car that they could have used to travel to the retail park. Car access was higher in the Outer London town centres (53%) than in Tottenham Hale Retail Park (although a much higher proportion at Tottenham Hale Retail Park actually used the car to access the area on the day of interview).
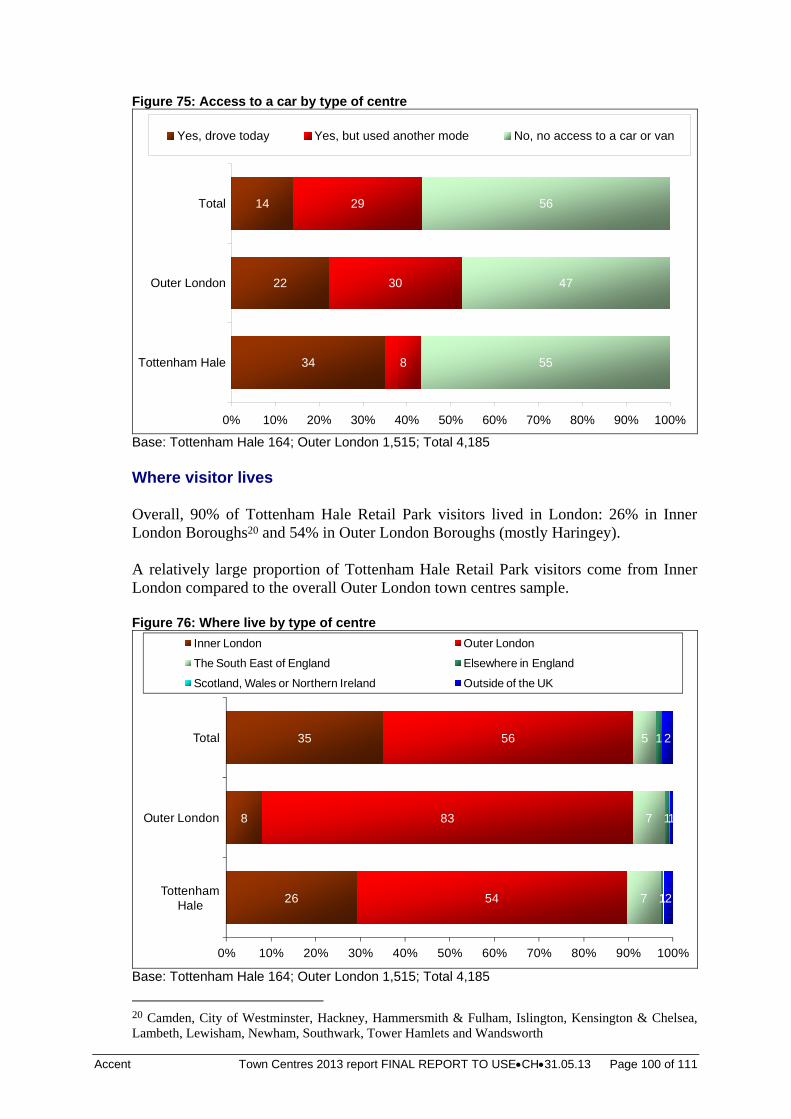
Accent Town Centres 2013 report FINAL REPORT TO USECH31.05.13 Page 100 of 111
Figure 75: Access to a car by type of centre
34
22
14
8
30
29
55
47
56
0% 10% 20% 30% 40% 50% 60% 70% 80% 90% 100%
Tottenham Hale
Outer London
Total
Yes, drove today Yes, but used another mode No, no access to a car or van
Base: Tottenham Hale 164; Outer London 1,515; Total 4,185 Where visitor lives Overall, 90% of Tottenham Hale Retail Park visitors lived in London: 26% in Inner London Boroughs20 and 54% in Outer London Boroughs (mostly Haringey). A relatively large proportion of Tottenham Hale Retail Park visitors come from Inner London compared to the overall Outer London town centres sample. Figure 76: Where live by type of centre
26
8
35
54
83
56
7
7
5
1
1
1
2
1
2
0% 10% 20% 30% 40% 50% 60% 70% 80% 90% 100%
Tottenham Hale
Outer London
Total
Inner London Outer London
The South East of England Elsewhere in England
Scotland, Wales or Northern Ireland Outside of the UK
Base: Tottenham Hale 164; Outer London 1,515; Total 4,185
20 Camden, City of Westminster, Hackney, Hammersmith & Fulham, Islington, Kensington & Chelsea, Lambeth, Lewisham, Newham, Southwark, Tower Hamlets and Wandsworth
Accent Town Centres 2013 report FINAL REPORT TO USECH31.05.13 Page 101 of 111
Physical and Mental Impairments Eight per cent of the Tottenham Hale Retail Park sample had a long-term physical or mental disability which limits daily activities or work they could do. Table 49: Long term physical or other impairment which limits daily activities or the work that can be done, including problems due to age by type of centre Tottenham
Hale Total
Outer London
% % % No, none 92 93 91 Mobility impairment 4 4 6 Visual impairment 0 1 1 Hearing impairment 2 1 1 Learning disability 1 * 1 Mental health condition 0 1 1 Serious long term illness 2 1 1 Other 0 * 1 Base 164 4,171 1,507
* = less than 0.5% One per cent of the Tottenham Hale Retail Park sample uses a wheelchair, the same proportion as in Outer London. Less than 0.5% of the overall sample do so. Ninety five per cent found it easy or very easy to move around the area. Table 50: Ease of moving around the area Tottenham
Hale Total
Outer London
% % % very easy 72 63 71 easy 23 32 23 neither easy nor difficult 2 3 3 difficult 3 2 1 very difficult 0 0 0 Base 164 4,171 1,507
Whether carrying anything Over half of the Tottenham Hale Retail Park visitors were carrying shopping bags or using a shopping trolley (56%) and 7% had a buggy or pram. Table 51: Whether respondent carrying anything Tottenham
Hale Total
Outer London
% % % Shopping bag(s)/shopping trolley 56 55 57 Buggy/pram 7 2 3 Carrying a child/baby 3 1 1 Suitcase/rucksack 1 7 6 Other large/awkward object 1 1 1 Nothing 38 37 36 Base 164 4,171 1,507
Accent Town Centres 2013 report FINAL REPORT TO USECH31.05.13 Page 102 of 111
5. HACKNEY
5.1 Introduction
At Hackney town centre, because of the planned pedestrianisation of Narrow Way leading to the rerouting of some buses some additional research was undertaken. This comprised: A booster of 150 interviews to the visitor survey and some additional questions Fifteen interviews with retail and catering outlet managers in the town centre An interview with the Town Centre Manager. The key findings of these are reported on below. It should be noted that ‘after’ surveys are planned for the Autumn of 2013 and the key interest will be in the change of behaviour and attitudes following the pedestrianisation of Narrow Way. Therefore, much the reporting for this stage is mainly to highlight existing behaviours and attitudes.
5.2 Visitor Survey Additional Questions
The data on Hackney town centre visitors is subsumed within the main findings in Chapter 3 with town centre specific data shown in Appendix B. There were some additional questions for Hackney town centre respondents which were intended to focus on the impact of the pedestrianisation of Narrow Way specifically with respect to access by bus users. These are: For bus users:
bus number used Which stop got off at Satisfaction with the amount of time it took to walk from the bus stop to where
you wanted to go today’ Which roads visited or planned to visit.
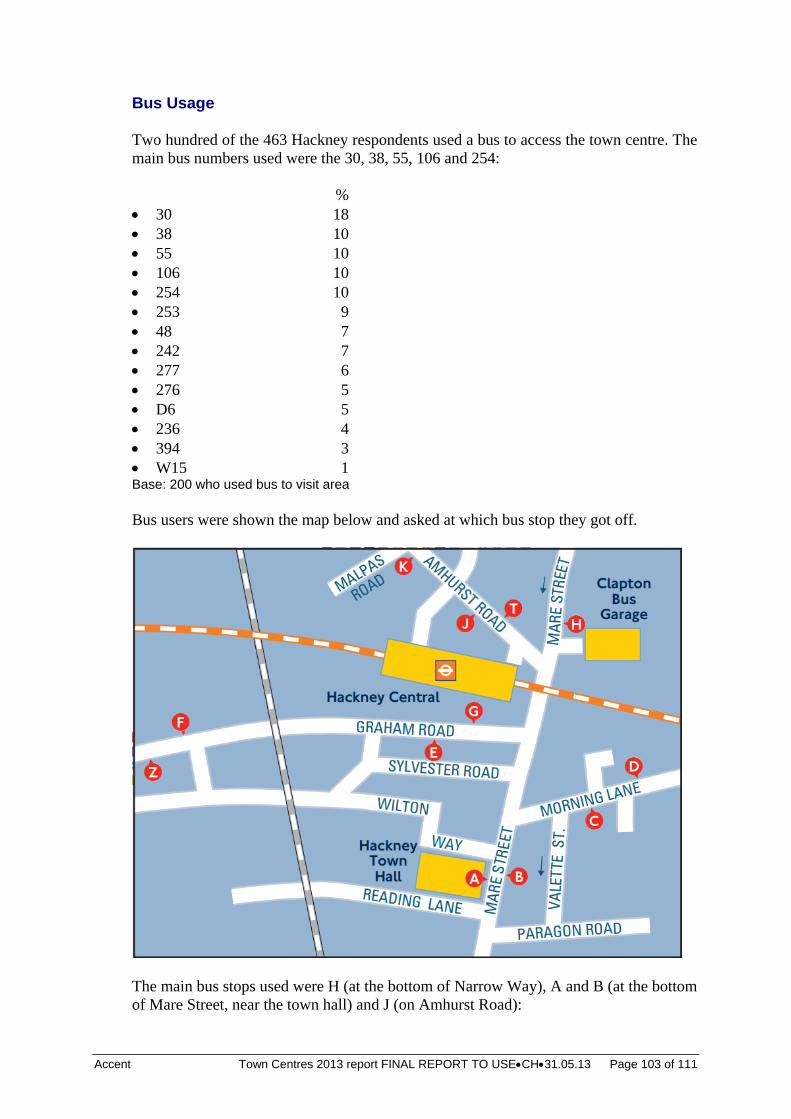
Accent Town Centres 2013 report FINAL REPORT TO USECH31.05.13 Page 103 of 111
Bus Usage Two hundred of the 463 Hackney respondents used a bus to access the town centre. The main bus numbers used were the 30, 38, 55, 106 and 254: % 30 18 38 10 55 10 106 10 254 10 253 9 48 7 242 7 277 6 276 5 D6 5 236 4 394 3 W15 1 Base: 200 who used bus to visit area Bus users were shown the map below and asked at which bus stop they got off.
The main bus stops used were H (at the bottom of Narrow Way), A and B (at the bottom of Mare Street, near the town hall) and J (on Amhurst Road):
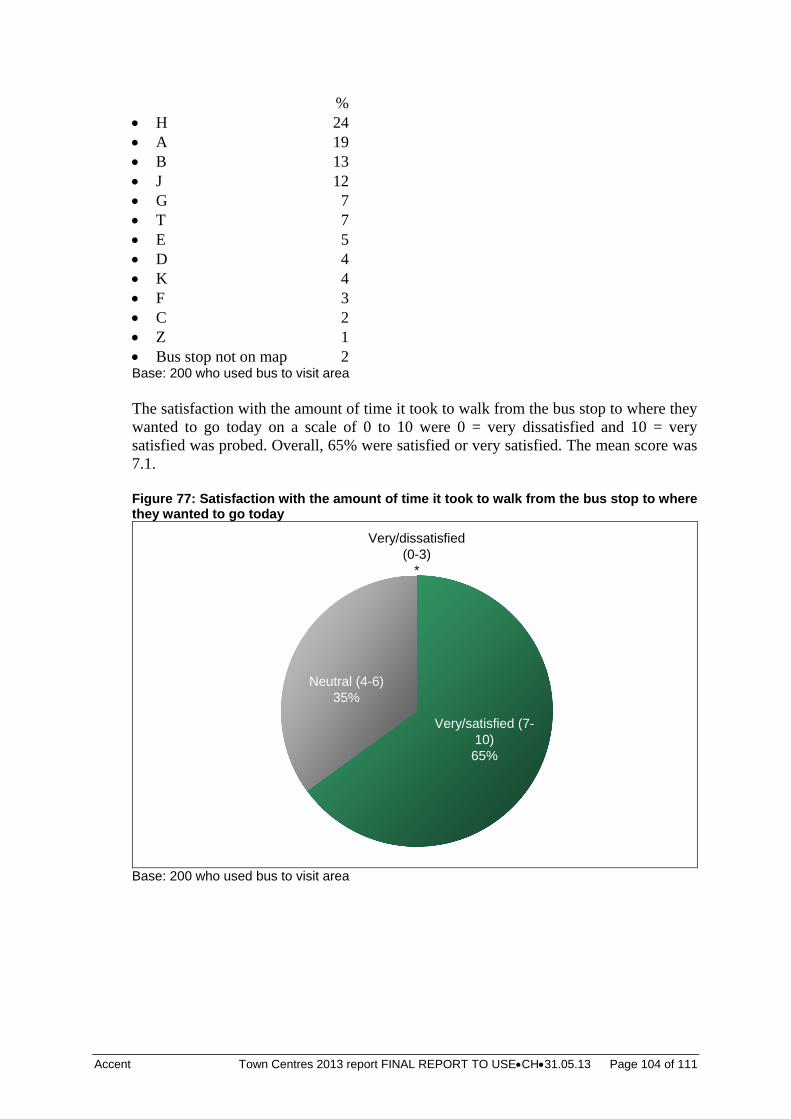
Accent Town Centres 2013 report FINAL REPORT TO USECH31.05.13 Page 104 of 111
% H 24 A 19 B 13 J 12 G 7 T 7 E 5 D 4 K 4 F 3 C 2 Z 1 Bus stop not on map 2 Base: 200 who used bus to visit area The satisfaction with the amount of time it took to walk from the bus stop to where they wanted to go today on a scale of 0 to 10 were 0 = very dissatisfied and 10 = very satisfied was probed. Overall, 65% were satisfied or very satisfied. The mean score was 7.1. Figure 77: Satisfaction with the amount of time it took to walk from the bus stop to where they wanted to go today
Neutral (4-6)35%
Very/satisfied (7-10)65%
Very/dissatisfied (0-3)
*
Base: 200 who used bus to visit area
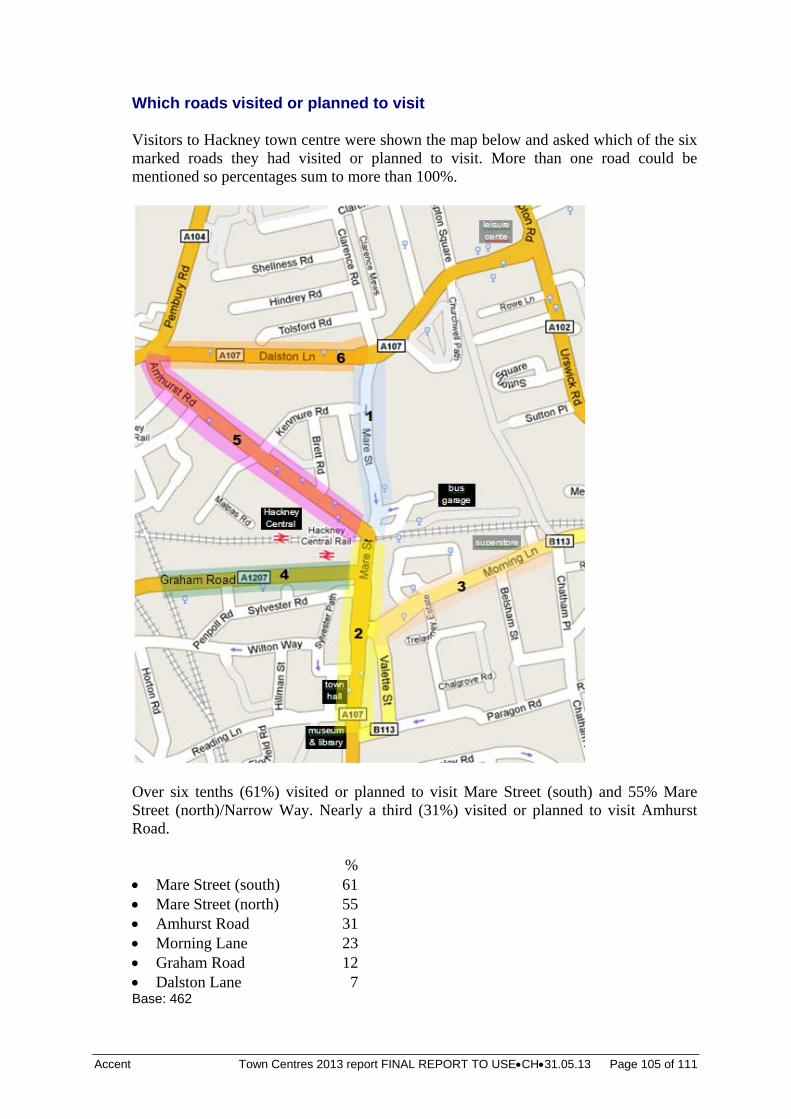
Accent Town Centres 2013 report FINAL REPORT TO USECH31.05.13 Page 105 of 111
Which roads visited or planned to visit Visitors to Hackney town centre were shown the map below and asked which of the six marked roads they had visited or planned to visit. More than one road could be mentioned so percentages sum to more than 100%.
Over six tenths (61%) visited or planned to visit Mare Street (south) and 55% Mare Street (north)/Narrow Way. Nearly a third (31%) visited or planned to visit Amhurst Road. % Mare Street (south) 61 Mare Street (north) 55 Amhurst Road 31 Morning Lane 23 Graham Road 12 Dalston Lane 7 Base: 462
Accent Town Centres 2013 report FINAL REPORT TO USECH31.05.13 Page 106 of 111
5.3 Business Interviews
Fifteen interviews were undertaken face-to-face with managers of retail and catering establishments in Mare Street (both the northern part ‘Narrow Way’ and the southern part). This section sets out the key findings from those interviews. As the sample size is only fifteen we show numbers and not percents. Nature of Business Eight interviews were conducted with managers of catering establishments while the remaining seven interviews were conducted with retail managers. Eleven out of the 15 establishments at which interviews were conducted at, had less than ten employees. Sole trader 1 2 – 4 4 5 – 9 6 10 – 20 2 20+ 2 Five establishments had been at their address in Hackney for ten years or more and a further five had been based at their address for between five and ten years. Two businesses had only been at their current address for less than one year. Less than 1 year 2 1 to 2 years 2 2 to 5 years 1 5 to 10 years 5 10 to 20 years 4 Over 21 years 1 Access The majority of respondents thought that ‘most’ of their customers travelled to the area by bus or on foot. Ten respondents thought that ‘most’ customers travelled to the area by bus while seven thought that ‘most’ would travel by foot (ie they live and/or work locally). Nearly all respondents thought that ‘very few’ customers would travel to the area by car while eight respondents thought that ‘very few’ would arrive by bicycle. Table 52: How customers travel to the area Most Some Very Few None Car 0 1 14 0 Bus 10 5 0 0 Bicycle 0 3 8 4 On foot 7 6 2 0 None of the establishments at which interviews were conducted had off street parking for customers, staff, deliveries or visitors.
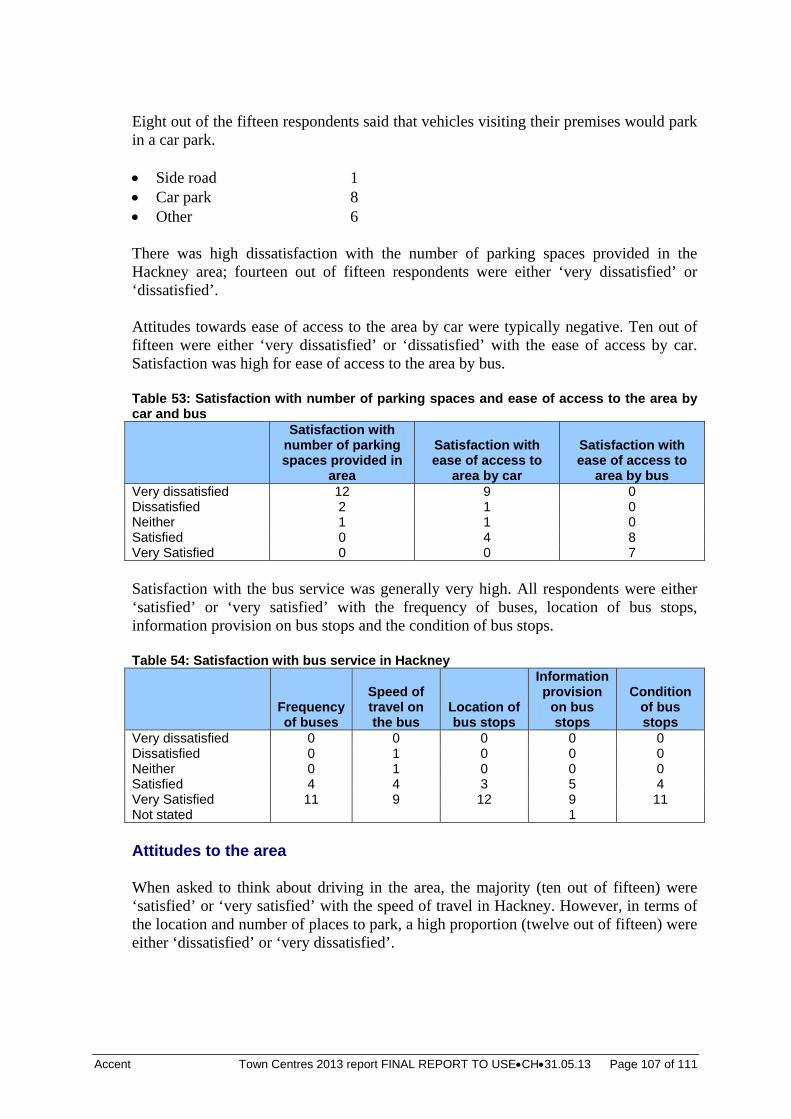
Accent Town Centres 2013 report FINAL REPORT TO USECH31.05.13 Page 107 of 111
Eight out of the fifteen respondents said that vehicles visiting their premises would park in a car park. Side road 1 Car park 8 Other 6 There was high dissatisfaction with the number of parking spaces provided in the Hackney area; fourteen out of fifteen respondents were either ‘very dissatisfied’ or ‘dissatisfied’. Attitudes towards ease of access to the area by car were typically negative. Ten out of fifteen were either ‘very dissatisfied’ or ‘dissatisfied’ with the ease of access by car. Satisfaction was high for ease of access to the area by bus. Table 53: Satisfaction with number of parking spaces and ease of access to the area by car and bus
Satisfaction with number of parking spaces provided in
area
Satisfaction with ease of access to
area by car
Satisfaction with ease of access to
area by bus Very dissatisfied 12 9 0 Dissatisfied 2 1 0 Neither 1 1 0 Satisfied 0 4 8 Very Satisfied 0 0 7 Satisfaction with the bus service was generally very high. All respondents were either ‘satisfied’ or ‘very satisfied’ with the frequency of buses, location of bus stops, information provision on bus stops and the condition of bus stops. Table 54: Satisfaction with bus service in Hackney
Frequency of buses
Speed of travel on the bus
Location of bus stops
Information provision
on bus stops
Condition of bus stops
Very dissatisfied 0 0 0 0 0 Dissatisfied 0 1 0 0 0 Neither 0 1 0 0 0 Satisfied 4 4 3 5 4 Very Satisfied 11 9 12 9 11 Not stated 1 Attitudes to the area When asked to think about driving in the area, the majority (ten out of fifteen) were ‘satisfied’ or ‘very satisfied’ with the speed of travel in Hackney. However, in terms of the location and number of places to park, a high proportion (twelve out of fifteen) were either ‘dissatisfied’ or ‘very dissatisfied’.
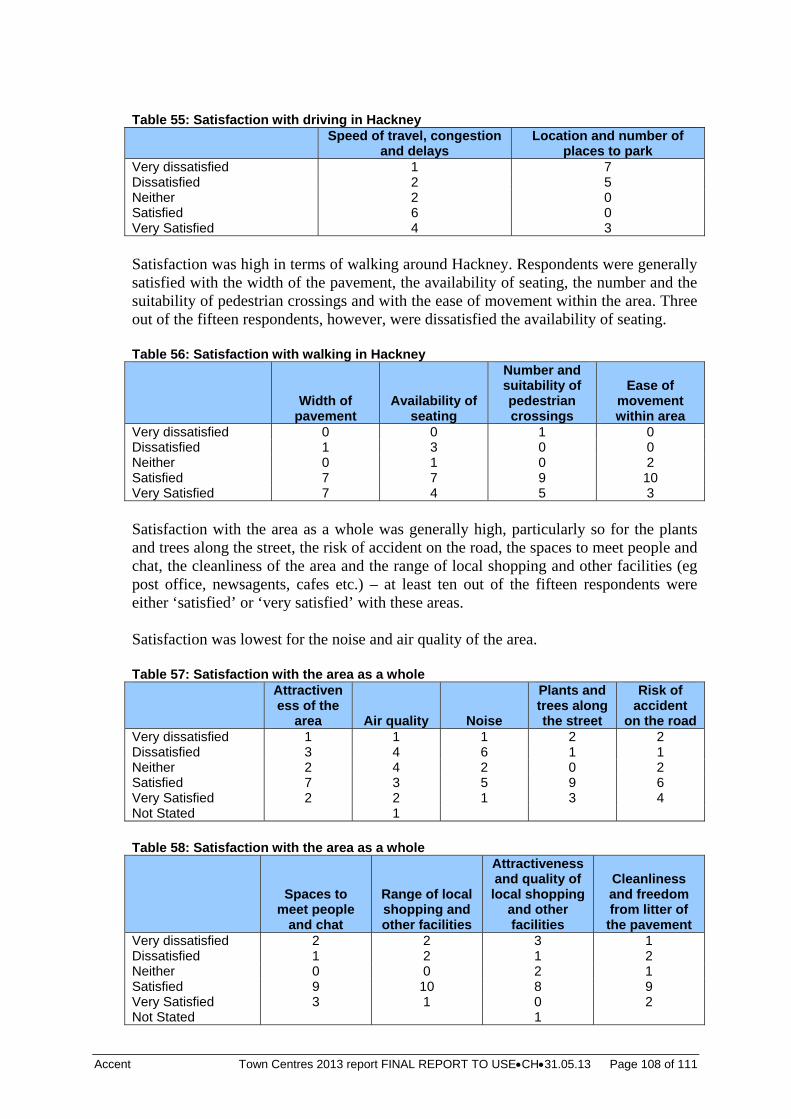
Accent Town Centres 2013 report FINAL REPORT TO USECH31.05.13 Page 108 of 111
Table 55: Satisfaction with driving in Hackney
Speed of travel, congestion and delays
Location and number of places to park
Very dissatisfied 1 7 Dissatisfied 2 5 Neither 2 0 Satisfied 6 0 Very Satisfied 4 3 Satisfaction was high in terms of walking around Hackney. Respondents were generally satisfied with the width of the pavement, the availability of seating, the number and the suitability of pedestrian crossings and with the ease of movement within the area. Three out of the fifteen respondents, however, were dissatisfied the availability of seating. Table 56: Satisfaction with walking in Hackney
Width of pavement
Availability of seating
Number and suitability of pedestrian crossings
Ease of movement within area
Very dissatisfied 0 0 1 0 Dissatisfied 1 3 0 0 Neither 0 1 0 2 Satisfied 7 7 9 10 Very Satisfied 7 4 5 3 Satisfaction with the area as a whole was generally high, particularly so for the plants and trees along the street, the risk of accident on the road, the spaces to meet people and chat, the cleanliness of the area and the range of local shopping and other facilities (eg post office, newsagents, cafes etc.) – at least ten out of the fifteen respondents were either ‘satisfied’ or ‘very satisfied’ with these areas. Satisfaction was lowest for the noise and air quality of the area. Table 57: Satisfaction with the area as a whole
Attractiveness of the
area Air quality Noise
Plants and trees along the street
Risk of accident
on the road Very dissatisfied 1 1 1 2 2 Dissatisfied 3 4 6 1 1 Neither 2 4 2 0 2 Satisfied 7 3 5 9 6 Very Satisfied 2 2 1 3 4 Not Stated 1 Table 58: Satisfaction with the area as a whole
Spaces to meet people
and chat
Range of local shopping and other facilities
Attractiveness and quality of local shopping
and other facilities
Cleanliness and freedom from litter of the pavement
Very dissatisfied 2 2 3 1 Dissatisfied 1 2 1 2 Neither 0 0 2 1 Satisfied 9 10 8 9 Very Satisfied 3 1 0 2 Not Stated 1
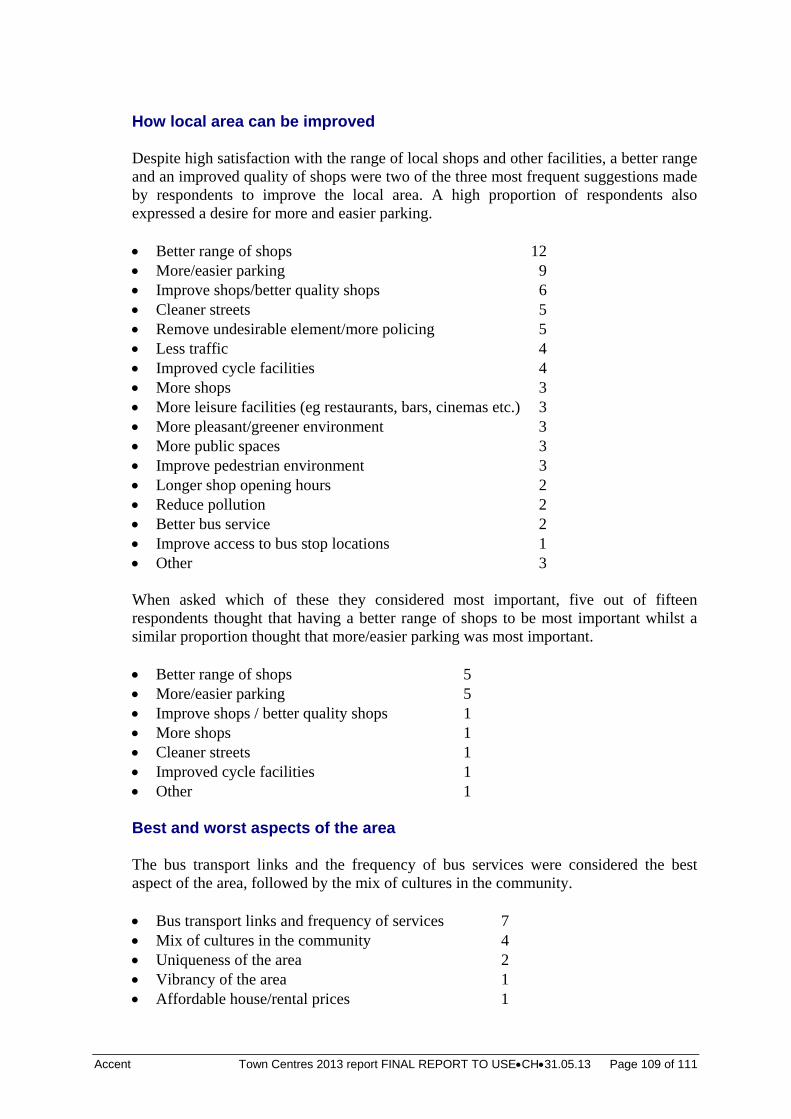
Accent Town Centres 2013 report FINAL REPORT TO USECH31.05.13 Page 109 of 111
How local area can be improved Despite high satisfaction with the range of local shops and other facilities, a better range and an improved quality of shops were two of the three most frequent suggestions made by respondents to improve the local area. A high proportion of respondents also expressed a desire for more and easier parking. Better range of shops 12 More/easier parking 9 Improve shops/better quality shops 6 Cleaner streets 5 Remove undesirable element/more policing 5 Less traffic 4 Improved cycle facilities 4 More shops 3 More leisure facilities (eg restaurants, bars, cinemas etc.) 3 More pleasant/greener environment 3 More public spaces 3 Improve pedestrian environment 3 Longer shop opening hours 2 Reduce pollution 2 Better bus service 2 Improve access to bus stop locations 1 Other 3 When asked which of these they considered most important, five out of fifteen respondents thought that having a better range of shops to be most important whilst a similar proportion thought that more/easier parking was most important. Better range of shops 5 More/easier parking 5 Improve shops / better quality shops 1 More shops 1 Cleaner streets 1 Improved cycle facilities 1 Other 1 Best and worst aspects of the area The bus transport links and the frequency of bus services were considered the best aspect of the area, followed by the mix of cultures in the community. Bus transport links and frequency of services 7 Mix of cultures in the community 4 Uniqueness of the area 2 Vibrancy of the area 1 Affordable house/rental prices 1
Accent Town Centres 2013 report FINAL REPORT TO USECH31.05.13 Page 110 of 111
The mix of cultures in the community was considered the second best aspect of the area. Mix of cultures in the community 5 Affordable house/rental prices 2 Attractiveness of the area 2 Vibrancy of the area 1 Range and quality of shops and businesses 1 Bus transport links and frequency of services 1 Ease of movement on foot 1 None 1 Six out of fifteen respondents thought the risk of crime (both day and night) was the worst aspect of the area. Personal security - risk of crime (day and night) 6 Attractiveness of area 1 Range and quality of shops and businesses 1 Safety from traffic when crossing road 1 Other 5 None 1
5.4 An interview with the Town Centre Manager
The town centre manager for Hackney, Hannah Dalgleish, was interviewed to ascertain her views on the town centre as a whole and specifically on the impacts of the proposed pedestrianisation. The interview was conducted by telephone on 10 April 2013. The town centre manager was responsible for: the private sector development in the town coordinating the development and regeneration within the town centre delivering a series of projects to support the regeneration of the town. She was happy with the bus service and the train provision –the introduction of the London Overground service had worked very well including the provision of a lift in the station. The only people she doesn’t think were well provided for were cyclists – they were currently cycling the wrong way up Mare Street. So an extension of the Cycle Superhighway would be appreciated. She said there was a lack of parking facilities for cars. Currently there were only 30 car parking spaces. She didn’t know whether it was expensive or cheap to park. They were currently considering opening the Town Hall car park at weekends for car parking.
Accent Town Centres 2013 report FINAL REPORT TO USECH31.05.13 Page 111 of 111
Pedestrianisation of Narrow Way was mentioned unprompted within five minutes of the interview starting. She said it was being trialled in June for six months. Her view was that if footfall increases or remains static it will remain. She said it was being trialled in order to reduce congestion and the high levels of air pollution caused by buses. All the chain shops supported it – independents were split with several quite opposed to it. However, bus stops were only being moved 25 metres down the road so it was not that significant. The pedestrianised area would be encouraged to have cafes with space outside for people to sit down. It should become a much nicer area. Also cyclists should be allowed to cycle down each side. She stressed it was a trial and they would have to wait and see the results of it. She felt that the area was well served by public transport – plenty of buses and good coverage. She would like more Countdown signs at bus stops though as there were currently only a few.

APPENDIX A
Paper Version of Questionnaire
Interviewer name: Interviewer no: Date: Time:
Introduction I am conducting a survey on behalf of Transport for London on travel to this area and use of the town centre. Could you spare a few minutes to answer some questions please? Any answer you give will be treated in confidence in accordance with the Code of Conduct of the Market Research Society. Q1. Can I just check – do you or does anyone in your household work in any of the following
occupations? SHOWCARD 1 1 Advertising ............................................................... 1 THANK AND CLOSE 2 Journalism ................................................................ 1 THANK AND CLOSE 3 London Underground / London Transport / TfL ...... 1 THANK AND CLOSE 4 Market research ........................................................ 1 THANK AND CLOSE 5 None of the above
Q2. Have you, or will you, be using any of the shops or facilities in this area, or are you just passing through, for example on your way to work? 1. Yes, have/will be using shops/facilities 2. No, just passing through IF LOCATION = 11 CONTINUE; OTHERWISE THANK AND CLOSE
Q3. All the questions I am going to ask you refer to the area shown on this map. SHOW MAP Please look at this card and tell me which of these best describes your reasons for visiting this area on this occasion today? SHOWCARD 2. CODE ALL MENTIONED IN Q3 BELOW Q3 Q4
1 Shopping ........................................................................................ 1 ........... 1 2 Using service e.g. bank, post office, hairdresser, travel agent ........ 1 ........... 2 3 Using public amenity e.g. court, police station, library, hospital ... 1 ........... 3 4 Eating/drinking out ......................................................................... 1 ........... 4 5 Other social/leisure ........................................................................ 1 ........... 5 6 Buying petrol .................................................................................. 1 ........... 6 7 Delivering goods ............................................................................ 1 ........... 7 8 Window shopping .......................................................................... 1 ........... 8 9 Personal business e.g. job interview, church .................................. 1 ........... 9 10 General recreation .......................................................................... 1 ......... 10
11 Live here ......................................................................................... 1 ......... 11 12 Work here ....................................................................................... 1 ......... 12 13 Travelling through the area ............................................................ 1 ......... 13 14 Visiting friends and relatives .......................................................... 1 ......... 14 15 Dropping off/picking up friend or relative (incl. school) .............. 1 ......... 15 16 Other CODE AND WRITE IN ..................................................... 1 ......... 16
Q4. IF MORE THAN ONE MENTIONED IN Q3 ASK: And what is your ONE main reason for visiting this area on this occasion today? CODE ONE ACTIVITY IN COLUMN Q4 ABOVE
Details of visiting area Q5. SHOW MAP How often do you visit the area shown on this map?
1 5 or more days a week 6 About once a month 2 3 or 4 days a week 7 Less than once a month 3 2 days a week 8 First time 4 Once a week 9 Don’t know 5 Once a fortnight
Q6. Do you live or work within ten minutes walk of this area? 1 Live within 10 minutes walk 4 No, neither 2 Work within 10 minutes walk 5 Don’t know 3 Both
Town Centres Survey 2013
LOCATION: 1. Aldgate 9. Hounslow 2. Bethnal Green 10. Kingston 3. Bromley 11. Oxford Street/Regent Street 4. Ealing Broadway 12. Romford Town 5. Hackney 13. Shepherds Bush 6. Harlesden 14. Twickenham 7. Kingsland High Street 15. Wood Green 8. Hornchurch
EP: 1 2 3
AT LEAST ONE OF 1 – 10 MUST BE CODED UNLESS LOCATION IS OXFORD STREET/REGENT STREET WHERE 11 AND 12 CAN ALSO BE ONLY CODE
Mode of transport Q7. How did you travel to this area today? PROBE FOR MAIN METHOD. CODE ONE ONLY
1 Drove a car / van / lorry 7 Train 2 Drove a motorbike / moped / scooter 8 Bicycle 3 Drove a delivery vehicle 9 Barclays Cycle Hire 4 Given a lift 10 Walked 5 Bus 11 Taxi / minicab 6 Tube / Underground 12 Other WRITE IN ………………………….
Q7B IF Q7= 5 (BUS) AND LOCATION = 5 (HACKNEY) Which bus number did you use? 1 30 8 253 2 38 9 254 3 48 10 276 4 55 11 277 5 106 12 394 6 236 13 D6 7 242 14 W15 15 Other WRITE IN ………………………….
Q7C IF Q7 = 5 (BUS) AND LOCATION = 5 (HACKNEY) Which stop did you get off at? SHOW HACKNEY BUSES SHOWCARD 1 A 7 G 2 B 8 H 3 C 9 J 4 D 10 T 5 E 11 K 6 F 12 Z 13 Bus top not on map
Q7D IF LOCATION = 5 (HACKNEY) Which of the roads on this map have you visited or do you plan to visit today? SHOW HACKNEY ROAD MAP. CODE ALL MENTIONED 1 Mare Street (north) 4 Graham Road 2 Mare Street (south) 5 Amhurst Road 3 Morning Lane 6 Dalston Lane
Q8. How frequently do you use [MODE OF TRANSPORT ATQ7] to travel to this area? 1 5 or more days a week 6 About once a month 2 3 or 4 days a week 7 Less than once a month 3 2 days a week 8 First time 4 Once a week 9 Don’t know 5 Once a fortnight
Q9. What other modes do you use to travel to this area? MULTICODE 1 Car / van / lorry 6 Bicycle 2 Motorbike / moped / scooter 7 Barclays Cycle Hire 3 Bus 8 Walk all the way 4 Tube / Underground 9 Taxi / minicab 5 Train 10 Other WRITE IN ………………………….
Q10. IF BUS AT Q7 ASK: How would you rate the following aspects of your journey by bus today? SHOWCARD 3. TICK START AND ROTATE. READ OUT
extremely extremely dissatisfied satisfied
1 Length of time waited for the bus .......... 0 1 2 3 4 5 6 7 8 9 10 2 Comfort of journey ................................ 0 1 2 3 4 5 6 7 8 9 10 3 Value for money .................................... 0 1 2 3 4 5 6 7 8 9 10 4 Ease of getting on and off the bus .......... 0 1 2 3 4 5 6 7 8 9 10 5 Level of crowding on the bus ................. 0 1 2 3 4 5 6 7 8 9 10 6 Length of time the journey took ............. 0 1 2 3 4 5 6 7 8 9 10 7 Convenience of the bus stops ................. 0 1 2 3 4 5 6 7 8 9 10 8 Waiting facilities at the bus stop ............ 0 1 2 3 4 5 6 7 8 9 10 IF Q7 = 5 (BUS) AND LOCATION = 5 (HACKNEY) 9 The amount of time it took to walk from the bus stop
to where you wanted to go today’ .......... 0 1 2 3 4 5 6 7 8 9 10
Q11. ASK ALL Which of the reasons on this card describe why you decided to use …. (MODE OF TRANSPORT USED AT Q7) rather than any other method of transport? SHOWCARD 4. CODE ALL MENTIONED UNDER Q11 Q11 Q12
1 Cheaper/less expensive ...................................... 1 ........... 1 2 Quicker ............................................................... 1 ........... 2 3 More direct ......................................................... 1 ........... 3 4 Had heavy bags/shopping to carry ..................... 1 ........... 4 5 Travelling with children ..................................... 1 ........... 5 6 More relaxing/comfortable ................................. 1 ........... 6 7 Easier/more convenient ...................................... 1 ........... 7 8 Safer ................................................................... 1 ........... 8 9 Avoids parking difficulties ................................. 1 ........... 9 10 Going to more than one place ............................ 1 ......... 10 11 Only method possible ........................................ 1 ......... 11 12 Live very close by .............................................. 1 ......... 12 13 Need/enjoy exercise/healthy............................... 1 ......... 13 14 No car/can’t drive ............................................... 1 ......... 14 15 Weather issues .................................................... 1 ......... 15 16 Avoid the congestion charge .............................. 1 ......... 16 17 Don’t know ........................................................ 1 ......... 17 18 Other (PLEASE WRITE IN) ............................ 1 ......... 18 …………………………………………………………………
Q12. IF MORE THAN ONE ANSWER AT Q11 ASK And which ONE reason best describes why you decided to use that method? Circle code in column Q11 Above for one reason only
Q13. ASK ALL How frequently do you travel by bus in this area? 1 5 or more days a week 6 About once a month 2 3 or 4 days a week 7 Less than once a month 3 2 days a week 8 First time 4 Once a week 9 Never 5 Once a fortnight 10 Don’t know
Q14. How frequently did you travel by bus in this area 12 months ago? 1 5 or more days a week 6 About once a month 2 3 or 4 days a week 7 Less than once a month 3 2 days a week 8 First time 4 Once a week 9 Not at all/never 5 Once a fortnight 10 Don’t know
Q15. Which of the things shown on this card would encourage you to use buses more often in this area? SHOWCARD 5. PROBE. CODE ALL MENTIONED UNDER Q15
Q15 Q16 1 Nothing GO TO Q17 ............................................................ 1 2 More regular / frequent buses ................................................ 1 ........... 2 3 More reliable buses ................................................................ 1 ........... 3 4 Faster journey ........................................................................ 1 ........... 4 5 Direct bus route ...................................................................... 1 ........... 5 6 Greater priority given to buses ............................................... 1 ........... 6 7 Reduce number of cars on the road / less congestion ............ 1 ........... 7 8 Stricter enforcement of illegal parking in bus lanes ............... 1 ........... 8 9 More seats on buses / less crowded buses .............................. 1 ........... 9 10 More comfortable journey ..................................................... 1 ......... 10 11 More shelters at bus stops ...................................................... 1 ......... 11 12 More seating at bus stops ....................................................... 1 ......... 12 13 Bus stop nearer home/destination .......................................... 1 ......... 13 14 Improved ease of getting on and off buses ............................. 1 ......... 14 15 More information about buses ............................................... 1 ......... 15 16 Safer buses ............................................................................. 1 ......... 16 17 Make children behave/school buses ....................................... 1 ......... 17 18 Cleaner buses ......................................................................... 1 ......... 18 19 Greener buses ......................................................................... 1 ......... 19 20 Lower fares ............................................................................ 1 ......... 20 21 Other (PLEASE WRITE IN) ................................................ 1 ......... 21
Q16. IF MORE THAN ONE ANSWER AT Q15 ASK And which ONE change would be most likely to encourage you to use buses more? SHOWCARD 5 CIRCLE ONE CODE IN COLUMN Q16 ABOVE FOR ONE REASON ONLY
Q17. How strongly do you agree or disagree with each of the following statements about this area? SHOWCARD 6. TICK START AND ROTATE. READ OUT
strongly strongly disagree agree
1 There should be more bus lanes ............ 0 1 2 3 4 5 6 7 8 9 10
2 There should be stricter enforcement of illegal parking in bus lanes ................ 0 1 2 3 4 5 6 7 8 9 10
3 Taxis should not be allowed in bus lanes....................................................................................................................................................................................................................................................................................................................................................................................................................................................................................................................................................................................................................................................................................... 0 1 2 3 4 5 6 7 8 9 10
3 Goods vehicles should not be allowed in bus lanes ............................... 0 1 2 3 4 5 6 7 8 9 10
4 Buses should be given priority at traffic lights ........................................ 0 1 2 3 4 5 6 7 8 9 10
5 Bus stops are conveniently located ........ 0 1 2 3 4 5 6 7 8 9 10
6 Bus lanes are of benefit to cyclists ......... 0 1 2 3 4 5 6 7 8 9 10 Q18.
Q17B Have you used any pedestrian information signs in this area today? 1 Yes 2 No GO TO Q18B
Q17C How easy did you find it to use the signs? 1 very easy 4 difficult 2 easy 5 very difficult 3 neither easy nor difficult
Q17D Was the information on the signs helpful? 1 Yes 2. No
Q18B How safe do you feel in this neighbourhood during the day? 1 Very safe 4 Very unsafe 2 Fairly safe 5 Never go out in the day 3 A bit unsafe
Q18C How safe do you feel in this neighbourhood during the evening/after dark? 1 Very safe 4 Very unsafe 2 Fairly safe 5 Never go out in the evening 3 A bit unsafe
Q18E In the past year, would you say you have seen more, less or about the same amount of uniformed police officers (that is, police men and women and Police Community Support Officers) in this local neighbourhood? 1 More 3 Less 2 About the same 4 Don’t know
Q18F IF CYCLIST (Q7 = 8 OR 9 OR Q9 = 6 OR 7) ASK: How safe do you feel when cycling in this neighbourhood? 1 Very safe 3 A bit unsafe 2 Fairly safe 4 Very unsafe
Q19. Which of the things shown on this card would encourage you to cycle more often in this area? SHOWCARD 7. CODE ALL MENTIONED
1 (More) cycle lanes on the roads .......................................... 1 2 (More) dedicated cycle paths .............................................. 1 3 Less road traffic .................................................................. 1 4 Free on-road cycle training ................................................. 1 5 Bicycle hire scheme ............................................................ 1 6 (Better) bicycle parking facilities in this area ..................... 1 7 (Better) bicycle parking facilities at / near your home ........ 1 8 None of these / nothing ....................................................... 1 9 Don’t know ......................................................................... 1
Q20.
1 on map 3 don’t know 2 off map
Q21. ASK IF DROVE OR WAS GIVEN LIFT (Q7 CODES 1-4), OTHERWISE GO TO Q23 Where did you park your vehicle? Was it… READ OUT 1 Off street residential parking 5 On main road 9 Don’t know 2 Off street private parking (eg driveway) 6 On side road 3 Off street municipal/NCP car park 7 In filling station forecourt 4 In store/pub/take-away car park 8 Other place
Q22. How satisfied are you with each of the following: SHOWCARD 8. READ OUT extremely extremely dissatisfied satisfied
1 The number of parking spaces provided in this area? ............................. 0 1 2 3 4 5 6 7 8 9 10
2 The ease of access to this area by car? .. 0 1 2 3 4 5 6 7 8 9 10
Shopping and expenditure in the area Q23. Could you look at this card and tell me the range of things you are shopping for or services you are
using in this area today? SHOWCARD 9. CODE ALL MENTIONED 1 Food/groceries ......................................................................................... 1 2 Take-away food ....................................................................................... 1 3 Wine, beer, spirits ................................................................................... 1 4 Clothing or footwear ............................................................................... 1 5 Confectionery, tobacco, newspapers ....................................................... 1 6 Stationery/books/CDs/DVDs/leisure goods ............................................ 1 7 Pharmaceuticals/toiletries ....................................................................... 1 8 Luxury goods .......................................................................................... 1 9 Major household goods ........................................................................... 1 10 Other household goods (eg electrical goods) .......................................... 1 11 Travel Pass/mobile top up/phonecard ..................................................... 1 12 Services (e.g. hairdresser, dry cleaners, Post Office, travel agent) ........ 1 13 Eating in a café or restaurant ................................................................... 1 14 Having a drink in a pub or wine bar ........................................................ 1 15 Going to cinema, theatre, concert, leisure facility etc ............................. 1 16 Other (PLEASE WRITE IN) ................................................................ 1
Q24. How much will you have spent in this area today? SHOWCARD 10 1 Nothing 6 £15-£19.99 11 £100-£149.99 2 Under £1 7 £20-£29.99 12 £150-£199.99 3 £1-£4.99 8 £30-£49.99 13 £200+ 4 £5-£9.99 9 £50-£74.99 14 Don’t know 5 £10-£14.99 10 £75-£99.99 15 Refused
Q25. How much do you typically spend on average per visit to this area? SHOWCARD 10 1 Nothing 6 £15-£19.99 11 £100-£149.99 2 Under £1 7 £20-£29.99 12 £150-£199.99 3 £1-£4.99 8 £30-£49.99 13 £200+ 4 £5-£9.99 9 £50-£74.99 14 Don’t know 5 £10-£14.99 10 £75-£99.99 15 Refused
Q26. How long will you spend in this area today altogether? 1 Under 5 minutes 4 30-59 minutes 7 Don’t know 2 5-14 minutes 5 1-3 hours 3 15-29 minutes 6 More than 3 hours
Q27. In what ways do you think this area could be improved? SHOW MAP. CODE ALL MENTIONED IN COLUMN A BELOW. SHOWCARD 11
Q28. Which of these would be the most important reason? PROBE FOR MOST IMPORTANT AND CODE IN 1ST COLUMN A 1ST
1 More shops......................................................................................... 1 1 2 Better range of shops ......................................................................... 2 2 3 Improve shops / better quality shops ................................................. 3 3 4 Longer shop opening hours ................................................................ 4 4 5 More leisure facilities e.g. restaurants, bars, cinemas etc .................. 5 5 6 More pleasant/greener environment .................................................. 6 6
7 Cleaner streets .................................................................................... 7 7 8 Reduce pollution ................................................................................ 8 8 9 More public spaces ............................................................................ 9 9 10 Remove undesirable element/more policing .................................... 10 10 11 Less traffic ....................................................................................... 11 11 12 High street should be pedestrianised ................................................ 12 12 13 Improve pedestrian environment ..................................................... 13 13 14 More/easier parking ......................................................................... 14 14 15 Better bus service ............................................................................. 15 15 16 Improve access to bus stop locations ............................................... 16 16 17 Improved cycle facilities .................................................................. 17 17 18 Other ............................................................................................... 18 18 19 Nothing ............................................................................................ 19 20 Don’t know ...................................................................................... 20 20
Oxford Street/Regent Street only – others go to Q29A QX1 Why are you visiting this area – the Oxford Street area – today, rather than going somewhere else?
1 Oxford Street is best shopping area ................................................ 1 2 Visiting a particular shop ............................................................... 1 3 More / better / bigger range of shops .............................................. 1 4 Longer shop opening hours ............................................................ 1 5 Visiting a particular leisure facility ................................................ 1 6 More leisure facilities, e.g. restaurants, bars, cinemas etc .............. 1 7 Visiting other places in London as well ......................................... 1 8 As a ‘day out’ / ‘trip into town’ ...................................................... 1 9 To do something different / special ................................................ 1 10 Had to be in central London for other reason ................................. 1 11 Meeting people here ....................................................................... 1 12 Good public transport ..................................................................... 1 13 Easy for me to travel to and from ................................................... 1 14 Easy for other people to travel to and from .................................... 1 15 Live near here ................................................................................. 1 16 Work near here .............................................................................. 1 17 Other WRITE IN …………………………. .................................. 1 18 No particular reason ....................................................................... 1
QX2 Were you aware that there are a number of changes to travel around Tottenham Court Road, with diversions to some bus services and changes to walking and cycling routes? 1 Yes 2 No GO TO QX6 3 Don’t know GO TO QX6
QX3 Do you know the reason for these diversions and travel changes around Tottenham Court Road? DO NOT PROMPT. CODE ALL MENTIONED
1 Building works (unspecified) ............................. 1 2 Utility works (e.g. electricity, gas, water) .......... 1 3 Transport works (unspecified)............................ 1 4 Improving Underground station ......................... 1 5 Building rail / Crossrail station .......................... 1 6 Improving bus facilities / bus routes .................. 1 7 Improving road layout / better roads .................. 1 8 Improving cycle facilities ................................... 1 9 Improving pavements / pedestrian facilities ....... 1 10 New shops / shopping centre development ........ 1 11 Other answer(s) .................................................. 1 12 No / Don’t know ................................................. 1
QX6 Have you used the diagonal crossing at Oxford Circus? 1 Yes 2 No GO TO Q29A 3 Don’t know GO TO Q29A
QX7 How satisfied are you with each of the following aspects of the diagonal crossing at Oxford Circus: SHOWCARD 12. READ OUT
extremely extremely dissatisfied satisfied
The ease of crossing the road? ....................... 0 1 2 3 4 5 6 7 8 9 10 The safety of crossing the road? .................... 0 1 2 3 4 5 6 7 8 9 10
DO NOT PROMPT. CODE ALL MENTIONED
All Q29A Do you go to any of these shopping centres in and around London? SHOWCARD 13. CODE ALL
MENTIONED 1 No ....................................................................... 1 2 Aylesham Shopping Centre ............................... 1 3 Bluewater ........................................................... 1 4 Brent Cross ......................................................... 1 5 Canary Wharf ..................................................... 1 6 Croydon .............................................................. 1 7 Elephant & Castle .............................................. 1 8 Lakeside ............................................................. 1 9 Victoria Place ..................................................... 1 10 Westfield White City .......................................... 1 11 Westfield Stratford ............................................. 1 12 Whiteleys ........................................................... 1
Q29B If you live in a London borough, which one do you live in? 1 Barking & Dagenham 2 Barnet 3 Bexley 4 Brent 5 Bromley 6 Camden 7 City of Westminster 8 Croydon 9 Ealing 10 Enfield 11 Greenwich 12 Hackney
13 Hammersmith & Fulham 14 Haringey 15 Harrow 16 Havering 17 Hillingdon 18 Hounslow 19 Islington 20 Kensington & Chelsea 21 Kingston-upon-Thames 22 Lambeth 23 Lewisham 24 Merton
25 Newham 26 Redbridge 27 Richmond-upon-Thames 28 Southwark 29 Sutton 30 Tower Hamlets 31 Waltham Forest 32 Wandsworth 33 Do not live in London GO TO Q29C 34 Don’t know 35 Refused
Q29C ASK IF DOES NOT LIVE IN LONDON BOROUGH: Do you live in … READ OUT 1 The South East of England 4 Outside of the UK 2 Elsewhere in England 5 Don’t know 3 Scotland, Wales or Northern Ireland 6 Refused
Q29D Do you do internet shopping? 1 Yes 2 No GO TO Q30
Q29E What kind of goods do you shop for online? SHOWCARD 14, CODE ALL MENTIONED 1 Food/groceries .................................................... 1 2 Wine, beer, spirits .............................................. 1 3 Clothing or footwear .......................................... 1 4 Books/CDs/DVDs/leisure goods ........................ 1 5 Luxury goods ..................................................... 1 6 Major household goods ...................................... 1 7 Other household goods (eg electrical goods) ..... 1 8 Take-way food ................................................... 1 9 Tickets (air, rail, concerts) .................................. 1
Classification Q29.
Q30. Do you have any long term physical or other impairment which limits your daily activities or the work you can do, including problems due to age? SHOWCARD 15, CODE ALL MENTIONED
1 No, none ............................................................. 1 2 Mobility impairment ......................................... 1 3 Visual impairment .............................................. 1 4 Hearing impairment ........................................... 1 5 Learning disability ............................................ 1 6 Mental health condition ...................................... 1 7 Serious long term illness ................................... 1 8 Other WRITE IN .............................................. 1 9 Refused ............................................................... 1
Q30A How easy did you find moving around this area? 1 very easy 4 difficult 2 easy 5 very difficult 3 neither easy nor difficult
Q31. Do you use a wheelchair for travelling? 1 Yes 3 Refused 2 No
Q32. Is the respondent carrying any of the following…? CODE BY OBSERVATION 1 Shopping bag(s) / shopping trolley 4 Suitcase / rucksack 2 Buggy / pram 5 Other large / awkward object 3 Carrying a child / baby 6 Nothing
Q33. Finally, I would like to ask you some questions about yourself. This is for classification purposes only. The personal information you provide during this survey will be kept confidential by Accent and will not be disclosed to third parties. It will be used by Accent only for this study, which is being undertaken for Transport for London. Which of the following age groups do you fall into? SHOWCARD 16 1 16-24 4 45-54 7 65-74 2 25-34 5 55-59 8 75 or over 3 35-44 6 60-64 9 refused
Q34. RECORD GENDER 1 Male 2 Female
Q35. Which of the following best describes your working status? SHOWCARD 17 1 Working full time (30+ hours a week) 6 Not working and not looking for work 2 Working part time (less than 30 hours a week) 7 Retired 3 A full time student 8 Looking after family and home 4 A part time student 9 Other 5 Not working, but looking for work 10 Refused
Q36. To which of these ethnic groups do you consider you belong? SHOWCARD 18 1 White 4. Mixed 7. Refused 2 Asian or Asian British 5. Chinese or Other Ethnic Group 3 Black or Black British 6. Don’t know
Q37. How many people are there in your household, including yourself? 1 One 4 Four 7 Refused 2 Two 5 Five 3 Three 6 Six or more
Q38. Do you have access to a car or van that you could have used for your journey to this area today? 1 Yes, drove today 3 No – no access to a car or van 2 Yes, but used another mode 4 Refused
Q39. Are you the chief income earner your household? That is the person with the largest income whether from employment pensions, state benefits, investments or any other sources (if equal income is claimed for 2 or more people, refer to the eldest) 1 Yes, respondent is Chief Income Earner 3 Refused 2 No, someone else
Q40. What is your total gross annual household income? This is income from work and any other sources such as benefits and pensions, before deductions e.g. income tax, National Insurance. SHOWCARD 19 1 Under £5,000 5 £20,000 to £24,999 9 £75,000 to £99,999 2 £5,000 to £9,999 6 £25,000 to £34,999 10 £100,000 or over 3 £10,000 to £14,999 7 £35,000 to £49,999 11 Don’t know 4 £15,000 to £19,999 8 £50,000 to £74,999 12 Refused
Q41. Thank you very much for taking part in this survey. If necessary may we recontact you about this study? 1 Yes 2 No
Q42. Transport for London may be carrying out further research about transport in London. Would it be OK for a research company working on their behalf to contact you again in the future for research purposes? 1 Yes 2 No
This research was conducted under the terms of the MRS code of conduct and is completely confidential. If you would like to confirm my credentials or those of Accent Marketing & Research please call the MRS free on 0500 396999. HAND OVER THE THANK YOU SLIP.
Please can I take a note of your name and where we can contact you for quality control purposes?
Respondent name: .................................................................................................................
Telephone: home: .............................................. work: ............................................... Thank you I confirm that this interview was conducted under the terms of the MRS code of conduct and is completely confidential
Interviewer’s signature: .................................................................................................................

APPENDIX B
Key Results by Town Centre
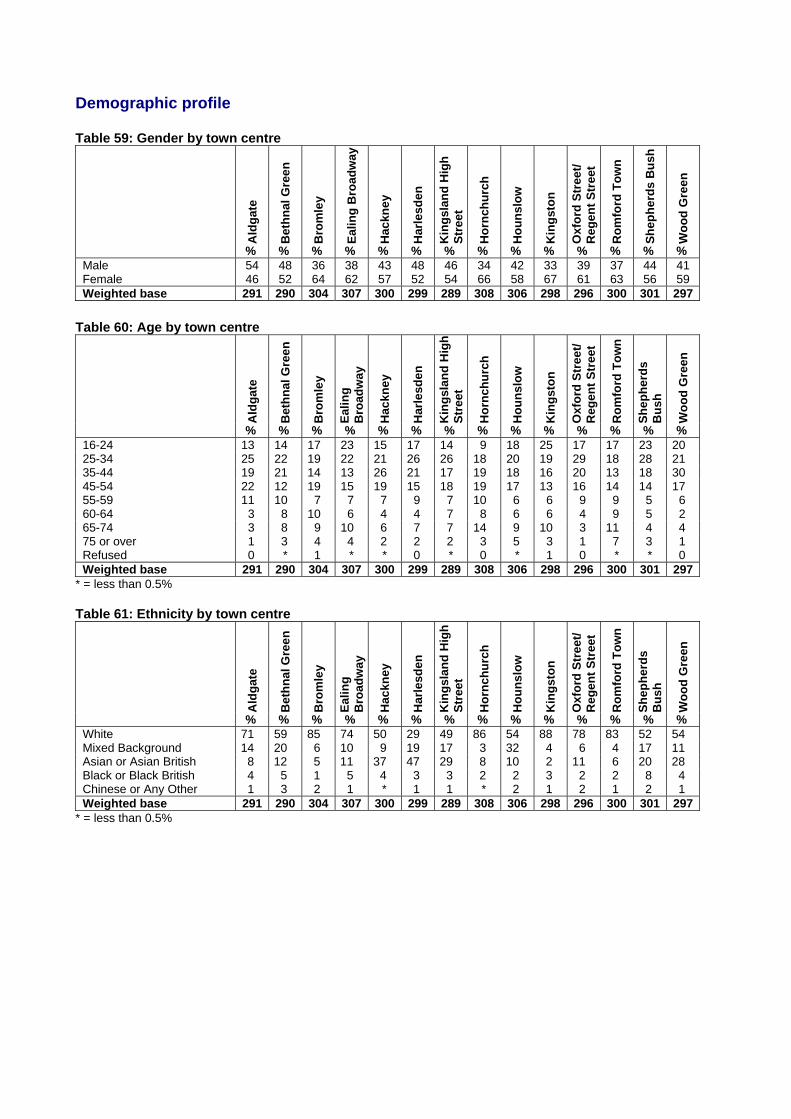
Demographic profile Table 59: Gender by town centre
Ald
gat
e
Bet
hn
al G
ree
n
Bro
mle
y
Eal
ing
Bro
adw
ay
Hac
kney
Har
lesd
en
Kin
gsl
and
Hig
h
Str
eet
Ho
rnch
urc
h
Ho
un
slo
w
Kin
gst
on
Oxf
ord
Str
eet/
R
egen
t S
tree
t
Ro
mfo
rd T
ow
n
Sh
eph
erd
s B
ush
Wo
od
Gre
en
% % % % % % % % % % % % % %Male 54 48 36 38 43 48 46 34 42 33 39 37 44 41 Female 46 52 64 62 57 52 54 66 58 67 61 63 56 59 Weighted base 291 290 304 307 300 299 289 308 306 298 296 300 301 297
Table 60: Age by town centre
Ald
gat
e
Bet
hn
al G
ree
n
Bro
mle
y
Eal
ing
B
road
way
Hac
kney
Har
lesd
en
Kin
gsl
and
Hig
h
Str
eet
Ho
rnch
urc
h
Ho
un
slo
w
Kin
gst
on
Oxf
ord
Str
eet/
R
egen
t S
tree
t
Ro
mfo
rd T
ow
n
Sh
eph
erd
s B
ush
Wo
od
Gre
en
% % % % % % % % % % % % % %16-24 13 14 17 23 15 17 14 9 18 25 17 17 23 20 25-34 25 22 19 22 21 26 26 18 20 19 29 18 28 21 35-44 19 21 14 13 26 21 17 19 18 16 20 13 18 30 45-54 22 12 19 15 19 15 18 19 17 13 16 14 14 17 55-59 11 10 7 7 7 9 7 10 6 6 9 9 5 6 60-64 3 8 10 6 4 4 7 8 6 6 4 9 5 2 65-74 3 8 9 10 6 7 7 14 9 10 3 11 4 4 75 or over 1 3 4 4 2 2 2 3 5 3 1 7 3 1 Refused 0 * 1 * * 0 * 0 * 1 0 * * 0 Weighted base 291 290 304 307 300 299 289 308 306 298 296 300 301 297
* = less than 0.5% Table 61: Ethnicity by town centre
Ald
gat
e
Bet
hn
al G
ree
n
Bro
mle
y
Eal
ing
B
road
way
Hac
kney
Har
lesd
en
Kin
gsl
and
Hig
h
Str
eet
Ho
rnch
urc
h
Ho
un
slo
w
Kin
gst
on
Oxf
ord
Str
eet/
R
egen
t S
tree
t
Ro
mfo
rd T
ow
n
Sh
eph
erd
s B
ush
Wo
od
Gre
en
% % % % % % % % % % % % % %White 71 59 85 74 50 29 49 86 54 88 78 83 52 54 Mixed Background 14 20 6 10 9 19 17 3 32 4 6 4 17 11 Asian or Asian British 8 12 5 11 37 47 29 8 10 2 11 6 20 28 Black or Black British 4 5 1 5 4 3 3 2 2 3 2 2 8 4 Chinese or Any Other 1 3 2 1 * 1 1 * 2 1 2 1 2 1 Weighted base 291 290 304 307 300 299 289 308 306 298 296 300 301 297
* = less than 0.5%
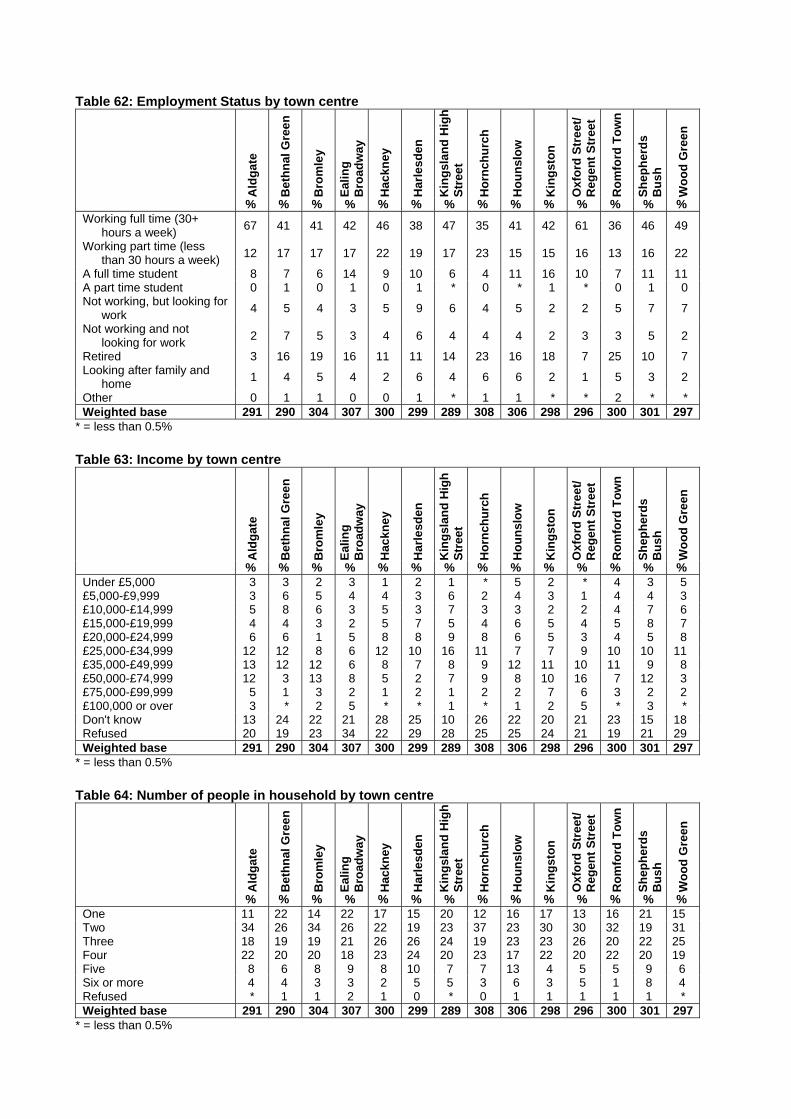
Table 62: Employment Status by town centre
Ald
gat
e
Bet
hn
al G
ree
n
Bro
mle
y
Eal
ing
B
road
way
Hac
kney
Har
lesd
en
Kin
gsl
and
Hig
h
Str
eet
Ho
rnch
urc
h
Ho
un
slo
w
Kin
gst
on
Oxf
ord
Str
eet/
R
egen
t S
tree
t
Ro
mfo
rd T
ow
n
Sh
eph
erd
s B
ush
Wo
od
Gre
en
% % % % % % % % % % % % % %Working full time (30+
hours a week) 67 41 41 42 46 38 47 35 41 42 61 36 46 49
Working part time (less than 30 hours a week)
12 17 17 17 22 19 17 23 15 15 16 13 16 22
A full time student 8 7 6 14 9 10 6 4 11 16 10 7 11 11 A part time student 0 1 0 1 0 1 * 0 * 1 * 0 1 0 Not working, but looking for
work 4 5 4 3 5 9 6 4 5 2 2 5 7 7
Not working and not looking for work
2 7 5 3 4 6 4 4 4 2 3 3 5 2
Retired 3 16 19 16 11 11 14 23 16 18 7 25 10 7 Looking after family and
home 1 4 5 4 2 6 4 6 6 2 1 5 3 2
Other 0 1 1 0 0 1 * 1 1 * * 2 * * Weighted base 291 290 304 307 300 299 289 308 306 298 296 300 301 297
* = less than 0.5%
Table 63: Income by town centre
Ald
gat
e
Bet
hn
al G
ree
n
Bro
mle
y
Eal
ing
B
road
way
Hac
kney
Har
lesd
en
Kin
gsl
and
Hig
h
Str
eet
Ho
rnch
urc
h
Ho
un
slo
w
Kin
gst
on
Oxf
ord
Str
eet/
R
egen
t S
tree
t
Ro
mfo
rd T
ow
n
Sh
eph
erd
s B
ush
Wo
od
Gre
en
% % % % % % % % % % % % % %Under £5,000 3 3 2 3 1 2 1 * 5 2 * 4 3 5 £5,000-£9,999 3 6 5 4 4 3 6 2 4 3 1 4 4 3 £10,000-£14,999 5 8 6 3 5 3 7 3 3 2 2 4 7 6 £15,000-£19,999 4 4 3 2 5 7 5 4 6 5 4 5 8 7 £20,000-£24,999 6 6 1 5 8 8 9 8 6 5 3 4 5 8 £25,000-£34,999 12 12 8 6 12 10 16 11 7 7 9 10 10 11 £35,000-£49,999 13 12 12 6 8 7 8 9 12 11 10 11 9 8 £50,000-£74,999 12 3 13 8 5 2 7 9 8 10 16 7 12 3 £75,000-£99,999 5 1 3 2 1 2 1 2 2 7 6 3 2 2 £100,000 or over 3 * 2 5 * * 1 * 1 2 5 * 3 * Don't know 13 24 22 21 28 25 10 26 22 20 21 23 15 18 Refused 20 19 23 34 22 29 28 25 25 24 21 19 21 29 Weighted base 291 290 304 307 300 299 289 308 306 298 296 300 301 297
* = less than 0.5%
Table 64: Number of people in household by town centre
Ald
gat
e
Bet
hn
al G
ree
n
Bro
mle
y
Eal
ing
B
road
way
Hac
kney
Har
lesd
en
Kin
gsl
and
Hig
h
Str
eet
Ho
rnch
urc
h
Ho
un
slo
w
Kin
gst
on
Oxf
ord
Str
eet/
R
egen
t S
tree
t
Ro
mfo
rd T
ow
n
Sh
eph
erd
s B
ush
Wo
od
Gre
en
% % % % % % % % % % % % % %One 11 22 14 22 17 15 20 12 16 17 13 16 21 15 Two 34 26 34 26 22 19 23 37 23 30 30 32 19 31 Three 18 19 19 21 26 26 24 19 23 23 26 20 22 25 Four 22 20 20 18 23 24 20 23 17 22 20 22 20 19 Five 8 6 8 9 8 10 7 7 13 4 5 5 9 6 Six or more 4 4 3 3 2 5 5 3 6 3 5 1 8 4 Refused * 1 1 2 1 0 * 0 1 1 1 1 1 * Weighted base 291 290 304 307 300 299 289 308 306 298 296 300 301 297
* = less than 0.5%
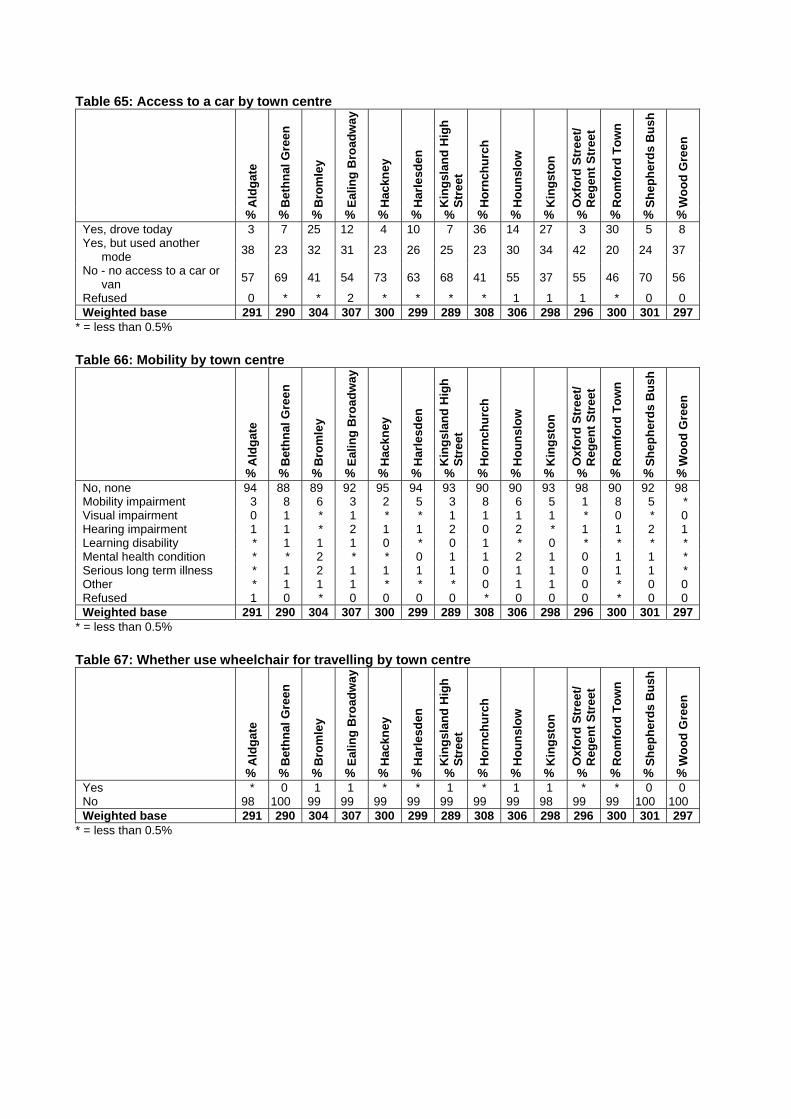
Table 65: Access to a car by town centre
Ald
gat
e
Bet
hn
al G
ree
n
Bro
mle
y
Eal
ing
Bro
adw
ay
Hac
kney
Har
lesd
en
Kin
gsl
and
Hig
h
Str
eet
Ho
rnch
urc
h
Ho
un
slo
w
Kin
gst
on
Oxf
ord
Str
eet/
R
egen
t S
tree
t
Ro
mfo
rd T
ow
n
Sh
eph
erd
s B
ush
Wo
od
Gre
en
% % % % % % % % % % % % % %Yes, drove today 3 7 25 12 4 10 7 36 14 27 3 30 5 8 Yes, but used another
mode 38 23 32 31 23 26 25 23 30 34 42 20 24 37
No - no access to a car or van
57 69 41 54 73 63 68 41 55 37 55 46 70 56
Refused 0 * * 2 * * * * 1 1 1 * 0 0 Weighted base 291 290 304 307 300 299 289 308 306 298 296 300 301 297
* = less than 0.5%
Table 66: Mobility by town centre
Ald
gat
e
Bet
hn
al G
ree
n
Bro
mle
y
Eal
ing
Bro
adw
ay
Hac
kney
Har
lesd
en
Kin
gsl
and
Hig
h
Str
eet
Ho
rnch
urc
h
Ho
un
slo
w
Kin
gst
on
Oxf
ord
Str
eet/
R
egen
t S
tree
t
Ro
mfo
rd T
ow
n
Sh
eph
erd
s B
ush
Wo
od
Gre
en
% % % % % % % % % % % % % %No, none 94 88 89 92 95 94 93 90 90 93 98 90 92 98 Mobility impairment 3 8 6 3 2 5 3 8 6 5 1 8 5 * Visual impairment 0 1 * 1 * * 1 1 1 1 * 0 * 0 Hearing impairment 1 1 * 2 1 1 2 0 2 * 1 1 2 1 Learning disability * 1 1 1 0 * 0 1 * 0 * * * * Mental health condition * * 2 * * 0 1 1 2 1 0 1 1 * Serious long term illness * 1 2 1 1 1 1 0 1 1 0 1 1 * Other * 1 1 1 * * * 0 1 1 0 * 0 0 Refused 1 0 * 0 0 0 0 * 0 0 0 * 0 0 Weighted base 291 290 304 307 300 299 289 308 306 298 296 300 301 297
* = less than 0.5% Table 67: Whether use wheelchair for travelling by town centre
Ald
gat
e
Bet
hn
al G
ree
n
Bro
mle
y
Eal
ing
Bro
adw
ay
Hac
kney
Har
lesd
en
Kin
gsl
and
Hig
h
Str
eet
Ho
rnch
urc
h
Ho
un
slo
w
Kin
gst
on
Oxf
ord
Str
eet/
R
egen
t S
tree
t
Ro
mfo
rd T
ow
n
Sh
eph
erd
s B
ush
Wo
od
Gre
en
% % % % % % % % % % % % % %Yes * 0 1 1 * * 1 * 1 1 * * 0 0 No 98 100 99 99 99 99 99 99 99 98 99 99 100 100 Weighted base 291 290 304 307 300 299 289 308 306 298 296 300 301 297
* = less than 0.5%
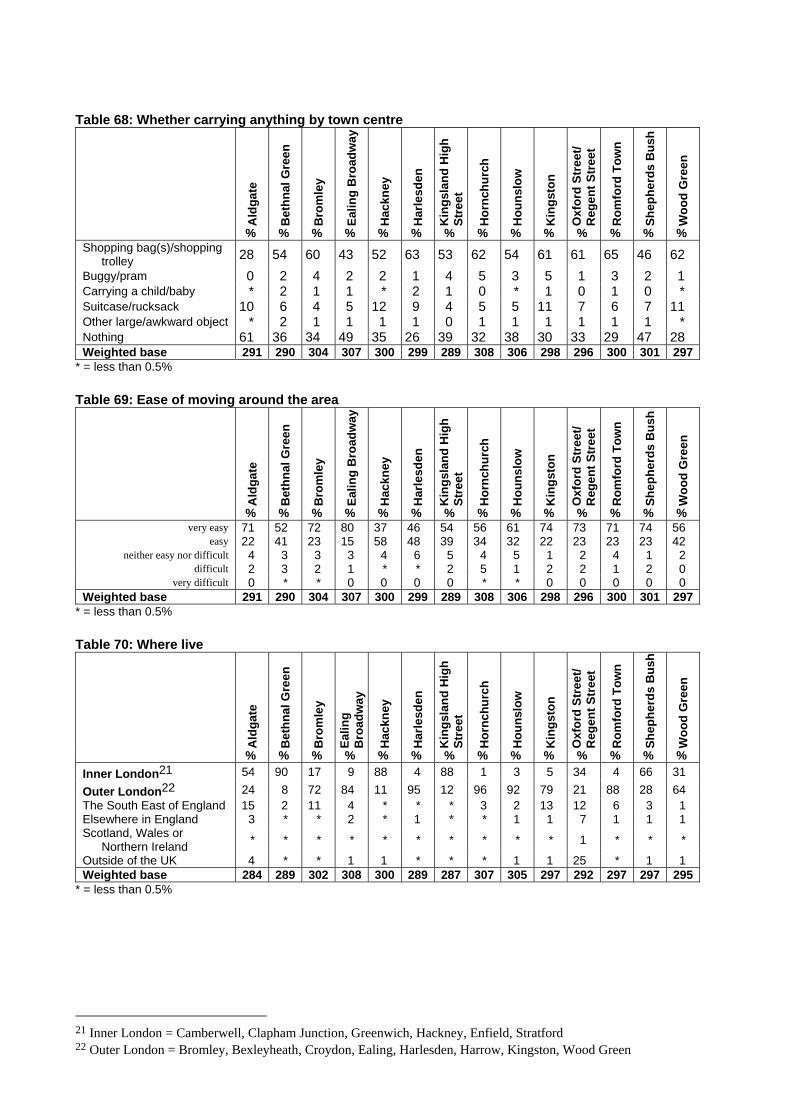
Table 68: Whether carrying anything by town centre
Ald
gat
e
Bet
hn
al G
ree
n
Bro
mle
y
Eal
ing
Bro
adw
ay
Hac
kney
Har
lesd
en
Kin
gsl
and
Hig
h
Str
eet
Ho
rnch
urc
h
Ho
un
slo
w
Kin
gst
on
Oxf
ord
Str
eet/
R
egen
t S
tree
t
Ro
mfo
rd T
ow
n
Sh
eph
erd
s B
ush
Wo
od
Gre
en
% % % % % % % % % % % % % %Shopping bag(s)/shopping
trolley 28 54 60 43 52 63 53 62 54 61 61 65 46 62
Buggy/pram 0 2 4 2 2 1 4 5 3 5 1 3 2 1 Carrying a child/baby * 2 1 1 * 2 1 0 * 1 0 1 0 * Suitcase/rucksack 10 6 4 5 12 9 4 5 5 11 7 6 7 11 Other large/awkward object * 2 1 1 1 1 0 1 1 1 1 1 1 * Nothing 61 36 34 49 35 26 39 32 38 30 33 29 47 28 Weighted base 291 290 304 307 300 299 289 308 306 298 296 300 301 297
* = less than 0.5% Table 69: Ease of moving around the area
Ald
gat
e
Bet
hn
al G
ree
n
Bro
mle
y
Eal
ing
Bro
adw
ay
Hac
kney
Har
lesd
en
Kin
gsl
and
Hig
h
Str
eet
Ho
rnch
urc
h
Ho
un
slo
w
Kin
gst
on
Oxf
ord
Str
eet/
R
egen
t S
tree
t
Ro
mfo
rd T
ow
n
Sh
eph
erd
s B
ush
Wo
od
Gre
en
% % % % % % % % % % % % % %very easy 71 52 72 80 37 46 54 56 61 74 73 71 74 56
easy 22 41 23 15 58 48 39 34 32 22 23 23 23 42 neither easy nor difficult 4 3 3 3 4 6 5 4 5 1 2 4 1 2
difficult 2 3 2 1 * * 2 5 1 2 2 1 2 0 very difficult 0 * * 0 0 0 0 * * 0 0 0 0 0
Weighted base 291 290 304 307 300 299 289 308 306 298 296 300 301 297* = less than 0.5% Table 70: Where live
Ald
gat
e
Bet
hn
al G
ree
n
Bro
mle
y
Eal
ing
B
road
way
Hac
kney
Har
lesd
en
Kin
gsl
and
Hig
h
Str
eet
Ho
rnch
urc
h
Ho
un
slo
w
Kin
gst
on
Oxf
ord
Str
eet/
R
egen
t S
tree
t
Ro
mfo
rd T
ow
n
Sh
eph
erd
s B
ush
Wo
od
Gre
en
% % % % % % % % % % % % % %
Inner London21 54 90 17 9 88 4 88 1 3 5 34 4 66 31
Outer London22 24 8 72 84 11 95 12 96 92 79 21 88 28 64 The South East of England 15 2 11 4 * * * 3 2 13 12 6 3 1 Elsewhere in England 3 * * 2 * 1 * * 1 1 7 1 1 1 Scotland, Wales or
Northern Ireland * * * * * * * * * * 1 * * *
Outside of the UK 4 * * 1 1 * * * 1 1 25 * 1 1 Weighted base 284 289 302 308 300 289 287 307 305 297 292 297 297 295
* = less than 0.5%
21 Inner London = Camberwell, Clapham Junction, Greenwich, Hackney, Enfield, Stratford 22 Outer London = Bromley, Bexleyheath, Croydon, Ealing, Harlesden, Harrow, Kingston, Wood Green
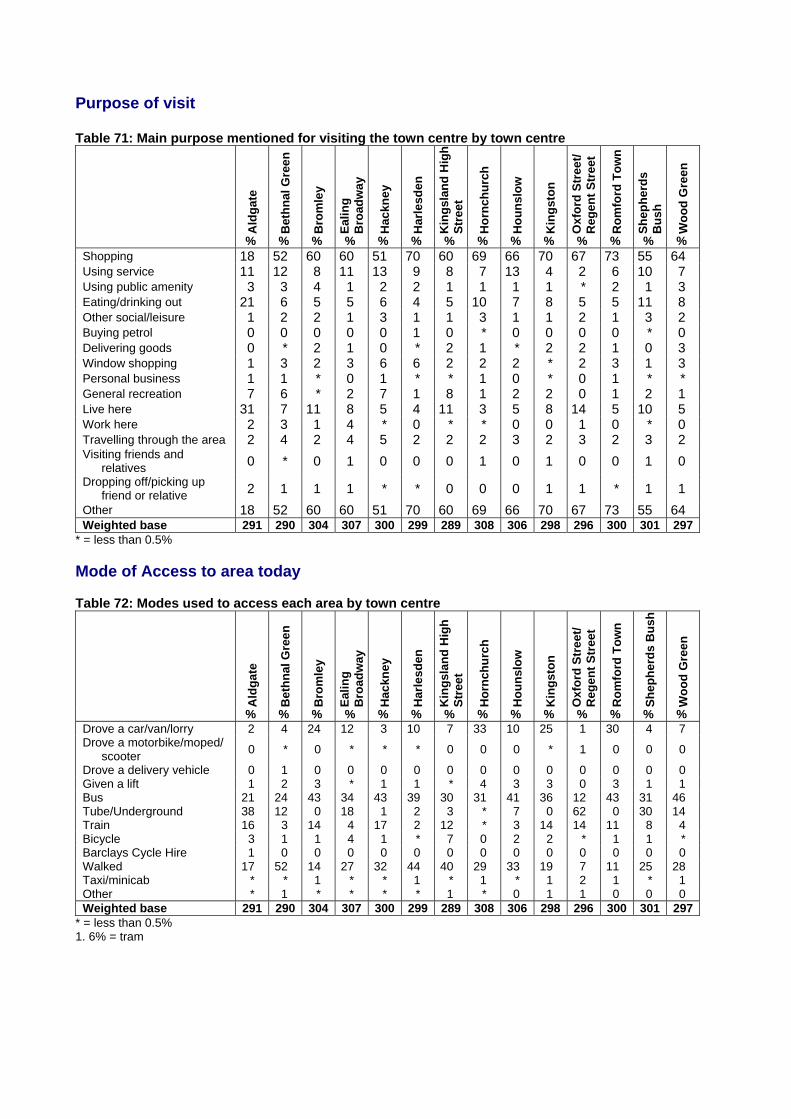
Purpose of visit Table 71: Main purpose mentioned for visiting the town centre by town centre
Ald
gat
e
Bet
hn
al G
ree
n
Bro
mle
y
Eal
ing
B
road
way
Hac
kney
Har
lesd
en
Kin
gsl
and
Hig
h
Str
eet
Ho
rnch
urc
h
Ho
un
slo
w
Kin
gst
on
Oxf
ord
Str
eet/
R
egen
t S
tree
t
Ro
mfo
rd T
ow
n
Sh
eph
erd
s B
ush
Wo
od
Gre
en
% % % % % % % % % % % % % %Shopping 18 52 60 60 51 70 60 69 66 70 67 73 55 64 Using service 11 12 8 11 13 9 8 7 13 4 2 6 10 7 Using public amenity 3 3 4 1 2 2 1 1 1 1 * 2 1 3 Eating/drinking out 21 6 5 5 6 4 5 10 7 8 5 5 11 8 Other social/leisure 1 2 2 1 3 1 1 3 1 1 2 1 3 2 Buying petrol 0 0 0 0 0 1 0 * 0 0 0 0 * 0 Delivering goods 0 * 2 1 0 * 2 1 * 2 2 1 0 3 Window shopping 1 3 2 3 6 6 2 2 2 * 2 3 1 3 Personal business 1 1 * 0 1 * * 1 0 * 0 1 * * General recreation 7 6 * 2 7 1 8 1 2 2 0 1 2 1 Live here 31 7 11 8 5 4 11 3 5 8 14 5 10 5 Work here 2 3 1 4 * 0 * * 0 0 1 0 * 0 Travelling through the area 2 4 2 4 5 2 2 2 3 2 3 2 3 2 Visiting friends and
relatives 0 * 0 1 0 0 0 1 0 1 0 0 1 0
Dropping off/picking up friend or relative 2 1 1 1 * * 0 0 0 1 1 * 1 1
Other 18 52 60 60 51 70 60 69 66 70 67 73 55 64 Weighted base 291 290 304 307 300 299 289 308 306 298 296 300 301 297
* = less than 0.5% Mode of Access to area today Table 72: Modes used to access each area by town centre
Ald
gat
e
Bet
hn
al G
ree
n
Bro
mle
y
Eal
ing
B
road
way
Hac
kney
Har
lesd
en
Kin
gsl
and
Hig
h
Str
eet
Ho
rnch
urc
h
Ho
un
slo
w
Kin
gst
on
Oxf
ord
Str
eet/
R
egen
t S
tree
t
Ro
mfo
rd T
ow
n
Sh
eph
erd
s B
ush
Wo
od
Gre
en
% % % % % % % % % % % % % %Drove a car/van/lorry 2 4 24 12 3 10 7 33 10 25 1 30 4 7 Drove a motorbike/moped/
scooter 0 * 0 * * * 0 0 0 * 1 0 0 0
Drove a delivery vehicle 0 1 0 0 0 0 0 0 0 0 0 0 0 0 Given a lift 1 2 3 * 1 1 * 4 3 3 0 3 1 1 Bus 21 24 43 34 43 39 30 31 41 36 12 43 31 46 Tube/Underground 38 12 0 18 1 2 3 * 7 0 62 0 30 14 Train 16 3 14 4 17 2 12 * 3 14 14 11 8 4 Bicycle 3 1 1 4 1 * 7 0 2 2 * 1 1 * Barclays Cycle Hire 1 0 0 0 0 0 0 0 0 0 0 0 0 0 Walked 17 52 14 27 32 44 40 29 33 19 7 11 25 28 Taxi/minicab * * 1 * * 1 * 1 * 1 2 1 * 1 Other * 1 * * * * 1 * 0 1 1 0 0 0 Weighted base 291 290 304 307 300 299 289 308 306 298 296 300 301 297
* = less than 0.5% 1. 6% = tram
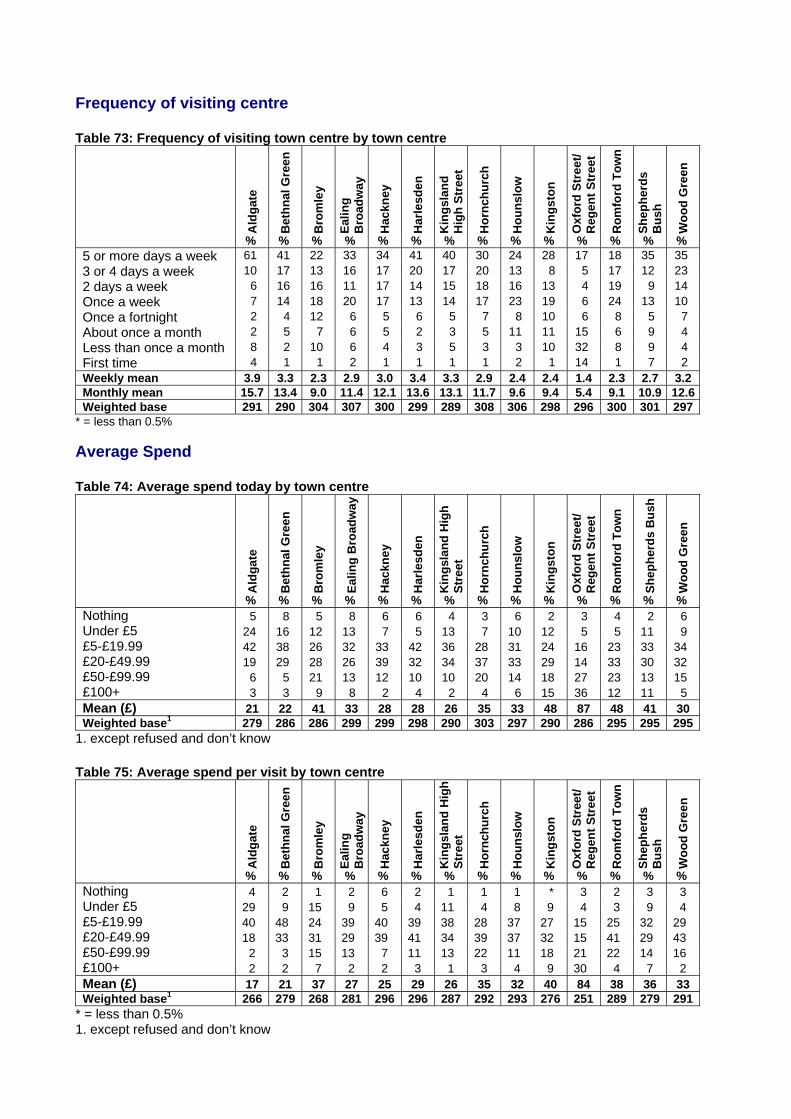
Frequency of visiting centre Table 73: Frequency of visiting town centre by town centre
Ald
gat
e
Bet
hn
al G
ree
n
Bro
mle
y
Eal
ing
B
road
way
Hac
kney
Har
lesd
en
Kin
gsl
and
H
igh
Str
eet
Ho
rnch
urc
h
Ho
un
slo
w
Kin
gst
on
Oxf
ord
Str
eet/
R
egen
t S
tree
t
Ro
mfo
rd T
ow
n
Sh
eph
erd
s B
ush
Wo
od
Gre
en
% % % % % % % % % % % % % %5 or more days a week 61 41 22 33 34 41 40 30 24 28 17 18 35 35 3 or 4 days a week 10 17 13 16 17 20 17 20 13 8 5 17 12 23 2 days a week 6 16 16 11 17 14 15 18 16 13 4 19 9 14 Once a week 7 14 18 20 17 13 14 17 23 19 6 24 13 10 Once a fortnight 2 4 12 6 5 6 5 7 8 10 6 8 5 7 About once a month 2 5 7 6 5 2 3 5 11 11 15 6 9 4 Less than once a month 8 2 10 6 4 3 5 3 3 10 32 8 9 4 First time 4 1 1 2 1 1 1 1 2 1 14 1 7 2 Weekly mean 3.9 3.3 2.3 2.9 3.0 3.4 3.3 2.9 2.4 2.4 1.4 2.3 2.7 3.2Monthly mean 15.7 13.4 9.0 11.4 12.1 13.6 13.1 11.7 9.6 9.4 5.4 9.1 10.9 12.6Weighted base 291 290 304 307 300 299 289 308 306 298 296 300 301 297
* = less than 0.5%
Average Spend Table 74: Average spend today by town centre
Ald
gat
e
Bet
hn
al G
ree
n
Bro
mle
y
Eal
ing
Bro
adw
ay
Hac
kney
Har
lesd
en
Kin
gsl
and
Hig
h
Str
eet
Ho
rnch
urc
h
Ho
un
slo
w
Kin
gst
on
Oxf
ord
Str
eet/
R
egen
t S
tree
t
Ro
mfo
rd T
ow
n
Sh
eph
erd
s B
ush
Wo
od
Gre
en
% % % % % % % % % % % % % %Nothing 5 8 5 8 6 6 4 3 6 2 3 4 2 6 Under £5 24 16 12 13 7 5 13 7 10 12 5 5 11 9 £5-£19.99 42 38 26 32 33 42 36 28 31 24 16 23 33 34 £20-£49.99 19 29 28 26 39 32 34 37 33 29 14 33 30 32 £50-£99.99 6 5 21 13 12 10 10 20 14 18 27 23 13 15 £100+ 3 3 9 8 2 4 2 4 6 15 36 12 11 5 Mean (£) 21 22 41 33 28 28 26 35 33 48 87 48 41 30 Weighted base1 279 286 286 299 299 298 290 303 297 290 286 295 295 295
1. except refused and don’t know Table 75: Average spend per visit by town centre
Ald
gat
e
Bet
hn
al G
ree
n
Bro
mle
y
Eal
ing
B
road
way
Hac
kney
Har
lesd
en
Kin
gsl
and
Hig
h
Str
eet
Ho
rnch
urc
h
Ho
un
slo
w
Kin
gst
on
Oxf
ord
Str
eet/
R
egen
t S
tree
t
Ro
mfo
rd T
ow
n
Sh
eph
erd
s B
ush
Wo
od
Gre
en
% % % % % % % % % % % % % %Nothing 4 2 1 2 6 2 1 1 1 * 3 2 3 3 Under £5 29 9 15 9 5 4 11 4 8 9 4 3 9 4 £5-£19.99 40 48 24 39 40 39 38 28 37 27 15 25 32 29 £20-£49.99 18 33 31 29 39 41 34 39 37 32 15 41 29 43 £50-£99.99 2 3 15 13 7 11 13 22 11 18 21 22 14 16 £100+ 2 2 7 2 2 3 1 3 4 9 30 4 7 2 Mean (£) 17 21 37 27 25 29 26 35 32 40 84 38 36 33 Weighted base1 266 279 268 281 296 296 287 292 293 276 251 289 279 291
* = less than 0.5% 1. except refused and don’t know
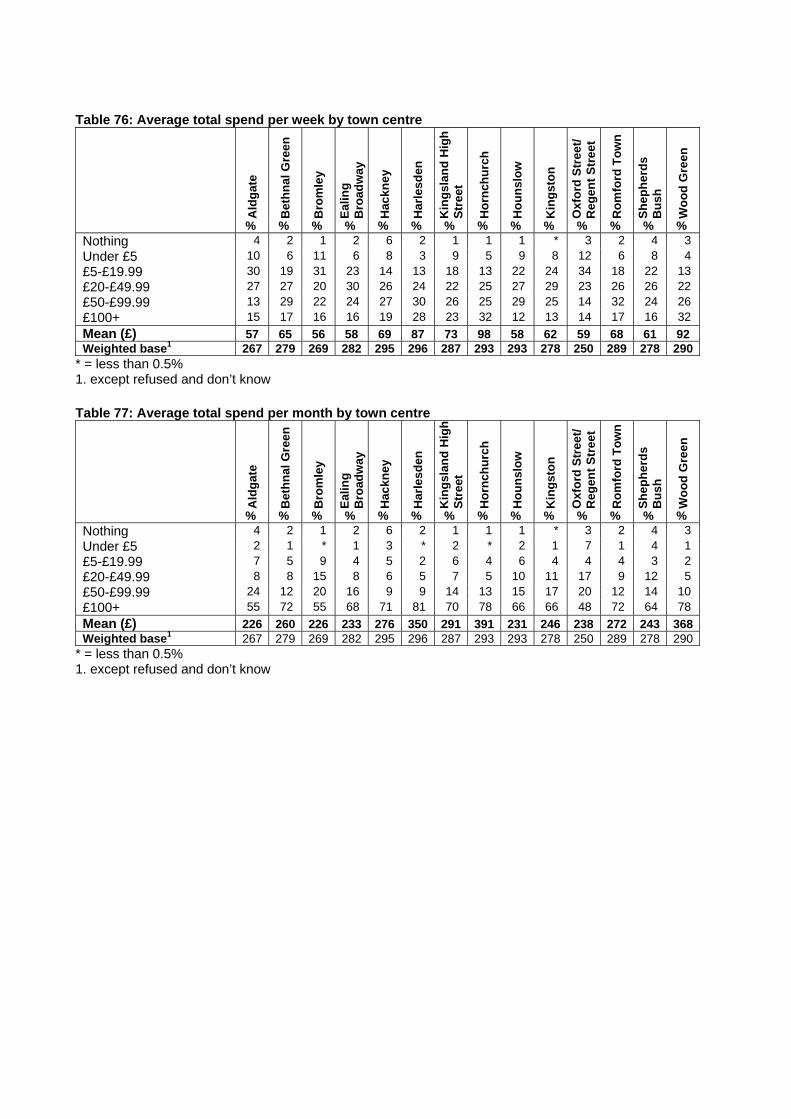
Table 76: Average total spend per week by town centre
Ald
gat
e
Bet
hn
al G
ree
n
Bro
mle
y
Eal
ing
B
road
way
Hac
kney
Har
lesd
en
Kin
gsl
and
Hig
h
Str
eet
Ho
rnch
urc
h
Ho
un
slo
w
Kin
gst
on
Oxf
ord
Str
eet/
R
egen
t S
tree
t
Ro
mfo
rd T
ow
n
Sh
eph
erd
s B
ush
Wo
od
Gre
en
% % % % % % % % % % % % % %Nothing 4 2 1 2 6 2 1 1 1 * 3 2 4 3 Under £5 10 6 11 6 8 3 9 5 9 8 12 6 8 4 £5-£19.99 30 19 31 23 14 13 18 13 22 24 34 18 22 13 £20-£49.99 27 27 20 30 26 24 22 25 27 29 23 26 26 22 £50-£99.99 13 29 22 24 27 30 26 25 29 25 14 32 24 26 £100+ 15 17 16 16 19 28 23 32 12 13 14 17 16 32
Mean (£) 57 65 56 58 69 87 73 98 58 62 59 68 61 92 Weighted base1 267 279 269 282 295 296 287 293 293 278 250 289 278 290
* = less than 0.5% 1. except refused and don’t know Table 77: Average total spend per month by town centre
Ald
gat
e
Bet
hn
al G
ree
n
Bro
mle
y
Eal
ing
B
road
way
Hac
kney
Har
lesd
en
Kin
gsl
and
Hig
hS
tree
t
Ho
rnch
urc
h
Ho
un
slo
w
Kin
gst
on
Oxf
ord
Str
eet/
R
egen
t S
tree
t
Ro
mfo
rd T
ow
n
Sh
eph
erd
s B
ush
Wo
od
Gre
en
% % % % % % % % % % % % % %Nothing 4 2 1 2 6 2 1 1 1 * 3 2 4 3 Under £5 2 1 * 1 3 * 2 * 2 1 7 1 4 1 £5-£19.99 7 5 9 4 5 2 6 4 6 4 4 4 3 2 £20-£49.99 8 8 15 8 6 5 7 5 10 11 17 9 12 5 £50-£99.99 24 12 20 16 9 9 14 13 15 17 20 12 14 10 £100+ 55 72 55 68 71 81 70 78 66 66 48 72 64 78
Mean (£) 226 260 226 233 276 350 291 391 231 246 238 272 243 368Weighted base1 267 279 269 282 295 296 287 293 293 278 250 289 278 290
* = less than 0.5% 1. except refused and don’t know
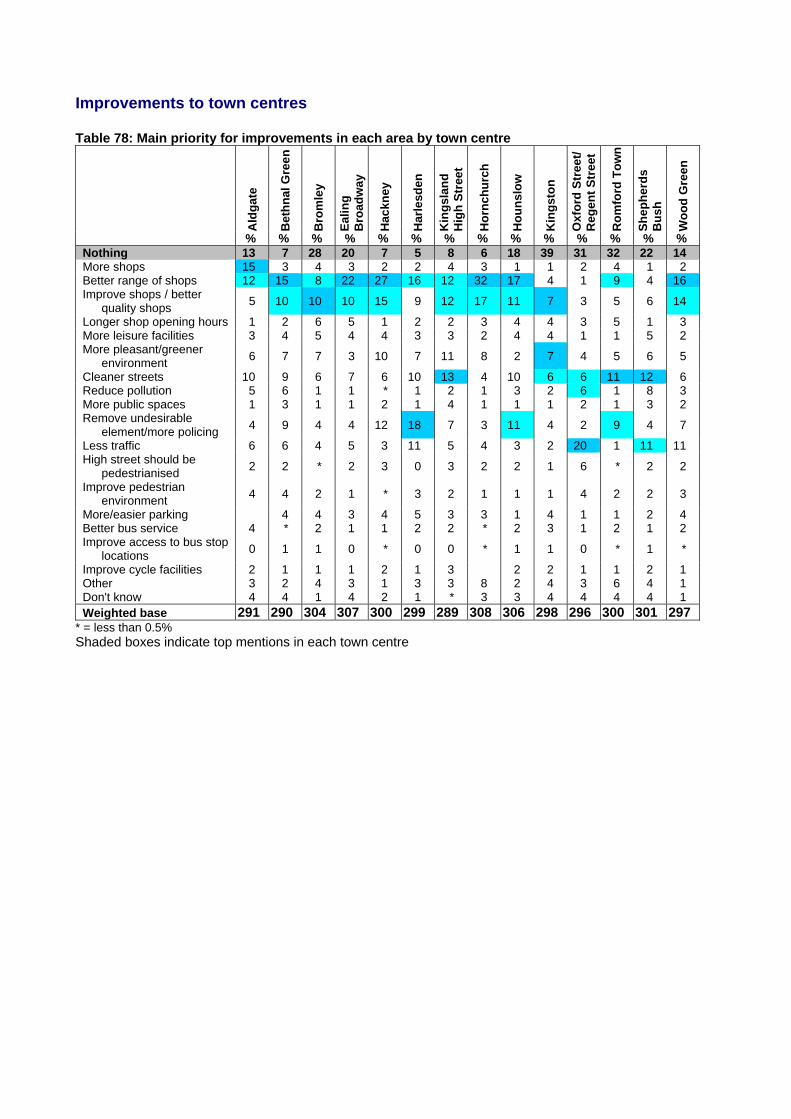
Improvements to town centres Table 78: Main priority for improvements in each area by town centre
Ald
gat
e
Bet
hn
al G
ree
n
Bro
mle
y
Eal
ing
B
road
way
Hac
kney
Har
lesd
en
Kin
gsl
and
H
igh
Str
eet
Ho
rnch
urc
h
Ho
un
slo
w
Kin
gst
on
Oxf
ord
Str
eet/
R
egen
t S
tree
t
Ro
mfo
rd T
ow
n
Sh
eph
erd
s B
ush
Wo
od
Gre
en
% % % % % % % % % % % % % %Nothing 13 7 28 20 7 5 8 6 18 39 31 32 22 14More shops 15 3 4 3 2 2 4 3 1 1 2 4 1 2 Better range of shops 12 15 8 22 27 16 12 32 17 4 1 9 4 16 Improve shops / better
quality shops 5 10 10 10 15 9 12 17 11 7 3 5 6 14
Longer shop opening hours 1 2 6 5 1 2 2 3 4 4 3 5 1 3 More leisure facilities 3 4 5 4 4 3 3 2 4 4 1 1 5 2 More pleasant/greener
environment 6 7 7 3 10 7 11 8 2 7 4 5 6 5
Cleaner streets 10 9 6 7 6 10 13 4 10 6 6 11 12 6 Reduce pollution 5 6 1 1 * 1 2 1 3 2 6 1 8 3 More public spaces 1 3 1 1 2 1 4 1 1 1 2 1 3 2 Remove undesirable
element/more policing 4 9 4 4 12 18 7 3 11 4 2 9 4 7
Less traffic 6 6 4 5 3 11 5 4 3 2 20 1 11 11 High street should be
pedestrianised 2 2 * 2 3 0 3 2 2 1 6 * 2 2
Improve pedestrian environment
4 4 2 1 * 3 2 1 1 1 4 2 2 3
More/easier parking 4 4 3 4 5 3 3 1 4 1 1 2 4 Better bus service 4 * 2 1 1 2 2 * 2 3 1 2 1 2 Improve access to bus stop
locations 0 1 1 0 * 0 0 * 1 1 0 * 1 *
Improve cycle facilities 2 1 1 1 2 1 3 2 2 1 1 2 1 Other 3 2 4 3 1 3 3 8 2 4 3 6 4 1 Don't know 4 4 1 4 2 1 * 3 3 4 4 4 4 1 Weighted base 291 290 304 307 300 299 289 308 306 298 296 300 301 297
* = less than 0.5% Shaded boxes indicate top mentions in each town centre
APPENDIX C
Response and Weighting Factors
Response and Weighting Factors Response The total number of interviews was 4,185 (an average of 299 in each area23). Weighting factors In order to reflect the distribution of the results by day as achieved in earlier phases of the Town Centres research the data were weighted so that 70% of the results were from weekdays, 20% from Saturdays and 10% from Sundays. The unweighted bases were 73% weekday, 19% Saturday and 8% Sunday. Values used for calculating average spend: Nothing = 0 Under £1 = 0.5 £1-£4.99 = 3 £5-£9.99 = 7.5 £10-£14.99 = 12.5 £15-£19.99 = 17.5 £20-£29.99 = 25 £30-£49.99 = 40 £50-£74.99 = 62.5 £75-£99.99 = 87.5 £100-£149.99 = 125 £150-£199.99 = 175 £200+ = 225 The average number of days visiting the town centre per month was calculated using the following: 5 or more days = 22 3-4 days = 14 2 days = 8 once a week= 4 once a fortnight = 2 once a month = 1 less than once a month = 0.4 first time = 0.2
23 Note that Hackney had a booster of 150 interviews so there were 463 interviews in total there, but these have been weighted to 300 for the purpose of the overall reporting
Appendix D
Retail Park Sampling Method
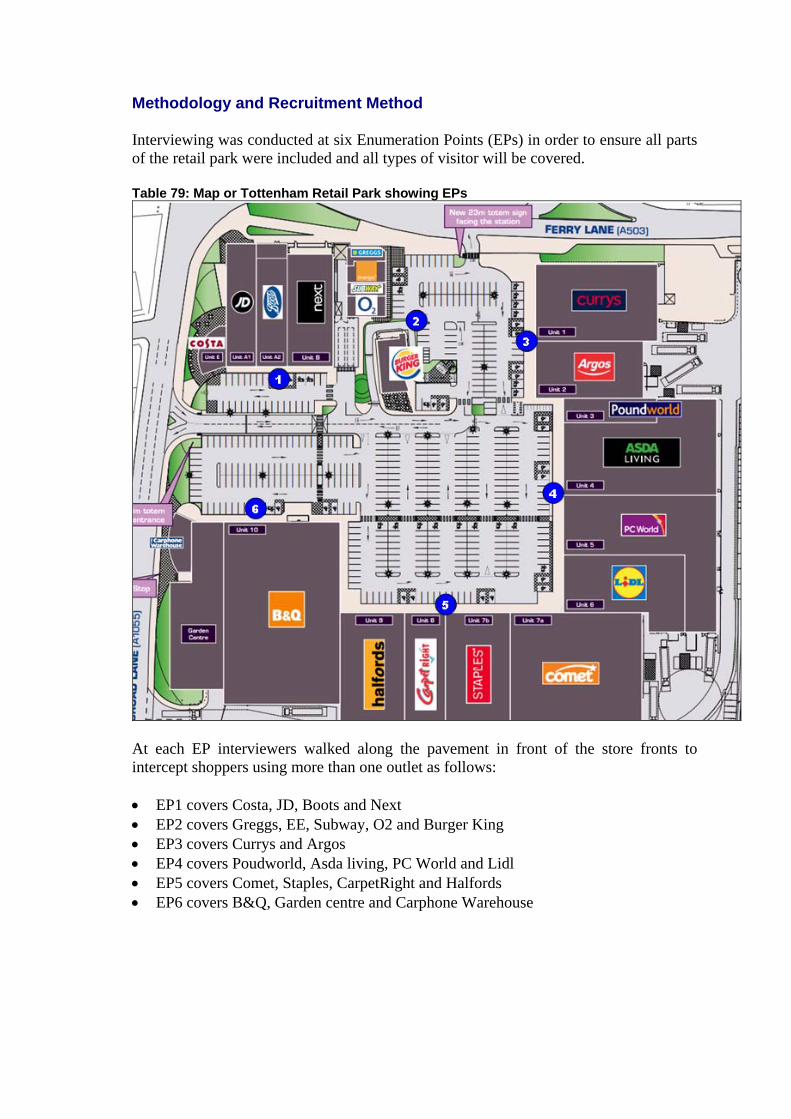
Methodology and Recruitment Method Interviewing was conducted at six Enumeration Points (EPs) in order to ensure all parts of the retail park were included and all types of visitor will be covered. Table 79: Map or Tottenham Retail Park showing EPs
At each EP interviewers walked along the pavement in front of the store fronts to intercept shoppers using more than one outlet as follows: EP1 covers Costa, JD, Boots and Next EP2 covers Greggs, EE, Subway, O2 and Burger King EP3 covers Currys and Argos EP4 covers Poudworld, Asda living, PC World and Lidl EP5 covers Comet, Staples, CarpetRight and Halfords EP6 covers B&Q, Garden centre and Carphone Warehouse

The fieldwork shift schedule is shown below.
EP for first 3
hours EP for second
3 hours Wednesday, 27-Mar-13 8-2pm 1 4 Thursday, 28-Mar-13 8-2pm 2 5 Tuesday, 02-Apr-13 12-6pm 4 1 Wednesday, 03-Apr-13 8-2pm 3 6 Wednesday, 03-Apr-13 12-6pm 5 2 Thursday, 04-Apr-13 12-6pm 6 3 Saturday, 06-Apr-13 10-4pm 1 4 Saturday, 06-Apr-13 12-6pm 2 5 Sunday, 07-Apr-13 11-5pm 3 6
APPENDIX E
Paper version of Retail Park Questionnaire
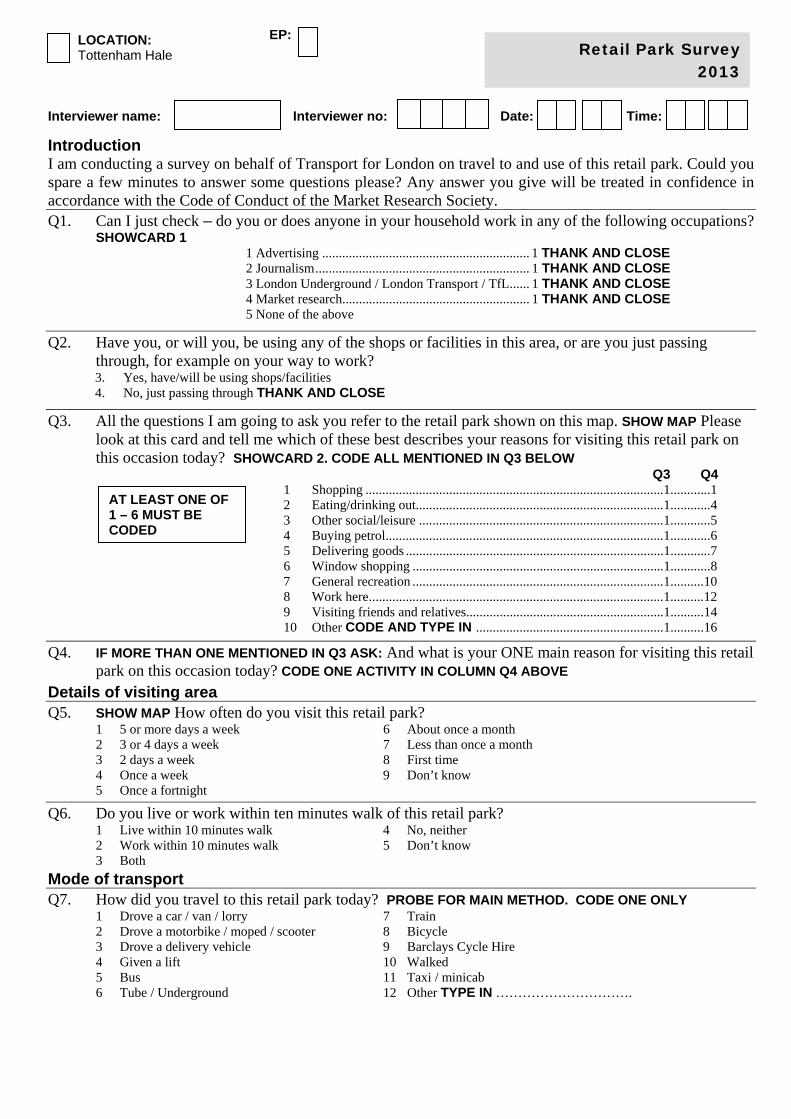
Interviewer name: Interviewer no: Date: Time:
Introduction I am conducting a survey on behalf of Transport for London on travel to and use of this retail park. Could you spare a few minutes to answer some questions please? Any answer you give will be treated in confidence in accordance with the Code of Conduct of the Market Research Society. Q1. Can I just check – do you or does anyone in your household work in any of the following occupations?
SHOWCARD 1 1 Advertising .............................................................. 1 THANK AND CLOSE 2 Journalism ................................................................ 1 THANK AND CLOSE 3 London Underground / London Transport / TfL ...... 1 THANK AND CLOSE 4 Market research........................................................ 1 THANK AND CLOSE 5 None of the above
Q2. Have you, or will you, be using any of the shops or facilities in this area, or are you just passing through, for example on your way to work? 3. Yes, have/will be using shops/facilities 4. No, just passing through THANK AND CLOSE
Q3. All the questions I am going to ask you refer to the retail park shown on this map. SHOW MAP Please look at this card and tell me which of these best describes your reasons for visiting this retail park on this occasion today? SHOWCARD 2. CODE ALL MENTIONED IN Q3 BELOW Q3 Q4
1 Shopping ......................................................................................... 1............ 1 2 Eating/drinking out.......................................................................... 1............ 4 3 Other social/leisure ......................................................................... 1............ 5 4 Buying petrol ................................................................................... 1............ 6 5 Delivering goods ............................................................................. 1............ 7 6 Window shopping ........................................................................... 1............ 8 7 General recreation ........................................................................... 1.......... 10 8 Work here ........................................................................................ 1.......... 12 9 Visiting friends and relatives ........................................................... 1.......... 14 10 Other CODE AND TYPE IN ........................................................ 1.......... 16
Q4. IF MORE THAN ONE MENTIONED IN Q3 ASK: And what is your ONE main reason for visiting this retail park on this occasion today? CODE ONE ACTIVITY IN COLUMN Q4 ABOVE
Details of visiting area Q5. SHOW MAP How often do you visit this retail park?
1 5 or more days a week 6 About once a month 2 3 or 4 days a week 7 Less than once a month 3 2 days a week 8 First time 4 Once a week 9 Don’t know 5 Once a fortnight
Q6. Do you live or work within ten minutes walk of this retail park? 1 Live within 10 minutes walk 4 No, neither 2 Work within 10 minutes walk 5 Don’t know 3 Both
Mode of transport Q7. How did you travel to this retail park today? PROBE FOR MAIN METHOD. CODE ONE ONLY
1 Drove a car / van / lorry 7 Train 2 Drove a motorbike / moped / scooter 8 Bicycle 3 Drove a delivery vehicle 9 Barclays Cycle Hire 4 Given a lift 10 Walked 5 Bus 11 Taxi / minicab 6 Tube / Underground 12 Other TYPE IN ………………………….
Retail Park Survey 2013
LOCATION: Tottenham Hale
EP:
AT LEAST ONE OF 1 – 6 MUST BE CODED
Q8. How frequently do you use [MODE OF TRANSPORT AT Q7] to travel to this retail park? 1 5 or more days a week 6 About once a month 2 3 or 4 days a week 7 Less than once a month 3 2 days a week 8 First time 4 Once a week 9 Don’t know 5 Once a fortnight
Q9. What other modes do you use to travel to this retail park? MULTICODE 1 Car / van / lorry 6 Bicycle 2 Motorbike / moped / scooter 7 Barclays Cycle Hire 3 Bus 8 Walk all the way 4 Tube / Underground 9 Taxi / minicab 5 Train 10 Other TYPE IN ………………………….
Q10. IF BUS AT Q7 ASK: How would you rate the following aspects of your journey by bus today? SHOWCARD 3. TICK START AND ROTATE. READ OUT
extremely extremely dissatisfied satisfied
1 Length of time waited for the bus .......... 0 1 2 3 4 5 6 7 8 9 10 2 Comfort of journey ................................ 0 1 2 3 4 5 6 7 8 9 10 3 Value for money .................................... 0 1 2 3 4 5 6 7 8 9 10 4 Ease of getting on and off the bus .......... 0 1 2 3 4 5 6 7 8 9 10 5 Level of crowding on the bus ................ 0 1 2 3 4 5 6 7 8 9 10 6 Length of time the journey took ............ 0 1 2 3 4 5 6 7 8 9 10 7 Convenience of the bus stops................. 0 1 2 3 4 5 6 7 8 9 10 8 Waiting facilities at the bus stop ............ 0 1 2 3 4 5 6 7 8 9 10
Q11. ASK ALL Which of the reasons on this card describe why you decided to use …. (MODE OF TRANSPORT USED AT Q7) rather than any other method of transport? SHOWCARD 4. CODE ALL MENTIONED UNDER Q11 Q11 Q12
1 Cheaper/less expensive ....................................... 1............ 1 2 Quicker ................................................................ 1............ 2 3 More direct .......................................................... 1............ 3 4 Had heavy bags/shopping to carry ...................... 1............ 4 5 Travelling with children ...................................... 1............ 5 6 More relaxing/comfortable ................................. 1............ 6 7 Easier/more convenient ....................................... 1............ 7 8 Safer .................................................................... 1............ 8 9 Avoids parking difficulties .................................. 1............ 9 10 Going to more than one place ............................ 1.......... 10 11 Only method possible ......................................... 1.......... 11 12 Live very close by ............................................... 1.......... 12 13 Need/enjoy exercise/healthy ............................... 1.......... 13 14 No car/can’t drive ............................................... 1.......... 14 15 Weather issues .................................................... 1.......... 15 16 Avoid the congestion charge ............................... 1.......... 16 17 Don’t know ......................................................... 1.......... 17 18 Other (PLEASE TYPE IN) ............................... 1.......... 18 …………………………………………………………………
Q12. IF MORE THAN ONE ANSWER AT Q11 ASK And which ONE reason best describes why you decided to use that method? Circle code in column Q12 Above for one reason only
Q21. ASK IF DROVE OR WAS GIVEN LIFT (Q7 CODES 1-4), OTHERWISE GO TO Q23 Where did you park your vehicle? Was it… read out 1 Off street residential parking 5 On main road 9 Don’t know 2 Off street private parking (eg driveway) 6 On side road 3 Off street municipal/NCP car park 7 In filling station forecourt 4 In retail park 8 Other place
Q22. How satisfied are you with each of the following: SHOWCARD 8. READ OUT extremely extremely dissatisfied satisfied
1 The number of parking spaces provided? ............................................... 0 1 2 3 4 5 6 7 8 9 10
2 The ease of access to this area by car? .. 0 1 2 3 4 5 6 7 8 9 10
Shopping and expenditure in the area Q23. Could you look at this card and tell me the range of things you are shopping for or services you are
using in this retail park today? SHOWCARD 9. CODE ALL MENTIONED 1 Food/groceries ........................................................................................ 1 2 Take-away food ...................................................................................... 1 3 Wine, beer, spirits ................................................................................... 1 4 Clothing or footwear ............................................................................... 1 5 Confectionery, tobacco, newspapers ....................................................... 1 6 Stationery/books/CDs/DVDs/leisure goods ............................................ 1 7 Pharmaceuticals/toiletries ....................................................................... 1 8 Luxury goods .......................................................................................... 1 9 Major household goods ........................................................................... 1 10 Other household goods (eg electrical goods) .......................................... 1 11 Travel Pass/mobile top up/phonecard ..................................................... 1 12 Services (e.g. hairdresser, dry cleaners, Post Office, travel agent) ........ 1 13 Eating in a café or restaurant ................................................................... 1 14 Having a drink in a pub or wine bar ........................................................ 1 15 Going to cinema, theatre, concert, leisure facility etc ............................. 1 16 Other (PLEASE TYPE IN) .................................................................. 1
Q24. How much will you have spent in this retail park today? SHOWCARD 10 1 Nothing 6 £15-£19.99 11 £100-£149.99 2 Under £1 7 £20-£29.99 12 £150-£199.99 3 £1-£4.99 8 £30-£49.99 13 £200+ 4 £5-£9.99 9 £50-£74.99 14 Don’t know 5 £10-£14.99 10 £75-£99.99 15 Refused
Q25. How much do you typically spend on average per visit to this retail park? SHOWCARD 10 1 Nothing 6 £15-£19.99 11 £100-£149.99 2 Under £1 7 £20-£29.99 12 £150-£199.99 3 £1-£4.99 8 £30-£49.99 13 £200+ 4 £5-£9.99 9 £50-£74.99 14 Don’t know 5 £10-£14.99 10 £75-£99.99 15 Refused
Q26. How long will you spend in this retail park today altogether? 1 Under 5 minutes 4 30-59 minutes 7 Don’t know 2 5-14 minutes 5 1-3 hours 3 15-29 minutes 6 More than 3 hours
Q27. In what ways do you think this retail park could be improved? SHOW MAP. CODE ALL MENTIONED IN COLUMN A BELOW. SHOWCARD 11
Q28. Which of these would be the most important reason? PROBE FOR MOST IMPORTANT AND CODE IN 1ST COLUMN A 1ST
1 More shops ........................................................................................ 1 1 2 Better range of shops ......................................................................... 2 2 3 Improve shops / better quality shops ................................................. 3 3 4 Longer shop opening hours ............................................................... 4 4 5 More leisure facilities e.g. restaurants, bars, cinemas etc .................. 5 5 6 More pleasant/greener environment .................................................. 6 6 7 Reduce pollution ................................................................................ 7 7 8 More public spaces ............................................................................ 8 8 9 Remove undesirable element/more policing ...................................... 9 9 10 Improve pedestrian environment ..................................................... 10 10 11 More/easier parking ......................................................................... 11 11 12 Better bus service ............................................................................ 12 12 13 Improve access to bus stop locations ............................................... 13 13 14 Improved cycle facilities ................................................................. 14 14 15 Other ............................................................................................... 15 15 16 Nothing ............................................................................................ 16 17 Don’t know ...................................................................................... 17 17
All Q29A Do you go to any of these shopping centres in and around London? SHOWCARD 13. CODE ALL
MENTIONED 1 No ....................................................................... 1 2 Aylesham Shopping Centre ............................... 1 3 Bluewater ............................................................ 1 4 Brent Cross ......................................................... 1 5 Canary Wharf ...................................................... 1 6 Croydon .............................................................. 1 7 Elephant & Castle ............................................... 1 8 Lakeside .............................................................. 1 9 Victoria Place ...................................................... 1 10 Westfield White City .......................................... 1 11 Westfield Stratford .............................................. 1 12 Whiteleys ............................................................ 1
Q29B If you live in a London borough, which one do you live in? 1 Barking & Dagenham 2 Barnet 3 Bexley 4 Brent 5 Bromley 6 Camden 7 City of Westminster 8 Croydon 9 Ealing 10 Enfield 11 Greenwich 12 Hackney
13 Hammersmith & Fulham 14 Haringey 15 Harrow 16 Havering 17 Hillingdon 18 Hounslow 19 Islington 20 Kensington & Chelsea 21 Kingston-upon-Thames 22 Lambeth 23 Lewisham 24 Merton
25 Newham 26 Redbridge 27 Richmond-upon-Thames 28 Southwark 29 Sutton 30 Tower Hamlets 31 Waltham Forest 32 Wandsworth 33 Do not live in London GO TO Q29C 34 Don’t know 35 Refused
Q29C ASK IF DOES NOT LIVE IN LONDON BOROUGH: Do you live in … READ OUT 1 The South East of England 4 Outside of the UK 2 Elsewhere in England 5 Don’t know 3 Scotland, Wales or Northern Ireland 6 Refused
Q29D Do you do internet shopping? 1 Yes 2 No GO TO Q30
Q29E What kind of goods do you shop for online? SHOWCARD 14, CODE ALL MENTIONED 1 Food/groceries ..................................................... 1 2 Wine, beer, spirits ............................................... 1 3 Clothing or footwear ........................................... 1 4 Books/CDs/DVDs/leisure goods ......................... 1 5 Luxury goods ...................................................... 1 6 Major household goods ....................................... 1 7 Other household goods (eg electrical goods) ...... 1 8 Take-way food .................................................... 1 9 Tickets (air, rail, concerts) .................................. 1
Classification Q29.
Q30. Do you have any long term physical or other impairment which limits your daily activities or the work you can do, including problems due to age? SHOWCARD 15, CODE ALL MENTIONED
1 No, none .............................................................. 1 2 Mobility impairment .......................................... 1 3 Visual impairment ............................................... 1 4 Hearing impairment ........................................... 1 5 Learning disability ............................................. 1 6 Mental health condition ...................................... 1 7 Serious long term illness .................................... 1 8 Other TYPE IN ................................................. 1 9 Refused ............................................................... 1
Q30A How easy did you find moving around this retail park? 1 very easy 4 difficult 2 easy 5 very difficult 3 neither easy nor difficult
Q31. Do you use a wheelchair for travelling? 1 Yes 3 Refused 2 No
Q32. Is the respondent carrying any of the following…? CODE BY OBSERVATION 1 Shopping bag(s) / shopping trolley 4 Suitcase / rucksack 4 Buggy / pram 5 Other large / awkward object 5 Carrying a child / baby 6 Nothing
Q33. Finally, I would like to ask you some questions about yourself. This is for classification purposes only. The personal information you provide during this survey will be kept confidential by Accent and will not be disclosed to third parties. It will be used by Accent only for this study, which is being undertaken for Transport for London. Which of the following age groups do you fall into? SHOWCARD 16 1 16-24 4 45-54 7 65-74 2 25-34 5 55-59 8 75 or over 3 35-44 6 60-64 9 refused
Q34. RECORD GENDER 1 Male 2 Female
Q35. Which of the following best describes your working status? SHOWCARD 17 1 Working full time (30+ hours a week) 6 Not working and not looking for work 2 Working part time (less than 30 hours a week) 7 Retired 3 A full time student 8 Looking after family and home 4 A part time student 9 Other 5 Not working, but looking for work 10 Refused
Q36. To which of these ethnic groups do you consider you belong? SHOWCARD 18 1 White 4. Mixed 7. Refused 2 Asian or Asian British 5. Chinese or Other Ethnic Group 3 Black or Black British 6. Don’t know
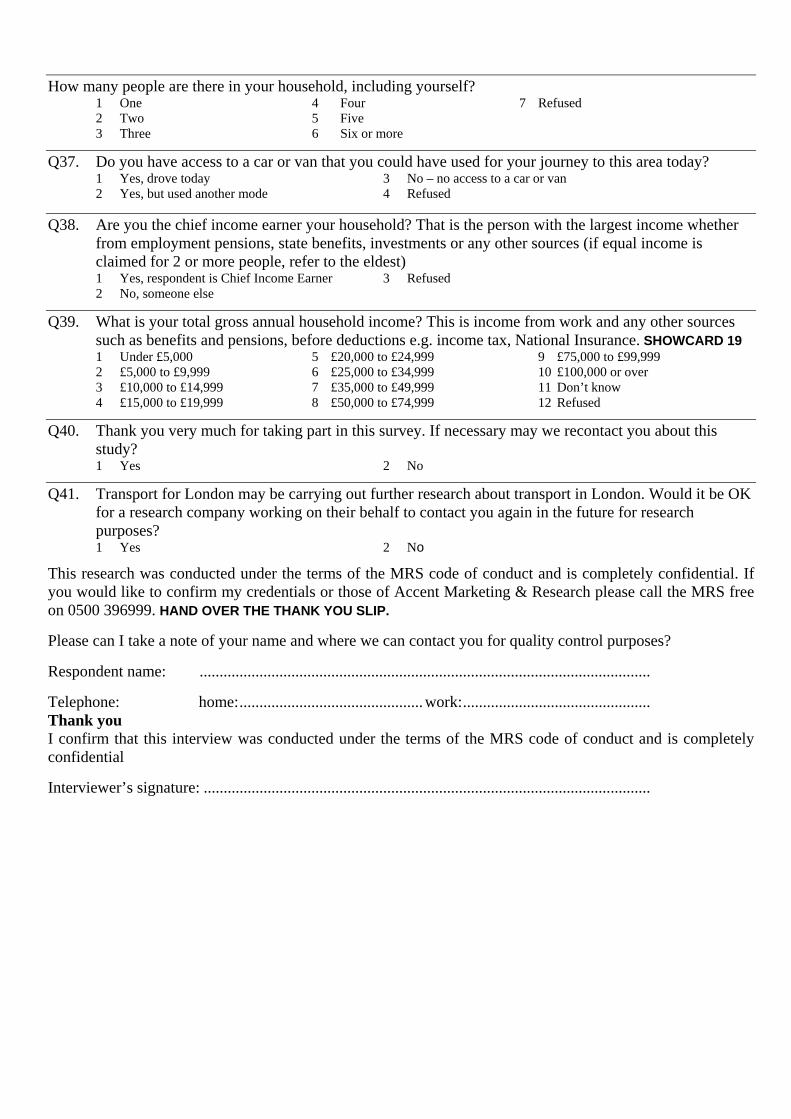
How many people are there in your household, including yourself? 1 One 4 Four 7 Refused 2 Two 5 Five 3 Three 6 Six or more
Q37. Do you have access to a car or van that you could have used for your journey to this area today? 1 Yes, drove today 3 No – no access to a car or van 2 Yes, but used another mode 4 Refused
Q38. Are you the chief income earner your household? That is the person with the largest income whether from employment pensions, state benefits, investments or any other sources (if equal income is claimed for 2 or more people, refer to the eldest) 1 Yes, respondent is Chief Income Earner 3 Refused 2 No, someone else
Q39. What is your total gross annual household income? This is income from work and any other sources such as benefits and pensions, before deductions e.g. income tax, National Insurance. SHOWCARD 19 1 Under £5,000 5 £20,000 to £24,999 9 £75,000 to £99,999 2 £5,000 to £9,999 6 £25,000 to £34,999 10 £100,000 or over 3 £10,000 to £14,999 7 £35,000 to £49,999 11 Don’t know 4 £15,000 to £19,999 8 £50,000 to £74,999 12 Refused
Q40. Thank you very much for taking part in this survey. If necessary may we recontact you about this study? 1 Yes 2 No
Q41. Transport for London may be carrying out further research about transport in London. Would it be OK for a research company working on their behalf to contact you again in the future for research purposes? 1 Yes 2 No
This research was conducted under the terms of the MRS code of conduct and is completely confidential. If you would like to confirm my credentials or those of Accent Marketing & Research please call the MRS free on 0500 396999. HAND OVER THE THANK YOU SLIP.
Please can I take a note of your name and where we can contact you for quality control purposes?
Respondent name: .................................................................................................................
Telephone: home: .............................................. work: ............................................... Thank you I confirm that this interview was conducted under the terms of the MRS code of conduct and is completely confidential
Interviewer’s signature: ................................................................................................................

APPENDIX F
Hackney Business Questionnaire
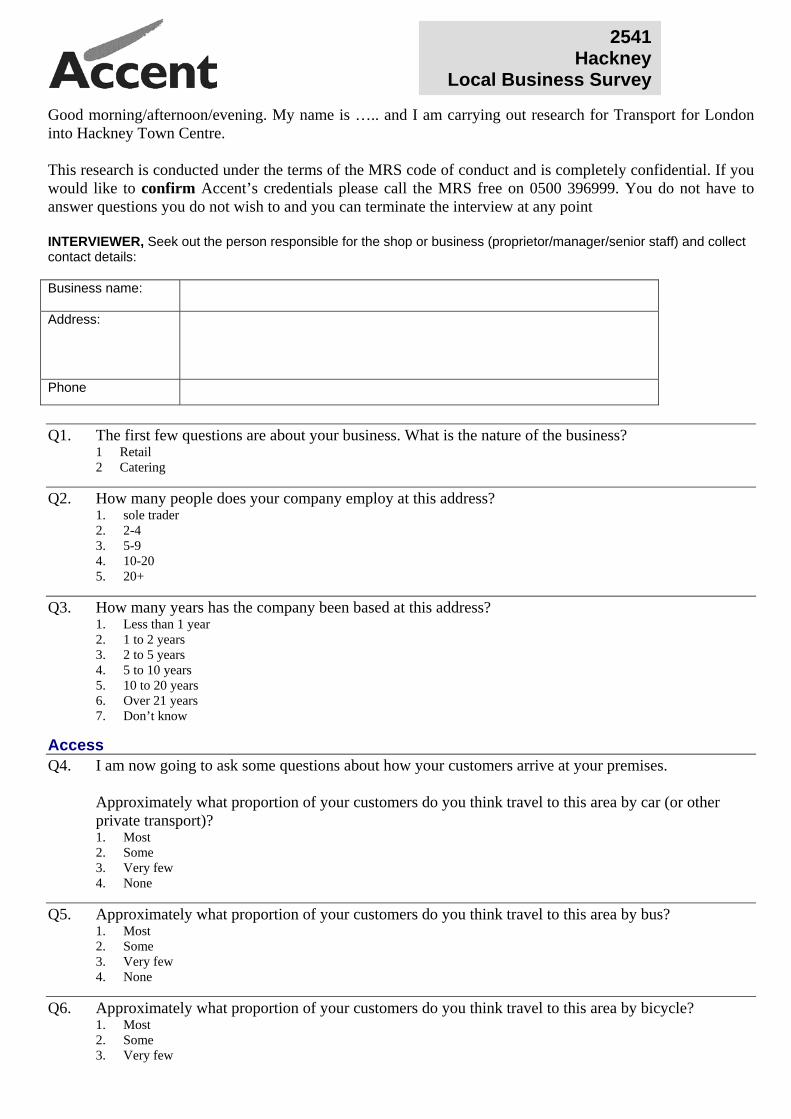
Good morning/afternoon/evening. My name is ….. and I am carrying out research for Transport for London into Hackney Town Centre. This research is conducted under the terms of the MRS code of conduct and is completely confidential. If you would like to confirm Accent’s credentials please call the MRS free on 0500 396999. You do not have to answer questions you do not wish to and you can terminate the interview at any point INTERVIEWER, Seek out the person responsible for the shop or business (proprietor/manager/senior staff) and collect contact details: Business name:
Address:
Phone
Q1. The first few questions are about your business. What is the nature of the business?
1 Retail 2 Catering
Q2. How many people does your company employ at this address? 1. sole trader 2. 2-4 3. 5-9 4. 10-20 5. 20+
Q3. How many years has the company been based at this address? 1. Less than 1 year 2. 1 to 2 years 3. 2 to 5 years 4. 5 to 10 years 5. 10 to 20 years 6. Over 21 years 7. Don’t know
Access Q4. I am now going to ask some questions about how your customers arrive at your premises.
Approximately what proportion of your customers do you think travel to this area by car (or other private transport)? 1. Most 2. Some 3. Very few 4. None
Q5. Approximately what proportion of your customers do you think travel to this area by bus? 1. Most 2. Some 3. Very few 4. None
Q6. Approximately what proportion of your customers do you think travel to this area by bicycle? 1. Most 2. Some 3. Very few
2541 Hackney
Local Business Survey
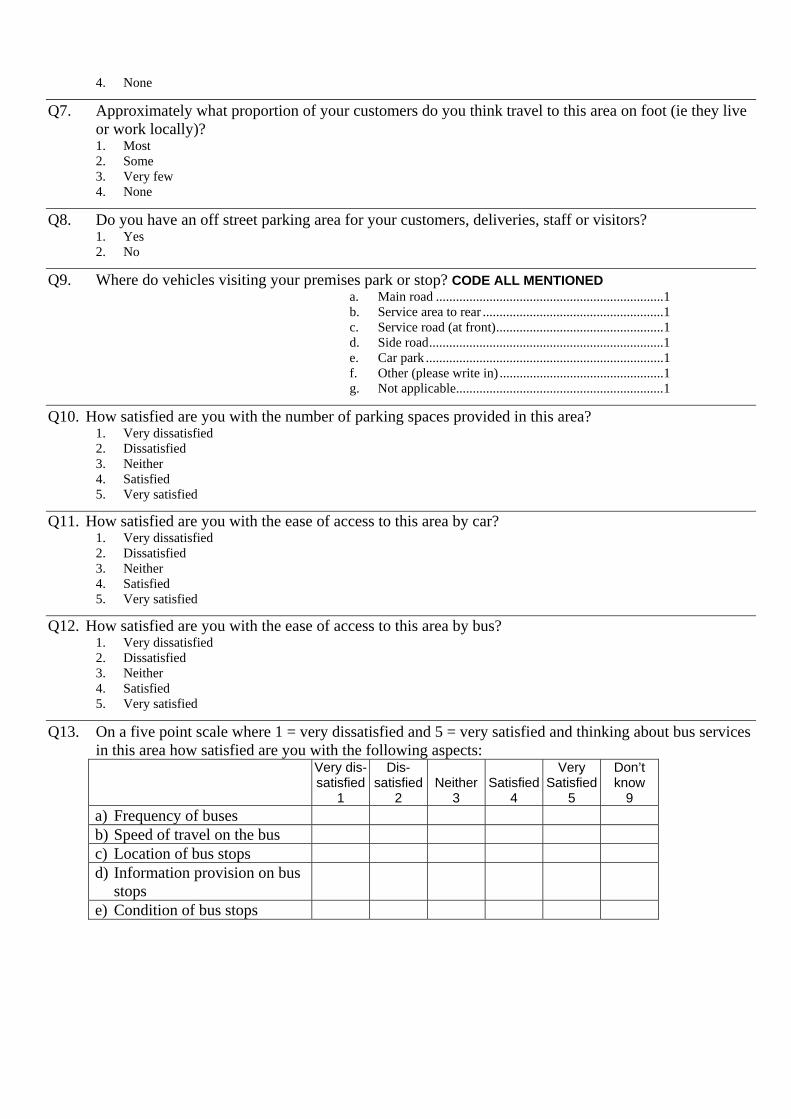
4. None
Q7. Approximately what proportion of your customers do you think travel to this area on foot (ie they live or work locally)? 1. Most 2. Some 3. Very few 4. None
Q8. Do you have an off street parking area for your customers, deliveries, staff or visitors? 1. Yes 2. No
Q9. Where do vehicles visiting your premises park or stop? CODE ALL MENTIONED a. Main road .................................................................... 1 b. Service area to rear ...................................................... 1 c. Service road (at front) .................................................. 1 d. Side road ...................................................................... 1 e. Car park ....................................................................... 1 f. Other (please write in) ................................................. 1 g. Not applicable .............................................................. 1
Q10. How satisfied are you with the number of parking spaces provided in this area? 1. Very dissatisfied 2. Dissatisfied 3. Neither 4. Satisfied 5. Very satisfied
Q11. How satisfied are you with the ease of access to this area by car? 1. Very dissatisfied 2. Dissatisfied 3. Neither 4. Satisfied 5. Very satisfied
Q12. How satisfied are you with the ease of access to this area by bus? 1. Very dissatisfied 2. Dissatisfied 3. Neither 4. Satisfied 5. Very satisfied
Q13. On a five point scale where 1 = very dissatisfied and 5 = very satisfied and thinking about bus services in this area how satisfied are you with the following aspects: Very dis-
satisfied1
Dis-satisfied
2 Neither
3 Satisfied
4
Very Satisfied
5
Don’t know
9 a) Frequency of buses
b) Speed of travel on the bus
c) Location of bus stops
d) Information provision on bus stops
e) Condition of bus stops
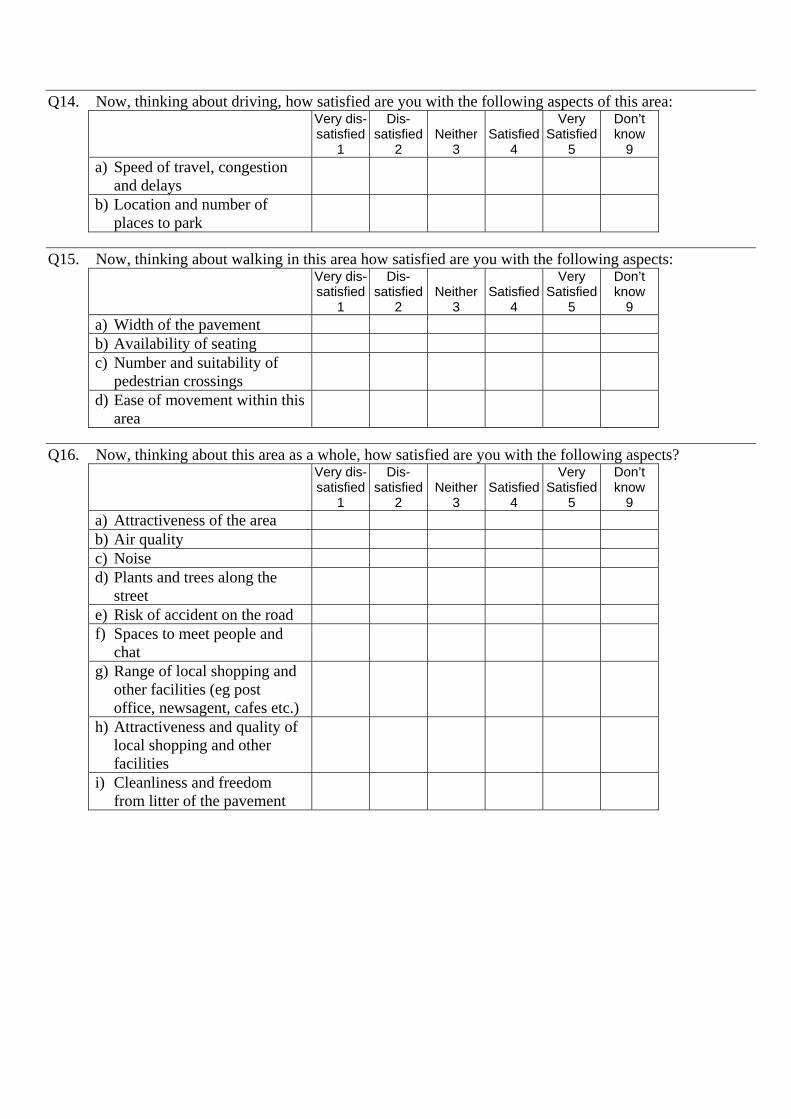
Q14. Now, thinking about driving, how satisfied are you with the following aspects of this area: Very dis-
satisfied1
Dis-satisfied
2 Neither
3 Satisfied
4
Very Satisfied
5
Don’t know
9 a) Speed of travel, congestion
and delays
b) Location and number of places to park
Q15. Now, thinking about walking in this area how satisfied are you with the following aspects: Very dis-
satisfied1
Dis-satisfied
2 Neither
3 Satisfied
4
Very Satisfied
5
Don’t know
9 a) Width of the pavement
b) Availability of seating
c) Number and suitability of pedestrian crossings
d) Ease of movement within this area
Q16. Now, thinking about this area as a whole, how satisfied are you with the following aspects? Very dis-
satisfied1
Dis-satisfied
2 Neither
3 Satisfied
4
Very Satisfied
5
Don’t know
9 a) Attractiveness of the area
b) Air quality
c) Noise
d) Plants and trees along the street
e) Risk of accident on the road
f) Spaces to meet people and chat
g) Range of local shopping and other facilities (eg post office, newsagent, cafes etc.)
h) Attractiveness and quality of local shopping and other facilities
i) Cleanliness and freedom from litter of the pavement
Local Area Q17. In what ways do you think this area could be improved? SHOW MAP. CODE ALL MENTIONED IN
COLUMN A BELOW. SHOWCARD A
Q18. Which of these would be the most important? PROBE FOR MOST IMPORTANT AND CODE IN 1ST COLUMN A 1ST
1 More shops ........................................................................................ 1 1 2 Better range of shops ......................................................................... 2 2 3 Improve shops / better quality shops ................................................. 3 3 4 Longer shop opening hours ............................................................... 4 4 5 More leisure facilities e.g. restaurants, bars, cinemas etc .................. 5 5 6 More pleasant/greener environment .................................................. 6 6 7 Cleaner streets ................................................................................... 7 7 8 Reduce pollution ................................................................................ 8 8 9 More public spaces ............................................................................ 9 9 10 Remove undesirable element/more policing .................................... 10 10 11 Less traffic ....................................................................................... 11 11 12 High street should be pedestrianised ............................................... 12 12 13 Improve pedestrian environment ..................................................... 13 13 14 More/easier parking ......................................................................... 14 14 15 Better bus service ............................................................................ 15 15 16 Improve access to bus stop locations ............................................... 16 16 17 Improved cycle facilities ................................................................. 17 17 18 Other ............................................................................................... 18 18 19 Nothing ............................................................................................ 19 20 Don’t know ...................................................................................... 20 20
Q19. What is the best aspect of this area? SHOWCARD B 1. Uniqueness of the area 2. Attractiveness of the area 3. Space to meet people and chat 4. Vibrancy of the area (many people and activities on the street) 5. Mix of cultures in the community 6. Affordable house/rental prices 7. Range and quality of shops and businesses 8. Close to schools, hospital or other services 9. Bus transport links and frequency of services 10. Convenient for access by car 11. Convenient for cycling 12. Ease of movement on foot (pavement provision and crossings) 13. Environment (noise, air and greenery) 14. Personal security - risk of crime (day and night) 15. Safety from traffic when crossing the road
Q20. And the second best aspect? 1. Uniqueness of the area 2. Attractiveness of the area 3. Space to meet people and chat 4. Vibrancy of the area (many people and activities on the street) 5. Mix of cultures in the community 6. Affordable house/rental prices 7. Range and quality of shops and businesses 8. Close to schools, hospital or other services 9. Bus transport links and frequency of services 10. Convenient for access by car 11. Convenient for cycling 12. Ease of movement on foot (pavement provision and crossings) 13. Environment (noise, air and greenery) 14. Personal security - risk of crime (day and night) 15. Safety from traffic when crossing the road 16. None
Q21. What is the worst aspect of this area? SHOWCARD B 1. Uniqueness of the area 2. Attractiveness of the area 3. Space to meet people and chat 4. Vibrancy of the area (many people and activities on the street) 5. Mix of cultures in the community 6. Affordable house/rental prices 7. Range and quality of shops and businesses 8. Close to schools, hospital or other services 9. Bus transport links and frequency of services 10. Convenient for access by car 11. Convenient for cycling 12. Ease of movement on foot (pavement provision and crossings) 13. Environment (noise, air and greenery) 14. Personal security - risk of crime (day and night) 15. Safety from traffic when crossing the road 16. None
Thank you. This research was conducted under the terms of the MRS code of conduct and is completely confidential. SYSTEM INFORMATION Time interview completed:
Appendix G
Town Centre Manager Topic Guide
![TOWN AND NEIGHBOURHOOD CENTRES [DESCRITION] 2011...TOWN AND NEIGHBOURHOOD CENTRES Collet Park Precinct (North Parramatta) 4.1.2 Collet Park Precinct (North Parramatta) Desired Future](https://img.pdfslide.us/doc/110x75/60181b45296da74e693f9c5d/town-and-neighbourhood-centres-descrition-2011-town-and-neighbourhood-centres.jpg)