Embed Size (px)
Citation preview
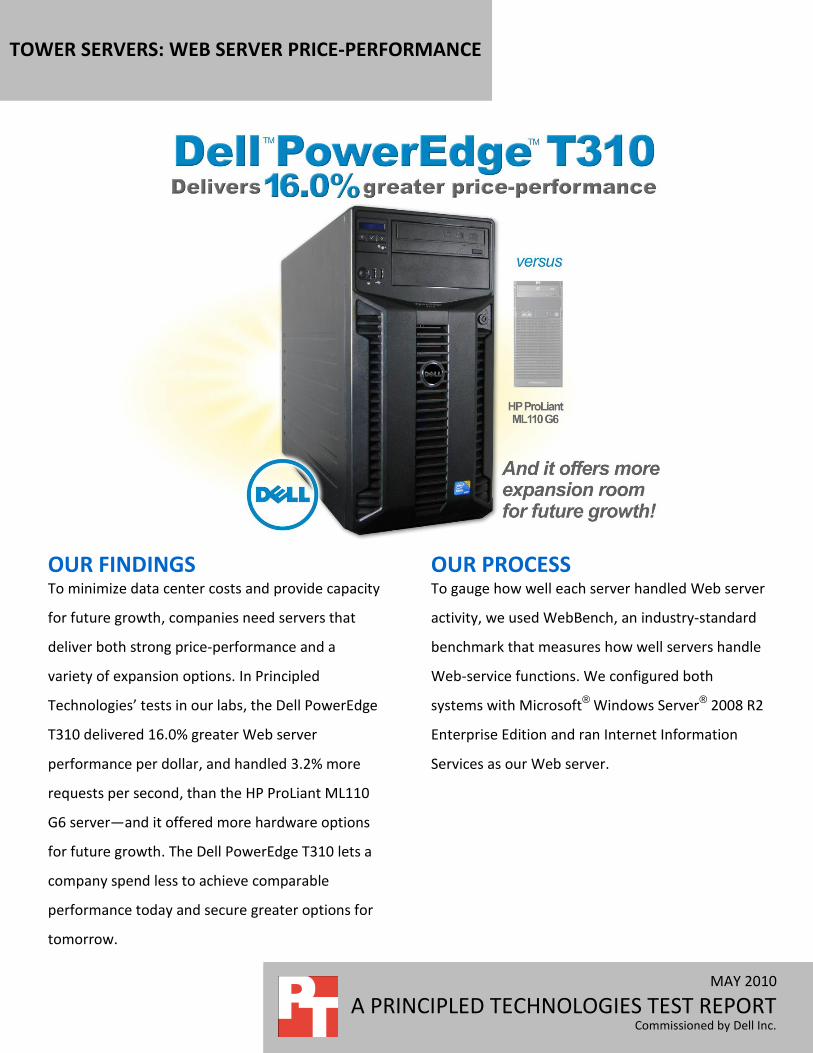
TOWER SERVERS: WEB SERVER PRICE-PERFORMANCE
MAY 2010
A PRINCIPLED TECHNOLOGIES TEST REPORT Commissioned by Dell Inc.
OUR FINDINGS To minimize data center costs and provide capacity
for future growth, companies need servers that
deliver both strong price-performance and a
variety of expansion options. In Principled
Technologies’ tests in our labs, the Dell PowerEdge
T310 delivered 16.0% greater Web server
performance per dollar, and handled 3.2% more
requests per second, than the HP ProLiant ML110
G6 server—and it offered more hardware options
for future growth. The Dell PowerEdge T310 lets a
company spend less to achieve comparable
performance today and secure greater options for
tomorrow.
OUR PROCESS To gauge how well each server handled Web server
activity, we used WebBench, an industry-standard
benchmark that measures how well servers handle
Web-service functions. We configured both
systems with Microsoft® Windows Server® 2008 R2
Enterprise Edition and ran Internet Information
Services as our Web server.
A Principled Technologies test report 2
Tower servers: Web server price-performance
PROJECT OVERVIEW The goals of the project were to determine which of the following systems had better Web server
price-performance and could deliver more requests per second, and to determine which server offered more
advanced hardware options to allow for future growth:
Dell PowerEdge T310
HP ProLiant ML110 G6 Both servers ran Microsoft Windows Server 2008 R2 Enterprise Edition. We used 48 clients running
Microsoft Windows XP Professional Service Pack 3 to induce a heavy Web server load on the server.
We also compared the upgrade capabilities of each server’s online offerings to determine which
system had superior hardware options.
WORKLOAD WebBench 5.0 (128-bit US version) is an industry-standard benchmark for Web server software and
hardware. It uses PC clients to send Web requests to the server under test. It generates performance results
by incrementally increasing the number of clients making HTTP 1.0 GET requests to the Web server; the result
is a curve showing the performance of the server under test. The peak of that curve represents the peak
throughput of the server. WebBench reports results in the total number of requests per second the server
handled.
We ran WebBench’s e-commerce CGI test suite, which generates a mixture of secure and non-secure,
dynamic and static HTTP 1.0 GET requests. A default WebBench test suite incrementally increases the number
of clients making the HTTP 1.0 GET requests to the Web server. As the number of clients increase, the clients
increasingly saturate the Web server’s resources until a component, in this case the network cards, reaches
maximum utilization. Each workload point with a fixed number of clients is a WebBench “mix.” The e-
commerce CGI test suite begins with a mix that involves one client; the next mix involves four clients; and each
subsequent mix increases the number of clients by four. Once the increasing number of clients no longer
demonstrated proportional growth in requests per second for three consecutive mixes, we took the highest
measurement of requests per second from those mixes.

A Principled Technologies test report 3
Tower servers: Web server price-performance
SYSTEM COMPARISON Figure 1 highlights some similarities and differences between the two servers. Appendix A presents
detailed system information.
Hardware specifications Dell PowerEdge T310 HP ProLiant ML110 G6
CPU Intel® Xeon® X3460 Intel Xeon X3460
CPU speed (GHz) 2.80 2.80
Number of processor packages 1 1
Number of cores per processor package
4 4
Number of hardware threads per core
2 2
Memory type PC3-10600E PC3-10600E
Total memory (GB) 8 8
Maximum supported memory (GB) 32 16
Redundant power supply Available Not available
Bin processor options Configurable with the Intel Xeon Processor X3470, at 2.93GHz
Support only through the Intel Xeon Processor X3460, at 2.80GHz
Figure 1: System configuration information for the test servers.
As Figure 1 shows, the servers are very similar. The primary differences lie in the Dell PowerEdge
T310’s greater potential for future expansion in the following three areas:
Redundant power supply. The Dell PowerEdge T310 is available with a redundant power supply
option, while the HP ProLiant ML110 G6 only offers non-redundant configurations. Redundant
power supplies prevent server downtime in the event of a power supply failure.
Maximum memory. The Dell PowerEdge T310 offers expansive memory configuration options
supporting up to 32GB RAM, while the HP ProLiant ML110 G6 supports only 16GB RAM.
Bin processor options. The Dell PowerEdge T310 is configurable with the Intel Xeon Processor
X3470, at 2.93GHz, while the HP ProLiant ML110 G6 only offers up to the Intel Xeon Processor
X3460, at 2.80GHz (Source:
http://h71016.www7.hp.com/dstore/MiddleFrame.asp?page=config&ProductLineId=431&FamilyId
=3093&BaseId=31701&oi=E9CED&BEID=19701&SBLID= April 30, 2010).

A Principled Technologies test report 4
Tower servers: Web server price-performance
WHAT WE FOUND
As Figure 2 shows, the Dell
PowerEdge T310 achieved a
WebBench price-performance
score of 5.75 requests per
second/dollar, a 16.0 percent
greater price-performance score
than the HP ProLiant ML110 G6,
which achieved a price-
performance score of 4.96
requests per second/dollar. To
calculate the price-performance,
we divided requests per second by
price.
Figure 3 shows the prices of
the two servers on April 27, 2010.
The Dell PowerEdge T310, at
$4,049, cost 11.0 percent less than
the HP ProLiant ML110 G6 at
$4,550.
0
1
2
3
4
5
6
7
Re
qu
est
pe
r se
con
d/d
oll
ar
Server
WebBench price performance(Higher numbers are better)
Dell PowerEdge T310
HP ProLiant ML110 G6
Figure 2: Normalized WebBench price performance results for the two servers. Higher numbers are better.
$0
$1,000
$2,000
$3,000
$4,000
$5,000
Pri
ce a
s o
f 4/
27/2
010
Server
Price comparison (Lower numbers are better)
Dell PowerEdge T310
HP ProLiant ML110 G6
Figure 3: Price comparison for the two servers. Lower numbers are better.
A Principled Technologies test report 5
Tower servers: Web server price-performance
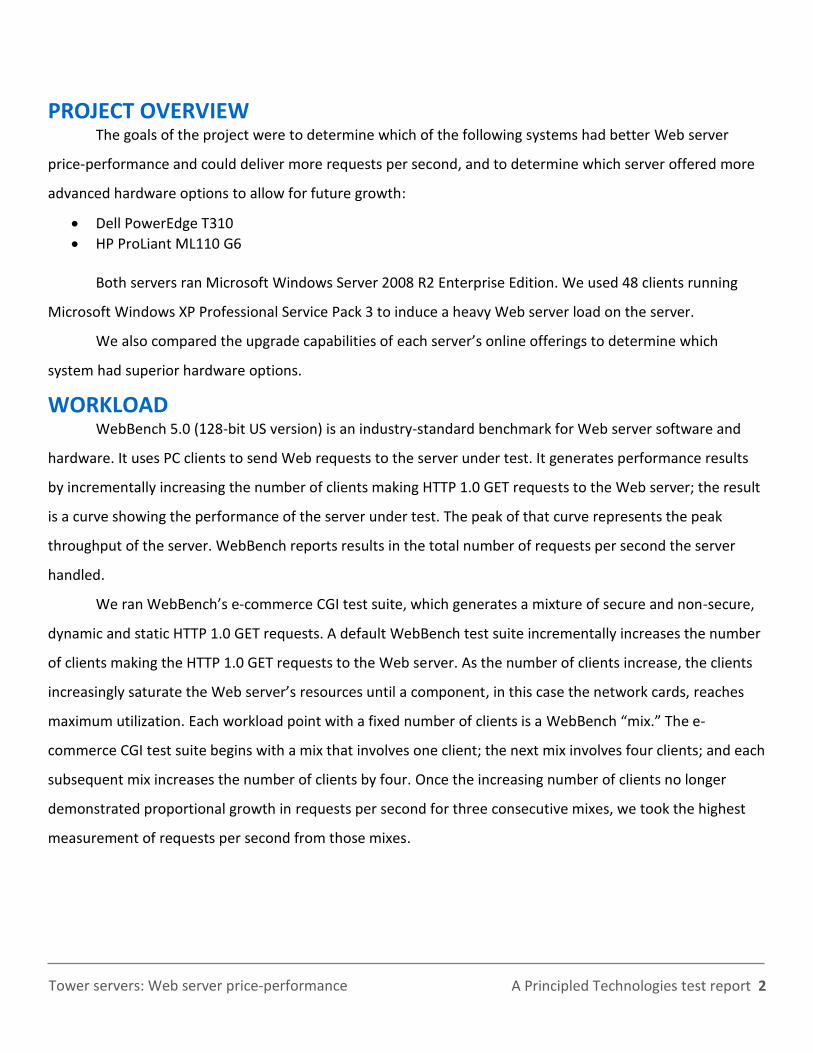
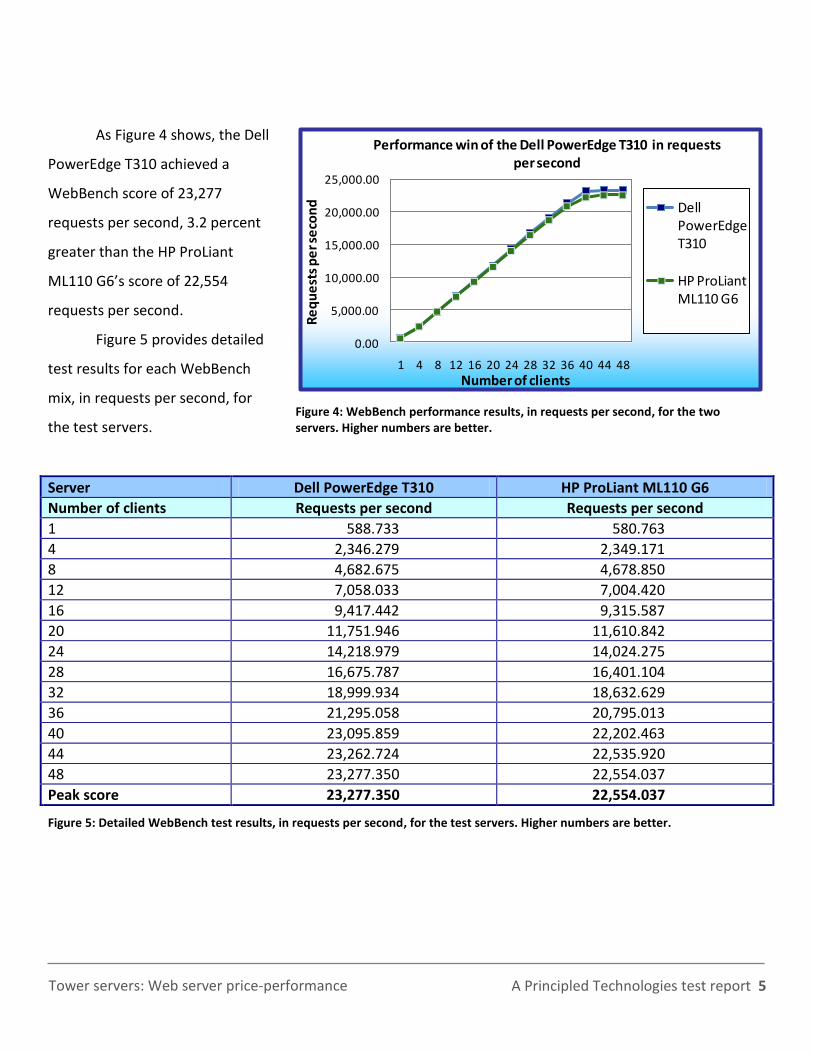
As Figure 4 shows, the Dell
PowerEdge T310 achieved a
WebBench score of 23,277
requests per second, 3.2 percent
greater than the HP ProLiant
ML110 G6’s score of 22,554
requests per second.
Figure 5 provides detailed
test results for each WebBench
mix, in requests per second, for
the test servers.
Server Dell PowerEdge T310 HP ProLiant ML110 G6
Number of clients Requests per second Requests per second
1 588.733 580.763
4 2,346.279 2,349.171
8 4,682.675 4,678.850
12 7,058.033 7,004.420
16 9,417.442 9,315.587
20 11,751.946 11,610.842
24 14,218.979 14,024.275
28 16,675.787 16,401.104
32 18,999.934 18,632.629
36 21,295.058 20,795.013
40 23,095.859 22,202.463
44 23,262.724 22,535.920
48 23,277.350 22,554.037
Peak score 23,277.350 22,554.037
Figure 5: Detailed WebBench test results, in requests per second, for the test servers. Higher numbers are better.
0.00
5,000.00
10,000.00
15,000.00
20,000.00
25,000.00
1 4 8 12 16 20 24 28 32 36 40 44 48
Re
qu
est
s p
er s
eco
nd
Number of clients
Performance win of the Dell PowerEdge T310 in requests per second
Dell PowerEdge T310
HP ProLiant ML110 G6
Figure 4: WebBench performance results, in requests per second, for the two servers. Higher numbers are better.

A Principled Technologies test report 6
Tower servers: Web server price-performance
HOW WE TESTED Setting up the servers
For each server, we configured two internal SAS hard drives into a RAID 1 volume. We installed a fresh
copy of Microsoft Windows Server 2008 R2 Enterprise Edition on both servers. Following the operating system
installation, we installed all recommended Windows Updates through May 4th, 2010.
Installing Microsoft Windows Server 2008 R2 Enterprise Edition on the host server
1. Boot the server, and insert the Windows Server 2008 R2 installation DVD in the DVD-ROM drive. 2. At the Language Selection Screen, click Next. 3. Click Install Now. 4. Select Windows Server 2008 R2 Enterprise (Full Installation), and click Next. 5. Click the I accept the license terms check box, and click Next. 6. Click Custom. 7. Click Drive options (advanced). 8. Ensure you select the proper drive, and click New. 9. Click Apply. 10. Click Next. 11. At the User’s password must be changed before logging on warning screen, click OK. 12. Type Password1 as the new password in both fields, and click the arrow to continue. 13. At the Your password has been changed screen, click OK.
Setting up the network configuration on the server
1. Click StartNetwork. Click Network and Sharing Center, and click Change Adapter Settings. 2. Double-click the appropriate Local Area Connection assigned to the first half of the clients. 3. Select Internet Protocol Version 4 (TCP/IPv4), and click Properties. 4. In the Internet Protocol Version 4 (TCP/IPv4) Properties screen, select the Use the following IP address
radio button. 5. Enter a valid static IP address, subnet mask, and default gateway. 6. Click OK, and click Close to exit. 7. Repeat steps 2 through 6 for the second Local Area Connection assigned to the second half of the
clients.
Setting up the Application Server
1. Click StartAdministrative ToolsServer Manager. 2. Click Roles on the left side. 3. Click Add Roles. 4. Click the Application Server check box. 5. When the Add features required for Application Server? screen appears, click Add Required Features. 6. Click Next. 7. Click Next. 8. At the Select Role Services page for Application Server, click the Web Server (IIS) Support check box.

A Principled Technologies test report 7
Tower servers: Web server price-performance
9. When the Add features required for Web Server (IIS) Support? screen appears, click Add Required Features.
10. Click Next. 11. Click Next. 12. At the Select Role Services page for Web Server (IIS), click IIS 6 Management Compatibility, ASP, and
CGI check boxes. Click Next. 13. Click Install. 14. Click Close.
Installing and configuring the Web server (WebBench) Deploying WebBench data
WebBench includes data that must reside on the server and that the Web server must use. We used
the following procedure to load that data, and set the Web server to use it:
1. Copy the file wbtree.exe from the WebBench CD to the wwwroot directory on the server under test. (The wbtree.exe file is on the WebBench CD at \wb50\workload. The wwwroot directory is located at C:\inetpub\wwwroot).
2. On the server, execute the wbtree.exe file. This program copies the WebBench workload to the server. 3. In the wwwroot folder on the server, create a new folder with the name CGI-BIN. 4. Copy the file simcgi.exe to the CGI-BIN folder.
Configuring Internet Information Services (IIS)
We configured the Windows Internet Information Services Web server as follows:
1. Open Computer Management. 2. Go to Services and ApplicationsInternet Information Services (IIS) ManagerServerName. 3. Double-click MIME Types. 4. In the MIME Types window, click Add. 5. In the Extension field, type *.
6. In the MIME Type field, type application/octet-stream, and click OK. 7. Double-click the server name on the left side of the window. 8. Double-click ISAPI and CGI Restrictions. 9. Click Edit Feature Settings. 10. Click the check boxes beside Allow unspecified CGI module and Allow unspecified ISAPI modules. 11. Click OK. 12. Go to Services and ApplicationsInternet Information Services (IIS) ManagerServerName. 13. Double-click Logging. 14. Click Disable.
Installing certificate services
Because WebBench includes tests that involve security, we installed Windows Certificate Services as
follows:

A Principled Technologies test report 8
Tower servers: Web server price-performance
1. Go to Services and ApplicationsInternet Information Services (IIS) ManagerServerName. 2. Double-click Server Certificates. 3. Click Create Self-Signed Certificate. 4. Name it Performance, and click OK. 5. Go to Services and ApplicationInternet Information Services (IIS) ManagerServerName
SitesDefault Web Site. 6. Click Bindings... 7. Click the https entry, and click Edit. 8. Set the SSL Certificate to Performance, and click OK. 9. Click Add. 10. Set the type to http, and set the IP address to 192.168.1.1 11. Set the Port to 81, and click OK. 12. Click Add.
13. Set the type to https, and set the IP address to 192.168.1.1 14. Select an appropriate SSL Certificate. 15. Set the Port to 444, and click OK. 16. If a warning pops up, click Yes. 17. Click Close. 18. Double-click SSL settings. 19. Uncheck the Require SSL check box. 20. Click Apply.
Creating SSL Communication
We enabled SSL communication as follows:
1. Go to Services and ApplicationsInternet Information Services (IIS) ManagerServerName. 2. Expand the Default Web site. 3. Expand wbtree. 4. Click Wbssl. 5. Double-click SSL Settings. 6. Check Require SSL. 7. Click Apply.
We then set the following operating system tuning parameters for optimum WebBench performance.
When creating the following parameters, ensure that they are DWORD files, with decimal coding (rather than
hexadecimal):
HKLM\System\CurrentControlSet\Services\Inetinfo\Parameters\MaxCachesFileSize to 1048576
HKLM\System\CurrentControlSet\Services\HTTP\Parameters\UriMaxUriBytes to 1048576
HKLM\System\CurrentControlSet\Control\FileSystem\NtfsDisableLastAccess to 1
HKLM\System\CurrentControlSet\Services\Tcpip\Parameters\MaxHashTableSize to 65535

A Principled Technologies test report 9
Tower servers: Web server price-performance
Testing Procedure
To facilitate rebooting the clients, we stored a batch file in the Web Controller to reboot them
remotely.
1. Restart the clients. 2. Restart the server. 3. Restart the Web Controller. 4. On the desktop, double-click the Web Controller shortcut. 5. Go to the top bar, and click ClientsStart Log In… 6. Restart all of the Web Clients. 7. Wait for all of the Web Clients to appear on the left side of the WebBench Controller Program. 8. Click OK. 9. When the application prompts you to add a test suite, click Yes. 10. Select the appropriate e-commerce CGI test suite file. 11. Give the run an appropriate name (e.g., ServerXYZ_TestRun1). 12. Click OK. 13. When the Would you like to start executing the test suites? Screen appears, do not click Yes or No.
Instead, leave the screen. 14. Wait 5 minutes for the server to complete startup tasks, and then click Yes.
A Principled Technologies test report 10
Tower servers: Web server price-performance
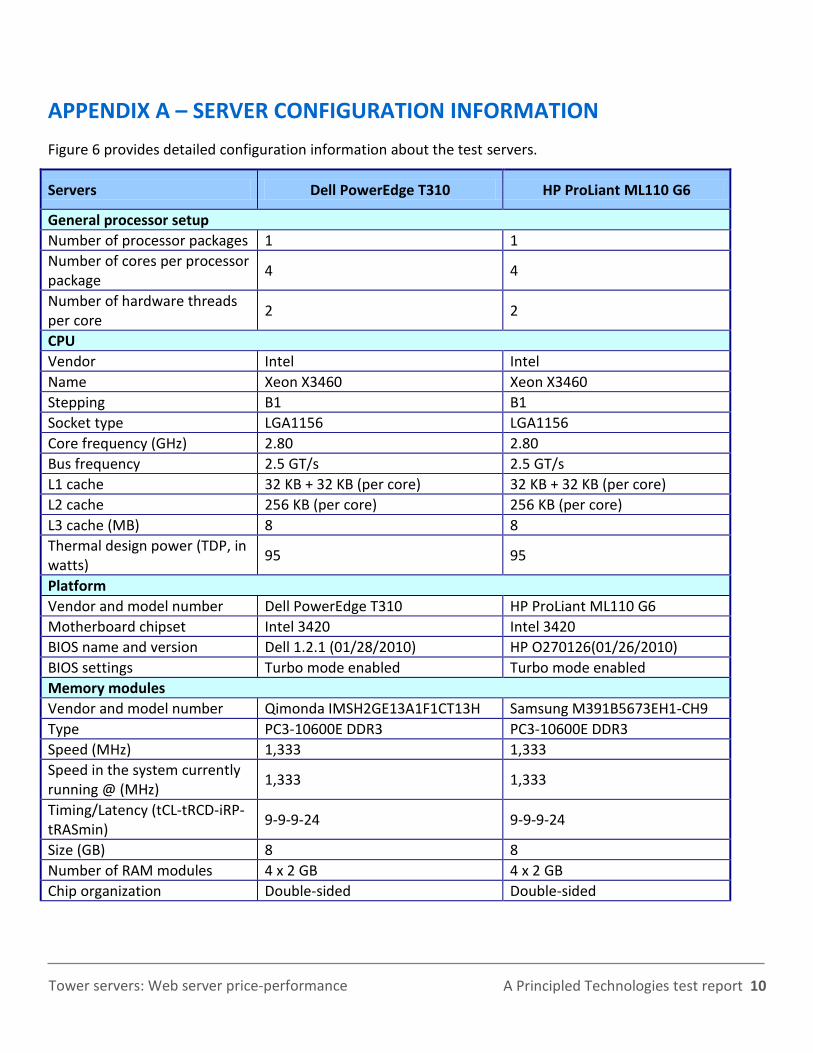
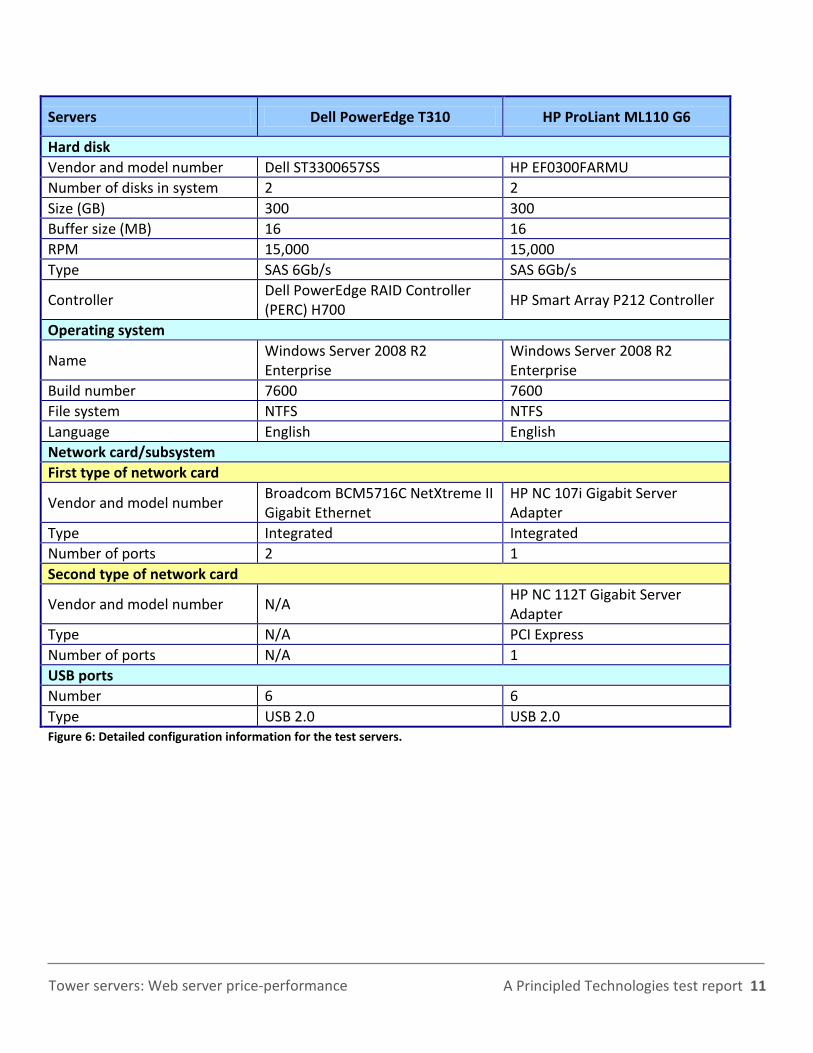
APPENDIX A – SERVER CONFIGURATION INFORMATION
Figure 6 provides detailed configuration information about the test servers.
Servers Dell PowerEdge T310 HP ProLiant ML110 G6
General processor setup
Number of processor packages 1 1
Number of cores per processor package
4 4
Number of hardware threads per core
2 2
CPU
Vendor Intel Intel
Name Xeon X3460 Xeon X3460
Stepping B1 B1
Socket type LGA1156 LGA1156
Core frequency (GHz) 2.80 2.80
Bus frequency 2.5 GT/s 2.5 GT/s
L1 cache 32 KB + 32 KB (per core) 32 KB + 32 KB (per core)
L2 cache 256 KB (per core) 256 KB (per core)
L3 cache (MB) 8 8
Thermal design power (TDP, in watts)
95 95
Platform
Vendor and model number Dell PowerEdge T310 HP ProLiant ML110 G6
Motherboard chipset Intel 3420 Intel 3420
BIOS name and version Dell 1.2.1 (01/28/2010) HP O270126(01/26/2010)
BIOS settings Turbo mode enabled Turbo mode enabled
Memory modules
Vendor and model number Qimonda IMSH2GE13A1F1CT13H Samsung M391B5673EH1-CH9
Type PC3-10600E DDR3 PC3-10600E DDR3
Speed (MHz) 1,333 1,333
Speed in the system currently running @ (MHz)
1,333 1,333
Timing/Latency (tCL-tRCD-iRP-tRASmin)
9-9-9-24 9-9-9-24
Size (GB) 8 8
Number of RAM modules 4 x 2 GB 4 x 2 GB
Chip organization Double-sided Double-sided
A Principled Technologies test report 11
Tower servers: Web server price-performance
Servers Dell PowerEdge T310 HP ProLiant ML110 G6
Hard disk
Vendor and model number Dell ST3300657SS HP EF0300FARMU
Number of disks in system 2 2
Size (GB) 300 300
Buffer size (MB) 16 16
RPM 15,000 15,000
Type SAS 6Gb/s SAS 6Gb/s
Controller Dell PowerEdge RAID Controller (PERC) H700
HP Smart Array P212 Controller
Operating system
Name Windows Server 2008 R2 Enterprise
Windows Server 2008 R2 Enterprise
Build number 7600 7600
File system NTFS NTFS
Language English English
Network card/subsystem
First type of network card
Vendor and model number Broadcom BCM5716C NetXtreme II Gigabit Ethernet
HP NC 107i Gigabit Server Adapter
Type Integrated Integrated
Number of ports 2 1
Second type of network card
Vendor and model number N/A HP NC 112T Gigabit Server Adapter
Type N/A PCI Express
Number of ports N/A 1
USB ports
Number 6 6
Type USB 2.0 USB 2.0 Figure 6: Detailed configuration information for the test servers.
A Principled Technologies test report 12
Tower servers: Web server price-performance
ABOUT PRINCIPLED TECHNOLOGIES
Principled Technologies, Inc. 1007 Slater Road, Suite 300 Durham, NC, 27703 www.principledtechnologies.com
We provide industry-leading technology assessment and fact-based marketing services. We bring to every assignment extensive experience with and expertise in all aspects of technology testing and analysis, from researching new technologies, to developing new methodologies, to testing with existing and new tools. When the assessment is complete, we know how to present the results to a broad range of target audiences. We provide our clients with the materials they need, from market-focused data to use in their own collateral to custom sales aids, such as test reports, performance assessments, and white papers. Every document reflects the results of our trusted independent analysis. We provide customized services that focus on our clients’ individual requirements. Whether the technology involves hardware, software, Web sites, or services, we offer the experience, expertise, and tools to help our clients assess how it will fare against its competition, its performance, its market readiness, and its quality and reliability. Our founders, Mark L. Van Name and Bill Catchings, have worked together in technology assessment for over 20 years. As journalists, they published over a thousand articles on a wide array of technology subjects. They created and led the Ziff-Davis Benchmark Operation, which developed such industry-standard benchmarks as Ziff Davis Media’s Winstone and WebBench. They founded and led eTesting Labs, and after the acquisition of that company by Lionbridge Technologies were the head and CTO of VeriTest.
Principled Technologies is a registered trademark of Principled Technologies, Inc. All other product names are the trademarks of their respective owners.
Disclaimer of Warranties; Limitation of Liability: PRINCIPLED TECHNOLOGIES, INC. HAS MADE REASONABLE EFFORTS TO ENSURE THE ACCURACY AND VALIDITY OF ITS TESTING, HOWEVER, PRINCIPLED TECHNOLOGIES, INC. SPECIFICALLY DISCLAIMS ANY WARRANTY, EXPRESSED OR IMPLIED, RELATING TO THE TEST RESULTS AND ANALYSIS, THEIR ACCURACY, COMPLETENESS OR QUALITY, INCLUDING ANY IMPLIED WARRANTY OF FITNESS FOR ANY PARTICULAR PURPOSE. ALL PERSONS OR ENTITIES RELYING ON THE RESULTS OF ANY TESTING DO SO AT THEIR OWN RISK, AND AGREE THAT PRINCIPLED TECHNOLOGIES, INC., ITS EMPLOYEES AND ITS SUBCONTRACTORS SHALL HAVE NO LIABILITY WHATSOEVER FROM ANY CLAIM OF LOSS OR DAMAGE ON ACCOUNT OF ANY ALLEGED ERROR OR DEFECT IN ANY TESTING PROCEDURE OR RESULT. IN NO EVENT SHALL PRINCIPLED TECHNOLOGIES, INC. BE LIABLE FOR INDIRECT, SPECIAL, INCIDENTAL, OR CONSEQUENTIAL DAMAGES IN CONNECTION WITH ITS TESTING, EVEN IF ADVISED OF THE POSSIBILITY OF SUCH DAMAGES. IN NO EVENT SHALL PRINCIPLED TECHNOLOGIES, INC.’S LIABILITY, INCLUDING FOR DIRECT DAMAGES, EXCEED THE AMOUNTS PAID IN CONNECTION WITH PRINCIPLED TECHNOLOGIES, INC.’S TESTING. CUSTOMER’S SOLE AND EXCLUSIVE REMEDIES ARE AS SET FORTH HEREIN.