Embed Size (px)
Citation preview
Towards Universal Water Supply and Sanitation for all in Urban
Areas
V. Srinivas Chary Dean of Research and Management Studies & Director,
Urban Governance and Infrastructure Development, ASCI ([email protected])

Learning Objectives
Gain better understanding :
1. Urban Water and Sanitation – Situation Analysis
2. 24-7 Water Supply in Cities – Experiences and lessons
3. Universal sanitation – Good practices
4. Lessons for achieving scale

CONTEXT
Urban Transformation
India is the second largest
urban system next to China
India is urbanizing fast
Report on Indian Urban Infrastructure and Services
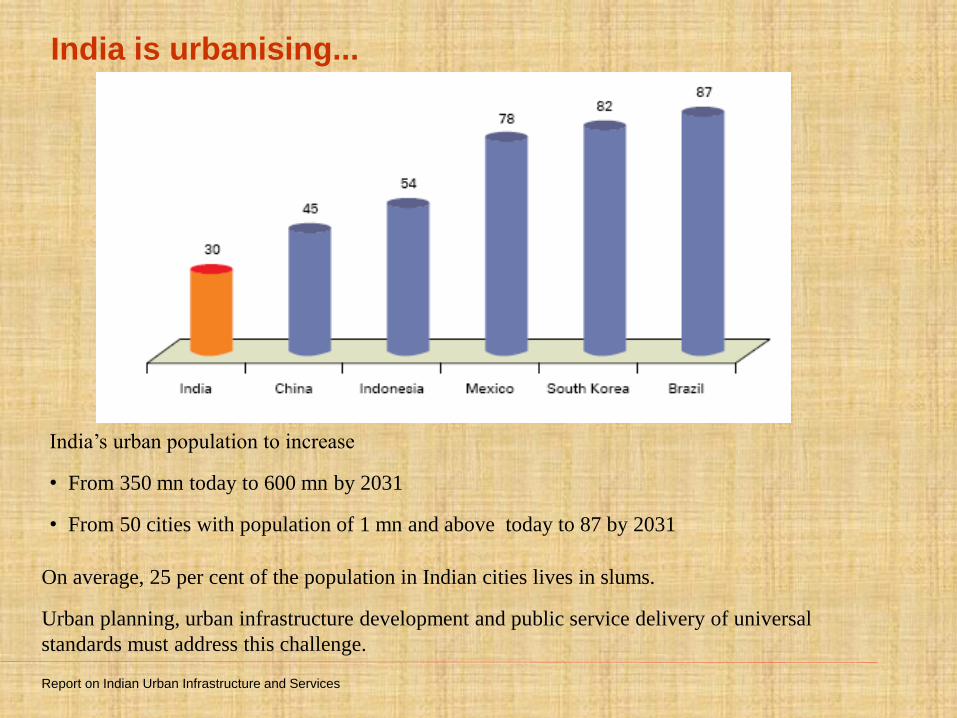
India is urbanising...
India’s urban population to increase
• From 350 mn today to 600 mn by 2031
• From 50 cities with population of 1 mn and above today to 87 by 2031
On average, 25 per cent of the population in Indian cities lives in slums.
Urban planning, urban infrastructure development and public service delivery of universal
standards must address this challenge.

+250
Urbanisation scenario
220
290 340
590
1991 2001 2008 2030
Total Population millions
856 1,040 1,155 1,470
Urbanisation rate % 26 28 30 40
In MGI’s base-case scenario, cities are likely to
house 40 percent of India’s population by 2030
Urb
an
Po
pu
lati
on
m
illi
on
s
Source: India Urbanisation Econometric Model; McKinsey Global Institute analysis

Urban Areas and Economy

Cities and Economy
• Engines of Growth – over 60% contribution to the economy
• Hubs for enterprise, innovation, people and politics
• Increasing dependence of national/state eco growth on the productivity of cities
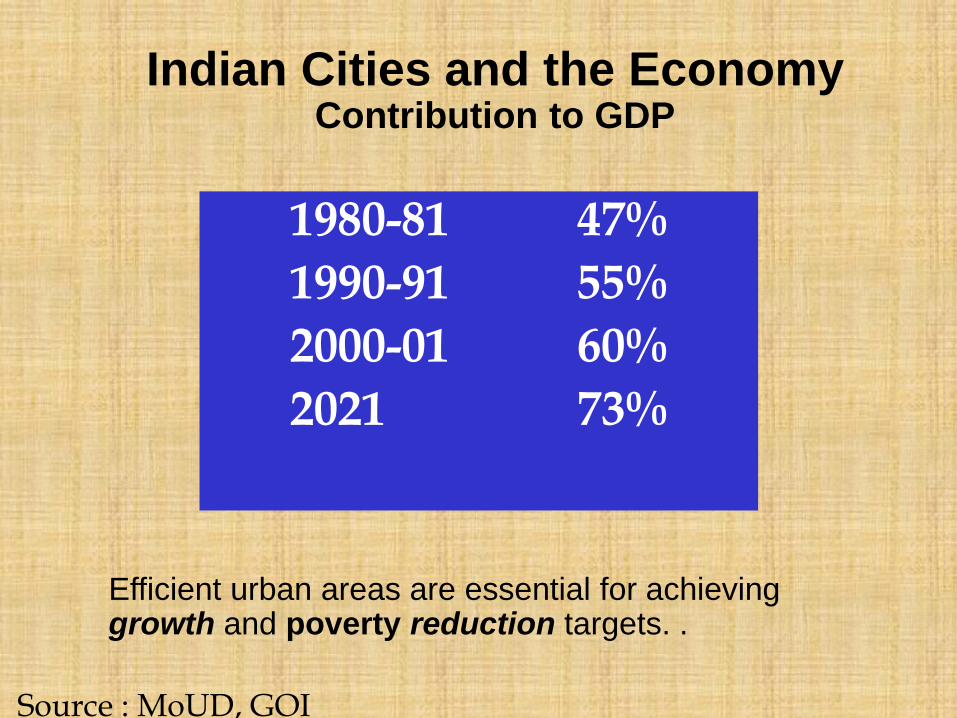
1980-81 47%
1990-91 55%
2000-01 60%
2021 73%
Indian Cities and the Economy Contribution to GDP
Source : MoUD, GOI
Efficient urban areas are essential for achieving growth and poverty reduction targets. .

Cities are competing for investments
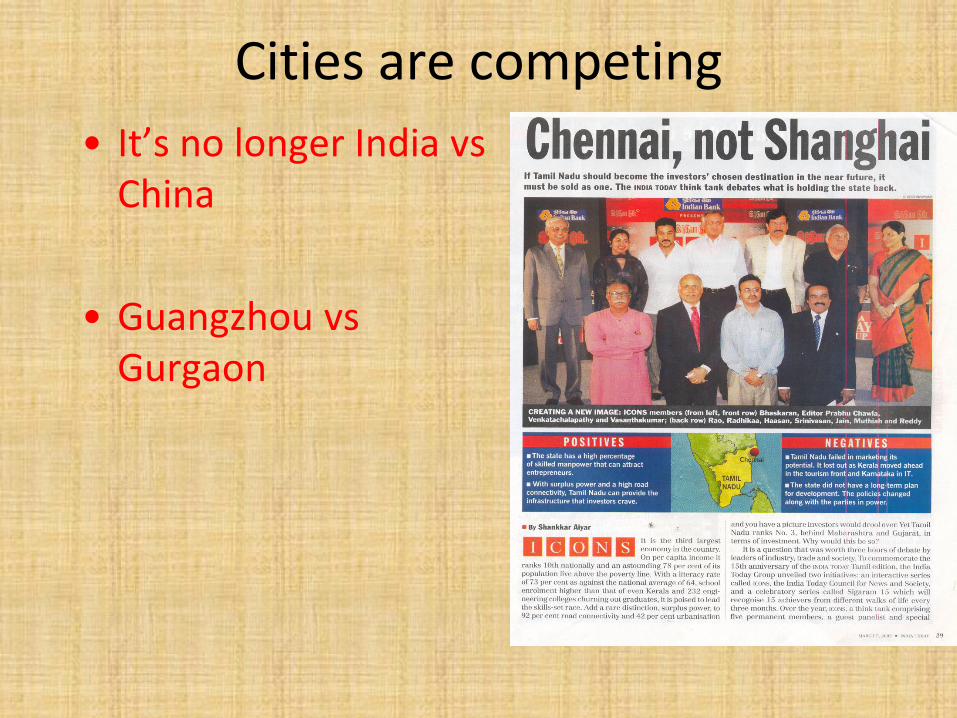
Cities are competing
• It’s no longer India vs China
• Guangzhou vs Gurgaon
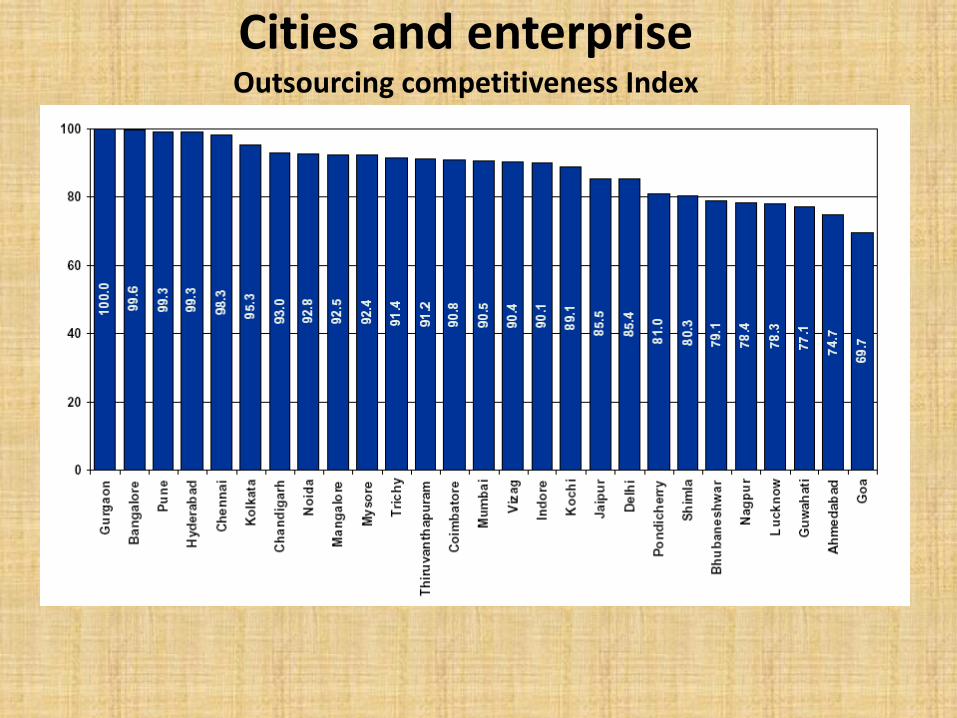
Cities and enterprise Outsourcing competitiveness Index

Cities and Poverty

Urbanization of Poverty
Cities and Poverty
City Slum Population (%)
Mumbai 49
Kolkata 33
Nagpur 35
Ludhiana 23
Meerut 44
Faridabad 47
Poverty moves to cities

Model Town
Vision
Outcomes
Output
Efficient and World Class Cities
No water-borne Disease -- quality of life
Public Health
Sustained GSDP Equitable Growth
Local Economic Growth
• World class infrastructure and high quality Municipal Services esp for the poor
Effective governance
Reliable, Continuous, High quality, Affordable

Benchmarks : Water Supply Proposed Indicator Benchmark
Coverage of Water Supply Connections
100%
Per capita availability of water at consumer end 135 lpcd
Extent of metering of water connections 100%
Extent of non revenue water 15%
Continuity of Water Supply 24X7
Efficiency in redressal of customer complaints 80%
Adequacy of Treatment and Disinfection and Quality of Water Supplied
100%
Cost recovery in water supply services 100%
Efficiency in collection of water supply related charges 90%
Number of persons receiving less than 70 lpcd 0%

Benchmarks : Sewerage Proposed Indicator Benchmark
Coverage of Waste Water Network Services
100%
Collection Efficiency of Waste Water Network 100%
Adequacy of waste water treatment capacity 100%
Quality of waste water treatment 100%
Extent of reuse and recycling of treated waste water 20%
Extent of cost recovery in waste water management 100%
Efficiency in redressal of customer complaints 80%
Efficiency in collection of sewerage charges 90%
Extent of Sewer House Connection 100%
Coverage of Toilets 100%
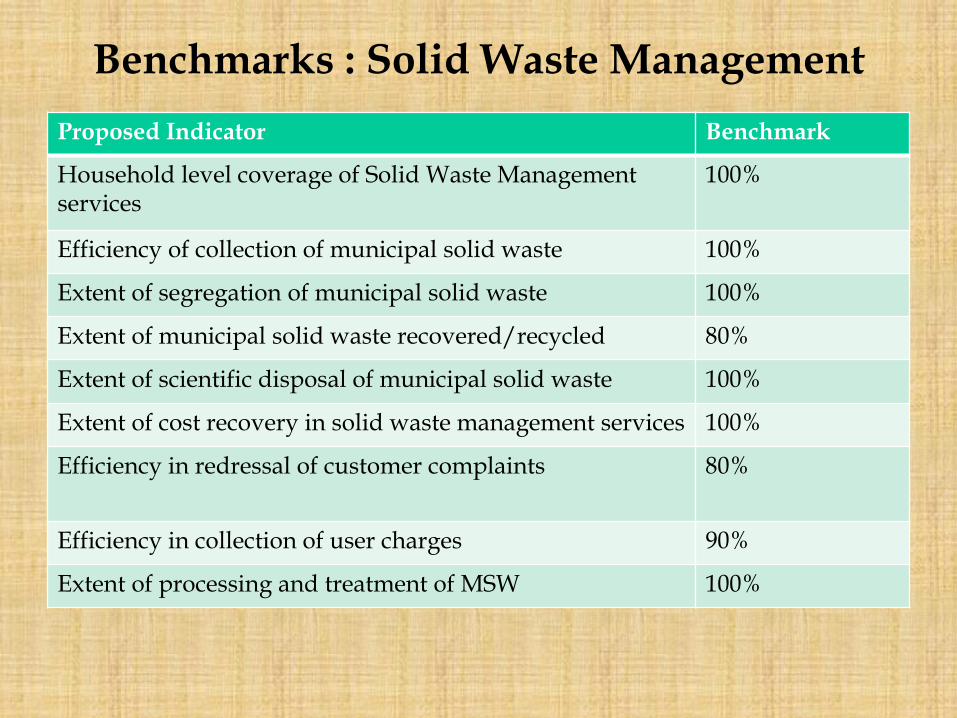
Benchmarks : Solid Waste Management
Proposed Indicator Benchmark
Household level coverage of Solid Waste Management services
100%
Efficiency of collection of municipal solid waste 100%
Extent of segregation of municipal solid waste 100%
Extent of municipal solid waste recovered/recycled 80%
Extent of scientific disposal of municipal solid waste 100%
Extent of cost recovery in solid waste management services 100%
Efficiency in redressal of customer complaints 80%
Efficiency in collection of user charges 90%
Extent of processing and treatment of MSW 100%
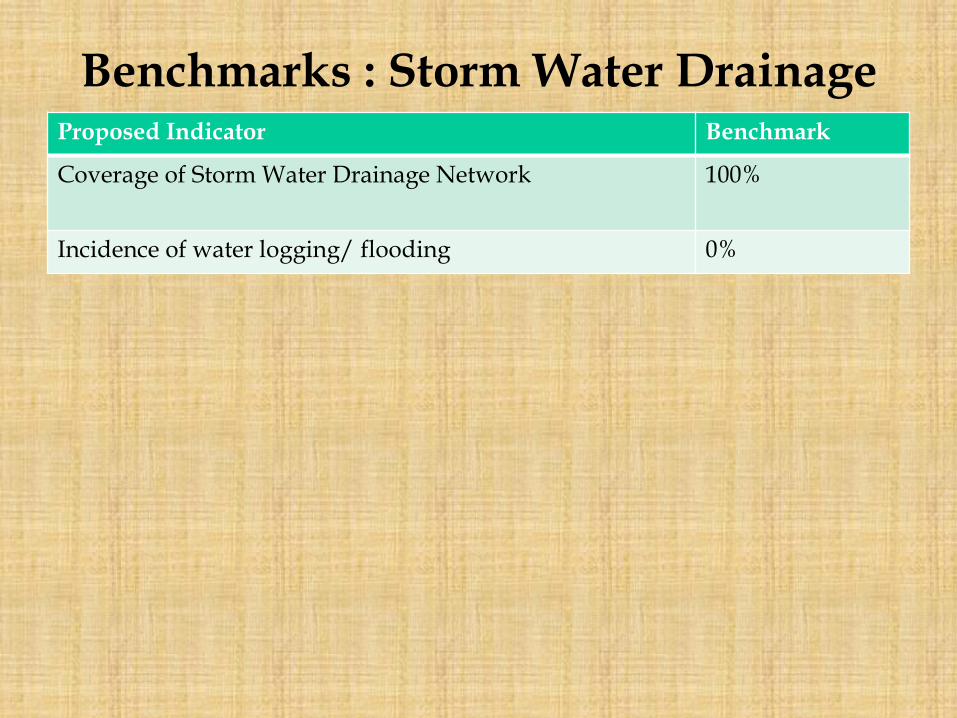
Benchmarks : Storm Water Drainage Proposed Indicator Benchmark
Coverage of Storm Water Drainage Network
100%
Incidence of water logging/ flooding 0%

Current Status
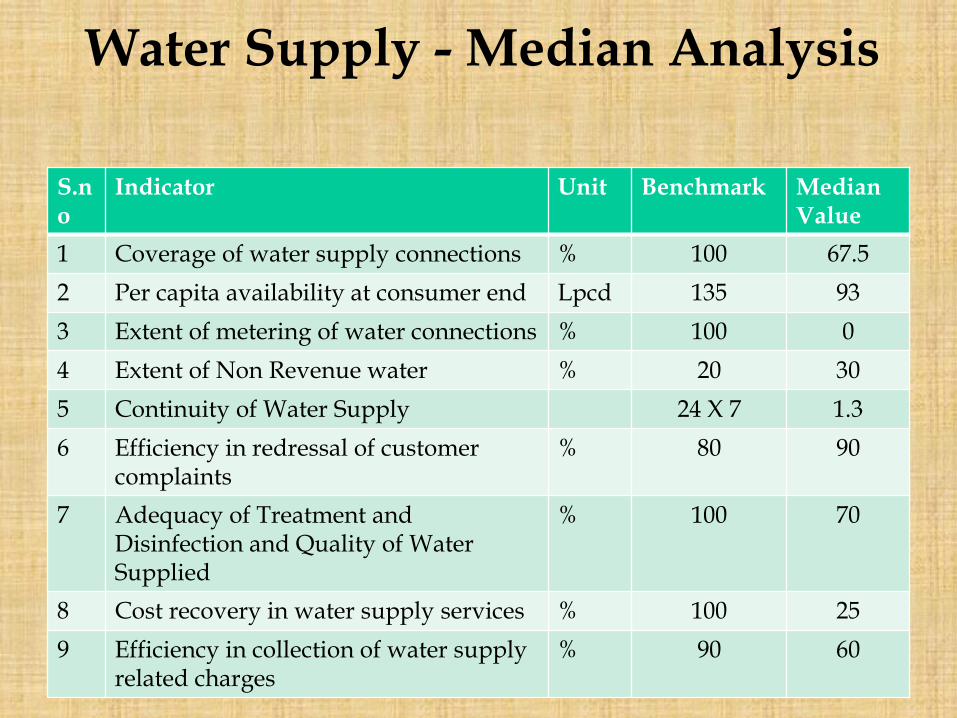
Water Supply - Median Analysis
S.no
Indicator Unit Benchmark Median Value
1 Coverage of water supply connections % 100 67.5
2 Per capita availability at consumer end Lpcd 135 93
3 Extent of metering of water connections % 100 0
4 Extent of Non Revenue water % 20 30
5 Continuity of Water Supply 24 X 7 1.3
6 Efficiency in redressal of customer complaints
% 80 90
7 Adequacy of Treatment and Disinfection and Quality of Water Supplied
% 100 70
8 Cost recovery in water supply services % 100 25
9 Efficiency in collection of water supply related charges
% 90 60

Sewerage – Median Analysis S.no
Indicator Unit Benchmark Median Value
1 Coverage of Toilets % 100 70
2 Coverage of Waste Water Network Services
% 100 23.5
3 Collection Efficiency of Waste Water Network
% 100 0
4 Adequacy of waste water treatment capacity
% 100 0
5 Quality of waste water treatment 100 0
6 Extent of reuse and recycling of treated waste water
% 20 0
7 Extent of cost recovery in waste water management
% 100 0
8 Efficiency in redressal of customer complaints
% 80 0
9 Efficiency in collection of sewerage charges
% 90 0

Solid Waste Management – Median Analysis
S.no Indicator Unit
Benchmark
Median Value
1 Household level coverage of Solid Waste Management services
% 100 47.5
2 Efficiency of collection of municipal solid waste
% 100 70
3 Extent of segregation of municipal solid waste
% 100 10
4 Extent of municipal solid waste recovered/recycled
% 80 67.5
5 Extent of scientific disposal of municipal solid waste
% 100 20
6 Extent of cost recovery in solid waste management services
% 80 4
7 Efficiency in redressal of customer complaints
% 80 65
8 Efficiency in collection of user charges % 90 30
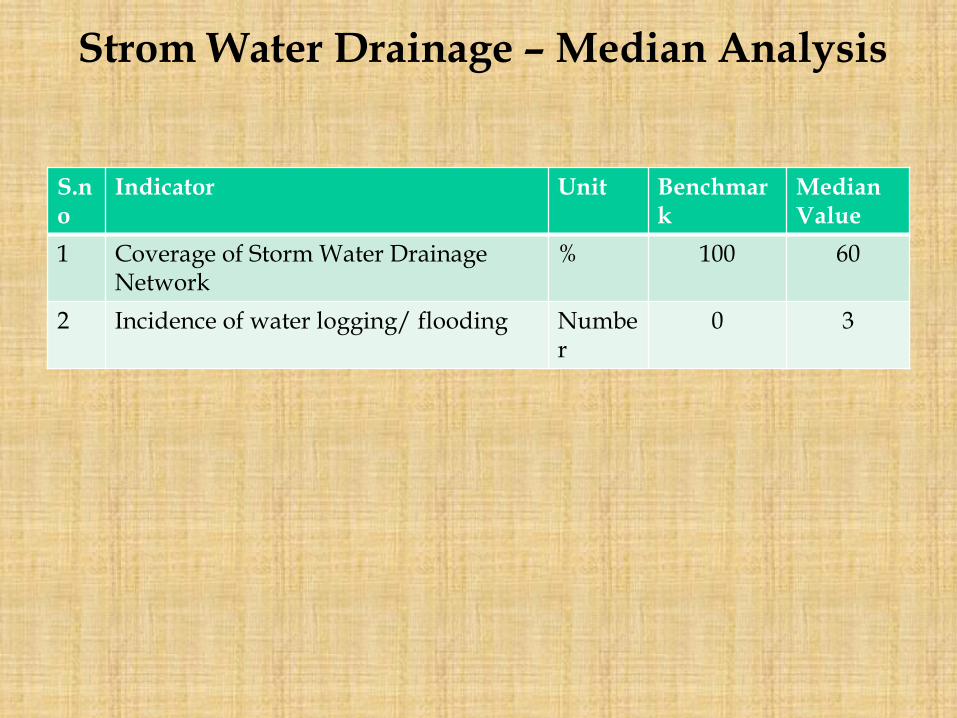
Strom Water Drainage – Median Analysis
S.no
Indicator Unit Benchmark
Median Value
1 Coverage of Storm Water Drainage Network
% 100 60
2 Incidence of water logging/ flooding Number
0 3
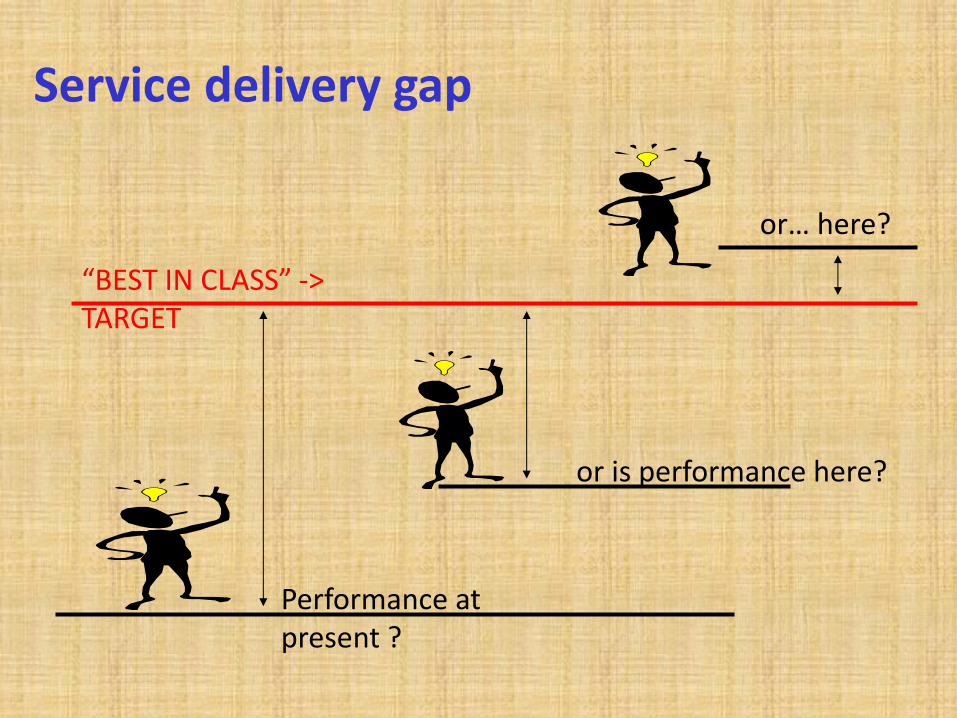
Service delivery gap
“BEST IN CLASS” -> TARGET
Performance at present ?
or is performance here?
or… here?

Good urban areas are essential for
sustaining economic growth
High quality municipal infrastructure &
services are essential for enhancing
urban productivity
especially to the poor

Need for innovations
• To improve service delivery
• To optimize cost
Product
Process
Position and
Paradigm

• Innovation is the creation of better or more effective products, processes, services, technologies, or ideas that are accepted by markets, governments, and society.
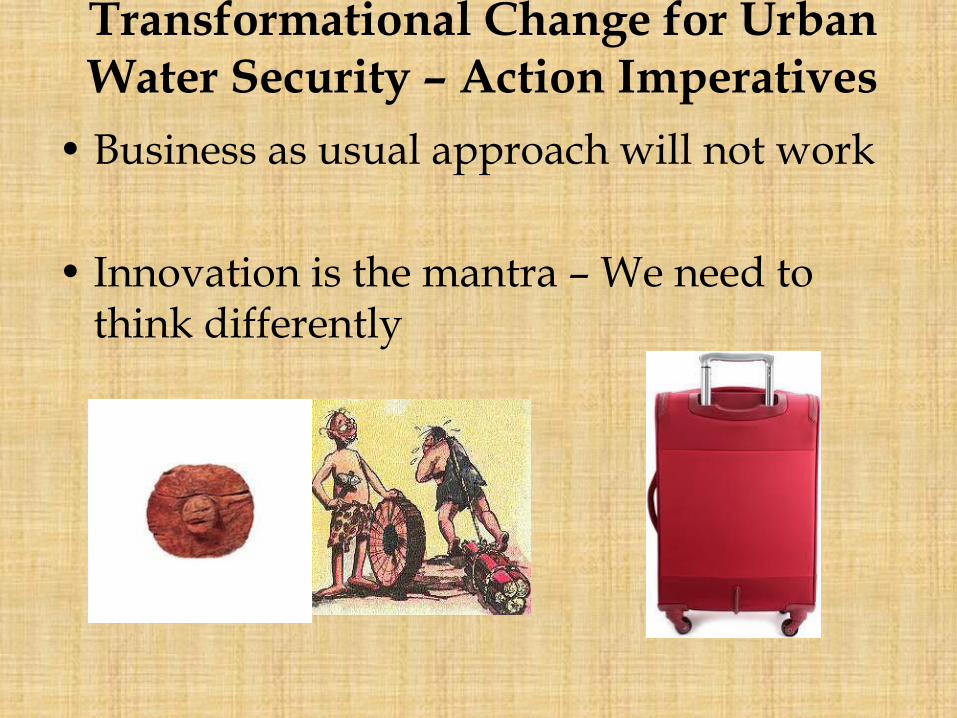
Transformational Change for Urban Water Security – Action Imperatives
• Business as usual approach will not work
• Innovation is the mantra – We need to think differently

Reinventing traditional approaches
Biotechnology Industry Research Assistance Council
(BIRAC) , A Government of India Enterprise
Announcing a Grand Challenge India Funding Opportunity
“Reinvent the Toilet Challenge - India”
Readiness for Change..
Areas
Water Sanitation
SWM
CONTINUOUS WATER SUPPLY

2- 4
24.0 24.0
0.0
4.0
8.0
12.0
16.0
20.0
24.0
Overall Average International Developing
International Developed
Availability (hrs.)
Hours of service: India

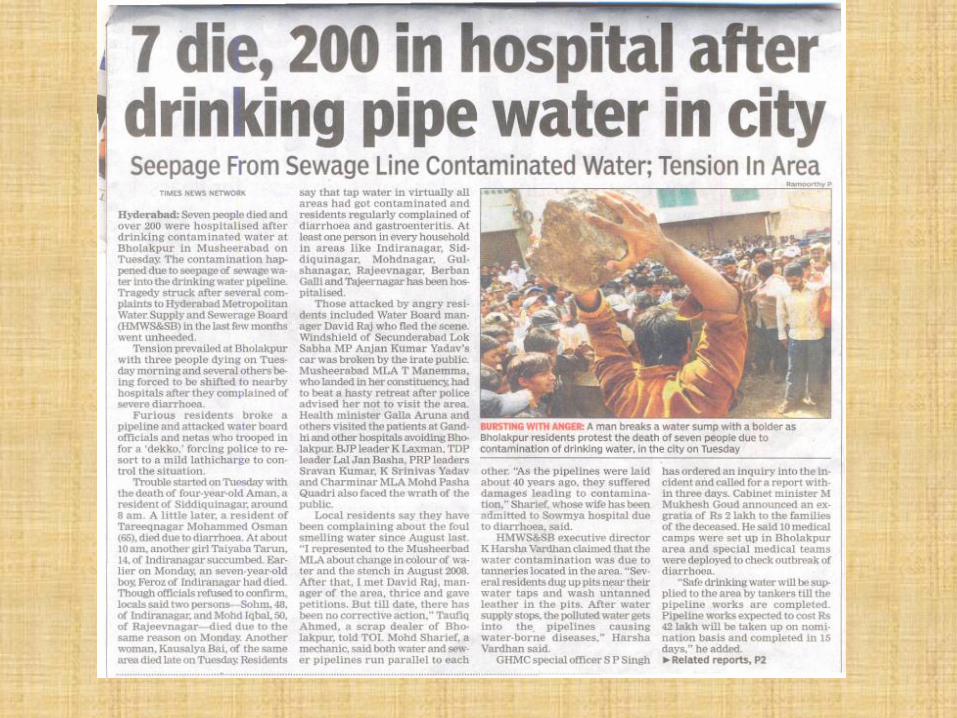
Why is Intermittent Supply Bad?
1. Risk to Public health
2. Reduction in life of assets
3. Inconvenience and economic loss to citizens especially the poor
Continuous supply avoids these problems
Problems caused by an intermittent water supply:
Mixture of Sewage
& Groundwater
Water meter
Connection toWater Main
X
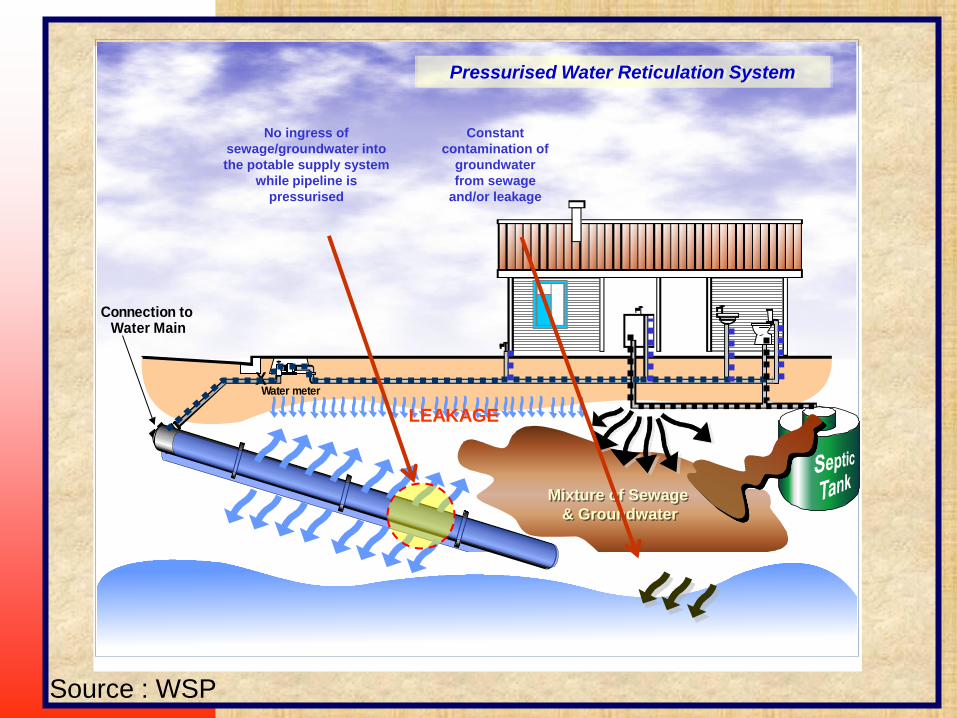
Pressurised Water Reticulation System
No ingress of
sewage/groundwater into
the potable supply system
while pipeline is
pressurised
Constant
contamination of
groundwater
from sewage
and/or leakage
LEAKAGE
Source : WSP
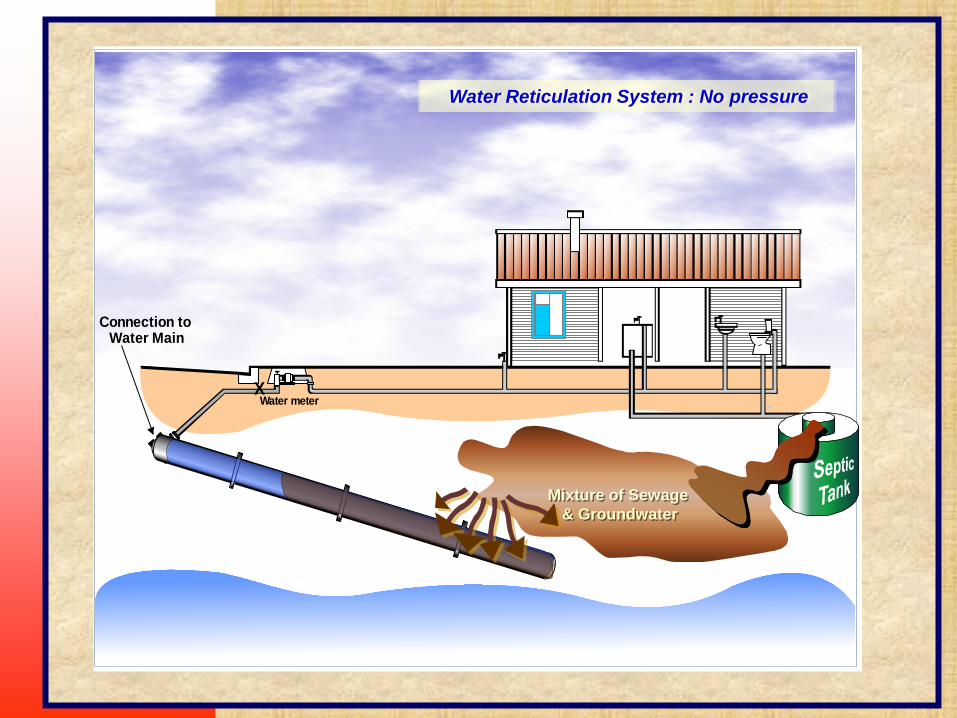
Mixture of Sewage
& Groundwater
Water meter
Connection toWater Main
X
Water Reticulation System : No pressure

Water meter
Connection toWater Main
X
Mixture of Sewage
& Potable Water
Water Reticulation System : Re-pressurised

Benefits vs. Hours/Day
Health Benefits
0
0
24
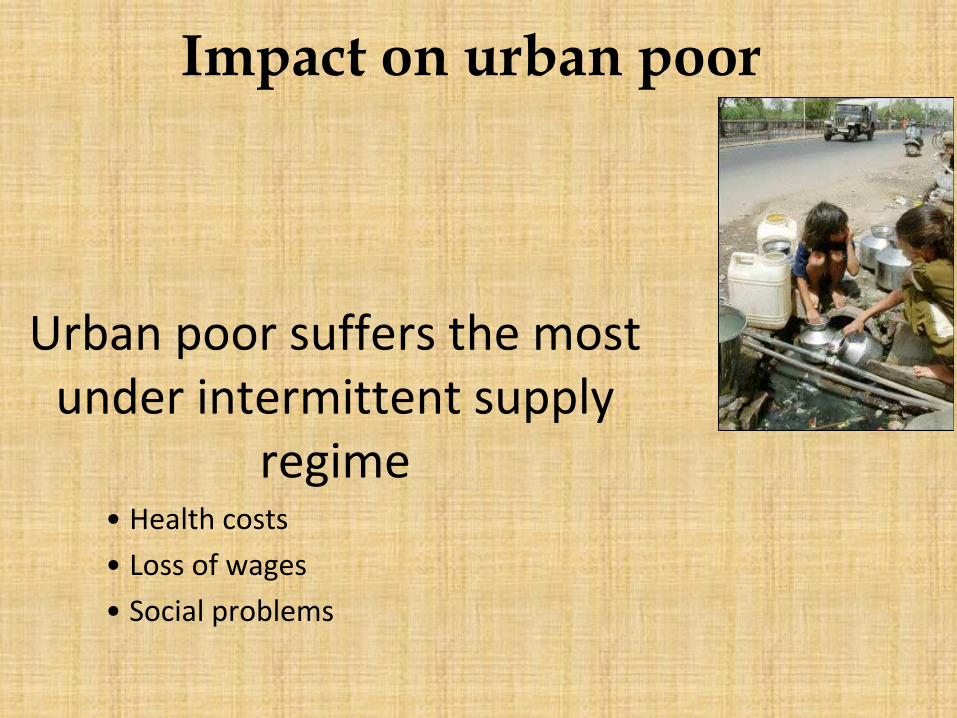
Impact on urban poor
Urban poor suffers the most under intermittent supply
regime • Health costs
• Loss of wages
• Social problems

Asset Deterioration
Problems caused by an intermittent water supply:
distribution system subjected to
unnecessary stress Shortening of infra life
2
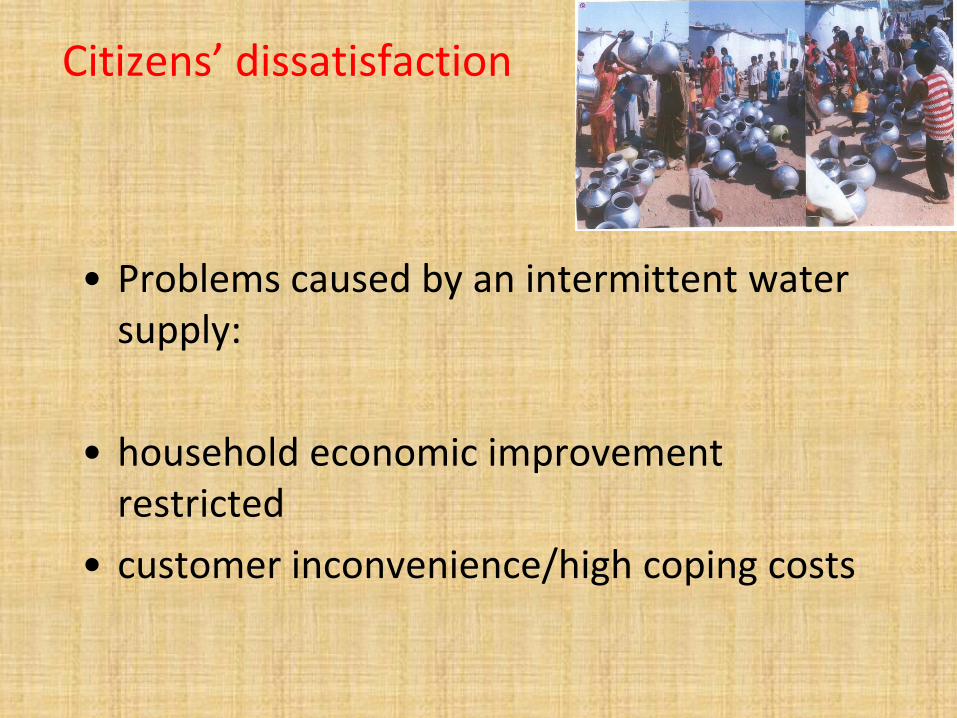
Citizens’ dissatisfaction
• Problems caused by an intermittent water supply:
• household economic improvement restricted
• customer inconvenience/high coping costs
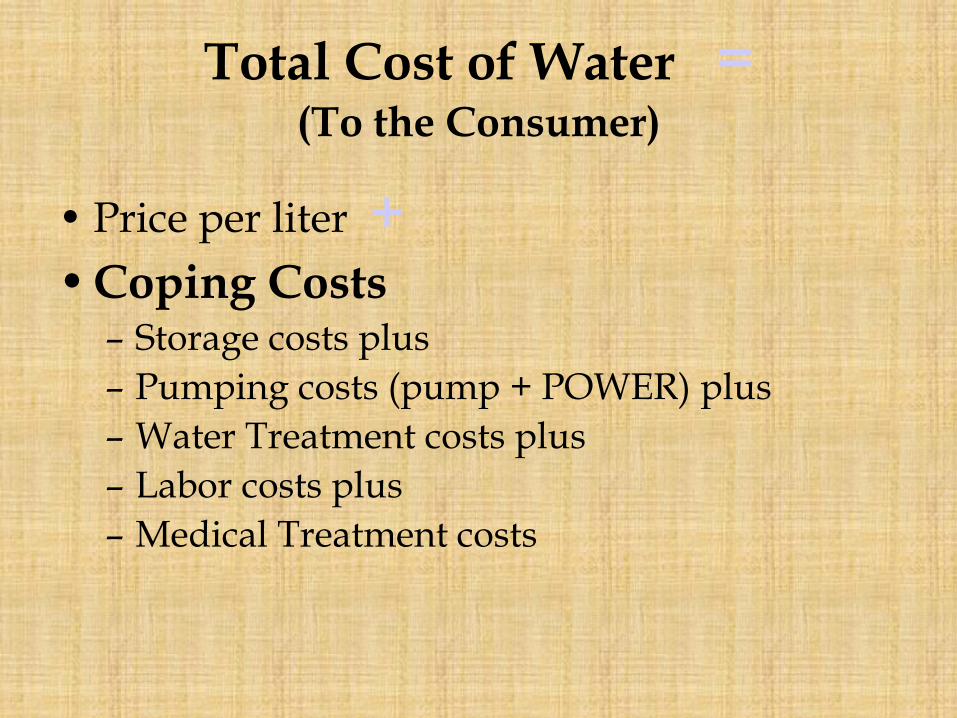
Total Cost of Water = (To the Consumer)
• Price per liter + • Coping Costs
– Storage costs plus
– Pumping costs (pump + POWER) plus
– Water Treatment costs plus
– Labor costs plus
– Medical Treatment costs

•Coping costs are significantly large;
•Poor pay lot more in relation to their income.
6

Is the goal of continuous water supply for all, feasible and ever
achievable in our towns?

Towns/Cities that have recently achieved Continuous Water Supply
• Bangkok, Thailand
• Phnom Penh, Cambodia
• Jakarta, Indonesia
• Colombo, Sri Lanka
• Chengdu, China
• Shanghai, China
• Male, Maldives
• Kuala Lumpur, Malaysia
• Tashkent, Uzbekistan
• Vientiane, Laos
• Manila, Philippines
• Ho Chi Minh, Vietnam
• Kampala, Uganda
• Dhulikhel, Nepal

49
IS THERE ENOUGH WATER ?
YES!

Cities LPCD Hrs. of Water supply
Goa 341 8
Mumbai 240 5
Delhi 220 4
Agra 220 4
Hubli-Dharwad 124 3
Ajmer-Pushkar 140 1-1.5
Vijayawada 157 4
Hyderabad 162 2
Surat 195 2-3hrs
Nagpur 200 4
France 156 24
UK 135 24
Kaula Lumpur 132 24
Colombo 119 24
Dakar, Senegal 90 24
Jakartha 80 24
No city in India has continuous water ...
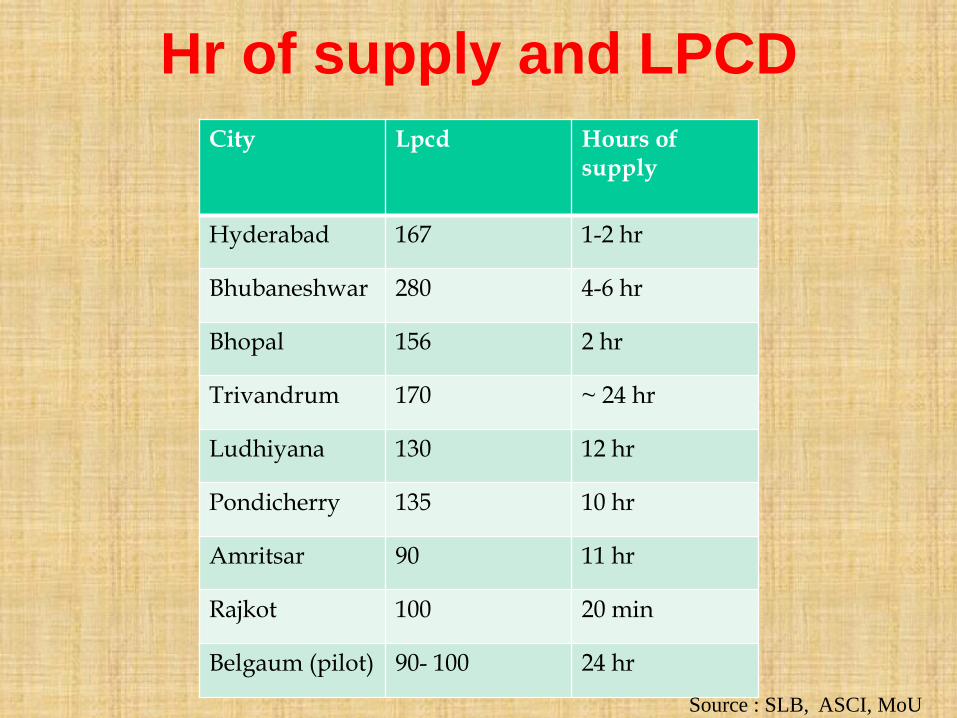
Hr of supply and LPCD
City Lpcd Hours of supply
Hyderabad 167 1-2 hr
Bhubaneshwar 280 4-6 hr
Bhopal 156 2 hr
Trivandrum 170 ~ 24 hr
Ludhiyana 130 12 hr
Pondicherry 135 10 hr
Amritsar 90 11 hr
Rajkot 100 20 min
Belgaum (pilot) 90- 100 24 hr
Source : SLB, ASCI, MoU

International experience
• Singapore – 150 lpcd – 24/7
• Few African cities – 40-70 lpcd – 24/7 (less pressure)
• Malaysia cities – 130 lpcd – 24/7
• UK (Severn Trent region) – 130 lpcd – 24/7
• India – 2 hr supply – 24/7 leakages

53
ARE 24/7 WATER SUPPLIES FEASIBLE IN INDIAN CITIES?
YES!
If:
•non revenue water is reduced significantly (> 50%)
•customer consumption is managed (including wastage)

Waste of Water
Lost Water =
Lost Revenue =
Lost Water

Water Treated
At Water Plant

Water Balance
Water Produced
Authorized Consumption
Billed & Authorized
Consumption
Billed & Metered
Revenue Water
Un-Collected
Billed & Un-Metered
Un-Billed Authorized
Consumption
Un-Billed & Metered
Non-Revenue
Water
NRW
Un-Billed & Un-Metered
Water Losses
UFW
Apparent Losses
Theft
Customer Meter Errors Data Errors
Real Losses
Storage Leakage
Transmission Main Leakage
Service Connection
Leakage
Un-Billed
1 2a
2b
3a 4a 5a
6c 5b
6b 4b
4c 3b
3c
3d
4d
4e
4f
4g
4h
4i
4j
Collected
6a

Supply side strategies
•Price signal
•Metering and volumetric billing
•Awareness
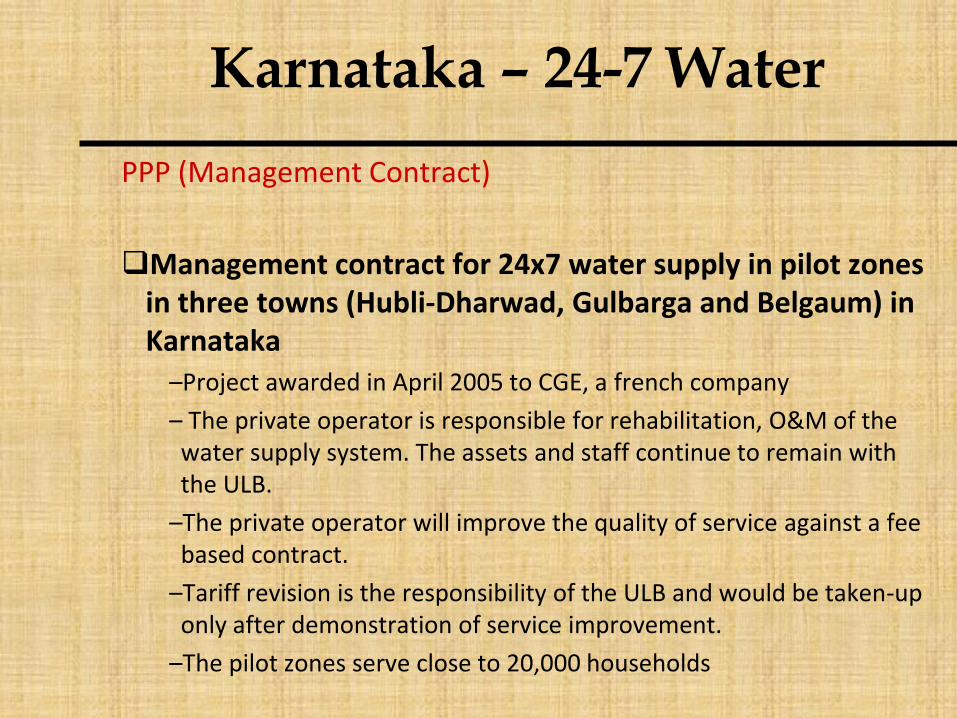
Karnataka – 24-7 Water
PPP (Management Contract)
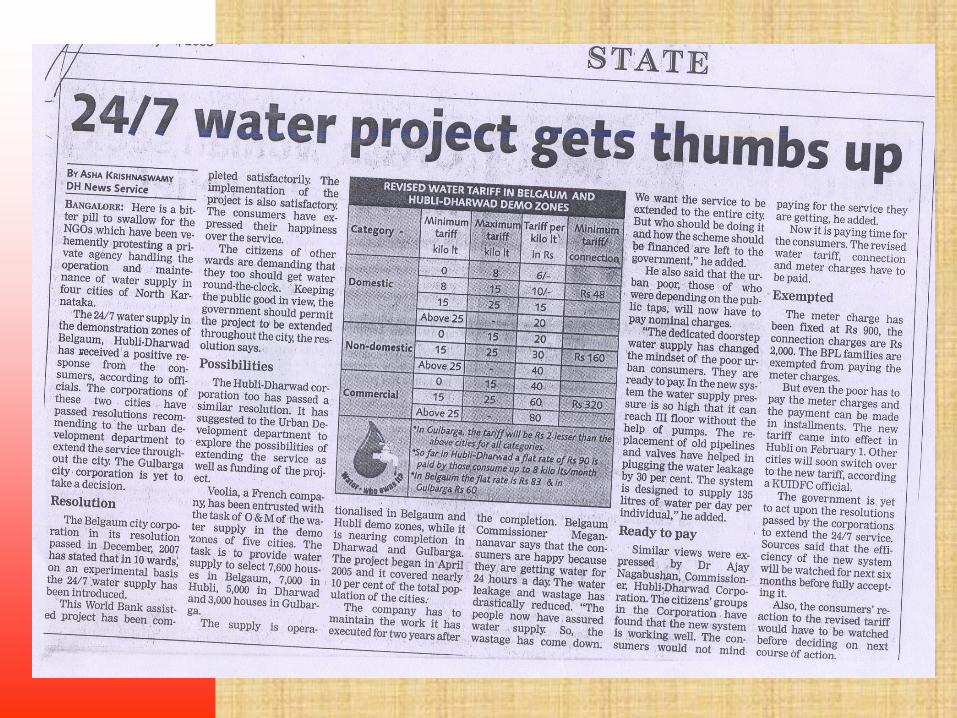
Management contract for 24x7 water supply in pilot zones in three towns (Hubli-Dharwad, Gulbarga and Belgaum) in Karnataka
–Project awarded in April 2005 to CGE, a french company
– The private operator is responsible for rehabilitation, O&M of the water supply system. The assets and staff continue to remain with the ULB.
–The private operator will improve the quality of service against a fee based contract.
–Tariff revision is the responsibility of the ULB and would be taken-up only after demonstration of service improvement.
–The pilot zones serve close to 20,000 households
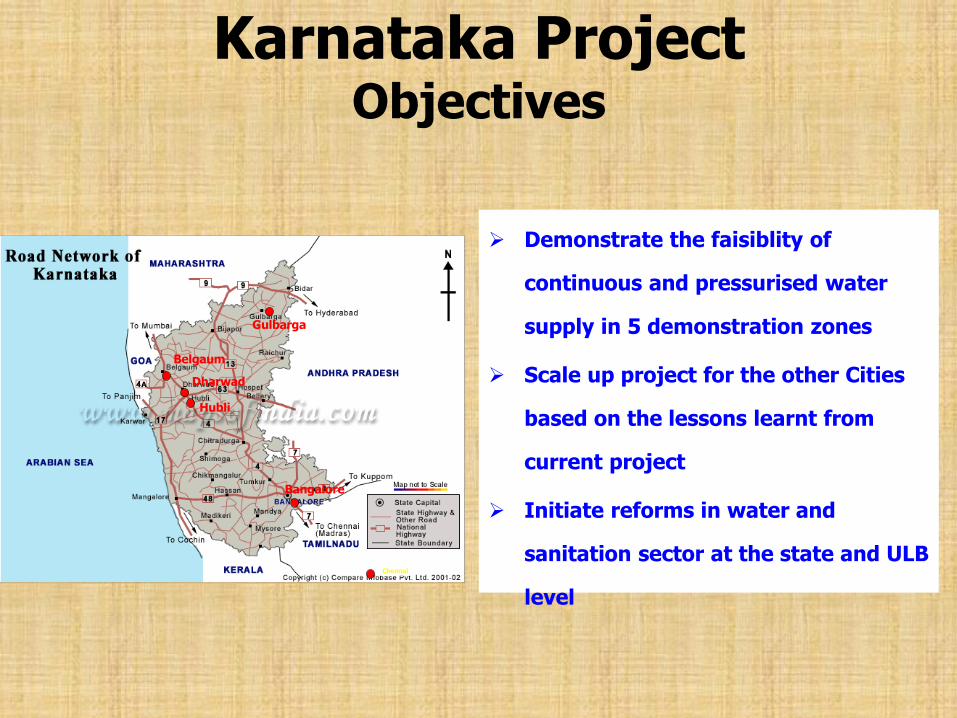
Karnataka Project Objectives
Dharwad
Belgaum
Hubli
Gulbarga
Bangalore
Chennai
Demonstrate the faisiblity of
continuous and pressurised water
supply in 5 demonstration zones
Scale up project for the other Cities
based on the lessons learnt from
current project
Initiate reforms in water and
sanitation sector at the state and ULB
level
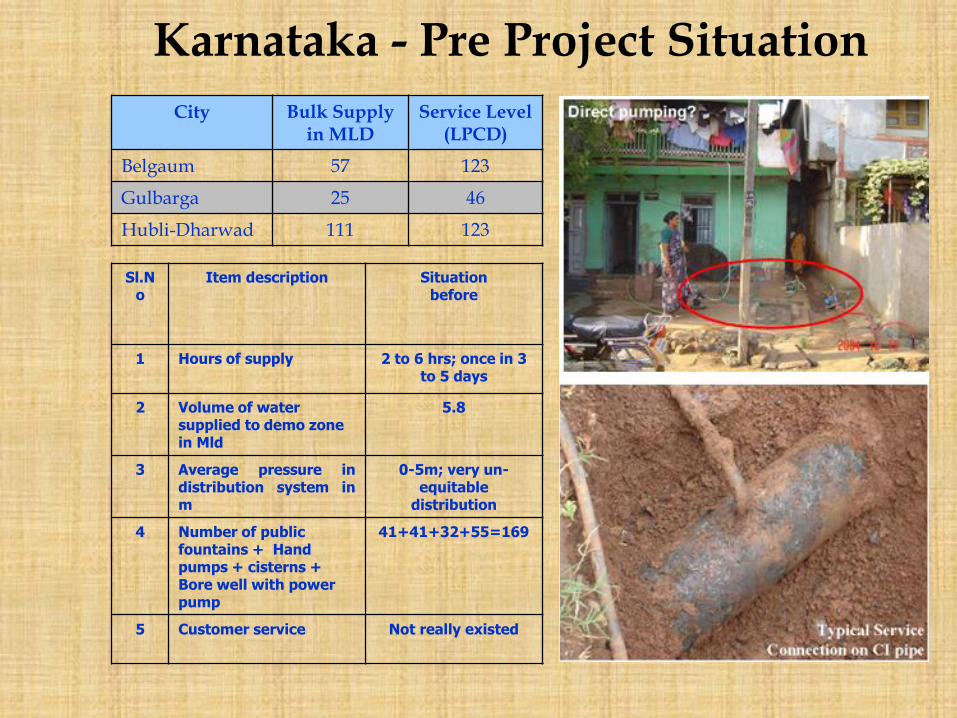
Karnataka - Pre Project Situation
City Bulk Supply in MLD
Service Level (LPCD)
Belgaum 57 123
Gulbarga 25 46
Hubli-Dharwad 111 123
Sl.No
Item description Situation before
1 Hours of supply 2 to 6 hrs; once in 3 to 5 days
2 Volume of water supplied to demo zone in Mld
5.8
3 Average pressure in distribution system in m
0-5m; very un-equitable
distribution
4 Number of public fountains + Hand pumps + cisterns + Bore well with power pump
41+41+32+55=169
5 Customer service Not really existed

KUWASIP Salient Features of The Contract
A Performance based Management Contract
Management fee divided into fixed and performance fee – 60:40
Performance fee only after achieving milestones for Performance Targets set in the
Contract
Capital expenditure limited to a maximum ceiling (agreed after three pre-bid meetings)
If capital expenditure exceeded, Contractor to bear the additional expenditure; Bonus if
saving is more than 25% of maximum ceiling
Bonus if real loss deductions is below stipulated limit
Bonus if increase in billed volume is above stipulated limit
Penalized if minimum stipulated Performance Targets not achieved in time – non payment
of Performance Remuneration
Termination of Contract if achievement of Performance Targets beyond limits
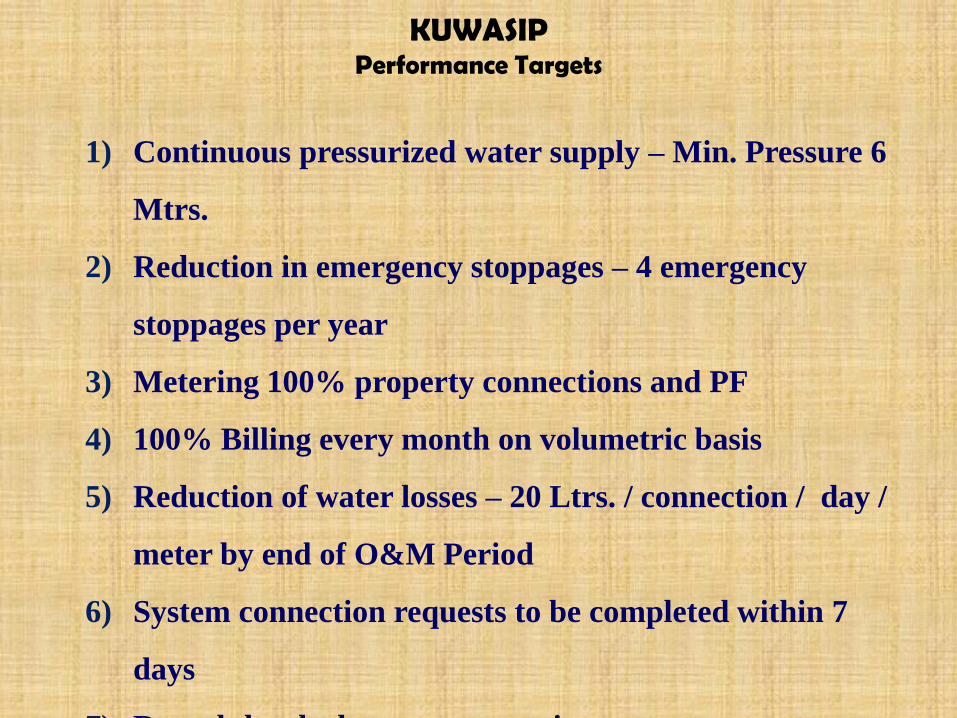
KUWASIP Performance Targets
1) Continuous pressurized water supply – Min. Pressure 6
Mtrs.
2) Reduction in emergency stoppages – 4 emergency
stoppages per year
3) Metering 100% property connections and PF
4) 100% Billing every month on volumetric basis
5) Reduction of water losses – 20 Ltrs. / connection / day /
meter by end of O&M Period
6) System connection requests to be completed within 7
days
7) Round the clock customer service centre
8) Repair leaks appearing on the surface within 24 hours
9) Respond to complaints within a day and redressal
within 7 days

KUWASIP Adequacy of available water
Per capita water supply:
Before 24x7 : 149 lpcd
Estimated : 135 lpcd
After 24x7 : 100 lpcd
100%
70% 61% of A & 88% of B
0.00
5.00
10.00
15.00
20.00
25.00
30.00
35.00
40.00
A- Supply Before 24X7(as on Mar 08)
B- Estimated @ 135 lpcd(as per contract)
C- Supply After 24X7(as on Feb 10)
Vo
lum
e o
f W
ate
r S
up
pli
ed
(MLD
)
Volume of water Supplied for 25,295 Connections
A B C
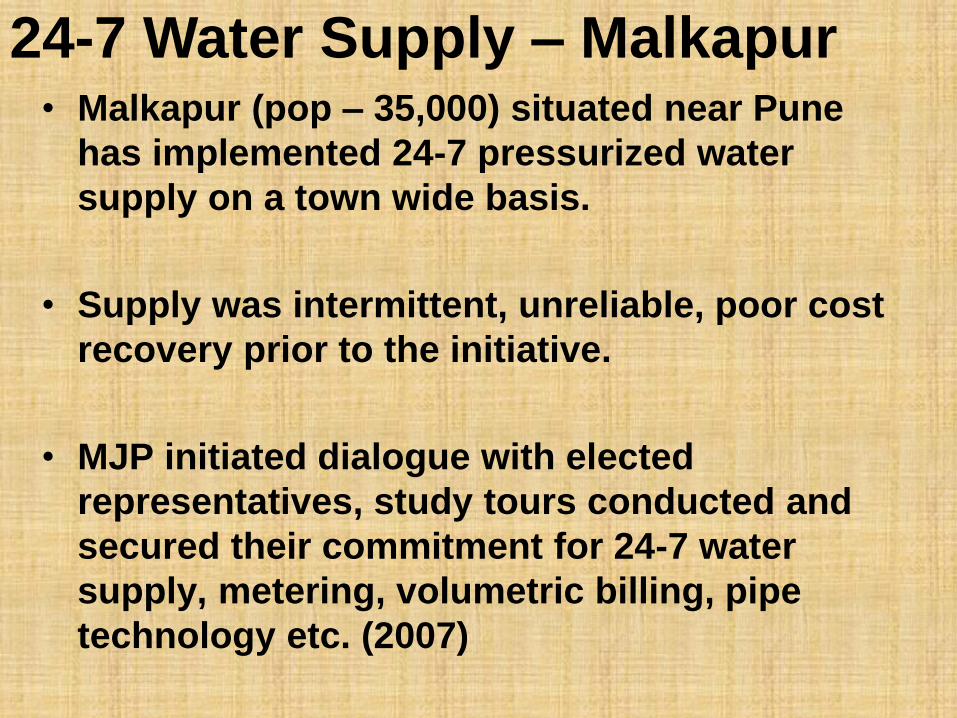
24-7 Water Supply – Malkapur • Malkapur (pop – 35,000) situated near Pune
has implemented 24-7 pressurized water
supply on a town wide basis.
• Supply was intermittent, unreliable, poor cost
recovery prior to the initiative.
• MJP initiated dialogue with elected
representatives, study tours conducted and
secured their commitment for 24-7 water
supply, metering, volumetric billing, pipe
technology etc. (2007)

24-7 Water Supply – Malkapur
• Distribution system designed using hydraulic modeling;
GIS.
• HDPE pipe network and MDPE house service connection,
AMR meters, bulk meters of AMR type were used.
• Elected representatives played an important role in
promoting the initiative amongst community – excessive
water usage was controlled by promoting float stop cocks
for overhead tanks and volumetric billing. Discount was
offered for water conservation.
• Outcome - Pumping hours reduced from 20 hrs to 13 hrs,
No valve men needed, energy saving, 100 % cost recovery,
UFW is about 12%.

• Citizen are receiving 24-7 water supply with
pressure through out the town.
• Strong political support.

24x7 Pilot Project - Nagpur
• Feature
– 15000 Connection including slum
– 10 slum areas
– Population 1.5 – 1.75 lakhs
• Contract
– Study, Rehabilitate, Operate contract with Private operator.
– Penalty /bonus for targets in UFW, Quality, Customer services and Continuity of supply

KPI Baseline KPI Target KPI
UFW level The NRW is assessed at 50% UFW below 30% for
proportionate bonus
Increase of volume
billed compared to
FY 2007-08
Volume billed for FY 2006-07 = 21,7
MLD on average.
This value shall be used for the cost-
benefit analysis of the rehabilitation
plan.
The baseline KPI for the assessment of
bonus/penalties during O&M will be
based on FY 2007-08 data.
Higher than baselines by
10% for bonus
Continuity of
supply
2 to 24 hours depending on the area of
supply
24/7 throughout the zone
with minimum 2m pressure
at customer tap
Water Quality 63% of samples tested had a residual
chlorine level higher than 0,2 ppm
Residual chlorine higher
than 0,2 ppm
Time for handling
customer
complaints
Not applicable Within 3 days
Pilot 24x7 Project :Baseline for Private Operator
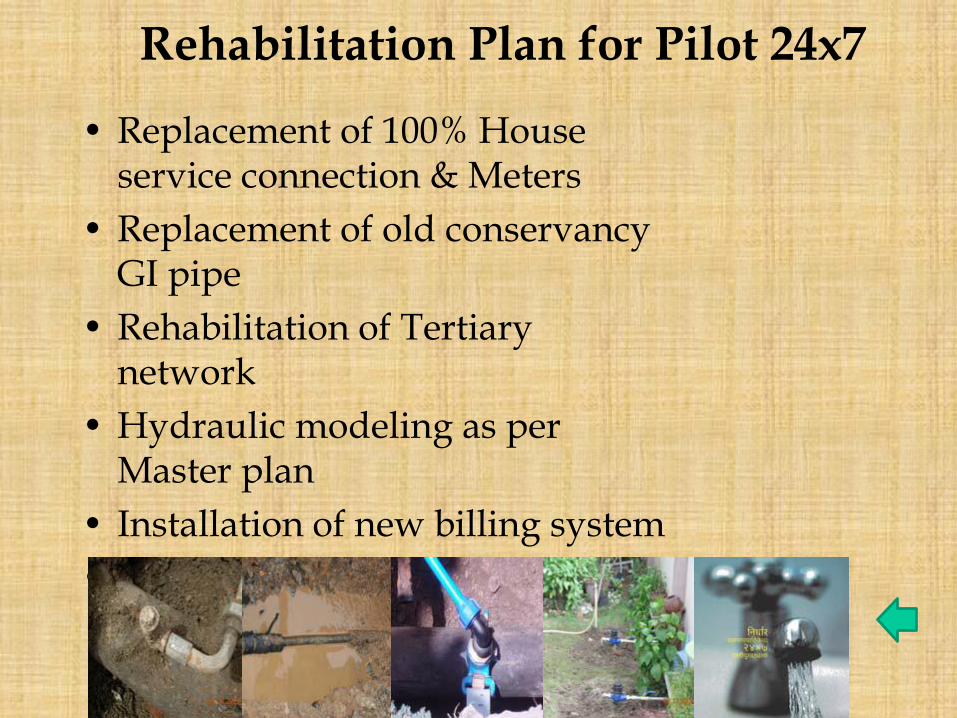
Rehabilitation Plan for Pilot 24x7
• Replacement of 100% House service connection & Meters
• Replacement of old conservancy GI pipe
• Rehabilitation of Tertiary network
• Hydraulic modeling as per Master plan
• Installation of new billing system
• Customer Facility centre

Visible Project Benefits
• Water Supply Hours – Water supply hours was increased from 4.30 hours to 24 hours
• Water Consumption: – The water consumption was 440m3/day for a Bajiprabhu nagar
with 4.30 hrs has increased to 24 hrs with 504m3/day of water consumption. With telescopic tariff and billing as per consumption will reduce.
• Pressure : – Before conversion the average pressure at consumer water taps
was 2-5 meters and now it reaches to 10-12 m. It resulted in to energy saving for consumers as water reaches directly to overhead water tank.
• Quality: – The continuous pressurized network has avoided the
contamination of water from leaking House service connections which were replaced under this project.

City Wide Scale up

PPP Approach
The PPP approach aimed at BOT/Lease Concession for 25 years
Private operator would undertake necessary investments for system upgradation and operates and maintains the system
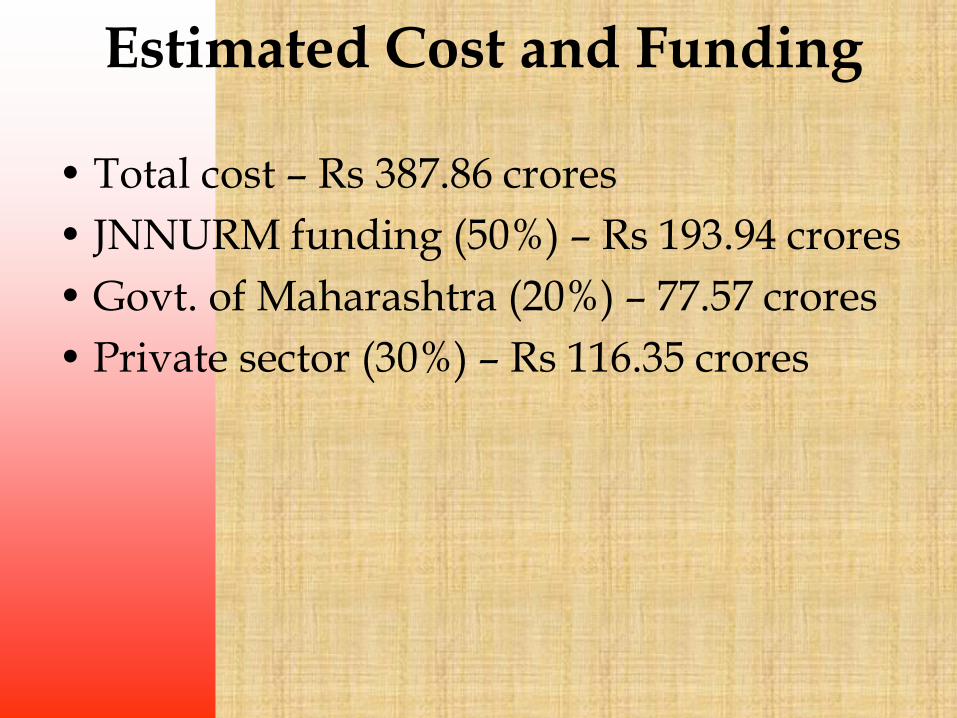
Estimated Cost and Funding
• Total cost – Rs 387.86 crores
• JNNURM funding (50%) – Rs 193.94 crores
• Govt. of Maharashtra (20%) – 77.57 crores
• Private sector (30%) – Rs 116.35 crores

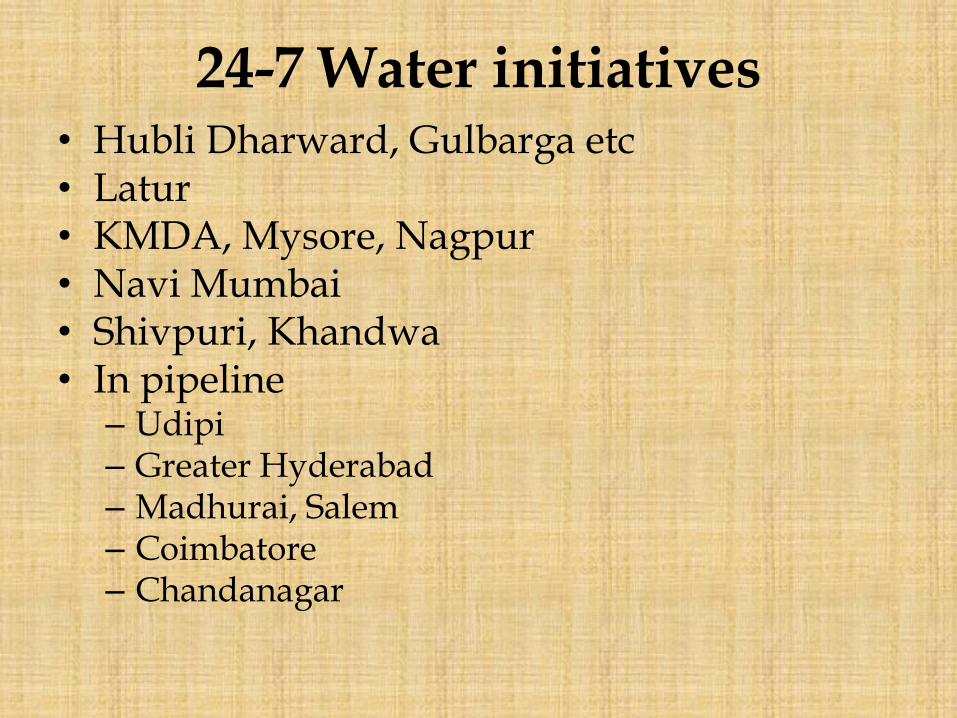
24-7 Water initiatives • Hubli Dharward, Gulbarga etc • Latur • KMDA, Mysore, Nagpur • Navi Mumbai • Shivpuri, Khandwa • In pipeline
– Udipi – Greater Hyderabad – Madhurai, Salem – Coimbatore – Chandanagar

Continuous water supply initiatives in India
2002/3
None

Continuous water supply initiatives in India
2008
~60

Coverage

Coverage – Water Supply
• Network coverage is high
• Significant gap between number of households and connections on record ; resulting in low coverage
• Last mile connectivity is a major concern
• Entry barriers for the poor to gain access – High cost of connection – Procedural barrier – Policy barrier
Tariffs in India are kept low, in the name of the poor. But poor are not formally connected to
the system

Informal Costs
Variable Costs
Fixed Connection Fee
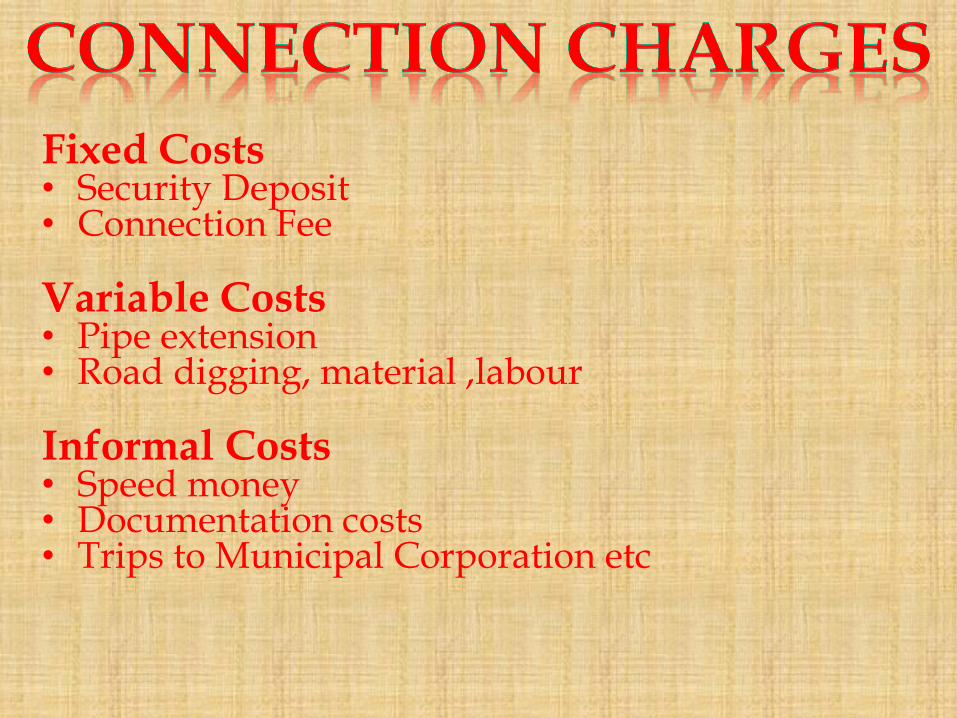
Fixed Costs • Security Deposit • Connection Fee Variable Costs • Pipe extension • Road digging, material ,labour Informal Costs • Speed money • Documentation costs • Trips to Municipal Corporation etc
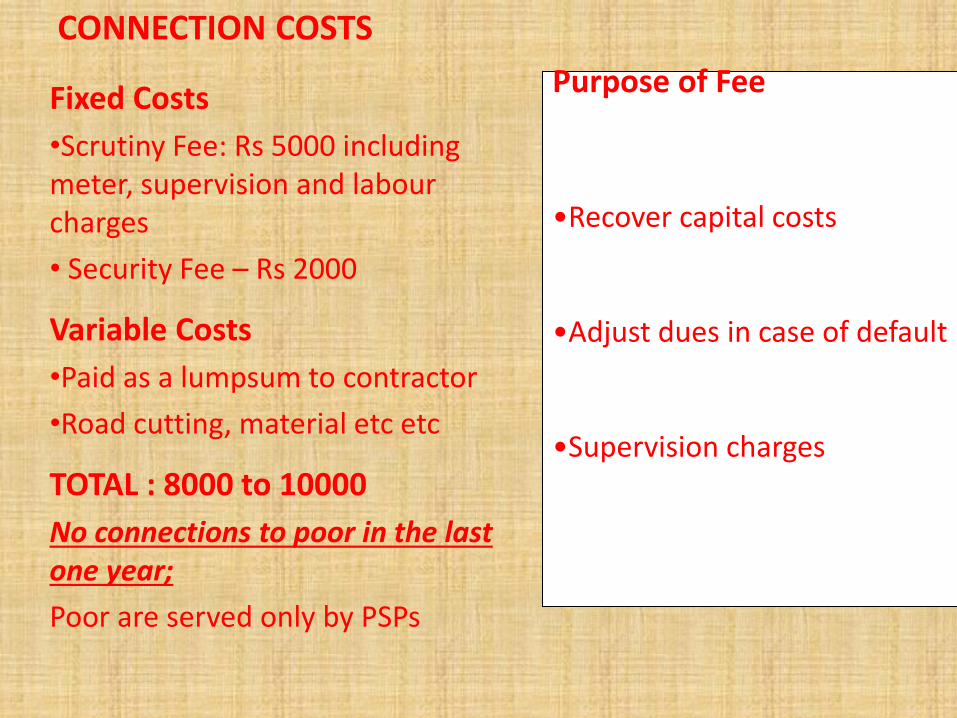
CONNECTION COSTS
Fixed Costs
•Scrutiny Fee: Rs 5000 including meter, supervision and labour charges
• Security Fee – Rs 2000
Variable Costs
•Paid as a lumpsum to contractor
•Road cutting, material etc etc
TOTAL : 8000 to 10000
No connections to poor in the last one year;
Poor are served only by PSPs
Purpose of Fee
•Recover capital costs
•Adjust dues in case of default
•Supervision charges

Towards Clean Drinking Water for All
Bhagirathi Nal-Jal Yojana, Chhattisgarh
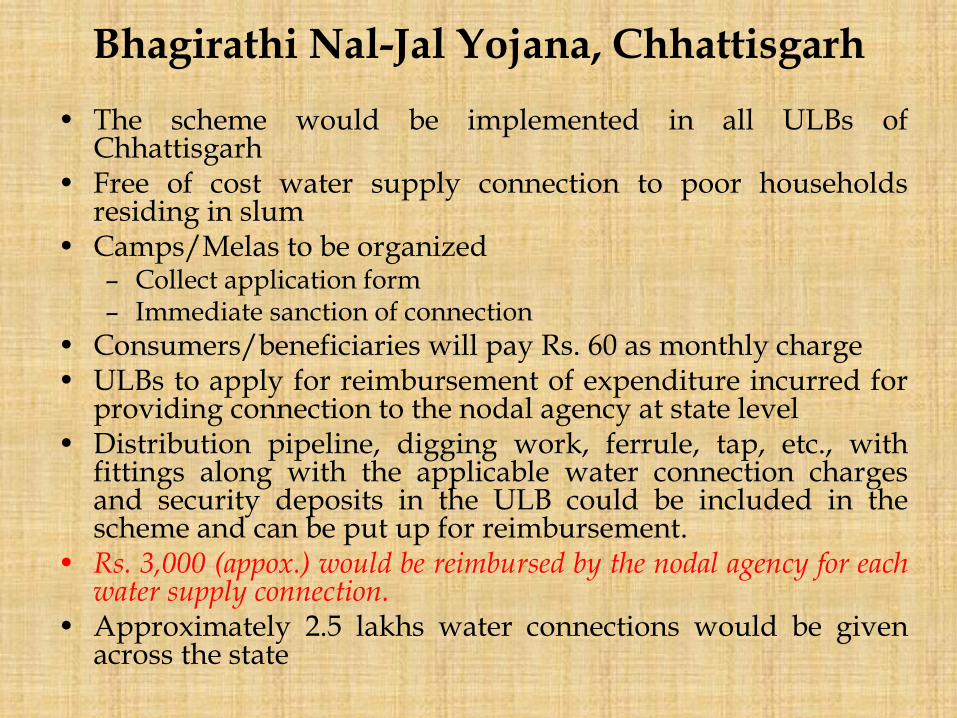
• The scheme would be implemented in all ULBs of Chhattisgarh
• Free of cost water supply connection to poor households residing in slum
• Camps/Melas to be organized – Collect application form – Immediate sanction of connection
• Consumers/beneficiaries will pay Rs. 60 as monthly charge • ULBs to apply for reimbursement of expenditure incurred for
providing connection to the nodal agency at state level • Distribution pipeline, digging work, ferrule, tap, etc., with
fittings along with the applicable water connection charges and security deposits in the ULB could be included in the scheme and can be put up for reimbursement.
• Rs. 3,000 (appox.) would be reimbursed by the nodal agency for each water supply connection.
• Approximately 2.5 lakhs water connections would be given across the state

Coverage – land tenure issues
• BPL card holders
• Slum residents - notified
• Non residents - notified slum
• Pavement dwellers/Migrant population? – fairly large number, poorest of the poor.
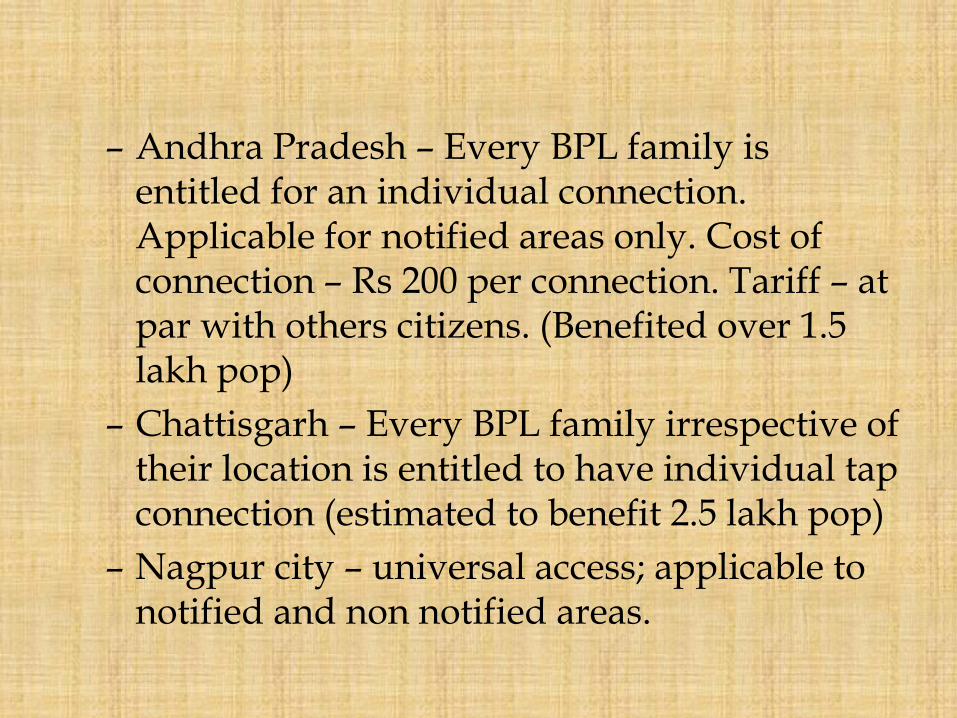
– Andhra Pradesh – Every BPL family is entitled for an individual connection. Applicable for notified areas only. Cost of connection – Rs 200 per connection. Tariff – at par with others citizens. (Benefited over 1.5 lakh pop)
– Chattisgarh – Every BPL family irrespective of their location is entitled to have individual tap connection (estimated to benefit 2.5 lakh pop)
– Nagpur city – universal access; applicable to notified and non notified areas.
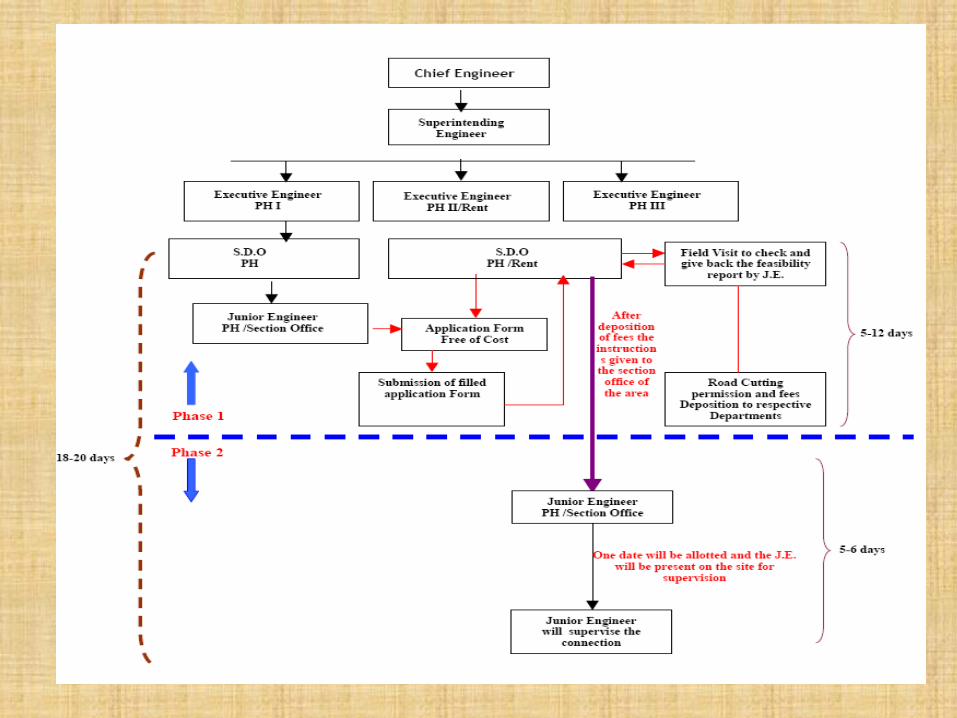
Simplification of procedure for issuing connections
• Single window system - HMWSSB
– Clearly defined process, timeframe
• Green brigade

Sanitation

• The day everyone of us gets a toilet to use, I shall know that our country reached the pinnacle of progress….
Jawaharlal Nehru

Singapore
Gabon
Botsw ana
Mauritius
RomaniaPanama
Kazakhstan
Ukraine
Namibia
China
Paraguay
Bolivia
Sri Lanka
Samoa
Tonga
Congo, Rep.
Philippines
Mongolia
India
Vietnam
Pakistan
Uzbekistan
Mauritania
Sudan
Nigeria
Tajikistan
Kenya
Zambia
BangladeshTanzania
Mali
Nepal
Malaw i
Sierra Leone
NigerEritrea
Burundi
R2 = 0.649
0
20
40
60
80
100
100 1000 10000 100000
GDP per capita PPP (current international $) (Log Scale)
% o
f p
op
ula
tio
n w
ith
acce
ss to
im
pro
ve
d s
an
ita
tio
nIndia’s Relative Performance
Scatter-plot of % of population with access to improved sanitation and GDP per capita
PPP (current international $)
[
Source: World Development Indicators, 2006
India’s progress
is lower than
some of the
other countries
with similar or
lower per
capital GDP
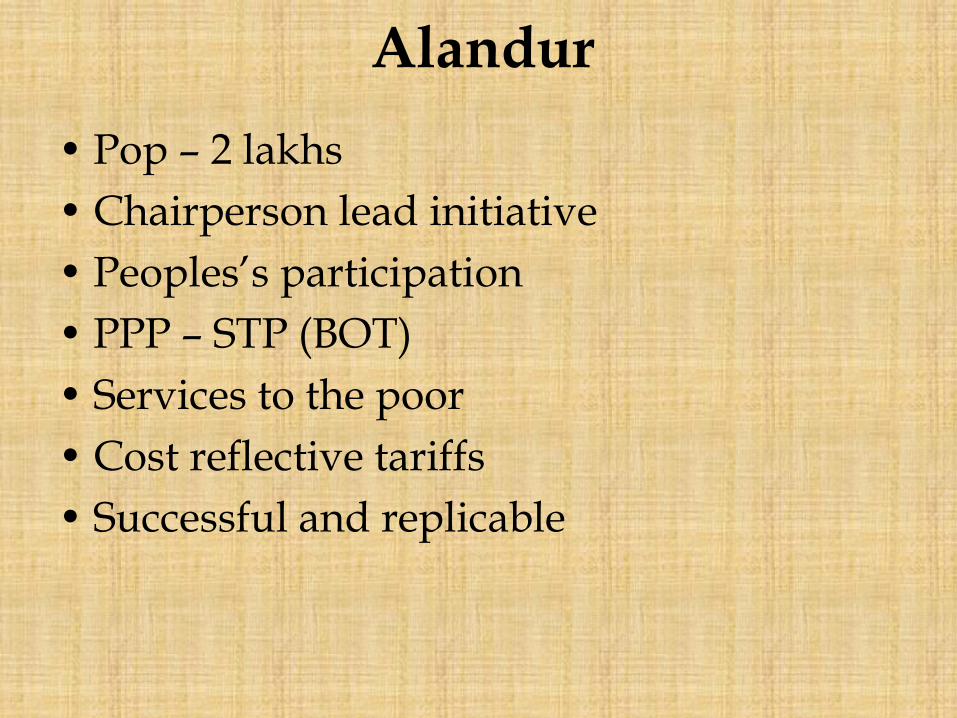
Alandur
• Pop – 2 lakhs
• Chairperson lead initiative
• Peoples’s participation
• PPP – STP (BOT)
• Services to the poor
• Cost reflective tariffs
• Successful and replicable

Community options

Pune Sanitation Drive
• Community toilets in low income areas
• More than 10,000 seats
• Capex by PMC
• O & M – community – Rs 15-20 /family /month

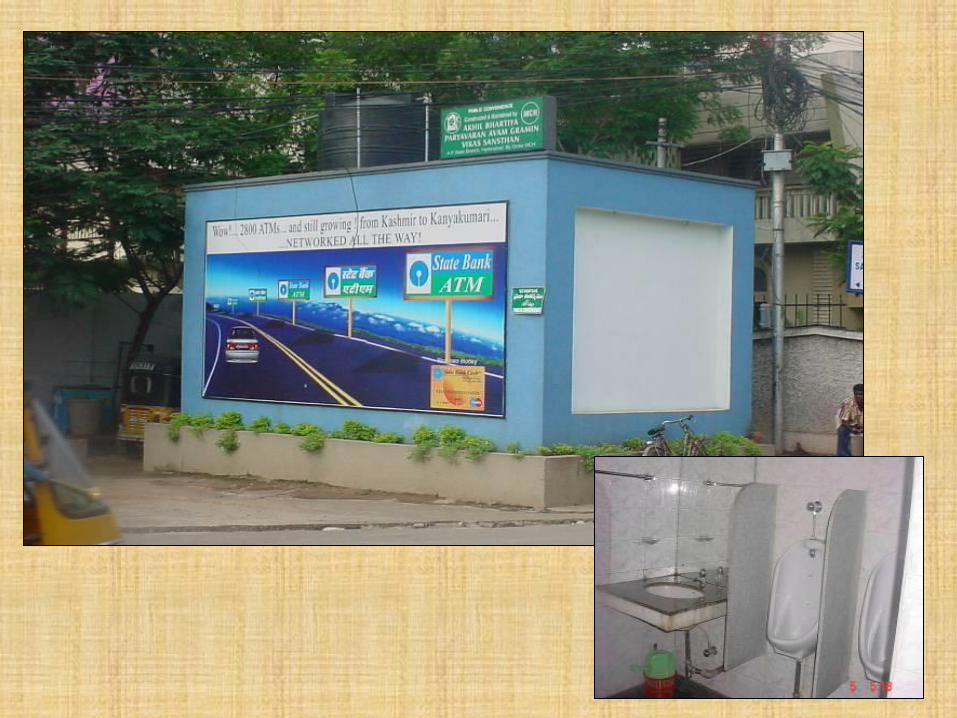
Toilets
• Pune
• Tiruchy
• Sangli

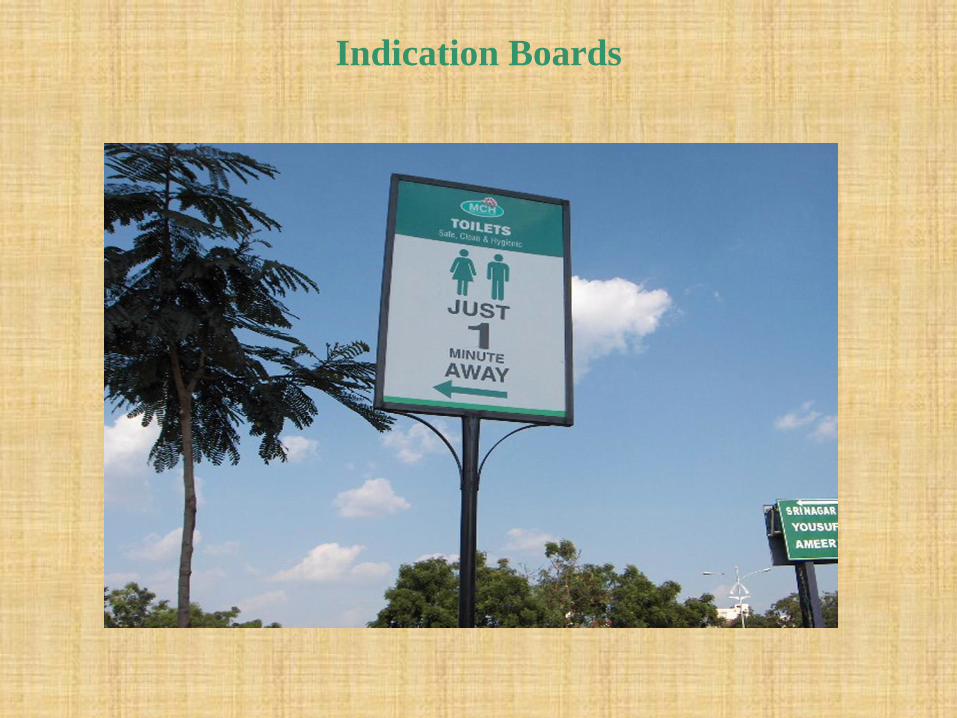
Indication Boards
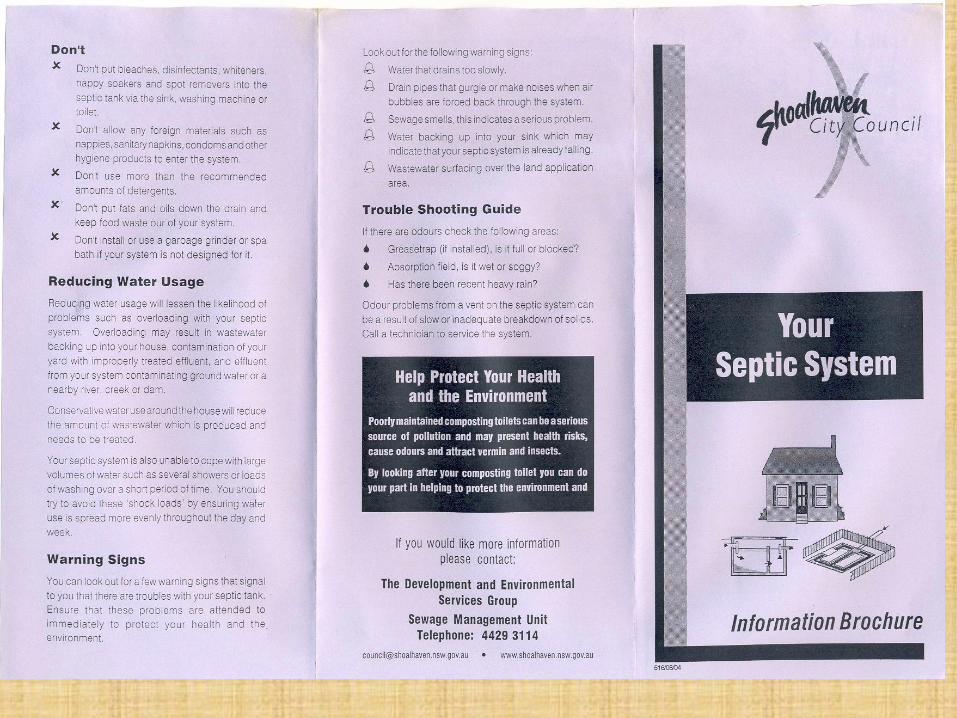
PPP in septage control


Waste recycling
• PPP in collection and recycling
– At a neighborhood level – Bangalore /Hyderabad
– City level – Bangalore /Nagpur /Hyderabad/Surat /
Accelerating Water Supply Agenda
Lesson 1
•Continuous water supply results in public health improvement

3 Myths about Water Supply
1. 24/7 Water is an Unnecessary luxury!
2. It costs too much and the Poor can’t afford it.
3. 24/7 Service requires too much water!

Lesson 2
• Institutional reforms
Separation of roles
– Policy
– Service delivery
– Regulation

Lesson 3
• Demand / appetite for 24-7
– Political leadership
– Community
– Staff
Lesson 4
• Investment in distribution improvement should precede source augmentation
• Leaking bucket syndrome

Lesson 5
• PPPs are viable in urban water and sanitation sectors
– Performance based management contracts to begin with
• Goal of PPP is for service delivery improvement and not for laying infrastructure
Lesson 6
• Organizational capacities – very important
Lesson 7
• Communications and consultations are important components of reforms – before and during implementation
• IEC is different from strategic communication
• Often neglected or taken up to deal with crisis
• Internal communication and external communication

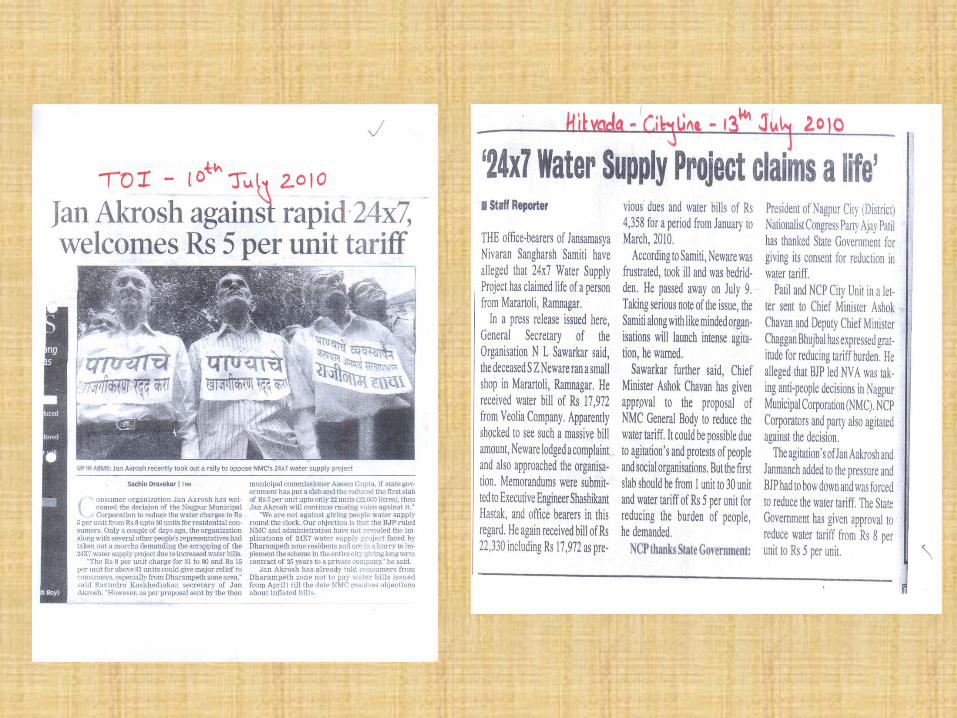
Misinformation
• Metering is bad, tariffs will go up
• Privatization
• Job loss
• Will benefit the rich at the exclusion of poor
• Social good
• Will benefit one zone at the cost of other areas


“Delhi Jal
Board ko
videshi
company ke
haatho bechne
ki saazish ko
nakam karo!
Akhri saas tak
sangharsh”

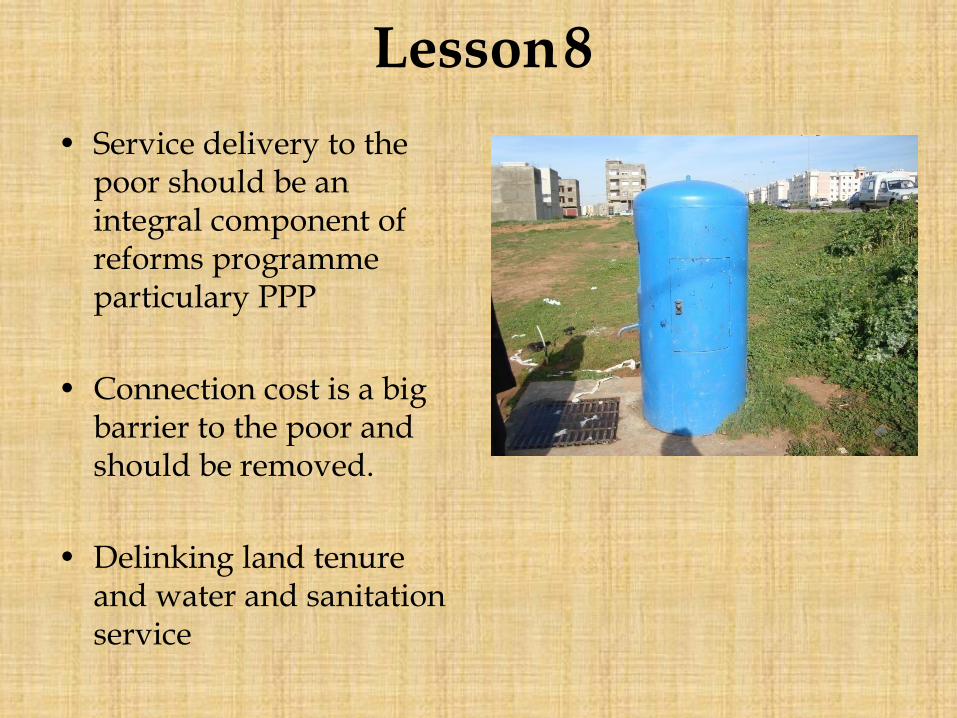
Lesson 8
• Service delivery to the poor should be an integral component of reforms programme particulary PPP
• Connection cost is a big barrier to the poor and should be removed.
• Delinking land tenure and water and sanitation service

Accelerating Sanitation Agenda

Lessons - 1
• Sewerage (reticulated) system is expensive; and it is not the only way to achieve public health outcomes
– City of Brussel and Milan (Famous European cities) till recently discharged untreated effluents to water bodies.
– Sewerage – subsidy for the rich to excrete in convenience …Sunita Narayan, CSE.
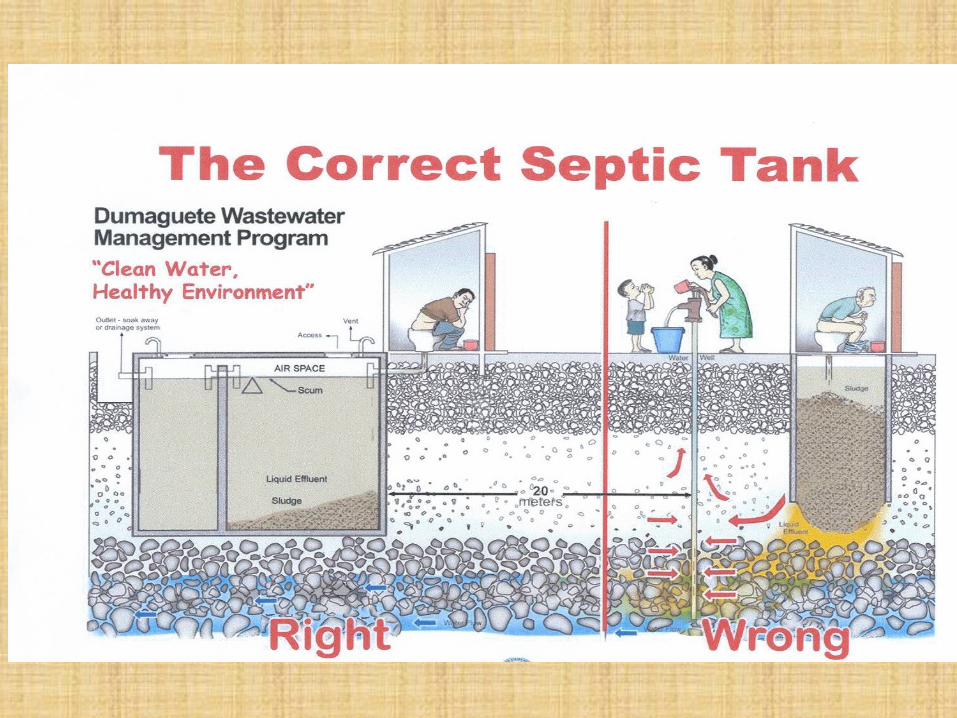

Lesson 2
• Development controls /regulations are essential
– Septic tank management
– Septage disposal
Lesson 3
• Community Partnership models work better
Lesson 4
• Creating demand for improved sanitation takes time..
– Communicating benefits of ORS took more than 50 years..
– Need for a good communication Campaign
– Strong political leadership (two good practices)

Lesson 5
• PPP in Urban Sanitation is feasible and viable
– Alandur, Pune, Bangalore

Lesson 6
• Sanitation improvement program requires Capacity building among municipal officials, NGOs, CSO etc.
India Advantage
• Fastest growing telecom market
• 2 m new telcom subscribers /yr
• 3 m graduates, 7 lacs PG, 1500 PhDs/y
• > 100 of Fortune 500 companies have setup R&D centres in India
• Glob Eco Survey – India is the sixth fastest growing country in terms of construction
• Forex reserves $ 105 b
• India’s Insat – among the worlds largest domestic satellite comm system
No city with continuous water supply