Embed Size (px)
Citation preview
Towards Ubiquitous Indoor Localization ServiceLeveraging Environmental Physical Features∗
Yang Tian, Ruipeng Gao, Kaigui Bian, Fan Ye, Tao Wang, Yizhou Wang, Xiaoming LiSchool of Electronics Engineering and Computer Science
Peking University, Beijing, ChinaEmail: {tianyangty,gaoruipeng,bkg,yefan,wangtao,yizhou.wang,lxm}@pku.edu.cn
Abstract—Mainstream indoor localization technologies rely onRF signatures that require extensive human efforts to measureand periodically re-calibrate. Although recent crowdsourcingbased work has started to address the issue, incentives are stilllacking for wide user adoption. Thus the progress to ubiquitouslocalization remains slow. In this paper, we explore an alternativeapproach that leverages environmental physical features suchas store logos or wall posters. A user uses a smartphone toobtain relative position measurements to such static referencepoints for the system to triangulate the user location. We studythe principle of such localization, determine the suitable sensor,and devise guidelines for the user to choose reference pointsfor better accuracy. To enable fast deployment, we propose alightweight site survey method for service providers to quicklyestimate the coordinates of reference points. We incorporate andenhance image matching algorithms with a heuristic technique toautomatically identify chosen reference points at high accuracy.Extensive experiments have shown that the prototype achieves4 − 5m accuracy at 80-percentile, comparable to the industrystate-of-the-art, while covering a 150×75m mall and 300×200mtrain station requires a one time investment of only 2− 3 man-hours from service providers.
I. INTRODUCTION
Localization [1]–[3] is the basis for novel features in var-ious location based applications. Despite more than a decadeof research, localization service is not yet pervasive indoors.The latest industry state-of-the-art, Google Indoor Maps [4],covers about 10,000 locations in 18 countries, which are onlya fraction of the millions of shopping centers, airports, trainstations, museums, hospitals and retail stores on the planet.One major obstacle behind the sporadic availability, is thatcurrent mainstream indoor localization technologies largelyrely on RF (Radio Frequency) signatures from certain ITinfrastructure (e.g., WiFi access points [1], [2] and cellulartowers [5]).
Obtaining the signature map usually requires dedicatedlabor efforts to measure the signal parameters at fine grainedgrid points. Because they are susceptible to intrinsic fluctu-ations and external disturbances, the signatures have to bere-calibrated periodically to ensure accuracy. Some recentresearch [6]–[8] has started to leverage crowd-sourcing toreduce site survey efforts, but incentives are still lacking forwide user adoption. Thus the progress is inevitably slow.
Localization also requires more than mere network connec-tivity. For example, 6 strongest towers are usually needed [5]for GSM localization, but the obstruction of walls may deprivemany places signals from enough number of towers. WiFilocalization also requires enough number of access points insignatures to effectively distinguish different locations. Thus
∗The first two authors contribute equally and this work is supported partiallyby China NSFC-61201245, NSFC-61231010 and NSFC-61073155.
places with network connectivity may not always be conduciveto localization.
In this paper, we explore an alternative approach thathas comparable performance but without relying on the RFsignature. Specifically, we leverage environmental physicalfeatures, such as logos of stores, paintings on the walls.Users use the smartphone to measure their relative positionsto physical features, and the coordinates of these referencepoints are used to compute user locations. This has a fewadvantages: 1) Physical features are part of and abundant inthe environment; they do not require dedicated deploymentand maintenance efforts like IT infrastructure; 2) They seldommove and usually remain static over long periods of time. Theyare not affected by and thus impervious to electromagneticdisturbances from microwaves, cordless phones or wirelesscameras. Once measured, their coordinates do not change, thuseliminating the need for periodic re-calibration.
The realization of such benefits, however, turns out to bea non-trivial journey. First, we need to identify a suitableform of relative position that can be effectively measuredby smartphones with accuracies favorable for localization.Second, the abundance of physical features is not always ablessing: users need some guidelines to decide which ones tomeasure for smaller localization errors. Third, to enable fastdeployment, service providers have to obtain the coordinatesof reference points in a new environment with low humanefforts. Finally, the system has to know which reference pointsare selected by users. Relying on explicit user input can be anonstarter. Ideally, the system should gain such input with aslittle efforts from users as possible.
Our investigation leads us to the localization method ofSextant. 1 In the prototype we build on smartphones, the usertakes a picture for each of three nearby reference points oneby one. The photos are sent to a server to identify whichreference points are selected, thus their coordinates, togetherwith relative position measurements, are used to triangulatethe user’s location. Prototype experiments in large indoorenvironments have shown promising results, with 80-percentileaccuracy at 4-5m, comparable to Google Indoor Maps.
We make the following contributions in this work:
• We identify a form of relative position measurementand its respective triangulation method suitable formodern smartphone hardware. We also analyze thelocalization errors caused by inaccuracies in suchposition measurements, and devise a simple rule ofreference point selection to minimize errors.
1Sextant is commonly used by sailors to determine their longitude/latitudeby measuring the angle between visible objects, usually celestial ones like theSun.
• We propose a lightweight site survey method suchthat a service provider can quickly obtain the coor-dinates of reference points in a previously unmappedenvironment with reasonable accuracy (∼ 1m at80-percentile). Our experiments find that it takes aone time investment of 2-3 man-hours to survey a150×75m shopping mall or a 300×200m train station.
• We enhance image matching algorithms [9], [10] witha spatial constraint based heuristic to automaticallyidentify selected reference points at high accuracy,thus reducing the users’ cognitive efforts.
• We build a Sextant prototype consisting of a phoneand a backend, and conduct extensive experiments inlarge complex indoor environments that shows 4-5 maccuracy at 80-percentile, using estimated coordinates.
• We also share the tips and lessons we have learnedcorrecting image matching mistakes, and hope suchinsights can help further refine this approach.
In the rest of the paper, we study the forms of relativepositions and the accuracies of suitable sensors (Section II).We then describe the localization operations, study the optimalreference object selection and demonstrate the feasibility of theoperations as a localization primitive (Section III). We proposea lightweight approach for estimating the coordinates in anunmapped environment (Section IV), describe the automaticrecognition of chosen reference points using image matchingalgorithm (Section V). We discuss our limits (Section VI) andreview related work (Section VII), then conclude the paper(Section VIII).
II. LOCALIZATION BASED ON RELATIVE POSITIONS
Relative positions include the distance and orientation be-tween the user and the reference point. Although smartphonescan measure their pairwise distance easily [11], they are notequipped with a sensor to directly measure the distance to aphysical object. While orientation can take two forms, absoluteand relative angles, both of which can be used to triangulatethe user.
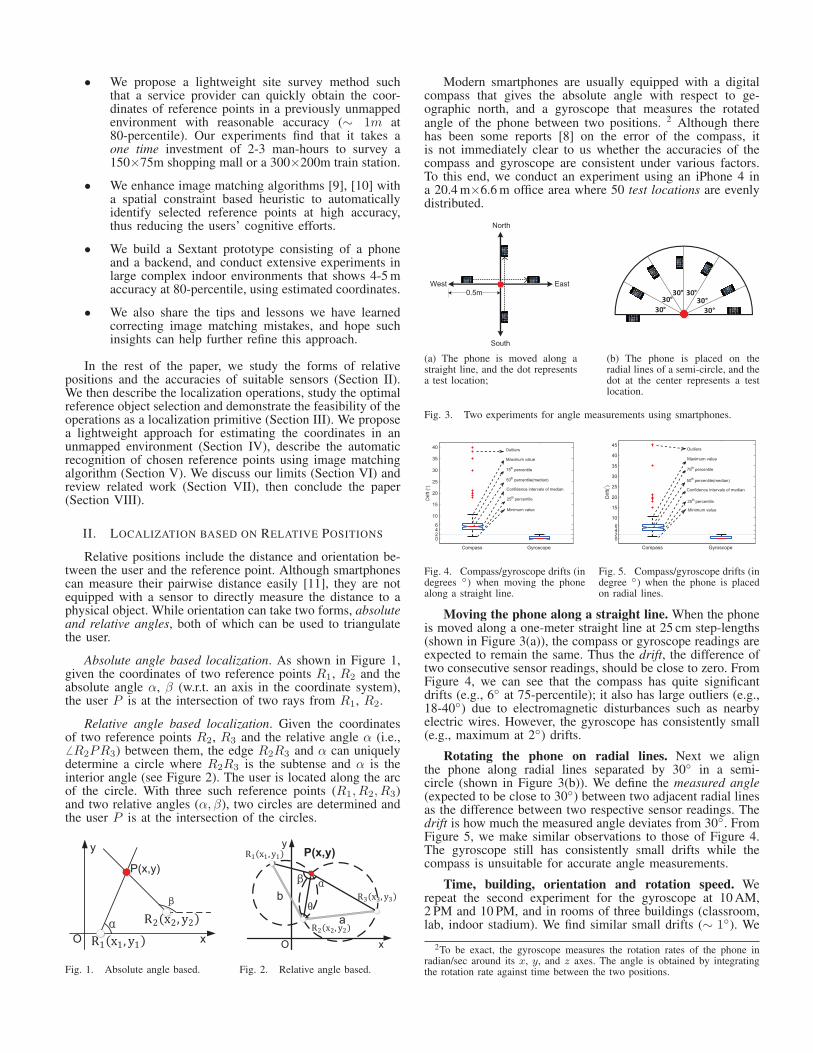
Absolute angle based localization. As shown in Figure 1,given the coordinates of two reference points R1, R2 and theabsolute angle α, β (w.r.t. an axis in the coordinate system),the user P is at the intersection of two rays from R1, R2.
Relative angle based localization. Given the coordinatesof two reference points R2, R3 and the relative angle α (i.e.,� R2PR3) between them, the edge R2R3 and α can uniquelydetermine a circle where R2R3 is the subtense and α is theinterior angle (see Figure 2). The user is located along the arcof the circle. With three such reference points (R1, R2, R3)and two relative angles (α, β), two circles are determined andthe user P is at the intersection of the circles.
O
P(x,y)
PPPP
x
y
Fig. 1. Absolute angle based.
O
P(x,y)
b
a
x
y
Fig. 2. Relative angle based.
Modern smartphones are usually equipped with a digitalcompass that gives the absolute angle with respect to ge-ographic north, and a gyroscope that measures the rotatedangle of the phone between two positions. 2 Although therehas been some reports [8] on the error of the compass, itis not immediately clear to us whether the accuracies of thecompass and gyroscope are consistent under various factors.To this end, we conduct an experiment using an iPhone 4 ina 20.4 m×6.6 m office area where 50 test locations are evenlydistributed.
0.5mEast
South
West
North
(a) The phone is moved along astraight line, and the dot representsa test location;
30°30°
30°30°30°
30°
(b) The phone is placed on theradial lines of a semi-circle, and thedot at the center represents a testlocation.
Fig. 3. Two experiments for angle measurements using smartphones.
Compass Gyroscope
0246
10
15
20
25
30
35
40
Drif
t (°)
Outliers
Maximum value
75th percentile
50th percentile(median)
Confidence intervals of median
25th percentile
Minimum value
Fig. 4. Compass/gyroscope drifts (indegrees ◦) when moving the phonealong a straight line.
Compass Gyroscope
0246
10
15
20
25
30
35
40
45
Drif
t(° )
Outliers
Maximum value
25th percentile
Minimum value
Confidence intervals of median
50th percentile(median)
75th percentile
Fig. 5. Compass/gyroscope drifts (indegree ◦) when the phone is placedon radial lines.
Moving the phone along a straight line. When the phoneis moved along a one-meter straight line at 25 cm step-lengths(shown in Figure 3(a)), the compass or gyroscope readings areexpected to remain the same. Thus the drift, the difference oftwo consecutive sensor readings, should be close to zero. FromFigure 4, we can see that the compass has quite significantdrifts (e.g., 6◦ at 75-percentile); it also has large outliers (e.g.,18-40◦) due to electromagnetic disturbances such as nearbyelectric wires. However, the gyroscope has consistently small(e.g., maximum at 2◦) drifts.
Rotating the phone on radial lines. Next we alignthe phone along radial lines separated by 30◦ in a semi-circle (shown in Figure 3(b)). We define the measured angle(expected to be close to 30◦) between two adjacent radial linesas the difference between two respective sensor readings. Thedrift is how much the measured angle deviates from 30◦. FromFigure 5, we make similar observations to those of Figure 4.The gyroscope still has consistently small drifts while thecompass is unsuitable for accurate angle measurements.
Time, building, orientation and rotation speed. Werepeat the second experiment for the gyroscope at 10 AM,2 PM and 10 PM, and in rooms of three buildings (classroom,lab, indoor stadium). We find similar small drifts (∼ 1◦). We
2To be exact, the gyroscope measures the rotation rates of the phone inradian/sec around its x, y, and z axes. The angle is obtained by integratingthe rotation rate against time between the two positions.
place the phone at a test location, and point the phone to fourvertically-intersected directions, east, south, west, and north (asshown in Figure 3(a)). Then we rotate the phone by ±d◦ where−d◦ is a clockwise and +d◦ a counter-clockwise rotation, andd = 15, 30, 45. This is repeated three times. We find that theerror is at most 1◦ and more than half of them have less than1◦ errors. We place the phone at a fixed location, and rotatethe phone at two different speeds, finishing a 10◦ rotation in2 and 5 seconds. This is intended to see how it behaves underdifferent user operations. Again we find consistently small driftin both cases.
From the above study, we conclude that the gyroscope hasconsistently high level of accuracy. Thus we decide to use therelative angle based localization as shown in Figure 2.
III. POINTING AS A LOCALIZATION PRIMITIVE
A. User Operations and Location Computation
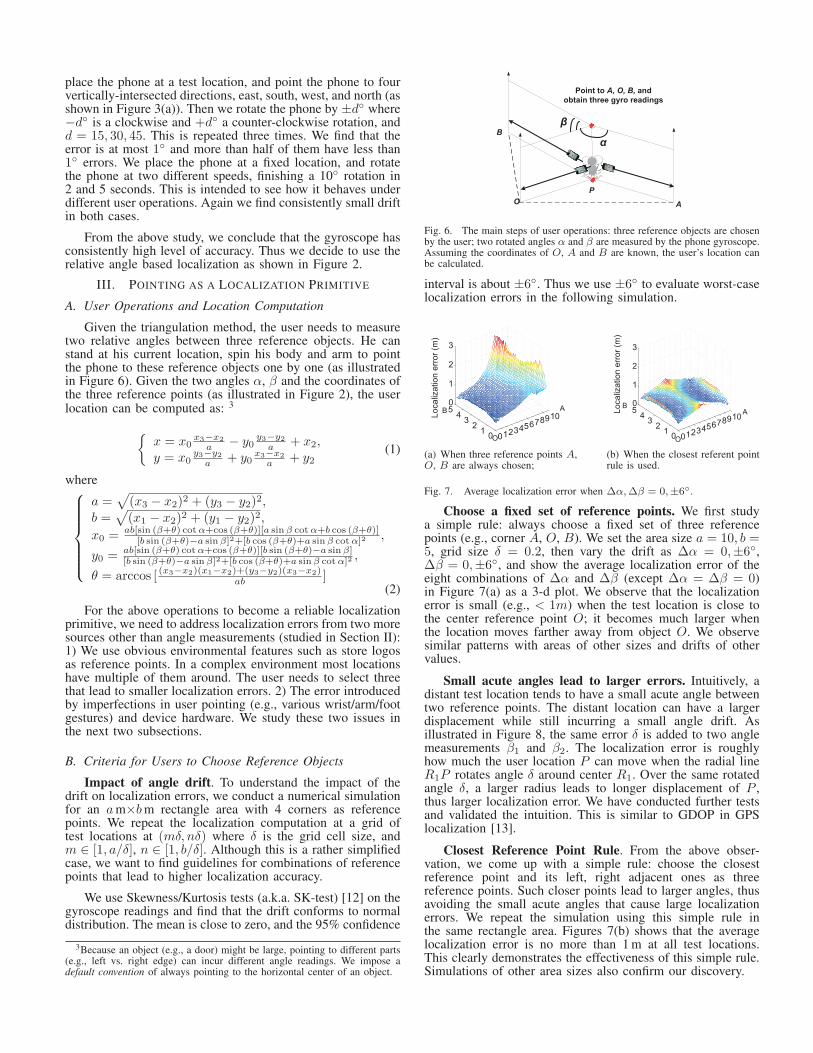
Given the triangulation method, the user needs to measuretwo relative angles between three reference objects. He canstand at his current location, spin his body and arm to pointthe phone to these reference objects one by one (as illustratedin Figure 6). Given the two angles α, β and the coordinates ofthe three reference points (as illustrated in Figure 2), the userlocation can be computed as: 3
{x = x0
x3−x2
a − y0y3−y2
a + x2,y = x0
y3−y2
a + y0x3−x2
a + y2(1)
where⎧⎪⎪⎪⎪⎪⎨⎪⎪⎪⎪⎪⎩
a =√
(x3 − x2)2 + (y3 − y2)2,b =
√(x1 − x2)2 + (y1 − y2)2,
x0 = ab[sin (β+θ) cotα+cos (β+θ)][a sin β cotα+b cos (β+θ)][b sin (β+θ)−a sin β]2+[b cos (β+θ)+a sin β cotα]2 ,
y0 = ab[sin (β+θ) cotα+cos (β+θ)][b sin (β+θ)−a sin β][b sin (β+θ)−a sin β]2+[b cos (β+θ)+a sin β cotα]2 ,
θ = arccos [ (x3−x2)(x1−x2)+(y3−y2)(x3−x2)ab ]
(2)
For the above operations to become a reliable localizationprimitive, we need to address localization errors from two moresources other than angle measurements (studied in Section II):1) We use obvious environmental features such as store logosas reference points. In a complex environment most locationshave multiple of them around. The user needs to select threethat lead to smaller localization errors. 2) The error introducedby imperfections in user pointing (e.g., various wrist/arm/footgestures) and device hardware. We study these two issues inthe next two subsections.
B. Criteria for Users to Choose Reference Objects
Impact of angle drift. To understand the impact of thedrift on localization errors, we conduct a numerical simulationfor an am×bm rectangle area with 4 corners as referencepoints. We repeat the localization computation at a grid oftest locations at (mδ, nδ) where δ is the grid cell size, andm ∈ [1, a/δ], n ∈ [1, b/δ]. Although this is a rather simplifiedcase, we want to find guidelines for combinations of referencepoints that lead to higher localization accuracy.
We use Skewness/Kurtosis tests (a.k.a. SK-test) [12] on thegyroscope readings and find that the drift conforms to normaldistribution. The mean is close to zero, and the 95% confidence
3Because an object (e.g., a door) might be large, pointing to different parts(e.g., left vs. right edge) can incur different angle readings. We impose adefault convention of always pointing to the horizontal center of an object.
Fig. 6. The main steps of user operations: three reference objects are chosenby the user; two rotated angles α and β are measured by the phone gyroscope.Assuming the coordinates of O, A and B are known, the user’s location canbe calculated.
interval is about ±6◦. Thus we use ±6◦ to evaluate worst-caselocalization errors in the following simulation.
012345678910
0123450
1
2
3
Loca
lizat
ion
erro
r (m
)
AB
O
(a) When three reference points A,O, B are always chosen;
012345678910
0123450
1
2
3
Loca
lizat
ion
erro
r (m
)
BA
O
(b) When the closest referent pointrule is used.
Fig. 7. Average localization error when Δα,Δβ = 0,±6◦.
Choose a fixed set of reference points. We first studya simple rule: always choose a fixed set of three referencepoints (e.g., corner A, O, B). We set the area size a = 10, b =5, grid size δ = 0.2, then vary the drift as Δα = 0,±6◦,Δβ = 0,±6◦, and show the average localization error of theeight combinations of Δα and Δβ (except Δα = Δβ = 0)in Figure 7(a) as a 3-d plot. We observe that the localizationerror is small (e.g., < 1m) when the test location is close tothe center reference point O; it becomes much larger whenthe location moves farther away from object O. We observesimilar patterns with areas of other sizes and drifts of othervalues.
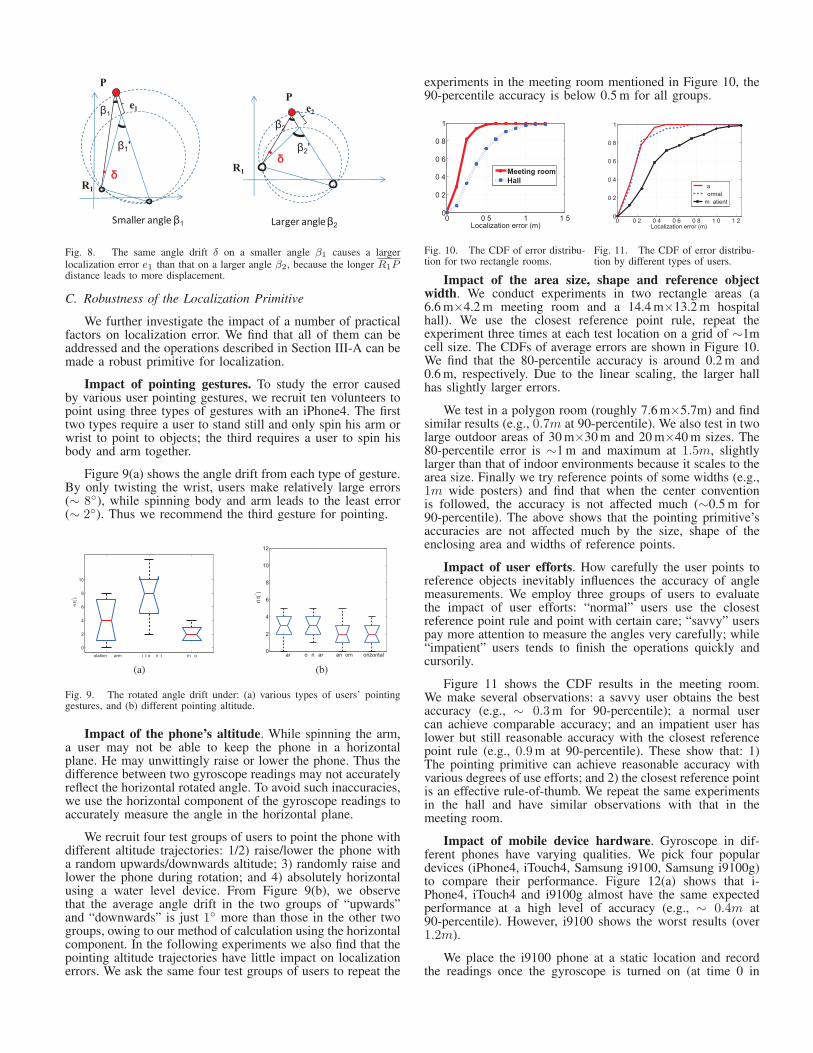
Small acute angles lead to larger errors. Intuitively, adistant test location tends to have a small acute angle betweentwo reference points. The distant location can have a largerdisplacement while still incurring a small angle drift. Asillustrated in Figure 8, the same error δ is added to two anglemeasurements β1 and β2. The localization error is roughlyhow much the user location P can move when the radial lineR1P rotates angle δ around center R1. Over the same rotatedangle δ, a larger radius leads to longer displacement of P ,thus larger localization error. We have conducted further testsand validated the intuition. This is similar to GDOP in GPSlocalization [13].
Closest Reference Point Rule. From the above obser-vation, we come up with a simple rule: choose the closestreference point and its left, right adjacent ones as threereference points. Such closer points lead to larger angles, thusavoiding the small acute angles that cause large localizationerrors. We repeat the simulation using this simple rule inthe same rectangle area. Figures 7(b) shows that the averagelocalization error is no more than 1 m at all test locations.This clearly demonstrates the effectiveness of this simple rule.Simulations of other area sizes also confirm our discovery.
e2
Smaller angle
e1P
R1R1
P
Larger angle
Fig. 8. The same angle drift δ on a smaller angle β1 causes a largerlocalization error e1 than that on a larger angle β2, because the longer R1Pdistance leads to more displacement.
C. Robustness of the Localization Primitive
We further investigate the impact of a number of practicalfactors on localization error. We find that all of them can beaddressed and the operations described in Section III-A can bemade a robust primitive for localization.
Impact of pointing gestures. To study the error causedby various user pointing gestures, we recruit ten volunteers topoint using three types of gestures with an iPhone4. The firsttwo types require a user to stand still and only spin his arm orwrist to point to objects; the third requires a user to spin hisbody and arm together.
Figure 9(a) shows the angle drift from each type of gesture.By only twisting the wrist, users make relatively large errors(∼ 8◦), while spinning body and arm leads to the least error(∼ 2◦). Thus we recommend the third gesture for pointing.
�otation �� arm ��i�t o� �ri�t ��in �o��
0
2
4
6
8
10
�ri�
t(° )
(a)
���ar� �o�n�ar� �an�om �orizontal0
2
4
6
8
10
12
�ri�
t(° )
(b)
Fig. 9. The rotated angle drift under: (a) various types of users’ pointinggestures, and (b) different pointing altitude.
Impact of the phone’s altitude. While spinning the arm,a user may not be able to keep the phone in a horizontalplane. He may unwittingly raise or lower the phone. Thus thedifference between two gyroscope readings may not accuratelyreflect the horizontal rotated angle. To avoid such inaccuracies,we use the horizontal component of the gyroscope readings toaccurately measure the angle in the horizontal plane.
We recruit four test groups of users to point the phone withdifferent altitude trajectories: 1/2) raise/lower the phone witha random upwards/downwards altitude; 3) randomly raise andlower the phone during rotation; and 4) absolutely horizontalusing a water level device. From Figure 9(b), we observethat the average angle drift in the two groups of “upwards”and “downwards” is just 1◦ more than those in the other twogroups, owing to our method of calculation using the horizontalcomponent. In the following experiments we also find that thepointing altitude trajectories have little impact on localizationerrors. We ask the same four test groups of users to repeat the
experiments in the meeting room mentioned in Figure 10, the90-percentile accuracy is below 0.5 m for all groups.
0 0�5 1 1�50
0�2
0�4
0�6
0�8
1
��
�
Localization error (m)
Meeting roomHall
Fig. 10. The CDF of error distribu-tion for two rectangle rooms.
0 0�2 0�4 0�6 0�8 1�0 1�20
0�2
0�4
0�6
0�8
1
Localization error (m)
��
�
�a����ormal�m�atient
Fig. 11. The CDF of error distribu-tion by different types of users.
Impact of the area size, shape and reference objectwidth. We conduct experiments in two rectangle areas (a6.6 m×4.2 m meeting room and a 14.4 m×13.2 m hospitalhall). We use the closest reference point rule, repeat theexperiment three times at each test location on a grid of ∼1mcell size. The CDFs of average errors are shown in Figure 10.We find that the 80-percentile accuracy is around 0.2 m and0.6 m, respectively. Due to the linear scaling, the larger hallhas slightly larger errors.
We test in a polygon room (roughly 7.6 m×5.7m) and findsimilar results (e.g., 0.7m at 90-percentile). We also test in twolarge outdoor areas of 30 m×30 m and 20 m×40 m sizes. The80-percentile error is ∼1 m and maximum at 1.5m, slightlylarger than that of indoor environments because it scales to thearea size. Finally we try reference points of some widths (e.g.,1m wide posters) and find that when the center conventionis followed, the accuracy is not affected much (∼0.5 m for90-percentile). The above shows that the pointing primitive’saccuracies are not affected much by the size, shape of theenclosing area and widths of reference points.
Impact of user efforts. How carefully the user points toreference objects inevitably influences the accuracy of anglemeasurements. We employ three groups of users to evaluatethe impact of user efforts: “normal” users use the closestreference point rule and point with certain care; “savvy” userspay more attention to measure the angles very carefully; while“impatient” users tends to finish the operations quickly andcursorily.
Figure 11 shows the CDF results in the meeting room.We make several observations: a savvy user obtains the bestaccuracy (e.g., ∼ 0.3m for 90-percentile); a normal usercan achieve comparable accuracy; and an impatient user haslower but still reasonable accuracy with the closest referencepoint rule (e.g., 0.9m at 90-percentile). These show that: 1)The pointing primitive can achieve reasonable accuracy withvarious degrees of use efforts; and 2) the closest reference pointis an effective rule-of-thumb. We repeat the same experimentsin the hall and have similar observations with that in themeeting room.
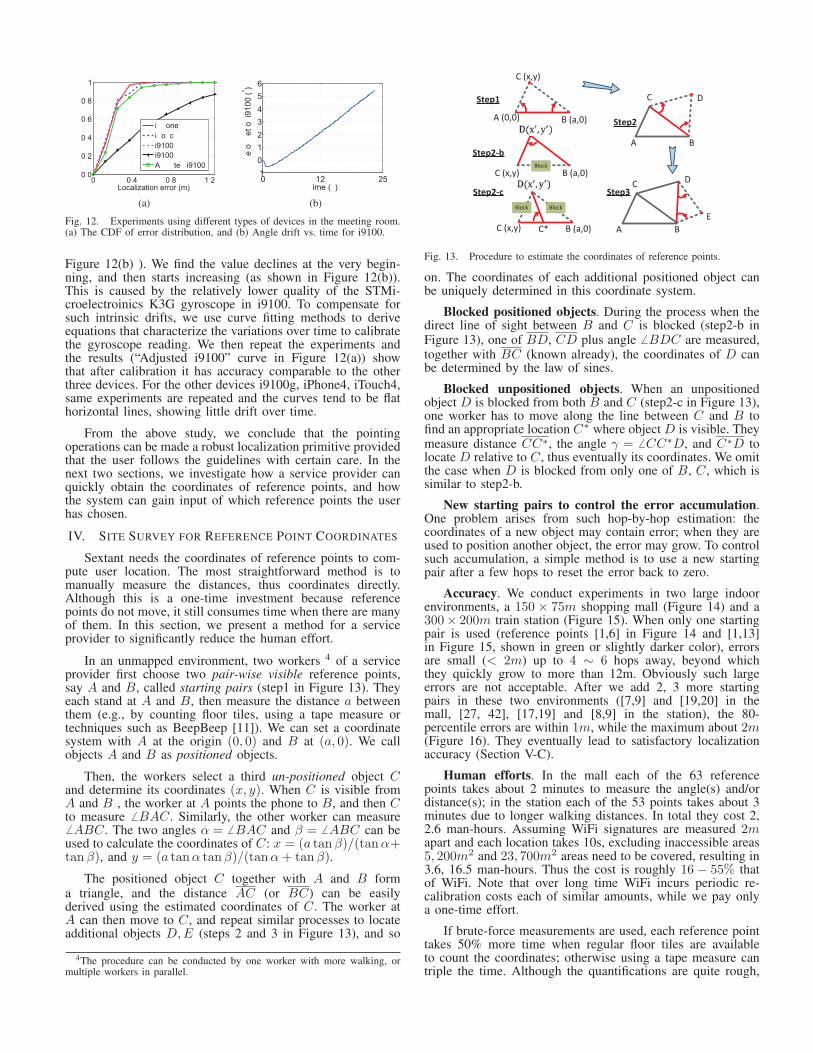
Impact of mobile device hardware. Gyroscope in dif-ferent phones have varying qualities. We pick four populardevices (iPhone4, iTouch4, Samsung i9100, Samsung i9100g)to compare their performance. Figure 12(a) shows that i-Phone4, iTouch4 and i9100g almost have the same expectedperformance at a high level of accuracy (e.g., ∼ 0.4m at90-percentile). However, i9100 shows the worst results (over1.2m).
We place the i9100 phone at a static location and recordthe readings once the gyroscope is turned on (at time 0 in
0 0�4 0�8 1�20�0
0�2
0�4
0�6
0�8
1
Localization error (m)
��
� i��onei�o�c�i9100�i9100A����te� i9100
(a)
0 12 25�10123456
�ime (�)
��e
o���
et o
� i91
00 (° )
(b)
Fig. 12. Experiments using different types of devices in the meeting room.(a) The CDF of error distribution, and (b) Angle drift vs. time for i9100.
Figure 12(b) ). We find the value declines at the very begin-ning, and then starts increasing (as shown in Figure 12(b)).This is caused by the relatively lower quality of the STMi-croelectroinics K3G gyroscope in i9100. To compensate forsuch intrinsic drifts, we use curve fitting methods to deriveequations that characterize the variations over time to calibratethe gyroscope reading. We then repeat the experiments andthe results (“Adjusted i9100” curve in Figure 12(a)) showthat after calibration it has accuracy comparable to the otherthree devices. For the other devices i9100g, iPhone4, iTouch4,same experiments are repeated and the curves tend to be flathorizontal lines, showing little drift over time.
From the above study, we conclude that the pointingoperations can be made a robust localization primitive providedthat the user follows the guidelines with certain care. In thenext two sections, we investigate how a service provider canquickly obtain the coordinates of reference points, and howthe system can gain input of which reference points the userhas chosen.
IV. SITE SURVEY FOR REFERENCE POINT COORDINATES
Sextant needs the coordinates of reference points to com-pute user location. The most straightforward method is tomanually measure the distances, thus coordinates directly.Although this is a one-time investment because referencepoints do not move, it still consumes time when there are manyof them. In this section, we present a method for a serviceprovider to significantly reduce the human effort.
In an unmapped environment, two workers 4 of a serviceprovider first choose two pair-wise visible reference points,say A and B, called starting pairs (step1 in Figure 13). Theyeach stand at A and B, then measure the distance a betweenthem (e.g., by counting floor tiles, using a tape measure ortechniques such as BeepBeep [11]). We can set a coordinatesystem with A at the origin (0, 0) and B at (a, 0). We callobjects A and B as positioned objects.
Then, the workers select a third un-positioned object Cand determine its coordinates (x, y). When C is visible fromA and B , the worker at A points the phone to B, and then Cto measure � BAC. Similarly, the other worker can measure� ABC. The two angles α = � BAC and β = � ABC can beused to calculate the coordinates of C: x = (a tanβ)/(tanα+tanβ), and y = (a tanα tanβ)/(tanα+ tanβ).
The positioned object C together with A and B forma triangle, and the distance AC (or BC) can be easilyderived using the estimated coordinates of C. The worker atA can then move to C, and repeat similar processes to locateadditional objects D,E (steps 2 and 3 in Figure 13), and so
4The procedure can be conducted by one worker with more walking, ormultiple workers in parallel.
A (0,0) B (a,0)
C (x,y)
D
D
E
A B
C
A B
C
B (a,0)C*
Step1
Step2-c
Step2
Step3
C (x,y) B (a,0)
Step2-bBlock
BlockBlock
C (x,y)
Fig. 13. Procedure to estimate the coordinates of reference points.
on. The coordinates of each additional positioned object canbe uniquely determined in this coordinate system.
Blocked positioned objects. During the process when thedirect line of sight between B and C is blocked (step2-b inFigure 13), one of BD, CD plus angle � BDC are measured,together with BC (known already), the coordinates of D canbe determined by the law of sines.
Blocked unpositioned objects. When an unpositionedobject D is blocked from both B and C (step2-c in Figure 13),one worker has to move along the line between C and B tofind an appropriate location C∗ where object D is visible. Theymeasure distance CC∗, the angle γ = � CC∗D, and C∗D tolocate D relative to C, thus eventually its coordinates. We omitthe case when D is blocked from only one of B, C, which issimilar to step2-b.
New starting pairs to control the error accumulation.One problem arises from such hop-by-hop estimation: thecoordinates of a new object may contain error; when they areused to position another object, the error may grow. To controlsuch accumulation, a simple method is to use a new startingpair after a few hops to reset the error back to zero.
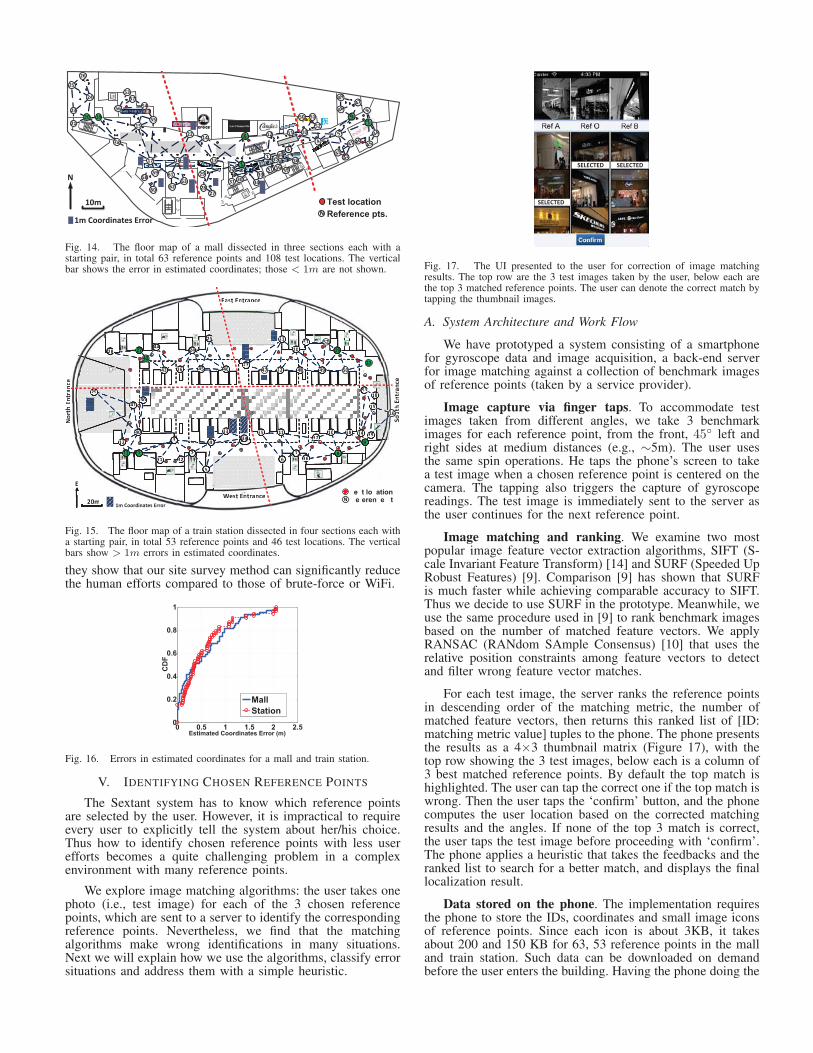
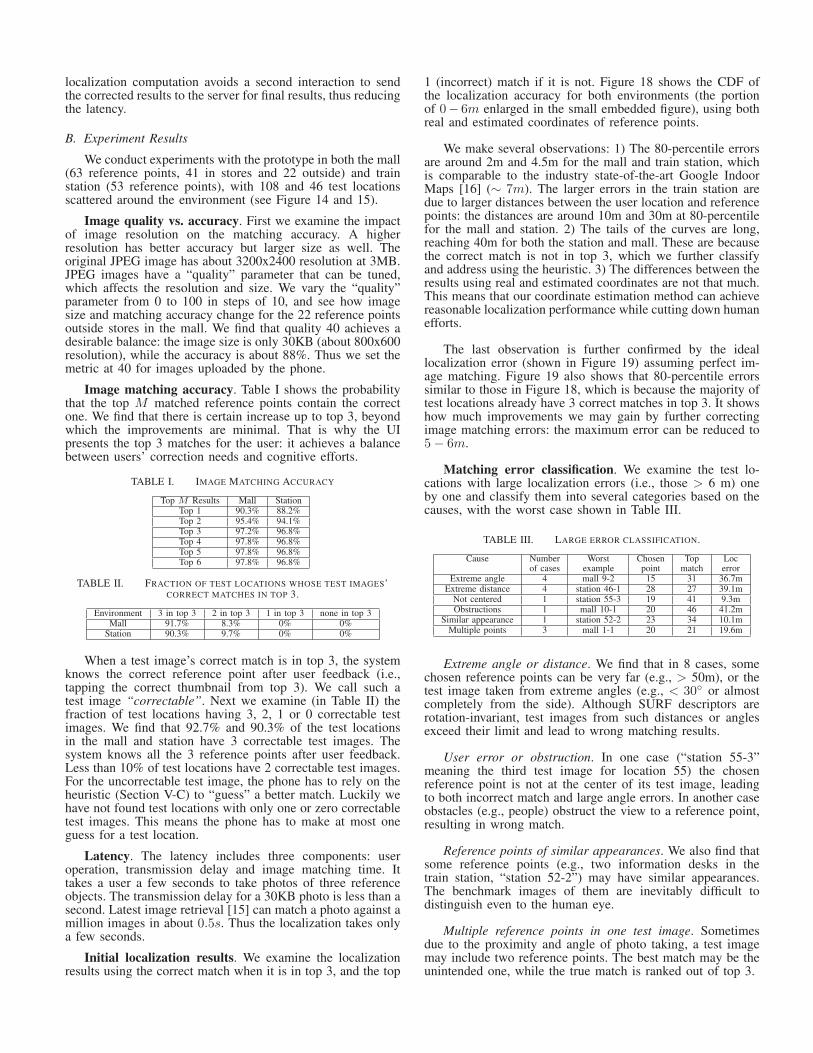
Accuracy. We conduct experiments in two large indoorenvironments, a 150 × 75m shopping mall (Figure 14) and a300× 200m train station (Figure 15). When only one startingpair is used (reference points [1,6] in Figure 14 and [1,13]in Figure 15, shown in green or slightly darker color), errorsare small (< 2m) up to 4 ∼ 6 hops away, beyond whichthey quickly grow to more than 12m. Obviously such largeerrors are not acceptable. After we add 2, 3 more startingpairs in these two environments ([7,9] and [19,20] in themall, [27, 42], [17,19] and [8,9] in the station), the 80-percentile errors are within 1m, while the maximum about 2m(Figure 16). They eventually lead to satisfactory localizationaccuracy (Section V-C).
Human efforts. In the mall each of the 63 referencepoints takes about 2 minutes to measure the angle(s) and/ordistance(s); in the station each of the 53 points takes about 3minutes due to longer walking distances. In total they cost 2,2.6 man-hours. Assuming WiFi signatures are measured 2mapart and each location takes 10s, excluding inaccessible areas5, 200m2 and 23, 700m2 areas need to be covered, resulting in3.6, 16.5 man-hours. Thus the cost is roughly 16 − 55% thatof WiFi. Note that over long time WiFi incurs periodic re-calibration costs each of similar amounts, while we pay onlya one-time effort.
If brute-force measurements are used, each reference pointtakes 50% more time when regular floor tiles are availableto count the coordinates; otherwise using a tape measure cantriple the time. Although the quantifications are quite rough,
6 12 11
4
43
50 51
5210
3
3336
38
39
35
37
2728
29
4021
2023
24
25
26
1555
5456
5357
1921
18
17
59
60
22
58
16
14
6163
62
13
30
32
31 34
5
41
42
98
4748
49
7
44
4546
N1m Coordinates Error
10m
N
Fig. 14. The floor map of a mall dissected in three sections each with astarting pair, in total 63 reference points and 108 test locations. The verticalbar shows the error in estimated coordinates; those < 1m are not shown.
West Entrance
East Entrance
Sout
h En
tran
ce
Nor
th E
ntra
nce
20m
E
2728
8
23
14 39381037
15
1853
67
9
11
361 2
3
5
12
13
2930
31 32
40
41
4
3334
35
24
26
42
43
44
45
25
46
16
205121
4822 49
19
West Entrance
East Entrance
Sout
hEn
tran
ce
Nor
thEn
tran
ce
20m
E
22772288
8
2233
1144 339999338811003377
1155
11885533
67
9
1111
33661 2
3
5
1122
1133
22993300
3311 3322
4400
4411
4
33333344
3355
2244
22664433
4444
4455
2255
4466
220055112211
44882222 4499
1199
1750
52
47
111111111116 ut16
42
�e�t lo�ation�e�eren�e �t��N
1m Coordinates Error
Fig. 15. The floor map of a train station dissected in four sections each witha starting pair, in total 53 reference points and 46 test locations. The verticalbars show > 1m errors in estimated coordinates.
they show that our site survey method can significantly reducethe human efforts compared to those of brute-force or WiFi.
0 0.5 1 1.5 2 2.50
0.2
0.4
0.6
0.8
1
Estimated Coordinates Error (m)
CD
F
MallStation
Fig. 16. Errors in estimated coordinates for a mall and train station.
V. IDENTIFYING CHOSEN REFERENCE POINTS
The Sextant system has to know which reference pointsare selected by the user. However, it is impractical to requireevery user to explicitly tell the system about her/his choice.Thus how to identify chosen reference points with less userefforts becomes a quite challenging problem in a complexenvironment with many reference points.
We explore image matching algorithms: the user takes onephoto (i.e., test image) for each of the 3 chosen referencepoints, which are sent to a server to identify the correspondingreference points. Nevertheless, we find that the matchingalgorithms make wrong identifications in many situations.Next we will explain how we use the algorithms, classify errorsituations and address them with a simple heuristic.
SELECTED SELECTED
SELECTED
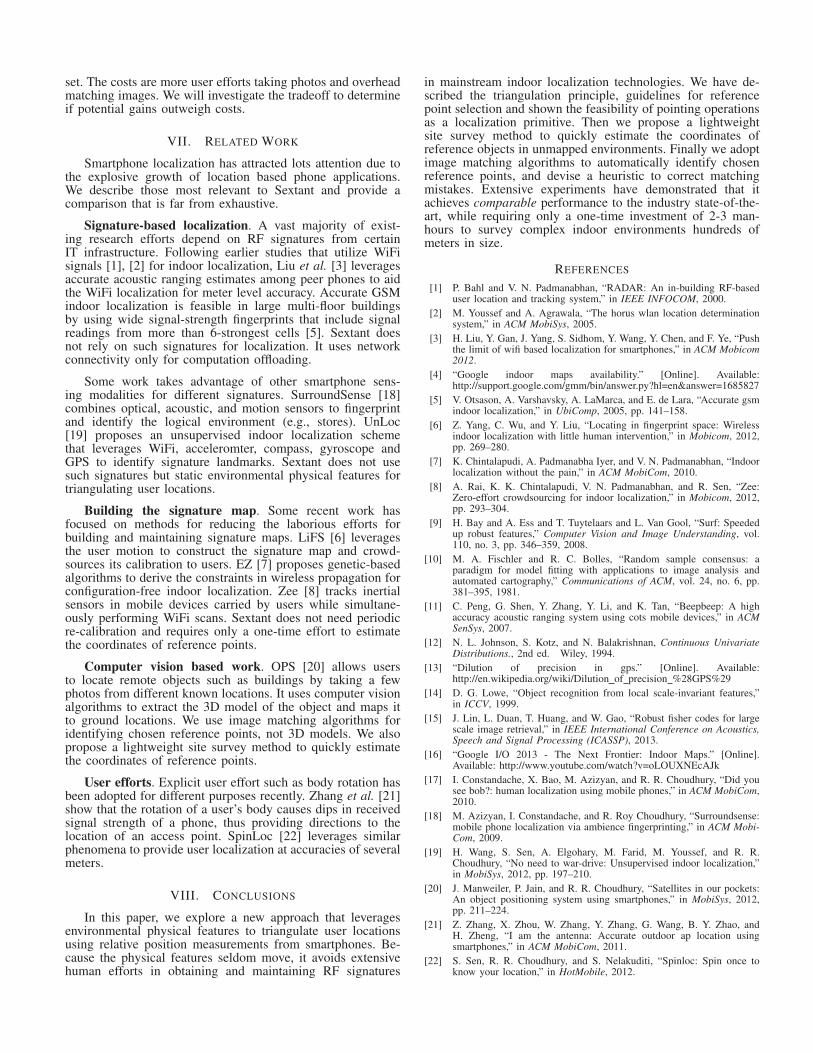
Fig. 17. The UI presented to the user for correction of image matchingresults. The top row are the 3 test images taken by the user, below each arethe top 3 matched reference points. The user can denote the correct match bytapping the thumbnail images.
A. System Architecture and Work Flow
We have prototyped a system consisting of a smartphonefor gyroscope data and image acquisition, a back-end serverfor image matching against a collection of benchmark imagesof reference points (taken by a service provider).
Image capture via finger taps. To accommodate testimages taken from different angles, we take 3 benchmarkimages for each reference point, from the front, 45◦ left andright sides at medium distances (e.g., ∼5m). The user usesthe same spin operations. He taps the phone’s screen to takea test image when a chosen reference point is centered on thecamera. The tapping also triggers the capture of gyroscopereadings. The test image is immediately sent to the server asthe user continues for the next reference point.
Image matching and ranking. We examine two mostpopular image feature vector extraction algorithms, SIFT (S-cale Invariant Feature Transform) [14] and SURF (Speeded UpRobust Features) [9]. Comparison [9] has shown that SURFis much faster while achieving comparable accuracy to SIFT.Thus we decide to use SURF in the prototype. Meanwhile, weuse the same procedure used in [9] to rank benchmark imagesbased on the number of matched feature vectors. We applyRANSAC (RANdom SAmple Consensus) [10] that uses therelative position constraints among feature vectors to detectand filter wrong feature vector matches.
For each test image, the server ranks the reference pointsin descending order of the matching metric, the number ofmatched feature vectors, then returns this ranked list of [ID:matching metric value] tuples to the phone. The phone presentsthe results as a 4×3 thumbnail matrix (Figure 17), with thetop row showing the 3 test images, below each is a column of3 best matched reference points. By default the top match ishighlighted. The user can tap the correct one if the top match iswrong. Then the user taps the ‘confirm’ button, and the phonecomputes the user location based on the corrected matchingresults and the angles. If none of the top 3 match is correct,the user taps the test image before proceeding with ‘confirm’.The phone applies a heuristic that takes the feedbacks and theranked list to search for a better match, and displays the finallocalization result.
Data stored on the phone. The implementation requiresthe phone to store the IDs, coordinates and small image iconsof reference points. Since each icon is about 3KB, it takesabout 200 and 150 KB for 63, 53 reference points in the malland train station. Such data can be downloaded on demandbefore the user enters the building. Having the phone doing the
localization computation avoids a second interaction to sendthe corrected results to the server for final results, thus reducingthe latency.
B. Experiment Results
We conduct experiments with the prototype in both the mall(63 reference points, 41 in stores and 22 outside) and trainstation (53 reference points), with 108 and 46 test locationsscattered around the environment (see Figure 14 and 15).
Image quality vs. accuracy. First we examine the impactof image resolution on the matching accuracy. A higherresolution has better accuracy but larger size as well. Theoriginal JPEG image has about 3200x2400 resolution at 3MB.JPEG images have a “quality” parameter that can be tuned,which affects the resolution and size. We vary the “quality”parameter from 0 to 100 in steps of 10, and see how imagesize and matching accuracy change for the 22 reference pointsoutside stores in the mall. We find that quality 40 achieves adesirable balance: the image size is only 30KB (about 800x600resolution), while the accuracy is about 88%. Thus we set themetric at 40 for images uploaded by the phone.
Image matching accuracy. Table I shows the probabilitythat the top M matched reference points contain the correctone. We find that there is certain increase up to top 3, beyondwhich the improvements are minimal. That is why the UIpresents the top 3 matches for the user: it achieves a balancebetween users’ correction needs and cognitive efforts.
TABLE I. IMAGE MATCHING ACCURACY
Top M Results Mall StationTop 1 90.3% 88.2%Top 2 95.4% 94.1%Top 3 97.2% 96.8%Top 4 97.8% 96.8%Top 5 97.8% 96.8%Top 6 97.8% 96.8%
TABLE II. FRACTION OF TEST LOCATIONS WHOSE TEST IMAGES’CORRECT MATCHES IN TOP 3.
Environment 3 in top 3 2 in top 3 1 in top 3 none in top 3Mall 91.7% 8.3% 0% 0%
Station 90.3% 9.7% 0% 0%
When a test image’s correct match is in top 3, the systemknows the correct reference point after user feedback (i.e.,tapping the correct thumbnail from top 3). We call such atest image “correctable”. Next we examine (in Table II) thefraction of test locations having 3, 2, 1 or 0 correctable testimages. We find that 92.7% and 90.3% of the test locationsin the mall and station have 3 correctable test images. Thesystem knows all the 3 reference points after user feedback.Less than 10% of test locations have 2 correctable test images.For the uncorrectable test image, the phone has to rely on theheuristic (Section V-C) to “guess” a better match. Luckily wehave not found test locations with only one or zero correctabletest images. This means the phone has to make at most oneguess for a test location.
Latency. The latency includes three components: useroperation, transmission delay and image matching time. Ittakes a user a few seconds to take photos of three referenceobjects. The transmission delay for a 30KB photo is less than asecond. Latest image retrieval [15] can match a photo against amillion images in about 0.5s. Thus the localization takes onlya few seconds.
Initial localization results. We examine the localizationresults using the correct match when it is in top 3, and the top
1 (incorrect) match if it is not. Figure 18 shows the CDF ofthe localization accuracy for both environments (the portionof 0− 6m enlarged in the small embedded figure), using bothreal and estimated coordinates of reference points.
We make several observations: 1) The 80-percentile errorsare around 2m and 4.5m for the mall and train station, whichis comparable to the industry state-of-the-art Google IndoorMaps [16] (∼ 7m). The larger errors in the train station aredue to larger distances between the user location and referencepoints: the distances are around 10m and 30m at 80-percentilefor the mall and station. 2) The tails of the curves are long,reaching 40m for both the station and mall. These are becausethe correct match is not in top 3, which we further classifyand address using the heuristic. 3) The differences between theresults using real and estimated coordinates are not that much.This means that our coordinate estimation method can achievereasonable localization performance while cutting down humanefforts.
The last observation is further confirmed by the ideallocalization error (shown in Figure 19) assuming perfect im-age matching. Figure 19 also shows that 80-percentile errorssimilar to those in Figure 18, which is because the majority oftest locations already have 3 correct matches in top 3. It showshow much improvements we may gain by further correctingimage matching errors: the maximum error can be reduced to5− 6m.
Matching error classification. We examine the test lo-cations with large localization errors (i.e., those > 6 m) oneby one and classify them into several categories based on thecauses, with the worst case shown in Table III.
TABLE III. LARGE ERROR CLASSIFICATION.
Cause Number Worst Chosen Top Locof cases example point match error
Extreme angle 4 mall 9-2 15 31 36.7mExtreme distance 4 station 46-1 28 27 39.1m
Not centered 1 station 55-3 19 41 9.3mObstructions 1 mall 10-1 20 46 41.2m
Similar appearance 1 station 52-2 23 34 10.1mMultiple points 3 mall 1-1 20 21 19.6m
Extreme angle or distance. We find that in 8 cases, somechosen reference points can be very far (e.g., > 50m), or thetest image taken from extreme angles (e.g., < 30◦ or almostcompletely from the side). Although SURF descriptors arerotation-invariant, test images from such distances or anglesexceed their limit and lead to wrong matching results.
User error or obstruction. In one case (“station 55-3”meaning the third test image for location 55) the chosenreference point is not at the center of its test image, leadingto both incorrect match and large angle errors. In another caseobstacles (e.g., people) obstruct the view to a reference point,resulting in wrong match.
Reference points of similar appearances. We also find thatsome reference points (e.g., two information desks in thetrain station, “station 52-2”) may have similar appearances.The benchmark images of them are inevitably difficult todistinguish even to the human eye.
Multiple reference points in one test image. Sometimesdue to the proximity and angle of photo taking, a test imagemay include two reference points. The best match may be theunintended one, while the true match is ranked out of top 3.
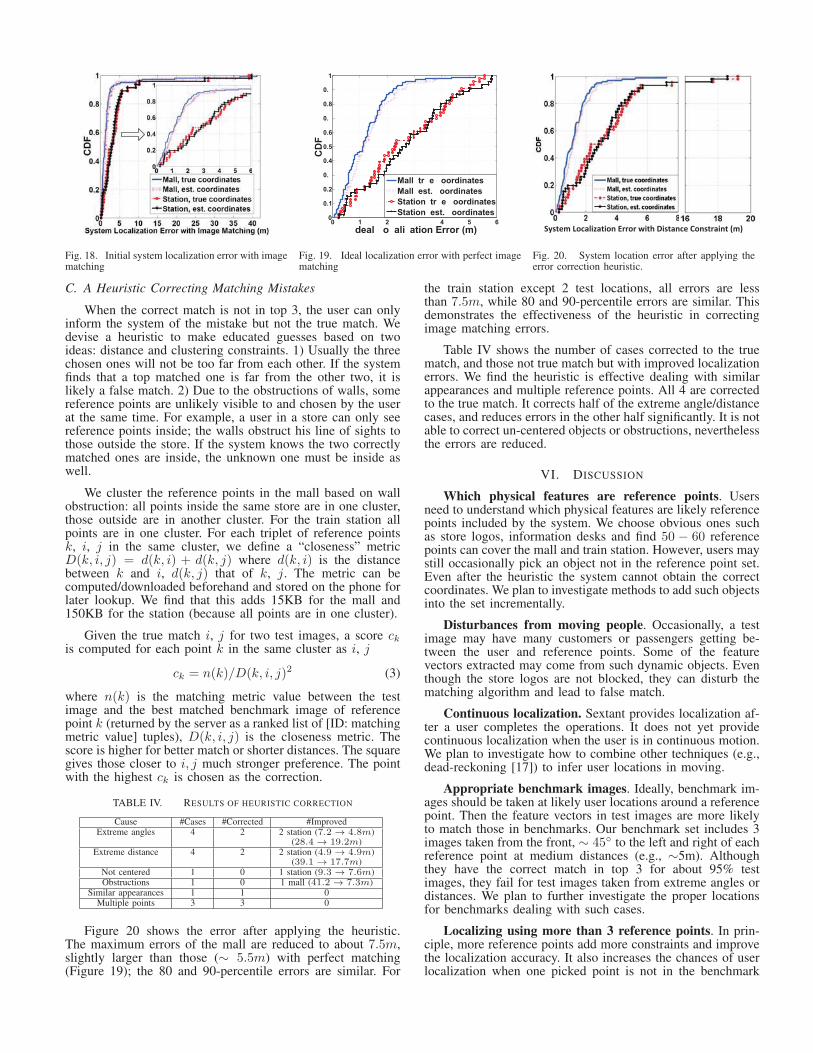
Fig. 18. Initial system localization error with imagematching
0 1 2 � 4 5 60
0.1
0.2
0.�
0.4
0.5
0.6
0.�
0.8
0.�
1
�deal �o�ali�ation Error (m)
CD
F
Mall� tr�e �oordinatesMall� est. �oordinatesStation� tr�e �oordinatesStation� est. �oordinates
Fig. 19. Ideal localization error with perfect imagematching
System Localization Error with Distance Constraint (m)
Fig. 20. System location error after applying theerror correction heuristic.
C. A Heuristic Correcting Matching Mistakes
When the correct match is not in top 3, the user can onlyinform the system of the mistake but not the true match. Wedevise a heuristic to make educated guesses based on twoideas: distance and clustering constraints. 1) Usually the threechosen ones will not be too far from each other. If the systemfinds that a top matched one is far from the other two, it islikely a false match. 2) Due to the obstructions of walls, somereference points are unlikely visible to and chosen by the userat the same time. For example, a user in a store can only seereference points inside; the walls obstruct his line of sights tothose outside the store. If the system knows the two correctlymatched ones are inside, the unknown one must be inside aswell.
We cluster the reference points in the mall based on wallobstruction: all points inside the same store are in one cluster,those outside are in another cluster. For the train station allpoints are in one cluster. For each triplet of reference pointsk, i, j in the same cluster, we define a “closeness” metricD(k, i, j) = d(k, i) + d(k, j) where d(k, i) is the distancebetween k and i, d(k, j) that of k, j. The metric can becomputed/downloaded beforehand and stored on the phone forlater lookup. We find that this adds 15KB for the mall and150KB for the station (because all points are in one cluster).
Given the true match i, j for two test images, a score ckis computed for each point k in the same cluster as i, j
ck = n(k)/D(k, i, j)2 (3)
where n(k) is the matching metric value between the testimage and the best matched benchmark image of referencepoint k (returned by the server as a ranked list of [ID: matchingmetric value] tuples), D(k, i, j) is the closeness metric. Thescore is higher for better match or shorter distances. The squaregives those closer to i, j much stronger preference. The pointwith the highest ck is chosen as the correction.
TABLE IV. RESULTS OF HEURISTIC CORRECTION
Cause #Cases #Corrected #ImprovedExtreme angles 4 2 2 station (7.2 → 4.8m)
(28.4 → 19.2m)Extreme distance 4 2 2 station (4.9 → 4.9m)
(39.1 → 17.7m)Not centered 1 0 1 station (9.3 → 7.6m)Obstructions 1 0 1 mall (41.2 → 7.3m)
Similar appearances 1 1 0Multiple points 3 3 0
Figure 20 shows the error after applying the heuristic.The maximum errors of the mall are reduced to about 7.5m,slightly larger than those (∼ 5.5m) with perfect matching(Figure 19); the 80 and 90-percentile errors are similar. For
the train station except 2 test locations, all errors are lessthan 7.5m, while 80 and 90-percentile errors are similar. Thisdemonstrates the effectiveness of the heuristic in correctingimage matching errors.
Table IV shows the number of cases corrected to the truematch, and those not true match but with improved localizationerrors. We find the heuristic is effective dealing with similarappearances and multiple reference points. All 4 are correctedto the true match. It corrects half of the extreme angle/distancecases, and reduces errors in the other half significantly. It is notable to correct un-centered objects or obstructions, neverthelessthe errors are reduced.
VI. DISCUSSION
Which physical features are reference points. Usersneed to understand which physical features are likely referencepoints included by the system. We choose obvious ones suchas store logos, information desks and find 50 − 60 referencepoints can cover the mall and train station. However, users maystill occasionally pick an object not in the reference point set.Even after the heuristic the system cannot obtain the correctcoordinates. We plan to investigate methods to add such objectsinto the set incrementally.
Disturbances from moving people. Occasionally, a testimage may have many customers or passengers getting be-tween the user and reference points. Some of the featurevectors extracted may come from such dynamic objects. Eventhough the store logos are not blocked, they can disturb thematching algorithm and lead to false match.
Continuous localization. Sextant provides localization af-ter a user completes the operations. It does not yet providecontinuous localization when the user is in continuous motion.We plan to investigate how to combine other techniques (e.g.,dead-reckoning [17]) to infer user locations in moving.
Appropriate benchmark images. Ideally, benchmark im-ages should be taken at likely user locations around a referencepoint. Then the feature vectors in test images are more likelyto match those in benchmarks. Our benchmark set includes 3images taken from the front, ∼ 45◦ to the left and right of eachreference point at medium distances (e.g., ∼5m). Althoughthey have the correct match in top 3 for about 95% testimages, they fail for test images taken from extreme angles ordistances. We plan to further investigate the proper locationsfor benchmarks dealing with such cases.
Localizing using more than 3 reference points. In prin-ciple, more reference points add more constraints and improvethe localization accuracy. It also increases the chances of userlocalization when one picked point is not in the benchmark
set. The costs are more user efforts taking photos and overheadmatching images. We will investigate the tradeoff to determineif potential gains outweigh costs.
VII. RELATED WORK
Smartphone localization has attracted lots attention due tothe explosive growth of location based phone applications.We describe those most relevant to Sextant and provide acomparison that is far from exhaustive.
Signature-based localization. A vast majority of exist-ing research efforts depend on RF signatures from certainIT infrastructure. Following earlier studies that utilize WiFisignals [1], [2] for indoor localization, Liu et al. [3] leveragesaccurate acoustic ranging estimates among peer phones to aidthe WiFi localization for meter level accuracy. Accurate GSMindoor localization is feasible in large multi-floor buildingsby using wide signal-strength fingerprints that include signalreadings from more than 6-strongest cells [5]. Sextant doesnot rely on such signatures for localization. It uses networkconnectivity only for computation offloading.
Some work takes advantage of other smartphone sens-ing modalities for different signatures. SurroundSense [18]combines optical, acoustic, and motion sensors to fingerprintand identify the logical environment (e.g., stores). UnLoc[19] proposes an unsupervised indoor localization schemethat leverages WiFi, acceleromter, compass, gyroscope andGPS to identify signature landmarks. Sextant does not usesuch signatures but static environmental physical features fortriangulating user locations.
Building the signature map. Some recent work hasfocused on methods for reducing the laborious efforts forbuilding and maintaining signature maps. LiFS [6] leveragesthe user motion to construct the signature map and crowd-sources its calibration to users. EZ [7] proposes genetic-basedalgorithms to derive the constraints in wireless propagation forconfiguration-free indoor localization. Zee [8] tracks inertialsensors in mobile devices carried by users while simultane-ously performing WiFi scans. Sextant does not need periodicre-calibration and requires only a one-time effort to estimatethe coordinates of reference points.
Computer vision based work. OPS [20] allows usersto locate remote objects such as buildings by taking a fewphotos from different known locations. It uses computer visionalgorithms to extract the 3D model of the object and maps itto ground locations. We use image matching algorithms foridentifying chosen reference points, not 3D models. We alsopropose a lightweight site survey method to quickly estimatethe coordinates of reference points.
User efforts. Explicit user effort such as body rotation hasbeen adopted for different purposes recently. Zhang et al. [21]show that the rotation of a user’s body causes dips in receivedsignal strength of a phone, thus providing directions to thelocation of an access point. SpinLoc [22] leverages similarphenomena to provide user localization at accuracies of severalmeters.
VIII. CONCLUSIONS
In this paper, we explore a new approach that leveragesenvironmental physical features to triangulate user locationsusing relative position measurements from smartphones. Be-cause the physical features seldom move, it avoids extensivehuman efforts in obtaining and maintaining RF signatures
in mainstream indoor localization technologies. We have de-scribed the triangulation principle, guidelines for referencepoint selection and shown the feasibility of pointing operationsas a localization primitive. Then we propose a lightweightsite survey method to quickly estimate the coordinates ofreference objects in unmapped environments. Finally we adoptimage matching algorithms to automatically identify chosenreference points, and devise a heuristic to correct matchingmistakes. Extensive experiments have demonstrated that itachieves comparable performance to the industry state-of-the-art, while requiring only a one-time investment of 2-3 man-hours to survey complex indoor environments hundreds ofmeters in size.
REFERENCES
[1] P. Bahl and V. N. Padmanabhan, “RADAR: An in-building RF-baseduser location and tracking system,” in IEEE INFOCOM, 2000.
[2] M. Youssef and A. Agrawala, “The horus wlan location determinationsystem,” in ACM MobiSys, 2005.
[3] H. Liu, Y. Gan, J. Yang, S. Sidhom, Y. Wang, Y. Chen, and F. Ye, “Pushthe limit of wifi based localization for smartphones,” in ACM Mobicom2012.
[4] “Google indoor maps availability.” [Online]. Available:http://support.google.com/gmm/bin/answer.py?hl=en&answer=1685827
[5] V. Otsason, A. Varshavsky, A. LaMarca, and E. de Lara, “Accurate gsmindoor localization,” in UbiComp, 2005, pp. 141–158.
[6] Z. Yang, C. Wu, and Y. Liu, “Locating in fingerprint space: Wirelessindoor localization with little human intervention,” in Mobicom, 2012,pp. 269–280.
[7] K. Chintalapudi, A. Padmanabha Iyer, and V. N. Padmanabhan, “Indoorlocalization without the pain,” in ACM MobiCom, 2010.
[8] A. Rai, K. K. Chintalapudi, V. N. Padmanabhan, and R. Sen, “Zee:Zero-effort crowdsourcing for indoor localization,” in Mobicom, 2012,pp. 293–304.
[9] H. Bay and A. Ess and T. Tuytelaars and L. Van Gool, “Surf: Speededup robust features,” Computer Vision and Image Understanding, vol.110, no. 3, pp. 346–359, 2008.
[10] M. A. Fischler and R. C. Bolles, “Random sample consensus: aparadigm for model fitting with applications to image analysis andautomated cartography,” Communications of ACM, vol. 24, no. 6, pp.381–395, 1981.
[11] C. Peng, G. Shen, Y. Zhang, Y. Li, and K. Tan, “Beepbeep: A highaccuracy acoustic ranging system using cots mobile devices,” in ACMSenSys, 2007.
[12] N. L. Johnson, S. Kotz, and N. Balakrishnan, Continuous UnivariateDistributions., 2nd ed. Wiley, 1994.
[13] “Dilution of precision in gps.” [Online]. Available:http://en.wikipedia.org/wiki/Dilution of precision %28GPS%29
[14] D. G. Lowe, “Object recognition from local scale-invariant features,”in ICCV, 1999.
[15] J. Lin, L. Duan, T. Huang, and W. Gao, “Robust fisher codes for largescale image retrieval,” in IEEE International Conference on Acoustics,Speech and Signal Processing (ICASSP), 2013.
[16] “Google I/O 2013 - The Next Frontier: Indoor Maps.” [Online].Available: http://www.youtube.com/watch?v=oLOUXNEcAJk
[17] I. Constandache, X. Bao, M. Azizyan, and R. R. Choudhury, “Did yousee bob?: human localization using mobile phones,” in ACM MobiCom,2010.
[18] M. Azizyan, I. Constandache, and R. Roy Choudhury, “Surroundsense:mobile phone localization via ambience fingerprinting,” in ACM Mobi-Com, 2009.
[19] H. Wang, S. Sen, A. Elgohary, M. Farid, M. Youssef, and R. R.Choudhury, “No need to war-drive: Unsupervised indoor localization,”in MobiSys, 2012, pp. 197–210.
[20] J. Manweiler, P. Jain, and R. R. Choudhury, “Satellites in our pockets:An object positioning system using smartphones,” in MobiSys, 2012,pp. 211–224.
[21] Z. Zhang, X. Zhou, W. Zhang, Y. Zhang, G. Wang, B. Y. Zhao, andH. Zheng, “I am the antenna: Accurate outdoor ap location usingsmartphones,” in ACM MobiCom, 2011.
[22] S. Sen, R. R. Choudhury, and S. Nelakuditi, “Spinloc: Spin once toknow your location,” in HotMobile, 2012.


![Ubiquitous and Mobile Computing CS 528web.cs.wpi.edu/~emmanuel/courses/cs528/S15/slides/...localization via ambience fingerprinting,” in ACM MobiCom, 2009. [13] C. Liu, “Beyond](https://img.pdfslide.us/doc/110x75/5eb4c0b3418bdf57664763fd/ubiquitous-and-mobile-computing-cs-emmanuelcoursescs528s15slides-localization.jpg)