Embed Size (px)
Citation preview
Towards Transparent Introspection
Kevin LeachUniversity of Virginia
MIT Lincoln [email protected]
Chad SpenskyUniversity of California, Santa Barbara
MIT Lincoln [email protected]
Westley WeimerUniversity of [email protected]
Fengwei ZhangWayne State University
Abstract—There is a growing need for the dynamic analysisof sensitive systems that do not support traditional debugging oremulation environments. Analysis can alter program behavior,necessitating transparency. For example, as the cat and mousegame between malware authors and malware analysts progresses,malicious software can increasingly detect and confound debug-gers. Analysts must understand variable values, stack traces,and factors influencing dynamic behavior, but recent malwaresamples leverage any piece of information or artifact availablethat signals the presence of a debugger or emulator. In thiswork, we advance the state-of-the-art for transparent programanalysis by introducing a low-artifact introspection technique.Our approach uses hardware-assisted live memory snapshotsof process execution on native targets (e.g., x86 processors),coupled with static reasoning about programs. We produce high-fidelity data and control flow information with minimal detectableartifacts that could influence benign subject behavior or beleveraged for anti-analysis. We evaluate our system using twohardware implementations (x86-supported System ManagementMode and PCI-based SlotScreamer devices) and two softwareconfigurations (benign and evasive programs). We also analyzethe theoretical and practical limitations of our technique. Wediscuss an expert case study in which we apply our technique toa malware reverse engineering task. Finally, we present resultsof a human study in which 30 participants performed debuggingtasks using information provided by our approach; our toolwas as useful as a gdb baseline, but applies transparently. Ourdynamic analysis approach permits transparent introspectionto access previously-unavailable information about a process’sinternal state with minimal instrumentation artifacts.
I. INTRODUCTION
From embedded domains to virtualization to security, manysoftware systems that require dynamic analysis cannot usetraditional debuggers. Standard approaches, such as gdb, incursignificant overhead or pause the subject program entirely,which can interfere with normal execution or timing. Manyhardware-based approaches, such as the JTAG [39] standardfor embedded testing, may introduce delays or be inapplicablein secure settings [39]. Advances in trace-based [38] or re-play [43], [48] debugging often have lower overhead, but suchpost-mortem analyses can be too late for many issues. Theessential problem here is that of the heisenbug, in which thevery act of debugging incurs overhead or perturbs the systemand thus changes the behavior to be studied [33]. We usethe general term program introspection to encompass standarddebugging and analysis actions, such as observing variablevalues, inspecting dynamic stack traces, or determining whatinfluences the conditional behavior of unknown software.
We say that a dynamic analysis system, such as a debuggeror introspection tool, is transparent if computational and
environmental observations made by the subject system donot differ between analyzed runs and unanalyzed runs. Asystem that is not transparent instead introduces artifacts thatcan reveal that system’s presence. Artifacts can be direct,such as the Windows API isDebuggerPresent method,or indirect, such as measurements of elapsed times betweenoperations.
Two factors have led to a recent surge of interest intransparent process analysis techniques. First, hardware ad-vances have made memory analysis techniques practical, low-overhead, and affordable [44], [53]. Second, the twin riseof virtualization and appearance of environment-aware mal-ware [6], [9], [12], [13], [19] mean that there are many moresystems that require transparent dynamic analyses. DARPA’srecent announcement of the Transparent Computing Pro-gram [15] emphasizes the need for such techniques. An effec-tive introspection system in this context must be transparent,provide accurate information, and support analysis tasks.
We propose a system that provides transparent intro-spection capabilities by asynchronously acquiring snapshotsof program memory at runtime. Given such snapshots, webridge the semantic gap (i.e., reconstruct important programdata), converting from operating system information to processaddress spaces to variables, buffers, and stack frames ofinterest to the analyst. With the advent of new commodityhardware and virtual machine techniques capable of quicklyreading system memory, we believe a transparent programintrospection framework is now possible. We propose andevaluate HOPS, a lightweight, native, accurate, asynchronousintrospection technique that usefully supports analysis tasks.
We evaluate HOPS with respect to those three properties.We consider the transparency of our system and the artifactsit might produce, with a focus on time overhead. We measurethe accuracy of our system’s variable value and stack traceinformation against ground truth. Finally, we conduct a humanstudy of 30 participants to evaluate our system’s ability tosupport standard debugging tasks, as well as an expert casestudy to evaluate our system’s ability to support a malwarereverse engineering task. We find that HOPS is generallyaccurate for variable values and stack traces, is able to supportconventional maintenance tasks as well as gdb, and supportsdomain-specific reverse engineering tasks. In addition, becausewe focus on zero-overhead approaches, HOPS can be used insystems where traditional debuggers cannot apply.
II. BACKGROUND
In this section, we introduce the hardware support thatpermits an effective implementation of HOPS.
A. System Management Mode
System Management Mode (SMM) [25] is a mode ofexecution similar to Real and Protected modes available onx86 platforms. It provides a transparent mechanism for im-plementing platform-specific system control functions, such aspower management. SMM is triggered by asserting the SystemManagement Interrupt (SMI) pin on the CPU. This pin can betriggered in a variety of ways, which include writing to anI/O port or generating message signaled interrupts with a PCIdevice. Next, the CPU saves its state to a special region ofmemory called System Management RAM (SMRAM). Then,it atomically executes the SMI handler stored in SMRAM. SM-RAM cannot be addressed by the other modes of execution1.Thus, SMRAM can be used as secure storage. The SMI handleris loaded into SMRAM by the BIOS at boot time. The SMIhandler has unrestricted access to the physical address spaceand can run any instructions requiring any privilege level. TheRSM instruction forces the CPU to exit from SMM and resumeexecution in the previous mode.
B. SlotScreamer
SlotScreamer [20] is a recently-introduced memory foren-sic device with software running on a USB3380 chip. The chipconsists of a PCI Express connector that attaches to the mother-board of the system under test and a USB3 port connecting to aremote system. The device firmware can generate arbitrary PCIpackets. The remote system fakes DMA packets to rapidly readmemory from the system under test. This produces a smear ofmemory in which contents may change while being gathered.Using this technique is not perfectly transparent as it updatesthe DMA access performance counter. While SlotScreamer isa promising new device, it has not yet been formally evaluatedin debugging scenarios.
III. APPROACH
A. HOPS — Transparent Process Introspection
We present HOPS, an approach for hardware-supportedlow-overhead asynchronous debugging. Transparency is crit-ical for benign systems with heisenbugs as well as security-critical software or malware samples that may behave dif-ferently when executing in a debugger or virtual machineframework. Essentially, our approach iteratively inspects snap-shots of physical memory (recorded via special hardware) andthen uses a combination of operating system and compilertechniques to locate local, global, and stack-allocated variablesand their values as well as to determine the current call stack.Because we may operate on off-the-shelf optimized code andonly assume access to memory (e.g., we cannot access CPUregisters), our approach may not be able to report the valuesof some variables (such as those that are stored in registers) orsome stack frames (such as those associated with functions thathave been inlined). Nonetheless, we demonstrate empiricallyin Section V that our approach provides rich information forcommon maintenance and security analysis tasks in practice.
1) Input Assumptions: We detail the assumptions of ourapproach that delineate its applicability.
1Requests for SMRAM addresses forward to video memory by default.
Assembly Code. We assume access to the assembly code ofthe target executable, but not knowledge of the exact assembleror compiler flags or options used to produce that executable.For example, we may know that the target machine is running aparticular version of the Apache HTTP Server, but not whetherthe deployed version was compiled with “–O2” or “–O3”. Wecan make use of the source code, when applicable.
Memory Snapshots. Most critically, we assume accessto periodic samples or snapshots of physical memory. Suchsnapshots could be provided via a hardware-based system(e.g., [7], [11], [14], [46], [50]), or through virtual machineintrospection. In Section V, we evaluate our approach usingboth x86-supported System Management Mode and also PCI-based SlotScreamer devices to gather memory snapshots.
We focus on PCI-e as the ideal candidate for memoryintrospection because of its promising throughput rates. Therate at which we can obtain snapshots is limited theoreticallyby peak PCI-e transfer speeds (i.e., to 15.754GB/s, or roughlyto 3.85 million page samples per second). In practice, how-ever, most implementations can expect to achieve an effectivetransfer rate of 250MB/s per PCI lane, or 4GB/s total using16 lanes [3]. This equates to 1.05 million page samples persecond, or roughly 3200 cycles per page acquisition on ourexperimental platform (see Section V). We evaluate usingSlotScreamer, which is a special PCI-express board with aUSB3 interface permitting DMA access to a host’s memoryfrom a remote system [20]. SlotScreamer permits acquiringsmears of memory very rapidly (theoretically, it is band-limited by USB3, which permits reading memory at 4.8Gbpsor roughly 146 page samples per second).
Alternatively, we can acquire snapshots via System Man-agement Mode on x86 machines. SMM remains available onextant and current x86 systems, admitting broad applicability.Using SMM allows the capture of pages of memory at a time,albeit with high overhead (roughly 12µs to capture a page ofmemory).
In either case, we seek to reconstruct useful semanticinformation from these acquired snapshots.
Normal Systems. We do not consider any modificationto the target machine or the target executable beyond thehardware required to log memory snapshots. That is, one plug-in PCI device for SlotScreamer or an unchanged x86 processorfor SMM. In particular, we do not replace, patch, or otherwisechange the target executable or the OS on the target machine.
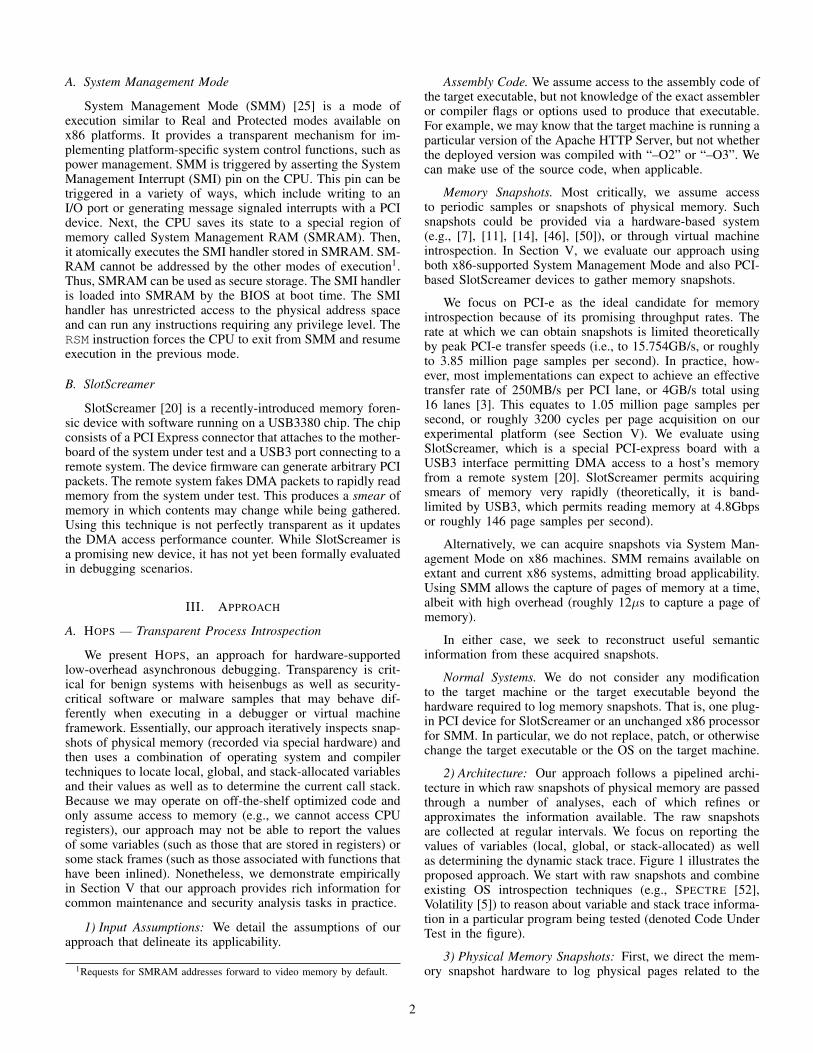
2) Architecture: Our approach follows a pipelined archi-tecture in which raw snapshots of physical memory are passedthrough a number of analyses, each of which refines orapproximates the information available. The raw snapshotsare collected at regular intervals. We focus on reporting thevalues of variables (local, global, or stack-allocated) as wellas determining the dynamic stack trace. Figure 1 illustrates theproposed approach. We start with raw snapshots and combineexisting OS introspection techniques (e.g., SPECTRE [52],Volatility [5]) to reason about variable and stack trace informa-tion in a particular program being tested (denoted Code UnderTest in the figure).
3) Physical Memory Snapshots: First, we direct the mem-ory snapshot hardware to log physical pages related to the
2
Semantics
Userspace
Kernel
Hardware
System Under Test (SUT)
Variables Function Calls
Code Under Test
OS Introspection
PCIe and/or SMMMemory Acquisition
Remote Host
Use cases
Read Variables
Read Stack Trace
Assumed component – Hardware-assisted memory acquisition (PCIe, SMM)
Hops component – Transparent program introspection
Fig. 1. Architecture of the proposed HOPS system. We assume access tohardware that can transparently acquire snapshots of system memory fromthe System Under Test. Combined with OS introspection techniques [5], [52]to find the program being tested (Code Under Test), we use these snapshotsto reason about variable and stack trace information in the Code Under Teston an external system (Remote Host).
Instrumented Binary
Program
Mem
ory
Globals
Locals
High addr
Low addr
← x = start of globals
← y = frame pointer
← Var a
← Var b
addr(a)− x = k1
Deployed Binary
Globals’
Locals’
start of globals →
frame pointer →
Var a→
Var b→addr(b)− y = k2
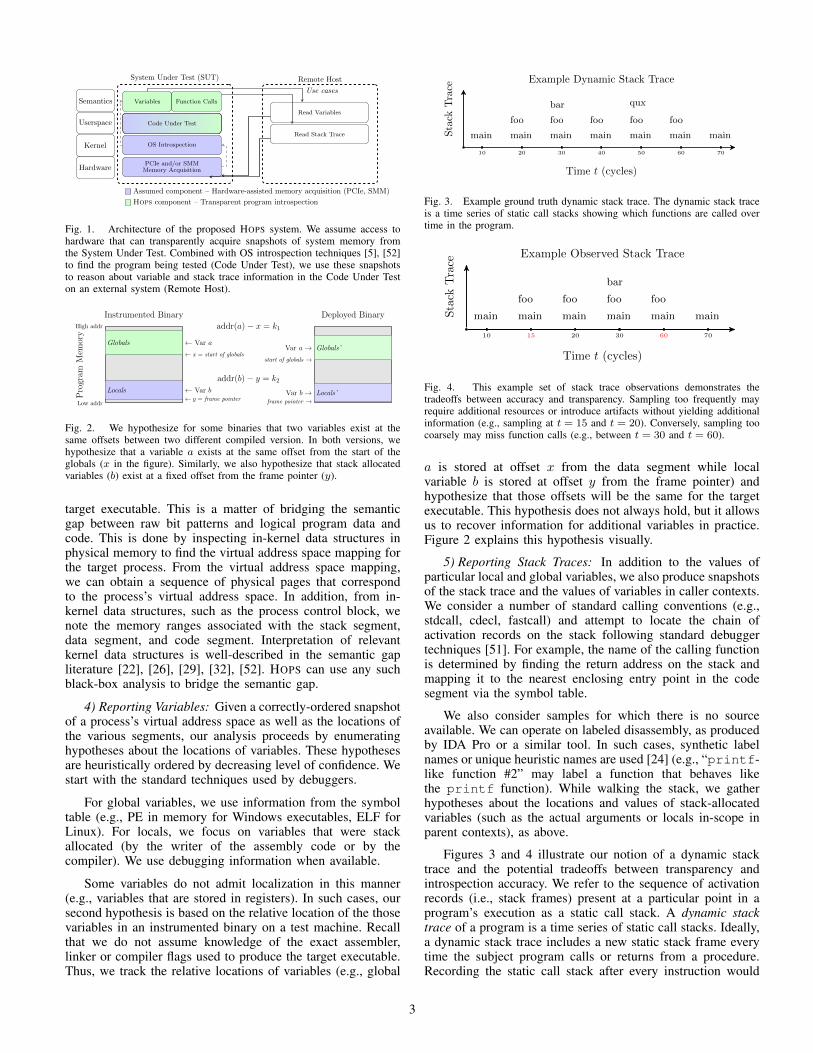
Fig. 2. We hypothesize for some binaries that two variables exist at thesame offsets between two different compiled version. In both versions, wehypothesize that a variable a exists at the same offset from the start of theglobals (x in the figure). Similarly, we also hypothesize that stack allocatedvariables (b) exist at a fixed offset from the frame pointer (y).
target executable. This is a matter of bridging the semanticgap between raw bit patterns and logical program data andcode. This is done by inspecting in-kernel data structures inphysical memory to find the virtual address space mapping forthe target process. From the virtual address space mapping,we can obtain a sequence of physical pages that correspondto the process’s virtual address space. In addition, from in-kernel data structures, such as the process control block, wenote the memory ranges associated with the stack segment,data segment, and code segment. Interpretation of relevantkernel data structures is well-described in the semantic gapliterature [22], [26], [29], [32], [52]. HOPS can use any suchblack-box analysis to bridge the semantic gap.
4) Reporting Variables: Given a correctly-ordered snapshotof a process’s virtual address space as well as the locations ofthe various segments, our analysis proceeds by enumeratinghypotheses about the locations of variables. These hypothesesare heuristically ordered by decreasing level of confidence. Westart with the standard techniques used by debuggers.
For global variables, we use information from the symboltable (e.g., PE in memory for Windows executables, ELF forLinux). For locals, we focus on variables that were stackallocated (by the writer of the assembly code or by thecompiler). We use debugging information when available.
Some variables do not admit localization in this manner(e.g., variables that are stored in registers). In such cases, oursecond hypothesis is based on the relative location of the thosevariables in an instrumented binary on a test machine. Recallthat we do not assume knowledge of the exact assembler,linker or compiler flags used to produce the target executable.Thus, we track the relative locations of variables (e.g., global
Example Dynamic Stack Trace
Stack
Trace
Time t (cycles)
main main
foo
main
foo
bar
main
foo
main
foo
qux
main
foo
main
10 20 30 40 50 60 70
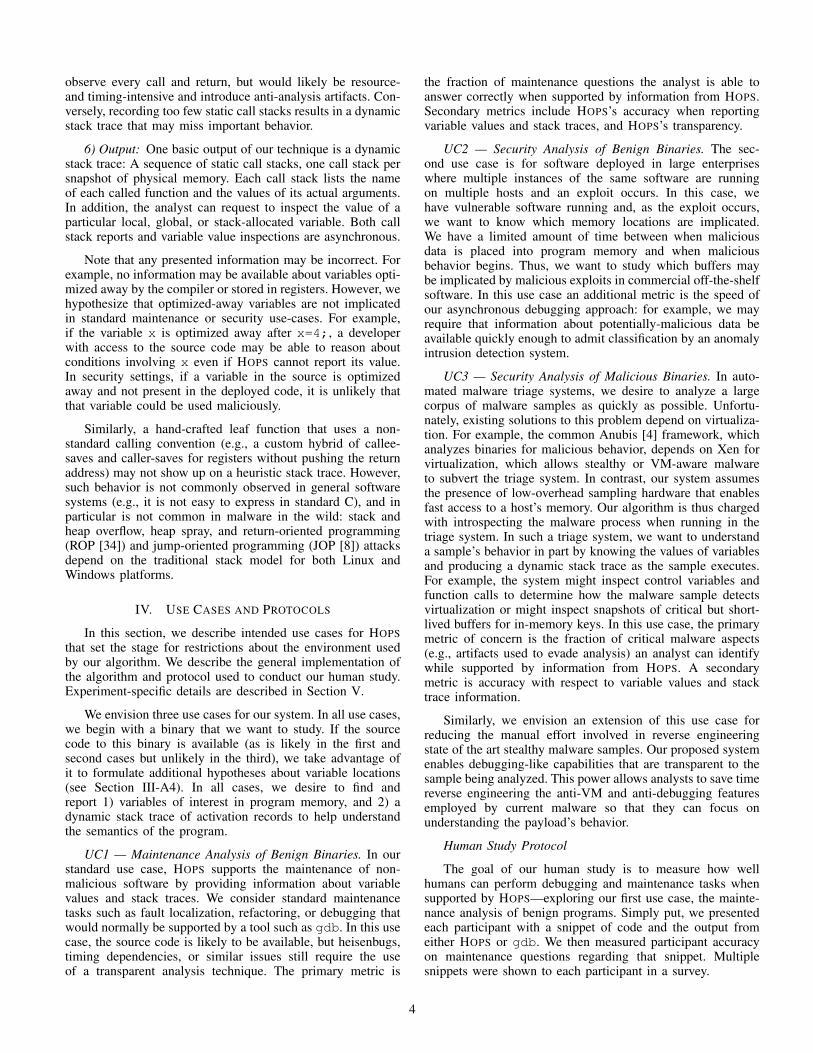
Fig. 3. Example ground truth dynamic stack trace. The dynamic stack traceis a time series of static call stacks showing which functions are called overtime in the program.
Example Observed Stack Trace
Stack
Trace
Time t (cycles)
main main
foo
main
foo
main
foo
bar
main
foo
main
10 15 20 30 60 70
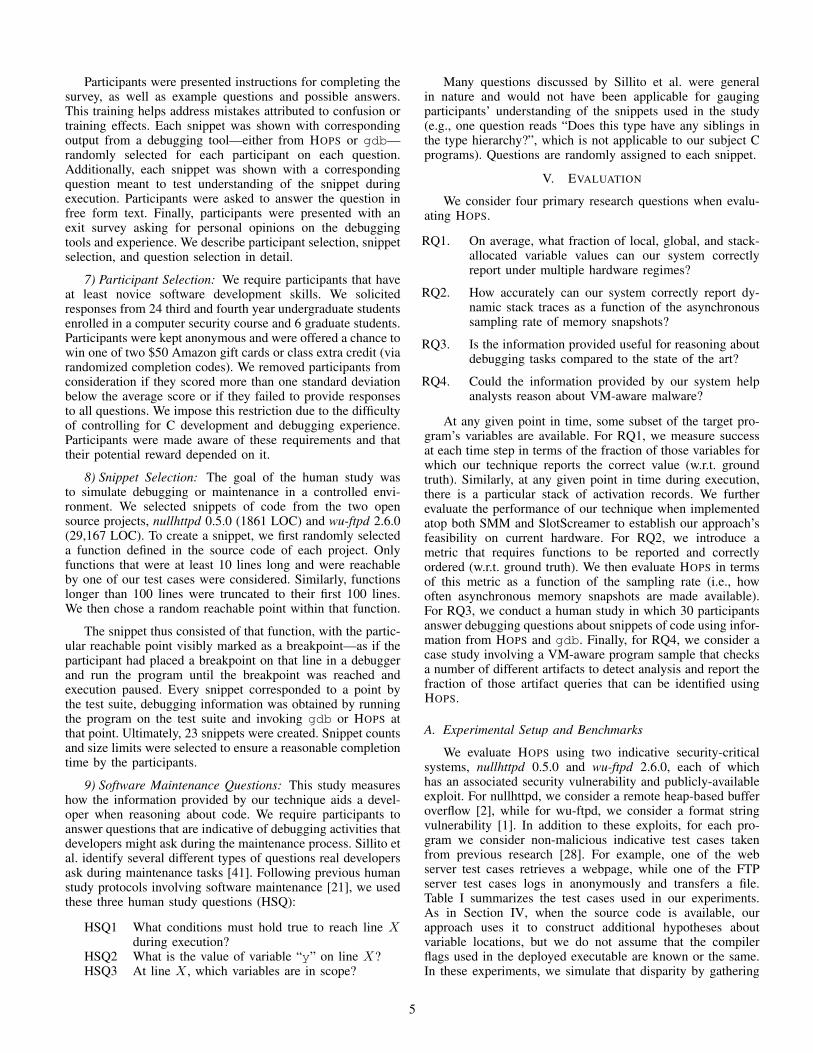
Fig. 4. This example set of stack trace observations demonstrates thetradeoffs between accuracy and transparency. Sampling too frequently mayrequire additional resources or introduce artifacts without yielding additionalinformation (e.g., sampling at t = 15 and t = 20). Conversely, sampling toocoarsely may miss function calls (e.g., between t = 30 and t = 60).
a is stored at offset x from the data segment while localvariable b is stored at offset y from the frame pointer) andhypothesize that those offsets will be the same for the targetexecutable. This hypothesis does not always hold, but it allowsus to recover information for additional variables in practice.Figure 2 explains this hypothesis visually.
5) Reporting Stack Traces: In addition to the values ofparticular local and global variables, we also produce snapshotsof the stack trace and the values of variables in caller contexts.We consider a number of standard calling conventions (e.g.,stdcall, cdecl, fastcall) and attempt to locate the chain ofactivation records on the stack following standard debuggertechniques [51]. For example, the name of the calling functionis determined by finding the return address on the stack andmapping it to the nearest enclosing entry point in the codesegment via the symbol table.
We also consider samples for which there is no sourceavailable. We can operate on labeled disassembly, as producedby IDA Pro or a similar tool. In such cases, synthetic labelnames or unique heuristic names are used [24] (e.g., “printf-like function #2” may label a function that behaves likethe printf function). While walking the stack, we gatherhypotheses about the locations and values of stack-allocatedvariables (such as the actual arguments or locals in-scope inparent contexts), as above.
Figures 3 and 4 illustrate our notion of a dynamic stacktrace and the potential tradeoffs between transparency andintrospection accuracy. We refer to the sequence of activationrecords (i.e., stack frames) present at a particular point in aprogram’s execution as a static call stack. A dynamic stacktrace of a program is a time series of static call stacks. Ideally,a dynamic stack trace includes a new static stack frame everytime the subject program calls or returns from a procedure.Recording the static call stack after every instruction would
3
observe every call and return, but would likely be resource-and timing-intensive and introduce anti-analysis artifacts. Con-versely, recording too few static call stacks results in a dynamicstack trace that may miss important behavior.
6) Output: One basic output of our technique is a dynamicstack trace: A sequence of static call stacks, one call stack persnapshot of physical memory. Each call stack lists the nameof each called function and the values of its actual arguments.In addition, the analyst can request to inspect the value of aparticular local, global, or stack-allocated variable. Both callstack reports and variable value inspections are asynchronous.
Note that any presented information may be incorrect. Forexample, no information may be available about variables opti-mized away by the compiler or stored in registers. However, wehypothesize that optimized-away variables are not implicatedin standard maintenance or security use-cases. For example,if the variable x is optimized away after x=4;, a developerwith access to the source code may be able to reason aboutconditions involving x even if HOPS cannot report its value.In security settings, if a variable in the source is optimizedaway and not present in the deployed code, it is unlikely thatthat variable could be used maliciously.
Similarly, a hand-crafted leaf function that uses a non-standard calling convention (e.g., a custom hybrid of callee-saves and caller-saves for registers without pushing the returnaddress) may not show up on a heuristic stack trace. However,such behavior is not commonly observed in general softwaresystems (e.g., it is not easy to express in standard C), and inparticular is not common in malware in the wild: stack andheap overflow, heap spray, and return-oriented programming(ROP [34]) and jump-oriented programming (JOP [8]) attacksdepend on the traditional stack model for both Linux andWindows platforms.
IV. USE CASES AND PROTOCOLS
In this section, we describe intended use cases for HOPSthat set the stage for restrictions about the environment usedby our algorithm. We describe the general implementation ofthe algorithm and protocol used to conduct our human study.Experiment-specific details are described in Section V.
We envision three use cases for our system. In all use cases,we begin with a binary that we want to study. If the sourcecode to this binary is available (as is likely in the first andsecond cases but unlikely in the third), we take advantage ofit to formulate additional hypotheses about variable locations(see Section III-A4). In all cases, we desire to find andreport 1) variables of interest in program memory, and 2) adynamic stack trace of activation records to help understandthe semantics of the program.
UC1 — Maintenance Analysis of Benign Binaries. In ourstandard use case, HOPS supports the maintenance of non-malicious software by providing information about variablevalues and stack traces. We consider standard maintenancetasks such as fault localization, refactoring, or debugging thatwould normally be supported by a tool such as gdb. In this usecase, the source code is likely to be available, but heisenbugs,timing dependencies, or similar issues still require the useof a transparent analysis technique. The primary metric is
the fraction of maintenance questions the analyst is able toanswer correctly when supported by information from HOPS.Secondary metrics include HOPS’s accuracy when reportingvariable values and stack traces, and HOPS’s transparency.
UC2 — Security Analysis of Benign Binaries. The sec-ond use case is for software deployed in large enterpriseswhere multiple instances of the same software are runningon multiple hosts and an exploit occurs. In this case, wehave vulnerable software running and, as the exploit occurs,we want to know which memory locations are implicated.We have a limited amount of time between when maliciousdata is placed into program memory and when maliciousbehavior begins. Thus, we want to study which buffers maybe implicated by malicious exploits in commercial off-the-shelfsoftware. In this use case an additional metric is the speed ofour asynchronous debugging approach: for example, we mayrequire that information about potentially-malicious data beavailable quickly enough to admit classification by an anomalyintrusion detection system.
UC3 — Security Analysis of Malicious Binaries. In auto-mated malware triage systems, we desire to analyze a largecorpus of malware samples as quickly as possible. Unfortu-nately, existing solutions to this problem depend on virtualiza-tion. For example, the common Anubis [4] framework, whichanalyzes binaries for malicious behavior, depends on Xen forvirtualization, which allows stealthy or VM-aware malwareto subvert the triage system. In contrast, our system assumesthe presence of low-overhead sampling hardware that enablesfast access to a host’s memory. Our algorithm is thus chargedwith introspecting the malware process when running in thetriage system. In such a triage system, we want to understanda sample’s behavior in part by knowing the values of variablesand producing a dynamic stack trace as the sample executes.For example, the system might inspect control variables andfunction calls to determine how the malware sample detectsvirtualization or might inspect snapshots of critical but short-lived buffers for in-memory keys. In this use case, the primarymetric of concern is the fraction of critical malware aspects(e.g., artifacts used to evade analysis) an analyst can identifywhile supported by information from HOPS. A secondarymetric is accuracy with respect to variable values and stacktrace information.
Similarly, we envision an extension of this use case forreducing the manual effort involved in reverse engineeringstate of the art stealthy malware samples. Our proposed systemenables debugging-like capabilities that are transparent to thesample being analyzed. This power allows analysts to save timereverse engineering the anti-VM and anti-debugging featuresemployed by current malware so that they can focus onunderstanding the payload’s behavior.
Human Study Protocol
The goal of our human study is to measure how wellhumans can perform debugging and maintenance tasks whensupported by HOPS—exploring our first use case, the mainte-nance analysis of benign programs. Simply put, we presentedeach participant with a snippet of code and the output fromeither HOPS or gdb. We then measured participant accuracyon maintenance questions regarding that snippet. Multiplesnippets were shown to each participant in a survey.
4
Participants were presented instructions for completing thesurvey, as well as example questions and possible answers.This training helps address mistakes attributed to confusion ortraining effects. Each snippet was shown with correspondingoutput from a debugging tool—either from HOPS or gdb—randomly selected for each participant on each question.Additionally, each snippet was shown with a correspondingquestion meant to test understanding of the snippet duringexecution. Participants were asked to answer the question infree form text. Finally, participants were presented with anexit survey asking for personal opinions on the debuggingtools and experience. We describe participant selection, snippetselection, and question selection in detail.
7) Participant Selection: We require participants that haveat least novice software development skills. We solicitedresponses from 24 third and fourth year undergraduate studentsenrolled in a computer security course and 6 graduate students.Participants were kept anonymous and were offered a chance towin one of two $50 Amazon gift cards or class extra credit (viarandomized completion codes). We removed participants fromconsideration if they scored more than one standard deviationbelow the average score or if they failed to provide responsesto all questions. We impose this restriction due to the difficultyof controlling for C development and debugging experience.Participants were made aware of these requirements and thattheir potential reward depended on it.
8) Snippet Selection: The goal of the human study wasto simulate debugging or maintenance in a controlled envi-ronment. We selected snippets of code from the two opensource projects, nullhttpd 0.5.0 (1861 LOC) and wu-ftpd 2.6.0(29,167 LOC). To create a snippet, we first randomly selecteda function defined in the source code of each project. Onlyfunctions that were at least 10 lines long and were reachableby one of our test cases were considered. Similarly, functionslonger than 100 lines were truncated to their first 100 lines.We then chose a random reachable point within that function.
The snippet thus consisted of that function, with the partic-ular reachable point visibly marked as a breakpoint—as if theparticipant had placed a breakpoint on that line in a debuggerand run the program until the breakpoint was reached andexecution paused. Every snippet corresponded to a point bythe test suite, debugging information was obtained by runningthe program on the test suite and invoking gdb or HOPS atthat point. Ultimately, 23 snippets were created. Snippet countsand size limits were selected to ensure a reasonable completiontime by the participants.
9) Software Maintenance Questions: This study measureshow the information provided by our technique aids a devel-oper when reasoning about code. We require participants toanswer questions that are indicative of debugging activities thatdevelopers might ask during the maintenance process. Sillito etal. identify several different types of questions real developersask during maintenance tasks [41]. Following previous humanstudy protocols involving software maintenance [21], we usedthese three human study questions (HSQ):
HSQ1 What conditions must hold true to reach line Xduring execution?
HSQ2 What is the value of variable “y” on line X?HSQ3 At line X , which variables are in scope?
Many questions discussed by Sillito et al. were generalin nature and would not have been applicable for gaugingparticipants’ understanding of the snippets used in the study(e.g., one question reads “Does this type have any siblings inthe type hierarchy?”, which is not applicable to our subject Cprograms). Questions are randomly assigned to each snippet.
V. EVALUATION
We consider four primary research questions when evalu-ating HOPS.
RQ1. On average, what fraction of local, global, and stack-allocated variable values can our system correctlyreport under multiple hardware regimes?
RQ2. How accurately can our system correctly report dy-namic stack traces as a function of the asynchronoussampling rate of memory snapshots?
RQ3. Is the information provided useful for reasoning aboutdebugging tasks compared to the state of the art?
RQ4. Could the information provided by our system helpanalysts reason about VM-aware malware?
At any given point in time, some subset of the target pro-gram’s variables are available. For RQ1, we measure successat each time step in terms of the fraction of those variables forwhich our technique reports the correct value (w.r.t. groundtruth). Similarly, at any given point in time during execution,there is a particular stack of activation records. We furtherevaluate the performance of our technique when implementedatop both SMM and SlotScreamer to establish our approach’sfeasibility on current hardware. For RQ2, we introduce ametric that requires functions to be reported and correctlyordered (w.r.t. ground truth). We then evaluate HOPS in termsof this metric as a function of the sampling rate (i.e., howoften asynchronous memory snapshots are made available).For RQ3, we conduct a human study in which 30 participantsanswer debugging questions about snippets of code using infor-mation from HOPS and gdb. Finally, for RQ4, we consider acase study involving a VM-aware program sample that checksa number of different artifacts to detect analysis and report thefraction of those artifact queries that can be identified usingHOPS.
A. Experimental Setup and Benchmarks
We evaluate HOPS using two indicative security-criticalsystems, nullhttpd 0.5.0 and wu-ftpd 2.6.0, each of whichhas an associated security vulnerability and publicly-availableexploit. For nullhttpd, we consider a remote heap-based bufferoverflow [2], while for wu-ftpd, we consider a format stringvulnerability [1]. In addition to these exploits, for each pro-gram we consider non-malicious indicative test cases takenfrom previous research [28]. For example, one of the webserver test cases retrieves a webpage, while one of the FTPserver test cases logs in anonymously and transfers a file.Table I summarizes the test cases used in our experiments.As in Section IV, when the source code is available, ourapproach uses it to construct additional hypotheses aboutvariable locations, but we do not assume that the compilerflags used in the deployed executable are known or the same.In these experiments, we simulate that disparity by gathering
5
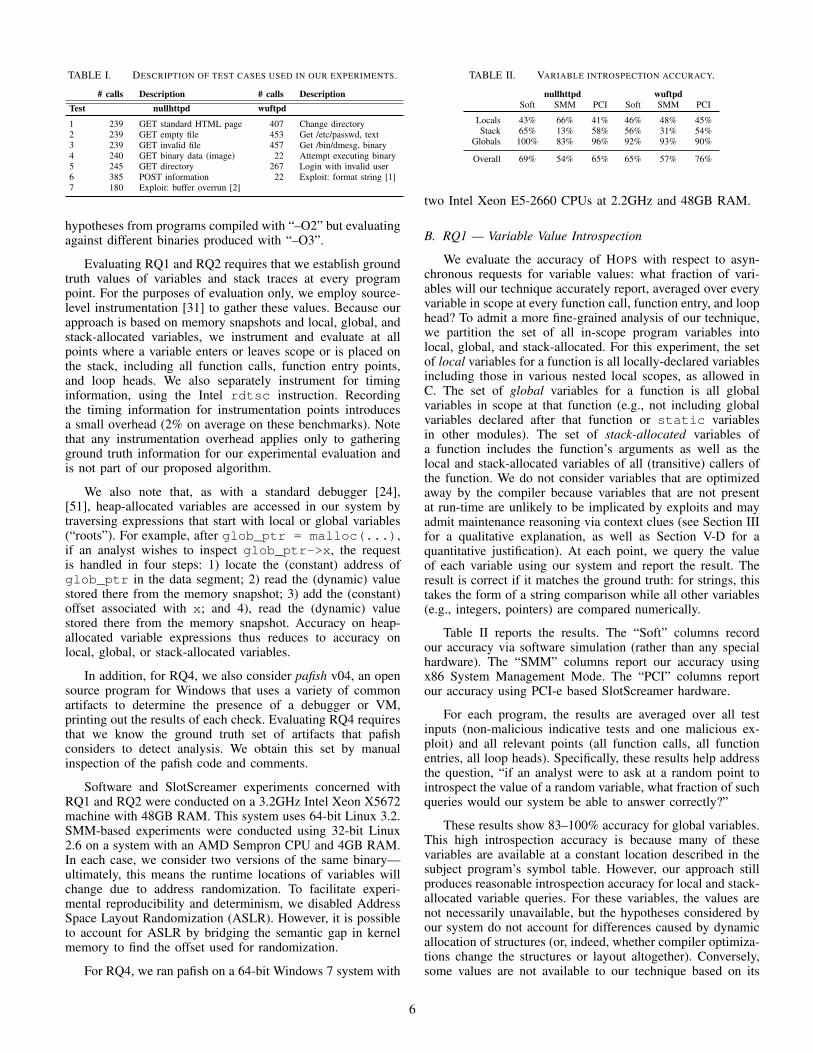
TABLE I. DESCRIPTION OF TEST CASES USED IN OUR EXPERIMENTS.
# calls Description # calls DescriptionTest nullhttpd wuftpd
1 239 GET standard HTML page 407 Change directory2 239 GET empty file 453 Get /etc/passwd, text3 239 GET invalid file 457 Get /bin/dmesg, binary4 240 GET binary data (image) 22 Attempt executing binary5 245 GET directory 267 Login with invalid user6 385 POST information 22 Exploit: format string [1]7 180 Exploit: buffer overrun [2]
hypotheses from programs compiled with “–O2” but evaluatingagainst different binaries produced with “–O3”.
Evaluating RQ1 and RQ2 requires that we establish groundtruth values of variables and stack traces at every programpoint. For the purposes of evaluation only, we employ source-level instrumentation [31] to gather these values. Because ourapproach is based on memory snapshots and local, global, andstack-allocated variables, we instrument and evaluate at allpoints where a variable enters or leaves scope or is placed onthe stack, including all function calls, function entry points,and loop heads. We also separately instrument for timinginformation, using the Intel rdtsc instruction. Recordingthe timing information for instrumentation points introducesa small overhead (2% on average on these benchmarks). Notethat any instrumentation overhead applies only to gatheringground truth information for our experimental evaluation andis not part of our proposed algorithm.
We also note that, as with a standard debugger [24],[51], heap-allocated variables are accessed in our system bytraversing expressions that start with local or global variables(“roots”). For example, after glob_ptr = malloc(...),if an analyst wishes to inspect glob_ptr->x, the requestis handled in four steps: 1) locate the (constant) address ofglob_ptr in the data segment; 2) read the (dynamic) valuestored there from the memory snapshot; 3) add the (constant)offset associated with x; and 4), read the (dynamic) valuestored there from the memory snapshot. Accuracy on heap-allocated variable expressions thus reduces to accuracy onlocal, global, or stack-allocated variables.
In addition, for RQ4, we also consider pafish v04, an opensource program for Windows that uses a variety of commonartifacts to determine the presence of a debugger or VM,printing out the results of each check. Evaluating RQ4 requiresthat we know the ground truth set of artifacts that pafishconsiders to detect analysis. We obtain this set by manualinspection of the pafish code and comments.
Software and SlotScreamer experiments concerned withRQ1 and RQ2 were conducted on a 3.2GHz Intel Xeon X5672machine with 48GB RAM. This system uses 64-bit Linux 3.2.SMM-based experiments were conducted using 32-bit Linux2.6 on a system with an AMD Sempron CPU and 4GB RAM.In each case, we consider two versions of the same binary—ultimately, this means the runtime locations of variables willchange due to address randomization. To facilitate experi-mental reproducibility and determinism, we disabled AddressSpace Layout Randomization (ASLR). However, it is possibleto account for ASLR by bridging the semantic gap in kernelmemory to find the offset used for randomization.
For RQ4, we ran pafish on a 64-bit Windows 7 system with
TABLE II. VARIABLE INTROSPECTION ACCURACY.
nullhttpd wuftpdSoft SMM PCI Soft SMM PCI
Locals 43% 66% 41% 46% 48% 45%Stack 65% 13% 58% 56% 31% 54%
Globals 100% 83% 96% 92% 93% 90%
Overall 69% 54% 65% 65% 57% 76%
two Intel Xeon E5-2660 CPUs at 2.2GHz and 48GB RAM.
B. RQ1 — Variable Value Introspection
We evaluate the accuracy of HOPS with respect to asyn-chronous requests for variable values: what fraction of vari-ables will our technique accurately report, averaged over everyvariable in scope at every function call, function entry, and loophead? To admit a more fine-grained analysis of our technique,we partition the set of all in-scope program variables intolocal, global, and stack-allocated. For this experiment, the setof local variables for a function is all locally-declared variablesincluding those in various nested local scopes, as allowed inC. The set of global variables for a function is all globalvariables in scope at that function (e.g., not including globalvariables declared after that function or static variablesin other modules). The set of stack-allocated variables ofa function includes the function’s arguments as well as thelocal and stack-allocated variables of all (transitive) callers ofthe function. We do not consider variables that are optimizedaway by the compiler because variables that are not presentat run-time are unlikely to be implicated by exploits and mayadmit maintenance reasoning via context clues (see Section IIIfor a qualitative explanation, as well as Section V-D for aquantitative justification). At each point, we query the valueof each variable using our system and report the result. Theresult is correct if it matches the ground truth: for strings, thistakes the form of a string comparison while all other variables(e.g., integers, pointers) are compared numerically.
Table II reports the results. The “Soft” columns recordour accuracy via software simulation (rather than any specialhardware). The “SMM” columns report our accuracy usingx86 System Management Mode. The “PCI” columns reportour accuracy using PCI-e based SlotScreamer hardware.
For each program, the results are averaged over all testinputs (non-malicious indicative tests and one malicious ex-ploit) and all relevant points (all function calls, all functionentries, all loop heads). Specifically, these results help addressthe question, “if an analyst were to ask at a random point tointrospect the value of a random variable, what fraction of suchqueries would our system be able to answer correctly?”
These results show 83–100% accuracy for global variables.This high introspection accuracy is because many of thesevariables are available at a constant location described in thesubject program’s symbol table. However, our approach stillproduces reasonable introspection accuracy for local and stack-allocated variable queries. For these variables, the values arenot necessarily unavailable, but the hypotheses considered byour system do not account for differences caused by dynamicallocation of structures (or, indeed, whether compiler optimiza-tions change the structures or layout altogether). Conversely,some values are not available to our technique based on its
6
design assumptions (e.g., variables that live exclusively inregisters). Over the three snapshot-gathering techniques, HOPSanswered 54–76% of variable introspection queries correctly.We consider what these accuracy results mean in the contextof supporting software maintenance questions in Section V-D.
1) SMM Implementation: We used SMM to transparentlycollect pages of memory during execution of each program. Wedetermine the location in physical memory of process pagesusing the CR3 register of the program under test as describedin SPECTRE [52]. The SMI handler has access to the CR3register of the currently executing process in SMRAM. Fromthis value, we 1) find the circularly-linked list of processes (i.e.,task_struct) in kernel memory, 2) iterate through the listto find the process under test, and 3) find the virtual memorymappings to help derive addresses of associated pages. Wenoted that the kernel could potentially swap processes out,in which case the mappings in the process’s page table maynot be directly applicable. For the purposes of experimentalevaluation, we disable swapping as it is unlikely to be anissue in our proposed use cases. We then use our techniqueto determine the hypothesized location of each variable withinthe page. We compare this value against ground truth data andreport the ratio of correctly identified variables. The resultsare similar overall to the software simulated and PCI-basedresults. The SMM platform shows worse performance withstack parameters passed to functions. This is most likely dueto the differing calling conventions, compiler versions, andnumber of available registers between the two platforms usedin these experiments.
2) SlotScreamer Implementation: The accuracy resultswhen HOPS is deployed atop SlotScreamer are shown in the“PCI” columns in Table II. SlotScreamer transparently collectssmears of memory during execution of each test program. Webridge the semantic gap as above. We use our technique todetermine the hypothesized location of each variable in the testprogram within physical memory. We then use Inception [30]so that SlotScreamer acquires the memory smear. We compareeach reported value against ground truth data and report the ra-tio of correctly identified variables. The results are comparableto the software simulation. SlotScreamer’s higher performanceon stack variables and lower performance on global variables isbest explained by asynchronous updates to memory (memorysmears are not atomic views of pages).
C. RQ2 — Stack Trace Introspection and Sampling Rate
For this research question we evaluate the portion of dy-namic stack trace information that our technique can accuratelyreport given a memory snapshot every k cycles. We reporta single activation record as a tuple consisting of a functionname and a list of actual argument values. A single static stacktrace (at a given point in time) is thus a sequence (stack) ofactivation records.
We are ultimately interested in changes to the stack overtime: a full dynamic stack trace is a sequence of staticstack traces (each one corresponding to a point in time). Forsimplicity of presentation, we elide variable values (for whichour accuracy is evaluated in RQ1) and denote a dynamic stacktrace as a sequence of tuples (t, s) where t is the time in cyclesand s the static call stack (e.g., f1 → f2 → f3) correspondingto the activation records live at time t.
Page 1
0 2000 4000 6000 8000 10000 120000
10
20
30
40
50
60
70
80
90
100
Nullhttpd Call Stack Introspection Accuracy
T1 (Get Text)
T2 (Get Empty)
T3 (404 Error)
T4 (Get Image)
T5 (Get Dir List)
T6 (Post Form)
T7 (Exploit)
Cycles Between Memory Samples
Perc
ent
of C
alls
Rep
orte
d C
orre
ctly
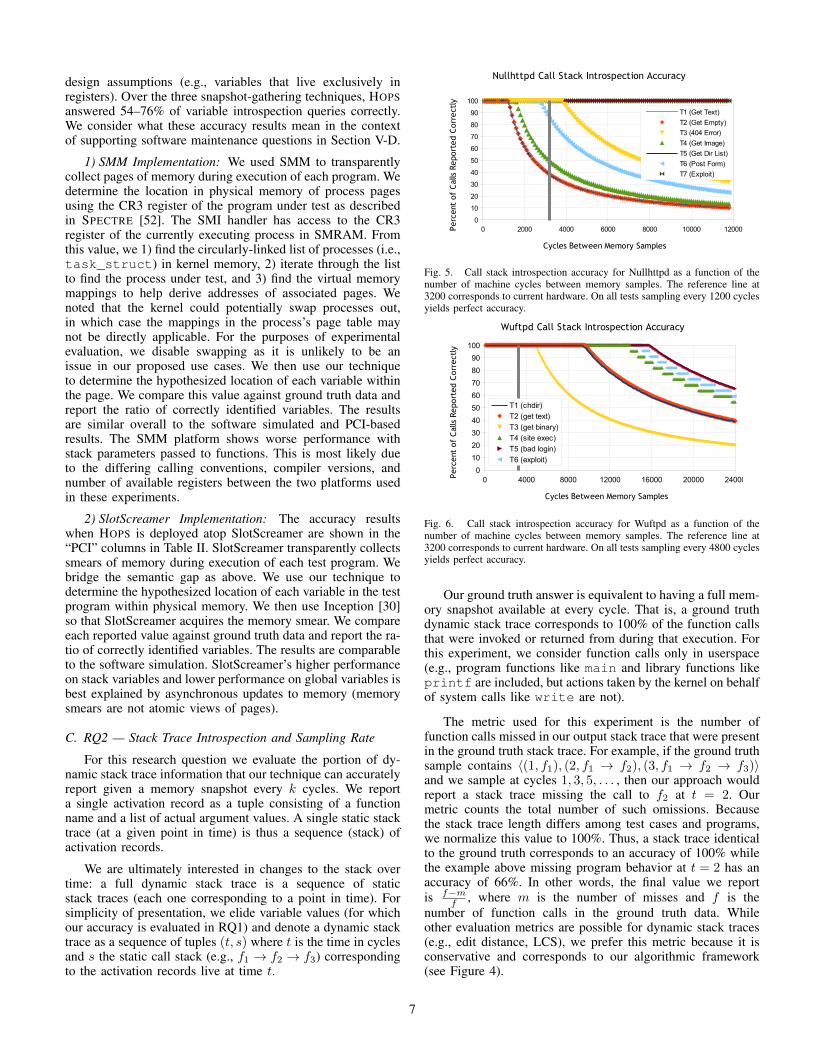
Fig. 5. Call stack introspection accuracy for Nullhttpd as a function of thenumber of machine cycles between memory samples. The reference line at3200 corresponds to current hardware. On all tests sampling every 1200 cyclesyields perfect accuracy.
Page 1
0 4000 8000 12000 16000 20000 240000
10
20
30
40
50
60
70
80
90
100
Wuftpd Call Stack Introspection Accuracy
T1 (chdir)
T2 (get text)
T3 (get binary)
T4 (site exec)
T5 (bad login)
T6 (exploit)
Cycles Between Memory Samples
Perc
ent
of C
alls
Rep
orte
d C
orre
ctly
Fig. 6. Call stack introspection accuracy for Wuftpd as a function of thenumber of machine cycles between memory samples. The reference line at3200 corresponds to current hardware. On all tests sampling every 4800 cyclesyields perfect accuracy.
Our ground truth answer is equivalent to having a full mem-ory snapshot available at every cycle. That is, a ground truthdynamic stack trace corresponds to 100% of the function callsthat were invoked or returned from during that execution. Forthis experiment, we consider function calls only in userspace(e.g., program functions like main and library functions likeprintf are included, but actions taken by the kernel on behalfof system calls like write are not).
The metric used for this experiment is the number offunction calls missed in our output stack trace that were presentin the ground truth stack trace. For example, if the ground truthsample contains 〈(1, f1), (2, f1 → f2), (3, f1 → f2 → f3)〉and we sample at cycles 1, 3, 5, . . . , then our approach wouldreport a stack trace missing the call to f2 at t = 2. Ourmetric counts the total number of such omissions. Becausethe stack trace length differs among test cases and programs,we normalize this value to 100%. Thus, a stack trace identicalto the ground truth corresponds to an accuracy of 100% whilethe example above missing program behavior at t = 2 has anaccuracy of 66%. In other words, the final value we reportis f−m
f , where m is the number of misses and f is thenumber of function calls in the ground truth data. Whileother evaluation metrics are possible for dynamic stack traces(e.g., edit distance, LCS), we prefer this metric because it isconservative and corresponds to our algorithmic framework(see Figure 4).
7
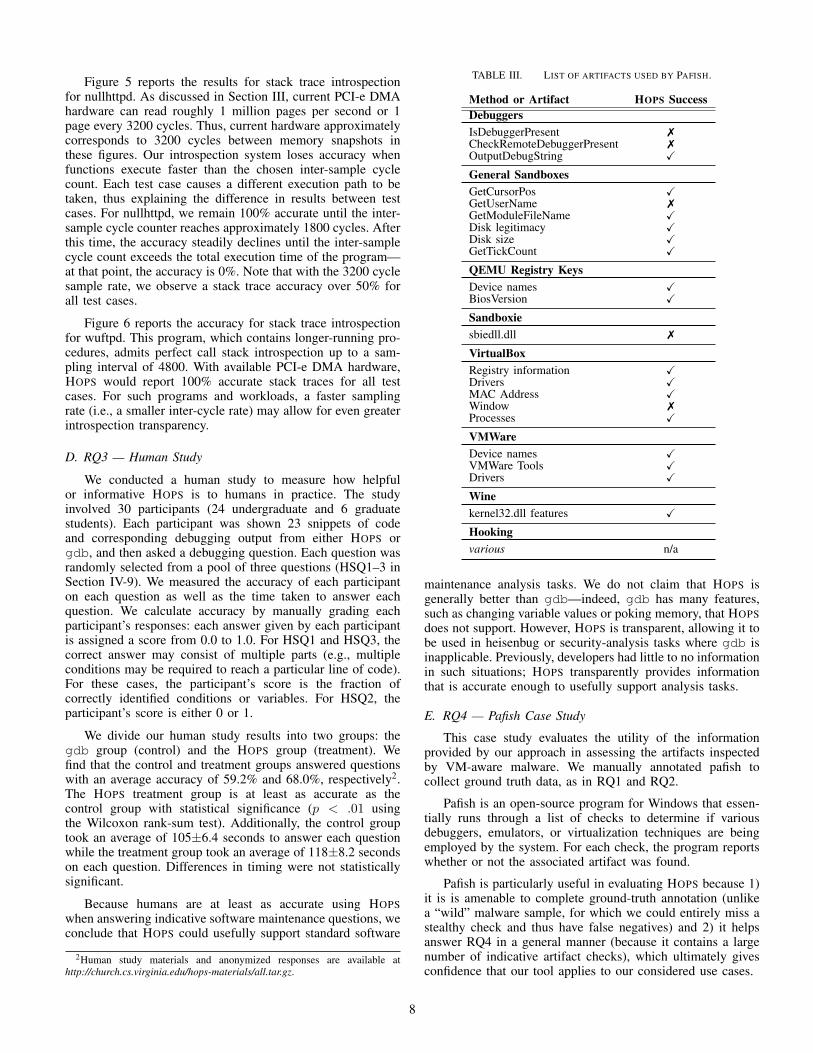
Figure 5 reports the results for stack trace introspectionfor nullhttpd. As discussed in Section III, current PCI-e DMAhardware can read roughly 1 million pages per second or 1page every 3200 cycles. Thus, current hardware approximatelycorresponds to 3200 cycles between memory snapshots inthese figures. Our introspection system loses accuracy whenfunctions execute faster than the chosen inter-sample cyclecount. Each test case causes a different execution path to betaken, thus explaining the difference in results between testcases. For nullhttpd, we remain 100% accurate until the inter-sample cycle counter reaches approximately 1800 cycles. Afterthis time, the accuracy steadily declines until the inter-samplecycle count exceeds the total execution time of the program—at that point, the accuracy is 0%. Note that with the 3200 cyclesample rate, we observe a stack trace accuracy over 50% forall test cases.
Figure 6 reports the accuracy for stack trace introspectionfor wuftpd. This program, which contains longer-running pro-cedures, admits perfect call stack introspection up to a sam-pling interval of 4800. With available PCI-e DMA hardware,HOPS would report 100% accurate stack traces for all testcases. For such programs and workloads, a faster samplingrate (i.e., a smaller inter-cycle rate) may allow for even greaterintrospection transparency.
D. RQ3 — Human Study
We conducted a human study to measure how helpfulor informative HOPS is to humans in practice. The studyinvolved 30 participants (24 undergraduate and 6 graduatestudents). Each participant was shown 23 snippets of codeand corresponding debugging output from either HOPS orgdb, and then asked a debugging question. Each question wasrandomly selected from a pool of three questions (HSQ1–3 inSection IV-9). We measured the accuracy of each participanton each question as well as the time taken to answer eachquestion. We calculate accuracy by manually grading eachparticipant’s responses: each answer given by each participantis assigned a score from 0.0 to 1.0. For HSQ1 and HSQ3, thecorrect answer may consist of multiple parts (e.g., multipleconditions may be required to reach a particular line of code).For these cases, the participant’s score is the fraction ofcorrectly identified conditions or variables. For HSQ2, theparticipant’s score is either 0 or 1.
We divide our human study results into two groups: thegdb group (control) and the HOPS group (treatment). Wefind that the control and treatment groups answered questionswith an average accuracy of 59.2% and 68.0%, respectively2.The HOPS treatment group is at least as accurate as thecontrol group with statistical significance (p < .01 usingthe Wilcoxon rank-sum test). Additionally, the control grouptook an average of 105±6.4 seconds to answer each questionwhile the treatment group took an average of 118±8.2 secondson each question. Differences in timing were not statisticallysignificant.
Because humans are at least as accurate using HOPSwhen answering indicative software maintenance questions, weconclude that HOPS could usefully support standard software
2Human study materials and anonymized responses are available athttp://church.cs.virginia.edu/hops-materials/all.tar.gz.
TABLE III. LIST OF ARTIFACTS USED BY PAFISH.
Method or Artifact HOPS SuccessDebuggersIsDebuggerPresent 7CheckRemoteDebuggerPresent 7OutputDebugString X
General SandboxesGetCursorPos XGetUserName 7GetModuleFileName XDisk legitimacy XDisk size XGetTickCount X
QEMU Registry KeysDevice names XBiosVersion X
Sandboxiesbiedll.dll 7
VirtualBoxRegistry information XDrivers XMAC Address XWindow 7Processes X
VMWareDevice names XVMWare Tools XDrivers X
Winekernel32.dll features X
Hookingvarious n/a
maintenance analysis tasks. We do not claim that HOPS isgenerally better than gdb—indeed, gdb has many features,such as changing variable values or poking memory, that HOPSdoes not support. However, HOPS is transparent, allowing it tobe used in heisenbug or security-analysis tasks where gdb isinapplicable. Previously, developers had little to no informationin such situations; HOPS transparently provides informationthat is accurate enough to usefully support analysis tasks.
E. RQ4 — Pafish Case Study
This case study evaluates the utility of the informationprovided by our approach in assessing the artifacts inspectedby VM-aware malware. We manually annotated pafish tocollect ground truth data, as in RQ1 and RQ2.
Pafish is an open-source program for Windows that essen-tially runs through a list of checks to determine if variousdebuggers, emulators, or virtualization techniques are beingemployed by the system. For each check, the program reportswhether or not the associated artifact was found.
Pafish is particularly useful in evaluating HOPS because 1)it is is amenable to complete ground-truth annotation (unlikea “wild” malware sample, for which we could entirely miss astealthy check and thus have false negatives) and 2) it helpsanswer RQ4 in a general manner (because it contains a largenumber of indicative artifact checks), which ultimately givesconfidence that our tool applies to our considered use cases.
8
Using HOPS, we can introspect visible variables and dy-namic stack traces as in RQ1 and RQ2. We consider the ques-tion: “are the variables and stack traces values that HOPS re-ports accurate enough to conclude which anti-debugging tech-niques pafish is employing?” While analyst skill plays a role insuch tasks, for this evaluation we used a conservative criterion,indicating success only for cases in which variables andfunction calls directly implicating the artifact were introspectedcorrectly. For example, calling the OutputDebugStringmethod in Windows would cause an error if a debugger is notattached. HOPS reports the call to OutputDebugString(ultimately culminating in a write-like system call), as wellas its parameter (a stack variable in RQ1). From this, ananalyst could accurately determine the artifact being employedin this scenario (i.e., OutputDebugString’s conditionalbehavior).
Table III summarizes which of the 22 artifacts consideredby pafish can be detected with our stack tracing and variableintrospection technique. A X indicates that an analyst coulduse introspection information from HOPS to determine thatpafish is using the given anti-analysis method or artifact.A 7 indicates that perfect variable or stack trace introspectioninformation would allow the analyst to determine that the givenanti-analysis method is being used, but in practice HOPS doesnot provide accurate information about the relevant variablesor stack frames (i.e., we cannot sample quickly enough withcurrent hardware). For example, the IsDebuggerPresentAPI call is very fast. As a result, our current sampling rateis too coarse to capture the calls to this function. In fact, allfive of the failing cases result from too coarse a sampling rate.In these situations, HOPS could acquire accurate stack traces,and thus implicate the artifacts, with a faster sampling rate(i.e., improved hardware). Finally, some methods or artifactsare beyond the scope of our technique. For instance, checkingfor hooked functions does not require calling any functionsat all (instead, it scans virtual addresses of API functionsfor particular signatures, using values in registers). However,HOPS requires activation records created by function calls orvariables stored in memory, so even with perfect memoryintrospection accuracy, HOPS could not reveal such artifactusage. We refer to these types of artifacts as being notapplicable to our approach and denote them with an “n/a” inTable III.
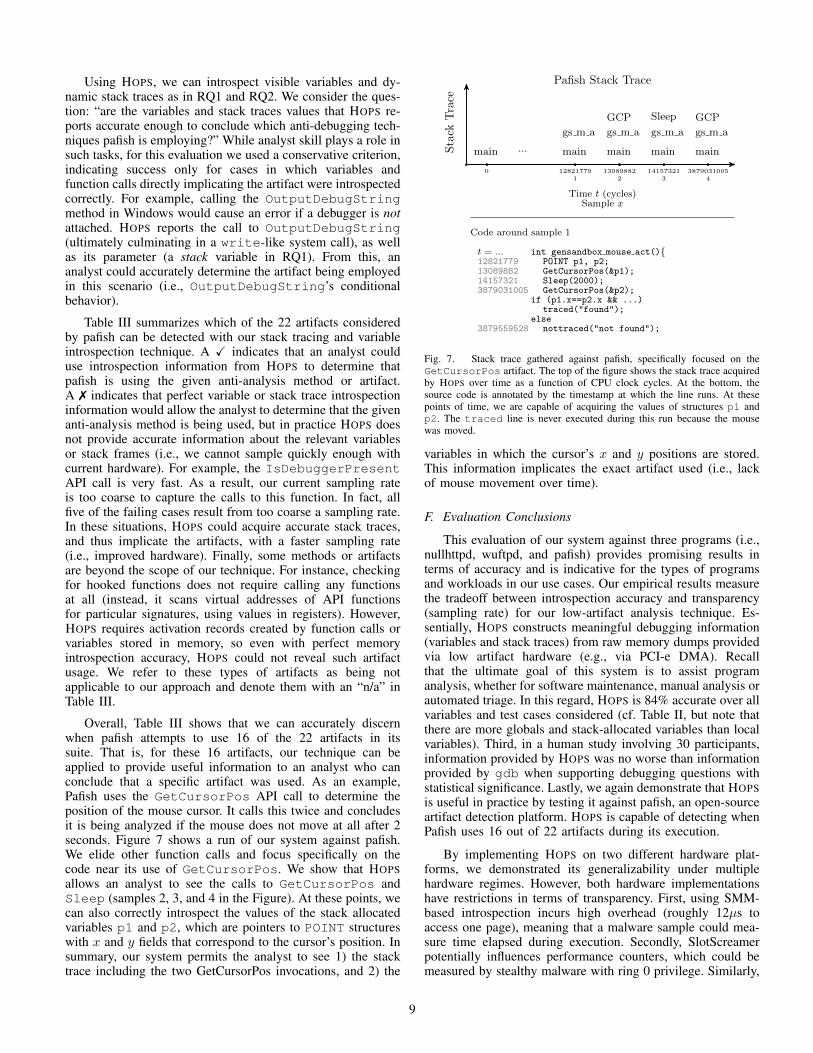
Overall, Table III shows that we can accurately discernwhen pafish attempts to use 16 of the 22 artifacts in itssuite. That is, for these 16 artifacts, our technique can beapplied to provide useful information to an analyst who canconclude that a specific artifact was used. As an example,Pafish uses the GetCursorPos API call to determine theposition of the mouse cursor. It calls this twice and concludesit is being analyzed if the mouse does not move at all after 2seconds. Figure 7 shows a run of our system against pafish.We elide other function calls and focus specifically on thecode near its use of GetCursorPos. We show that HOPSallows an analyst to see the calls to GetCursorPos andSleep (samples 2, 3, and 4 in the Figure). At these points, wecan also correctly introspect the values of the stack allocatedvariables p1 and p2, which are pointers to POINT structureswith x and y fields that correspond to the cursor’s position. Insummary, our system permits the analyst to see 1) the stacktrace including the two GetCursorPos invocations, and 2) the
Pafish Stack Trace
Sta
ckT
race
Time t (cycles)Sample x
main
0
... main
gs m a
128217791
main
gs m a
GCP
130898822
main
gs m a
Sleep
141573213
main
gs m a
GCP
38790310054
Code around sample 1
t = ... int gensandbox mouse act(){12821779 POINT p1, p2;13089882 GetCursorPos(&p1);14157321 Sleep(2000);3879031005 GetCursorPos(&p2);
if (p1.x==p2.x && ...)traced("found");
else3879559528 nottraced("not found");
Fig. 7. Stack trace gathered against pafish, specifically focused on theGetCursorPos artifact. The top of the figure shows the stack trace acquiredby HOPS over time as a function of CPU clock cycles. At the bottom, thesource code is annotated by the timestamp at which the line runs. At thesepoints of time, we are capable of acquiring the values of structures p1 andp2. The traced line is never executed during this run because the mousewas moved.
variables in which the cursor’s x and y positions are stored.This information implicates the exact artifact used (i.e., lackof mouse movement over time).
F. Evaluation Conclusions
This evaluation of our system against three programs (i.e.,nullhttpd, wuftpd, and pafish) provides promising results interms of accuracy and is indicative for the types of programsand workloads in our use cases. Our empirical results measurethe tradeoff between introspection accuracy and transparency(sampling rate) for our low-artifact analysis technique. Es-sentially, HOPS constructs meaningful debugging information(variables and stack traces) from raw memory dumps providedvia low artifact hardware (e.g., via PCI-e DMA). Recallthat the ultimate goal of this system is to assist programanalysis, whether for software maintenance, manual analysis orautomated triage. In this regard, HOPS is 84% accurate over allvariables and test cases considered (cf. Table II, but note thatthere are more globals and stack-allocated variables than localvariables). Third, in a human study involving 30 participants,information provided by HOPS was no worse than informationprovided by gdb when supporting debugging questions withstatistical significance. Lastly, we again demonstrate that HOPSis useful in practice by testing it against pafish, an open-sourceartifact detection platform. HOPS is capable of detecting whenPafish uses 16 out of 22 artifacts during its execution.
By implementing HOPS on two different hardware plat-forms, we demonstrated its generalizability under multiplehardware regimes. However, both hardware implementationshave restrictions in terms of transparency. First, using SMM-based introspection incurs high overhead (roughly 12µs toaccess one page), meaning that a malware sample could mea-sure time elapsed during execution. Secondly, SlotScreamerpotentially influences performance counters, which could bemeasured by stealthy malware with ring 0 privilege. Similarly,
9
in systems where the PCI express bus is under high load, theuse of SlotScreamer could adversely affect throughput.
VI. RELATED WORK
There are two broad areas of work related to our technique.The first is debugging and analysis transparency. We focus onanalysis techniques that reduce the presence of artifacts used tosubvert malware analysis. The second is process introspectiontechniques. This body of work is focused on the collection andunderstanding of program memory during execution.
A. Malware Analysis and Debugging
HOPS aims to aid analysis situations, such as heisenbugs orbinal samples, that do not permit traditional debugging. Manytechniques, including Ether [17], BitBlaze [42], and Anu-bis [4], provide debugging mechanisms to assist the analysis ofmalware. However, these techniques all rely on some mannerof virtualization (or virtualization extensions like Intel VT).In contrast, we trade some confidence in analysis accuracy toachieve a higher level of transparency.
Several research projects have also begun to address thenotion of transparency. V2E [49] combines Ether with moresoftware emulation to replay malware execution, allowing ananalyst to replay execution. However, V2E can be detected asit depends on virtualization. Additionally, its introduction ofsoftware emulation to support recording also causes significantslowdown—this adds to the problem of external timing attacks.SPIDER [16] implements invisible breakpoints using pagetable tricks. However, SPIDER depends on virtualization aswell. Several studies have discovered these techniques [13],[35], [36], [40].
Aside from virtualization used in debugging, there are alsoexplicit debuggers popular among malware analysts. For in-stance, IDA Pro [24] and OllyDbg [51] are popular debuggersthat run alongside malware samples. DynamoRIO [10] usesprocess virtualization that executes on the OS and admitsuser-built dynamic instrumentation tools. These options requirerunning software inside the target OS, which is easily detectedby malware. In contrast, the proposed use of HOPS does notadd any software to the target system.
In recent years, Intel’s System Management Mode (SMM)has appeared in the security literature. SPECTRE [52] usesSMM to introspect processes on live systems, successfully de-tecting malware. Similarly, MALT [53] uses SMM to provideinteractive debugging remotely, though it did not address intro-specting application-level software. SMM has also been usedfor system memory acquisition for forensic analysis [37], [47].These techniques are quite similar to HOPS in their ultimategoal. However, SMM-based techniques are not generalizablebeyond x86 and suffer from external timing attacks due tosignificant performance overhead.
B. Process Introspection
Jain et al. [26] summarize numerous techniques for in-trospecting VMs and bridging the semantic gap, includingprocess implanting [23] and process out-grafting [45]. Processimplanting injects a process into the guest VM, relayingsemantic information back to the hypervisor. This produces a
potentially-obvious artifact for malware to observe (in additionto the VM framework itself). Process out-grafting attempts toaddress this problem by instead creating two VMs, one whichruns the malware and one which runs an implanted process.This better prevents the implanted process from causing no-ticeable software artifacts at the expense of overhead.
Numerous projects have studied Virtual Machine Intro-spection [18], [22], [27], [29]. Such techniques focus onreconstructing semantic information about the guest kernel.This differs from HOPS in that we are looking at a singleprocess for the purpose of understanding potential maliciousor stealthy behavior. Additionally, VMI techniques rely onvirtualization, again introducing artifacts that can be used tosubvert the analysis.
VII. CONCLUSIONS
Many software systems, from embedded devices to virtual-ization to security, cannot make use of standard debuggers. Theact of analyzing a system can change that system, leading toheisenbugs in benign software and admitting anti-analysis bystealthy malware. We thus focus on zero-overhead approachesthat leave no artifacts or traces that a program could useto behave differently when analyzed. We propose HOPS, anapproach to program introspection that infers and reportsvariable values and dynamic stack traces from hardware-provided memory snapshots. Our approach is based on twokey observations. First, it is possible, using existing hardware,to log snapshots of memory pages with low to no overhead.Second, it is possible to bridge the semantic gap between rawmemory snapshots and software semantics using a combinationof program analysis, operating system, and security techniques.
Our approach formulates hypotheses about the locationsof variables and stack frames, allowing analysts to introspectmalicious and non-malicious programs. In our experiments,HOPS was 84% accurate, overall, at reporting the values of lo-cal, stack-allocated, and global variables. We also implementedHOPS using x86-based System Management Mode and PCIe-based SlotScreamer hardware to test our hypotheses on realhardware. In addition, it was over 50% accurate at reportingentire dynamic stack traces using conservative memory timingsassociated with available hardware. Third, in a human studyinvolving 30 participants with statistical significance, HOPSwas no worse than gdb at supporting the analysis of standardmaintenance questions. Finally, we examined 22 methods orartifacts that can be used by stealthy malware to detect analysisand observed that the introspection information provided byHOPS was sufficient to reveal 16 of 22 artifacts used by pafish(and could reveal 5 more with faster hardware). Overall, wesee HOPS as an effective first step towards transparent processintrospection.
VIII. ACKNOWLEDGMENTS
This work was sponsored by the Assistance Secretary ofDefense for Research and Engineering under Air Force Con-tracts #FA8721-05-C-0002 and #FA8750-15-2-0075 as well asthe National Science Foundation under grants CCF0954024and CCF1116289. Opinions, interpretations, conclusions andrecommendations are those of the authors and are not neces-sarily endorsed by the United States Government.
10
REFERENCES
[1] “CVE-2000-0573: Format string vulnerability,” https://web.nvd.nist.gov/view/vuln/detail?vulnId=CVE-2000-0573, 2000.
[2] “CVE-2002-1496: Heap-based buffer overflow,” https://web.nvd.nist.gov/view/vuln/detail?vulnId=CVE-2002-1496, 2002.
[3] Altera Corporation, “PCI Express High Performance Reference De-sign,” http://www.altera.com/literature/an/an456.pdf, 2014.
[4] Anubis, “Analyzing unknown binaries,” http://anubis.iseclab.org.[5] M. Auty, A. Case, M. Cohen, B. Dolan-Gavitt, M. H. Ligh, J. Levy, and
A. Walters. Volatility framework - volatile memory extraction utilityframework. [Online]. Available: http://www.volatilityfoundation.org/
[6] E. Bachaalany, “Detect if your program is running insidea Virtual Machine,” http://www.codeproject.com/Articles/9823/Detect-if-your-program-is-running-inside-a-Virtual.
[7] S. Biedermann and J. Szefer, “Systemwall: An isolated firewall us-ing hardware-based memory introspection,” in Information Security.Springer, 2014, pp. 273–290.
[8] T. Bletsch, X. Jiang, V. W. Freeh, and Z. Liang, “Jump-orientedprogramming: a new class of code-reuse attack,” in Proceedings of the6th ACM Symposium on Information, Computer and CommunicationsSecurity. ACM, 2011, pp. 30–40.
[9] R. Branco, G. Barbosa, and P. Neto, “Scientific but Not AcademicalOverview of Malware Anti-Debugging, Anti-Disassembly and Anti-VMTechnologies,” in Black Hat, 2012.
[10] D. Bruening, Q. Zhao, and S. Amarasinghe, “Transparent dynamicinstrumentation,” in Proceedings of the 8th ACM SIGPLAN/SIGOPSConference on Virtual Execution Environments (VEE’12), 2012.
[11] B. D. Carrier and J. Grand, “A hardware-based memory acquisitionprocedure for digital investigations,” Digital Investigation, vol. 1, no. 1,pp. 50–60, 2004.
[12] checkvm: Scoopy doo, http://www.trapkit.de/research/vmm/scoopydoo/scoopy doo.htm.
[13] X. Chen, J. Andersen, Z. Mao, M. Bailey, and J. Nazario, “Towardsan understanding of anti-virtualization and anti-debugging behavior inmodern malware,” in Proceedings of the 38th Annual IEEE Interna-tional Conference on Dependable Systems and Networks (DSN ’08),2008.
[14] Y. Chen, Y. Wang, Y. Ha, M. R. Felipe, S. Ren, and K. M. M. Aung,“saes: A high throughput and low latency secure cloud storage withpipelined dma based pcie interface,” in Field-Programmable Technology(FPT), 2013 International Conference on. IEEE, 2013, pp. 374–377.
[15] DARPA, “Transparent Computing BAA,” http://www.darpa.mil/OurWork/I2O/Programs/Transparent Computing.aspx, 2014.
[16] Z. Deng, X. Zhang, and D. Xu, “Spider: Stealthy binary program instru-mentation and debugging via hardware virtualization,” in Proceedingsof the Annual Computer Security Applications Conference (ACSAC’13),2013.
[17] A. Dinaburg, P. Royal, M. Sharif, and W. Lee, “Ether: Malware analysisvia hardware virtualization extensions,” in Proceedings of the 15th ACMConference on Computer and Communications Security (CCS ’08),2008.
[18] B. Dolan-Gavitt, T. Leek, J. Hodosh, and W. Lee, “Tappan zee (north)bridge: mining memory accesses for introspection,” in Proceedings ofthe 2013 ACM SIGSAC conference on Computer & communicationssecurity. ACM, 2013, pp. 839–850.
[19] N. Falliere, “Windows anti-debug reference,” http://www.symantec.com/connect/articles/windows-anti-debug-reference, 2010.
[20] J. FitzPatrick and M. Crabill, “NSA Playset: PCIE,” in DEFCON 22,2014.
[21] Z. P. Fry, B. Landau, and W. Weimer, “A human study of patchmaintainability,” in Proceedings of the 2012 International Symposiumon Software Testing and Analysis. ACM, 2012, pp. 177–187.
[22] Y. Fu and Z. Lin, “Space Traveling across VM: Automatically Bridgingthe Semantic Gap in Virtual Machine Introspection via Online KernelData Redirection,” in Proceedings of the 33rd IEEE Symposium onSecurity and Privacy (S&P’12), 2012.
[23] Z. Gu, Z. Deng, D. Xu, and X. Jiang, “Process implanting: A new activeintrospection framework for virtualization,” in Reliable Distributed
Systems (SRDS), 2011 30th IEEE Symposium on. IEEE, 2011, pp.147–156.
[24] IDA Pro, www.hex-rays.com/products/ida/.
[25] Intel, “Intel R© 64 and IA-32 Architectures Software Developer’sManual.” [Online]. Available: http://www.intel.com/content/www/us/en/processors/architectures-software-developer-manuals.html
[26] B. Jain, M. B. Baig, D. Zhang, D. E. Porter, and R. Sion, “Sok:Introspections on trust and the semantic gap,” in Security and Privacy(SP), 2014 IEEE Symposium on. IEEE, 2014, pp. 605–620.
[27] X. Jiang, X. Wang, and D. Xu, “Stealthy malware detection throughVMM-based out-of-the-box semantic view reconstruction,” in Proceed-ings of the 14th ACM Conference on Computer and CommunicationsSecurity (CCS’07), 2007.
[28] C. Le Goues, T. Nguyen, S. Forrest, and W. Weimer, “Genprog: Ageneric method for automatic software repair,” Software Engineering,IEEE Transactions on, vol. 38, no. 1, pp. 54–72, 2012.
[29] T. Leek, M. Zhivich, J. Giffin, and W. Lee, “Virtuoso: Narrowing theSemantic Gap in Virtual Machine Introspection,” in Proceedings of the32nd IEEE Symposium on Security and Privacy (S&P’11), 2011.
[30] C. Maartmann-Moe, “Inception,” http://github.com/carmaa/inception,2015.
[31] G. C. Necula, S. McPeak, S. P. Rahul, and W. Weimer, “Cil: Intermedi-ate language and tools for analysis and transformation of c programs,”in Compiler Construction. Springer, 2002, pp. 213–228.
[32] B. D. Payne. Libvmi: Simplified virtual machine introspection.[Online]. Available: https://github.com/bdpayne/libvmi
[33] C. E. Pitts, “Parallel processing support: so what is a ”heisenbug”anyway?” in Proceedings of the 17th Annual ACM SIGUCCSConference on User Services, Bethesda, Maryland, USA, 1989, 1989,pp. 237–242. [Online]. Available: http://doi.acm.org/10.1145/73760.73799
[34] M. Prandini and M. Ramilli, “Return-oriented programming,” Security& Privacy, IEEE, vol. 10, no. 6, pp. 84–87, 2012.
[35] A. Quist and V. Smith, “Detecting the Presence of Virtual MachinesUsing the Local Data Table,” http://www.offensivecomputing.net/.
[36] T. Raffetseder, C. Kruegel, and E. Kirda, “Detecting system emulators,”in Information Security. Springer Berlin Heidelberg, 2007.
[37] A. Reina, A. Fattori, A. Pagani, L. Cavallaro, and D. Bruschi, “WhenHardware Meets Software: A Bulletproof Solution to Forensic MemoryAcquisition,” in Proceedings of the Annual Computer Security Appli-cations Conference (ACSAC’12), 2012.
[38] S. P. Reiss, “Trace-based debugging,” in Proceedings of the FirstInternational Workshop on Automated and Algorithmic Debugging,ser. AADEBUG ’93. London, UK, UK: Springer-Verlag, 1993,pp. 305–314. [Online]. Available: http://dl.acm.org/citation.cfm?id=646902.710203
[39] K. Rosenfeld and R. Karri, “Attacks and defenses for JTAG,” IEEEDesign & Test of Computers, vol. 27, no. 1, pp. 36–47, 2010. [Online].Available: http://doi.ieeecomputersociety.org/10.1109/MDT.2010.9
[40] J. Rutkowska, “Red Pill,” http://www.ouah.org/Red Pill.html.
[41] J. Sillito, G. C. Murphy, and K. De Volder, “Questions programmersask during software evolution tasks,” in Proceedings of the 14thACM SIGSOFT international symposium on Foundations of softwareengineering. ACM, 2006, pp. 23–34.
[42] D. Song, D. Brumley, H. Yin, J. Caballero, I. Jager, M. Kang, Z. Liang,J. Newsome, P. Poosankam, and P. Saxena, “Bitblaze: A new approachto computer security via binary analysis,” in Proceedings of the 4thInternational Conference on Information Systems Security (ICISS’08),2008.
[43] T. I. Sookoor, T. W. Hnat, P. Hooimeijer, W. Weimer, andK. Whitehouse, “Macrodebugging: global views of distributed programexecution,” in Proceedings of the 7th International Conferenceon Embedded Networked Sensor Systems, SenSys 2009, Berkeley,California, USA, November 4-6, 2009, 2009, pp. 141–154. [Online].Available: http://doi.acm.org/10.1145/1644038.1644053
[44] C. Spensky, H. Hu, and K. Leach., “LO-PHI: Low Observable PhysicalHost Instrumentation,” in Proceedings of 2016 Network and DistributedSystem Security Symposium (NDSS’16), 2016.
11
[45] D. Srinivasan, Z. Wang, X. Jiang, and D. Xu, “Process out-grafting:An efficient ‘Out-of-VM’ approach for fine-grained process executionmonitoring,” in Proceedings of the 18th ACM Conference on Computerand Communications Security (CCS’11), 2011.
[46] J. Stuttgen and M. Cohen, “Anti-forensic resilient memory acquisition,”Digital Investigation, vol. 10, pp. S105–S115, 2013.
[47] J. Wang, F. Zhang, K. Sun, and A. Stavrou, “Firmware-assisted memoryacquisition and analysis tools for digital forensic,” in Proceedings ofthe 6th International Workshop on Systematic Approaches to DigitalForensic Engineering (SADFE ’11), 2011.
[48] Y. Wang, H. Patil, C. Pereira, G. Lueck, R. Gupta, and I. Neamtiu,“Drdebug: Deterministic replay based cyclic debugging with dynamicslicing,” in 12th Annual IEEE/ACM International Symposium onCode Generation and Optimization, CGO ’14, Orlando, FL,USA, February 15-19, 2014, 2014, p. 98. [Online]. Available:http://doi.acm.org/10.1145/2544137.2544152
[49] L.-K. Yan, M. Jayachandra, M. Zhang, and H. Yin, “V2E:Combining hardware virtualization and software emulation for
transparent and extensible malware analysis,” in Proceedings ofthe 8th ACM SIGPLAN/SIGOPS Conference on Virtual ExecutionEnvironments (VEE’12), 2012. [Online]. Available: http://doi.acm.org/10.1145/2151024.2151053
[50] P. Yu, L. Bo, L. Datong, and P. Xiyuan, “A high speed dma transactionmethod for pci express devices,” in Testing and Diagnosis, 2009. ICTD2009. IEEE Circuits and Systems International Conference on. IEEE,2009, pp. 1–4.
[51] O. Yuschuk, “OllyDbg,” www.ollydbg.de.[52] F. Zhang, K. Leach, K. Sun, and A. Stavrou, “SPECTRE: A De-
pendable Introspection Framework via System Management Mode,” inProceedings of the 43rd Annual IEEE/IFIP International Conferenceon Dependable Systems and Networks (DSN’13), 2013.
[53] F. Zhang, K. Leach, H. Wang, A. Stavrou, and K. Sun, “Using hardwarefeatures for increased debugging transparency,” in Proceedings of the36th IEEE Symposium on Security and Privacy, 2015.
12