Embed Size (px)
Citation preview
Towards the Non-Visual Monitoring of Canine Physiology inReal-Time by Blind Handlers
Sean Mealin1, Mike Winters1, Ignacio X. Domı́nguez1, Michelle Marrero-Garcı́a2, Alper Bozkurt3,Barbara L. Sherman4, David L. Roberts1
1 Department of Computer Science2 CROEM Specialized Residential School
3 Department of Electrical and Computer Engineering4 College of Veterinary MedicineNorth Carolina State University
ABSTRACTOne of the challenges to working with canines is that whereashumans are primarily vocal communicators, canines are pri-marily postural and behavioral communicators. It can takeyears to gain some level of proficiency at reading canine bodylanguage, even under the best of circumstances. In the case ofguide dogs and visually-impaired handlers, this task is evenmore difficult. Luckily, new technology designed to helpmonitor canines may prove useful in helping handlers, espe-cially those with visual impairments, to better understand andinterpret what their working partners are feeling or saying.
In prior work a light-weight, wearable, wireless physiolog-ical monitoring system was shown to be accurate for mea-suring canines’ heart and respiratory rates [6]. In this paper,we consider the complementary problem of communicatingphysiological information to handlers. We introduce two non-visual interfaces for monitoring a canine’s heart and respira-tory rates, an audio interface and a vibrotactile interface. Wealso present the results of two initial studies to evaluate the ef-ficacy of the interfaces. In the first study we found that manyparticipants were more confident in detecting changes in heartand respiratory rate using the audio interface, however mostof the time they were just as accurate with the vibrotactileinterface with only a slight increase in detection latency.
INTRODUCTIONHumans and canines communicate information about them-selves and their surroundings in different ways. Humans pri-marily use verbal communication, while canines typically usemore visual means, such as body language. As words canhave different meanings in different contexts, there are simi-lar nuances to canine body language and behavior. Like learn-
Permission to make digital or hard copies of all or part of this work for personal orclassroom use is granted without fee provided that copies are not made or distributedfor profit or commercial advantage and that copies bear this notice and the full cita-tion on the first page. Copyrights for components of this work owned by others thanACM must be honored. Abstracting with credit is permitted. To copy otherwise, or re-publish, to post on servers or to redistribute to lists, requires prior specific permissionand/or a fee. Request permissions from [email protected] ’15, November 16-19, 2015, Iskandar, Malaysia.Copyright © 2015 ACM ISBN 978-1-4503-3852-3/15/11$15.00.http://dx.doi.org/10.1145/2832932.2837018
ing a foreign language, it becomes easier to interpret the vi-sual language of the canine with practice. Using technologyto assist with translating body language to something moreintuitive for people would ease and increase human-caninecommunication, for example by helping novice dog trainersunderstand their dogs better. This would also provide infor-mation that is unavailable to those who cannot see their dog,such as blind handlers and guide dogs.
When working with a guide dog, a blind handler is relianton auditory clues and the physical feedback provided by theleash or harness to guess at the actions that the guide dog istaking; however, the dog may take the same action for manyreasons. For example, if a dog suddenly moves forward, itcould be because the dog has seen someone that they recog-nize and is trying to show the handler, or because the dog islunging towards food, or because the dog is fearful of a carapproaching the handler. Without being able to identify thestimulus directly, the next best thing would be to identify theemotions that the dog is experiencing just before, or duringthe time of the action. Many of the body language hints thatsighted handlers use to identify the emotional context of adog’s actions are unobservable to blind handlers. Previouswork focused on the development of portable technology tomonitor canine physiology [6], which we can use to give ahandler hints about a canine’s emotional state.
This paper presents the design of two non-visual interfaces toallow the monitoring of a canine’s heart rate and respiratoryrate. The interfaces were designed to communicate physio-logical information to a blind handler in real-time, while be-ing as discreet and non-distracting as possible. The interfacesmust be discreet, since the handler may be working in a quietarea such as a library. They also must be non-distracting,since the handler may be doing something that requires herattention, such as crossing a busy street or conversing with acolleague. To meet these goals, we based the interfaces ontwo modalities: audio and vibrotactile feedback.
We will present the results of two preliminary studies per-formed using these two interfaces, using a total of 15 sightedparticipants and simulated data based on data collected byexisting physiological monitoring hardware [6]. For the first

study, we asked participants to monitor the interfaces and giveverbal feedback when there was a change in heart or respi-ratory rate. We found for almost all participants, the audiointerface was preferred initially, however many said that theywould find it very distracting and would eventually switch tothe vibrotactile interface. Despite initial preferences, partic-ipants were more accurate using the latter interface duringsome tasks, with only a small increase in latency time. Forthe second study, we introduced a concentration-based taskto evaluate the distraction level of the participants. We foundthat as the audio-based concentration task became more dif-ficult, the latency for the audio interface increased while thelatency for the vibrotactile interface decreased.
RELATED WORKThe idea of using audio to communicate data to the blind andothers is not a new concept. Line graphs, pie charts, and othertypes of plots have been presented to the blind using changesin pitch, timbre, and stereo with varying levels of success [11,20]. Audio interfaces are becoming more common in ve-hicles [12, 15]. Node-link diagrams, a standard data con-struct in science, technology, engineering, and mathematics(STEM) disciplines, have been made accessible via synthe-sized speech [2]. Medical data has also been communicatedthrough sonification, however that study focused on commu-nicating brainwave patterns [1]. The real-time monitoringof financial data has also been studied using audio; howevermuch of the information was coded using music theory, whichcould be difficult to interpret for the untrained user [10].
Vibrotactile interfaces have been likewise explored in previ-ous studies; they have been used to provide directional andspatial cues [18], they have been used to augment audio com-munication [9], and have become a universal augmentationfor mobile devices [17]. Vibrotactile interfaces have beenstudied in visually complex environments, like alerting pilotsto changes in instrumentation in a plane’s cockpit [19]. Thedevelopment of Tactons, which are the vibrotactile equiva-lent of phonemes, have allowed the effect of intensity, ampli-tude, and frequency to be studied in various applications [3].When applied to human physiological monitoring, a vibrotac-tile alert system proved effective both when used alone, andin tandem with other notification systems [16].
This work is based on previous efforts to introduce technol-ogy to the human-canine relationship. Past studies have fo-cused on the development of wearable technology for dogs,with an emphasis on using accelerometers and gyroscopesto allow computers to identify canine posture and behavior.That information was then applied to automated training sys-tems [7, 8]. This project also directly depends on work doneto allow the noninvasive monitoring of canine physiology [6].Using the two non-visual modalities outlined above, and thephysiological monitoring systems, our work is the first to al-low a completely blind user to monitor their dog’s heart andrespiratory rate in real-time while performing everyday tasks.
PLATFORMThe focus of this paper is the handler’s interface. Previously,it has been shown that a lightweight physiological monitoring
system is possible [6], so we do not address the methodologyused to capture the heart and respiratory rate of canines ingreat detail. For the purposes of this paper it is sufficient toknow that it is possible to monitor a canine’s heart rate, heartrate variability, and respiratory rate outside of a laboratoryenvironment using both electrocardiogram (ECG) and photo-plethysmogram (PPG) techniques [6].
Common HardwareWe based the two interfaces on a common platform andcommercially available components, which we then extendedwith custom hardware as necessary. A BeagleBone Black,a microcomputer approximately the size of a deck of cards,serves as the central hub. The BeagleBone Black is equippedwith an ARM Cortex-A8 CPU running at 1.0 gigahertz, 512megabytes of memory, 4.0 gigabytes of onboard flash mem-ory, and runs Ubuntu 14.04 as an operating system.
SoftwareWe connected the interfaces to a software system we wrotethat mimics a canine’s physiological status to make experi-ments consistent and reproducible. The system allows us towrite virtual walks, which are broken down into separate be-haviors such as running and walking. It then uses those be-haviors to output events, which we define as a time and actionpairing. The interfaces then read those events, and communi-cates the action, such as a heart beat or breath.
Each interface is capable of operating in two modes. Absolutemode communicates each heart beat and breath, while rela-tive mode only indicates when the heart or respiratory rateschange by a certain amount. The advantage of the first is thatusers can “tune in” to the interface whenever they wish tosee their dog’s status, while the latter generates fewer events.The disadvantage is that absolute mode is noisier, while a dis-tracted user may lose context when using relative mode.
Audio InterfaceThe audio interface consists of a bluetooth earpiece connectedto the BeagleBone Black which is mounted on a PVC pipe as-sembly cut to the shape of a standard guide dog handle. Sincethe environmental sounds that blind people use for gettingaround are important, the earpiece is lightweight, very small,and is wearable on either ear. Future improvements to thisinterface could include using bone-conduction, which gener-ates audio through vibrations directly applied to the bones onthe side of the face, and does not block environmental sounds.
For communicating information to users via audio, a vari-ety of techniques and best practices have been identified [5];however, the most common techniques either masque envi-ronmental audio, or are unavailable given the mono-audiooutput of the earpiece. One solution is to use different volumelevels to separate heart and respiratory rate; however, stud-ies have found that users are not proficient at judging smallto moderate differences in relative volume, and can becomequickly annoyed with the perceived sound pollution [4].
The audio interface uses different short sounds to commu-nicate to users. In absolute mode, a double-thud sound ofa heart beating represents a heartbeat, while a clip of a dog
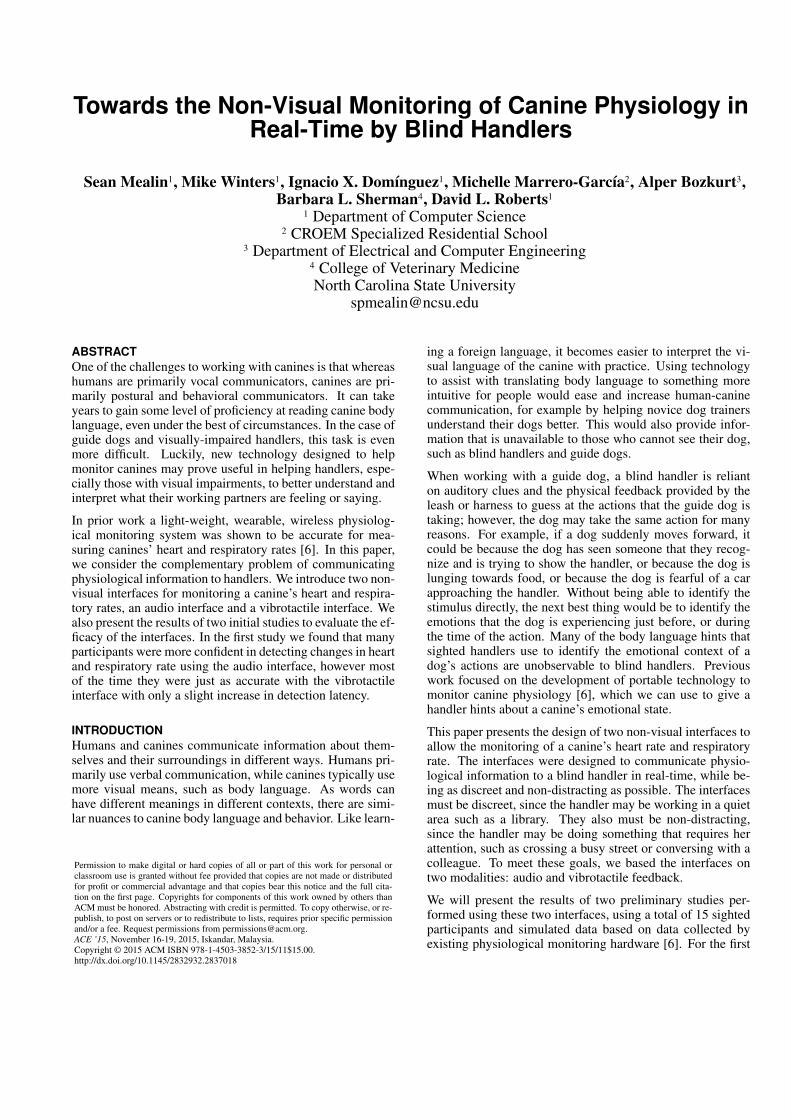
(a) Handle Design (b) Handle Gripped
Figure 1. The vibrotactile interface, annotated with the components (a).An illustration of a typical off-center grip (b).
panting represents a breath. In relative mode, a high-pitchedtone that increases in pitch represents heart rate getting faster,while a high pitch tone that decreases in pitch means that itis getting slower. For respiratory rate, the semantic meaningsare the same, but the pitch of the tones is significantly lower.We chose the pitch of the sounds to fall within the range of150 Hz to 5,000 Hz, which has been shown to be effective forcommunicating information to users [5].
Vibrotactile InterfaceWe based the shape of the vibrotactile interface on a guidedog handle, and used the data from anonymous pictures ofhow guide dog users grip the handle when working with theirdog as a guide on where to position the ERM motors. Wemounted The BeagleBone Black and a battery on a cross-pipe, while we embedded the ERM motors into either sideof the grip, which we then wrapped in common grip tape tomake it more pleasant to hold. Figure 1(a) gives an overviewof the handle, indicating the BeagleBone Black, grip, andERM motors. Figure 1(b) shows the interface being held.
The two motors allow us to communicate heart rate throughone side of the handle, and respiratory rate through the other.The PVC piping is rigid enough that the vibrations are easilyfelt at any point on the grip, but are dampened enough that de-pending on the location of the hand, one source of vibrationis more noticeable than the other. A majority of guide dogusers grasp the handle closer to the right side, so the channelthat communicates heart rate was placed there and slightlyreduced in intensity compared to the left motor which com-municates respiratory rate.
High frequency vibrations tend to get an observer’s attentionmore quickly, but can become irritating and be ignored whenleft active for long durations [13]. Consequently, the vibra-tions for this interface were designed to be high frequency, butas short as possible in duration. When in absolute mode, the
interface communicates each heartbeat by a short pulse, fol-lowed by an even shorter pause, and lastly a vibration pulse ofequal duration to the first, which mimics the common “thud-thud” representation of the heart. Breath is represented as asoft vibration that increases in intensity to a peak, followedby a decrease to stillness. While not as intuitive as heart rate,we hoped users would associate this with an inhale of breath,which gradually gets louder before tapering off in volume.When in relative mode, a double-pulse pattern represents anincrease in heart rate, while a rapid series of eight pulses rep-resents a decrease. For respiratory rate, an increase is indi-cated by a soft vibration that quickly and smoothly increasesbefore abruptly stopping, while a decrease in respiratory rateis an intense vibration that smoothly decreases to stillness.
METHODOLOGY FOR STUDY ONEFor the first study, to evaluate the efficacy of the two inter-faces, we had participants go on a series of virtual walks.During each experiment, which lasted on average 1.5 hours,participants had the opportunity to take breaks after each sim-ulated walk to minimize mental fatigue.
The 10 participants were recruited via word of mouth fromaround the Computer Science department. The only disquali-fying criteria was prior experience using the interfaces duringdesign time. Six participants were graduate Computer Sci-ence students, while the other four were from other depart-ments, or nonstudents. All of the participants were sighted,and volunteered for the study for no compensation.
Experimental DesignParticipants used the interfaces and modes in random order.To reduce the burden of switching between interfaces, weforced the modes to be contiguous; for example, participantscompleted both modes of the vibrotactile interface before theaudio interface. During each interface-mode combination, theparticipant went on a total of six virtual walks.
Space prevents a detailed description of all the walks. There-fore, as a representative example, we present walk W1 here,which was always used as a training walk so the participantcould see how the interface worked. The walk started atheart rate = 75 and respiratory rate = 15 for 15 seconds,before increasing to HR = 95 and RR = 25 over a 10 sec-ond period. both remained constant for 20 seconds, beforedecreasing back to HR = 75 and RR = 15 over 10 seconds,where it remained for the last 15 seconds of the walk. Sincethis walk was used to show the participant both a simple in-crease and decrease in heart and respiratory rate, the walk wasexplained to them ahead of time. All of the remaining walkswere defined in a similar manner.
Participant ExperienceWe gave participants a general overview of the interfaces, andexplained that they would be monitoring heart and respiratoryrate of a simulated canine, while giving verbal indicationswhen the rates changed. We then told them which interface-mode combination they would be using first.
There were seven steps for each interface-mode combination.
1. Training: We showed the participant how the interface-mode combination represented heart and respiratory rate.For example, the training prompt for absolute mode was:“The [sound/vibration] you are about to [hear/feel] repre-sents the dog’s [heart beat/breath].” The participant couldrepeat training before progressing.
2. The second step consisted of the participant going on walkW1, which was the training walk.
3-7. 5 walks: For each walk, the pre-walk prompt was “forthis walk, the heart rate will start at [HR starting value],while the respiratory rate will start at [RR starting value].Please verbally indicate if you think that the heart or res-piratory rate of the dog is increasing or decreasing. Doyou have any questions before we begin?” If the partici-pant said no, the walk would then start. After the walk, weasked each participant two questions. The first questionwas “on a scale from one to ten, how confident are you thatyou were able to detect increases and decreases of heartand respiratory rate?” while the second question was “Doyou have any comments about this walk?”
After each interface-mode combination, we asked the partic-ipant if they had any comments that they would like to share.
RESULTS OF STUDY ONETo evaluate the interface-mode combinations, we focused onthree key metrics: accuracy, latency, and confidence. To com-pare the first two metrics between conditions (interface andmode), we conducted an ANOVA. For every metric, a signifi-cant factor was the simulated walk; however, we intentionallydesigned each one to have a varying difficulty level, so we ag-gregate that factor in the analysis below.
AccuracyFor each behavior, we compared the participant-generated in-dications to the ground truth. We totaled the number of timesthat the participant correctly identified an increase or decrease(true positive), and correctly gave no indication when theheart and respiratory rates were steady (a true negative). Notethat two participants were unable to hear the audio signal forchanges in respiratory rate when using the audio interface inrelative mode, however, that data is included in the analysisto give a complete picture of the interfaces.
For the accuracy of the heart rate detection task, the only sig-nificant factor was mode (F = 48.068, d.f. = 1, p < 0.001).When operating in absolute mode, the mean accuracy was81.52% with a variance of 18.82. When in relative mode, themean was 96.20% with variance 13.09.
Likewise for the respiratory rate accuracy, the significant fac-tors were mode (F = 31.158, d.f. = 1, p < 0.001) and in-terface (F = 7.079, d.f. = 1, p = 0.009). In absolute mode,the mean and variance were 75.67% and 19.86 respectively,while in relative mode, the mean was 90.60% with variance19.81. When participants used the audio interface, the meanaccuracy was 79.57% with variance 23.20, while the vibro-tactile interface resulted in mean 86.69% and variance 18.32.
LatencyWe defined latency as the difference in time between thefirst heart beat or breath during an increase or decrease andthe time that the participant verbally stated that there was achange. If the participant did not identify a change in eitherrate, we excluded that particular behavior from the calcula-tion for that participant.
For latency during the heart rate detection task, both mode(F = 402.140, d.f. = 1, p < 0.001) and interface (F = 4.263,d.f. = 1, p = 0.04) were significant. For absolute mode, themean latency was 13.89 seconds, with variance 5.75, whilerelative mode scored mean latency 4.84 seconds, with vari-ance 1.42. When the audio interface was used, the mean andvariance were 8.94 and 6.04 respectively, while the vibro-tactile interface resulted in mean latency 9.78, with variance6.29.
For the latency during the respiratory rate detection task, theonly statistically significant factor was mode (F = 233.644,d.f. = 1, p < 0.001). In absolute mode, the mean latencywas 15.63 seconds, with variance 7.56. In relative mode, themean and vairiance was 5.34 and 1.83 respectively.
ConfidenceAfter each walk, we had the participants rate how confidentthey felt that they detected the changes in heart and respira-tory rate on a scale from one to 10, where one was not confi-dent at all and 10 was very confident. We used these resultsin combination with comments that participants made to getan idea of how easy they felt the interfaces were to use.
Participants felt the most confident with the audio interface inrelative mode, assigning it an average score of 8.92. The vi-brotactile interface in the same mode received the next high-est score, with participants giving it 8.53 on average. Therewas the same pattern for the audio and vibrotactile interfacesin absolute mode, with average confidence scores of 6.4 and5.96 respectively.
DISCUSSION OF STUDY ONE
AccuracyFor the accuracy during the heart rate detection task, bothmodes scored very well, with accuracies greater than 80%.Participants using the relative mode scored a higher meanaccuracy by approximately 15%, which indicates that it waseasier to detect changes in relative mode. A possible expla-nation of this result is that users found it easier when they didnot have to keep track of the heartbeats themselves.
Just as the heart rate accuracy task, mode was significant,and the relative mode proved to be more accurate than theabsolute mode. Both scores were lower than their counter-parts during the heart rate detection, which could indicate thatusers focused more on the heart rate; however, we do not haveenough data to be sure. Unlike the heart rate task, the inter-faces themselves were significant, with the vibrotactile inter-face doing moderately better than the audio interface. This isinteresting considering that many participants felt more con-fident with the audio interface, as explained below. As previ-ously mentioned, two participants were seemingly unable to
detect the audio indicators for changes in respiratory rate inrelative mode. When their data is removed from the analy-sis, the accuracy of both interfaces increase by approximately5%, however interface is no longer a statistically significantfactor (p > 0.05). Considering that participants performedthis study in a quiet environment, this indicates that we needto reevaluate the frequency of the audio signal; however, thiscould also indicate that the audio interface is more susceptibleto interference in noisy environments.
LatencyFor the latency during the heart rate detection task, both in-terface and mode were significant. Surprisingly, the audiointerface resulted in slightly lower latencies than the vibro-tactile interface, which could indicate that users are more ac-customed to using their auditory sense rather than their tactilesense for detecting alerts. For both of these interfaces, therewas a relatively high variance, which indicates that some par-ticipants were able to do better than others. When examin-ing relative mode compared to absolute mode, relative moderesulted in significantly lower latencies, which we expected,since that mode only indicates when something changes.
For the respiratory rate latency, once again the only signifi-cant factor was the mode. For the same reason as previouslyoutlined, we were not surprised to find that relative mode didsignificantly better than absolute mode. Since responding to achange in a canine’s physiological status is time critical, it ap-pears that relative mode may be more useful due to the lowerlatency times.
ConfidenceDespite feedback enabling a ranking for the interface-modecombinations as a whole, subjectively, participants could notagree which interface was best. All of the participants feltmore confident using relative mode; however five participantsindicated that the audio interface was their favorite (“veryeasy to identify what’s going on”, and “just tells you whensomething is happening”), while four participants said theywere very distracted by the audio (“it sounds like an alarm,like something urgently needs my attention”), and would findit difficult to navigate safely while using the interface. Theaudio interface in absolute mode was more distracting, withsix participants saying they would be unable to concentrate onanything else (“the constant sound is very distracting, there’sno way I could talk to someone with this on”). Interestingly,despite 80% of participants feeling less confident with the vi-brotactile interface in either mode, results were as accurateas the audio interface. The two participants that preferredthe vibrotactile interface self-identified as getting distractedby audio (“I’m just not an audio person. I even get distractedany time there’s stuff like music.”). Four participants said thatthey would eventually prefer the vibrotactile interface (“Aftera few months, I would really like it.”).
METHODOLOGY OF STUDY TWOWe introduced a distraction task in the second study. Likestudy one, participants went on a series of virtual walks. Eachsession lasted on average 30 minutes, and we had 10 partici-pants (five of which had taken part in study one). We recruited
all participants by word of mouth, and none of them were in-volved with the design of the interfaces.
Experimental DesignAs with the previous study, participants went on virtual walkswhile verbally indicating changes in heart and respiratory ratefor the four interface-mode combinations. There were a totalof eight walks, which varied the heart and respiratory rate in-dependently. Each walk lasted 60 seconds, and was designedusing the same software as described above; however, werelaxed the requirement of modeling it off observed caninephysiological data to add additional variation. In the interestof space, we are omitting the description of the walks.
During each virtual walk, we asked participants to performan audio-based N-back test to place them under additionalcognitive load while using the interfaces [14]. In an N-backtest, a series of elements are sequentially communicated tothe participant, who must indicate if the current element isthe same as, or different than the element that occurred Nelements ago. For our N-back test, the elements consistedof a computer-generated voice speaking the numbers “one,”“two,” and “three” at 2.5 second intervals. The participantindicated if the element was the same or different by pressingkeys on a laptop keyboard.
For the first four walks, participants used all four interface-mode combinations while performing an N-back test withN = 1, while the second four walks had N = 2. A com-puter randomized the order of the walks and interface-modecombinations, with the restriction that all combinations wereused exactly once for each value of N.
Participant ExperienceWe gave each participant the same general overview of theproject as we gave in the first study. We also explained whatan N-back test was, and discussed how to indicate if an ele-ment was the same or different.
Without using the audio or vibrotactile interface, participantsdid a 60 second N-back test with N = 1 to allow them to be-come accustomed to N-back tests. We then went through thefollowing three steps for each interface-mode combination:
1. Training: We used the same prompts as we used for thetraining step in the first study.
2. Walks: Participants went on a virtual walk, while perform-ing the N-back test. The prompt for this step was “Now youare going to go on a virtual walk with this interface. Pleaseremember to verbalize when you think there is a changein either heart rate or respiratory rate. Please also do theN-back test as accurately and quickly as possible.”
3. We then asked the participant if they had any feedback.
After participants used all four interfaces, they were given anopportunity for a five minute break. They then did a 60 sec-ond N-back test with N = 2. We then went through the abovesteps again, with the N-back test with N = 2. Participantscould skip the training step if they wished.
RESULTS OF STUDY TWOJust as in the first study, we focused on accuracy and latencyas metrics of performance. We once again derived the groundtruth using the scripts of the simulated walks. The formu-las and methodologies used to calculate the accuracy scoresand latency times for heart and respiratory rate detection wereidentical to those used before.
New to this study was the accuracy and latency of the N-backtest. Latency was defined as the amount of time between thestart of the voice speaking the element, and the participantpressing a key. If the participant did not respond to an ele-ment within the 2.5 second window, the software counted thatas the wrong answer and included the number of missed ele-ments in the results of each test. To compare the results acrossconditions (interface, mode, and N-back) we conducted anANOVA and report the results below.
AccuracyFor heart rate detection, the only significant differentiator wasthe interface mode (F = 13.702, d.f. = 1, p = 0.0004). Whenin absolute mode, the mean accuracy was 72.58%, with avariance of 30.88. When in relative mode, the accuracy was92.42%, with variance 13.26.
Mode was likewise the only differentiator for the respiratoryrate detection task (F = 22.167, d.f. = 1, p = 0.00001).While in absolute mode, the mean accuracy was 62.75% witha variance of 28.14. When in relative mode, the mean accu-racy was 88.38% with a variance of 17.52.
For the accuracy of the N-back tests, the only significant dif-ferences were between the levels of N (F = 4.538, d.f. = 1,p = 0.037). For the interface-mode combinations during N-back tests with N = 1, the N-back accuracy was 73.04% withvariance 16.55. For the walks with N = 2, the mean accuracyof the N-back tests was 65.24% with variance 15.91.
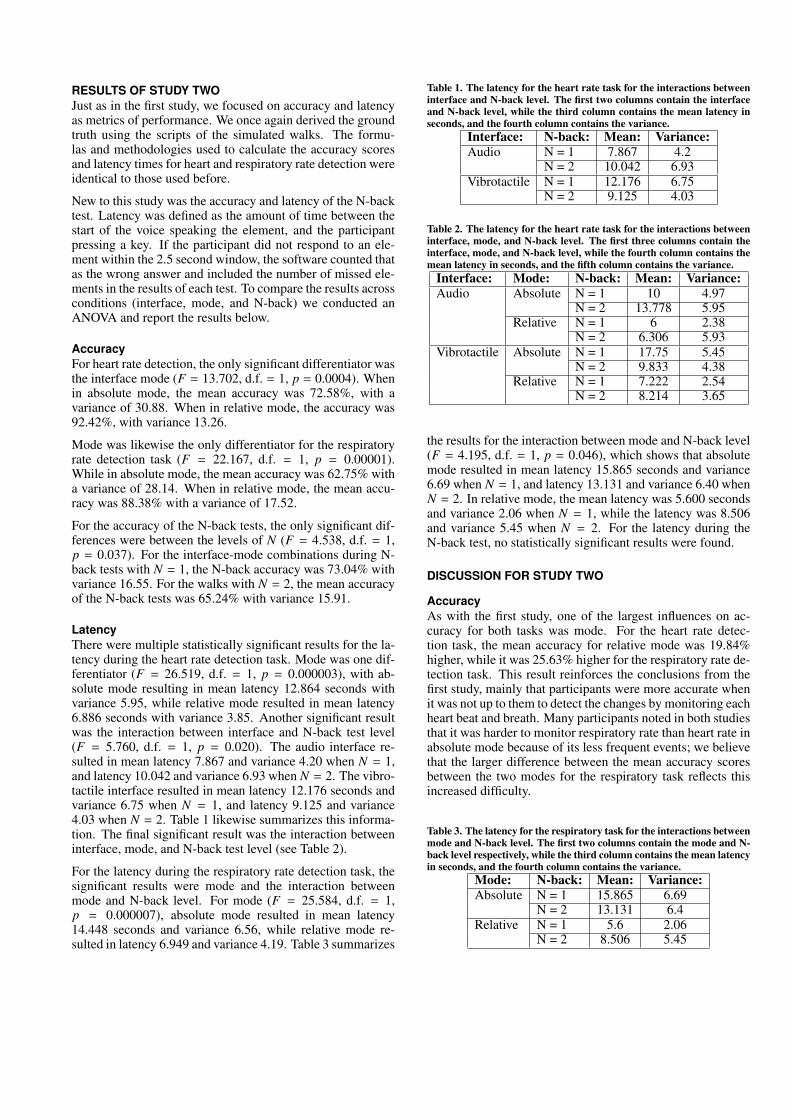
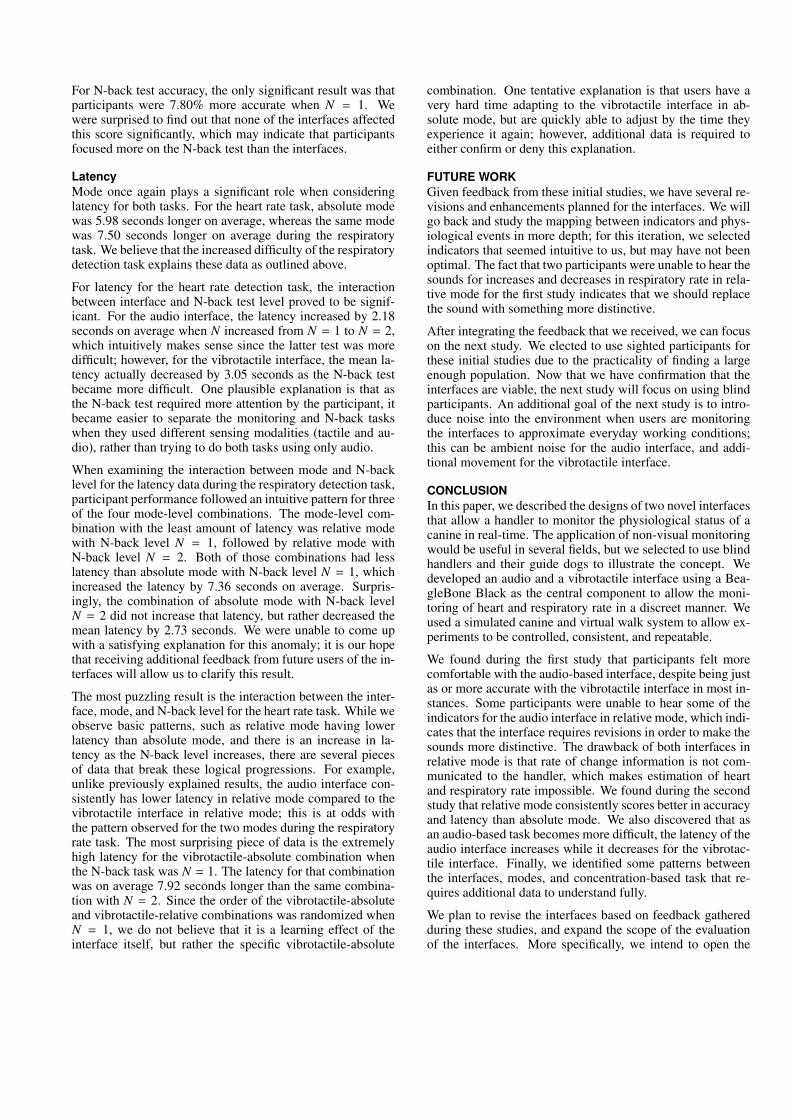
LatencyThere were multiple statistically significant results for the la-tency during the heart rate detection task. Mode was one dif-ferentiator (F = 26.519, d.f. = 1, p = 0.000003), with ab-solute mode resulting in mean latency 12.864 seconds withvariance 5.95, while relative mode resulted in mean latency6.886 seconds with variance 3.85. Another significant resultwas the interaction between interface and N-back test level(F = 5.760, d.f. = 1, p = 0.020). The audio interface re-sulted in mean latency 7.867 and variance 4.20 when N = 1,and latency 10.042 and variance 6.93 when N = 2. The vibro-tactile interface resulted in mean latency 12.176 seconds andvariance 6.75 when N = 1, and latency 9.125 and variance4.03 when N = 2. Table 1 likewise summarizes this informa-tion. The final significant result was the interaction betweeninterface, mode, and N-back test level (see Table 2).
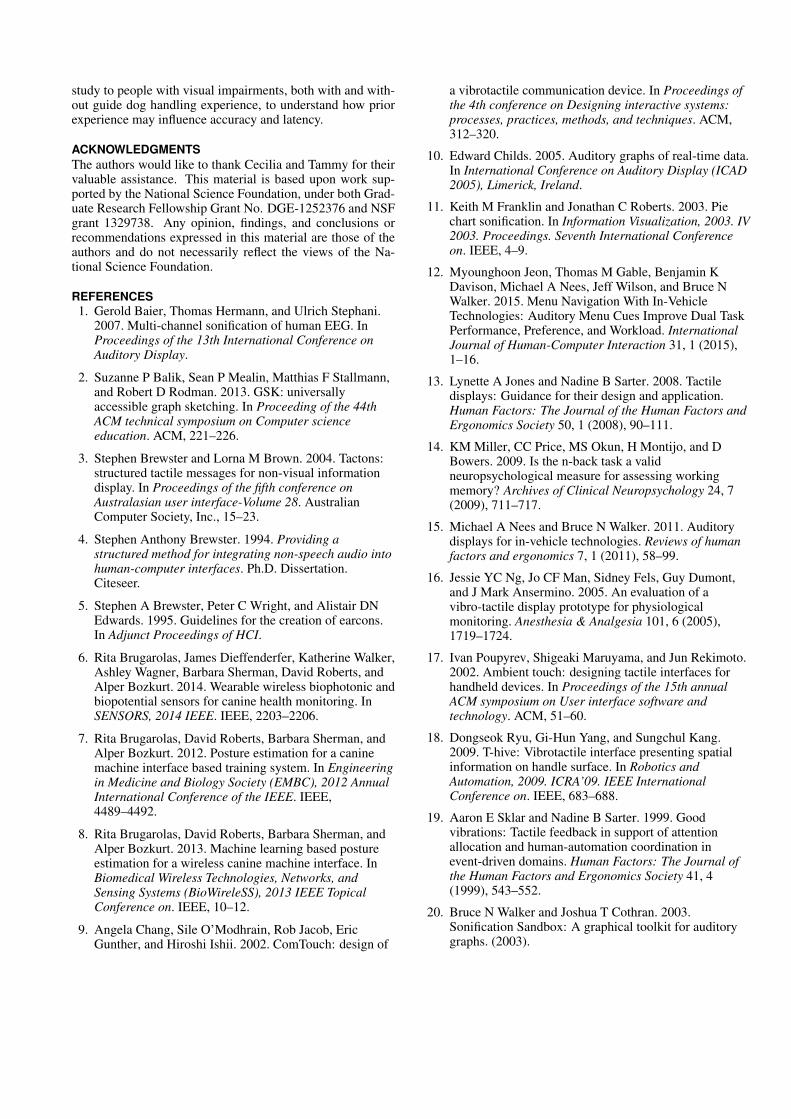
For the latency during the respiratory rate detection task, thesignificant results were mode and the interaction betweenmode and N-back level. For mode (F = 25.584, d.f. = 1,p = 0.000007), absolute mode resulted in mean latency14.448 seconds and variance 6.56, while relative mode re-sulted in latency 6.949 and variance 4.19. Table 3 summarizes
Table 1. The latency for the heart rate task for the interactions betweeninterface and N-back level. The first two columns contain the interfaceand N-back level, while the third column contains the mean latency inseconds, and the fourth column contains the variance.
Interface: N-back: Mean: Variance:Audio N = 1 7.867 4.2
N = 2 10.042 6.93Vibrotactile N = 1 12.176 6.75
N = 2 9.125 4.03
Table 2. The latency for the heart rate task for the interactions betweeninterface, mode, and N-back level. The first three columns contain theinterface, mode, and N-back level, while the fourth column contains themean latency in seconds, and the fifth column contains the variance.
Interface: Mode: N-back: Mean: Variance:Audio Absolute N = 1 10 4.97
N = 2 13.778 5.95Relative N = 1 6 2.38
N = 2 6.306 5.93Vibrotactile Absolute N = 1 17.75 5.45
N = 2 9.833 4.38Relative N = 1 7.222 2.54
N = 2 8.214 3.65
the results for the interaction between mode and N-back level(F = 4.195, d.f. = 1, p = 0.046), which shows that absolutemode resulted in mean latency 15.865 seconds and variance6.69 when N = 1, and latency 13.131 and variance 6.40 whenN = 2. In relative mode, the mean latency was 5.600 secondsand variance 2.06 when N = 1, while the latency was 8.506and variance 5.45 when N = 2. For the latency during theN-back test, no statistically significant results were found.
DISCUSSION FOR STUDY TWO
AccuracyAs with the first study, one of the largest influences on ac-curacy for both tasks was mode. For the heart rate detec-tion task, the mean accuracy for relative mode was 19.84%higher, while it was 25.63% higher for the respiratory rate de-tection task. This result reinforces the conclusions from thefirst study, mainly that participants were more accurate whenit was not up to them to detect the changes by monitoring eachheart beat and breath. Many participants noted in both studiesthat it was harder to monitor respiratory rate than heart rate inabsolute mode because of its less frequent events; we believethat the larger difference between the mean accuracy scoresbetween the two modes for the respiratory task reflects thisincreased difficulty.
Table 3. The latency for the respiratory task for the interactions betweenmode and N-back level. The first two columns contain the mode and N-back level respectively, while the third column contains the mean latencyin seconds, and the fourth column contains the variance.
Mode: N-back: Mean: Variance:Absolute N = 1 15.865 6.69
N = 2 13.131 6.4Relative N = 1 5.6 2.06
N = 2 8.506 5.45
For N-back test accuracy, the only significant result was thatparticipants were 7.80% more accurate when N = 1. Wewere surprised to find out that none of the interfaces affectedthis score significantly, which may indicate that participantsfocused more on the N-back test than the interfaces.
LatencyMode once again plays a significant role when consideringlatency for both tasks. For the heart rate task, absolute modewas 5.98 seconds longer on average, whereas the same modewas 7.50 seconds longer on average during the respiratorytask. We believe that the increased difficulty of the respiratorydetection task explains these data as outlined above.
For latency for the heart rate detection task, the interactionbetween interface and N-back test level proved to be signif-icant. For the audio interface, the latency increased by 2.18seconds on average when N increased from N = 1 to N = 2,which intuitively makes sense since the latter test was moredifficult; however, for the vibrotactile interface, the mean la-tency actually decreased by 3.05 seconds as the N-back testbecame more difficult. One plausible explanation is that asthe N-back test required more attention by the participant, itbecame easier to separate the monitoring and N-back taskswhen they used different sensing modalities (tactile and au-dio), rather than trying to do both tasks using only audio.
When examining the interaction between mode and N-backlevel for the latency data during the respiratory detection task,participant performance followed an intuitive pattern for threeof the four mode-level combinations. The mode-level com-bination with the least amount of latency was relative modewith N-back level N = 1, followed by relative mode withN-back level N = 2. Both of those combinations had lesslatency than absolute mode with N-back level N = 1, whichincreased the latency by 7.36 seconds on average. Surpris-ingly, the combination of absolute mode with N-back levelN = 2 did not increase that latency, but rather decreased themean latency by 2.73 seconds. We were unable to come upwith a satisfying explanation for this anomaly; it is our hopethat receiving additional feedback from future users of the in-terfaces will allow us to clarify this result.
The most puzzling result is the interaction between the inter-face, mode, and N-back level for the heart rate task. While weobserve basic patterns, such as relative mode having lowerlatency than absolute mode, and there is an increase in la-tency as the N-back level increases, there are several piecesof data that break these logical progressions. For example,unlike previously explained results, the audio interface con-sistently has lower latency in relative mode compared to thevibrotactile interface in relative mode; this is at odds withthe pattern observed for the two modes during the respiratoryrate task. The most surprising piece of data is the extremelyhigh latency for the vibrotactile-absolute combination whenthe N-back task was N = 1. The latency for that combinationwas on average 7.92 seconds longer than the same combina-tion with N = 2. Since the order of the vibrotactile-absoluteand vibrotactile-relative combinations was randomized whenN = 1, we do not believe that it is a learning effect of theinterface itself, but rather the specific vibrotactile-absolute
combination. One tentative explanation is that users have avery hard time adapting to the vibrotactile interface in ab-solute mode, but are quickly able to adjust by the time theyexperience it again; however, additional data is required toeither confirm or deny this explanation.
FUTURE WORKGiven feedback from these initial studies, we have several re-visions and enhancements planned for the interfaces. We willgo back and study the mapping between indicators and phys-iological events in more depth; for this iteration, we selectedindicators that seemed intuitive to us, but may have not beenoptimal. The fact that two participants were unable to hear thesounds for increases and decreases in respiratory rate in rela-tive mode for the first study indicates that we should replacethe sound with something more distinctive.
After integrating the feedback that we received, we can focuson the next study. We elected to use sighted participants forthese initial studies due to the practicality of finding a largeenough population. Now that we have confirmation that theinterfaces are viable, the next study will focus on using blindparticipants. An additional goal of the next study is to intro-duce noise into the environment when users are monitoringthe interfaces to approximate everyday working conditions;this can be ambient noise for the audio interface, and addi-tional movement for the vibrotactile interface.
CONCLUSIONIn this paper, we described the designs of two novel interfacesthat allow a handler to monitor the physiological status of acanine in real-time. The application of non-visual monitoringwould be useful in several fields, but we selected to use blindhandlers and their guide dogs to illustrate the concept. Wedeveloped an audio and a vibrotactile interface using a Bea-gleBone Black as the central component to allow the moni-toring of heart and respiratory rate in a discreet manner. Weused a simulated canine and virtual walk system to allow ex-periments to be controlled, consistent, and repeatable.
We found during the first study that participants felt morecomfortable with the audio-based interface, despite being justas or more accurate with the vibrotactile interface in most in-stances. Some participants were unable to hear some of theindicators for the audio interface in relative mode, which indi-cates that the interface requires revisions in order to make thesounds more distinctive. The drawback of both interfaces inrelative mode is that rate of change information is not com-municated to the handler, which makes estimation of heartand respiratory rate impossible. We found during the secondstudy that relative mode consistently scores better in accuracyand latency than absolute mode. We also discovered that asan audio-based task becomes more difficult, the latency of theaudio interface increases while it decreases for the vibrotac-tile interface. Finally, we identified some patterns betweenthe interfaces, modes, and concentration-based task that re-quires additional data to understand fully.
We plan to revise the interfaces based on feedback gatheredduring these studies, and expand the scope of the evaluationof the interfaces. More specifically, we intend to open the
study to people with visual impairments, both with and with-out guide dog handling experience, to understand how priorexperience may influence accuracy and latency.
ACKNOWLEDGMENTSThe authors would like to thank Cecilia and Tammy for theirvaluable assistance. This material is based upon work sup-ported by the National Science Foundation, under both Grad-uate Research Fellowship Grant No. DGE-1252376 and NSFgrant 1329738. Any opinion, findings, and conclusions orrecommendations expressed in this material are those of theauthors and do not necessarily reflect the views of the Na-tional Science Foundation.
REFERENCES1. Gerold Baier, Thomas Hermann, and Ulrich Stephani.
2007. Multi-channel sonification of human EEG. InProceedings of the 13th International Conference onAuditory Display.
2. Suzanne P Balik, Sean P Mealin, Matthias F Stallmann,and Robert D Rodman. 2013. GSK: universallyaccessible graph sketching. In Proceeding of the 44thACM technical symposium on Computer scienceeducation. ACM, 221–226.
3. Stephen Brewster and Lorna M Brown. 2004. Tactons:structured tactile messages for non-visual informationdisplay. In Proceedings of the fifth conference onAustralasian user interface-Volume 28. AustralianComputer Society, Inc., 15–23.
4. Stephen Anthony Brewster. 1994. Providing astructured method for integrating non-speech audio intohuman-computer interfaces. Ph.D. Dissertation.Citeseer.
5. Stephen A Brewster, Peter C Wright, and Alistair DNEdwards. 1995. Guidelines for the creation of earcons.In Adjunct Proceedings of HCI.
6. Rita Brugarolas, James Dieffenderfer, Katherine Walker,Ashley Wagner, Barbara Sherman, David Roberts, andAlper Bozkurt. 2014. Wearable wireless biophotonic andbiopotential sensors for canine health monitoring. InSENSORS, 2014 IEEE. IEEE, 2203–2206.
7. Rita Brugarolas, David Roberts, Barbara Sherman, andAlper Bozkurt. 2012. Posture estimation for a caninemachine interface based training system. In Engineeringin Medicine and Biology Society (EMBC), 2012 AnnualInternational Conference of the IEEE. IEEE,4489–4492.
8. Rita Brugarolas, David Roberts, Barbara Sherman, andAlper Bozkurt. 2013. Machine learning based postureestimation for a wireless canine machine interface. InBiomedical Wireless Technologies, Networks, andSensing Systems (BioWireleSS), 2013 IEEE TopicalConference on. IEEE, 10–12.
9. Angela Chang, Sile O’Modhrain, Rob Jacob, EricGunther, and Hiroshi Ishii. 2002. ComTouch: design of
a vibrotactile communication device. In Proceedings ofthe 4th conference on Designing interactive systems:processes, practices, methods, and techniques. ACM,312–320.
10. Edward Childs. 2005. Auditory graphs of real-time data.In International Conference on Auditory Display (ICAD2005), Limerick, Ireland.
11. Keith M Franklin and Jonathan C Roberts. 2003. Piechart sonification. In Information Visualization, 2003. IV2003. Proceedings. Seventh International Conferenceon. IEEE, 4–9.
12. Myounghoon Jeon, Thomas M Gable, Benjamin KDavison, Michael A Nees, Jeff Wilson, and Bruce NWalker. 2015. Menu Navigation With In-VehicleTechnologies: Auditory Menu Cues Improve Dual TaskPerformance, Preference, and Workload. InternationalJournal of Human-Computer Interaction 31, 1 (2015),1–16.
13. Lynette A Jones and Nadine B Sarter. 2008. Tactiledisplays: Guidance for their design and application.Human Factors: The Journal of the Human Factors andErgonomics Society 50, 1 (2008), 90–111.
14. KM Miller, CC Price, MS Okun, H Montijo, and DBowers. 2009. Is the n-back task a validneuropsychological measure for assessing workingmemory? Archives of Clinical Neuropsychology 24, 7(2009), 711–717.
15. Michael A Nees and Bruce N Walker. 2011. Auditorydisplays for in-vehicle technologies. Reviews of humanfactors and ergonomics 7, 1 (2011), 58–99.
16. Jessie YC Ng, Jo CF Man, Sidney Fels, Guy Dumont,and J Mark Ansermino. 2005. An evaluation of avibro-tactile display prototype for physiologicalmonitoring. Anesthesia & Analgesia 101, 6 (2005),1719–1724.
17. Ivan Poupyrev, Shigeaki Maruyama, and Jun Rekimoto.2002. Ambient touch: designing tactile interfaces forhandheld devices. In Proceedings of the 15th annualACM symposium on User interface software andtechnology. ACM, 51–60.
18. Dongseok Ryu, Gi-Hun Yang, and Sungchul Kang.2009. T-hive: Vibrotactile interface presenting spatialinformation on handle surface. In Robotics andAutomation, 2009. ICRA’09. IEEE InternationalConference on. IEEE, 683–688.
19. Aaron E Sklar and Nadine B Sarter. 1999. Goodvibrations: Tactile feedback in support of attentionallocation and human-automation coordination inevent-driven domains. Human Factors: The Journal ofthe Human Factors and Ergonomics Society 41, 4(1999), 543–552.
20. Bruce N Walker and Joshua T Cothran. 2003.Sonification Sandbox: A graphical toolkit for auditorygraphs. (2003).