Embed Size (px)
Citation preview
Towards the Differentiation of Initial and Final Retention
in Massive Open Online Courses
Raghad Al-Shabandar, Abir Hussain, Andy Laws, Robert Keight ,Janet Lunn
Applied Computing Research Group, School of Computing and Mathematical Sciences
Liverpool John Moores University, Byrom Street, Liverpool, L3 3AF, UK
[email protected],{A.hussain,
A.Laws,J.Lunn}@ljmu.ac.uk,[email protected]
Abstract. Following an accelerating pace of technological change, Massive Open Online
Courses (MOOCs) have emerged as a popular educational delivery platform, leveraging ubiqui-
tous connectivity and computing power to overcome longstanding geographical and financial
barriers to education. Consequently, the demographic reach of education delivery is extended
towards a global online audience, facilitating learning and development for a continually ex-
panding portion of the world population. However, an extensive literature review indicates that
the low completion rate is the major issue related to MOOCs. Due to a lack of in-person inter-
action between instructors and learners in such courses, the ability of tutors to monitor learners
is impaired, often leading to learner withdrawals. To address this problem, learner drop out
patterns across five courses offered by Harvard and MIT universities are investigated in this
paper. Learning Analytics is applied to address key factors behind participant dropout events
through the comparison of attrition during the first and last weeks of each course. The results
show that the number of attired participants during the first week of the course is higher than
during the last week, low percentages of attired learners are found prior to course closing dates.
It is indicated therefore that assessment fees may not represent a significant reason for learners
withdrawal. We introduce supervised machine learning algorithms for the analysis of learner
retention and attrition within MOOC platform. Results show that machine learning represents a
viable direction for the predictive analysis of MOOCs, with highest performances yielded by
Boosted Tree classification for initial attrition and Neural Network based classification for final
attrition.
1 Introduction
With progress in Open Educational Resources (OER) advancing from an emerging
field towards an increasingly important learning modality, Massive Open Online
Courses (MOOCs) have seen dramatically increases in popularity over the last few
years within the higher education sector[1]. The high ranking universities have devel-
oped and delivered hundreds of courses, including HarvardX, Khan Academy, and
Coursera[1]. MOOCs provide the same quality of learning as the traditional class-
room without conventional time and geographical restrictions. As a result, learners are
able to understand and learn courseware content at their own pace. Through the
MOOC platform, learners are connected with an array of learning resources, including
video lectures, regular assessments, and content in the form of pdf documents. Addi-
tionally, learners can interact with each other through participation in online discus-
sion forums[2]. One of the distinctive features of MOOCs is their instant accessibility,
coupled with the elimination of financial, geographical, and educational obstacles.
Consequently, the proportion of participants engaging in such courses could increase
quickly[1][2]. For example, the number of participants has rapidly expanded in Har-
vard online courses, with 1.3 million unique learners engaged in online courses re-
ported at the end of 2014[3]. Nevertheless, significant potential of MOOCs features,
the low completion rate is the major issue related to MOOCs[2][4]. Research investi-
gations reveal on average that out of each one million participants in MOOCs, an
overwhelming majority of them withdraw from MOOCs prior to completion[2]. Due
to lack of face to face interaction between instructors and learners in such courses, it
is understandably difficult for instructor's to maintain direct awareness of the reasons
for individual learner withdrawals[5]. Learning Analytics (LA) is an emerging field of
educational technology. LA approaches have demonstrated beneficial insight into the
rate of attrition at an early stage. LA analysis, measures and abstracts comprehensive
information about the learner from various aspects, including cognitive, social, and
psychological facets to help the decision-maker to effectively reason about learner
success and failures [6].LA methods can provide course instructors further infor-
mation about learner activity in a virtual environment and help them to tailor material
to need of participants[6]. Machine learning is a space of techniques at the intersec-
tion of computer science, statistics, and mathematics, that has been subsequently
adopted by researchers to predict student retention within virtual class
environments[4]. Despite the large number of works reported in the literature for
modelling student dropout rates, such models do not take into consideration the un-
derlying factors that drive student withdrawals[5]. In this work, LA is therefore em-
ployed to analyse and address key factors behind participant dropout events, provid-
ing a window of opportunity in which to apply early stage intervention, thereby pre-
venting such cases of withdrawal. It is hypothesised in this work that such withdrawal
events are in fact largely preventable through the observation and analysis of learner
behaviours over various time periods. Machine learning represents a powerful data
intensive approach which we apply within our proposed LA framework. ML is
appropriate for the detection of potentially learner attrition patterns from course
activity data through the examination of learning behaviour features over time[7].
Moreover, machine learning has the potential scope to infer the underlying emotional
state of learners by discovering a latent pattern of learner behavior [1].In this paper
supervised machine learning approaches will be presented to predict learner retnetion
and attrition parameters in MOOCs platform. The performance of classifier models
will be compared using a set of appropriate criteria.
2 Literature Review
MOOCs have attracted the attention of many researchers, with an aim to provide an
advantage over traditional classroom environments. Much existing work focuses on
participant attrition in MOOCs. In this section we will summarise the work of other
researchers towards learner attrition in MOOCs. The author in ref [4]applies super-
vised machine learning to predict the likelihood of learner dropout from MOOCs.
Feature engineering over time was considered in order to obtain more accurate
predication rates[4]. Other researchers emphasise forum posts as a prominent recourse
of information for dropout analysis in MOOCs. In such works, the author in ref
[8]adopts a sentiment analysis approach considering only forum post as the main
criteria for analysis. The work considers the daily data of user forum posts and under-
takes analysis in order to evaluate participant opinions regarding the quality of
teaching, learning material, and peer-assessment. The results show a significant asso-
ciation between learner sentiment and attrition rate. Although forum posts act as a
major factor affecting attrition rates, it has been observed that around 5-10% of
registrants participate in the discussion forums themselves [9].Consequentially, the
narrow focus on the forum post data imposes a critical limit on the generality of the
approach, since other important factors such as behavioral activities are not accounted
for [10].The authors in reference [10] applies Support Vector Machines (SVM) and
considers only click stream features. A set of features have been extracted from be-
havioral log data such as the number of times a student undertakes a particular quiz,
the number of visits to the course home page, and length of the session[10]. The attri-
tion phenomenon was described by [11]as a funnel of participation. The term funnel
of participation emerges from the equivalent concept in marketing (marketing funnel).
The funnel of participation approach attempts to describe learners’ theoretical stages
toward dropout from MOOCs according to four main stages. Such stages are defined
as Awareness, Registration, Activity, and progress[11].The author concludes that the
fluctuation of learners behavioral activities leads to withdrew from online courses.
Discussion threads are used to measure the negative behaviors of learners that lead to
demotivate engagement within MOOCs platforms. Two kinds of features have been
considered, namely click stream events and discussion threads[11]. Survival models
have been developed by [2]for measuring the likelihood of attrition events. Survival
model can be described as predictive models that apply logistic regression to infer the
probability of learners’ survival in the course over time[2] Additionally, feedforward
neural networks have been implemented in [12] to predict completion rate in MOOCs,
considering student sentiments as input. In this case, only the behavioral attributes are
used to measure the performance of learners.
3 Methodology
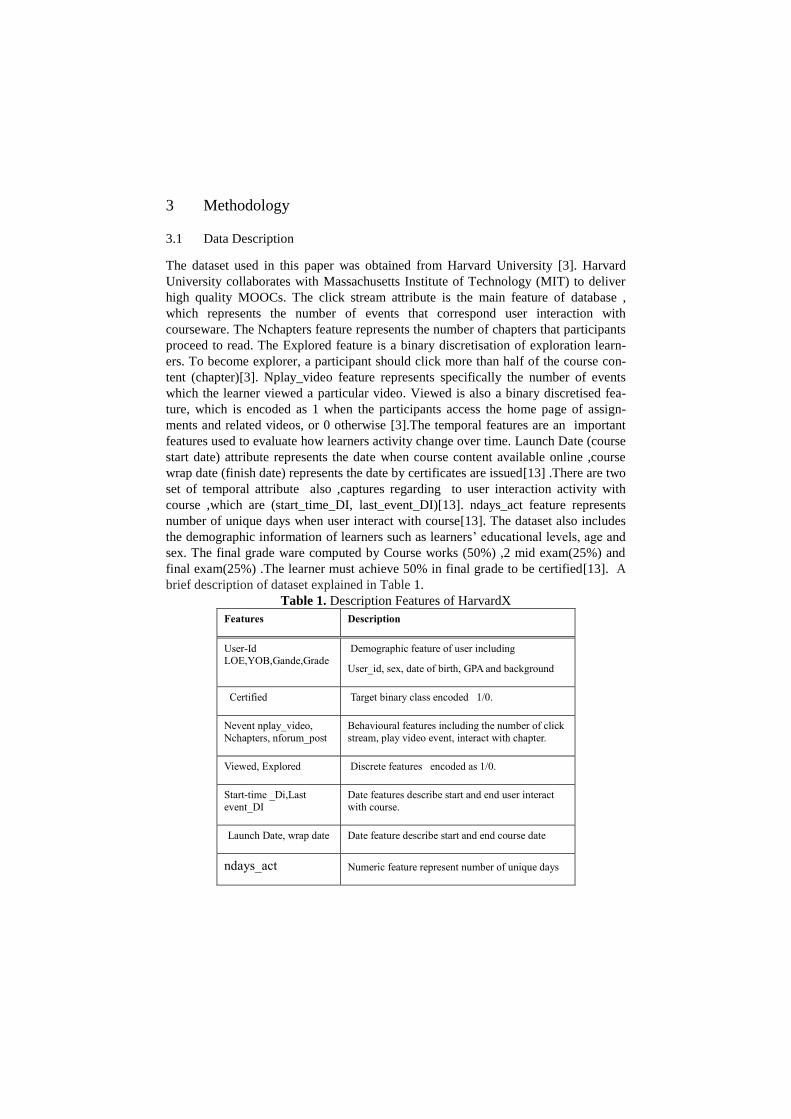
3.1 Data Description
The dataset used in this paper was obtained from Harvard University [3]. Harvard
University collaborates with Massachusetts Institute of Technology (MIT) to deliver
high quality MOOCs. The click stream attribute is the main feature of database ,
which represents the number of events that correspond user interaction with
courseware. The Nchapters feature represents the number of chapters that participants
proceed to read. The Explored feature is a binary discretisation of exploration learn-
ers. To become explorer, a participant should click more than half of the course con-
tent (chapter)[3]. Nplay_video feature represents specifically the number of events
which the learner viewed a particular video. Viewed is also a binary discretised fea-
ture, which is encoded as 1 when the participants access the home page of assign-
ments and related videos, or 0 otherwise [3].The temporal features are an important
features used to evaluate how learners activity change over time. Launch Date (course
start date) attribute represents the date when course content available online ,course
wrap date (finish date) represents the date by certificates are issued[13] .There are two
set of temporal attribute also ,captures regarding to user interaction activity with
course ,which are (start_time_DI, last_event_DI)[13]. ndays_act feature represents
number of unique days when user interact with course[13]. The dataset also includes
the demographic information of learners such as learners’ educational levels, age and
sex. The final grade ware computed by Course works (50%) ,2 mid exam(25%) and
final exam(25%) .The learner must achieve 50% in final grade to be certified[13]. A
brief description of dataset explained in Table 1.
Table 1. Description Features of HarvardX
Features Description
User-Id LOE,YOB,Gande,Grade
Demographic feature of user including
User_id, sex, date of birth, GPA and background
Certified Target binary class encoded 1/0.
Nevent nplay_video,
Nchapters, nforum_post
Behavioural features including the number of click
stream, play video event, interact with chapter.
Viewed, Explored Discrete features encoded as 1/0.
Start-time _Di,Last
event_DI
Date features describe start and end user interact
with course.
Launch Date, wrap date Date feature describe start and end course date
ndays_act Numeric feature represent number of unique days

3.2 Data Pre-Processing
The data used in this study has been captured from 5 courses, classified into five
types: Computer science, Electronic engineering, History, Chemistry, and Health.
Due to the large size of date, we randomly sampled 700,000-log file entries represent-
ing the completed learners’ activities on MOOCs, where each row represents a single
user session. On inspection it was found that the Harvard dataset contains a large
number of missing values inclusive of both behavioural and demographic features. To
overcome this issue, Multivariate imputation by chained equations (MICE) has been
applied [14]. MICE is capable of performing multiple imputations over a set of
variables at single step regardless of the type of variables, making it a reasonable
choice [14].Data in the Harvard dataset does not match the normal distribution.
Normality of data is a desirable property and may be required in the case of some
classes of machine learning models [15]. To handle non normality issue, Box-Cox
transformation was used .Box-Cox is a member of the class of power transform func-
tions, which are used for the efficient conversion of variables to a form of normality,
the equalisation of variance, and to enhance the validity of tests for correlated varia-
bles [15]. Additionally, we scaled and centered the data through a zscore calculation.
Furthermore, imbalanced classes are a notable concern in this dataset. As such, the
procedure of Synthetic Minority Oversampling Technique (SMOTE) has been applied
to equalise the class proportions through the generation of additional minority class
examples [16]. In particular, SMOTE applies a kNN algorithm to interpolate a new
instances of each minority class through evaluation of its nearest neighbours
according to some distance metric.
3.3 Experiments Introduction
The purpose of this study is to estimate the rate of learner dropout from MOOCs in
the future. Only five courses are considered in this study, provided by Harvard and
MIT through the EDX platform in 2012-2013 [13]. The courses differ in both their
structure and length. As such, the course material offered by Harvard was delivered
on a weekly basis over 12-14 weeks, with MIT conversely releasing all materials at
the launch date for each course [13]. Both HarvardX and MITx define successful
certification of learners as the completion of weekly course works, followed by a pass
mark for a final exam held at the end of the course [13]. The objective of this study is
to estimate the learners dropout rate from future courses and additionally to identify
the main reasons leading to learner withdrawal. A data-driven approach was used to
describe patterns of activity drop off. The features considered comprise “ndays_act”,
which represents a number of unique days learners interact in the courseware,
combined with temporal features. Importantly, there is no imposed limitation of time
on learners’ access to courseware content. Learners might enrol in late in a given
course; in addition, learners might withdraw from courses even prior to the comple-
tion date. Attrition was defined in terms of two main categories, namely initial and
final attrition. A brief explanation of each category is provided below.
Initial (in/out) state: The aim of drive initial (in/out state) feature examines the rate
of participant dropout over the first week. Therefore, only learners who participat-
ed in the course since the first-week were considered. The date of learner first ac-
tivity is compared with course start dates to determine learners who engaged since
the beginning of course, to examine if learners dropout from the course over the
first week. The date of first activity compares with last activity if both activities
happened in same first week and learners didn’t interact with course material. In
this case, the learner state is defined as out (attrition), otherwise in (retention).
Final (in/out) state: The aim of drive final (in/out) state feature is to evaluate the
learners who enrol late and drop out from a course before the final exam date. In
this case, only learners who enrolled after the course start were considered in order
to explore if learners drop out of a course before the final exam data. The date of
last activity was compared to the course end date. If last activity happened in the
same period of course end date, the learner state is defined as out (attrition),
otherwise in (retention).
3.4 Exploratory Data Analysis
In this paper, Exploratory Data Analysis (EDA), was used as a precursor of modelling
phase. The aim of undertaking EDA is to understand learners activity inuitively, in
particular the percentage of withdrawal participants per individual course over time.
To compare learner dropout rates over time, quantitative summaries were produced.
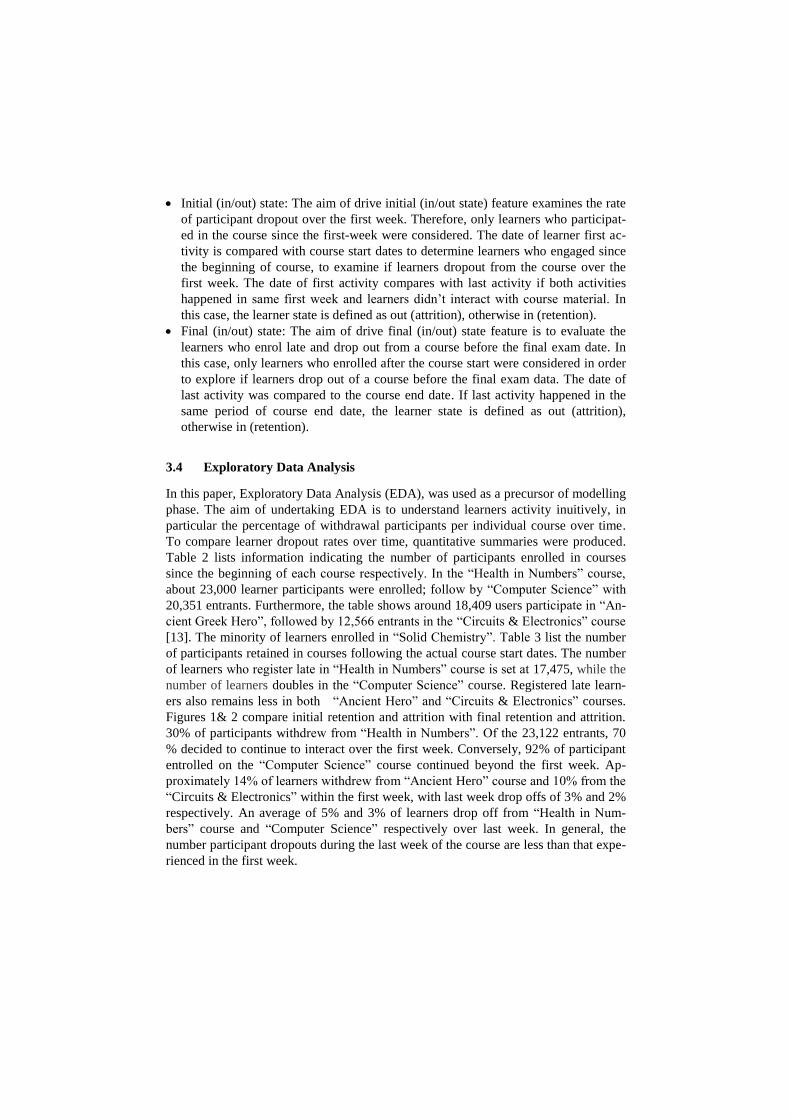
Table 2 lists information indicating the number of participants enrolled in courses
since the beginning of each course respectively. In the “Health in Numbers” course,
about 23,000 learner participants were enrolled; follow by “Computer Science” with
20,351 entrants. Furthermore, the table shows around 18,409 users participate in “An-
cient Greek Hero”, followed by 12,566 entrants in the “Circuits & Electronics” course
[13]. The minority of learners enrolled in “Solid Chemistry”. Table 3 list the number
of participants retained in courses following the actual course start dates. The number
of learners who register late in “Health in Numbers” course is set at 17,475, while the
number of learners doubles in the “Computer Science” course. Registered late learn-
ers also remains less in both “Ancient Hero” and “Circuits & Electronics” courses.
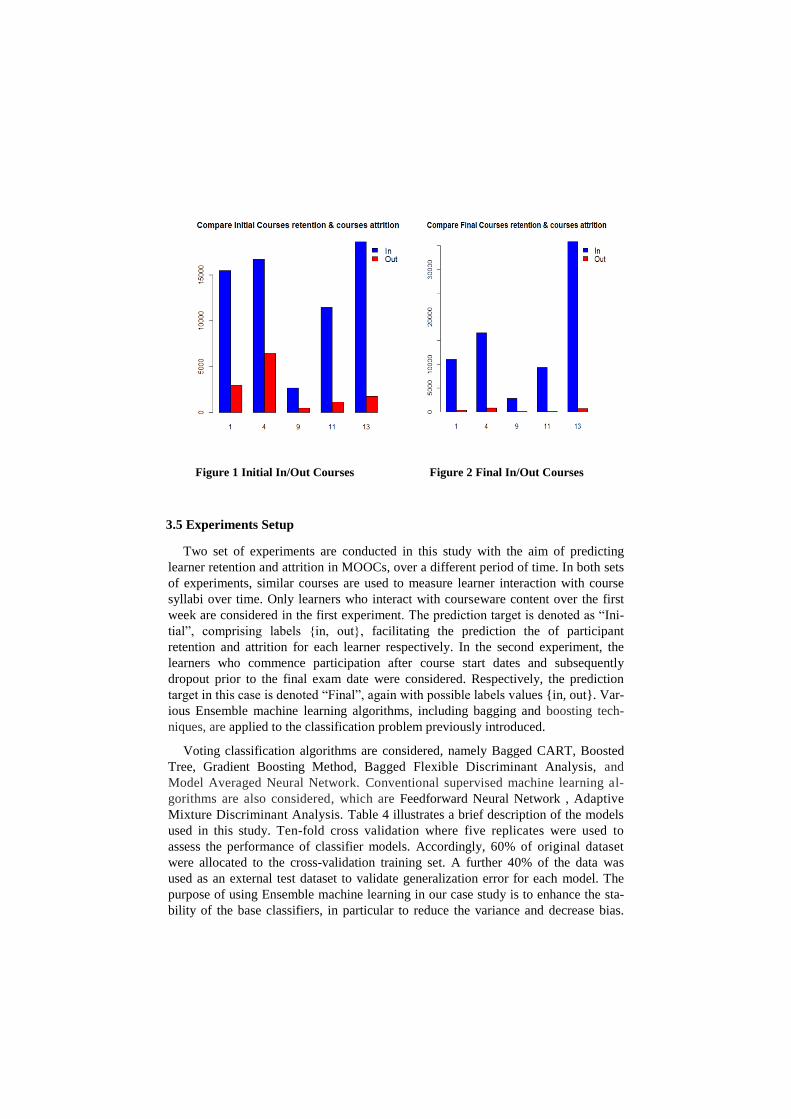
Figures 1& 2 compare initial retention and attrition with final retention and attrition.
30% of participants withdrew from “Health in Numbers”. Of the 23,122 entrants, 70
% decided to continue to interact over the first week. Conversely, 92% of participant
entrolled on the “Computer Science” course continued beyond the first week. Ap-
proximately 14% of learners withdrew from “Ancient Hero” course and 10% from the
“Circuits & Electronics” within the first week, with last week drop offs of 3% and 2%
respectively. An average of 5% and 3% of learners drop off from “Health in Num-
bers” course and “Computer Science” respectively over last week. In general, the
number participant dropouts during the last week of the course are less than that expe-
rienced in the first week.
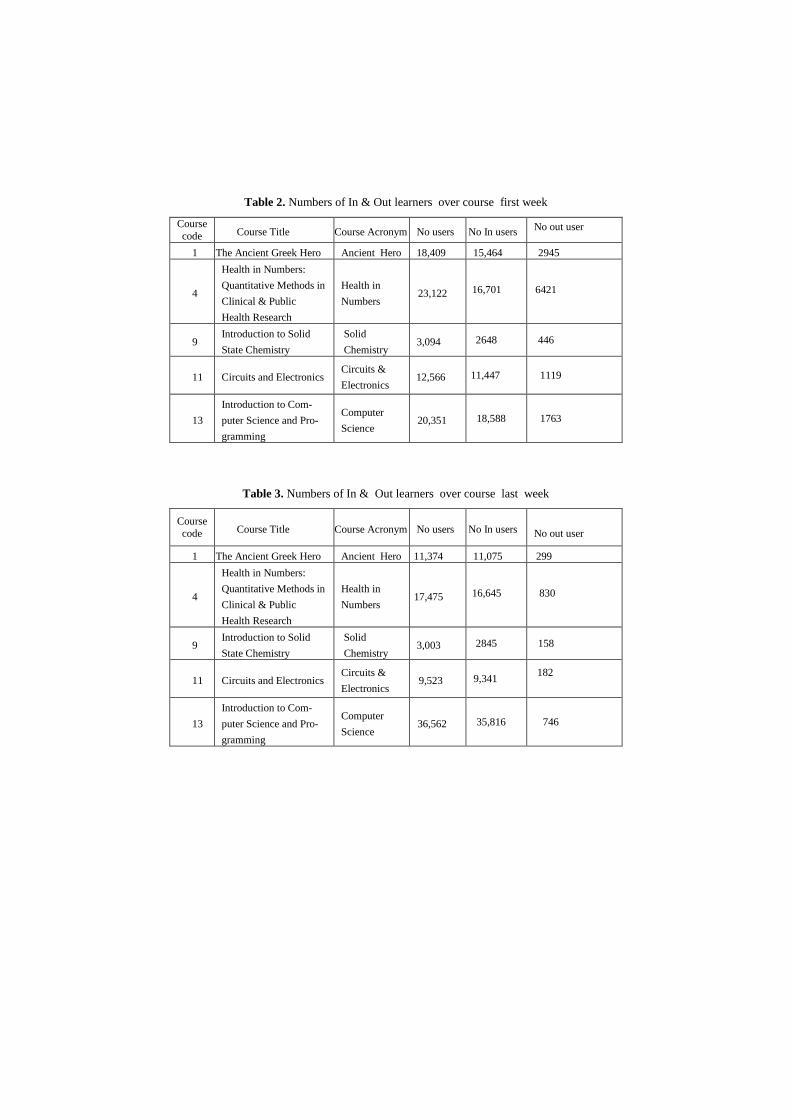
Table 2. Numbers of In & Out learners over course first week
Course
code Course Title Course Acronym No users No In users No out user
1 The Ancient Greek Hero Ancient Hero 18,409 15,464 2945
4
Health in Numbers:
Quantitative Methods in
Clinical & Public
Health Research
Health in
Numbers 23,122
16,701
6421
9 Introduction to Solid
State Chemistry
Solid
Chemistry 3,094 2648 446
11 Circuits and Electronics Circuits &
Electronics 12,566
11,447
1119
13
Introduction to Com-
puter Science and Pro-
gramming
Computer
Science 20,351
18,588
1763
Table 3. Numbers of In & Out learners over course last week
Course
code Course Title Course Acronym No users No In users
No out user
1 The Ancient Greek Hero Ancient Hero 11,374 11,075 22222222 299
4
Health in Numbers:
Quantitative Methods in
Clinical & Public
Health Research
Health in
Numbers 17,475
16,645
830
9 Introduction to Solid
State Chemistry
Solid
Chemistry 3,003 2845 158
11 Circuits and Electronics Circuits &
Electronics 9,523
9,341
182
13
Introduction to Com-
puter Science and Pro-
gramming
Computer
Science 36,562
35,816
746
3.5 Experiments Setup
Two set of experiments are conducted in this study with the aim of predicting
learner retention and attrition in MOOCs, over a different period of time. In both sets
of experiments, similar courses are used to measure learner interaction with course
syllabi over time. Only learners who interact with courseware content over the first
week are considered in the first experiment. The prediction target is denoted as “Ini-
tial”, comprising labels {in, out}, facilitating the prediction the of participant
retention and attrition for each learner respectively. In the second experiment, the
learners who commence participation after course start dates and subsequently
dropout prior to the final exam date were considered. Respectively, the prediction
target in this case is denoted “Final”, again with possible labels values {in, out}. Var-
ious Ensemble machine learning algorithms, including bagging and boosting tech-
niques, are applied to the classification problem previously introduced.
Voting classification algorithms are considered, namely Bagged CART, Boosted
Tree, Gradient Boosting Method, Bagged Flexible Discriminant Analysis, and
Model Averaged Neural Network. Conventional supervised machine learning al-
gorithms are also considered, which are Feedforward Neural Network , Adaptive
Mixture Discriminant Analysis. Table 4 illustrates a brief description of the models
used in this study. Ten-fold cross validation where five replicates were used to
assess the performance of classifier models. Accordingly, 60% of original dataset
were allocated to the cross-validation training set. A further 40% of the data was
used as an external test dataset to validate generalization error for each model. The
purpose of using Ensemble machine learning in our case study is to enhance the sta-
bility of the base classifiers, in particular to reduce the variance and decrease bias.
Figure 1 Initial In/Out Courses
Figure 2 Final In/Out Courses
Bootstrap aggregating (bagging) of weak classifiers into strong classifiers is achieved
by randomly resampling the original training data of size m into a number of boot-
strap samples, where of which retains the same size of the original dataset. New data
points are then classified based on a voting procedure. Boosting leverages a multi-
plicity of weak base classifiers to form a strong classifier through the use of adaptive
reweighting of data during training. Specifically, to obtain improved classification
performance, a weight is assigned to each data point, which is adjusted during the
iterative learning process. The weight of data corresponding to misclassified samples
increases while the weight of correctly classified sample decreases.
3.5 Result Evaluation and Discussion
The method implemented in this paper follows a binary classification problem, where
retention is donated as the positive class while attrition is assigned to the negative
class. Empirical results over both sets of experiments have been compared in terms of
performance metrics comprising accuracy, specificity and sensitivity, precision,
recall, and AUC. Tables 5 & 6 show the empirical results obtained for each classifier
respectively.Bagged CART acquired the highest accuracy in experiment 1, with a
value of 0.94%, while NN gives the best accuracy in experiment 2 where a value of
0.89% is obtained. There is a noticeable difference in accuracy for the boosting mod-
els, where GBM obtained higher accuracy than the Boosted Tree in experiment 1,
achieving values of 0.92 and 0.80 respectively, while the Boosting tree classifier ob-
tained better accuracy than GBM in experiment 2, yielding values of 0.85 and 0.71. A
comparison of bagging models shows that BagFDA yielded slightly higher accuracy
than the avNNet model with an average value of 0.89, whereas BagFDA showed the
lowest accuracy in experiment 2, obtaining a value of 0.66%. In both sets of experi-
ments, the linear classifier Amdai obtained the lowest average accuracy with values of
0.70 and 0.76, respectively. Due to the number of learners who drop off from the
course during the last week being much less than that of the first week, the True nega-
tive (specificity) results over all classifiers in experiment 1 are seen to be significantly
higher than in those of experiment 2. In particular, models Treebag, avNNet, NN, and
GBM obtained average values of 94%, 93%, 92%, and 91% respectively. Con-
versely, such models achieved worse specificity in experiment 2, with values of 79%,
75%, 30%, and 77% respectively. The linear model achieved a slightly higher speci-
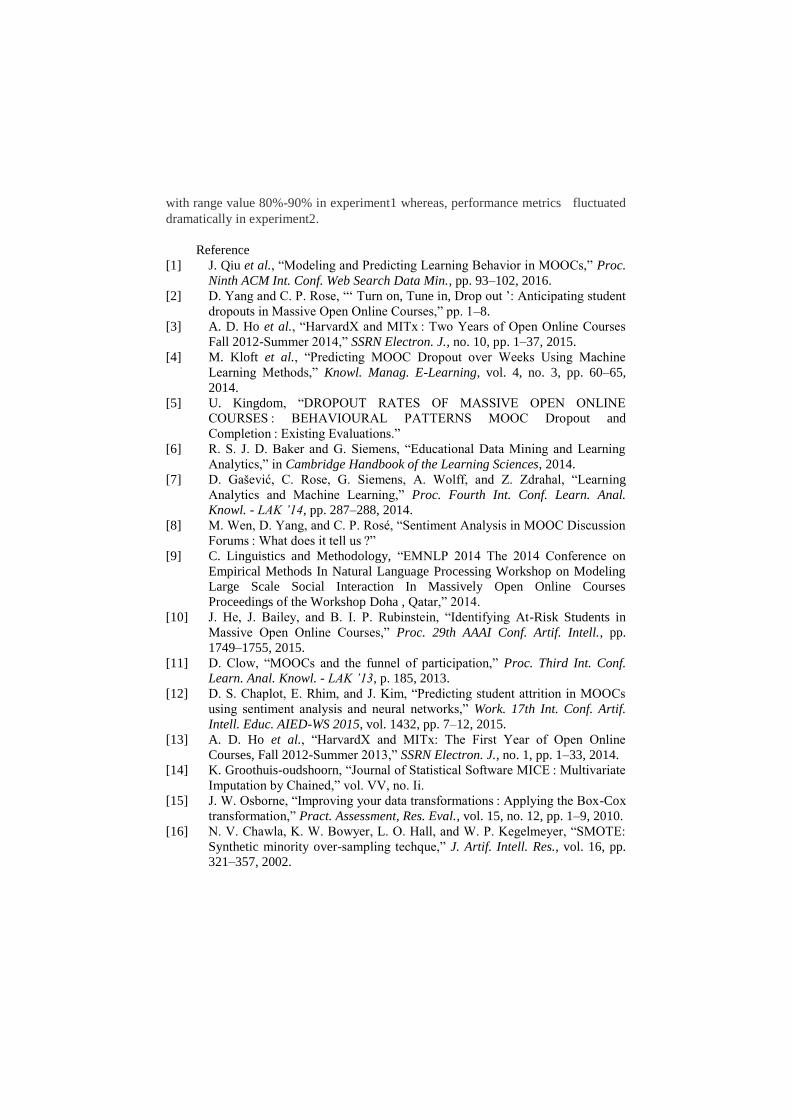
ficity in experiment 1, with a value of 69%. Receiver Operator Characteristic (ROC)
and area Under Curve (AUC) were also considered. Figures 3 and 4 show ROC re-
sults for both experiments. The curves are shown to converge to roughly the same
semblance on the plot, indicating the similarity of performance across models in ex-
periments 1 and 2, resulting in values around 90%, 80%, with the exception of the
Amdai classifier where the lowest AUC values of both experiments were obtained,
namely 76% and 78% respectively.

Table 4 Brief Description of ML Models
Model Description Architecture Type Algorithm
NN Feedforward Neural
Network
Units 14-3-2 Nonlinear
Backpropagation
treebag Bagged CART Ensemble DT using
Bagging method
Nonlinear
Random subset
Features Bootstrap
Blackboost Boosted Tree Ensemble DT using
Boosting method
Nonlinear
Classical gradient
Boosting
Amdai Adaptive Mixture
Discriminant Analysis
Generalized Linear
Model
Linear Maximum
Likelihood Estimation
GBM Gradient Bosting Method
Ensemble DT using
Boosting method
Nonlinear
Functional Gradient
Descent
bagfda Bagged Flexible
Discriminant Analysis
Ensemble FDA
Bagging method
Linear Maximum
Likelihood Estimation
avNNet Model Averaged Neural Network
E Ensemble NN
B Begging method
Nonlinear Backpropagation
Table 4. Empirical result for classification performance Experiment 1
Model Acc. Sens. Spec. Precision Recall AUC
NN 0.86
64
0.858
0
0.923
9
0.9873 0.8580 0.9408
2 treebag 0.94
64
0.948
4
0.932
4
0.9831 0.8321 0.9811
6 Blackboost 0.80
85
0.803
2
0.845
1
0.9727 0.8032 0.8970
87)
0.8970
8
Amdai 0.70
28
0.704
6
0.690
1
0.9400 0.7046 0.7655
0 GBM 0.92
25
0.923
9
0.912
7
0.9865 0.9239 0.9767
6 bagfda 0.89
57
0.909
6
0.800
0
0.9690 0.9096 0.9303
avNNet 0.86
42
0.853
5
0.938
0
0.9896 0.8535 0.9606
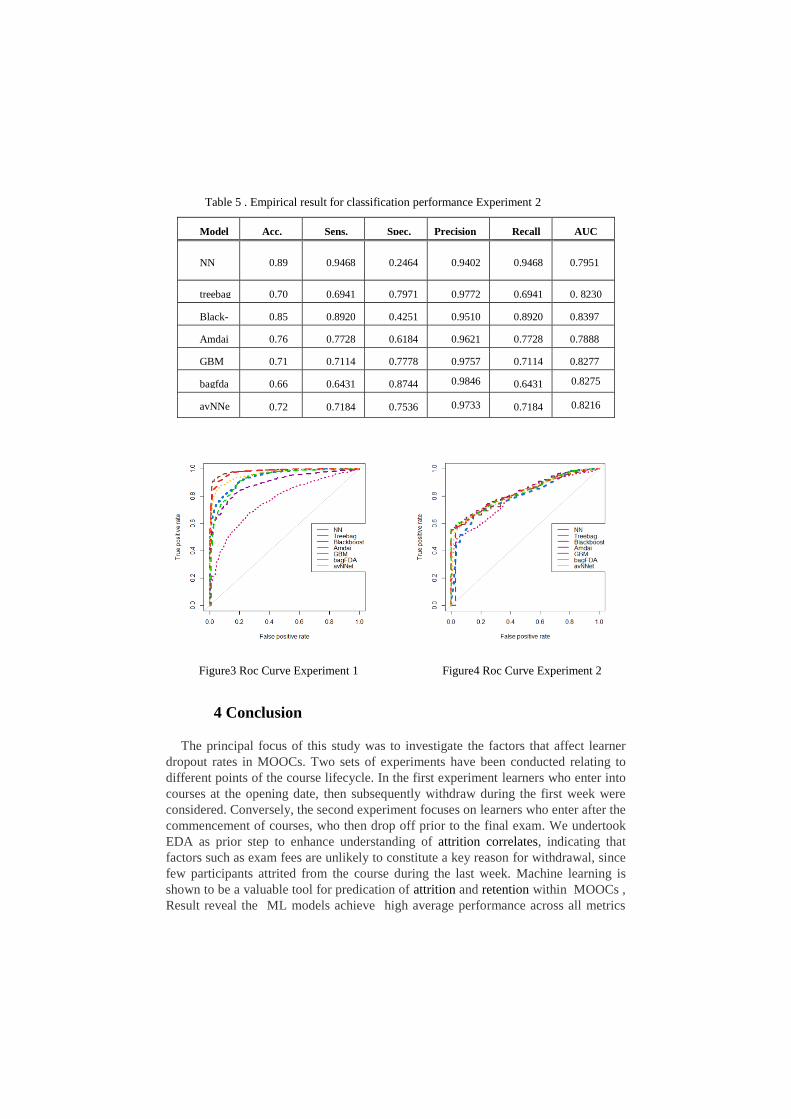
Table 5 . Empirical result for classification performance Experiment 2
Model Acc. Sens. Spec. Precision Recall AUC
NN 0.89 0.9468 0.2464 0.9402 0.9468 0.7951
treebag 0.70 0.6941 0.7971 0.9772 0.6941 0. 8230
Black-
boostst
0.85 0.8920 0.4251
0.9510 0.8920 0.8397
Amdai 0.76 0.7728 0.6184 0.9621 0.7728
0.7888
GBM 0.71 0.7114 0.7778
0.9757 0.7114
0.8277
bagfda 0.66 0.6431
0.8744 0.9846 0.6431
0.8275
avNNe
t
0.72 0.7184 0.7536 0.9733 0.7184 0.8216
Figure3 Roc Curve Experiment 1 Figure4 Roc Curve Experiment 2
4 Conclusion
The principal focus of this study was to investigate the factors that affect learner
dropout rates in MOOCs. Two sets of experiments have been conducted relating to
different points of the course lifecycle. In the first experiment learners who enter into
courses at the opening date, then subsequently withdraw during the first week were
considered. Conversely, the second experiment focuses on learners who enter after the
commencement of courses, who then drop off prior to the final exam. We undertook
EDA as prior step to enhance understanding of attrition correlates, indicating that
factors such as exam fees are unlikely to constitute a key reason for withdrawal, since
few participants attrited from the course during the last week. Machine learning is
shown to be a valuable tool for predication of attrition and retention within MOOCs ,
Result reveal the ML models achieve high average performance across all metrics
with range value 80%-90% in experiment1 whereas, performance metrics fluctuated
dramatically in experiment2.
Reference
[1] J. Qiu et al., “Modeling and Predicting Learning Behavior in MOOCs,” Proc.
Ninth ACM Int. Conf. Web Search Data Min., pp. 93–102, 2016.
[2] D. Yang and C. P. Rose, “‘ Turn on, Tune in, Drop out ’: Anticipating student
dropouts in Massive Open Online Courses,” pp. 1–8.
[3] A. D. Ho et al., “HarvardX and MITx : Two Years of Open Online Courses
Fall 2012-Summer 2014,” SSRN Electron. J., no. 10, pp. 1–37, 2015.
[4] M. Kloft et al., “Predicting MOOC Dropout over Weeks Using Machine
Learning Methods,” Knowl. Manag. E-Learning, vol. 4, no. 3, pp. 60–65,
2014.
[5] U. Kingdom, “DROPOUT RATES OF MASSIVE OPEN ONLINE
COURSES : BEHAVIOURAL PATTERNS MOOC Dropout and
Completion : Existing Evaluations.”
[6] R. S. J. D. Baker and G. Siemens, “Educational Data Mining and Learning
Analytics,” in Cambridge Handbook of the Learning Sciences, 2014.
[7] D. Gašević, C. Rose, G. Siemens, A. Wolff, and Z. Zdrahal, “Learning
Analytics and Machine Learning,” Proc. Fourth Int. Conf. Learn. Anal.
Knowl. - LAK ’14, pp. 287–288, 2014.
[8] M. Wen, D. Yang, and C. P. Rosé, “Sentiment Analysis in MOOC Discussion
Forums : What does it tell us ?”
[9] C. Linguistics and Methodology, “EMNLP 2014 The 2014 Conference on
Empirical Methods In Natural Language Processing Workshop on Modeling
Large Scale Social Interaction In Massively Open Online Courses
Proceedings of the Workshop Doha , Qatar,” 2014.
[10] J. He, J. Bailey, and B. I. P. Rubinstein, “Identifying At-Risk Students in
Massive Open Online Courses,” Proc. 29th AAAI Conf. Artif. Intell., pp.
1749–1755, 2015.
[11] D. Clow, “MOOCs and the funnel of participation,” Proc. Third Int. Conf.
Learn. Anal. Knowl. - LAK ’13, p. 185, 2013.
[12] D. S. Chaplot, E. Rhim, and J. Kim, “Predicting student attrition in MOOCs
using sentiment analysis and neural networks,” Work. 17th Int. Conf. Artif.
Intell. Educ. AIED-WS 2015, vol. 1432, pp. 7–12, 2015.
[13] A. D. Ho et al., “HarvardX and MITx: The First Year of Open Online
Courses, Fall 2012-Summer 2013,” SSRN Electron. J., no. 1, pp. 1–33, 2014.
[14] K. Groothuis-oudshoorn, “Journal of Statistical Software MICE : Multivariate
Imputation by Chained,” vol. VV, no. Ii.
[15] J. W. Osborne, “Improving your data transformations : Applying the Box-Cox
transformation,” Pract. Assessment, Res. Eval., vol. 15, no. 12, pp. 1–9, 2010.
[16] N. V. Chawla, K. W. Bowyer, L. O. Hall, and W. P. Kegelmeyer, “SMOTE:
Synthetic minority over-sampling techque,” J. Artif. Intell. Res., vol. 16, pp.
321–357, 2002.


![3. Agnus Dei [Petite Messe Boréale] - Sheet musicAgnus Dei 56 solo Bernard Dewagtere A - gnus -56 De qui lis tol ta mun Tous Tous Tous pec ca se ta di, solo mp Mi Tous mp A- gnus](https://img.pdfslide.us/doc/110x75/5f4398aeed6efe7fde3f895b/3-agnus-dei-petite-messe-borale-sheet-music-agnus-dei-56-solo-bernard-dewagtere.jpg)