Embed Size (px)
Citation preview
Towards the definition of a measurable
environmentally sustainable transport
Proceedings of Seminar
COST 356 – EST
Wednesday 20 February 2008, TOI, Oslo, Norway Institute of Transport Economics, Gaustadalléen 21, 0349 Oslo
Farideh Ramjerdi
ISBN 978-82-480-0915-3 Copyright © Institute of Transport Economics 2008
COST- the acronym for European COoperation in the field of Scientific and Technical Research- is the oldest and widest European intergovernmental network for cooperation in research. Established by the Ministerial Conference in November 1971, COST is presently used by the scientific communities of 35 European countries to cooperate in common research projects supported by national funds. The funds provided by COST - less than 1% of the total value of the projects - support the COST cooperation networks (COST Actions) through which, with EUR 30 million per year, more than 30.000 European scientists are involved in research having a total value which exceeds EUR 2 billion per year. This is the financial worth of the European added value which COST achieves. A “bottom up approach” (the initiative of launching a COST Action comes from the European scientists themselves), “à la carte participation” (only countries interested in the Action participate), “equality of access” (participation is open also to the scientific communities of countries not belonging to the European Union) and “flexible structure” (easy implementation and light management of the research initiatives) are the main characteristics of COST. As precursor of advanced multidisciplinary research COST has a very important role for the realisation of the European Research Area (ERA) anticipating and complementing the activities of the Framework Programmes, constituting a “bridge” towards the scientific communities of emerging countries, increasing the mobility of researchers across Europe and fostering the establishment of “Networks of Excellence” in many key scientific domains such as: Biomedicine and Molecular Biosciences; Food and Agriculture; Forests, their Products and Services; Materials, Physical and Nanosciences; Chemistry and Molecular Sciences and Technologies; Earth System Science and Environmental Management; Information and Communication Technologies; Transport and Urban Development; Individuals, Societies, Cultures and Health. It covers basic and more applied research and also addresses issues of pre-normative nature or of societal importance. Web: www.cost.esf.org This publication is supported by COST
The COST Office Copyright notice:1 © COST Office No permission to reproduce or utilise the contents of this book by any means is necessary, other than in the case of images, diagrams or other material from other copyright holders. In such cases, permission of the copyright holders is required. This book may be cited as: COST Action 356: Towards the definition of a measurable environmentally sustainable transport, proceedings of the Oslo seminar, 20 February 2008. The Legal notice by COST Office:1 Neither the COST Office nor any person acting on its behalf is responsible for the use which might be made of the information contained in this publication. The COST Office is not responsible for the external websites referred to in this publication.
1 Exceptions must be justified.

COST 356 seminar, Oslo, 20 February 2008
i
Table of contents
Definitions of indicator within the COST action 356 EST (Robert Joumard)
Abstract .................................................................................................................. 1 1. The COST action 356.................................................................................... 1 2. Defining indicators....................................................................................... 2 3. Conclusion and proposed definition.............................................................. 6 References.............................................................................................................. 7
Chains of causalities of environmental impacts (Robert Joumard)
Abstract .................................................................................................................. 9 1. Introduction ................................................................................................... 9 2. Precise list of environmental impacts.......................................................... 12 3. The concept of chain of causalities ............................................................. 12 4. Typology of chains of causalities................................................................ 14 5. Conclusion................................................................................................... 20 References............................................................................................................ 20
Towards an Integrated Reporting on Transport, Health and Environment: Environment and Health Indicators (Dafina Dalbokova, Sonja Kahlmeier)
Abstract ................................................................................................................ 23 Background and objectives .................................................................................. 23 Methods ............................................................................................................... 24 Results.................................................................................................................. 26
Part I: Indicator-based reporting ..................................................................... 26 Part II: Examples of integrated assessments ................................................... 35
Conclusions.......................................................................................................... 36 References............................................................................................................ 37
Noise indicators (Cristian Camusso)
Introduction.......................................................................................................... 39 2. A review of the main noise indicators ............................................................. 39 3. Remarks ........................................................................................................... 46 Conclusions.......................................................................................................... 48 References............................................................................................................ 48
Developing Composite Indicators for Policy-Making: A Brief Methodological Framework and Considerations (Michaela Saisana)
Abstract ................................................................................................................ 51 1. Introduction...................................................................................................... 51 2. Methodological framework for developing a composite indicator .................. 53 3. Interplay between composite indicators and narratives ................................... 56 4. Composite indicators for analytic purposes ..................................................... 59 5. Composite indicators and the need for multiple simulations ........................... 61 5. Final considerations ......................................................................................... 62
COST 356 seminar, Oslo, 20 February 2008
ii
Integrating indicators measuring the environmental sustainability of transportation projects, plans and policies into decision making (Farideh Ramjerdi, Patrick, Wäger, Benjamin Rousval, Luc Adolphe, Santiago Mancebo)
Introduction.......................................................................................................... 65 Sustainable development ..................................................................................... 65 Social choice theory and sustainability................................................................ 67 Welfare economics approach for aggregation ..................................................... 67 Cost benefit analysis ............................................................................................ 68 Aggregation over individuals............................................................................... 69 Aggregation over time ......................................................................................... 69 Aggregation over risk .......................................................................................... 71 Multi-criteria decision analysis and CBA............................................................ 72 A summary........................................................................................................... 74 References............................................................................................................ 75
Trade-off analysis (with a revised Rawlsian decision-making philosophy) as an alternative to cost-benefit analysis (CBA) in socio-technical decisions (Ralph P. Hall, Nicholas A. Ashford and Peter Söderbaum)
Abstract ................................................................................................................ 79 Cost-benefit analysis as a means of evaluating policies, programs, and projects 79 Alternatives to CBA............................................................................................. 84 The trade-off analysis framework........................................................................ 88 A ‘revised’ Rawlsian decision-making philosophy ............................................. 90 Q&A on the potential barriers to adopting the trade-off analysis framework and a revised rawlsian decision-making philosophy ......................... 95 Conclusion ......................................................................................................... 100 Acknowledgements............................................................................................ 101 References.......................................................................................................... 101
Using sustainable transportation performance measures in corridor decision making (Josias Zietsman and Laurence R. Rilett)
Introduction........................................................................................................ 105 Typical sustainability performance measures .................................................... 105 Methods of disaggregation................................................................................. 107 Innovative methods for collecting performance measurement data .................. 107 Automatic Vehicle Identification (AVI) ............................................................ 108
Automatic Vehicle Location (AVL) ......................................................... 108 Cellular Phone Tracking............................................................................ 108 Distance Measuring Instruments (DMI) ................................................... 109 Electronic License Plate Matching............................................................ 109 Global Positioning System (GPS) ............................................................. 109 Inductive Loop Detectors .......................................................................... 109 Video Imaging........................................................................................... 110
Application......................................................................................................... 110 Description of Test Beds ........................................................................... 110 Selection of Decision-Making Method ..................................................... 112 Defining the Problem ................................................................................ 114 Selection of Performance Measures .......................................................... 115 Determination of Criteria Weights and Values ......................................... 116 Calculating Utility Values......................................................................... 118
COST 356 seminar, Oslo, 20 February 2008
iii
Concluding remarks ........................................................................................... 121 References.......................................................................................................... 123
Does the development of sustainability indicators lead to more sustainable decision-making? A case study of the UK (Dr Greg Marsden)
Abstract .............................................................................................................. 125 Introduction........................................................................................................ 125 Are we clear what we mean by sustainability/sustainable transport? ................ 126 Are we certain how transport contributes towards these goals? ........................ 128 How do we take decisions that are consistent with this? ................................... 129 What about delivery structures?......................................................................... 132 Conclusions........................................................................................................ 137 References.......................................................................................................... 139
Assessment Of The Landscape Quality Including The Historical Heritage In Italy (Paolo Ventura)
1 Definition of landscape ............................................................................. 141 1.1 The European Convention......................................................................... 141 1.2 Ambiguity and wealth of the term “landscape” ........................................ 142 2 Landscape analysis and protection in the Italian planning system............ 148 2.1 Objects protected by the State................................................................... 149
2.1.1 Landmarks and scenic landscape........................................................ 149 2.1.2 National Parks..................................................................................... 149
2.2 Landscape plans in Regional Planning...................................................... 150 2.2.1 Landscape protection in Lombardy .................................................... 154 2.2.2 Conservation of Ancient roads and canals systems ............................ 155
2.2.3 Mitigation of the impact of industrial zones ............................................. 155 2.3 Landscape protection in town planning..................................................... 155
2.3.1 Conservation of historic town centres ................................................ 156 2.3.2 Urban landscape plans ........................................................................ 156
3 Images index ............................................................................................. 157
APPENDIX I Programme.................................................................................. 159 APPENDIX II List of participants ..................................................................... 165

COST 356 seminar, Oslo, 20 February 2008
iv

1
Definitions of indicator within the COST action 356 EST
Robert JOUMARD COST 356 chairman, INRETS, France, [email protected]
Abstract After a presentation of the objective of the COST action EST "Towards the definition of a measurable environmentally sustainable transport", the literature has been reviewed to identify some potentially relevant definitions of the term ‘indicator’, to help identify the key functions that indicators can play, and revel the extent to which context factors should be allowed to influence the definition of indicators. The review of indicator definitions considers general or generic indicator definitions, the definitions of ‘environmental’ indicators, the indicator definitions that take into account the context of sustainability, and the indicator definitions that have been proposed within the specific field of sustainable transport. A definition is proposed in conclusion. Key-words: measurement, tool, environment, impact, indicator, COST action.
There is a strong interest in promoting more sustainable transport patterns in Europe and around the globe. It has therefore become still more important to be able to measure and assess the sustainability of present and future transport trends and policies. But most transport decisions do not fully take into account the full range of the environmental impacts, and often use markers, indices and more generally tools which do not represent these impacts adequately. A correct representation of the whole range of impacts is necessary to ensure that sustainability assessment incorporates an appropriate range of environmental issues. This is especially important for the transport sector, where the impacts and the range of stakeholders are numerous and complex.
1. The COST action 356 COST 356 aims at contributing to a systemic approach in the assessment of the environmental sustainability of transportation issues by integrating and communicating existing European knowledge (see http://cost356.inrets.fr). The primary target audience is forecasting (or back-casting) analysts involved in the impact assessment of the transport system, and transport planners.
The action is concerned with how environmental impacts of transport can be measured, how measurements can be transformed to operational indicators and indices, and how indicators are used in planning and decision making. The focus of the action is on the environmental dimension of sustainability. The main
Definitions of indicator within COST 356
2
objective of the action is to identify harmonised, scientifically sound methods to build environmental indicators or indices for the assessment of transportation projects, plans and policies, and to integrate these indicators into decision-making processes by indicator selection or aggregation (e.g. multi-criteria analysis).
COST is an intergovernmental framework for European Co-operation in the field of Scientific and Technical Research, allowing the co-ordination and exchange of nationally funded research initiatives. It is open also to non-European countries and enables scientists from any country to collaborate in a wide spectrum of activities. COST is based on so-called actions. These are networks of co-ordinated national research projects in a given field. Each action is built by scientists from a bottom-up approach, and facilitates meetings and technical exchanges, usually reimbursed from the COST Action resources and encompass Management Committee meetings, working group meetings, short term scientific missions, workshops and seminars, dissemination and possible national working groups.
Scientists from 20 countries are currently participating to COST 356, which commenced on October 2005 and is scheduled to be completed by January 2010.
COST 356 is organised in four working groups, the core of the scientific work being done in WG 2 and 3. Whereas WG 2 basically adopts the environmental or natural science perspective and analyses which impacts are relevant, and how they could and should be described and measured, WG 3 identifies requirements for environmental sustainability indicators from the perspective of decision makers, and identifies methods to integrate them into decision making. An important, continuous part of the work will consist in discussing and integrating the results obtained from the application of each of these two perspectives in-between the working groups.
The action hosts a seminar that takes place at the Institute of Transport Economics (TØI) in Oslo, Norway, on February 20th 2008. There are two main objectives of the seminar:
- to present to a larger audience the work carried out so far within the COST action 356 on environmental indicators as measurement tools or decision making tools for environmentally sustainable transport
- to present significant research by other scholars in the same field, allowing the COST action to discuss and take into account the best available current thinking and results .
2. Defining indicators The literature has been reviewed to identify some official and other potentially relevant definitions of the term ‘indicator’. The detailed review is by no means complete. The role of this review of indicator definitions is not to locate one ‘correct’ definition, but to help identify the key functions that indicators can play, and revel the extent to which context factors should be allowed to influence the definition of indicators. The review of indicator definitions considers i) general,
Definitions of indicator within COST 356
3
generic or global indicator definitions from dictionaries, encyclopaedia and some significant academic contributions, ii) the definitions of ‘environmental’ indicators, iii) the indicator definitions that take into account the context of sustainability, and iv) the indicator definitions that have been proposed within the specific field of sustainable transport. A definition is proposed in conclusion.
General definitions
A. A substance (as litmus) used to show visually (as by change of colour) the condition of a solution with respect to the presence of a particular material (as a free acid or alkali) (Websters).
B. An organism or ecological community so strictly associated with particular environmental conditions that its presence is indicative of the existence of these conditions (Websters).
C. [ecology]: indicator species - a species whose presence is directly related to a particular quality in its environment at a given location (McGraw-Hill Encyclopaedia of Science & Technology).
D. [economics] Any of a group of statistical values (as level of employment) that taken together give an indication of the health of the economy (Websters).
E. [biology]: An organism that can be used to determine the concentration of a chemical in the environment. (McGraw-Hill Encyclopaedia of Science & Technology)
F. [analytical chemistry]: A substance whose physical appearance is altered at or near the end point of a chemical titration (McGraw-Hill Encyclopaedia of Science & Technology).
G. Common term to refer to the variables that we use to detect (…) concepts empirically (Bollen, 2001).
H. A variable that is directly associated with a latent variable such that differences in the values of the latent variable mirror differences in the values of the indicator (Bollen, 2001).
I. At a more concrete level, …indicators are variables (not 'values', as they are sometimes called). A variable is an operational representation of an attribute (quality, characteristic, property) of a system (Gallopin, 1996; 1997).
J. The reasoning is a multi-step one. Given a concept X. We begin by building a representation of this concept full of imagery: Here come into play knowledge, sensibility and creativity. The next step specifies the concept, giving its dimensions. During the third step, indicators of these dimensions are chosen, i.e. some observable characteristics, which show these dimensions. At the end, the weighted synthesis of these dimensions is made, giving a unique measurement, which is the index (Bourdon and Lazarfeld, 1965).
These general definitions of an indicator share many common elements. An
Definitions of indicator within COST 356
4
indicator is generally understood as a tool or a method to measure something in a way that adequately represents what is measured. Even the general definitions are often defined with respect to different measurement functions in different scientific domains (chemistry, biology, social science). In some, mostly natural science definitions, the indicator linkage can be strong (e.g. used to determine something). In other cases (social science, ecology) the linkage may be weaker, the indicator ‘indicating’ or suggesting something. In no cases an indicator is understood as a full description of something.
Environmental indicators
K. A parameter, or a value derived from parameters, which points to, provides information about, describes the state of a phenomenon/environment/area, with a significance extending beyond that directly associated with a parameter value (OECD, 2003).
L. A parameter or a value derived from parameters that describe the state of the environment and its impact on human beings, ecosystems and materials, the pressures on the environment, the driving forces and the responses steering that system. An indicator has gone through a selection and/or aggregation process to enable it to steer action (EEA, 2007).
M. A numerical value derived from actual measurements of a pressure, ambient condition, exposure, or human health or ecological condition over a specified geographic domain, whose trends over time represent or draw attention to underlying trends in the condition of the environment (USEPA, 2006).
The definitions of ‘environmental indicators’ are similar and all concern measurement of aspects of the environment itself or interactions between humans and the environment. The definitions do not deviate fundamentally from the above general definition of indicators, but provide some guidance about the content of environmental indicators. EEA mention ‘environmental impact’ as one aspect. The basic notion of representation is clearly present. According to the OECD definition the representation should go ‘beyond’ what is directly measured. This is identical with the general indicator function. But the linkage between subject and indicator can be accepted as relatively weak for environmental indicator (‘provides information about’, ‘describe’, ‘derived from’, ‘draw attention to’). Moreover the measurement aspect is slightly de-emphasised, since environmental indicators may be derived from ‘parameters’ or derived from ‘actual measurement’. EEA highlights the context of steering. USEPA highlights context as a physical time-space domain.
Sustainability indicators
N. Quantitative measures of human wellbeing, economic activity, and natural processes and conditions; they are needed to sense the degree to which human activity may be continued or expanded in the future (Lee, 2001).
Definitions of indicator within COST 356
5
O. Sustainable development indicator: A statistical measure that gives an indication on the sustainability of social, environmental and economic development (OECD, 2005).
P. “Sustainability indicators reflect the reproducibility of the way a given society utilizes its environment’’ (Opschoor & Reinders, 1991, p. 7).
All of these definitions of sustainability indicators, selected form a large literature on sustainability indicators, highlight the measurement aspect, again in overall correspondence with the general definition and its idea of representation. In this case the representation is of a complex notion namely ‘sustainability’ or ‘reproducibility or ‘the degree to which human activity may be continued or expanded.’ Hence the linkage is accepted as potentially very weak (‘reflect’, ‘give an indication’, ‘sense’).
Large parts of the same literature deals with another aspect namely the role of sustainability indicators for decision making This literature adds several other elements to what it requires for an indicator to be a adequate sustainability indicator, including being ‘meaningful’ and ‘resonant’ (motivating) for decision makers and stakeholders (Gray and Wiedemann, 1999; SCOPE, 2006; Meadows, 1996; Bossel ,1996).
Sustainable transport indicators
Q. Selected, targeted, and compressed variables that reflect public concerns and are of use to decision-makers (Gilbert et al., 2002).
R. Sustainable transportation indicators (STIs) are defined as regularly updated performance measures that help transportation planners and managers take into account the full range of economic, social and environmental impacts of their decisions” (Lee et al., 2003).
S. Forecastable quantifiable variable, usually with target value representing an objective, which symbolises environmental or other impacts of transport infrastructure plans (including ordinal scales: e.g low, medium, high): Output Indicator: an indicator that measures the direct output of the plan or programme. These indicators measure progress in achieving plan or programme objectives, targets and policies. Significant Effect Indicator: An indicator that measures the significant effects of the plan or programme. Contextual Indicator: An indicator that measures changes in the context within which a plan or programme is being prepared or implemented (COST 350, 2006).

Definitions of indicator within COST 356
6
T. Indicators are ways of quantifying objectives. For example, accident numbers would measure the overall safety objective. This type of indicator is often called an outcome indicator, in that it measures part of the outcome of a strategy. It is also possible to define input indicators, which measure what has been done (e.g. length of bus lanes implemented) and process indicators, which describe how the transport system is responding (e.g. number of bus users) (KonSULT).
U. General principles regarding indicators in any Urban Mobility system: Indicators should support decision-making capacity in particular enabling proactive action to correct the performance path of a specific element or agent whenever signs of potential underperformance are identified… (Macario, 2005)
The definitions proposed in the context of sustainable transport are, even if mixed, based on the same idea of representation as the general definition. However, the ‘something’ to be indicated and represented is much more focused on objectives, plans, policies, measures, etc to achieve sustainable transport, than on simply representing items within systems. The definitions draw the emphasis on the context of decision making from the general literature about sustainability indicators, of which it is a subdivision. It does not seem that an EST indicator is acceptable (fulfil criteria) if it does not represent information that is relevant for the performance of policies. The COST 350 is the most detailed, concise and elaborate of the definitions, but very restrictive in the sense that only ‘quantifiable, forecastable’ variable are accepted. This seems not fully justified in the COST 356 context where indicators may be equally relevant in the retrospective, as in ex post measurement. Also it is restricted to transport infrastructure, which is too narrow for COST 356.
3. Conclusion and proposed definition Above are listed three types of definitions: - a sentry, sentinel, revelation, indicating the presence or absence of something:
definitions C to F - a measurement tool: definitions F to Q - a definition by its using: definitions Q to U
The sentinel definition (absence or presence) is also a measurement tool, but a simplified one. Most of the definitions consider an indicator as a measurement tool, but some definitions add considerations about the use of such measurement tool: draw attention, quantify objectives, use by decision makers, help managers, measure progress.
The key notion is representation. An indicator has to represent something in an adequate way. At the same time it has to allow simplification compared to a full representation, other ways there is no point to an indicator. Representation necessarily involves three elements; the thing being represented; the thing
Definitions of indicator within COST 356
7
representing it (the indicator) and the usage domain (the entity for whom the representation has to be valid; acceptable)
We propose to distinguish clearly the two fields of thought: the characteristics of the measurement tools, and the characteristics of the uses. Both have to be present however, in order the indicators can be fully accepted. The measurement aspect is fundamental to any indicator, and can be one starting point. The decision context and use is essential for indicators to be used for achieving sustainability and sustainable transport. This context is a ‘filter’ for purely measurement based indicators.
In summary the following simple definitions can be proposed:
An indicator is a variable, based on measurements, representing as accurately as possible and necessary a phenomenon of interest to human beings.
An environmental impact indicator is a variable based on measurements, representing an impact of human activity on the environment, as accurately as possible and necessary.
An indicator of environmentally sustainable transport is a variable, based on measurements, representing potential or actual impacts on the environment, or factors that may cause such impacts, due to transport systems, flows or policies, as accurately as possible and necessary.
References Bollen, K.A (2001). Indicators: Methodology. International Encyclopedia of the
Social & Behavioural Sciences. Elsevier, Amsterdam, The Netherlands. Bossel, H. (1996). Deriving indicators of sustainable development. Environmental
modelling and assessment 1, pp 193-218. Bourdon, R. & Lazarfeld, R. (1965). Le vocabulaire des sciences sociales
(Lexicon of social sciences), Mouton, Paris. COST 350 (2006). Integrated Assessment of Environmental Impact of Traffic
And Transport Infrastructure, Part C: Glossary, 4 p. EEA Glossary (cited; February 2007) URL: http://glossary.eea.europa.eu/EEAGlossary/search_html Gilbert, R; Irwin, N; Hollingworth, B & Blais, Pamela (2002) . Sustainable
Transportation. Performance Indicators (STPI). Project Report On Phase 3. The Centre for Sustainable Transportation, Toronto. December 31, 2002 URL: http://www.cstctd.org/CSThomepage.htm [Cited 26 August 2003]
Gallopin, Gilberto Carlos (1996). Environmental and sustainability indicators and the concept of situational indicators. A systems approach. Environmental Modeling and Assessment 1 (1996) 101-117.
Gallopin, Gilberto Carlos (1997). Indicators and Their Use: Information for Decision Making. Introduction. pp 13-27 in: Moldan, B & Billharz, S. :
Definitions of indicator within COST 356
8
Sustainability Indicators. Report on the project on Indicators of Sustainable Development. Wiley, Chichester 1997.
Gray, P. C. R .; Wiedemann, P. M. (1999). Risk management and sustainable development: mutual lessons from approaches to the use of indicators Journal of Risk Research 2 (3), 201–218.
KonSULT, the Knowledgebase on Sustainable Urban Land use and Transport.- Glossary. http://www.socscinet.com/transport/konsult/public/level1/l1_gloss.htm#a
Lee, K.N (2001). International Encyclopaedia of the Social & Behavioural Sciences. Elsevier, Amsterdam, The Netherlands.
Lee Richard W., Wack, Paul & Jud, Eugene (2003). Toward Sustainable Transportation Indicators for California. MTI REPORT 02-05 Mineta Transportation Institute, San José State University, San Jose, Ca. August 2003.
Macario, Maria do Rosário Maurício Ribeiro (2005). Quality management in urban mobility systems: an integrated approach. Dissertação para obtenção do Grau de Doutor em Transportes, Universidade Técnica de Lisboa Instituto Superior Técnico, Lissabon.
Meadows, Donella (1996). Indicators and Information Systems for Sustainable Development. A Report to the Balaton Group. The Sustainability Institute, Hartford, VT.
OECD (2003). Environmental Indicators – Development, Measurement and Use. Reference paper, OECD, Paris.
OECD (2005). Glossary of Statistical Terms. OECD Statistics Portal. [Created July 06, 2005; Last updated July 19, 2005] URL: http://stats.oecd.org/glossary/index.htm
Opschoor, Hans & Reijnders, Lucas (1991). Towards sustainable development indicators. pp. 7-27 in: Kuik, H. & Verbruggen. O. (eds.): In search of indicators of sustainable development. Kluwer, Dordrecht.
SCOPE (2006). Indicators if sustainability. Reliable tools for decision making. UNESCO – SCOPE Policy Briefs No 1, May 2006.
US EPA (2006). Report of the 2005 peer review of proposed indicators for the U.S. Environmental Protection Agency’s Report On the Environment 2007 (ROE07) technical document. FINAL REPORT January 4, 2006. URL: http://www.epa.gov/ncea/ROEIndicators/prcomments/pdfs/1.cover-and-introduction.pdf

9
Chains of causalities of environmental impacts
Robert Joumard1, Santiago Mancebo Quintana2, Gerassimos Arapis3 & Tomasz Zacharz4
1 Inrets, France, [email protected] 2 Univ. Politécnica de Madrid, Spain
3 Agricultural Univ. of Athens, Greece
4 Komag, Poland
Abstract
In order to prepare an encompassing ex-ante assessment of the impacts of the transport system on the environment by building impact indicators, the pressure-state-impact concept is widen into the concept of chain of causalities or process. A process is defined by an output of the transport system, a homogeneous series of physical, chemical, biological, psychological relationships between elements, and a final target. All the known today impacts of the transport system on the environment are described as a list of 43 chains of causalities. The knowledge of the relationships will be used to design indicators or to know what does and not does measure a given indicator.
Key-words: environmental impact, classification, process, chain of causalities, transport.
1. Introduction
To build tools for assessing the impacts on the environment of a transport system or sub-system asks for a definition of the impacts on the environment, defined by final targets and modifications of target. For instance, the final targets of the traffic safety are mainly the humans with death and injuries. To assess each impact, the best way should be to measure the impact itself, by counting or evaluating for instance the number of people injured or dead because the traffic system. But such counting can't be made only ex-post and does not give any indication on the causes of the impact, because the impact cannot be linked by a one-to-one relationship with the accidents: the accidents are not the only causality of human death and injuries: local air pollution, greenhouse effect, hazards, among others cause death and injuries. The account of death and injuries due to the accident needs to take into account the process of accident. It is especially easy in the field of traffic safety, much more complex for most of the impacts.
For an evaluation ex-ante or for looking for the causes of an ex-post evaluation, a clear and precise relationship has to be established with the transport system. Each process, each chain of causalities from the source to each final impact on the
Chains of causalities of environmental impacts
10
environment has to be described in detail: in terms of sources, intermediate and final targets, mechanisms between intermediate sources and intermediate targets. Such description allows us also to express clearly what a potential indicator measures and does not measure, and on which scientific mechanisms an indicator should be based. For instance the global warming potential evaluates the global temperature increase and not really the final impacts of greenhouse effect as sea level increase, the amount of fauna, flora and human habitat destruction, the food chain changes... The knowledge of the physical mechanism of the climate and temperature modifications as a function of greenhouse gas emissions allows to build the shape of the indicator 'global warming potential'.
At the same time, the description of the chains of causalities allows us to define quite precisely the term 'environment': What are the impacts on the environment? What are their characteristics or typical features?
The most common presentation of the environment, especially by economists, considers it as a resource used by the humans for producing economic goods. This resource is an ecosystem, i.e. the association between a physicochemical and abiotic (the biotope) environment and a living community characteristic of the latter (the biocenosis), including fossil resources. This resource is destroyed but can be renewed at a given extend: the environmental issue is a question of resource flow and capacity of the biosphere to support the effects of the human activities (carrying capacity): It calls the 7th principle of the Rio declaration (UNCED, 1992): "...to conserve, protect and restore [...] the integrity of the Earth's ecosystem [...] the pressures their societies place on the global environment". The pressure-state-impact (PSI) system from OECD seems well applicable to this meaning with a pressure representing a flow.
In parallel, the environment is often understood as the quality of our physical environment or the quality of life: a calm area with pure air and pure water, a beautiful landscape... It calls the first principle of the Rio declaration: "Human beings [...] are entitled to a healthy and productive life in harmony with nature". It is here often difficult to consider only flows or pressures.
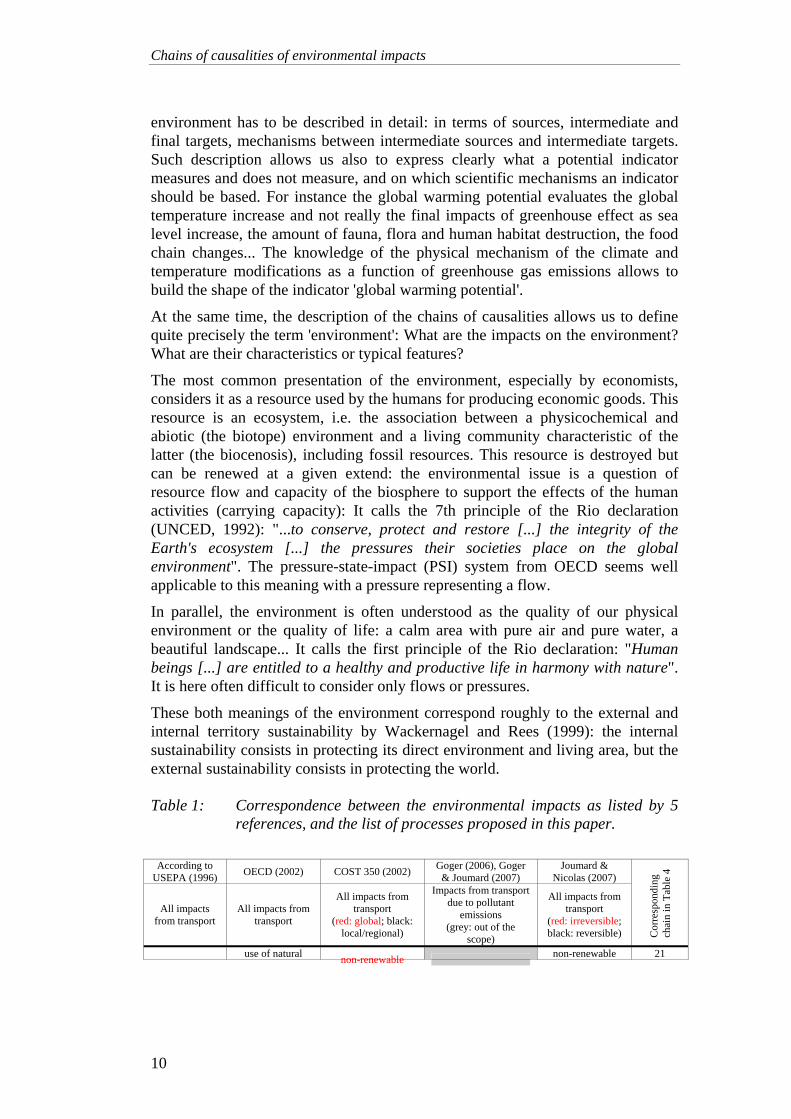
These both meanings of the environment correspond roughly to the external and internal territory sustainability by Wackernagel and Rees (1999): the internal sustainability consists in protecting its direct environment and living area, but the external sustainability consists in protecting the world. Table 1: Correspondence between the environmental impacts as listed by 5
references, and the list of processes proposed in this paper.
According to
USEPA (1996) OECD (2002) COST 350 (2002) Goger (2006), Goger & Joumard (2007)
Joumard & Nicolas (2007)
All impacts from transport
All impacts from transport
All impacts from transport
(red: global; black: local/regional)
Impacts from transport due to pollutant
emissions (grey: out of the
scope)
All impacts from transport
(red: irreversible; black: reversible) C
orre
spon
ding
ch
ain
in T
able
4
use of natural non-renewable non-renewable 21

Chains of causalities of environmental impacts
11
energy consumpt.
resources use of material
resources resource use,
including energy
climate change climate change Greenhouse effect greenhouse effect 42 ozone depletion Ozone depletion 15, 16
Direct restricted health effects 4
Direct ecotoxicity local air quality
3 air quality air pollution Photochemical
pollution regional air
quality (smog) 17, 18, 19, 20
pollutant emissions
Eutrophication 5 highway and airport runoff
toxic release sewage
dumping
water quality water pollution
24, 25, 26
water quality / uses and régime
8 release of deicing
compounds
soil pollution
24, 25, 26
waste 23 direct waste
from vehicles waste production 34
41
noise noise noise
nuisance/vibration 29, 30, 31
light and noise nuisances 14
traffic accidents traffic safety 22 roadkill, wildlife
collisions 35
severance barrier effects / land fragmentation 6, 7 Habitat
disruption and land take by
infrastructure land uptake landuse
9, 11
soil erosion
hydrologic/hydraulic risks 27
37 visual impacts Sensitive pollution 38, 39
visual qualities of landscape/townsca
pe 40
Degradation of
common man-made heritage
2, 12, 27
landscape / visual effects / aesthetics /
cultural heritage Degradation of historic
man-made heritage
man-made heritage
12
historical / archaeological /
nature conservation
9, 10, 13
loss of biodiversity (Direct ecotoxicity)
biodiversity and protected areas
acidification Acidification 1, 2
hazardeous material incident
technological and
natural hazards 28
introduction of non-native
species 32
habitat disruption by
wakes / anchors 33
36 43
Chains of causalities of environmental impacts
12
2. Precise list of environmental impacts Such definitions are much too global and rough to be useful for describing the
environmental issue or the impact on the environment of a human activity as the transport system, and for designing environmental impact indicators. An exhaustive list of the chains of causalities is necessary to present a full picture. But the definition of the environmental or ecological impacts is neither clear nor precise in the literature. When lists of environmental impacts are given, they are often heterogeneous, merging impacts and sources: See some examples
Table 1. For instance USEPA (1996) lists mainly the pressures or the first consequences of the transport system on the environment rather than environmental impacts (although designed as impacts). The use of natural resources, the hydrologic and hydraulic risks, the traffic safety and the final impacts as sensitive pollution are missing; A contrario rarely mentioned impacts are listed as introduction of non-native species, habitat disruption by wakes or anchors, direct waste from vehicles, roadkill and wildlife collisions. The other references examined merge impacts on the environment as climate change or visual effects, and intermediate states of the environment as local air quality, water quality. Goger (2006) and Goger & Joumard (2007) give the most precise list but only due to atmospheric pollutant emissions: In this field, impacts are distinguished when they are due to different chains of causalities, taking into account the fact that, as stated in Wäger (2006), the impact categories shall together enable an encompassing assessment of relevant impacts, which are known today (completeness), but at the same time should have the least overlap as possible (independence).
3. The concept of chain of causalities
It is the reason why we prefer to enlarge the PSI picture to the concept of process or chain of causalities between a cause and a final impact, with possibly a succession of couples cause-impact. A good example is the greenhouse effect with the greenhouse gases (GHG) as a first cause, which by physical phenomenon increases the earth temperature, which modifies the global and local climates, with impacts on the agriculture, sea level, with impacts on all the biocenosis including the humans. If an initial pressure can be easily detected (GHG emissions), they are afterwards a lot of intermediate states and impacts. Another advantage of the concept of process or chain of causalities is to be much wider than a physical flow problem: any process can be taken into account, as cultural, psychological, psycho-physical, or biological effect.
A chain of causalities can be described through:
Chains of causalities of environmental impacts
13
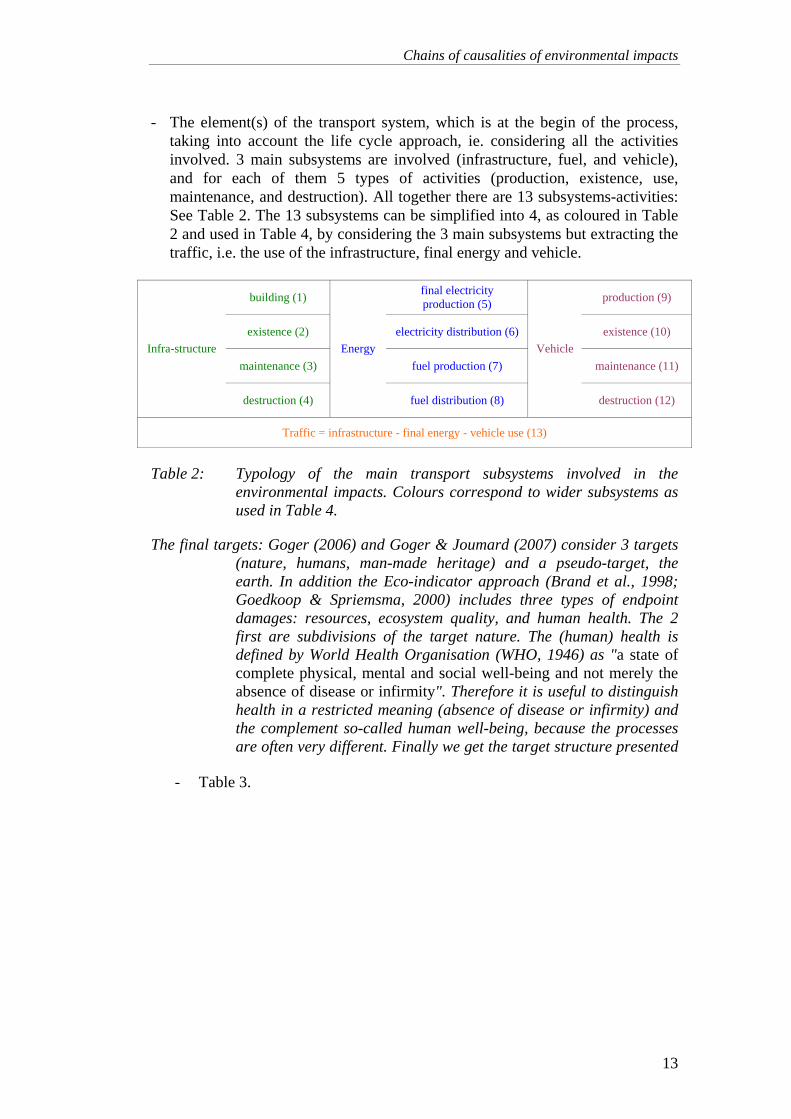
- The element(s) of the transport system, which is at the begin of the process, taking into account the life cycle approach, ie. considering all the activities involved. 3 main subsystems are involved (infrastructure, fuel, and vehicle), and for each of them 5 types of activities (production, existence, use, maintenance, and destruction). All together there are 13 subsystems-activities: See Table 2. The 13 subsystems can be simplified into 4, as coloured in Table 2 and used in Table 4, by considering the 3 main subsystems but extracting the traffic, i.e. the use of the infrastructure, final energy and vehicle.
building (1) final electricity
production (5) production (9)
existence (2) electricity distribution (6) existence (10)
maintenance (3) fuel production (7) maintenance (11) Infra-structure
destruction (4)
Energy
fuel distribution (8)
Vehicle
destruction (12)
Traffic = infrastructure - final energy - vehicle use (13)
Table 2: Typology of the main transport subsystems involved in the environmental impacts. Colours correspond to wider subsystems as used in Table 4.
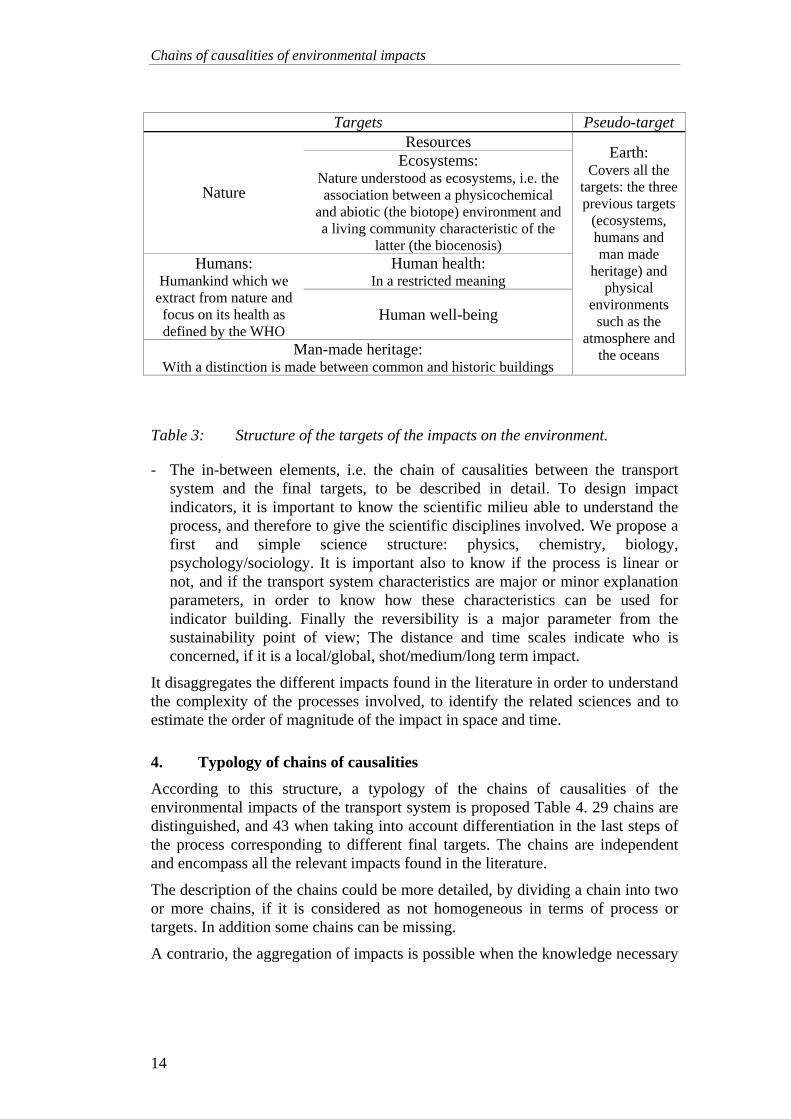
The final targets: Goger (2006) and Goger & Joumard (2007) consider 3 targets (nature, humans, man-made heritage) and a pseudo-target, the earth. In addition the Eco-indicator approach (Brand et al., 1998; Goedkoop & Spriemsma, 2000) includes three types of endpoint damages: resources, ecosystem quality, and human health. The 2 first are subdivisions of the target nature. The (human) health is defined by World Health Organisation (WHO, 1946) as "a state of complete physical, mental and social well-being and not merely the absence of disease or infirmity". Therefore it is useful to distinguish health in a restricted meaning (absence of disease or infirmity) and the complement so-called human well-being, because the processes are often very different. Finally we get the target structure presented
- Table 3.
Chains of causalities of environmental impacts
14
Targets Pseudo-target Resources
Nature
Ecosystems: Nature understood as ecosystems, i.e. the association between a physicochemical
and abiotic (the biotope) environment and a living community characteristic of the
latter (the biocenosis) Human health:
In a restricted meaning Humans:
Humankind which we extract from nature and focus on its health as defined by the WHO
Human well-being
Man-made heritage: With a distinction is made between common and historic buildings
Earth: Covers all the
targets: the three previous targets
(ecosystems, humans and man made
heritage) and physical
environments such as the
atmosphere and the oceans
Table 3: Structure of the targets of the impacts on the environment.
- The in-between elements, i.e. the chain of causalities between the transport system and the final targets, to be described in detail. To design impact indicators, it is important to know the scientific milieu able to understand the process, and therefore to give the scientific disciplines involved. We propose a first and simple science structure: physics, chemistry, biology, psychology/sociology. It is important also to know if the process is linear or not, and if the transport system characteristics are major or minor explanation parameters, in order to know how these characteristics can be used for indicator building. Finally the reversibility is a major parameter from the sustainability point of view; The distance and time scales indicate who is concerned, if it is a local/global, shot/medium/long term impact.
It disaggregates the different impacts found in the literature in order to understand the complexity of the processes involved, to identify the related sciences and to estimate the order of magnitude of the impact in space and time.
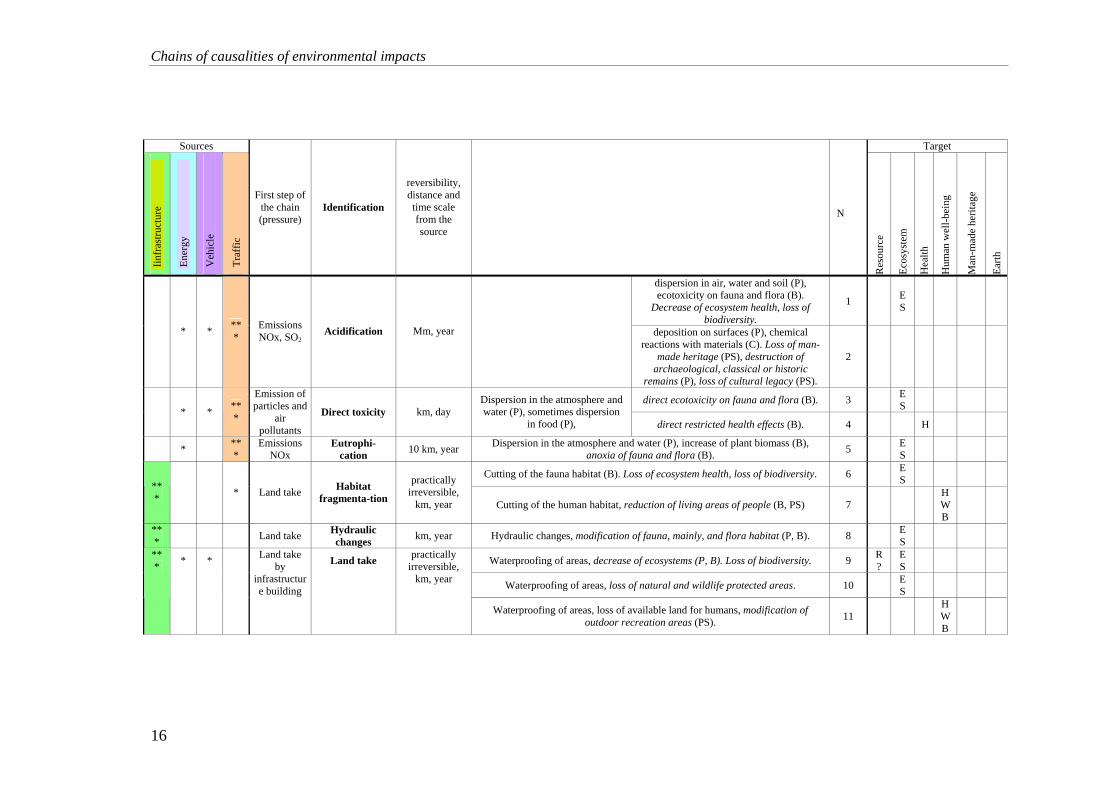
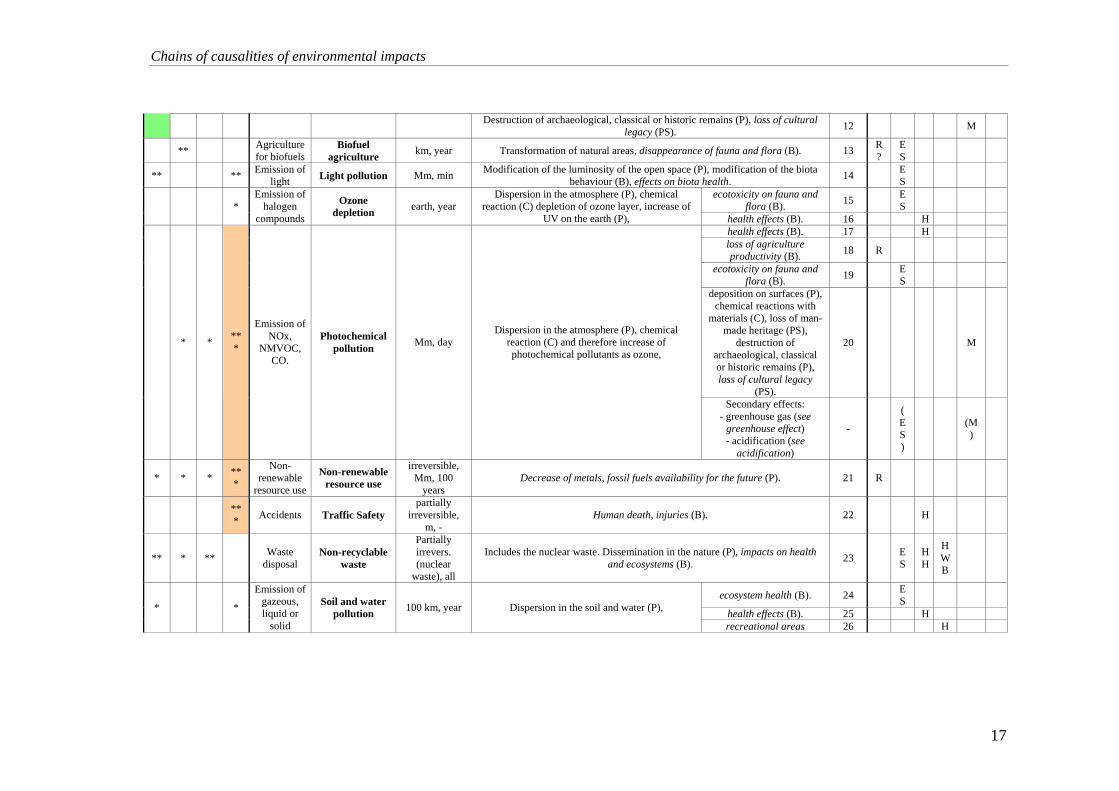
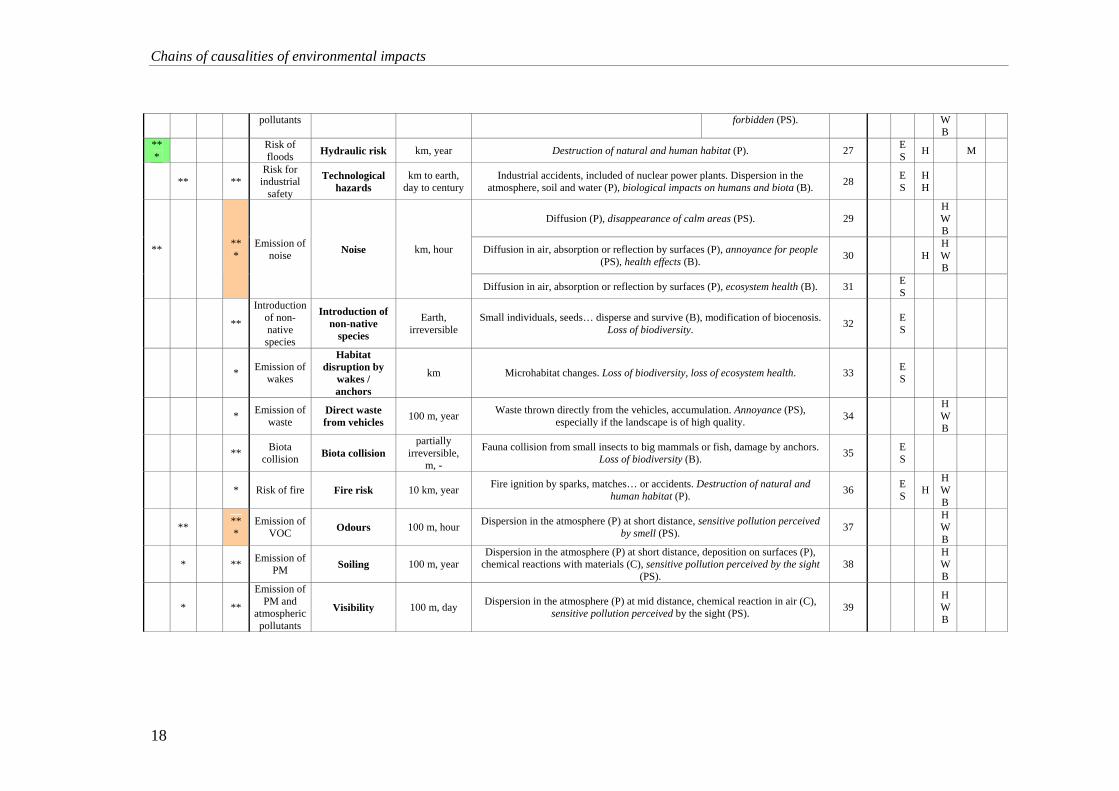
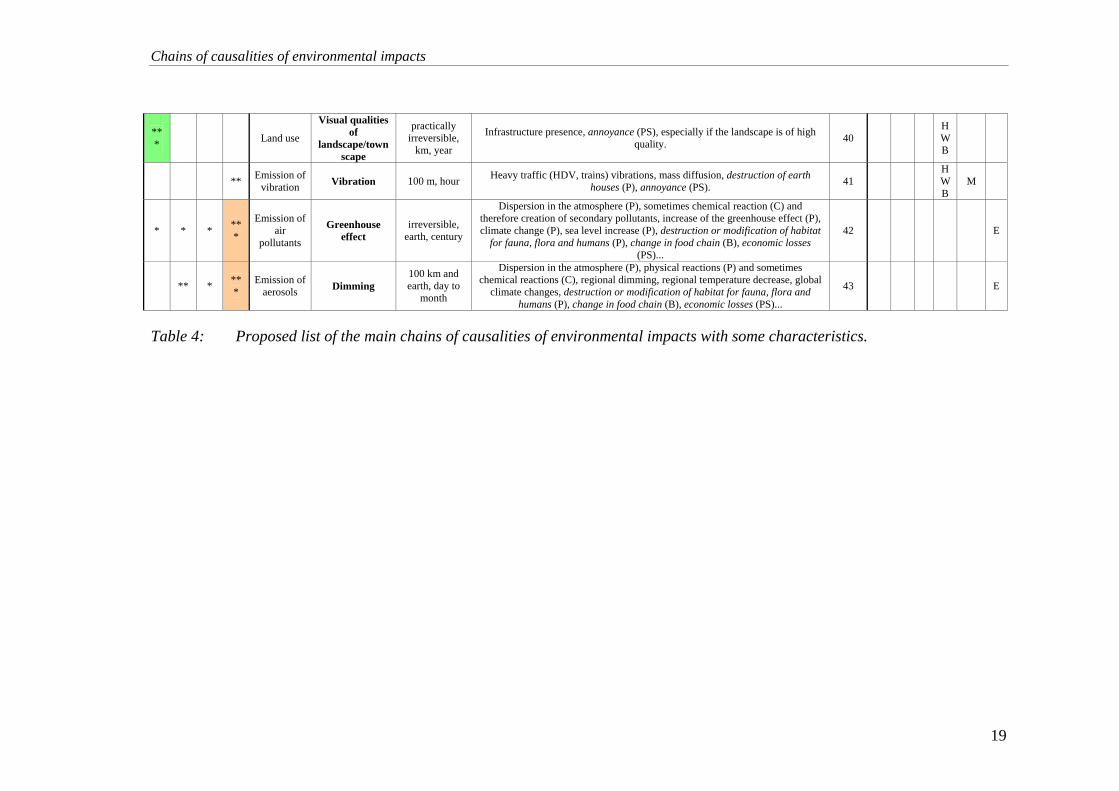
4. Typology of chains of causalities
According to this structure, a typology of the chains of causalities of the environmental impacts of the transport system is proposed Table 4. 29 chains are distinguished, and 43 when taking into account differentiation in the last steps of the process corresponding to different final targets. The chains are independent and encompass all the relevant impacts found in the literature.
The description of the chains could be more detailed, by dividing a chain into two or more chains, if it is considered as not homogeneous in terms of process or targets. In addition some chains can be missing.
A contrario, the aggregation of impacts is possible when the knowledge necessary

Chains of causalities of environmental impacts
15
to build impact indicators is similar and if the main characteristics of the chain are similar. As, to be practical, the number of categories should amount to a not too high number, and considering the importance of each impact and the availability of indicators, some impacts could be merged, or minor chains be deleted. Because it is important to give the possibility to further users to perform such simplifications, the chain structure has to be as detailed as possible: It is easier to merge and delete than to add processes.
Chains of causalities of environmental impacts
16
Sources Target
Iinfr
astru
ctur
e
Ener
gy
Veh
icle
Traf
fic
First step of the chain (pressure)
Identification
reversibility, distance and time scale from the source
N
Res
ourc
e
Ecos
yste
m
Hea
lth
Hum
an w
ell-b
eing
Man
-mad
e he
ritag
e
Earth
dispersion in air, water and soil (P), ecotoxicity on fauna and flora (B).
Decrease of ecosystem health, loss of biodiversity.
1 ES
* * ***
Emissions NOx, SO2
Acidification Mm, year deposition on surfaces (P), chemical reactions with materials (C). Loss of man-
made heritage (PS), destruction of archaeological, classical or historic
remains (P), loss of cultural legacy (PS).
2
direct ecotoxicity on fauna and flora (B). 3 ES
* * ***
Emission of particles and
air pollutants
Direct toxicity km, day Dispersion in the atmosphere and water (P), sometimes dispersion
in food (P), direct restricted health effects (B). 4 H
* ***
Emissions NOx
Eutrophi-cation 10 km, year Dispersion in the atmosphere and water (P), increase of plant biomass (B),
anoxia of fauna and flora (B). 5 ES
Cutting of the fauna habitat (B). Loss of ecosystem health, loss of biodiversity. 6 ES
*** * Land take Habitat
fragmenta-tion
practically irreversible,
km, year Cutting of the human habitat, reduction of living areas of people (B, PS) 7 HWB
*** Land take Hydraulic
changes km, year Hydraulic changes, modification of fauna, mainly, and flora habitat (P, B). 8 ES
Waterproofing of areas, decrease of ecosystems (P, B). Loss of biodiversity. 9 R?
ES
Waterproofing of areas, loss of natural and wildlife protected areas. 10 ES
*** * * Land take
by infrastructure building
Land take practically irreversible,
km, year
Waterproofing of areas, loss of available land for humans, modification of outdoor recreation areas (PS). 11
HWB
Chains of causalities of environmental impacts
17
Destruction of archaeological, classical or historic remains (P), loss of cultural legacy (PS). 12 M
** Agriculture for biofuels
Biofuel agriculture km, year Transformation of natural areas, disappearance of fauna and flora (B). 13 R
? ES
** ** Emission of light Light pollution Mm, min Modification of the luminosity of the open space (P), modification of the biota
behaviour (B), effects on biota health. 14 ES
ecotoxicity on fauna and flora (B). 15 E
S * Emission of
halogen compounds
Ozone depletion earth, year
Dispersion in the atmosphere (P), chemical reaction (C) depletion of ozone layer, increase of
UV on the earth (P), health effects (B). 16 H health effects (B). 17 H loss of agriculture productivity (B). 18 R
ecotoxicity on fauna and flora (B). 19 E
S
deposition on surfaces (P), chemical reactions with
materials (C), loss of man-made heritage (PS),
destruction of archaeological, classical or historic remains (P), loss of cultural legacy
(PS).
20 M * * ***
Emission of NOx,
NMVOC, CO.
Photochemical pollution Mm, day
Dispersion in the atmosphere (P), chemical reaction (C) and therefore increase of photochemical pollutants as ozone,
Secondary effects: - greenhouse gas (see
greenhouse effect) - acidification (see
acidification)
-
(ES)
(M)
* * * ***
Non-renewable
resource use
Non-renewable resource use
irreversible, Mm, 100
years Decrease of metals, fossil fuels availability for the future (P). 21 R
*** Accidents Traffic Safety
partially irreversible,
m, - Human death, injuries (B). 22 H
** * ** Waste disposal
Non-recyclable waste
Partially irrevers. (nuclear
waste), all
Includes the nuclear waste. Dissemination in the nature (P), impacts on health and ecosystems (B). 23 E
S HH
HWB
ecosystem health (B). 24 ES
health effects (B). 25 H * *
Emission of gazeous, liquid or
solid
Soil and water pollution 100 km, year Dispersion in the soil and water (P),
recreational areas 26 H
Chains of causalities of environmental impacts
18
pollutants forbidden (PS). WB
*** Risk of
floods Hydraulic risk km, year Destruction of natural and human habitat (P). 27 ES H M
** ** Risk for
industrial safety
Technological hazards
km to earth, day to century
Industrial accidents, included of nuclear power plants. Dispersion in the atmosphere, soil and water (P), biological impacts on humans and biota (B). 28 E
S HH
Diffusion (P), disappearance of calm areas (PS). 29 HWB
Diffusion in air, absorption or reflection by surfaces (P), annoyance for people (PS), health effects (B). 30 H
HWB
** ***
Emission of noise Noise km, hour
Diffusion in air, absorption or reflection by surfaces (P), ecosystem health (B). 31 ES
**
Introduction of non-native species
Introduction of non-native
species
Earth, irreversible
Small individuals, seeds… disperse and survive (B), modification of biocenosis. Loss of biodiversity. 32 E
S
* Emission of wakes
Habitat disruption by
wakes / anchors
km Microhabitat changes. Loss of biodiversity, loss of ecosystem health. 33 ES
* Emission of waste
Direct waste from vehicles 100 m, year Waste thrown directly from the vehicles, accumulation. Annoyance (PS),
especially if the landscape is of high quality. 34 HWB
** Biota collision Biota collision
partially irreversible,
m, -
Fauna collision from small insects to big mammals or fish, damage by anchors. Loss of biodiversity (B). 35 E
S
* Risk of fire Fire risk 10 km, year Fire ignition by sparks, matches… or accidents. Destruction of natural and human habitat (P). 36 E
S HHWB
** ***
Emission of VOC Odours 100 m, hour Dispersion in the atmosphere (P) at short distance, sensitive pollution perceived
by smell (PS). 37 HWB
* ** Emission of PM Soiling 100 m, year
Dispersion in the atmosphere (P) at short distance, deposition on surfaces (P), chemical reactions with materials (C), sensitive pollution perceived by the sight
(PS). 38
HWB
* **
Emission of PM and
atmospheric pollutants
Visibility 100 m, day Dispersion in the atmosphere (P) at mid distance, chemical reaction in air (C), sensitive pollution perceived by the sight (PS). 39
HWB
Chains of causalities of environmental impacts
19
*** Land use
Visual qualities of
landscape/townscape
practically irreversible,
km, year
Infrastructure presence, annoyance (PS), especially if the landscape is of high quality. 40
HWB
** Emission of vibration Vibration 100 m, hour Heavy traffic (HDV, trains) vibrations, mass diffusion, destruction of earth
houses (P), annoyance (PS). 41 HWB
M
* * * ***
Emission of air
pollutants
Greenhouse effect
irreversible, earth, century
Dispersion in the atmosphere (P), sometimes chemical reaction (C) and therefore creation of secondary pollutants, increase of the greenhouse effect (P), climate change (P), sea level increase (P), destruction or modification of habitat
for fauna, flora and humans (P), change in food chain (B), economic losses (PS)...
42 E
** * ***
Emission of aerosols Dimming
100 km and earth, day to
month
Dispersion in the atmosphere (P), physical reactions (P) and sometimes chemical reactions (C), regional dimming, regional temperature decrease, global
climate changes, destruction or modification of habitat for fauna, flora and humans (P), change in food chain (B), economic losses (PS)...
43 E
Table 4: Proposed list of the main chains of causalities of environmental impacts with some characteristics.
Chains of causalities of environmental impacts
20
5. Conclusion
To describe the environmental impacts of an activity as transport through a complete list of independent chains of causalities allows us firstly to give a precise definition of the term 'environment'. In the literature, the differences in the impacts considered translate often the research area of the author, and, when the work is more global, the local perception of the environmental or ecological issue. For instance the loss of visibility above the cities, due to air pollution, is always cited in North America, but never in Europe, although the physical situations are similar. It is especially important to define the term environment, when today the environmental issue is taken into account by most of the transport specialists without precise knowledge of this field: In this case the environmental issue is very often reduced to greenhouse gases or to few well known impacts, or are reduced unconsciously to impacts for which simple to use assessment tools are available.
According to COST 356 (Joumard, 2008), an indicator of environmentally sustainable transport is a variable, based on measurements, representing potential or actual impacts on the environment, or factors that may cause such impacts, due to transport systems, flows or policies, as accurately as possible and necessary. The precise description of the environmental processes constitutes then a powerful tool for indicator assessment, similar to that done by USEPA (1996). A priori, it can be stated that the more to the right the indicator is, the more precise the final impact is. It is mainly a tool to define what precisely an indicator does represent: Does it represent the final impact, or an intermediate one? How accurately is the process translated into the indicator function? Which relevant impacts are not taken into account by existing indicators? Isn't it possible double counting?
When the aim is to design new indicators of environmentally sustainable transport, the knowledge of the process indicates which scientists should be asked about the best way to represent the impact. It is also a comprehensive basis to study the social perception of the environmental issue by survey, whom outputs can be used to balance the quality of local air, of regional air, noise, greenhouse effect… according to the focus placed on each of these impacts, as made for the Personal Security Index designed by the Canadian Council on Social Development: See Tsoukalas & MacKenzie, 2003).
References Brand G., Braunschweig A., Scheidegger A. & Schwank O. (1998): Weighting in
Ecobalances with the ecoscarcity method – Ecofactors 1997. BUWAL (SAFEL) Environment Series, No. 297, Bern. www.e2mc.com/BUWAL297%20english.pdf

Chains of causalities of environmental impacts
21
COST 350 (2002): Integrated Assessment of Environmental Impact of Traffic and Transport Infrastructure, executive summary of final deliverable of Workin Group 1. 7 p. /www.rws.nl/rws/dww/home/cost350/
Goedkoop M. & Spriemsma R. (2000): The Eco-Indicator 99: A damage oriented method for Life Cycle Impact Assessment. Methodology report. 2nd Edition, 214 p. www.pre.nl/eco-indicator99/ei99-reports.htm
Goger T. (2006) : Un indicateur d'impact environnemental global des polluants atmosphériques émis par les transports. Thèse, Insa Lyon, 28 nov. 2006, et rapport Inrets, n°LTE 0633, Bron, France, 283 p.
Goger T. & Joumard R. (2007) : A method of building an aggregated indicator of air-pollution impacts. 3rd int. conf. Sustainable development 2007, 25-27 April 2007, Algarve, Portugal.
Joumard R. (2008): Definitions of indicator within the COST action 356 EST. Seminar COST 356 EST "Towards the definition of a measurable environmentally sustainable transport", 20 February 2008, Oslo, Norway.
Joumard R. & Nicolas J.P. (2007) : Méthodologie d'évaluation de projets de transport dans le cadre du développement durable. 12e coll. int. Évaluation environnementale et transports : concepts, outils et méthodes, 18-22 juin 2007, Genève, Suisse.
OECD (2002): Impact of Transport Infrastructure Investment on Regional Development. http://www.cemt.org/pub/pubpdf/JTRC/02RTRinvestE.pdf
Tsoukalas S. & MacKenzie A. (2003): Personal Security Index 2003: A reflection of how Canadians feel five years later.CCSD, Ottawa, 87 p. www.ccsd.ca/pubs/2003/psi/
UNCED (1992): Rio Declaration on Environment and Development. 3 p. www.unep.org/Documents.Multilingual/Default.asp?DocumentID=78&ArticleID=1163
USEPA (1996): Indicators of environmental impacts of transportation - Highway, Rail, aviation and maritime transport. USEPA report, 230-R-96-009, Washington, USA, 268 p.
Wackernagel M. & Rees W. (1999): Notre empreinte écologique, Ecosociété, Paris, 207 p.
Wäger P. (2006): Life Cycle Assessment – a short overview. COST356 WG1 meeting, Madrid, 18-19 October.
WHO (1946): Preamble to the Constitution of the World Health Organization as adopted by the International Health Conference, New York, 19-22 June, 1946; signed on 22 July 1946 by the representatives of 61 States (Official Records of the World Health Organization, no. 2, p. 100) and entered into force on 7 April 1948.

Chains of causalities of environmental impacts
22
23
Towards an Integrated Reporting on Transport, Health and Environment: Environment and Health Indicators Dafina Dalbokova, Sonja Kahlmeier World Health Organization Regional Office for Europe European Centre for Environment and Health Disclaimer: The views expressed by the authors do not necessarily represent the decisions or the stated policy of the World Health Organization or of the European Commission.
ABSTRACT Integrated reporting on transport, health and environment is exemplified using ENHIS - the European Environment and Health Information System developed through a joint effort of the Member States, the European Commission and the WHO Regional Office for Europe in the framework of the Environment and Health in Europe process. The system is based on a set of EH indicators and uses health impact assessment methods with a focus on priority issues identified by the Children’s Environment and Health Action Plan for Europe. Indicator-based assessment for five core indicators is reported to address key transport, health and environment pathways. Information gaps are pointed out where harmonization or new data are needed for health and environment aspects to be taken into account comprehensively in transport policies. Two examples of sectoral assessments highlight approaches for a better integration of public health concerns into informed transport decision-making. Some lessons learned from the development of information support of environment and health policies in Europe are presented.
BACKGROUND AND OBJECTIVES The transport sector has a variety of effects on people’s lives. Access of people to services and goods ensured by contemporary transport technology is an important driver of economic development. Owing to its flexibility but also due to externalization of a part of its costs, road transport is the main transport mode in Europe. In addition, cars are object of desire and pride in many societies. Unfortunately these positive aspects often do not take account related negative consequences: consumption of non-renewable energy sources, air pollution, noise, road traffic injuries, use of space and often urban developments that hinder physical activity. These risks are a disproportionate threat to the most vulnerable population groups, such as children and the elderly, and they raise important questions about social inequalities.
Moving towards environmentally sustainable transport requires a comprehensive and evidence-based integration of environment and health aspects in policy action taken at each step of the transport demands and activities-driven chain of causality. It also requires a mechanism for monitoring and reporting on transport, public health and environment.
Towards an Integrated Reporting on Transport, Health and Environment: Environment and Health Indicators
24
Within the European environment and health process, the establishment of a well-coordinated mechanism for health and environment monitoring and reporting has increasingly become a priority. The Fourth Ministerial Conference on Environment and Health (Budapest, 2004) adopted the Children’s Environment and Health Action Plan for Europe (CEHAPE).1 To support policy development including for CEHAPE, Member States of the WHO European Region committed themselves to joint action with WHO, the European Commission (EC) and other international organizations in building a supporting information base. The WHO Regional Office for Europe was asked to lead this process, focusing on children’s health as underlined by the main focus of the Budapest Conference.
With the support of the Directorate-General for Health and Consumer Protection of the European Commission and contributions from many Member States, the Regional Office for Europe has carried out a series of projects with the aim of designing and establishing an information system, while at the same time strengthening countries’ capacities in this area. In response to these needs, the European environment and health information system ENHIS2 was created. It is based on a set of indicators to measure public health and environment situation and progress and to enable assessment of policy effects on health.
This paper presents examples of an integrated transport, health and environment reporting based on ENHIS and the European environment and health (EH) indicators with a focus on children’s health.
METHODS The methodology for a set of EH indicators was developed including the rationale, definition, required data elements, calculation method, data sources, interpretation and policy relevance3. A set of 26 “core” EH indicators was selected in a process involving multiple working groups and consultations, using the criteria of scientific credibility, a focus on children’s EH and relevant policy action, as well as feasibility. An information-base has been created for those indicators using international databases, case studies based on surveys in selected countries and examples of child-specific policies. Reporting methods and tools for indicator fact sheets and periodic indicator-based assessments were designed for decision-makers. Fact sheets for the 26 indicators were created and integrated in the information-base (1).
The following indicators from the core set address transport, health and environment issues:
1 Children’s Environment and Health Action Plan for Europe. Declaration. Fourth Ministerial Conference on Environment and Health, Budapest, 23–25 June 2004 (EUR/04/5046267/6, paragraph 16; http://www.euro.who.int/document/e83335.pdf, accessed 16 March 2007). 2 ENHIS – European Environment and Health Information System http://www.enhis.org accessed 28 March 2008 3 Indicator methodology is available at www.enhis.org/object_class/enhis_about_indicators.html
Towards an Integrated Reporting on Transport, Health and Environment: Environment and Health Indicators
25
o Air quality • population exposure to outdoor airborne particulate matter (urban)
o Chemicals • blood lead level in children
o Safe mobility
• road-traffic injuries in children and young people • policies to promote safe mobility and transport • physical activity in children
Concise facts about the situation in the European Region in the first half of the current decade are reported for each indicator together with the relevant data presentation and a key message.
The following six indicators from the extended set address transport, health and environment issues:
o Safe mobility
• injury rate due to road traffic accidents • children travelling to school by different transport modes
o Air quality • population exposure to outdoor air ozone (SOMO35) • children living in proximity of heavily trafficked roads
o Traffic noise
• population living in dwellings exposed to noise from traffic • children exposed to transport noise in schools
For the indicators from the extended set only rationale and data-flow status is given as they require further harmonization and new data collection.
Integrated sector-specific assessments are powerful tools for informed decision-making enabling projection of health benefits from implementing a policy or regulatory action as well as valuating associated economic costs. Two examples of integrated assessments are given.
The first one is on the economic valuation of health benefits of physical activity, particularly from cycling and walking. The calculation of cost-benefit ratios is an established practice in transport planning. However, the health effects of transport interventions are rarely taken into account in such analyses. In recent years, a few countries (e.g. the Nordic Council) have carried out pioneering work in trying to assess the overall costs and benefits of transport infrastructures taking health effects into account, and guidance for carrying out these assessments has been developed. However, important questions remain to be addressed regarding the type and extent of health benefits which can be attained through investments in policies and initiatives which promote more cycling and walking. Therefore, WHO has launched a project (2) aimed at:
a) The review of recent approaches to cost-benefit analysis of transport-related physical activity, and
Towards an Integrated Reporting on Transport, Health and Environment: Environment and Health Indicators
26
b) The development of guidance on approaches to the inclusion of health effects through transport-related physical activity in economic analyses of transport infrastructure and policies for the Member States.
The project was developed by a core group, with the support of an international advisory group consisting of economists, experts of health and physical activity and experts in transport. The products, a guidance document and an illustrative tool with its user guide, have been developed through a systematic review of the relevant published literature and a comprehensive consensus building process.
The second example of integrated assessment presents a case study from Germany on health impacts of road traffic noise. Details about the methodology can be found at http://www.enhis.org/object_class/enhis_healthimpactassessment.html.
RESULTS
Part I: Indicator-based reporting
• Population exposure to outdoor airborne particulate matter in urban areas
Among air pollutants, PM is widely present and people are exposed where they live and work. To a great extent, PM is generated by human activities such as transport, energy production, domestic heating and a wide range of industries. Concentrations of ambient PM10 (particles with a diameter of up to 10 μm, which are small enough to pass into the lungs) are a good approximation of population exposure to PM from outdoor sources. The value of this is supported by numerous epidemiological studies, conducted in Europe and in other parts of the world, which show links between various indicators of children’s health and outdoor PM10. Importantly, effects are seen on health at PM levels currently observed in European cities.
Fig. 1a shows the population exposure to PM10 (as an average annual concentration) in various European cities in 2004 (or the last available year). This is expected to approximate the exposure in children, assuming children comprise similar proportions of the cities’ populations (3). The average exposure to PM10 varied from 13–14 μg/m3 (Finland, Ireland) to 53–56 μg/m3 (Bulgaria, Romania and Serbia and Montenegro (Serbia)). Within some countries, a three-fold variation in the exposure level of children was observed. There have been no substantial changes in average exposure levels over the last few years in urban areas of the Region.
Of people living in European cities where PM10 is monitored, the vast majority (89%), including children, are exposed to levels exceeding the WHO air quality guideline level of 20 μg/m3 (4). This gives rise to a substantial risk to children’s health. For 14% of people, the higher EU limit value of 40 μg/m3 is exceeded. Finally, it should be remembered that for 31 countries in the Region – with 43% of the total population – no PM data from regular monitoring are available. However, an approximate assessment indicates that the pollution levels and corresponding health risks may be even higher in many of these countries.

Towards an Integrated Reporting on Transport, Health and Environment: Environment and Health Indicators
27
Among the major contributors to urban air pollution, road transport is becoming ever more important. Traffic contributes to a range of gaseous air pollutants and to suspended PM of different sizes and composition. Tailpipe emissions of primary particles from road transport account for up to 30% of PM2.5 in urban areas ((5); Fig. 1b). Other emissions, such as those from re-suspended road dust or resulting from worn tyres and brake linings, are the most important source of coarse PM. People of all ages experience high levels of exposure to traffic-related air pollutants when they live near busy roads, travel on roads or have to spend a long time on roads. Epidemiological and toxicological studies indicate that transport-related air pollution contributes to an increased risk of death, particularly from cardiopulmonary causes, as well as to an increased risk of respiratory symptoms and diseases (6). The exposure of children to traffic-related air pollutants such as PM has a considerable impact on their health and well-being (7).
• Blood lead level in children
Lead is a well-known neurotoxin: impairment of neurodevelopment in children is the most critical effect. In many Member States there have been major decreases in blood lead levels in children in recent decades mainly because of the uptake of unleaded fuels. Nevertheless case studies (8) such as the one shown on Fig.2 demonstrate that residual exposure to re-suspended lead disappears only after a complete elimination of the leaded petrol from the market.
Fig. 1b Transport sector contribution to primary PM2.5 emissions, EU-15,
2000
Fig. 1a
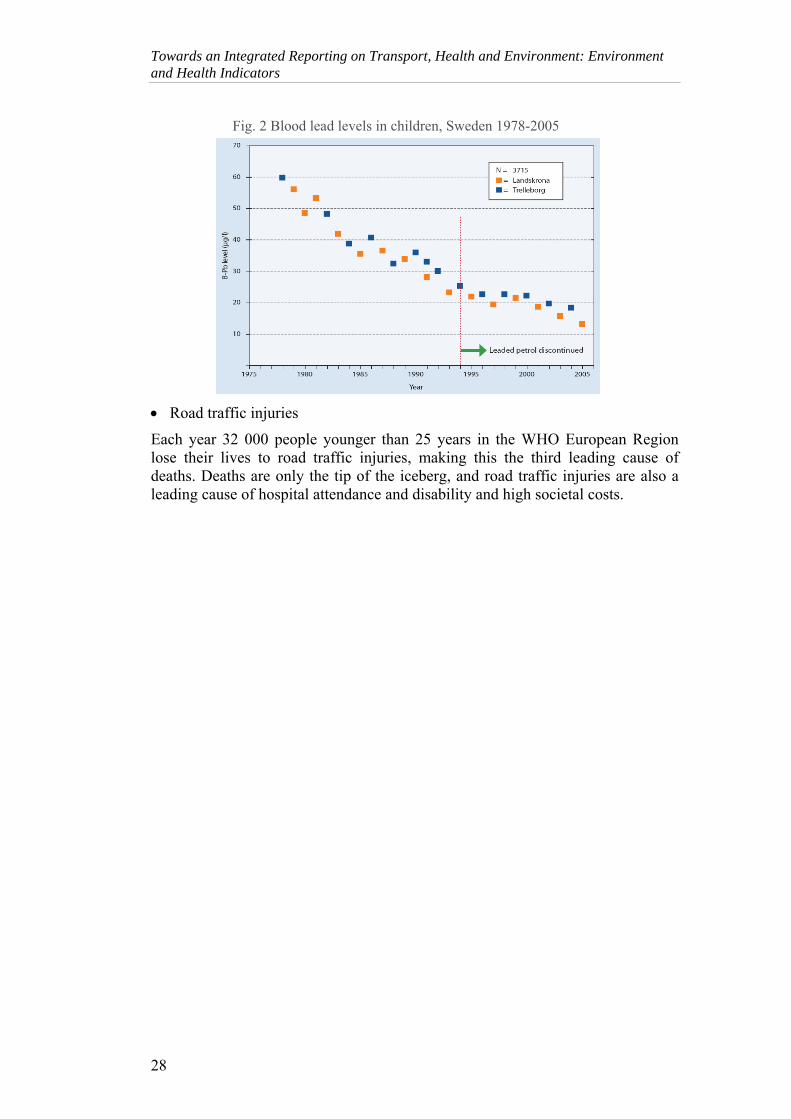
Towards an Integrated Reporting on Transport, Health and Environment: Environment and Health Indicators
28
• Road traffic injuries
Each year 32 000 people younger than 25 years in the WHO European Region lose their lives to road traffic injuries, making this the third leading cause of deaths. Deaths are only the tip of the iceberg, and road traffic injuries are also a leading cause of hospital attendance and disability and high societal costs.
Fig. 2 Blood lead levels in children, Sweden 1978-2005
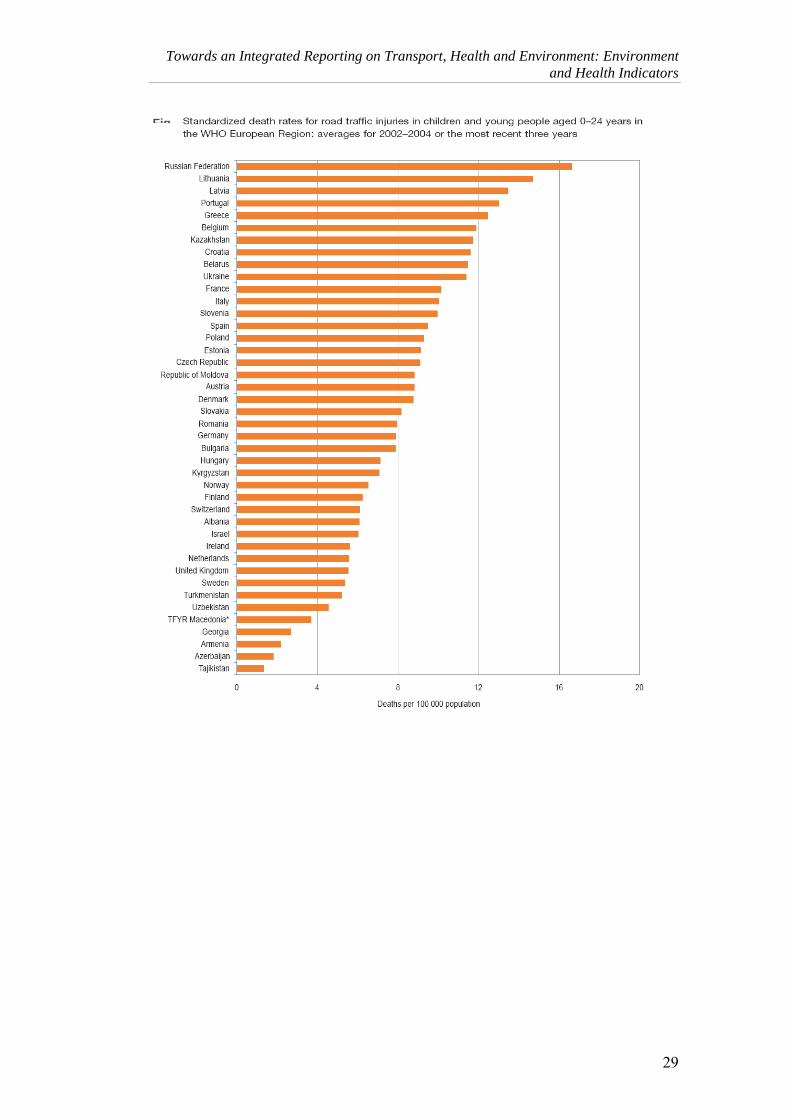
Towards an Integrated Reporting on Transport, Health and Environment: Environment and Health Indicators
29
Fig
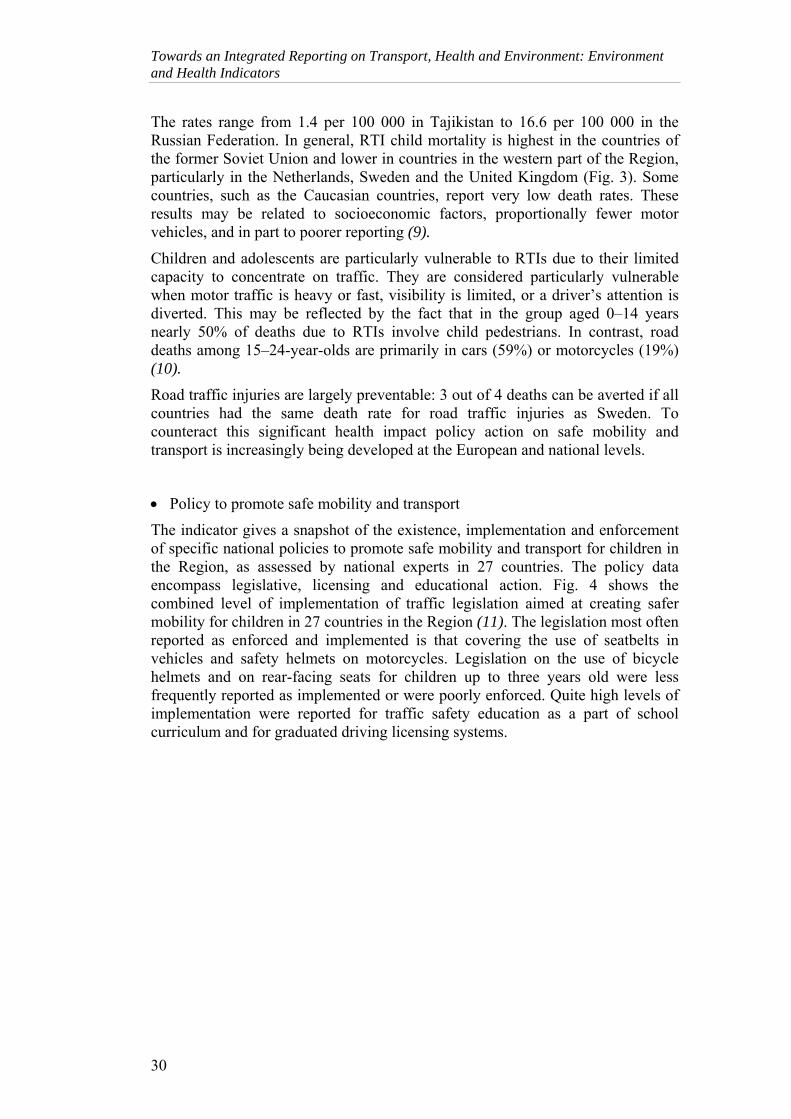
Towards an Integrated Reporting on Transport, Health and Environment: Environment and Health Indicators
30
The rates range from 1.4 per 100 000 in Tajikistan to 16.6 per 100 000 in the Russian Federation. In general, RTI child mortality is highest in the countries of the former Soviet Union and lower in countries in the western part of the Region, particularly in the Netherlands, Sweden and the United Kingdom (Fig. 3). Some countries, such as the Caucasian countries, report very low death rates. These results may be related to socioeconomic factors, proportionally fewer motor vehicles, and in part to poorer reporting (9).
Children and adolescents are particularly vulnerable to RTIs due to their limited capacity to concentrate on traffic. They are considered particularly vulnerable when motor traffic is heavy or fast, visibility is limited, or a driver’s attention is diverted. This may be reflected by the fact that in the group aged 0–14 years nearly 50% of deaths due to RTIs involve child pedestrians. In contrast, road deaths among 15–24-year-olds are primarily in cars (59%) or motorcycles (19%) (10).
Road traffic injuries are largely preventable: 3 out of 4 deaths can be averted if all countries had the same death rate for road traffic injuries as Sweden. To counteract this significant health impact policy action on safe mobility and transport is increasingly being developed at the European and national levels.
• Policy to promote safe mobility and transport
The indicator gives a snapshot of the existence, implementation and enforcement of specific national policies to promote safe mobility and transport for children in the Region, as assessed by national experts in 27 countries. The policy data encompass legislative, licensing and educational action. Fig. 4 shows the combined level of implementation of traffic legislation aimed at creating safer mobility for children in 27 countries in the Region (11). The legislation most often reported as enforced and implemented is that covering the use of seatbelts in vehicles and safety helmets on motorcycles. Legislation on the use of bicycle helmets and on rear-facing seats for children up to three years old were less frequently reported as implemented or were poorly enforced. Quite high levels of implementation were reported for traffic safety education as a part of school curriculum and for graduated driving licensing systems.
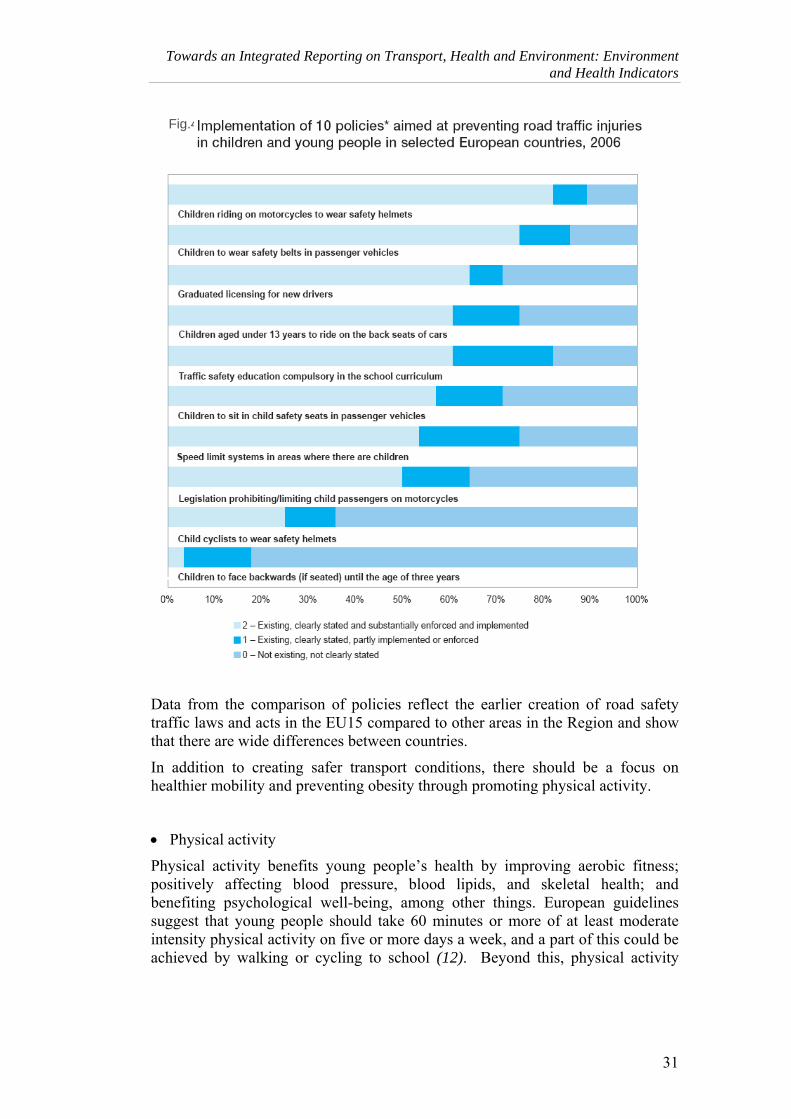
Towards an Integrated Reporting on Transport, Health and Environment: Environment and Health Indicators
31
Data from the comparison of policies reflect the earlier creation of road safety traffic laws and acts in the EU15 compared to other areas in the Region and show that there are wide differences between countries.
In addition to creating safer transport conditions, there should be a focus on healthier mobility and preventing obesity through promoting physical activity.
• Physical activity
Physical activity benefits young people’s health by improving aerobic fitness; positively affecting blood pressure, blood lipids, and skeletal health; and benefiting psychological well-being, among other things. European guidelines suggest that young people should take 60 minutes or more of at least moderate intensity physical activity on five or more days a week, and a part of this could be achieved by walking or cycling to school (12). Beyond this, physical activity
Fig.4
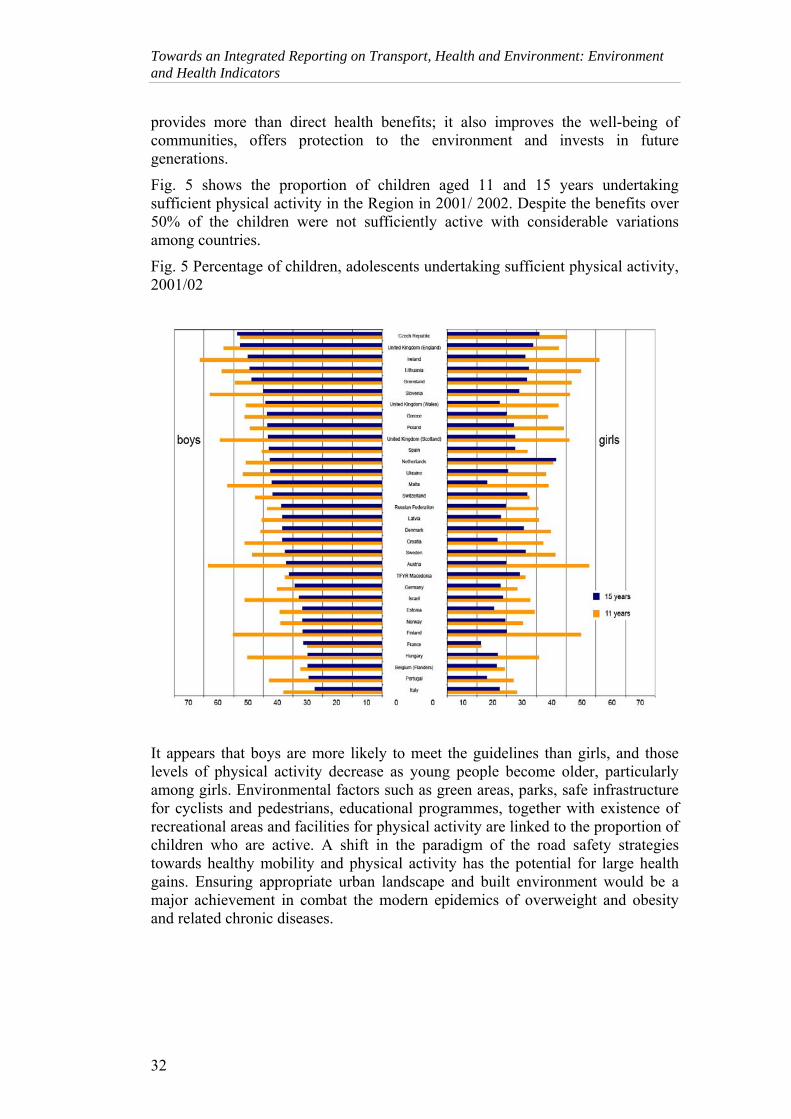
Towards an Integrated Reporting on Transport, Health and Environment: Environment and Health Indicators
32
provides more than direct health benefits; it also improves the well-being of communities, offers protection to the environment and invests in future generations.
Fig. 5 shows the proportion of children aged 11 and 15 years undertaking sufficient physical activity in the Region in 2001/ 2002. Despite the benefits over 50% of the children were not sufficiently active with considerable variations among countries.
Fig. 5 Percentage of children, adolescents undertaking sufficient physical activity, 2001/02
It appears that boys are more likely to meet the guidelines than girls, and those levels of physical activity decrease as young people become older, particularly among girls. Environmental factors such as green areas, parks, safe infrastructure for cyclists and pedestrians, educational programmes, together with existence of recreational areas and facilities for physical activity are linked to the proportion of children who are active. A shift in the paradigm of the road safety strategies towards healthy mobility and physical activity has the potential for large health gains. Ensuring appropriate urban landscape and built environment would be a major achievement in combat the modern epidemics of overweight and obesity and related chronic diseases.
Towards an Integrated Reporting on Transport, Health and Environment: Environment and Health Indicators
33
Within the extended set of indicators the perspective for indicator-based reporting is as follows.
• Injury rate due to road traffic accidents
The indicator is designed to give a better insight in the public health problem due to road traffic injuries as the injury fatalities are only the tip of the health burden iceberg with many people suffering enormous long-term physical disability and psychological consequences. It is relatively easy to interpret as the cause - health effect link is explicit. Changes in the indicator should be due to reduction in total traffic volume, greater segregation of pedestrian from road traffic accident, improvement in: road infrastructure, traffic management, vehicle safety, environmental conditions. Data from EU countries are available in the Road Safety Observatory 4 though data collection practices differ and there are limitations due to underreporting,
• Children travelling to school by different transport mode
Since more than 50% of journeys undertaken by car are shorter than five kilometres and 30% are shorter than three kilometres walking and cycling may often be feasible alternative forms of transport, at times even when for adults travelling with children. However, walkers and cyclists are discouraged in many European cities by fear of traffic injuries and hostile road environments, with high traffic volume and lack of infrastructure for vulnerable road users. Investments in the development of safe pedestrian and cycling environments are likely to be returned through an increase in children choosing independent and safe physical activity.
The indicator measures the proportion of children that travel to school by car, walking, bicycling and public transportation mode. It is based on the assumption that walking and cycling are health enhancing for the traveller and that public transport is a sustainable form of transport less polluting per capita than travelling by car. Data will be available in the future from the Health Behaviour in School-aged Children (13) study and on the local scale - from the European Common Indicators.
• Population exposure to outdoor air ozone
Ozone and other photochemical oxidants are pollutants that are not directly emitted by primary sources. The precursors of ozone are nitrogen dioxide and non- methane volatile organic compounds (VOC), especially unsaturated VOCs. They are emitted from large urban centres and industrial areas. The indicator is defined as population-weighted yearly sum of maximum daily 8-hour mean of ozone concentrations exceeding 70 μg/m3 (35 ppb) (SOMO35). Data on ambient air pollution concentrations from national or local monitoring networks are
4 CARE: community road accident databases: http://ec.europa.eu/transport/roadsafety/road_safety_observatory/care_en.htm
Towards an Integrated Reporting on Transport, Health and Environment: Environment and Health Indicators
34
submitted to and maintained by the EEA AirBase 5 . For the EU-25 Member countries the indicator is available at the Eurostat data portal -> sustainable development indicators. The ENHIS indicator-based assessment will be available by the end of 2008.
• Children living in proximity of heavily trafficked roads
The indicator provides a useful general measure of the level of exposure of children to road traffic. A recent study conducted by the EC Joint Research Centre using GIS techniques and overlaying population density with the road network has shown that nearly 1300000 children under 15 years of age live within 50 m of roads in the EU-15. Those children are at high risk from air pollution as well as noise and traffic accidents. Furthermore, they are restricted in normal children’s activities such as playing, sports, and being healthy mobile and the greatest problems are in big urban agglomerations with the highest concentration of people. The indicator measures the proportion of children who live in a distance of 50 m, 200 m and 350 m from motorways, national roads with double lanes, national roads and other principal roads as classified by Eurostat. When the same methodology and database is applied to city level it disclosed a limitation of the road network database i.e. it does not include the big busy roads within the cities unless they are designated as part of a national road. Further enhancement of GISCO road database and availability of population density within the cities are needed to apply the indicator (14).
• Population exposure living in dwellings exposed to environmental noise
Noise seriously harms human health and interferes with people’s daily activities at school, at work, at home and during leisure time. Traffic noise alone is harming today the health of almost every third European. The indicator is in line with the EU Environmental Noise Directive 2002/49/EC which requires estimation of the number of people exposed to ranges of noise levels from different sources of environmental noise in urban areas and along major transport infrastructures. The data-flows by the Member States are expected during 2008 after which the indicator-based assessment will be developed.
• Children exposed to harmful noise at school
Impairments of early childhood development and education by environmental noise may have lifelong effects on academic achievement and health. The indicator measures the proportion of children being at risk of having cognitive delays in school due to excessive noise i.e. above 55 dB (A) average during school hours. It represents the daily noise exposure for school-aged children. Data flows are expected after the full implementation of the Directive 2002/49/EC.
5 EEA AirBase: the European Air Quality Database http://air-climate.eionet.europa.eu/databases/airbase /
Towards an Integrated Reporting on Transport, Health and Environment: Environment and Health Indicators
35
Part II: Examples of integrated assessments
• Economic valuation of health benefits of walking and cycling
Products developed by this project include guidance to quantify the health effects of cycling and walking (2) as well as an illustrative tool for cycling, named "Health economic assessment tool for cycling" (HEAT for cycling) and its user guide.
Based on best available evidence that can be adapted to specific situations, this tool estimates the economic savings resulting from reduced mortality due to cycling, i.e.: if x people cycle y distance on most days, what is the economic value of the improvements in their mortality rate? The results of this project are meant primarily for integration into comprehensive cost-benefit analyses of transport interventions or infrastructure projects, but can also serve for an assessment of the current situation or of investments made in the past. The only input data needed are the number of trips currently done by bicycle or projected to result from a particular intervention and their average length. This makes the tool attractive for transport planners who do not have a public health background.
Illustrative applications show that the public health benefits and potential economic savings from public health benefits are likely to be great, especially if inactive persons can be reached by targeted interventions. A number of Member States are currently considering the application of the tool and case studies will be available on the project website soon.
A number of Member States are currently considering the application of the tool and case studies will be available on the project website soon.
• Health impact assessment of traffic noise
Health Impact Assessment (HIA) case study in children (0-14 yrs) on health effects induced by road traffic noise was conducted in two German cities in North Rhine-Westphalia, one small town (city A), the other a larger city in a highly compressed area (city B). 17 %– 34 % of children in these cities are estimated to be exposed to noise levels of more than 60 dB(A) during the day and 21 % – 34 % of children are estimated to be exposed to noise levels of more than 50 dB(A) at night.
The proportion of highly annoyed and highly sleep-disturbed per 1000 children in both North Rhine-Westphalia cities, were estimated for the current situation and two scenarios. The first includes noise exposure not exceeding 60 dB(A) during daytime and 50 dB(A) at night, and the second – noise levels decreased by 5 dB(A).
Results showed a clear decrease of the negative health outcomes in both cities under the two scenarios. Therefore preventive actions to reduce traffic noise exposure following the 2002/49/EC should be reinforced in Europe (15).
Towards an Integrated Reporting on Transport, Health and Environment: Environment and Health Indicators
36
CONCLUSIONS These results show that EH indicator-based assessment and reporting could support measurement of environmentally sustainable transport. Furthermore it shows that developing indicators is important but even more so is their regular use to inform decision-making and to facilitate public debate among different stakeholders. Using indicators in policy-oriented monitoring implies time-trends analysis and reporting which requires resolving a number of feasibility issues and maintaining and updating the information-base.
Indicators enable country comparison of progress towards targets set in the European policy action programmes. Lessons from ENHIS show the usefulness of country comparisons in achieving peer-pressure effects and also in enabling exchange and learning from good practice examples. Putting explicit health concerns and in particular children’s needs with regard to their environment in the focus of transport policies should stimulate accountable public policies which benefit both environment and public health.
Finally, implementation of indicator-based systems for assessment and reporting entails establishment of a network of diverse partners as an important mechanism for maintaining the data-flows and the relevance of the information. A challenge for the network and system sustainability yet an optimal solution is to assure some degree of institutional commitment.
As for ENHIS, next steps include
• periodic update of the databases both concerning new data points to allow the analysis of trends, and expansion of country coverage as well as updating the system’s web site and fact sheets,
• expansion of the system to new policy areas, for example, to cover the health aspects of climate change, built environment and addressing high-risk groups in addition to children, and,
• further integration and expansion of the policy analysis and health impact assessment tools (HIA) and case studies.
Illustrative applications of the HEAT for cycling tool show that the public health benefits and potential economic savings from public health benefits are likely to be great, especially if inactive persons can be reached by targeted interventions. The development of a similar tool for valuing the health benefits from walking is foreseen in the next project phase. The Member States interest in applying the tool to their national or local context shows that such practical guidance and tools can usefully support the integration of health concerns into transport policies and interventions.
Towards an Integrated Reporting on Transport, Health and Environment: Environment and Health Indicators
37
References 1. Facts on children’s health and the environment (2007). ENHIS indicator-
based assessments: 26 fact sheets provide a pan-European summary on a core environment and health issue (http://www.euro.who.int/EHindicators/Publications/qryIndicatorbasedAssessments, assessed 28 March 2008)
2. WHO Regional Office for Europe (2007): Quantifying the health effects of cycling and walking [website]. Copenhagen WHO Regional Office for Europe, WHO Regional Office for Europe (http://www.euro.who.int/transport/policy/20070503_1, accessed 2 November 2007)
3. Exposure of children to air pollution (particulate matter) in outdoor air. Copenhagen, WHO Regional Office for Europe, 2007 (ENHIS fact sheet 3.3) (http://www.euro.who.int/Document/EHI/ENHIS_Factsheet_3_3.pdf, accessed 17 July 2007)
4. Air quality guidelines, global update 2005. Copenhagen, WHO Regional Office for Europe, 2006 (http://www.euro.who.int/Document/E90038.pdf, accessed 17 July 2007).
5. Health risks of particulate matter from long-range transboundary air pollution. Copenhagen, WHO Regional Office for Europe, 2006 (http://www.euro.who.int/document/E88189.pdf, accessed 17 July 2007).
6. Health effects of transport-related air pollution. Copenhagen, WHO Regional Office for Europe, 2005 (http://www.euro.who.int/document/E86650.pdf, accessed 17 July 2007).
7. World Health Organization European Centre for Environment and Health. Effects of air pollution on children’s health and development – a review of the evidence. Copenhagen, WHO Regional Office for Europe, 2005 (http://www.euro.who.int/document/E86575.pdf, accessed 17 July 2007).
8. Joint WHO/Convention Task Force on the Health Aspects of Air Pollution Health risks of heavy metals from long-range transboundary air pollution Copenhagen WHO Regional Office for Europe, 2007 (http://www.euro.who.int/document/E91044.pdf, assessed 28 March 2008)
9. ENHIS Fact Sheet 2.1 Mortality from road traffic injuries in children and young people. Copenhagen, WHO Regional Office for Europe, 2007 (http://www.euro.who.int/Document/EHI/ENHIS_Factsheet_2_1.pdf, accessed 17 July 2007).
10. Youth and road safety in Europe. Policy briefing, By: D. Sethi, Fr. Racioppi and F. Mitis. Copenhagen, WHO Regional Office for Europe, 2007, http://www.euro.who.int/Document/E90142.pdf, assessed 28 March 2008
Towards an Integrated Reporting on Transport, Health and Environment: Environment and Health Indicators
38
11. Policies to promote safe mobility and transport for children. Copenhagen, WHO Regional Office for Europe, 2007 (ENHIS fact sheet 2.5) (http://www.euro.who.int/Document/EHI/ENHIS_Factsheet_2_5.pdf, accessed 17 July 2007).
12. Percentage of physically active children and adolescents. Copenhagen, WHO Regional Office for Europe, 2007 (ENHIS fact sheet 2.4) (http://www.euro.who.int/Document/EHI/ENHIS_Factsheet_2_4.pdf, accessed 17 July 2007).
13. Currie C et al., eds. Young people’s health in context. Health Behaviour in Schoolchildren (HBSC) study: international report from the HBSC 2001/02 survey. Copenhagen, WHO Regional Office for Europe, 2004 (Health Policy for Children and Adolescents, No. 4; http://www.hbsc.org/downloads/IntReport04/HBSCFullReport0102.pdf, accessed 17 July 2007).
14. Children’s health and the environment in Europe: a baseline assessment, D. Dalbokova, M. Krzyzanowski, S. Lloyd, eds. Copenhagen, WHO Regional Office for Europe, 2007 (http://www.euro.who.int/Document/E90767.pdf, assessed 28 March 2008)
15. Health impact of traffic noise. Mekel O., Sierig S. and Claßen T., ENHIS-2 project (http://www.enhis.org/object_document/o4824n27773.html assessed 28 March 2008)
Acknowledgements This work has been supported by the EC DG Sanco Grant Agreement SPC 2004112. The contribution of the ENHIS project group (http://www.euro.who.int/Document/EHI/acknowledgements_list.pdf)
The paper has been presented at the seminar of COST 356 – EST: Towards the definition of a measurable environmentally sustainable transport which took place in Oslo on 20 February 2008.
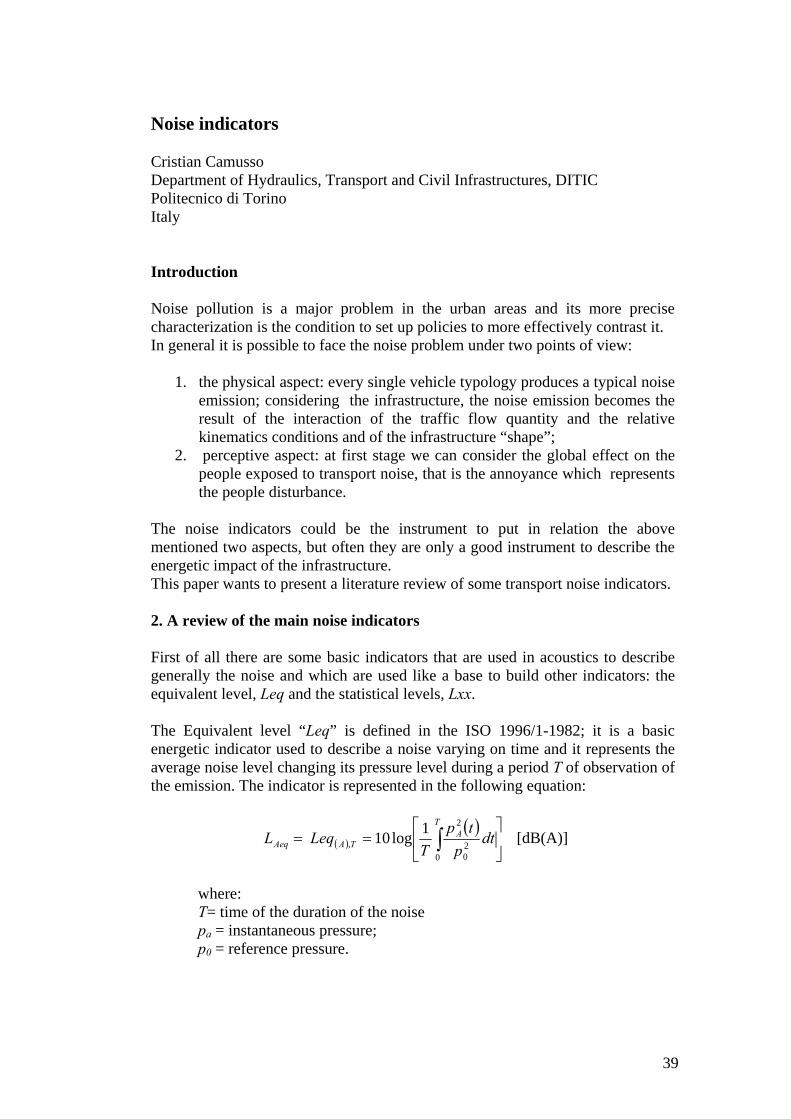
39
Noise indicators Cristian Camusso Department of Hydraulics, Transport and Civil Infrastructures, DITIC Politecnico di Torino Italy Introduction Noise pollution is a major problem in the urban areas and its more precise characterization is the condition to set up policies to more effectively contrast it. In general it is possible to face the noise problem under two points of view:
1. the physical aspect: every single vehicle typology produces a typical noise emission; considering the infrastructure, the noise emission becomes the result of the interaction of the traffic flow quantity and the relative kinematics conditions and of the infrastructure “shape”;
2. perceptive aspect: at first stage we can consider the global effect on the people exposed to transport noise, that is the annoyance which represents the people disturbance.
The noise indicators could be the instrument to put in relation the above mentioned two aspects, but often they are only a good instrument to describe the energetic impact of the infrastructure. This paper wants to present a literature review of some transport noise indicators.
2. A review of the main noise indicators First of all there are some basic indicators that are used in acoustics to describe generally the noise and which are used like a base to build other indicators: the equivalent level, Leq and the statistical levels, Lxx. The Equivalent level “Leq” is defined in the ISO 1996/1-1982; it is a basic energetic indicator used to describe a noise varying on time and it represents the average noise level changing its pressure level during a period T of observation of the emission. The indicator is represented in the following equation:
( )( )
⎥⎦
⎤⎢⎣
⎡== ∫
TA
TAAeq dtp
tpT
LeqL0
20
2
,1log10 [dB(A)]
where: T= time of the duration of the noise pa = instantaneous pressure; p0 = reference pressure.
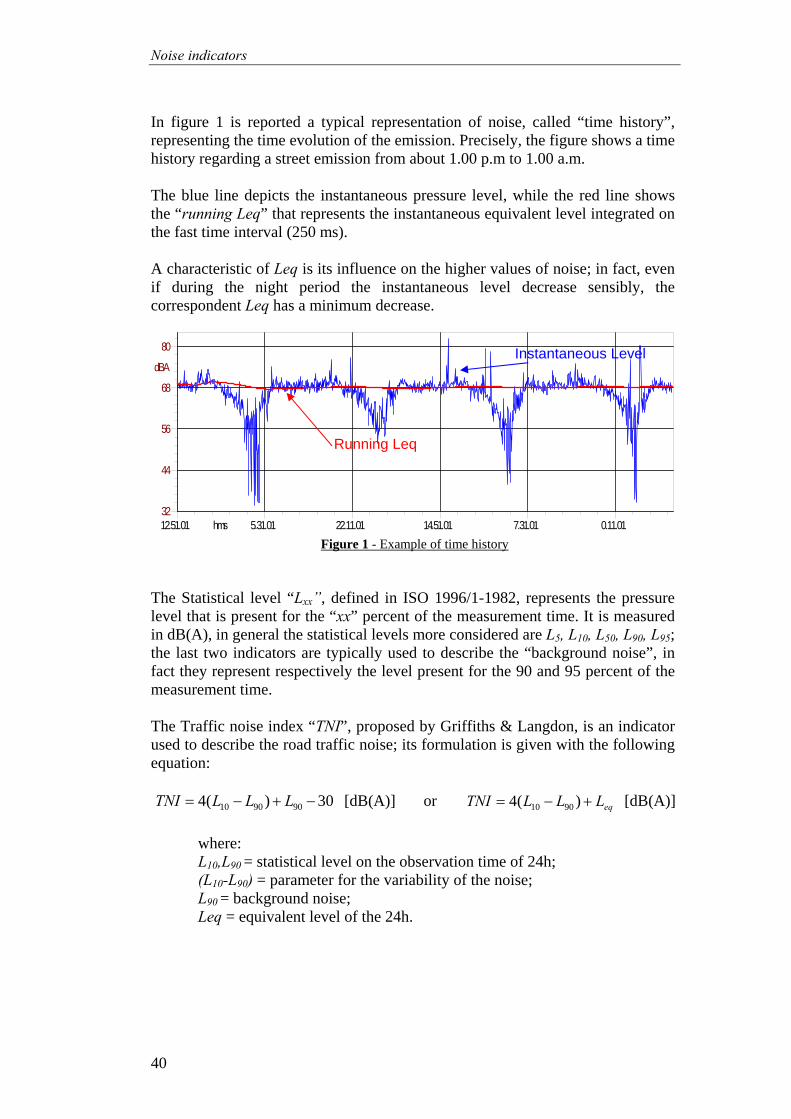
Noise indicators
40
In figure 1 is reported a typical representation of noise, called “time history”, representing the time evolution of the emission. Precisely, the figure shows a time history regarding a street emission from about 1.00 p.m to 1.00 a.m. The blue line depicts the instantaneous pressure level, while the red line shows the “running Leq” that represents the instantaneous equivalent level integrated on the fast time interval (250 ms). A characteristic of Leq is its influence on the higher values of noise; in fact, even if during the night period the instantaneous level decrease sensibly, the correspondent Leq has a minimum decrease.
Figure 1 - Example of time history
The Statistical level “Lxx”, defined in ISO 1996/1-1982, represents the pressure level that is present for the “xx” percent of the measurement time. It is measured in dB(A), in general the statistical levels more considered are L5, L10, L50, L90, L95; the last two indicators are typically used to describe the “background noise”, in fact they represent respectively the level present for the 90 and 95 percent of the measurement time.
The Traffic noise index “TNI”, proposed by Griffiths & Langdon, is an indicator used to describe the road traffic noise; its formulation is given with the following equation:
30)(4 909010 −+−= LLLTNI [dB(A)] or eqLLLTNI +−= )(4 9010 [dB(A)]
where: L10,L90 = statistical level on the observation time of 24h; (L10-L90) = parameter for the variability of the noise; L90 = background noise; Leq = equivalent level of the 24h.
12.51.01 5.31.01 22.11.01 14.51.01 7.31.01 0.11.01hms32
44
56
68
80
dBA
Running Leq
Instantaneous Level
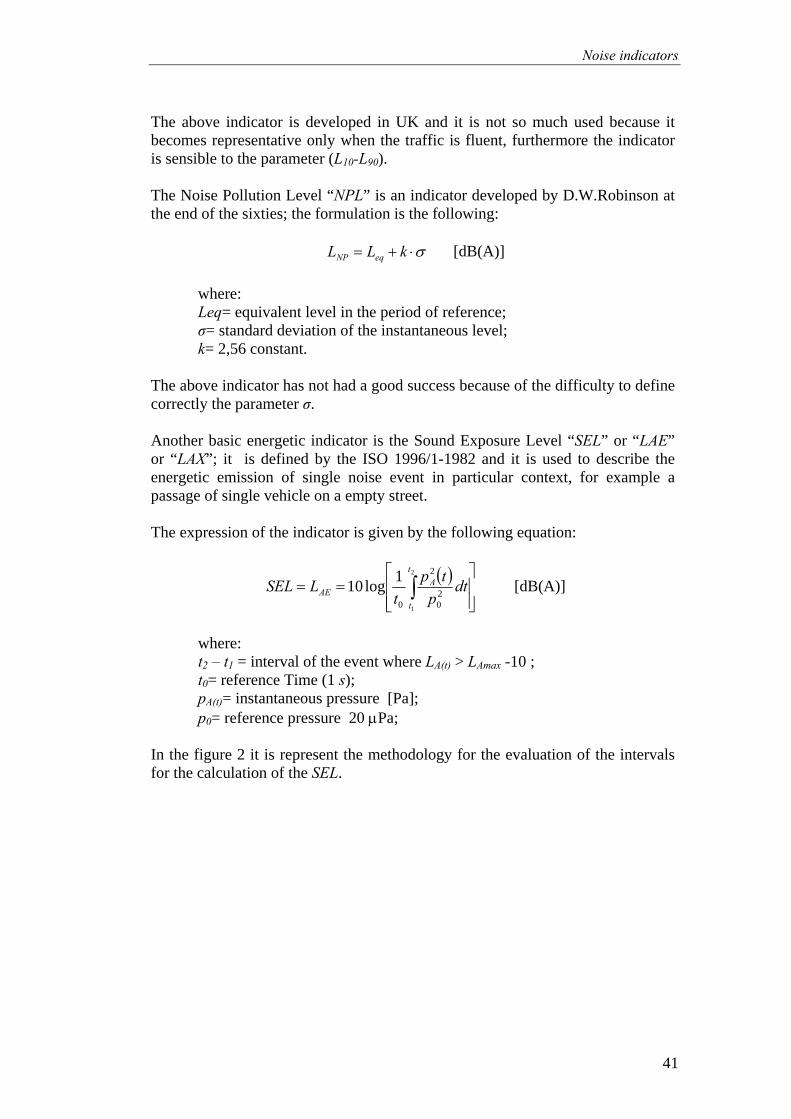
Noise indicators
41
The above indicator is developed in UK and it is not so much used because it becomes representative only when the traffic is fluent, furthermore the indicator is sensible to the parameter (L10-L90).
The Noise Pollution Level “NPL” is an indicator developed by D.W.Robinson at the end of the sixties; the formulation is the following:
σ⋅+= kLL eqNP [dB(A)]
where: Leq= equivalent level in the period of reference; σ= standard deviation of the instantaneous level; k= 2,56 constant.
The above indicator has not had a good success because of the difficulty to define correctly the parameter σ.
Another basic energetic indicator is the Sound Exposure Level “SEL” or “LAE” or “LAX”; it is defined by the ISO 1996/1-1982 and it is used to describe the energetic emission of single noise event in particular context, for example a passage of single vehicle on a empty street. The expression of the indicator is given by the following equation:
( )⎥⎥⎦
⎤
⎢⎢⎣
⎡== ∫
2
1
20
2
0
1log10t
t
AAE dt
ptp
tLSEL [dB(A)]
where: t2 – t1 = interval of the event where LA(t) > LAmax -10 ; t0= reference Time (1 s); pA(t)= instantaneous pressure [Pa]; p0= reference pressure 20 μPa;
In the figure 2 it is represent the methodology for the evaluation of the intervals for the calculation of the SEL.
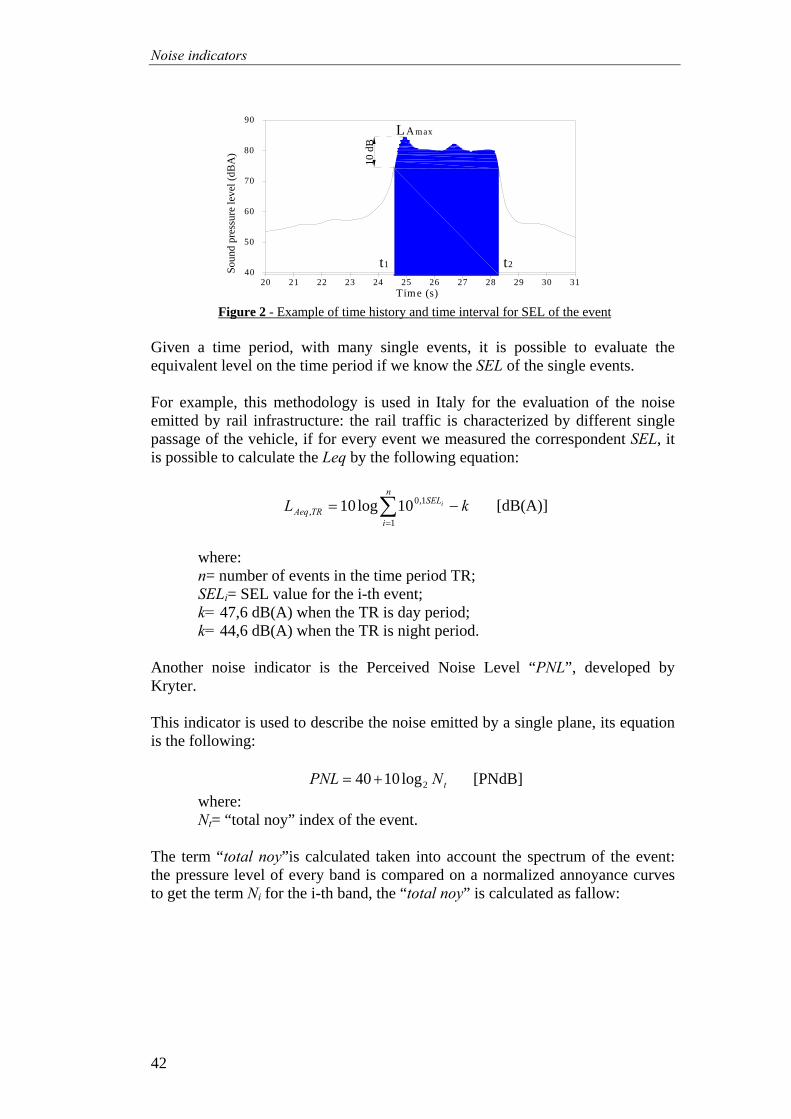
Noise indicators
42
Figure 2 - Example of time history and time interval for SEL of the event
Given a time period, with many single events, it is possible to evaluate the equivalent level on the time period if we know the SEL of the single events. For example, this methodology is used in Italy for the evaluation of the noise emitted by rail infrastructure: the rail traffic is characterized by different single passage of the vehicle, if for every event we measured the correspondent SEL, it is possible to calculate the Leq by the following equation:
kLn
i
SELTRAeq
i −= ∑=1
1,0, 10log10 [dB(A)]
where: n= number of events in the time period TR; SELi= SEL value for the i-th event; k= 47,6 dB(A) when the TR is day period; k= 44,6 dB(A) when the TR is night period.
Another noise indicator is the Perceived Noise Level “PNL”, developed by Kryter. This indicator is used to describe the noise emitted by a single plane, its equation is the following:
tNPNL 2log1040+= [PNdB]
where: Nt= “total noy” index of the event.
The term “total noy”is calculated taken into account the spectrum of the event: the pressure level of every band is compared on a normalized annoyance curves to get the term Ni for the i-th band, the “total noy” is calculated as fallow:
20 21 22 23 24 2625 27 3128 29 3040
50
60
80
70
90LAmax
10 d
B
t1 t2
Time (s)
Soun
d pr
essu
re le
vel (
dBA
)
Noise indicators
43
( )⎟⎠
⎞⎜⎝
⎛−+= ∑
iit NNFNN maxmax
where F is a constant.
An evolution of this indicator is the Effective Perceived Noise Level “EPNL”, this indicator taken into account the evolution of the PNL during the time with an increase of the level depending of the duration of the high level, its expression is given by the following equation:
⎟⎟⎠
⎞⎜⎜⎝
⎛ Δ+=
010log10
TtPNLEPNL [EPNdB]
where: Δt= time interval where PNL > PNLmax-10 T0= 15s
These two indicators are used to describe the noise emitted by a single event, for the evaluation of a global emission made by aircraft traffic, some global indicators are proposed. One of the global noise indicators is the Noise Exposure Forecast “NEF”, this indicator is proposed by the Federal Aviation Administration, and the equation of the indicator is the following:
752.120
log10 ,,10 −⎟⎟
⎠
⎞⎜⎜⎝
⎛++= ijNijD
ijij
nnEPNLNEF
where: nD= number of day operations; nN= number of night operations; i= aircraft class; j= take-off, landing profile.
This indicator takes into account the different events in the different part of the day. Another global aircraft noise indicator is the Weighted Noise Exposure Forecast “WECPNL”, this indicator is proposed by International Civil Aviation Organisation, its expression is the following:
SWECPNLNECPNLDECPNL
+⎟⎠⎞
⎜⎝⎛ += 1010 10
8310
85log10 10
where: D= for day operations;
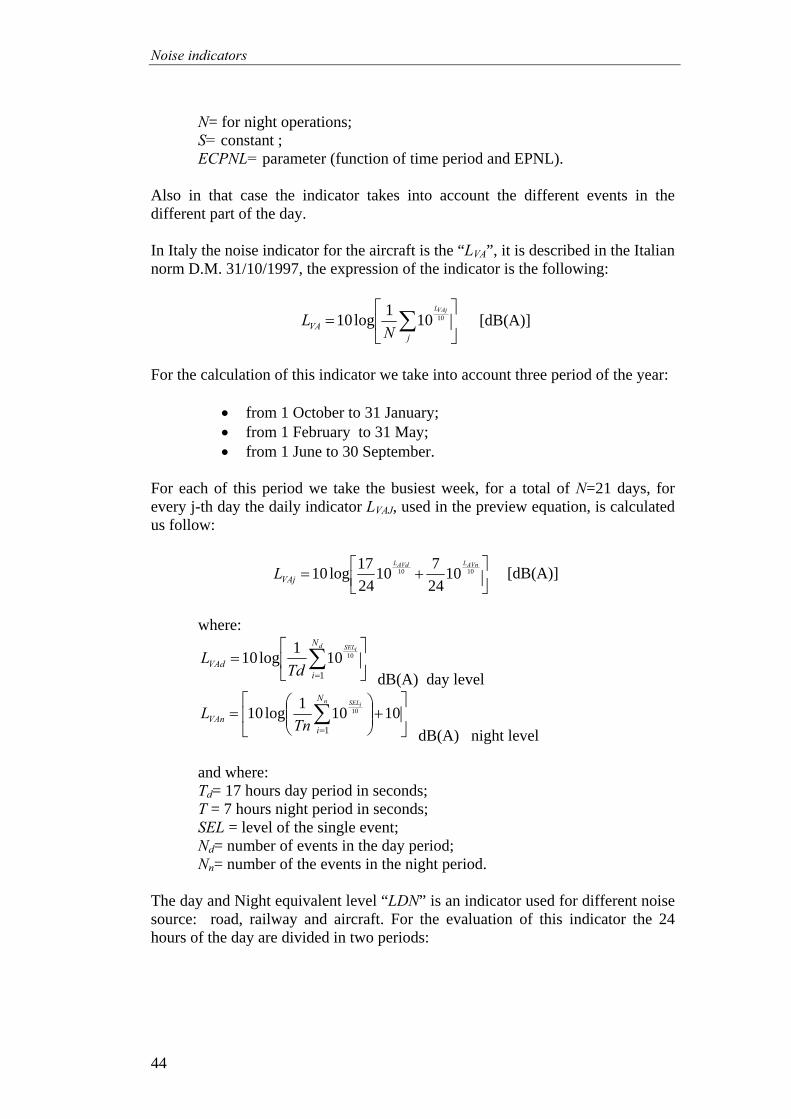
Noise indicators
44
N= for night operations; S= constant ; ECPNL= parameter (function of time period and EPNL).
Also in that case the indicator takes into account the different events in the different part of the day. In Italy the noise indicator for the aircraft is the “LVA”, it is described in the Italian norm D.M. 31/10/1997, the expression of the indicator is the following:
⎥⎦
⎤⎢⎣
⎡= ∑
jVA
VAjL
NL 10101log10 [dB(A)]
For the calculation of this indicator we take into account three period of the year:
• from 1 October to 31 January; • from 1 February to 31 May; • from 1 June to 30 September.
For each of this period we take the busiest week, for a total of N=21 days, for every j-th day the daily indicator LVAJ, used in the preview equation, is calculated us follow:
⎥⎦⎤
⎢⎣⎡ += 1010 10
24710
2417log10
AVnLAVdL
VAjL [dB(A)]
where:
⎥⎦
⎤⎢⎣
⎡= ∑
=
d iSELN
iVAd Td
L1
10101log10 dB(A) day level
⎥⎦
⎤⎢⎣
⎡+⎟⎟
⎠
⎞⎜⎜⎝
⎛= ∑
=
10101log101
10n iSELN
iVAn Tn
L dB(A) night level
and where: Td= 17 hours day period in seconds; T = 7 hours night period in seconds; SEL = level of the single event; Nd= number of events in the day period; Nn= number of the events in the night period.
The day and Night equivalent level “LDN” is an indicator used for different noise source: road, railway and aircraft. For the evaluation of this indicator the 24 hours of the day are divided in two periods:
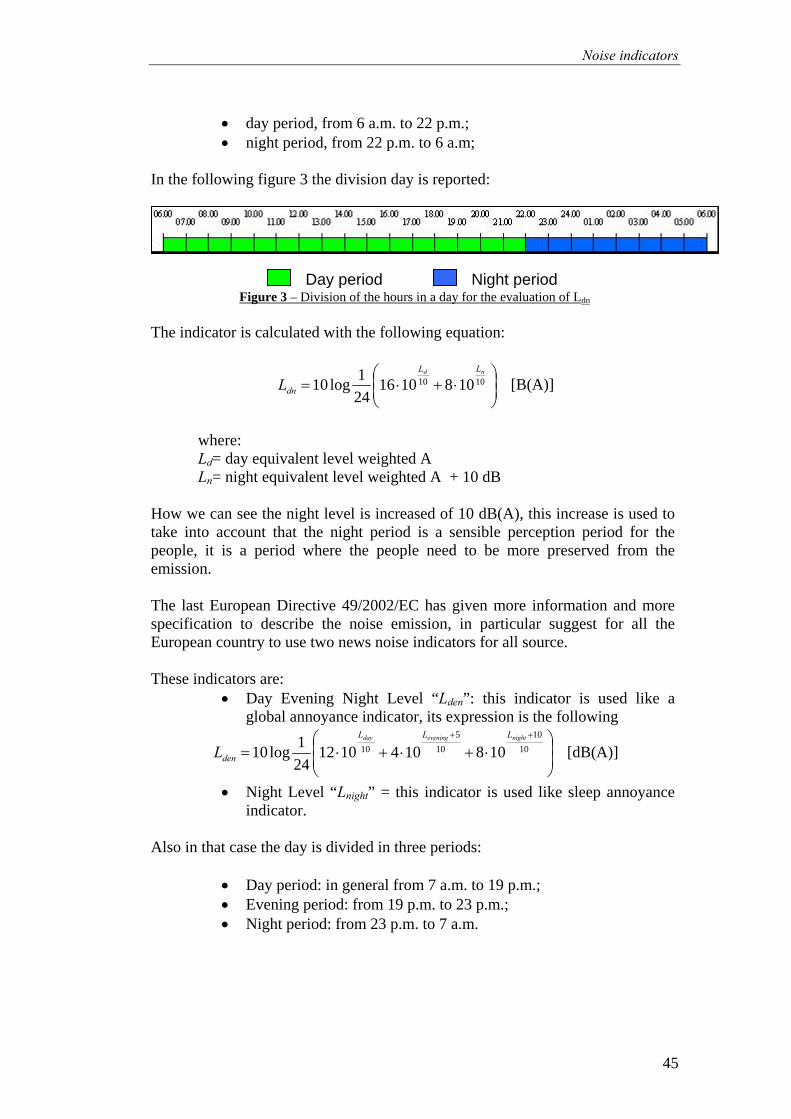
Noise indicators
45
• day period, from 6 a.m. to 22 p.m.; • night period, from 22 p.m. to 6 a.m;
In the following figure 3 the division day is reported:
Figure 3 – Division of the hours in a day for the evaluation of Ldn
The indicator is calculated with the following equation:
⎟⎟⎠
⎞⎜⎜⎝
⎛⋅+⋅= 1010 1081016
241log10
nd LL
dnL [B(A)]
where: Ld= day equivalent level weighted A Ln= night equivalent level weighted A + 10 dB
How we can see the night level is increased of 10 dB(A), this increase is used to take into account that the night period is a sensible perception period for the people, it is a period where the people need to be more preserved from the emission.
The last European Directive 49/2002/EC has given more information and more specification to describe the noise emission, in particular suggest for all the European country to use two news noise indicators for all source. These indicators are:
• Day Evening Night Level “Lden”: this indicator is used like a global annoyance indicator, its expression is the following
⎟⎟⎠
⎞⎜⎜⎝
⎛⋅+⋅+⋅=
++
1010
105
10 1081041012241log10
nighteveningday LLL
denL [dB(A)]
• Night Level “Lnight” = this indicator is used like sleep annoyance indicator.
Also in that case the day is divided in three periods:
• Day period: in general from 7 a.m. to 19 p.m.; • Evening period: from 19 p.m. to 23 p.m.; • Night period: from 23 p.m. to 7 a.m.
Day period Night period
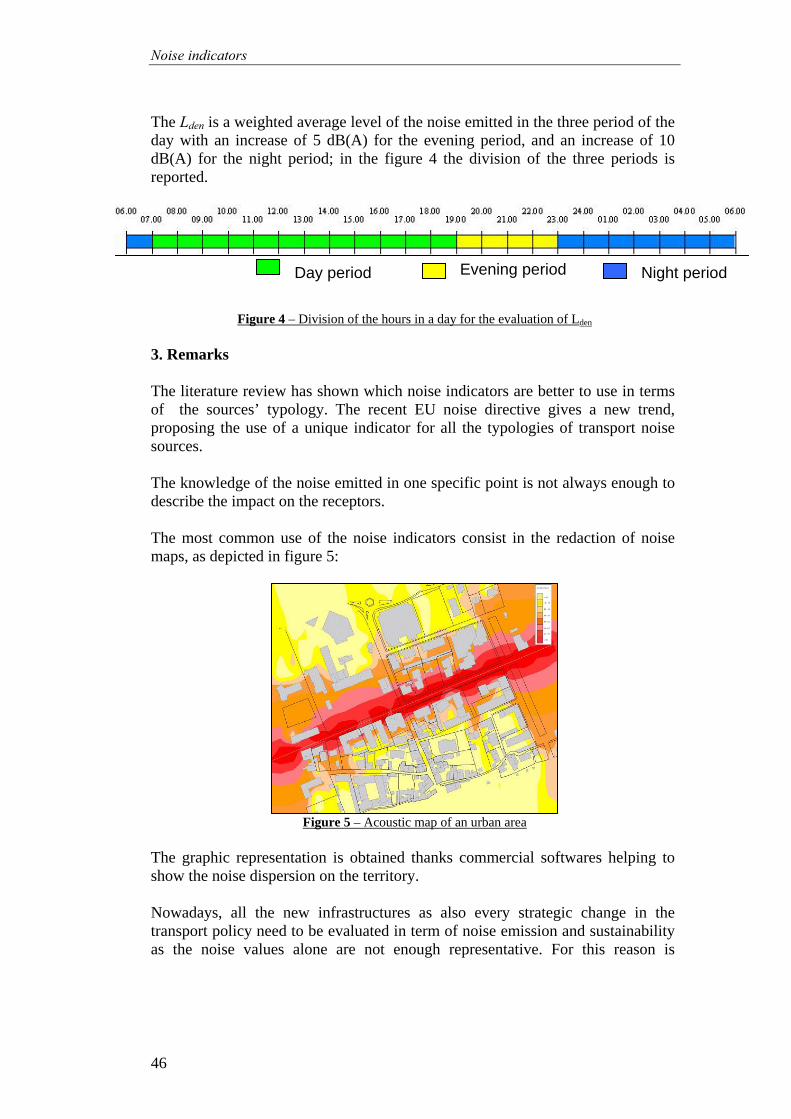
Noise indicators
46
The Lden is a weighted average level of the noise emitted in the three period of the day with an increase of 5 dB(A) for the evening period, and an increase of 10 dB(A) for the night period; in the figure 4 the division of the three periods is reported.
Figure 4 – Division of the hours in a day for the evaluation of Lden 3. Remarks The literature review has shown which noise indicators are better to use in terms of the sources’ typology. The recent EU noise directive gives a new trend, proposing the use of a unique indicator for all the typologies of transport noise sources. The knowledge of the noise emitted in one specific point is not always enough to describe the impact on the receptors. The most common use of the noise indicators consist in the redaction of noise maps, as depicted in figure 5:
Figure 5 – Acoustic map of an urban area
The graphic representation is obtained thanks commercial softwares helping to show the noise dispersion on the territory. Nowadays, all the new infrastructures as also every strategic change in the transport policy need to be evaluated in term of noise emission and sustainability as the noise values alone are not enough representative. For this reason is
Day period Evening period Night period
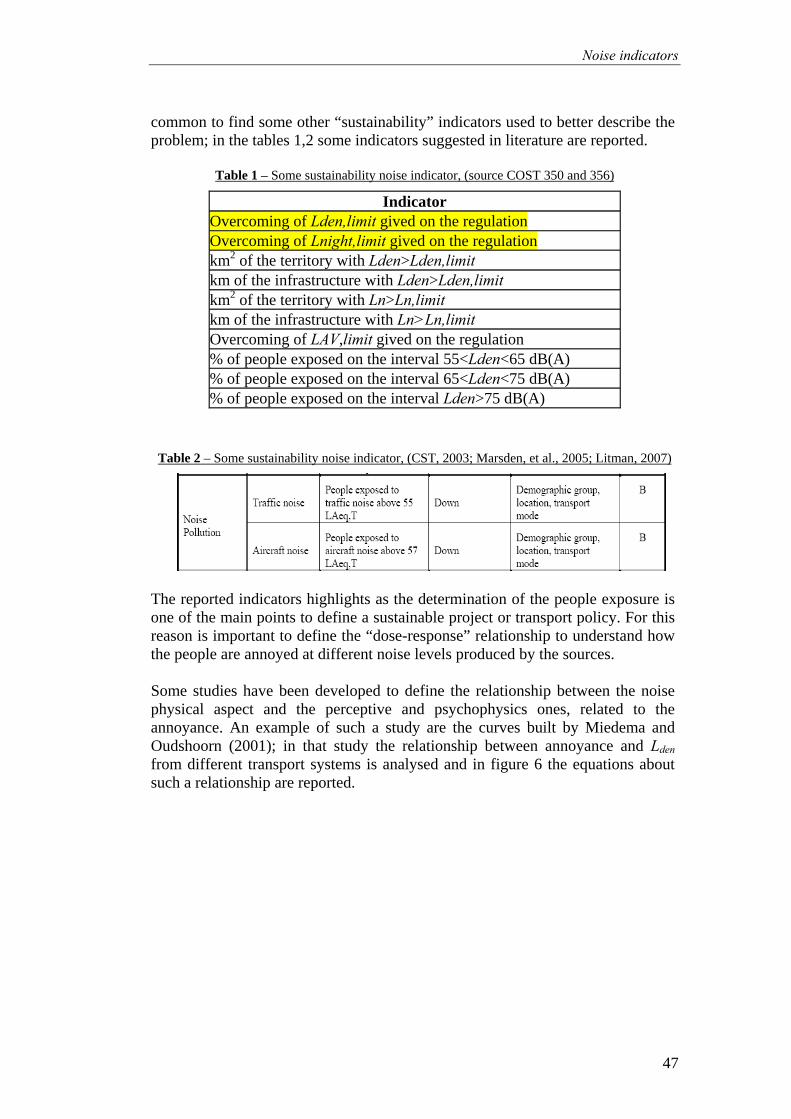
Noise indicators
47
common to find some other “sustainability” indicators used to better describe the problem; in the tables 1,2 some indicators suggested in literature are reported.
Table 1 – Some sustainability noise indicator, (source COST 350 and 356)
Indicator Overcoming of Lden,limit gived on the regulation Overcoming of Lnight,limit gived on the regulation km2 of the territory with Lden>Lden,limit km of the infrastructure with Lden>Lden,limit km2 of the territory with Ln>Ln,limit km of the infrastructure with Ln>Ln,limit Overcoming of LAV,limit gived on the regulation % of people exposed on the interval 55<Lden<65 dB(A) % of people exposed on the interval 65<Lden<75 dB(A) % of people exposed on the interval Lden>75 dB(A)
Table 2 – Some sustainability noise indicator, (CST, 2003; Marsden, et al., 2005; Litman, 2007)
The reported indicators highlights as the determination of the people exposure is one of the main points to define a sustainable project or transport policy. For this reason is important to define the “dose-response” relationship to understand how the people are annoyed at different noise levels produced by the sources. Some studies have been developed to define the relationship between the noise physical aspect and the perceptive and psychophysics ones, related to the annoyance. An example of such a study are the curves built by Miedema and Oudshoorn (2001); in that study the relationship between annoyance and Lden from different transport systems is analysed and in figure 6 the equations about such a relationship are reported.
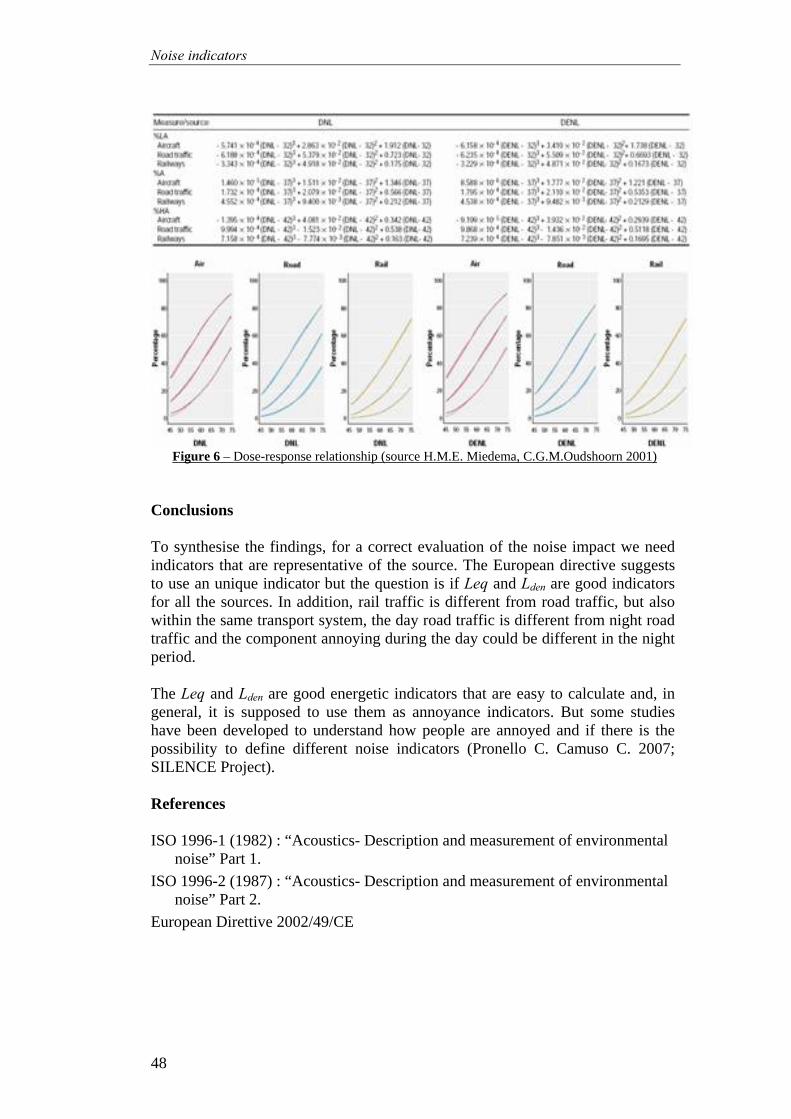
Noise indicators
48
Figure 6 – Dose-response relationship (source H.M.E. Miedema, C.G.M.Oudshoorn 2001)
Conclusions To synthesise the findings, for a correct evaluation of the noise impact we need indicators that are representative of the source. The European directive suggests to use an unique indicator but the question is if Leq and Lden are good indicators for all the sources. In addition, rail traffic is different from road traffic, but also within the same transport system, the day road traffic is different from night road traffic and the component annoying during the day could be different in the night period. The Leq and Lden are good energetic indicators that are easy to calculate and, in general, it is supposed to use them as annoyance indicators. But some studies have been developed to understand how people are annoyed and if there is the possibility to define different noise indicators (Pronello C. Camuso C. 2007; SILENCE Project). References ISO 1996-1 (1982) : “Acoustics- Description and measurement of environmental
noise” Part 1. ISO 1996-2 (1987) : “Acoustics- Description and measurement of environmental
noise” Part 2. European Direttive 2002/49/CE
Noise indicators
49
H. M.E. Miedema and C.G.M. Oudshoorn (2001): “Annoyance from Transportation Noise: Relationships with Exposure Metrics DNL and DENL and Their Confidence Intervals”; Environmental Health Perspectives, volume 109, n° 4 pp.409-416
Pronello,C., Camusso, C. (2007): “The acoustic climate in the city: an approach to define noise indicators in urban context for a sustainable transport planning”. 11th World Conference On Transport Research WCTR 2007
WHO (2003): “Technical meeting on exposure-response relationships of noise on health”, Meeting report, 19-21 September 2002 Bonn, Germany.
D.M. 31/10/1997 : Metodologia di misura del rumore aeroportuale. CST (2003), Sustainable Transportation Performance Indicators, Centre for
Sustainable Transportation (www.cstctd.org); at http://cst.uwinnipeg.ca/completed.html.
Greg Marsden, et al. (2005), Appraisal of Sustainability: Environmental Indicators, Institute for Transport Studies, University of Leeds ; at www.its.leeds.ac.uk/projects/sustainability/resources/Appraisal%20of%20Sustainability%20in%20Transport%20-%20Environment%20Indicators.pdf.
Mondaca Lo Giudice G, Santoboni S. (1995): Acustica, ed. Masson Todd Litman (2007) Well Measured: Developing Indicators for Comprehensive
and Sustainable Transport Planning, Victoria Transport Policy Institute (www.vtpi.org); at www.vtpi.org/wellmeas.pdf
SILENCE Project: http://www.silence-ip.org/site/

Noise indicators
50
51
Developing Composite Indicators for Policy-Making: A Brief Methodological Framework and Considerations
Michaela Saisana European Commission – Joint Research Centre – Italy [email protected] http://composite-indicators.jrc.ec.europa.eu/
Abstract This summary paper sketches upon the extent to which composite indicators (CIs) can effectively underpin the development of data-driven narratives for policy consumption. An attempt is made to summarise the controversy surrounding the use of CIs with practical and applied examples from the recent literature. We then discuss briefly the main steps for developing a CI. We argue in favour of multiple simulations to represent different scenarios in the construction of a CI prior to drawing recommendations for policy-making. Finally, we try to establish a link between the analytic use of CIs and the development of a robust culture of evaluation of policies based on information. 1. Introduction A composite indicator is a function of variables and weights, which aims at delivering a measure of country performance either ordinal (rank) or cardinal (score). Weights may represent the relative importance of each variable or be implied by the data, and the function may involve linear or geometric averaging, use of outscoring matrix in a multi-criteria setting or other. In their simplest form, composite indicators (CIs) can be achieved by averaging the ranks given by the individual variables to each country, or even the scores given in the form of stars or other visualisation equivalent.
The popularity of composite indicators in practice is likely due to what Saisana et al. (2005) distillate into: “the temptation of stakeholders and practitioners to summarize complex and sometime elusive process (e.g. sustainability or a single-market policy) into a single figure to benchmark country performance for policy consumption seems irresistible.”
In other words, one would argue that the construction of a CI is driven by the need for advocacy and intellectual debates, whose rationale can be mainly identified in the generation of narratives supporting the subject of the advocacy. Yet, when decision makers are concerned, it is likely that for policy action individual variables and quantitative analyses (e.g. cost-benefit) are more relevant than aggregate measures. In fact along those lines, Sharpe (2004) notes that: “The aggregators believe there are two major reasons that there is value in combining
Developing Composite Indicators for Policy-Making. A Brief Methodological Framework and Considerations
52
indicators in some manner to produce a bottom line. They believe that such a summary statistic can indeed capture reality and is meaningful, and that stressing the bottom line is extremely useful in garnering media interest and hence the attention of policy makers. The second school, the non-aggregators, believe one should stop once an appropriate set of indicators has been created and not go the further step of producing a composite index. Their key objection to aggregation is what they see as the arbitrary nature of the weighting process by which the variables are combined.”
It appears that the controversy on the use of aggregate measures unfolds along an analytic versus pragmatic axis. The core of the non-aggregators’ argument is in the subjective (analytic) nature of these measures, whilst the core of aggregators favouritism is on the practical use of composite indicators. For example, in the 1980s, GDP per capita was considered the best indicator for measuring development and the related issues such as health, and social well-being. Since the 1990s there has been a shift from this reductionism and the analytic problems associated with the GDP (Rifkin 2004, p. 70) towards more multi-dimensional indicators of well-being, such as the Economist’s Quality-of-life index (Economist, 2005), the Human Development Index (UN, 2008), or the Genuine Progress Indicator (Talberth et al. 2006). Despite the criticism, this literature hardly seems to dent GDP’s rather universal pragmatic acceptance.
The “lack of consensus” is at times seen as a defining property of composite indicators, and while one may hypothesise a consensus between the association of key variables with the subject of the index, weights will most likely remain controversial (Cherchye et al., 2005). At the same time, a given constituency may come to accept an aggregate measure (and reach compromise on weighting) on a CI to be used to benchmark best practices. A CI of countries’ industrial competitiveness proposed by an international organisation may lead to a much needed soul-searching exercise within constituencies of countries even if disagreement may exist on the measures themselves.
The point of these considerations is that subjectivity and fitness need not be antithetical. They are in fact both at play when constructing and adopting a CI, where inter-subjectivity may be at the core of the exercise, such as when participative approaches (such as budget allocation or analytic hierarchy process) to weight negotiations are adopted. Thus, these only apparently conflicting properties underpin CIs suitability for advocacy and we would add that, however good the scientific basis for a given CI, its acceptance relies on negotiation and peer acceptance.
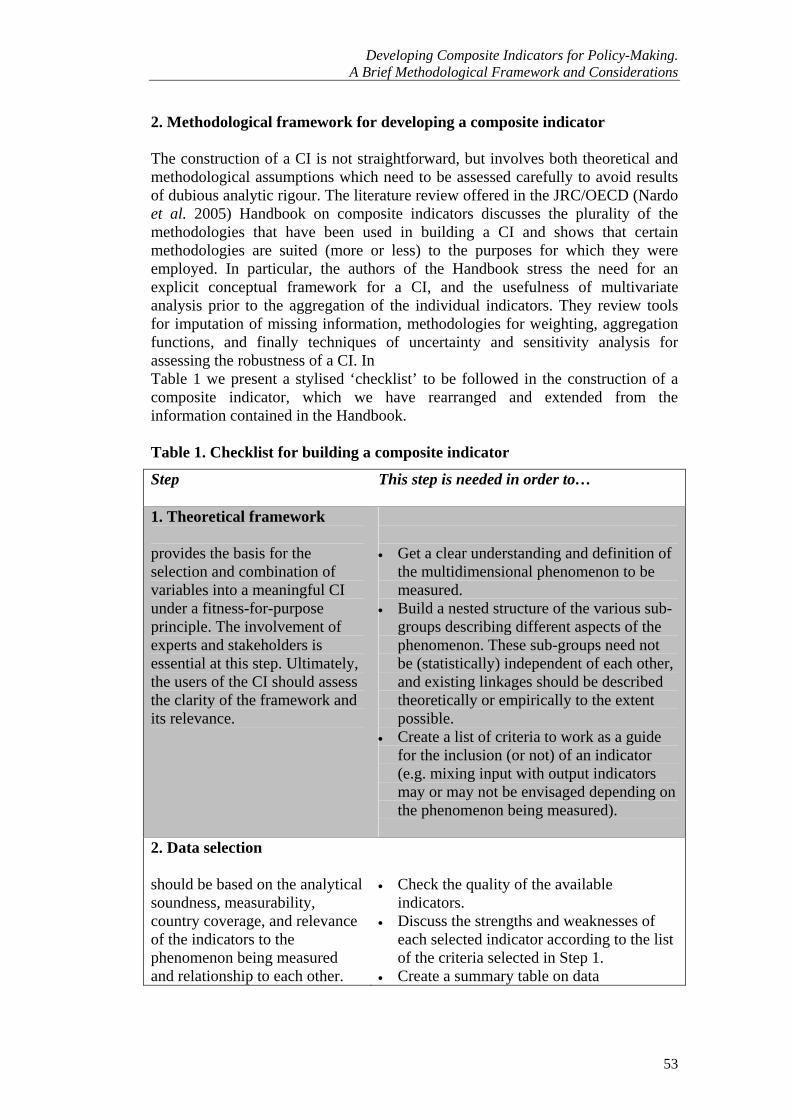
Developing Composite Indicators for Policy-Making. A Brief Methodological Framework and Considerations
53
2. Methodological framework for developing a composite indicator The construction of a CI is not straightforward, but involves both theoretical and methodological assumptions which need to be assessed carefully to avoid results of dubious analytic rigour. The literature review offered in the JRC/OECD (Nardo et al. 2005) Handbook on composite indicators discusses the plurality of the methodologies that have been used in building a CI and shows that certain methodologies are suited (more or less) to the purposes for which they were employed. In particular, the authors of the Handbook stress the need for an explicit conceptual framework for a CI, and the usefulness of multivariate analysis prior to the aggregation of the individual indicators. They review tools for imputation of missing information, methodologies for weighting, aggregation functions, and finally techniques of uncertainty and sensitivity analysis for assessing the robustness of a CI. In Table 1 we present a stylised ‘checklist’ to be followed in the construction of a composite indicator, which we have rearranged and extended from the information contained in the Handbook. Table 1. Checklist for building a composite indicator
Step
This step is needed in order to…
1. Theoretical framework provides the basis for the selection and combination of variables into a meaningful CI under a fitness-for-purpose principle. The involvement of experts and stakeholders is essential at this step. Ultimately, the users of the CI should assess the clarity of the framework and its relevance.
• Get a clear understanding and definition of
the multidimensional phenomenon to be measured.
• Build a nested structure of the various sub-groups describing different aspects of the phenomenon. These sub-groups need not be (statistically) independent of each other, and existing linkages should be described theoretically or empirically to the extent possible.
• Create a list of criteria to work as a guide for the inclusion (or not) of an indicator (e.g. mixing input with output indicators may or may not be envisaged depending on the phenomenon being measured).
2. Data selection should be based on the analytical soundness, measurability, country coverage, and relevance of the indicators to the phenomenon being measured and relationship to each other.
• Check the quality of the available
indicators. • Discuss the strengths and weaknesses of
each selected indicator according to the list of the criteria selected in Step 1.
• Create a summary table on data
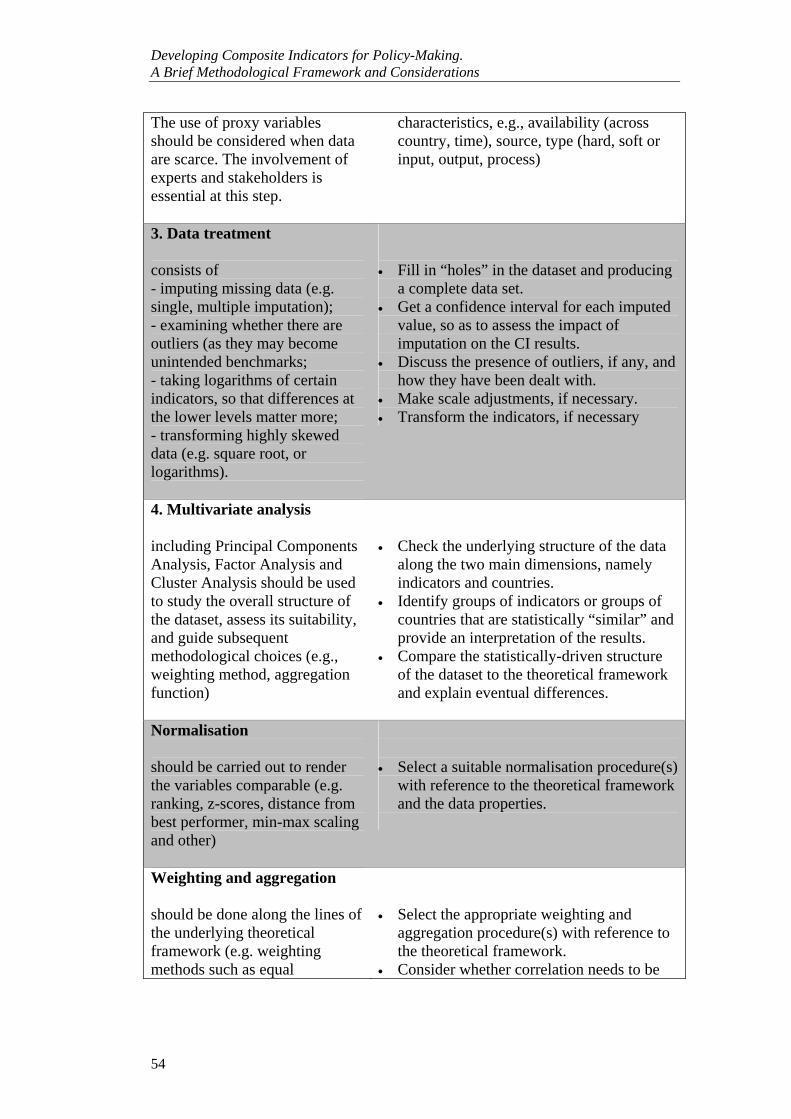
Developing Composite Indicators for Policy-Making. A Brief Methodological Framework and Considerations
54
The use of proxy variables should be considered when data are scarce. The involvement of experts and stakeholders is essential at this step.
characteristics, e.g., availability (across country, time), source, type (hard, soft or input, output, process)
3. Data treatment consists of - imputing missing data (e.g. single, multiple imputation); - examining whether there are outliers (as they may become unintended benchmarks; - taking logarithms of certain indicators, so that differences at the lower levels matter more; - transforming highly skewed data (e.g. square root, or logarithms).
• Fill in “holes” in the dataset and producing
a complete data set. • Get a confidence interval for each imputed
value, so as to assess the impact of imputation on the CI results.
• Discuss the presence of outliers, if any, and how they have been dealt with.
• Make scale adjustments, if necessary. • Transform the indicators, if necessary
4. Multivariate analysis including Principal Components Analysis, Factor Analysis and Cluster Analysis should be used to study the overall structure of the dataset, assess its suitability, and guide subsequent methodological choices (e.g., weighting method, aggregation function)
• Check the underlying structure of the data
along the two main dimensions, namely indicators and countries.
• Identify groups of indicators or groups of countries that are statistically “similar” and provide an interpretation of the results.
• Compare the statistically-driven structure of the dataset to the theoretical framework and explain eventual differences.
Normalisation should be carried out to render the variables comparable (e.g. ranking, z-scores, distance from best performer, min-max scaling and other)
• Select a suitable normalisation procedure(s)
with reference to the theoretical framework and the data properties.
Weighting and aggregation should be done along the lines of the underlying theoretical framework (e.g. weighting methods such as equal
• Select the appropriate weighting and
aggregation procedure(s) with reference to the theoretical framework.
• Consider whether correlation needs to be
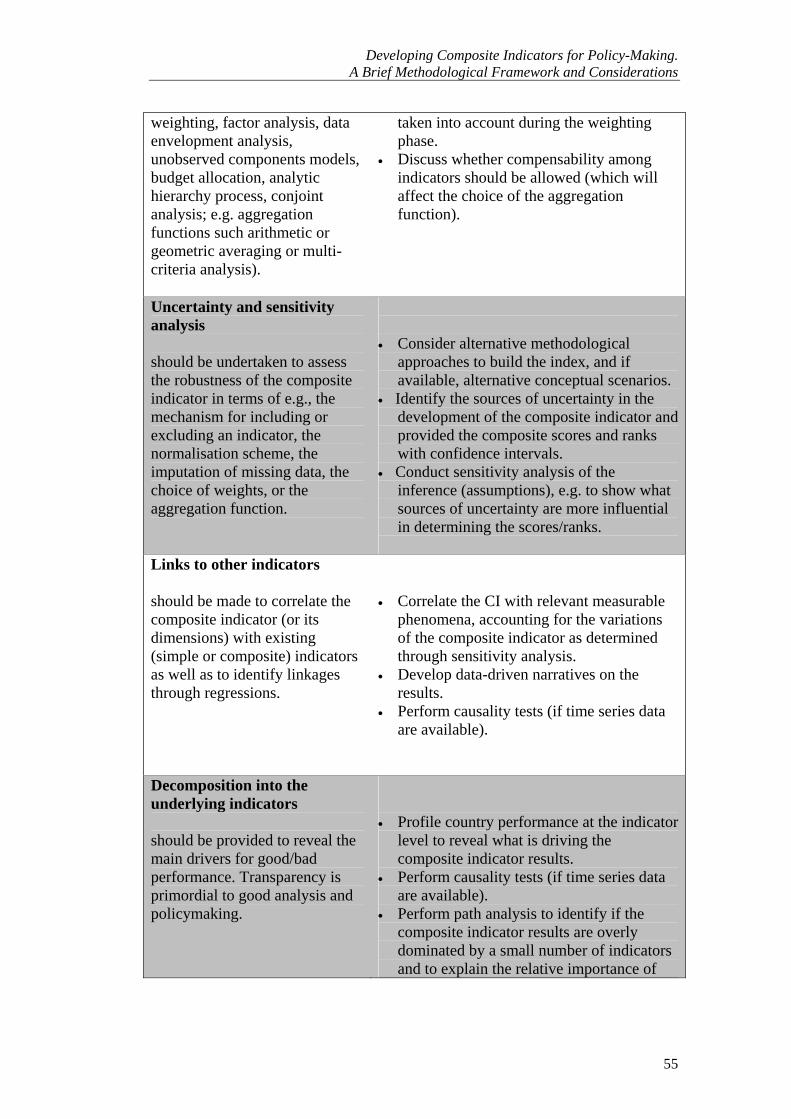
Developing Composite Indicators for Policy-Making. A Brief Methodological Framework and Considerations
55
weighting, factor analysis, data envelopment analysis, unobserved components models, budget allocation, analytic hierarchy process, conjoint analysis; e.g. aggregation functions such arithmetic or geometric averaging or multi-criteria analysis).
taken into account during the weighting phase.
• Discuss whether compensability among indicators should be allowed (which will affect the choice of the aggregation function).
Uncertainty and sensitivity analysis should be undertaken to assess the robustness of the composite indicator in terms of e.g., the mechanism for including or excluding an indicator, the normalisation scheme, the imputation of missing data, the choice of weights, or the aggregation function.
• Consider alternative methodological
approaches to build the index, and if available, alternative conceptual scenarios.
• Identify the sources of uncertainty in the development of the composite indicator and provided the composite scores and ranks with confidence intervals.
• Conduct sensitivity analysis of the inference (assumptions), e.g. to show what sources of uncertainty are more influential in determining the scores/ranks.
Links to other indicators should be made to correlate the composite indicator (or its dimensions) with existing (simple or composite) indicators as well as to identify linkages through regressions.
• Correlate the CI with relevant measurable
phenomena, accounting for the variations of the composite indicator as determined through sensitivity analysis.
• Develop data-driven narratives on the results.
• Perform causality tests (if time series data are available).
Decomposition into the underlying indicators should be provided to reveal the main drivers for good/bad performance. Transparency is primordial to good analysis and policymaking.
• Profile country performance at the indicator
level to reveal what is driving the composite indicator results.
• Perform causality tests (if time series data are available).
• Perform path analysis to identify if the composite indicator results are overly dominated by a small number of indicators and to explain the relative importance of
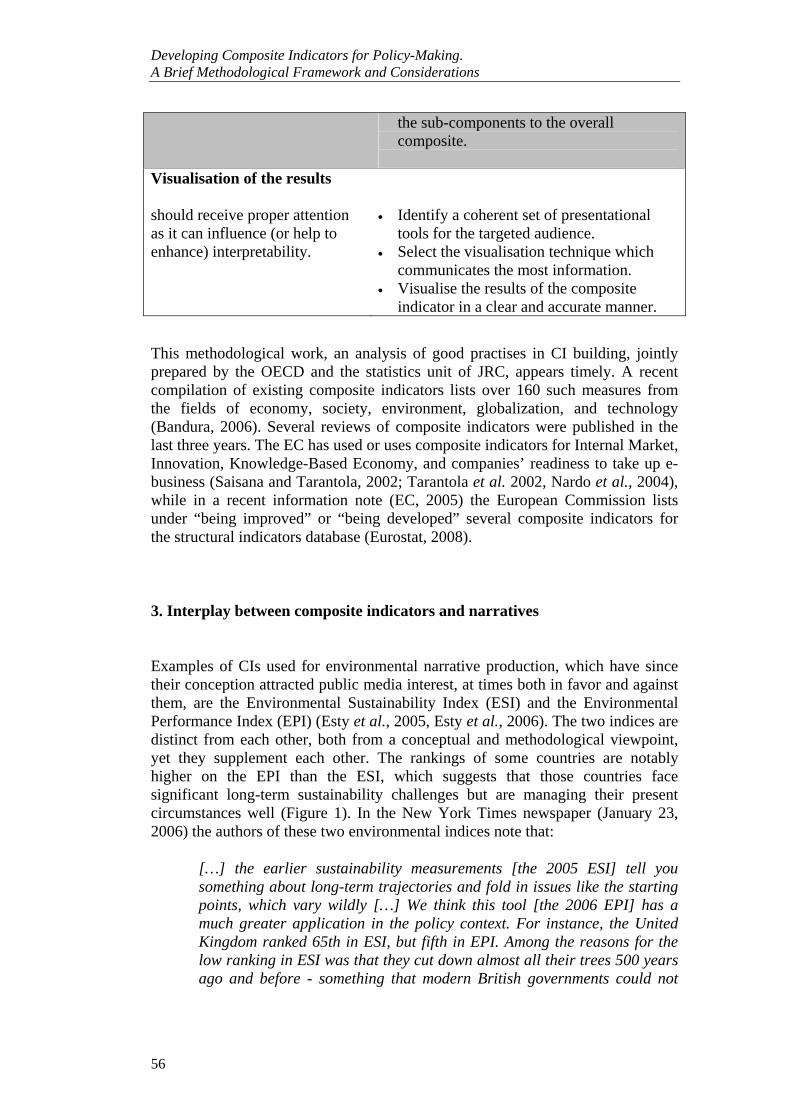
Developing Composite Indicators for Policy-Making. A Brief Methodological Framework and Considerations
56
the sub-components to the overall composite.
Visualisation of the results should receive proper attention as it can influence (or help to enhance) interpretability.
• Identify a coherent set of presentational
tools for the targeted audience. • Select the visualisation technique which
communicates the most information. • Visualise the results of the composite
indicator in a clear and accurate manner.
This methodological work, an analysis of good practises in CI building, jointly prepared by the OECD and the statistics unit of JRC, appears timely. A recent compilation of existing composite indicators lists over 160 such measures from the fields of economy, society, environment, globalization, and technology (Bandura, 2006). Several reviews of composite indicators were published in the last three years. The EC has used or uses composite indicators for Internal Market, Innovation, Knowledge-Based Economy, and companies’ readiness to take up e-business (Saisana and Tarantola, 2002; Tarantola et al. 2002, Nardo et al., 2004), while in a recent information note (EC, 2005) the European Commission lists under “being improved” or “being developed” several composite indicators for the structural indicators database (Eurostat, 2008).
3. Interplay between composite indicators and narratives
Examples of CIs used for environmental narrative production, which have since their conception attracted public media interest, at times both in favor and against them, are the Environmental Sustainability Index (ESI) and the Environmental Performance Index (EPI) (Esty et al., 2005, Esty et al., 2006). The two indices are distinct from each other, both from a conceptual and methodological viewpoint, yet they supplement each other. The rankings of some countries are notably higher on the EPI than the ESI, which suggests that those countries face significant long-term sustainability challenges but are managing their present circumstances well (Figure 1). In the New York Times newspaper (January 23, 2006) the authors of these two environmental indices note that:
[…] the earlier sustainability measurements [the 2005 ESI] tell you something about long-term trajectories and fold in issues like the starting points, which vary wildly […] We think this tool [the 2006 EPI] has a much greater application in the policy context. For instance, the United Kingdom ranked 65th in ESI, but fifth in EPI. Among the reasons for the low ranking in ESI was that they cut down almost all their trees 500 years ago and before - something that modern British governments could not
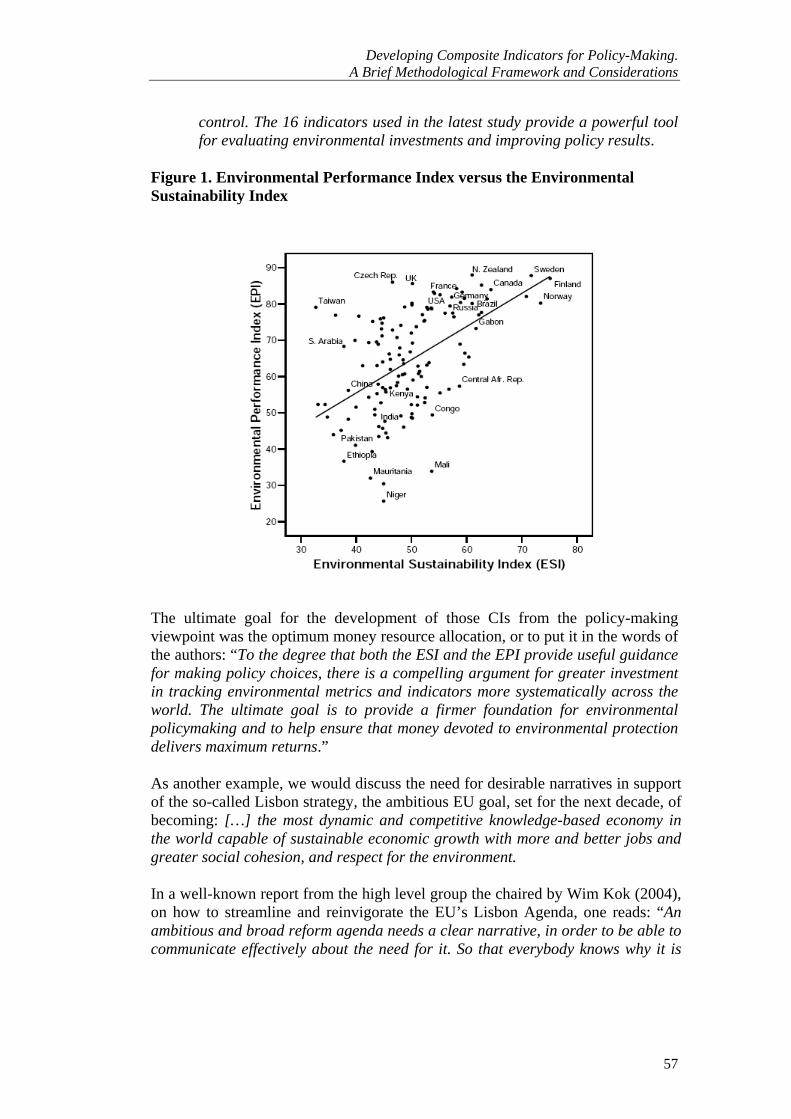
Developing Composite Indicators for Policy-Making. A Brief Methodological Framework and Considerations
57
control. The 16 indicators used in the latest study provide a powerful tool for evaluating environmental investments and improving policy results.
Figure 1. Environmental Performance Index versus the Environmental Sustainability Index
The ultimate goal for the development of those CIs from the policy-making viewpoint was the optimum money resource allocation, or to put it in the words of the authors: “To the degree that both the ESI and the EPI provide useful guidance for making policy choices, there is a compelling argument for greater investment in tracking environmental metrics and indicators more systematically across the world. The ultimate goal is to provide a firmer foundation for environmental policymaking and to help ensure that money devoted to environmental protection delivers maximum returns.”
As another example, we would discuss the need for desirable narratives in support of the so-called Lisbon strategy, the ambitious EU goal, set for the next decade, of becoming: […] the most dynamic and competitive knowledge-based economy in the world capable of sustainable economic growth with more and better jobs and greater social cohesion, and respect for the environment.
In a well-known report from the high level group the chaired by Wim Kok (2004), on how to streamline and reinvigorate the EU’s Lisbon Agenda, one reads: “An ambitious and broad reform agenda needs a clear narrative, in order to be able to communicate effectively about the need for it. So that everybody knows why it is
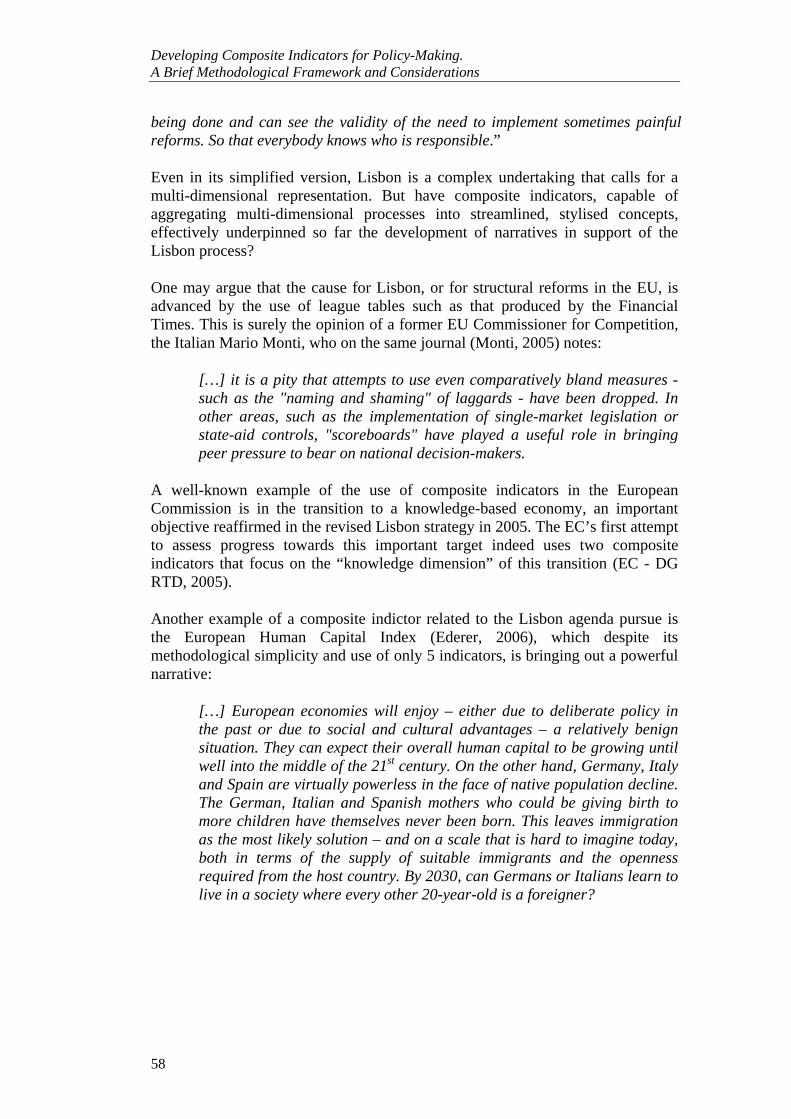
Developing Composite Indicators for Policy-Making. A Brief Methodological Framework and Considerations
58
being done and can see the validity of the need to implement sometimes painful reforms. So that everybody knows who is responsible.”
Even in its simplified version, Lisbon is a complex undertaking that calls for a multi-dimensional representation. But have composite indicators, capable of aggregating multi-dimensional processes into streamlined, stylised concepts, effectively underpinned so far the development of narratives in support of the Lisbon process?
One may argue that the cause for Lisbon, or for structural reforms in the EU, is advanced by the use of league tables such as that produced by the Financial Times. This is surely the opinion of a former EU Commissioner for Competition, the Italian Mario Monti, who on the same journal (Monti, 2005) notes:
[…] it is a pity that attempts to use even comparatively bland measures - such as the "naming and shaming" of laggards - have been dropped. In other areas, such as the implementation of single-market legislation or state-aid controls, "scoreboards" have played a useful role in bringing peer pressure to bear on national decision-makers.
A well-known example of the use of composite indicators in the European Commission is in the transition to a knowledge-based economy, an important objective reaffirmed in the revised Lisbon strategy in 2005. The EC’s first attempt to assess progress towards this important target indeed uses two composite indicators that focus on the “knowledge dimension” of this transition (EC - DG RTD, 2005).
Another example of a composite indictor related to the Lisbon agenda pursue is the European Human Capital Index (Ederer, 2006), which despite its methodological simplicity and use of only 5 indicators, is bringing out a powerful narrative:
[…] European economies will enjoy – either due to deliberate policy in the past or due to social and cultural advantages – a relatively benign situation. They can expect their overall human capital to be growing until well into the middle of the 21st century. On the other hand, Germany, Italy and Spain are virtually powerless in the face of native population decline. The German, Italian and Spanish mothers who could be giving birth to more children have themselves never been born. This leaves immigration as the most likely solution – and on a scale that is hard to imagine today, both in terms of the supply of suitable immigrants and the openness required from the host country. By 2030, can Germans or Italians learn to live in a society where every other 20-year-old is a foreigner?
Developing Composite Indicators for Policy-Making. A Brief Methodological Framework and Considerations
59
4. Composite indicators for analytic purposes Although we have thus far placed most of our emphasis on the interplay between composite indicators and narratives, the use of composite indicators for analytic purposes should not be discounted. Nicoletti et al. (2000) present an analysis of product market regulation in OECD countries based on a composite indicator. Sapir (2005) describes a taxonomy of EU social models among Mediterranean, Nordic, Anglo-Saxon and Continental countries using two criteria- “efficiency” and “equity” (Figure 2). A social model is considered: (a) efficient, if it provides sufficient incentive to work and generates relatively high employment rates, (b) equitable, if it keeps the risk of poverty relatively low. The “Mediterranean” model, characterised by relatively low levels of employment and a high risk of poverty, provides neither equity nor efficiency. With the “Anglo-Saxon” and “Continental” models there appears to be a trade-off between equity and efficiency. Only the “Nordic” model, with high employment rates, and a low risk of poverty combines both equity and efficiency. Critically, the “Continental” and “Mediterranean” models, which together account for two-thirds of the GDP of the entire EU-25 and 90 per cent of the GDP of the 12-member eurozone, are inefficient and unsustainable. Another reading of the figure emphasizes the sustainability of social models. Models that are not efficient, and have the wrong incentives to work, are simply not sustainable in the face of growing strains on public finances coming from globalisation, technological change and population ageing. On the other hand, models that are not equitable may be sustainable.
Figure 2. The Four European Models based on equity (probability of escaping poverty) and efficiency (employment rate)

Developing Composite Indicators for Policy-Making. A Brief Methodological Framework and Considerations
60
Along the same line of producing a taxonomy of countries in two complex dimensions such as “environmental performance” and “economic competitiveness”, Esty et al. (2006) present the plot of the Environmental Performance Index versus the World Economic Forum’s Global Competitiveness Index (Lopez-Claro et al., 2005), and conclude that good environmental results do not have to be sacrificed to achieve economic success (Figure 3 3). Although this result may be partly due to the high degree of correlation between both of these measures and GDP, the correlation confirms the Porter Hypothesis that demanding environmental standards will spur innovation and competitive advantage (Porter & van der Linde, 1995; Porter, 2001). At the same time the taxonomy reveals that no country can achieve a high level of competitiveness without having achieved first a satisfactory level of environmental performance, although the contrary is feasible. Such a result goes in favour of some economists’ argument that it is possible for the concepts of sustainable development and competitiveness to merge if enacted wisely, so that there is not an inevitable trade-off (Hargroves & Smith 2005).
Figure 3. Plot of the Environmental Performance index versus the Global Competitiveness Index
On the attraction exerted by composite indicators, we come back to the example of the Human Development Index (HDI) that has been criticized for aggregating indicators of education, health and income, that tend to be correlated, and for the arbitrary weights attached to them. Its worth noting that Amartya Sen, Nobel prize winner in 1998 and a designer of the concept of human development through his concept of “Capabilities” (Sen, 1989), was originally opposed to the idea of combining different indicators to form a CI, mainly on methodological
Developing Composite Indicators for Policy-Making. A Brief Methodological Framework and Considerations
61
grounds. Sen preferred to have different separate indicators on social, economic and political features. He later claimed that his earlier view was mistaken as it was too purist. Acknowledging the limitations, but focusing on the potentiality, Mahbub ul Haq (the pioneer of HDI) states that “For any useful policy index, some compromises must be made.” (Haq 1995, p. 59). When questioned about the data reliability/quality of HDI, Haq said that it should be used to improve data quality, rather than to abandon the exercise. “To stop the production of the HDI on this reasoning would be to throw out the baby rather than change the bath water” (Haq 1995, p. 60). In fact, all the debate on development and public policy and media attention would not have been possible if the idea had been aborted at the indicators level, without coming to a CI (Fukuda-Parr & Kumar 2003). The HDI scores and ranks have persuaded many countries to invest more resources and effort in preparing better statistical series. Meanwhile, HDI scores should be treated as indicating a sense of direction rather than precise magnitudes.
5. Composite indicators and the need for multiple simulations Despite its appealing features, a composite indicator involves subjective stages: the selection of indicators, the weights to be attached to the indicators, the aggregation function, and so on. Without careful analysis based on solid factual foundations, bad choices get made, investments under-perform, and political divisions widen. At the same time, mistrust is often placed in the results of just one model. Michael Crichton in his book “State of Fears” (Crichton, 2005, p.50) is being provocative by arguing that: “If you read some author who say ‘We find that anthropogenic greenhouse gases and sulphates have had a detectable influence on sea-level pressure’ it sounds like they went into the world and measured something. Actually, they just run a simulation. They talk as if simulation were real-world data. They’re not. That’s a problem that has to be fixed. I favor a stamp WARNING: COMPUTER SIMULATION – MAY BE ERRONEOUS and UNVERIFIABLE.”
As there is no universally accepted model to construct a CI, different scenarios (simulations) need to be considered. Hopefully, the picture provided by a CI will resemble the “median” of the simulated scenarios, in order to be considered representative of the greater space of inferences and not biased against certain political choices or other “feelings”. This is exactly a challenge that needs to be addressed, as activists’ advocacy may lead to the so-called “Rhetoric Selection” of statistical information whereby “feelings and facts are merged in reaching for the audience’s empathy and wallets” (Rosling et al., 2005). In the example of the 2006 Environmental Performance Index, the median of the simulated scenarios correlated high with the original country ranks provided by the Index (R2 = 0.89, Figure 4). This outcome produces a quite high degree of confidence that, with a few exceptions, most countries in the 2006 EPI are ranked roughly in the correct place, and that no deliberate bias was introduced in the index.
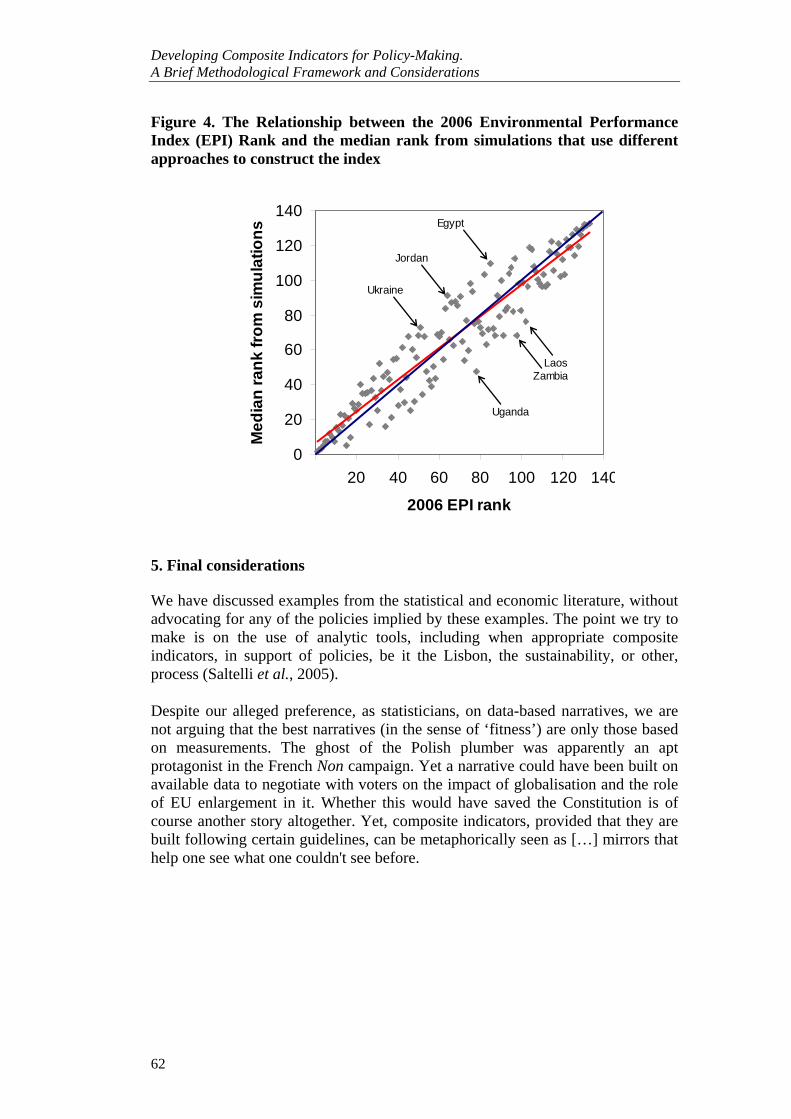
Developing Composite Indicators for Policy-Making. A Brief Methodological Framework and Considerations
62
Figure 4. The Relationship between the 2006 Environmental Performance Index (EPI) Rank and the median rank from simulations that use different approaches to construct the index
5. Final considerations We have discussed examples from the statistical and economic literature, without advocating for any of the policies implied by these examples. The point we try to make is on the use of analytic tools, including when appropriate composite indicators, in support of policies, be it the Lisbon, the sustainability, or other, process (Saltelli et al., 2005).
Despite our alleged preference, as statisticians, on data-based narratives, we are not arguing that the best narratives (in the sense of ‘fitness’) are only those based on measurements. The ghost of the Polish plumber was apparently an apt protagonist in the French Non campaign. Yet a narrative could have been built on available data to negotiate with voters on the impact of globalisation and the role of EU enlargement in it. Whether this would have saved the Constitution is of course another story altogether. Yet, composite indicators, provided that they are built following certain guidelines, can be metaphorically seen as […] mirrors that help one see what one couldn't see before.
0
20
40
60
80
100
120
140
20 40 60 80 100 120 140
2006 EPI rank
Med
ian
rank
from
sim
ulat
ions
Egypt
Jordan
Ukraine
LaosZambia
Uganda
Developing Composite Indicators for Policy-Making. A Brief Methodological Framework and Considerations
63
References
Bandura R. (2006), A Survey of Composite Indices Measuring Country Performance: 2006 Update, United Nations Development Programme – Office of Development Studies, available at www.thenewpublicfinance.org/background/Measuring%20country%20performance_nov2006%20update.pdf
Cherchye L., Knox L., Moesen W., van Puyenbroeck T. (2005) One Market, One Number? A Composite Indicator Assessment of EU Internal Market Dynamics. Discussion paper (part of the EC-DG RTD project on Knowledge Economy Indicators), University of Leuven, http://ssrn.com/abstract=808905
Chricton M. (2004) State of Fear, HarperCollins Pubs, 603 pages. EC (2005) Information Note on STRUCTURAL INDICATORS, Directorate
General Economic and Financial Affairs, internal document. EC-DG RTD (2005) Key Figures 2005 on Science, Technology and Innovation
towards a European knowledge area, http://www.cordis.lu/indicators/publications.htm
Economist (2005) The Economist Intelligence Unit’s quality-of-life index, http://www.economist.com/media/pdf/quality_of_life.pdf
Ederer P. (2006) Innovation at Work: The European Human Capital Index. Lisbon Council and Deutschland Denken! http://www.lisboncouncil.net/media/lisbon_council_european_human_capital_index.pdf
Esty D., Levy M., Srebotnjak T., de Sherbinin A. (2005) 2005 Environmental Sustainability Index: Benchmarking National Environmental Stewardship. New Haven: Yale Center for Environmental Law & Policy.
Esty D., Levy M., Srebotnjak T., de Sherbinin A., Kim C., Anderson B. (2006) Pilot 2006 Environmental Performance Index. New Haven: Yale Center for Environmental Law & Policy.
Eurostat (2008) Structural Indicators, http://europa.eu.int/comm/eurostat/structuralindicators
Fukuda-Parr, Kumar S. (2003) Readings in Human Development. Oxford University Press, Oxford.
Haq M. (1995) Reflections on Human Development. Oxford University Press, New York.
Hargroves K., Smith M. (2005) The Natural Advantage of Nations: Business Opportunities, Innovation and Governance in the 21st Century, 525 pages.
Kok W. (2004) The High Level Group on Lisbon Strategy - Facing the Challenge, European Communities, Luxembourg.
Lopez-Claro A., Porter M.E., Schwab K. (2005) Global Competitiveness Report 2005-2006. Geneva, World Economic Forum.
Monti M. (2005) Toughen up EU reform agenda and make it count, Financial Times, Published: March 21 2005.
Nardo M., Saisana M., Saltelli A., Tarantola S., Hoffman A., Giovannini E. (2005) Handbook on constructing composite indicators: methodology and user guide, OECD Statistics Working Paper, www.olis.oecd.org/olis/2005doc.nsf/LinkTo/std-doc(2005)3
Developing Composite Indicators for Policy-Making. A Brief Methodological Framework and Considerations
64
Nardo M., Tarantola S., Saltelli A., Andropoulos C., Buescher R, Karageorgos G., Latvala A., Noel F. (2004) The e-business readiness composite indicator for 2003: a pilot study, European Commission, EUR 21294EN, Joint Research Centre, Ispra, Italy.
Nicoletti G., Scarpetta S., Boylaud O. (2000) Summary indicators of product market regulation with an extension to employment protection legislation. OECD, Economics department working papers No. 226, ECO/WKP(99)18, http://www.oecd.org/eco/eco
Porter (2001) Economics and the History of Measurement. Supplement to the History of Political Economy 33, 4-22. Poverty-Environment
Porter M., van der Linde C. (1995) Toward a New Conception of the Environment-Competitiveness Relationship. Journal of Economic Perspectives, 9, 97-118.
Rifkin J. (2004) The European Dream, Tarcher-Penguin, New York. Rosling H., Rosling Rönnlund A., Rosling O. (2005) New software brings
statistics beyond the eye. OECD World Forum on Key Indicators, Palermo, 10-13 November 2004, http://www.oecd.org/dataoecd/39/48/33843977.doc
Saisana M., Saltelli A., Tarantola S. (2005) Uncertainty and Sensitivity analysis techniques as tools for the quality assessment of composite indicators. Journal of the Royal Statistical Society A, 168,(2), 307-323.
Saisana M., Tarantola S. (2002) State-of-the-Art Report on Current Methodologies and Practices for Composite Indicator Development. European Commission, EUR 20408 EN, Joint Research Centre, Ispra, Italy.
Sapir A. (2005) Globalisation and the Reform of European Social Models, http://www.bruegel.org/
Sen A. (1989) Development as Capabilities Expansion. Journal of Development Planning, 19, 41-58.
Sharpe A. (2004) Literature Review of Frameworks for Macro-indicators. Centre for the Study of Living Standards, Ottawa, Canada.
Talberth J., Cobb C., Slattery N. (2006) The Genuine Progress Indicator 2006. A Tool for Sustainable Development. Redefining Progress, San Francisco, http://www.rprogress.org/publications/2007/GPI%202006.pdf
Tarantola S., Saisana M., Saltelli A., Schmiedel F., Leapman N. (2002) Statistical techniques and participatory approaches for the composition of the European Internal Market Index 1992-2001, European Commission, EUR 20547 EN, Joint Research Centre, Ispra, Italy.
UN (2008) Human Development Report, http://hdr.undp.org/en/statistics/indices/hdi/
65
Integrating indicators measuring the environmental sustainability of transportation projects, plans and policies into decision making Farideh Ramjerdi, Patrick, Wäger, Benjamin Rousval, Luc Adolphe, Santiago Mancebo
Introduction Decision making involves integrating indicators that measures environmental sustainability along with other social and economic impacts of projects, plans and policies. The integration can be carried out by setting weights on different indicators and other economic and social impacts to bring these to a common cardinal scale. Implicit in this approach is the possibility of substitution between different impacts. This approach is the so called cost benefit analysis. The approach allows the ranking of projects, plans and policies. In this paper we summarise the theoretical underpinnings of cost benefit analysis and problems of this approach to aggregation in the context of sustainability. Alternative approach is multi-criteria decision approach. Multi-criteria decision analysis does not offer a solution by optimising over all the criteria. It should be viewed as a tool for structuring the decision making problem. It provides an insight into the nature of conflicts and by increasing transparency, facilitates political compromises and the development alternative plans and policies.
Sustainable development The World Commission on Environment and Development through its report (WCED, 1987), also called the Brundtland Report, introduced the notion of ‘sustainable development’ into the political agenda. The Report does not give a precise definition of ‘sustainable development’. The quotation that is usually taken as a point of departure is the following:
“Sustainable development is a development that meets the needs of the present without compromising the ability of future generations to meet their own needs”.
The Brundtland Report looks at sustainability both as a requirement for intra- and intergenerational justice.
Since WCED many definitions of sustainable development, often incompatible, have been offered. The differences can be linked to the differences in environmental ideologies. A central point of departure between the different views is related to substitutability between man-made capital and natural capital and the services provided by the ecological system (Hackett 2001). The spectrum of sustainability modes covers the very weak to very strong sustainability modes. A strong sustainability mode rejects that the man-made capital can perfectly substitute for the lost natural capital. In this view, some elements of the natural capital cannot be substituted by the man-made capital and some functions and services of ecosystems are essential to human survival and cannot be replaced. Other ecological assets such as landscape, space, relative peace and quite are
Integrating indicators measuring the environmental sustainability of transportation projects, plans and policies into decision making
66
essential to human wellbeing if not for human survival. These assets are regarded as critical natural capital and are not substitutable, if at all. Within a strong sustainability mode, policies and actions are governed by fixed standard approach, derived from absolute limits, precautionary principles, primary and secondary value of natural capital, constant natural capital, and strong version of safe minimum standard. The strong sustainability mode rejects the methodological assumptions in cost benefit analysis. However, it does not oppose the achievement of specified goals through cost effective measures, including economic measures (Speth 2005).
The interpretation of the role of technological development varies significantly among the sustainability modes. The direction and extent of technological change matters in reducing abatement costs. While much is known about past technological changes, less is known about future changes. Uncertainties pertain to the whole process of technological change, from invention to diffusion (Schumpeter 1942).
Transport has been recognised as the source of many adverse impacts on the ecological systems and there have been extensive research on and suggestions for policies, instruments and measures for remedies (Ramjerdi, 2007). Yet there has been an acknowledgement that the current trends in transport are not sustainable and difficult to deal with (see Stern, 2006; EEA, 2006). An understanding of the transport sector is crucial in this context since policies and plans are devised for implementation in this system and with an expectation to produce the intended results. The complexities of the transport sector are probably a main cause for the current unsustainable trends and the failure to change the course. Policies and plans involve costs and benefits that can occur over long periods of time. Provisions of infrastructures and changes in land use are such examples with impacts on environment that are often irreversible and associated with high degree of risk and uncertainty.
While there is not very much consensus on a definition for sustainable development, there is even less consensus on the interpretations of sustainable development for the transport sector or sustainable mobility. Nonetheless numerous definitions have been devised to incorporate the different dimensions of environmental/ ecological, economic, social and cultural sustainability (OECD 1996, Greene 2001, Verhoef and Feitelsson eds. 2001, Gudmundsson 2004, Kågeson 1994). Specifically, many researchers have put emphasis on defining indicators for sustainable mobility (Gilbert and Tanguay 2000). The indicators include those derived from current practices, stakeholders’ views on sustainability, or the current state and quality of the transport systems.
In summary a major concern in “sustainable development” is the interests of future generations. Uncertainties, risk, irreversibility, path dependency is central in the course to sustainability and needs to be addressed in the policies and plans. These issues are particularly important in the context of the transport sector.

Integrating indicators measuring the environmental sustainability of transportation projects, plans and policies into decision making
67
Social choice theory and sustainability For social choice theory to direct us on how to resolve the normative question on intra- and intergenerational justice, three fundamental questions on sustainable development should be resolved (Asheim, 2007). These are:
Justifying sustainability: From a normative perspective, why is it desirable for our generation to contribute to the implementation of sustainable development?
Characterizing sustainability: If sustainable development is implemented, what does it look like? How do we describe the situation if we are heading for the right destination?
Indicating sustainability: If we would like to implement sustainable development, how can we tell whether development is in fact sustainable? How to detect if we are off course?
Moral responsibility, rights, and ethics are central in defining sustainability. Different notions of ethics emphasises different aspects of the consequences of decisions for others and for the future. The list is however similar, its focus is on consumption, education, health and environment (Stern, 2006). The ethical position determines the implications of the assessments of these dimensions.
Ethical considerations emphasises that all perspectives would take account of the distribution of outcomes within and across generation, together with the risks involved in different actions, now and over time. Hence crucial to policy design and choice are the aggregation over consequences
(i) within generation,
(ii) over time, and
(iii) according to risk.
Aggregation across these dimensions poses different kinds of problems and ethical questions.
Other fundamental questions relevant for social choice are (Stern, 2006):
What do individuals value?
What is/should be their relation to decisions and decision-making?
What is the decision making process?
Who are the decision makers?
Welfare economics approach for aggregation The underlying ethics of welfare economics focuses on the consequences of a policy for the consumption of goods and services by individuals in a community. The perspective sees individuals as having, preferences, and their utility, or welfare, arising from consumption. In this perspective anything is a benefit that
Integrating indicators measuring the environmental sustainability of transportation projects, plans and policies into decision making
68
increases human well-being and anything is a cost that reduces human well-being1.
Goods and services can be defined in a broad way to include education, health, and goods appearing at different dates and in different circumstances. Thus the theory covers time and uncertainty. And, to the extent that individuals value the environment, that too is part of the analysis2. Aggregating social utility across individuals to come up with a measure of social welfare has its problems. Different value judgements can lead to different rankings of possible outcomes, and deciding what values should be applied is difficult in democratic societies3.
The standard welfare-economics framework has a single criterion, and implicitly, a single governmental decision-maker.
The ethical framework of standard welfare economics looks only at the consequences of actions, i.e., it has a consequentialism approach. Hence there is no room for ethical dimensions concerning the processes. Processes are important in other notions of ethics, including those based on concepts of rights, justice and freedoms.
There are other fundamental questions related to the underpinnings of welfare economics such as:
How preferences are formed (Consumer sovereignty)?
How preferences change?
Who has the moral authority to do so?
Cost benefit analysis The objective in cost-benefit analysis is to work out the policies that would be set by a decision-maker acting on behalf of the community and whose role it is to
1 “Economic theories and ideologies are founded on the principle that consumers have well-defined preferences, and consistently behave to advance their self-interest. Jeremy Bentham (1789) said “My notion of man is that ... he aims at happiness ... in every thing he does”. Herb Simon (1956) said “The rational man of economics is a maximizer, who will settle for nothing less than the best”. Some economists have even taken self-interest to tautologically explain choice. Consumers who know their own tastes, and are relentlessly self-interested and self-reliant, relish choice, and welcome market opportunities that expand their options. Most economists accept this concept of the consumer, and the attendant economic theory that demonstrates the efficiency and Pareto optimality of decentralized, competitive markets”. McFadden (2005). Jeremy Bentham (1748-1832) put forward the calculus of the total utility for the society from the aggregation of the individual interests (Bentham, 1988). Inspired by Bentham’s works, Edgeworth (1845-1926), a utilitarian economist, was mainly concerned with the maximization of the utility of the different competing agents in an economy. He proposed the indifference curves (lines of equal utility) for each agent and the contract curve, a curve that corresponds to the notion of the Pareto or efficient set (Newman, 2003). Soon after, Pareto (1848-1923) gave a definition of the optimal social utility (Pareto, 1906). 2 It is important to emphasise that many goods or services, including education, health and the environment, perform a dual role: individuals directly value them and they are inputs into the use or acquisition of other consumption good. They are both goals and instruments. 3
Sen (1982) points to a number of limitations in identification of group preferences (in addition to the obvious problems of time). Sen suggests that a group welfare function is best approximated by the accepted value judgements of society. Rather than seeking to identify a group preference function,
Integrating indicators measuring the environmental sustainability of transportation projects, plans and policies into decision making
69
improve, or maximise, overall social welfare. CBA functions on the basis that a better allocation of resources is one that meets people’s preferences. Aggregation over individuals The overall social welfare depends on the welfare of each individual in the community. Fundamental to cost-benefit is the aggregation of individual preferences into collective ones, i.e., summation of costs and benefits over all the individuals in a society. A main problem in CBA arises over the measurement of cost and benefits in one scale to be able to end up with numerical values for summation. There are two central problems with this approach. One is related to the valuation of costs and benefits for an individual. This implies individual’s values of cost and benefits should be the basis. The problem of solicitation of individual’s values based on response to hypothetical questions or on the basis of actual behaviour is acute and poses a central problem in CBA. In other words there are qualifications on willingness-to-pay for benefit or avoid the cost as a good measure of values. The questions on the validity of valuations of health and the environment are even more serious dues to their significant inherent difficulties. The other problem is related to the aggregation of individual preferences (costs and benefits). Aggregating social utility across individuals to come up with a measure of social welfare has its problems. Different value judgements can lead to different rankings of possible outcomes, and deciding what values should be applied is difficult in democratic societies. How the welfare of people with very different standards of living should be assessed and aggregated in forming judgements on policy.
Aggregation over time Cost and benefits occur over long periods of time. People do care about when the costs and benefits occur. They have time preference. Since CBA is based on preferences, it is essential to take account of time preferences (discounting). Policies and plans involve costs and benefits that occur over long periods of time. Long-term effects involves uncertainty, irreversibility and even catastrophic. Assessing impacts over a very long time period emphasises the problem that future generations are not fully represented in current discussion. Hence Long-term evaluation, explicitly, or implicitly is based on a “social contract” for intergenerational equity. How should future generations be represented in the views and decisions of current generations?
This is captured by the discount rate in cost benefit analysis, by the application of option theory to address risk, uncertainty and irreversibility or by Precautionary Principles or Safe Minimum Standards.
The “correct” procedure to the evaluation of the social desirability of a project would have been in relation to its total effect on the economy, with it and without

Integrating indicators measuring the environmental sustainability of transportation projects, plans and policies into decision making
70
it. The total effect includes those concerning future generations. Without any market imperfection and failures and lump-sum redistributive taxation, it would have been possible to evaluate a project on the basis of its costs and benefits using market prices. The problem of finding shadow prices including the social rate of discount is related to the second-best world, where different market failures make market prices to deviate from the relative marginal social costs. Some of these market imperfections relate to social rate of time preference. Hence the question of social rate of discount involves a discussion of intra- and intergenerational distributional issues (Stiglitz 1994). Arrow, et al (1966) identifies two opposing school of thoughts on the selection of a discount rate, what they refers to as prescriptive and descriptive approaches. In descriptive approach, the choice of a discount rate is based on the observation of the rates of return on capital invested in a variety of assets. Prescriptive approach proceeds from ethical principles by suggesting rules to address the well being of different generations.
Individual time preference relates to one’s own mortality and may be the interest of direct descendants. More distant benefits might get too little weight, what Pigou (1920) attributed to “our defective telescopic faculty”. The tyranny of discounting is that it could works against the interest of future generations. Discounting damages occurring far into the future makes the present value of such damages considerably smaller than actual damage. And when extracting resources is affected by the discount rate, exhaustible resources are more likely to be used up quickly the higher the discount rate, leaving less for the future generation. For this reason social rate of time preference should include some altruistic interest in welfare of other generations. There is in fact very little scope for avoiding a conscious ethical consideration on choosing appropriate rates of discount for cost-benefit analysis. Cost-benefit analysis should be based on the objectivity on the part of economists concerning the allocation of resources. Hence the parameters should reflect individuals’ preferences and not the economists. Meanwhile the distributional judgements are left to politicians. Consequently the choice of interest rate is not a detached and objective decision (Stiglitz 1994).
The vast attention on social discount rate in literature testifies to the importance of the social discount rate. Many economists, since Pigou and Ramsey have been engaged in this subject. Portney and Weyant (1999), in their introduction to a collection of articles by a number of prominent economists on discounting and intergenerational equity, suggest that, “There is a sense of unease about this subject, due to the technical complexity of the issues and the ethical considerations.”
Portney and Weyant reflect on the views of some prominent economists on by stating that all experts agree that, “It is appropriate-indeed essential- to discount future benefits and costs at some positive rate.” All agree on a standard procedure for evaluation of projects with timeframes of forty years or less. It is beyond this horizon that the experts divert in their approach and unease sets in. A low discount rate makes the evaluation of the various abatement strategies incompatible and incomparable with other environmental and social policy issues that require immediate attention. Some argue for different discount rates for
Integrating indicators measuring the environmental sustainability of transportation projects, plans and policies into decision making
71
different time horizons, more specifically, a smaller discount rate for a farther future. Among these are Arrow (1999), Weizman (1999) and Kopp and Portney (1999). Studies by Hausman (1979) and Horowitz (1991), among many others, support this view. Yet Solow (1999) points out that a non-constant discount rate will subject the policy path to time inconsistency. Heal (1999) suggests that there is no reason to require time consistency in decision-making involving many generations, a view embodied in the work by Chichilnisky (1996). Newell and Pizer (2001) assume a constant discount rate and allow for uncertainty to enter discounting. This approach accounts for future costs and benefits much more effectively than discounting without consideration to uncertainty. In this manner the policy path is not subject to time inconsistency.
Schelling (1999), among others, even questions the validity of the standard welfare-theoretic approach for decision making with intergenerational consequences. This view coincides with the view of the supporters of the strong sustainability mode. The strong sustainability position is that sustainability constraints should be seen as expression of Precautionary Principles, similar to the notion of Safe Minimum Standards. It is a way of giving shape to the intergenerational social contract idea. The trade-off decision has to be taken within a context of uncertainty and possible irreversibility. When harm is irreversible, and there is uncertainty associated with its magnitude and likelihood, the purchase an “option” prevents the harm at a later date. The Irreversible Harm Precautionary principle functions like option theory for environmental risk regulation. The Catastrophic Harm Precautionary Principle is applied when outcomes are catastrophic. It requires special precautions against the worst-case scenario. The principle is based on people’s potential failure to recognise the expected value of truly catastrophic losses and that political actors are likely to postpone action when the costs of precautions are immediate and when the benefits occur in the distant future. These normative arguments are demonstrated in the context of the impacts of global warming. See Sunstein (2005) for an excellent discussion on the subject.
Aggregation over risk There is a great deal of risk and uncertainty associated with the long-term effects of an action or policy. The risks and uncertainties around the costs and benefits of environmental policies are particularly large. Hence the analytical framework should be able to handle risk and uncertainty explicitly.
Most actions such as provisions of infrastructure, changes in land use have uncertainty associated with their social benefits and costs, and are irreversible. Their impacts on environment are also associated with uncertainty that can be irreversible, even catastrophic. Technology adoption is another example where investment decisions are made under uncertainty and irreversibility.
Other researchers have applied option theory for environmental risk regulation and evaluations (Sunstein 2005). The simple concept is that when dealing with an irreversible loss, and when uncertain about the timing and likelihood of that loss,
Integrating indicators measuring the environmental sustainability of transportation projects, plans and policies into decision making
72
one should be willing to pay for an option in order to maintain flexibility for the future. Fisher (2001) has generalized this argument by suggesting “where a decision problem is characterized by (1) uncertainty about future costs and benefits of the alternatives, (2) prospects for resolving or reducing the uncertainty with the passage of time, and (3) irreversibility of one or more of the alternatives, an extra value, an option value, properly attaches to the reversible alternative(s).” This implies that irreversible decisions must pass a higher obstacle in a cost benefit test.
Arrow and Fisher (1974) and Henry (1974) demonstrate that the ideas of uncertainty and irreversibility have considerable importance to the theory of environmental protection. They use a linear net benefit function and an all-or-nothing choice situation and show that it will be optimal to delay or reduce investment. Arrow and Fisher give the example of the alternative actions of development or keeping a wilderness. They argue that if development produces “some irreversible transformation of the environment, hence a loss in perpetuity of the benefits from preservation,” then it is worth paying for the option to wait to acquire the missing information. Their proposal is that “the expected benefits of an irreversible decision should be adjusted to reflect the loss of options it entails.” Other economists have since had important contribution to this subject by extending the theory for nonlinear benefit function and continuous choice (Dixit and Pindyck 1994) and temporal resolution of uncertainty (Hanemann 1989, Kolstad 1996, Ulph and Ulph 1997, Gollier et al 2000) and there have been contributions to the subject with techniques such as stochastic optimization4.
Multi-criteria decision analysis and CBA The reality of living in societies with diverse and complicated political decision-making processes, many layers of interdependencies, many sources of well-being and ill-being, wide disparities in distribution, and very little likelihood of the sorts of compensating transfers hypothesized in cost-benefit models ever occurring.
Environmental policy deals with “reflexive” phenomena. It should deal with not merely the measurable and contrastable dimensions of a simple part of the system, but also with higher dimensions of the system, those in which power relations, hidden interests, social participation, cultural constraints and other “soft” values, become relevant and unavoidable variables. All these dimensions will affect the possible outcomes of the strategies and not in a deterministic manner.
Social choice theory should address ethical components of human beings in a social world, other than those inspired by rational choice theory and modelling.
4 Social utility approach can be extended to an uncertain or ‘stochastic’ environment. As in a certain or ‘deterministic’ environment, it has its ethical difficulties. More modern theories embodying a distinction between uncertainty and risk suggest an explicit ‘precautionary principle’ beyond that following from standard expected-utility theory.
Integrating indicators measuring the environmental sustainability of transportation projects, plans and policies into decision making
73
For at least thirty years, a new way to look at decision problems has gained the attention of researchers and practitioners5. This is the approach intends to take into account the diversities of points of view. Despite the diversity of MCDA approaches, methods and techniques, the basic ingredients of MCDA are a finite or infinite set of actions, at least two criteria, and at least one decision-maker. Given these basic elements, MCDA is an activity which supports decision making process in terms of choosing, ranking or sorting the actions. Many important technical aspects of MCDA are linked to classic works in economics; in particular, welfare economics, utility theory and voting oriented social choice theory (see Stadler, 1979). Aggregating the opinion or the preferences of voters or individuals of a community into collective or social preferences is quite similar a problem to devising comprehensive preferences of a decision-maker from a set of conflicting criteria in MCDA (Bouyssou, et al, 2000). Evaluation problems can involve qualitative information (data). The analytical framework in MCDA allows for qualitative data and quantitative data. Multi criteria evaluation method is based on incommensurability principle as alternative to the traditional cost-benefit analysis. Incommensurability implies the absence of a common unit of measurement across plural values; it does not mean incomparability. However for the same reason weak comparability is associated with the philosophical base of a MCDA while strong comparability is associated with CBA.
CBA is compensatory by definition. By using the same (monetary) scale in the measurement of cost and benefit, the approach allows substitution between different impacts and consequently substitution between different capitals, human and capital. In contrast MCDA methods can highlight the potentials for non- compensation. MCDA can be structured on a weak commensurability using ordinal scale of measure for ranking of options in contract to a cardinal scale in CBA. Alternatively in MCDA built on a strong incommensurability, alternative options can’t be compared.
A quality of MCDA is the ability to consider large amount of data, relations and objectives that are present in a real-world policy situation. MCDA does not offer a solution by optimising over all the criteria and hence can’t solve all conflicts. It can however provide an insight into the nature of conflicts by increasing the transparency of the choice process and facilitate political compromises. It should be viewed as a tool for structuring of the problem and the evaluation of the decision-making. It is at the end the decision-maker’s task to find a compromise solution. When there is no unique “correct” policy, the focus is on the quality of the process.
Desirable properties for procedures in a sustainability exercise are: 5 The “official” starting point of MCDA, the conference on “Multiple Criteria Decision Making” organised in 1972 by Cochrane and Zeleny at Columbia University in South Carolina (Cochrane and Zeleny, 1973).
Integrating indicators measuring the environmental sustainability of transportation projects, plans and policies into decision making
74
Avoiding aggregation of all indicators into one aggregate function
Avoiding complete compensability
Transparency (good or bad for what reason, for whom, for how long, …)
The results of a MCDA approach depends on
The available data
Structured information
The chosen aggregation method
Decision makers’ preferences
A summary Weak sustainability views natural capital (environment) as another form of capitals. It assumes perfect substitutability between the different forms of capital. Strong sustainability view is that perfect substitution between different forms of capital is not a valid assumption. On this basis it is possible to summarise the demands of the spectrum of the sustainability views as follow:
Very weak sustainability: Conventional CBA (correction of market and intervention failures via efficiency pricing; potential Pareto criterion; consumer sovereignty; infinite substitution)
Weak sustainability: Natural capital (environment) is another form of capital. It assumes perfect substitutability between the different forms of capital. Modified CBA (extended application of monetary valuation methods; actual compensation; shadow projects, etc.; systems approach; weak version of minimum safe standard)
Stong sustainability: Fixed Standard Approach (precautionary principle, primary and secondary value of natural capital; constant natural capital rule; dual self conception, social preference value; strong version of safe minimum standard)
Very strong sustainabilty: Abandonment of CBA ( or severely constrained cost-effectiveness analysis; bioethics)
The above summary suggest that the conventional cost benefit analysis is not an appropriate approach for integrating indicators that measures environmental sustainability along with other social and economic impacts of projects, plans and policies. However, modified forms of cost benefit analysis and cost effectiveness are useful tools under all modes of sustainability.
Multi-criteria decision analysis does not offer a solution by optimising over all the criteria. It should be viewed as a tool for structuring the decision making problem. It provides an insight into the nature of conflicts and by increasing transparency, facilitates political compromises and the development alternative plans and
Integrating indicators measuring the environmental sustainability of transportation projects, plans and policies into decision making
75
policies. It is possible to integrate elements of cost-benefit analysis and cost effectiveness measures in a multi-criteria decision analysis. The debate on conventional cost-benefit analysis and multi criteria analysis tends to regard these approaches as complementary rather than competitive analytical tool.
References Arrow, K, and A. C. Fisher (1974) Environmental Preservation, Uncertainty, and
Irreversibility, Quarterly Journal of Economics 312. Arrow, K.J. (1966) ‘Discounting and public investment criteria’, in Kneese A.V.
and Smith S.C. (eds.) Water Research, Baltimore: John Hopkins, quoted in Lind op cit, Ch. 2.
Bentham, J, 1988, The Principles of Morals and Legislation. Prometheus Books, New York.
Bouyssou, D. T. Marchant, M. Pirlot, P. Perny, A. Tsoukias, and Ph. Vincke, 2000, Evaluation and Decision Model. A Critical Perspective. Kluwer Academic Publishers, Dordrecht.
Chichilnisky, G. (1996) ‘An axiomatic approach to sustainable development’, Social Choice and Welfare 13(2), 231-257.
Cochrane, J.L. and M. Zeleny, 1973, Multiple Criteria Decision Making. University of South Carolina Press.
Dixit, A.K. & R.S. Pindyck (1994) Investment under Uncertainty Princeton University Press, Princeton, N.J. Edmonds, J., J.M. Roop, and M.J.
EEA (2006) Transport and Environment: facing a dilemma EEA Report No3/2006 Fisher, A. (2001) Uncertainty, Irreversibility, and the Timing of Climate Policy 9 Gilbert, R., Tanguay, H., 2000. Sustainable transportation performance indicators
project: Brief review of some relevant worldwide activity and development of an initial long list of indicators. The Centre for Sustainable Transportation, Toronto, Ontario, Canada.
Gollier, C., Jullien, B. and N. Treich (2000) ‘Scientific progress and irreversibility: an economic interpretation of the precautionary principle’, Journal of Public Economics 75: 229–253.
Greene, D.L. 2001. Sustainable Transportation. pp. 15335-39 In: Baltes, Paul B. & Smelser, Neil J. (eds.) The International Encyclopaedia of the Social & Behavioral Sciences. Elsevier Science Ltd, Oxford.
Gudmundsson, H., 2004. Sustainable Transport and Performance Indicators. Issues in Environmental Science and Technology No 20.
Hackett, S.C. (2001) Environmental and Natural resources economics: Theory, policy and the sustainable society, 2nd ed. Available http://www.humboldt.edu/~envecon/ancil.htm
Integrating indicators measuring the environmental sustainability of transportation projects, plans and policies into decision making
76
Hanemann, W. M. (1989) ‘Information and the concept of option value’, Journal of Environmental Economics and Management 16: 23–37.
Hausman, J.A. (1979) ‘Individual discount rates and purchases and utilization of energy-using durables’, The Bell Journal of Economics 10: 33-54
Heal, G. (1999) Valuing the Future. Economic Theory and Sustainability. Economics for sustainable earth series. Columbia University Press, New York.
Henry, C. (1974) ‘Investment decisions under uncertainty: The irreversibility effect’, American Economic Review 64: 1006–12.
Horowitz, 1991, Discounting monetary payoffs: An experimental analysis. In Handbook of Behavioural Economics, Kaish S. and Gilad, B. (eds.), Greenwich, Connecticut: JAI press.
Kågeson, P., 1994. The concept of sustainable transportation, The European Federation for Transport and Environment, T&E 94/3, Bruxelles, 1994, 26 p.
Kolstad, C. D. (1996) ‘Fundamental irreversibilities in stock externalities’, Journal of Public Economics 60: 221–233.
Kopp, R. J., and P.R. Portney (1999) ‘Mock referenda for intergenerational decision-making’, chap 9 in Discounting and intergenerational equity, edited by Portney P.R. and Weyant J.P., Resources for the future, Washington, DC
McFadden, D. (2006) Free Markets and Fettered Consumers, AEA Presidential Address, January 7, 2006
Newell, R. and W. Pizer (2001) Discounting the benefits of climate change mitigation: Howmuch do uncertain rates increase valuation? Prepared for the Pew Center on Global Climate Change, Economics, technical series.
Newman, P, (2003) editor. F.Y. Edgeworth’s “Mathematical Psychics” and Further Papers on Political Economy. Oxford University Press, Oxford, 2003.
Pareto, V., 1906, Manuale di Economia Politica. Societ`a Editrice Libraria,Milano, 1906. Translated into English by S. Schwier, edited byAnn S. Schwier andAlfredN. Page (1971),
Pigou, A.C. (1920) The Economics of welfare, 4th ed, 1952, London Macmillan Portney P.R. and Weyant, J.P ,1999, Introduction, in Discounting and
intergenerational equity, Portney P.R. and Weyant J.P. (eds.) Resources for the future, Washington, DC
Schelling, T.C. (1999) ’Intergenerational discounting’, in Portney P.R. and Weyant J.P. (eds.) Discounting and intergenerational equity, Resources for the future, Washington, DC
Schumpeter, J. (1942), Capitalism, Socialism and Democracy, New York: Harper. Sen, A., 1982, Choice, Welfare, and Measurement, Oxford: Blackwell
Integrating indicators measuring the environmental sustainability of transportation projects, plans and policies into decision making
77
Solow, R. M., 1999, Foreword, in Discounting and intergenerational equity, edited by Portney P.R. and Weyant J.P. Resources for the future, Washington, DC
Speth, G., 2005, “Creating a Sustainable Future: Are We Running Out of Time?” in Robert Olson and David Rejeski, Environmentalism and the Technologies of Tomorrow, Washington, D.C.: Island Press.
Stadler, W, 1979, A survey of multicriteria optimization or the vector maximum problem, Part I: 1776-1960. Journal of Optimization Theory and Applications, 29(1):1–52, 1979.
Stern (2006) Stern Review on the Economics of Climate Change, a summary http://news.bbc.co.uk/1/shared/bsp/hi/pdfs/30_10_06_exec_sum.pdf
Stiglitz, J.E. (1994) ‘Discount rates: The rate of discount for benefit-cost analysis and the theory of the second best’, in Layard, R. and S. Glaister (eds.) Cost-Benefit Analysis.
Sunstein, C.R. (2005) Irreversible and Catastrophic, The University of Chicago, The Law School. John M. Olin Law and Economic Working Paper No. 242, Public law and Legal Theory Working Paper No. 88
Ulph, A. and D. Ulph (1997) ‘Global warming, irreversibility and learning’, The Economic Journal 107: 636–650.
Verhoef, E.T. & Feitelson, E., 2001. Transport and environment: from policy measures to sustainability notions and back pp. 3-11 in:Verhoef, E.T. & Feitelson, E. (eds.). Transport and environment: in search of sustainable solutions. Cheltenham : Edward Elgar
WCED (1987) World Commission on Environment and Development. "Our Common Future". Oxford University Press, Oxford, 1987.
Weizman, M.L. (1999) ‘Just keep discounting, but…’, in Portney P.R. and Weyant J.P. (eds.) Discounting and intergenerational equity, Resources for the future, Washington, DC

Integrating indicators measuring the environmental sustainability of transportation projects, plans and policies into decision making
78
79
Trade-off Analysis (with a revised Rawlsian Decision-making Philosophy) as an Alternative to Cost-Benefit Analysis (CBA) in Socio-technical Decisions1 Ralph P. Hall1, Nicholas A. Ashford2, and Peter Söderbaum3
1 Postdoctoral Scholar, Stanford University, email: [email protected] 2 Professor of Technology and Policy, Massachusetts Institute of Technology, email: [email protected] 3 Professor of Ecological Economics, School of Business, Mälardalen University, email: [email protected]. ABSTRACT This paper discusses the concept of trade-off analysis as an alternative to cost-benefit analysis (CBA) in socio-technical decisions. The concept of trade-off analysis is not new, but increasing dissatisfaction with CBA as the centerpiece of decision analysis and concerns for Rawlsian equity warrant its reintroduction into decision-making. As a decision-support tool, trade-off analysis [1] allows decision-makers to avoid monetizing and aggregating non-monetary factors over time; [2] invites the involvement of stakeholders into policy debates since there is greater transparency as to who benefits and who is harmed by a particular policy; [3] enables analysts to undertake a comparative analysis of alternatives over time; and [4] takes into account the important role of technological change in shaping the state and performance of a system. In addition, a revised Rawlsian approach to incorporating equity and environmental considerations into decision-making is advocated as a way of promoting sustainable development.
While the proposed framework has yet to be applied on a wide scale, the authors believe it approximates the way that decisions are actually made in the political system and holds the potential to assist with decision-making for sustainable development in a broad variety of contexts.
COST-BENEFIT ANALYSIS AS A MEANS OF EVALUATING POLICIES, PROGRAMS, AND PROJECTS2 Arguably, there is a need for a formal methodology for choosing from among alternative policies, programs, and projects (hereafter referred to collectively as ‘policies’). Typically government or private sector initiatives create social costs as well as benefits. There is a natural tendency to want a mechanism that can identify which policies, on balance, make society ‘better off’ in some meaningful sense
1 This text is based upon a paper submitted to the 86th Annual Meeting of the Transportation Research Board, January 21-25, 2007, in Washington, D.C. 2 This section is based upon Ashford and Caldart (2008, Chapter 3: Economics and the Environment) and Hall (2006).
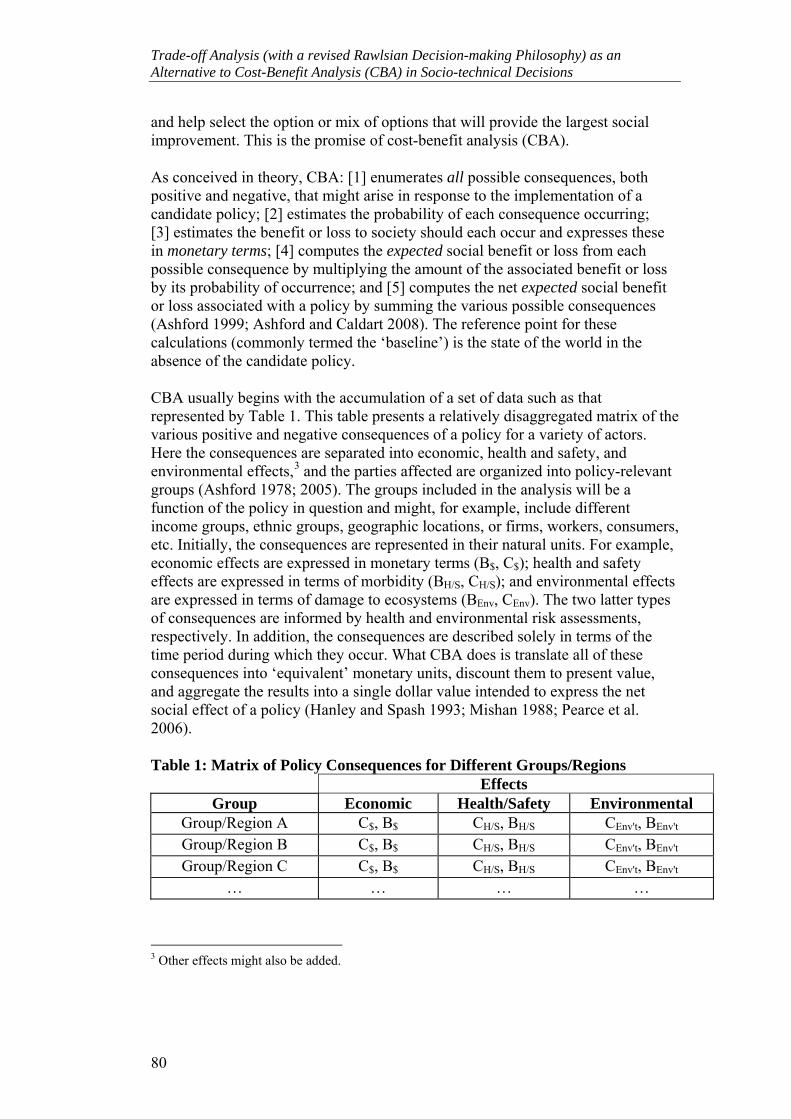
Trade-off Analysis (with a revised Rawlsian Decision-making Philosophy) as an Alternative to Cost-Benefit Analysis (CBA) in Socio-technical Decisions
80
and help select the option or mix of options that will provide the largest social improvement. This is the promise of cost-benefit analysis (CBA).
As conceived in theory, CBA: [1] enumerates all possible consequences, both positive and negative, that might arise in response to the implementation of a candidate policy; [2] estimates the probability of each consequence occurring; [3] estimates the benefit or loss to society should each occur and expresses these in monetary terms; [4] computes the expected social benefit or loss from each possible consequence by multiplying the amount of the associated benefit or loss by its probability of occurrence; and [5] computes the net expected social benefit or loss associated with a policy by summing the various possible consequences (Ashford 1999; Ashford and Caldart 2008). The reference point for these calculations (commonly termed the ‘baseline’) is the state of the world in the absence of the candidate policy.
CBA usually begins with the accumulation of a set of data such as that represented by Table 1. This table presents a relatively disaggregated matrix of the various positive and negative consequences of a policy for a variety of actors. Here the consequences are separated into economic, health and safety, and environmental effects,3 and the parties affected are organized into policy-relevant groups (Ashford 1978; 2005). The groups included in the analysis will be a function of the policy in question and might, for example, include different income groups, ethnic groups, geographic locations, or firms, workers, consumers, etc. Initially, the consequences are represented in their natural units. For example, economic effects are expressed in monetary terms (B$, C$); health and safety effects are expressed in terms of morbidity (BH/S, CH/S); and environmental effects are expressed in terms of damage to ecosystems (BEnv, CEnv). The two latter types of consequences are informed by health and environmental risk assessments, respectively. In addition, the consequences are described solely in terms of the time period during which they occur. What CBA does is translate all of these consequences into ‘equivalent’ monetary units, discount them to present value, and aggregate the results into a single dollar value intended to express the net social effect of a policy (Hanley and Spash 1993; Mishan 1988; Pearce et al. 2006).
Table 1: Matrix of Policy Consequences for Different Groups/Regions Effects
Group Economic Health/Safety Environmental Group/Region A C$, B$ CH/S, BH/S CEnv't, BEnv't
Group/Region B C$, B$ CH/S, BH/S CEnv't, BEnv't
Group/Region C C$, B$ CH/S, BH/S CEnv't, BEnv't
… … … …
3 Other effects might also be added.
Trade-off Analysis (with a revised Rawlsian Decision-making Philosophy) as an Alternative to Cost-Benefit Analysis (CBA) in Socio-technical Decisions
81
As a decision-making tool, CBA claims several positive features. First, CBA can clarify choices among alternatives by evaluating consequences in a consistent and systematic manner. Second, it has the potential to foster an open and fair policymaking process by making explicit the estimates of costs and benefits and the assumptions on which those estimates are based. Third, by expressing all of the gains and losses in monetary terms, discounted to their present value, CBA permits the total impact of an initiative to be summarized using a common metric and to be represented by a single dollar amount. However, CBA possesses several limitations. First, the one-dimensional nature of CBA gives the impression that aggregating environmental, social, and economic concerns into a single monetary value is a simple process (Söderbaum 1987). Thus, the inherent complexity underlying many environmental and development issues is likely to be hidden behind a veil of simplicity. Further, the fact that CBA stems from economic theory “gives the impression of rigor and precision when in fact the truth is largely otherwise” (Bromley 1980, p. 247). Second, the valuation techniques that monetize environmental and social goods/services in a CBA suffer from a number of drawbacks. One major problem is the assumption that environmental benefits/costs can be adequately represented by a monetary value (Kapp 1970; McAllister 1995). By making money the common metric, the environment, for instance, is valued (or interpreted) as a form of commodity that can be traded in real or imagined markets (Söderbaum 2000). While this might seem like a rational approach, a closer look at the valuation techniques reveals another problem. Only the market-related transactions of an individual are captured by the valuation techniques, largely to the exclusion of other (social) activities such as community participation, citizenship, etc. (Söderbaum 2004).4 Finally, CBA valuation techniques do not provide any information about the implicit (and unavoidable) ethical decisions that an analyst makes as part of the valuation process (Kelman 1981; 1982; Söderbaum 2004; Tribe 1972). Third, while an array of proposals exist on how distributional considerations can be incorporated into a CBA – such as weighting benefits to better reflect equity concerns (Harberger 1984; Kriström 2006; Pearce et al. 2006) – if one rejects the monetization of non-market goods then the value of such techniques is limited.5
4 Valuation techniques capture the preferences of the individuals affected, which are then translated into a monetary value and summed across different impacts, social groups/stakeholders, and time periods. The amount of economic goods – i.e., purchasing power – a person has in the marketplace influences his/her willingness to pay for a good/service or to accept a certain level of risk with employment. This observation is known as the ‘wealth effect.’ While the distribution of wealth collectively determines the market value of environmental, social, and economic goods, the position a market actor holds on a distribution of wealth determines what basket of goods (and bads) he/she receives. If a valuation technique fails to consider the distribution of wealth in a society, its outcome is likely to lead to misleading conclusions about the benefits/costs of a policy. 5 One theory put forward by neo-classical welfare economists as a way to avoid distributive problems is the Pareto optimality criterion. A Pareto efficient solution is one in which no one is
Trade-off Analysis (with a revised Rawlsian Decision-making Philosophy) as an Alternative to Cost-Benefit Analysis (CBA) in Socio-technical Decisions
82
Further, identifying the appropriate magnitudes of distributional weights is far from easy, invites arbitrariness, and small variations in weightings can lead to significant changes in a project’s social worth (Pearce et al. 2006). Fourth, CBA does not adequately deal with technological innovation (Ashford 2002; Driesen 2003; 2004). For example, calculating regulatory compliance costs using existing technology is likely to overestimate costs (which are often based upon upwardly biased industry estimates) since savings that accrue from technological improvements (e.g., efficiency gains), economies of scale, and learning curves are ignored. In effect, CBA leaves considerations of the process of industrial transformations outside of the analysis framework. For industrial transformations to be properly considered, a CBA would need to be recalculated each time a new innovation enters the market. Fifth, policies designed to internalize negative externalities are likely to increase the costs of certain activities (e.g., by increasing production and/or usage costs) in an attempt to alter consumer behavior. Since costs are compared to benefits, a policy that is specifically designed to inflate costs may require special treatment beyond what is possible in a standard CBA. Sixth, the translation of non-economic issues – such as the condition of the environment and human health – into a present monetary value is a contentious issue (Donohue 1999; Glicksman and Shapiro 2003; Heinzerling 1998; Heinzerling and Ackerman 2002; Portney and Weyant 1999; Söderbaum 1987). The choice of the discount rate can have a dramatic effect on the cost/benefit estimates used to evaluate the desirability of a policy (Ashford and Caldart 2008). Since many government initiatives involve an investment of resources in early periods that generate benefits in later periods, the major effect of discounting is to reduce the magnitude of future benefits – i.e., the larger the discount rate, the greater the reduction in future benefit. Thus, the act of discounting can reduce the attractiveness of government policies, particularly in cases where benefits are not realized until many years later. Finally, CBA does not align well with the democratic decision-making process. While CBA is democratic in the sense that it counts the ‘votes’ (or preferences) of actors and interested parties, an equally important aspect of democracy is that all
made worse off, but at least one person gains under new arrangements (Pareto 1896). However, given the complexity of real world development, it is difficult to identify a policy that does not make someone worse off. A less restrictive theory that can be used to arrive at a ‘potential’ Pareto outcome is the Kaldor-Hicks efficiency criterion (Kaldor 1939; Hicks 1940). A Kaldor-Hicks outcome is one where the total economic value of social resources is increased to a level at which those who gain could compensate those who lose and still be better off. However, there is no requirement that any transfer of wealth should actually take place. This potential outcome is a significant problem, especially when those most likely to receive the benefits are already the more advantaged members of society. If we are interested in developing a more democratic and fair decision-making process that specifically addresses inequality, then a Rawlsian approach seems more appropriate (see the section entitled ‘A Revised Rawlsian Decision-making Philosophy’).
Trade-off Analysis (with a revised Rawlsian Decision-making Philosophy) as an Alternative to Cost-Benefit Analysis (CBA) in Socio-technical Decisions
83
kinds of arguments and alternatives are put forward and considered (Söderbaum 1987; 2001). Emphasizing CBA as the primary decision-making tool applies an economic lens to problem-solving that largely excludes other equally valid approaches/perspectives. Another important aspect of democracy is that society has the ability to collectively understand and learn from different perspectives on an issue. A problem with CBA is that the ‘expert’ analyst has very little interaction with the relevant stakeholders. While there is a limited amount of interaction through the administration of willingness to pay/accept surveys, it is questionable as to whether the decision-making process is informed (Söderbaum 2001; 2004). The above concerns lead to the conclusion that CBA is an inappropriate decision-making tool if progress towards sustainable development is a desired objective. Indeed, CBA can be viewed as fundamentally flawed and incapable of being able to reflect the full complexions of a policy, no matter what methodological improvements are made to the CBA process. Further, it is important to make a distinction between the ‘technical’ arguments against CBA (outlined above) and the ‘practical’ argument that CBA does not reflect the real world decision-making environment. For example, there is evidence to suggest that CBA has a limited role in transportation investment decisions (GAO 2005). The important factors appear to be the availability of funding and the public acceptance of a proposed transportation project (ibid). Thus, instead of attempting to aggregate and transform environmental and social issues into a single monetary value (i.e., identify the ‘scientific’ solution), a better approach is to accept a certain amount of complexity and heterogeneity and adopt a more informed and disaggregated decision-making process that can better accommodate the ‘politics’ of decision-making. Alternative approaches to CBA include Multi-Criteria Approaches (MCA), Environmental Impact Assessments (EIAs), Positional Analysis (Söderbaum 1973; 2000), and Trade-off Analysis (Ashford 1978). While each of these techniques has something to offer (Söderbaum 2004), we believe trade-off and positional analysis are more closely aligned with the idea of democratic decision-making for sustainable development (Hall 2006).

Trade-off Analysis (with a revised Rawlsian Decision-making Philosophy) as an Alternative to Cost-Benefit Analysis (CBA) in Socio-technical Decisions
84
ALTERNATIVES TO CBA Trade-off and positional analysis are two techniques that require decision-makers to explore the trade-offs that are often obscured in a CBA. Instead of aggregating a wide range of heterogeneous factors into a single monetary value, both techniques keep each factor in its natural units. Thus, when constructing a trade-off matrix (represented in its generic form in Table 1), the analyst is not required to make decisions about how environmental, health/safety, and economic factors should be valued and summed across different actors or generations.6 By keeping these factors separate in the matrix, it is possible to assess who benefits and who is made worse off as the result of an existing or new policy. A benefit of non-aggregation is that the time period in which each effect is experienced can be revealed and future (non-financial) benefits/costs need not be discounted to a present value. Further, the trade-off between the costs of environmental or health improvements are made explicit, if they occur. Disaggregating the impacts of a policy in a trade-off matrix has the added advantage of informing decision-makers and stakeholders about who is reaping the benefits and who is bearing the costs. While it has been argued that the informational burden of such an approach to decision-making “tends to reduce the efficacy of political institutions” and leads to stakeholder conflict and delay (Congleton and Sweetser 1992, p. 16), hiding such information would surely be inappropriate in a democratic process. The transparency achieved by non-aggregation means that decision-makers become more accountable for their decisions. When pursuing a new policy initiative or assessing an existing regulation/program, the decision-maker is required to acknowledge who is receiving the benefits/costs and how these are evolving over time. Hence, a time series of trade-off matrices could be presented in order to capture the changing dynamics of the system under analysis and facilitate a comparative analysis of alternatives over time. The challenge facing decision-makers, however, is often described narrowly as how to arrive at an appropriate trade-off or balance between economic efficiency and equity.7 Given 6 It is important to recognize that a CBA framework can be used within the trade-off matrix to translate the ‘economic’ costs or benefits of a policy or program into a net present value (NPV) or future value (FV) for comparison purposes. The ‘non-economic’ costs and benefits remain in their natural units and are not ‘valued’ in an economic sense. 7 What is meant by ‘economic efficiency’ and ‘equity’ depends upon the perspective from which it is considered. For example, there are many ideas of equity – formal equity, substantive equity, desert/merit equity, etc. – each of which, if applied to a problem, would lead to a quite different ‘equitable’ outcome. While ‘economic efficiency’ – measured by metrics such as cost-benefit ratios – is a less ambiguous concept, the manner in which economists value non-economic parameters (if they are considered) can significantly influence the attractiveness of a policy or program. For example, a neo-classical and ecological economist might use quite different techniques to value non-economic parameters. Further, how should environmental improvements that provide recreational benefits be compared against those that save human lives or prevent the extinction of an endangered species? The point here is to recognize that economic efficiency and equity are not simple concepts and are a function of ideological orientation.
Trade-off Analysis (with a revised Rawlsian Decision-making Philosophy) as an Alternative to Cost-Benefit Analysis (CBA) in Socio-technical Decisions
85
that decision-making is political, not formulaic (Sagoff 1988; Swartzman 1982), arriving at a single or ‘right’ answer is unlikely. The fact that there are likely to be multiple solutions increases the importance of transparent decision-making, which makes decision-makers more accountable for their actions. In the situation where potential solutions raise unacceptable compromises in economic efficiency or equity, trade-off analysis enables the decision-maker to explore more effective policy alternatives. In this regard, trade-off analysis resists simplistic thinking and allows decision-makers to deal with those difficult questions involving [1] economic efficiency/equity trade-offs and [2] alternatives analysis. In effect, uncertainties and distributive inequalities are accepted as part of the normal (real world) decision-making process. A critical point is that trade-off analysis holds the potential for environmental, social, and economic factors to be considered on a more equal footing and provides a setting where alternatives can be considered that do not raise Hobson’s choices. The history of trade-off analysis can be traced back to the 1970s when Ashford (1978) and Söderbaum (1973) independently offered trade-off analysis – what Söderbaum calls positional analysis (PA) – as an alternative to CBA. While there are important similarities between the two approaches, the way in which the trade-off matrix is used in each approach is different. Whereas Ashford (1978) views the trade-off matrix from the perspective of the decision-maker, Söderbaum (2000) considers the trade-off matrix from a number of different ideological orientations. Söderbaum (2000; 2001; 2003) argues that CBA makes the unrealistic assumption that all politicians and citizens adopt the market ideology built into the analysis framework. He suggests PA is a more democratic process that incorporates the ideological orientation of politicians and citizens. Therefore, instead of identifying the economically efficient outcome, PA is a many-sided analysis that aims to articulate the following: the options or alternatives of choice; the impacts associated with these; the interests/stakeholders that are affected and whether there are conflicts between them; and whether ideological orientations (e.g., neo-liberal market, ecological economic, technologist, deep ecology, religious, etc.) can provide a new lens for valuation and decision-making (Söderbaum 2000, p. 87). The basic idea of PA is to reach ‘conditional conclusions,’ “that is conclusions that are conditional in relation to each ideological orientation articulated and considered. The idea is to facilitate learning processes and decision-making and not to dictate the ‘correct’ way of arriving at the best and optimal decision” (ibid, p. 66). The phrase ‘positional analysis’ can be confusing and requires some clarification. PA can be described as a form of systems analysis. The word ‘positional’ is borrowed from cybernetics where reference is made to the ‘position’ of a biological unit or system. Therefore, PA refers to an analysis of the position or state of a system at different time intervals. If we consider a system as a
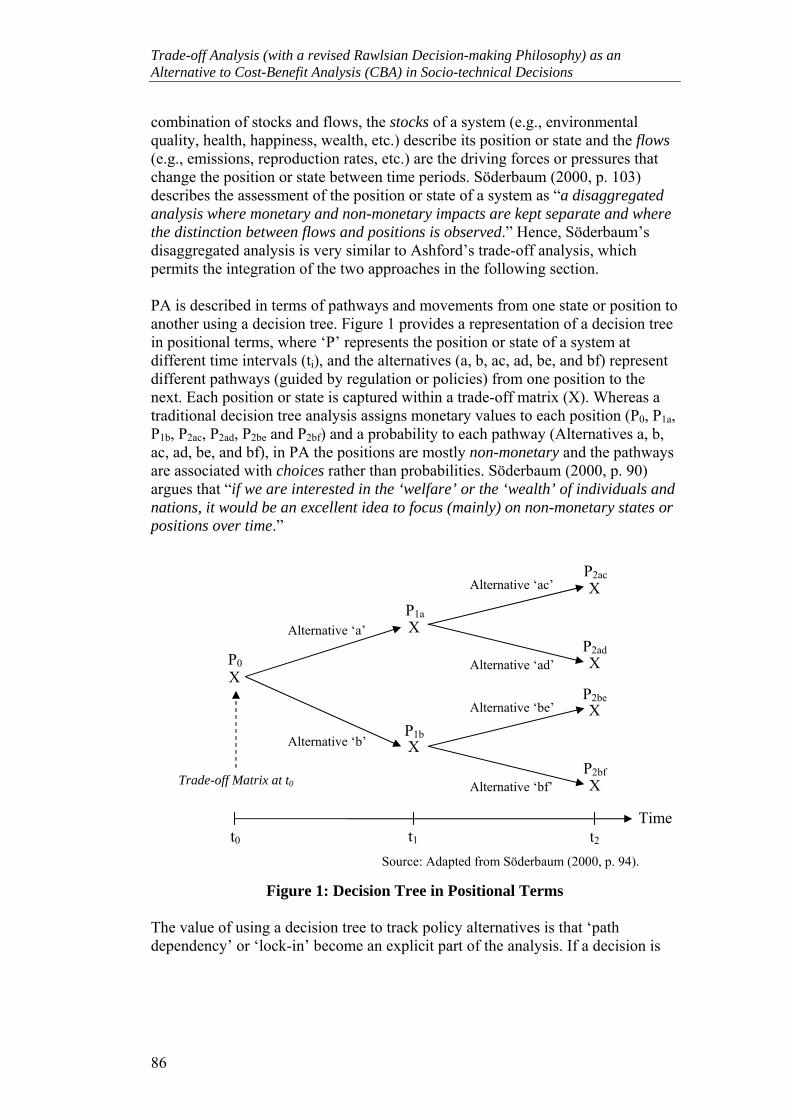
Trade-off Analysis (with a revised Rawlsian Decision-making Philosophy) as an Alternative to Cost-Benefit Analysis (CBA) in Socio-technical Decisions
86
combination of stocks and flows, the stocks of a system (e.g., environmental quality, health, happiness, wealth, etc.) describe its position or state and the flows (e.g., emissions, reproduction rates, etc.) are the driving forces or pressures that change the position or state between time periods. Söderbaum (2000, p. 103) describes the assessment of the position or state of a system as “a disaggregated analysis where monetary and non-monetary impacts are kept separate and where the distinction between flows and positions is observed.” Hence, Söderbaum’s disaggregated analysis is very similar to Ashford’s trade-off analysis, which permits the integration of the two approaches in the following section. PA is described in terms of pathways and movements from one state or position to another using a decision tree. Figure 1 provides a representation of a decision tree in positional terms, where ‘P’ represents the position or state of a system at different time intervals (ti), and the alternatives (a, b, ac, ad, be, and bf) represent different pathways (guided by regulation or policies) from one position to the next. Each position or state is captured within a trade-off matrix (X). Whereas a traditional decision tree analysis assigns monetary values to each position (P0, P1a, P1b, P2ac, P2ad, P2be and P2bf) and a probability to each pathway (Alternatives a, b, ac, ad, be, and bf), in PA the positions are mostly non-monetary and the pathways are associated with choices rather than probabilities. Söderbaum (2000, p. 90) argues that “if we are interested in the ‘welfare’ or the ‘wealth’ of individuals and nations, it would be an excellent idea to focus (mainly) on non-monetary states or positions over time.”
Source: Adapted from Söderbaum (2000, p. 94).
Figure 1: Decision Tree in Positional Terms
The value of using a decision tree to track policy alternatives is that ‘path dependency’ or ‘lock-in’ become an explicit part of the analysis. If a decision is
P1b
P1a
P2ad
P2ac
P0 X
X
X
X
X
X
X
P2be
P2bf
Alternative ‘a’
Alternative ‘b’
Alternative ‘ac’
Alternative ‘ad’
Alternative ‘be’
Alternative ‘bf’
Time t0 t1 t2
Trade-off Matrix at t0
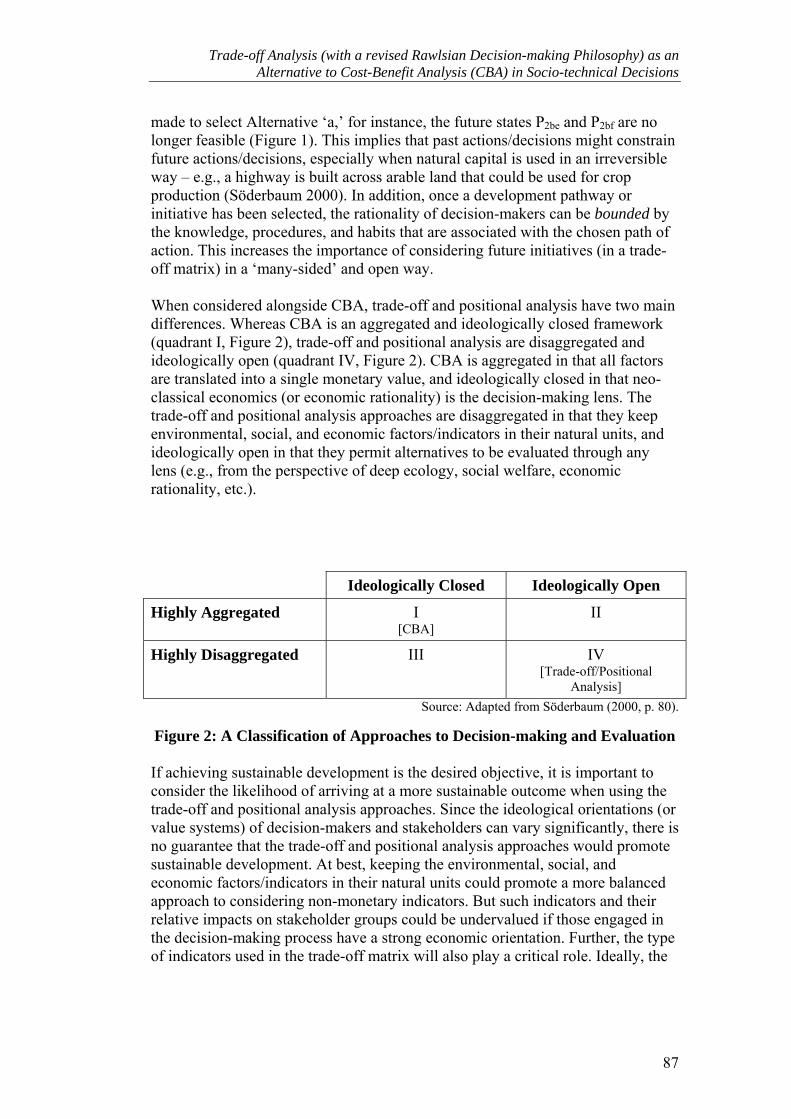
Trade-off Analysis (with a revised Rawlsian Decision-making Philosophy) as an Alternative to Cost-Benefit Analysis (CBA) in Socio-technical Decisions
87
made to select Alternative ‘a,’ for instance, the future states P2be and P2bf are no longer feasible (Figure 1). This implies that past actions/decisions might constrain future actions/decisions, especially when natural capital is used in an irreversible way – e.g., a highway is built across arable land that could be used for crop production (Söderbaum 2000). In addition, once a development pathway or initiative has been selected, the rationality of decision-makers can be bounded by the knowledge, procedures, and habits that are associated with the chosen path of action. This increases the importance of considering future initiatives (in a trade-off matrix) in a ‘many-sided’ and open way. When considered alongside CBA, trade-off and positional analysis have two main differences. Whereas CBA is an aggregated and ideologically closed framework (quadrant I, Figure 2), trade-off and positional analysis are disaggregated and ideologically open (quadrant IV, Figure 2). CBA is aggregated in that all factors are translated into a single monetary value, and ideologically closed in that neo-classical economics (or economic rationality) is the decision-making lens. The trade-off and positional analysis approaches are disaggregated in that they keep environmental, social, and economic factors/indicators in their natural units, and ideologically open in that they permit alternatives to be evaluated through any lens (e.g., from the perspective of deep ecology, social welfare, economic rationality, etc.).
Ideologically Closed Ideologically Open
Highly Aggregated I [CBA]
II
Highly Disaggregated III IV [Trade-off/Positional
Analysis] Source: Adapted from Söderbaum (2000, p. 80).
Figure 2: A Classification of Approaches to Decision-making and Evaluation
If achieving sustainable development is the desired objective, it is important to consider the likelihood of arriving at a more sustainable outcome when using the trade-off and positional analysis approaches. Since the ideological orientations (or value systems) of decision-makers and stakeholders can vary significantly, there is no guarantee that the trade-off and positional analysis approaches would promote sustainable development. At best, keeping the environmental, social, and economic factors/indicators in their natural units could promote a more balanced approach to considering non-monetary indicators. But such indicators and their relative impacts on stakeholder groups could be undervalued if those engaged in the decision-making process have a strong economic orientation. Further, the type of indicators used in the trade-off matrix will also play a critical role. Ideally, the
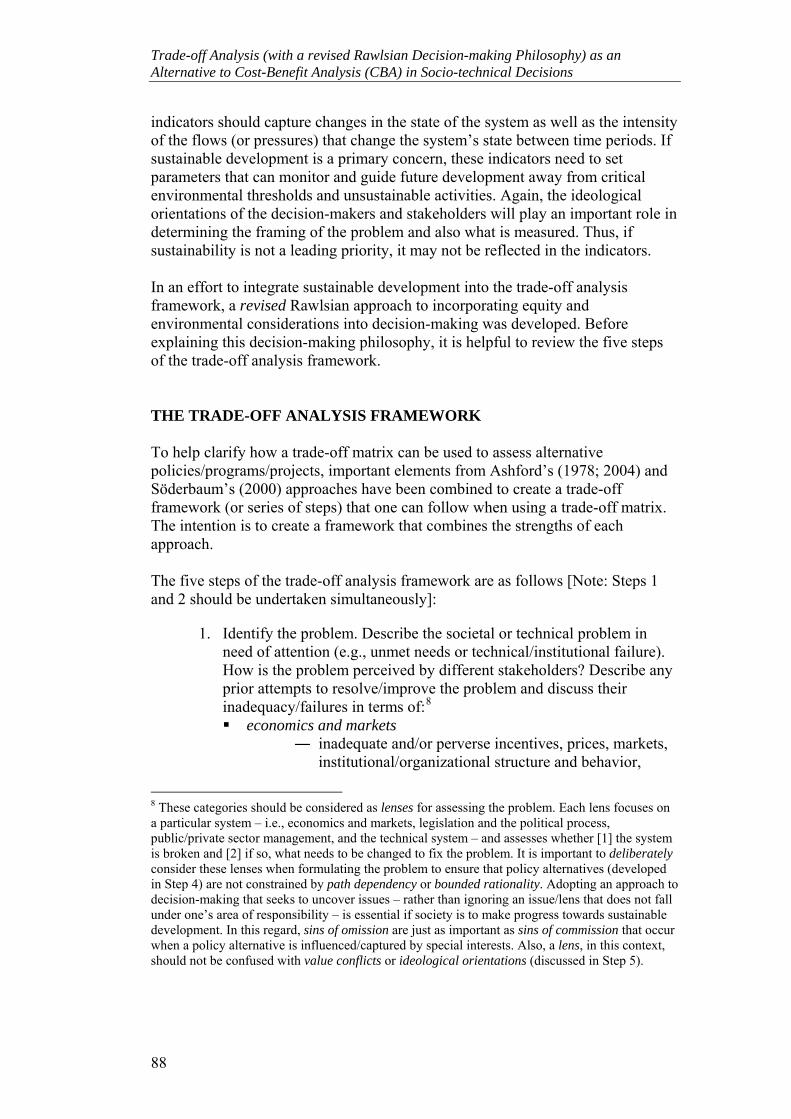
Trade-off Analysis (with a revised Rawlsian Decision-making Philosophy) as an Alternative to Cost-Benefit Analysis (CBA) in Socio-technical Decisions
88
indicators should capture changes in the state of the system as well as the intensity of the flows (or pressures) that change the system’s state between time periods. If sustainable development is a primary concern, these indicators need to set parameters that can monitor and guide future development away from critical environmental thresholds and unsustainable activities. Again, the ideological orientations of the decision-makers and stakeholders will play an important role in determining the framing of the problem and also what is measured. Thus, if sustainability is not a leading priority, it may not be reflected in the indicators. In an effort to integrate sustainable development into the trade-off analysis framework, a revised Rawlsian approach to incorporating equity and environmental considerations into decision-making was developed. Before explaining this decision-making philosophy, it is helpful to review the five steps of the trade-off analysis framework. THE TRADE-OFF ANALYSIS FRAMEWORK To help clarify how a trade-off matrix can be used to assess alternative policies/programs/projects, important elements from Ashford’s (1978; 2004) and Söderbaum’s (2000) approaches have been combined to create a trade-off framework (or series of steps) that one can follow when using a trade-off matrix. The intention is to create a framework that combines the strengths of each approach. The five steps of the trade-off analysis framework are as follows [Note: Steps 1 and 2 should be undertaken simultaneously]:
1. Identify the problem. Describe the societal or technical problem in need of attention (e.g., unmet needs or technical/institutional failure). How is the problem perceived by different stakeholders? Describe any prior attempts to resolve/improve the problem and discuss their inadequacy/failures in terms of:8 economics and markets
― inadequate and/or perverse incentives, prices, markets, institutional/organizational structure and behavior,
8 These categories should be considered as lenses for assessing the problem. Each lens focuses on a particular system – i.e., economics and markets, legislation and the political process, public/private sector management, and the technical system – and assesses whether [1] the system is broken and [2] if so, what needs to be changed to fix the problem. It is important to deliberately consider these lenses when formulating the problem to ensure that policy alternatives (developed in Step 4) are not constrained by path dependency or bounded rationality. Adopting an approach to decision-making that seeks to uncover issues – rather than ignoring an issue/lens that does not fall under one’s area of responsibility – is essential if society is to make progress towards sustainable development. In this regard, sins of omission are just as important as sins of commission that occur when a policy alternative is influenced/captured by special interests. Also, a lens, in this context, should not be confused with value conflicts or ideological orientations (discussed in Step 5).
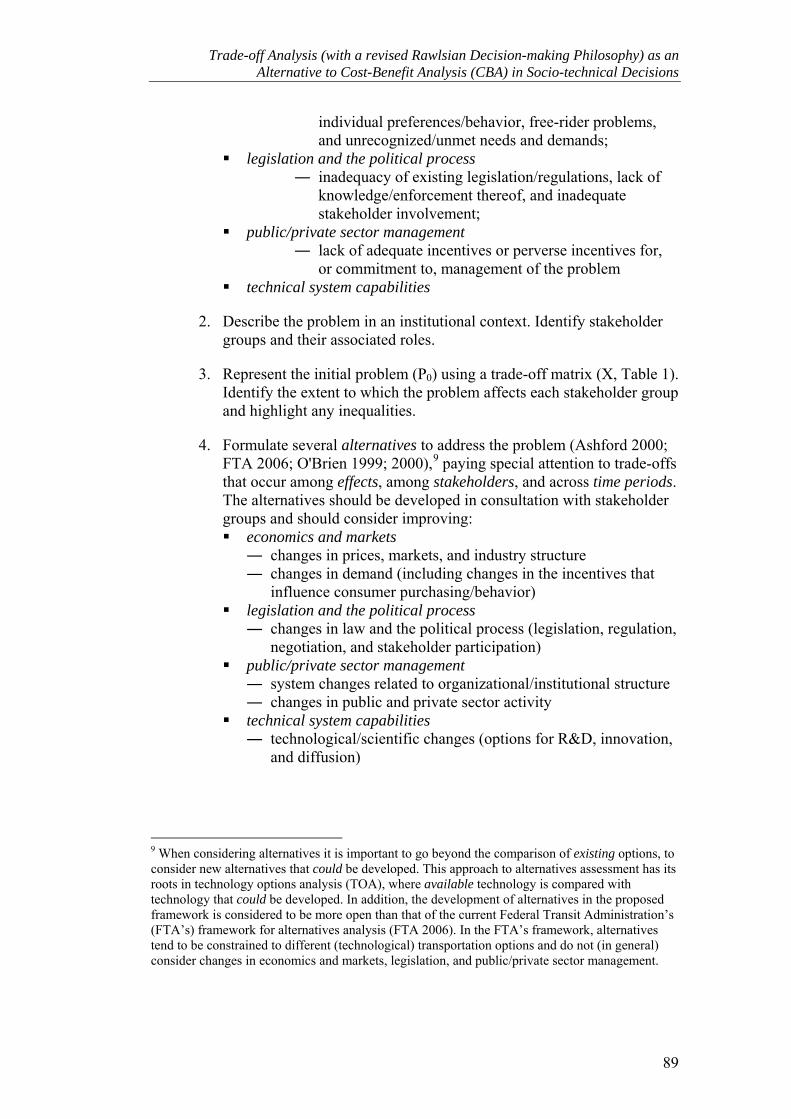
Trade-off Analysis (with a revised Rawlsian Decision-making Philosophy) as an Alternative to Cost-Benefit Analysis (CBA) in Socio-technical Decisions
89
individual preferences/behavior, free-rider problems, and unrecognized/unmet needs and demands;
legislation and the political process ― inadequacy of existing legislation/regulations, lack of
knowledge/enforcement thereof, and inadequate stakeholder involvement;
public/private sector management ― lack of adequate incentives or perverse incentives for,
or commitment to, management of the problem technical system capabilities
2. Describe the problem in an institutional context. Identify stakeholder groups and their associated roles.
3. Represent the initial problem (P0) using a trade-off matrix (X, Table 1). Identify the extent to which the problem affects each stakeholder group and highlight any inequalities.
4. Formulate several alternatives to address the problem (Ashford 2000; FTA 2006; O'Brien 1999; 2000),9 paying special attention to trade-offs that occur among effects, among stakeholders, and across time periods. The alternatives should be developed in consultation with stakeholder groups and should consider improving: economics and markets ― changes in prices, markets, and industry structure ― changes in demand (including changes in the incentives that
influence consumer purchasing/behavior) legislation and the political process ― changes in law and the political process (legislation, regulation,
negotiation, and stakeholder participation) public/private sector management ― system changes related to organizational/institutional structure ― changes in public and private sector activity
technical system capabilities ― technological/scientific changes (options for R&D, innovation,
and diffusion)
9 When considering alternatives it is important to go beyond the comparison of existing options, to consider new alternatives that could be developed. This approach to alternatives assessment has its roots in technology options analysis (TOA), where available technology is compared with technology that could be developed. In addition, the development of alternatives in the proposed framework is considered to be more open than that of the current Federal Transit Administration’s (FTA’s) framework for alternatives analysis (FTA 2006). In the FTA’s framework, alternatives tend to be constrained to different (technological) transportation options and do not (in general) consider changes in economics and markets, legislation, and public/private sector management.
Trade-off Analysis (with a revised Rawlsian Decision-making Philosophy) as an Alternative to Cost-Benefit Analysis (CBA) in Socio-technical Decisions
90
5. Use the trade-off matrix (X) to qualitatively and quantitatively assess (in a comparative manner) the likely outcomes from each policy alternative. Consider how relevant values and/or ideological orientations (e.g.,
ideas of development and progress) can adjust the attractiveness of each alternative. Use this analysis to identify potential value conflicts and develop strategies to address them, recognizing that political coalition-building is likely to play an important role in shaping the final alternative.
In parallel with the task above, assess how well distributional inequalities and environmental impacts are addressed in relation to a revised Rawlsian decision-making philosophy (see the following section).
Identify the impact each policy alternative is likely to have on important systems connected to the system under analysis.
Evaluate the likelihood that an alternative will solve the problem under different future scenarios.10
The trade-off analysis framework is generic and can be used to assess any policy. While certain aspects of the framework have been considered in relation to the planning functions of U.S. Metropolitan Planning Organizations (MPOs) (Hall 2006), the framework has yet to be applied in a formal way in this planning environment. A ‘REVISED’ RAWLSIAN DECISION-MAKING PHILOSOPHY The ability of governments to develop policies that transition societies towards more sustainable forms of development will depend upon how they, and their societies, view the purpose of development – i.e., either to establish a fair and just society (Rawlsianism) or maximize the well-being of society in the neoclassical sense (utilitarianism). These two philosophies bound the modern decision-making continuum. This section argues that a revised Rawlsian approach to decision-making is more likely to support the basic principles of sustainable development. In 1971, John Rawls published his seminal work – A Theory of Justice – that renewed the notion of the social contract11 by arguing that political and moral
10 Since the future is uncertain, creating several scenarios against which an alternative can be assessed is likely to provide an indication of the robustness of the alternative. 11 The basic premise of the social contract is that an individual – in accepting that the pursuit of self-interest is ultimately self-defeating – relinquishes certain freedoms/rights to a system of collectively-enforced social arrangements in exchange for peace and security. Hence, he/she agrees to follow the ‘general will’ of society and be held accountable if his/her ‘individual will’ motivates behavior that breaks the social contract – i.e., the law of the land (Rousseau 1968). Whatever freedoms an individual loses in the transition from the State of Nature to the Civil State are more than compensated for by belonging to a civil society that ensures liberties and property

Trade-off Analysis (with a revised Rawlsian Decision-making Philosophy) as an Alternative to Cost-Benefit Analysis (CBA) in Socio-technical Decisions
91
positions can be determined using impartiality. In essence, Rawls developed his theory to address the inadequacy of utilitarianism (the philosophy behind CBA) in dealing with equity. Rawls (1971) developed a version of the social contract in which decision-making revolved around moral principles – i.e., the principles of justice. Specifically, he created two principles of justice that he argued contracting parties would select in the Original Position – behind the Veil of Ignorance – to establish a just society (see below).12 In addition, to make the environment an explicit consideration in the Rawlsian decision-making process, a third environmental principle has been added to Rawls’s two principles.
First Principle: “each person is to have an equal right to the most extensive total system of equal basic liberties compatible with a similar system of liberty for all” (Rawls 1971, p. 302). Second Principle: “social and economic inequalities are to be arranged so that they are both (a) to the greatest benefit of the least advantaged, consistent with the just savings principle, and (b) attached to offices and positions open to all under conditions of fair equality of opportunities” (Rawls 1971, p. 302). Suggested Third Principle: social arrangements are to be organized so that they (a) protect and improve the environment, especially for those individuals and species most heavily affected by environmental degradation/pollution, and (b) do not result in activities that exceed ecological carrying capacity.
rights. Hence, the social contract tries to balance individual freedom with being a member of a civil society that limits freedoms for the greater good. 12 Central to Rawls’s (1971) Theory of Justice is the ‘Original Position,’ a hypothetical situation in which an individual’s knowledge is constrained by a ‘Veil of Ignorance.’ Behind the Veil of Ignorance, “no one knows his place in society, his class position or social status; nor does he know his fortune in the distribution of natural assets and abilities, his intelligence and strength, and the like. Nor, again, does anyone know his conception of the good, the particulars of his rational plan of life, or even the special features of his psychology such as his aversion to risk or liability to optimism or pessimism. … [T]he parties do not know the particular circumstances of their own society, … its economic or political situation, or the level of civilization and culture it has been able to achieve” (Rawls 1971, p. 137). Rawls argues that decisions made for society should be made as if the participants do not know in advance what their lot in life will be. By denying contracting parties the knowledge of their own characteristics or circumstances, they are forced to adopt the moral point of view and are unable to develop principles or policies that favor themselves. Rawls also states that contracting parties are assumed to be “rational and mutually disinterested” (Rawls 1971, p. 13): ‘rational’ in the sense that the contracting party makes the most effective decision to reach a given end, and ‘mutually disinterested’ in the sense that each person does not take “an interest in one another’s interests” (Rawls 1971, p. 13). Thus, the ‘rational’ choice is to develop principles and strategies for a just society that are developed from initial conditions that are inherently fair. Justice, therefore, proceeds out of fairness, giving rise to Rawls’s formulation of “justice as fairness” (Rawls 1971, p. 17).
Trade-off Analysis (with a revised Rawlsian Decision-making Philosophy) as an Alternative to Cost-Benefit Analysis (CBA) in Socio-technical Decisions
92
The first principle determines the distribution of civil liberties. It states that each member of a society is to receive as much liberty (or personal freedom) as possible, as long as every other member of society receives the same. The second principle states that social and economic inequalities are only justified if the most disadvantaged members of society are made relatively better off under new arrangements.13 The ‘suggested’ third (environmental) principle was created to explicitly link the social and natural worlds in decision-making.14 The intent of the principle is [1] to ensure that society continually strives to protect and improve the environment and the lives of people negatively affected by pollution, and [2] to keep human activity within ecological limits.15 The basic premise of the principle is twofold. First, protecting human health is believed to be of paramount importance. Second, the natural environment is essential for human life and should be protected and regenerated if it is being degraded by human activity. In reality, the first part of
13 Rawls’s two principles of justice have a specific order in which they are to be considered. The first principle must be considered prior to the second principle since “liberty can only be restricted for the sake of liberty, not for other social and economic advantages” (Rawls 1971, p. 490). It is possible to envision a situation where liberty is constrained to protect liberty – i.e., “restrictions to individual freedoms are justified when the unfettered exercise of these freedoms conflicts with other freedoms” (Beatley 1994, p. 156). For example, the speed at which vehicles are allowed to drive is constrained to protect broader public freedoms such as individual safety. The lexicographic order to the principles implies that society would rank the determination of civil liberties above that of economic advantage. 14 The fact that Rawls (1971, p. 512) did not extend his Theory of Justice to include “animals and the rest of nature,” is in many ways a missed opportunity that has encouraged many to take up this challenge (Dobson 1998; Lehman 1995; Miller 1999; Partridge 1976). The most common recommendations for changing Rawls’s theory are to make the ‘environment’ or ‘ecosystems’ into ‘primary goods,’ and to consider these forms of natural capital under the ‘just savings’ principle. Environmental justice advocates have also argued that “the ability to live in a safe environment is a primary good” (Chapman 2001, p. 16). Rawls (1971, p. 62) defines ‘social’ primary goods as “things that every rational man is presumed to want” such as rights and liberties, powers and opportunities, income and wealth, and self respect. These goods are seen to be essential to human development and to the realization of one’s life plan. Since the “basic structure of society” (Rawls 1971, p. 62) is the main conduit through which these primary goods are distributed, creating a structure that fosters justice and fairness is of paramount importance. This objective forms the basis for Rawls’s Theory of Justice. While making the environment into a ‘primary good’ is an elegant solution, it does not make explicit the relative importance of the environment when compared to the ‘social’ primary goods. If we are concerned about sustainable development then social systems need to be considered within the broader context of the natural environment within which they exist. When viewed in this manner the environment becomes a ‘meta-primary good’ – i.e., without it the ‘social’ primary goods could not exist. One interesting way to give the environment a much more prominent role in Rawls’s theory of justice is to include it in a third principle of justice. 15 A significant work that focuses on the links between environmental quality and human equality and those between sustainability and environmental justice more generally is Agyeman et al.’s (2003) Just Sustainabilities: Development in an Unequal World. This publication, which consists of a selection of papers, focuses specifically on the linkages between the political and policy processes surrounding environmental justice and sustainability. Just Sustainabilities highlights “an important and emerging realization that a sustainable society must also be a just society, locally, nationally and internationally, both within and between generations and species” (ibid, p. 3).
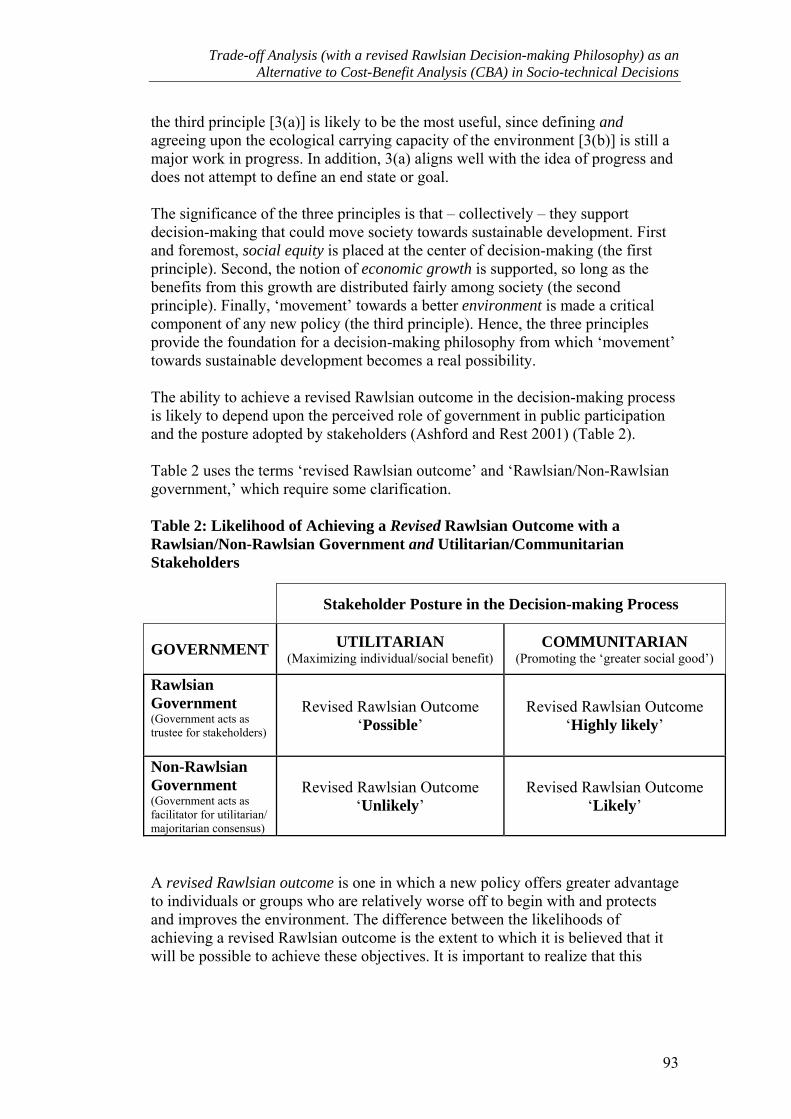
Trade-off Analysis (with a revised Rawlsian Decision-making Philosophy) as an Alternative to Cost-Benefit Analysis (CBA) in Socio-technical Decisions
93
the third principle [3(a)] is likely to be the most useful, since defining and agreeing upon the ecological carrying capacity of the environment [3(b)] is still a major work in progress. In addition, 3(a) aligns well with the idea of progress and does not attempt to define an end state or goal. The significance of the three principles is that – collectively – they support decision-making that could move society towards sustainable development. First and foremost, social equity is placed at the center of decision-making (the first principle). Second, the notion of economic growth is supported, so long as the benefits from this growth are distributed fairly among society (the second principle). Finally, ‘movement’ towards a better environment is made a critical component of any new policy (the third principle). Hence, the three principles provide the foundation for a decision-making philosophy from which ‘movement’ towards sustainable development becomes a real possibility. The ability to achieve a revised Rawlsian outcome in the decision-making process is likely to depend upon the perceived role of government in public participation and the posture adopted by stakeholders (Ashford and Rest 2001) (Table 2). Table 2 uses the terms ‘revised Rawlsian outcome’ and ‘Rawlsian/Non-Rawlsian government,’ which require some clarification.
Table 2: Likelihood of Achieving a Revised Rawlsian Outcome with a Rawlsian/Non-Rawlsian Government and Utilitarian/Communitarian Stakeholders
Stakeholder Posture in the Decision-making Process
GOVERNMENT UTILITARIAN (Maximizing individual/social benefit)
COMMUNITARIAN (Promoting the ‘greater social good’)
Rawlsian Government (Government acts as trustee for stakeholders)
Revised Rawlsian Outcome ‘Possible’
Revised Rawlsian Outcome ‘Highly likely’
Non-Rawlsian Government (Government acts as facilitator for utilitarian/ majoritarian consensus)
Revised Rawlsian Outcome ‘Unlikely’
Revised Rawlsian Outcome ‘Likely’
A revised Rawlsian outcome is one in which a new policy offers greater advantage to individuals or groups who are relatively worse off to begin with and protects and improves the environment. The difference between the likelihoods of achieving a revised Rawlsian outcome is the extent to which it is believed that it will be possible to achieve these objectives. It is important to realize that this
Trade-off Analysis (with a revised Rawlsian Decision-making Philosophy) as an Alternative to Cost-Benefit Analysis (CBA) in Socio-technical Decisions
94
framework does not attempt to achieve a single state of utopia; Rawls does not define such a state. This fact highlights an important difference between Rawlsian thinking and utilitarianism – utilitarian outcomes can be defined by an end state (i.e., efficiency). In contrast, Rawlsian outcomes should be seen as a movement towards equality, not equality per se. A Rawlsian government refers to a government (or decision-making entity) that is willing and has the capacity to act as a trustee for stakeholders, especially for those who are disadvantaged. If stakeholders hold a predominantly utilitarian posture, it is likely that revised Rawlsian outcomes will need to be advocated by a Rawlsian government. If the stakeholders hold a predominantly communitarian posture – which promotes the (perceived) greater societal good – a Rawlsian government may only need to endorse the solutions agreed upon by stakeholders to achieve a revised Rawlsian outcome. Given that we live in a dynamic world, Rawls avoids a static perspective inferred by preoccupation with [static] efficiency criteria. It follows that a non-Rawlsian government is either unwilling or does not have the capacity to advocate for revised Rawlsian outcomes. Instead, it adopts the position as mediator of stakeholder interests. Under this arrangement, the responsibility for achieving a just and fair society is left to the stakeholders. A non-Rawlsian government does not mean that a revised Rawlsian outcome cannot be achieved; it simply means that government does not act as a trustee for stakeholder interests and it would take an influential group of communitarian stakeholders to press for a revised Rawlsian outcome. While the ideas presented in Table 2 are hypothetical, they present some valuable insights that can help guide decision-making towards just, fair, and environmentally sound outcomes. In effect, the table highlights two important observations: [1] a Rawlsian-sympathetic government may not be sufficient to achieve a revised Rawlsian outcome if the stakeholders adopt a utilitarian posture and the government accedes to their wishes; and [2] a non-Rawlsian government can arrive at a revised Rawlsian outcome, but only if stakeholders adopt a communitarian posture16 and the government accedes to their wishes. In a typical policy setting, if one were to adopt a Rawlsian approach to decision making – i.e., any new policy should preferentially advantage the least 16 It should be understood that communitarian stakeholders will not develop a Rawlsian outcome based upon Rawls’s (1971) Theory of Justice; rather, they are likely to approximate a Rawlsian outcome by pursuing the greater social good (or common purpose or goal). Thus, communitarians are ‘likely’ to arrive at a Rawlsian outcome from the perspective of shared moral values that stem from the traditions of a community. While it is not possible to know whether, and to what extent, communitarian stakeholders will develop Rawlsian outcomes – since the perception of a ‘fair outcome’ is likely to differ between communities – one would imagine that their strong emphasis on the ‘community’ is likely to prevent or minimize the marginalization of disadvantaged groups. For an insightful discussion of the differences between views of liberals (i.e., Rawlsians) and communitarians, see Etzioni (1990).
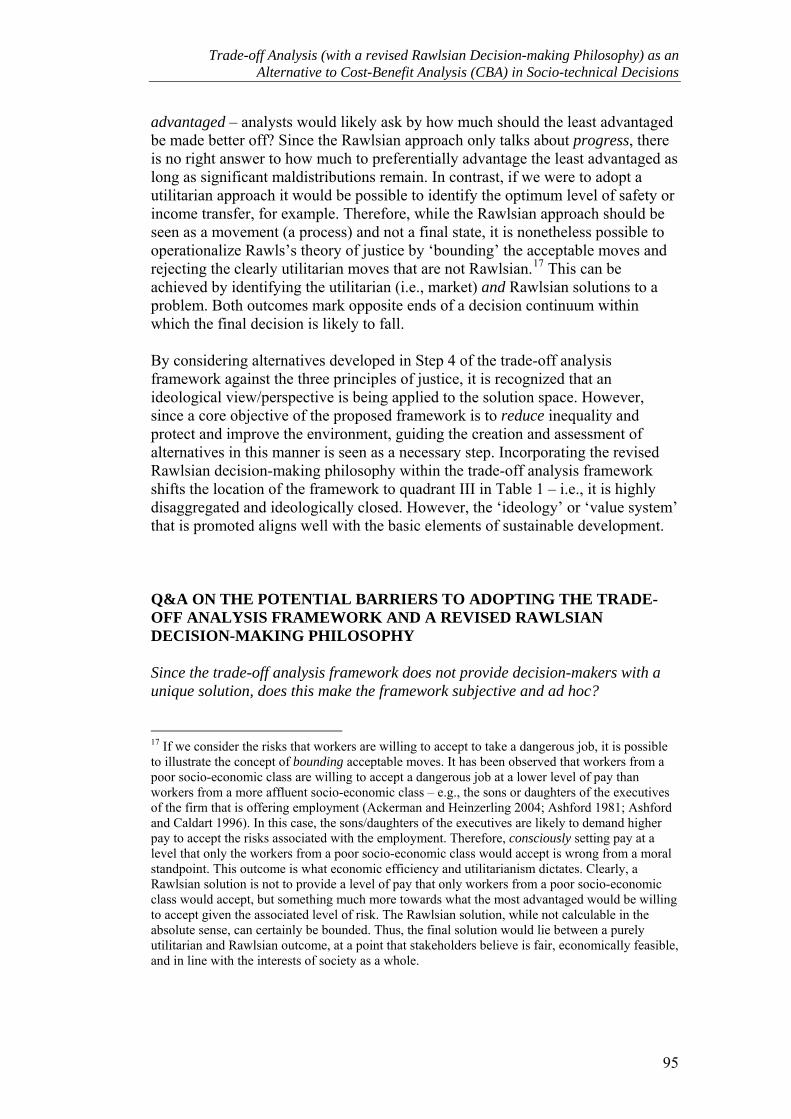
Trade-off Analysis (with a revised Rawlsian Decision-making Philosophy) as an Alternative to Cost-Benefit Analysis (CBA) in Socio-technical Decisions
95
advantaged – analysts would likely ask by how much should the least advantaged be made better off? Since the Rawlsian approach only talks about progress, there is no right answer to how much to preferentially advantage the least advantaged as long as significant maldistributions remain. In contrast, if we were to adopt a utilitarian approach it would be possible to identify the optimum level of safety or income transfer, for example. Therefore, while the Rawlsian approach should be seen as a movement (a process) and not a final state, it is nonetheless possible to operationalize Rawls’s theory of justice by ‘bounding’ the acceptable moves and rejecting the clearly utilitarian moves that are not Rawlsian.17 This can be achieved by identifying the utilitarian (i.e., market) and Rawlsian solutions to a problem. Both outcomes mark opposite ends of a decision continuum within which the final decision is likely to fall. By considering alternatives developed in Step 4 of the trade-off analysis framework against the three principles of justice, it is recognized that an ideological view/perspective is being applied to the solution space. However, since a core objective of the proposed framework is to reduce inequality and protect and improve the environment, guiding the creation and assessment of alternatives in this manner is seen as a necessary step. Incorporating the revised Rawlsian decision-making philosophy within the trade-off analysis framework shifts the location of the framework to quadrant III in Table 1 – i.e., it is highly disaggregated and ideologically closed. However, the ‘ideology’ or ‘value system’ that is promoted aligns well with the basic elements of sustainable development. Q&A ON THE POTENTIAL BARRIERS TO ADOPTING THE TRADE-OFF ANALYSIS FRAMEWORK AND A REVISED RAWLSIAN DECISION-MAKING PHILOSOPHY Since the trade-off analysis framework does not provide decision-makers with a unique solution, does this make the framework subjective and ad hoc? 17 If we consider the risks that workers are willing to accept to take a dangerous job, it is possible to illustrate the concept of bounding acceptable moves. It has been observed that workers from a poor socio-economic class are willing to accept a dangerous job at a lower level of pay than workers from a more affluent socio-economic class – e.g., the sons or daughters of the executives of the firm that is offering employment (Ackerman and Heinzerling 2004; Ashford 1981; Ashford and Caldart 1996). In this case, the sons/daughters of the executives are likely to demand higher pay to accept the risks associated with the employment. Therefore, consciously setting pay at a level that only the workers from a poor socio-economic class would accept is wrong from a moral standpoint. This outcome is what economic efficiency and utilitarianism dictates. Clearly, a Rawlsian solution is not to provide a level of pay that only workers from a poor socio-economic class would accept, but something much more towards what the most advantaged would be willing to accept given the associated level of risk. The Rawlsian solution, while not calculable in the absolute sense, can certainly be bounded. Thus, the final solution would lie between a purely utilitarian and Rawlsian outcome, at a point that stakeholders believe is fair, economically feasible, and in line with the interests of society as a whole.
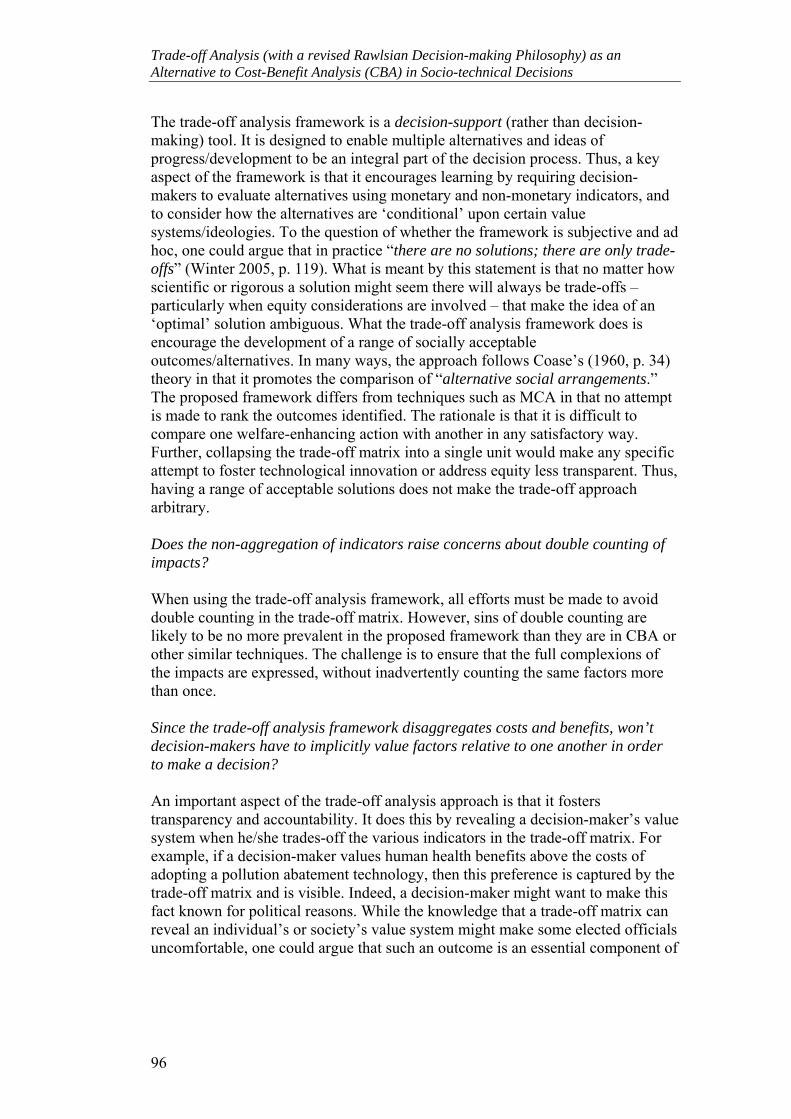
Trade-off Analysis (with a revised Rawlsian Decision-making Philosophy) as an Alternative to Cost-Benefit Analysis (CBA) in Socio-technical Decisions
96
The trade-off analysis framework is a decision-support (rather than decision-making) tool. It is designed to enable multiple alternatives and ideas of progress/development to be an integral part of the decision process. Thus, a key aspect of the framework is that it encourages learning by requiring decision-makers to evaluate alternatives using monetary and non-monetary indicators, and to consider how the alternatives are ‘conditional’ upon certain value systems/ideologies. To the question of whether the framework is subjective and ad hoc, one could argue that in practice “there are no solutions; there are only trade-offs” (Winter 2005, p. 119). What is meant by this statement is that no matter how scientific or rigorous a solution might seem there will always be trade-offs – particularly when equity considerations are involved – that make the idea of an ‘optimal’ solution ambiguous. What the trade-off analysis framework does is encourage the development of a range of socially acceptable outcomes/alternatives. In many ways, the approach follows Coase’s (1960, p. 34) theory in that it promotes the comparison of “alternative social arrangements.” The proposed framework differs from techniques such as MCA in that no attempt is made to rank the outcomes identified. The rationale is that it is difficult to compare one welfare-enhancing action with another in any satisfactory way. Further, collapsing the trade-off matrix into a single unit would make any specific attempt to foster technological innovation or address equity less transparent. Thus, having a range of acceptable solutions does not make the trade-off approach arbitrary. Does the non-aggregation of indicators raise concerns about double counting of impacts? When using the trade-off analysis framework, all efforts must be made to avoid double counting in the trade-off matrix. However, sins of double counting are likely to be no more prevalent in the proposed framework than they are in CBA or other similar techniques. The challenge is to ensure that the full complexions of the impacts are expressed, without inadvertently counting the same factors more than once. Since the trade-off analysis framework disaggregates costs and benefits, won’t decision-makers have to implicitly value factors relative to one another in order to make a decision? An important aspect of the trade-off analysis approach is that it fosters transparency and accountability. It does this by revealing a decision-maker’s value system when he/she trades-off the various indicators in the trade-off matrix. For example, if a decision-maker values human health benefits above the costs of adopting a pollution abatement technology, then this preference is captured by the trade-off matrix and is visible. Indeed, a decision-maker might want to make this fact known for political reasons. While the knowledge that a trade-off matrix can reveal an individual’s or society’s value system might make some elected officials uncomfortable, one could argue that such an outcome is an essential component of
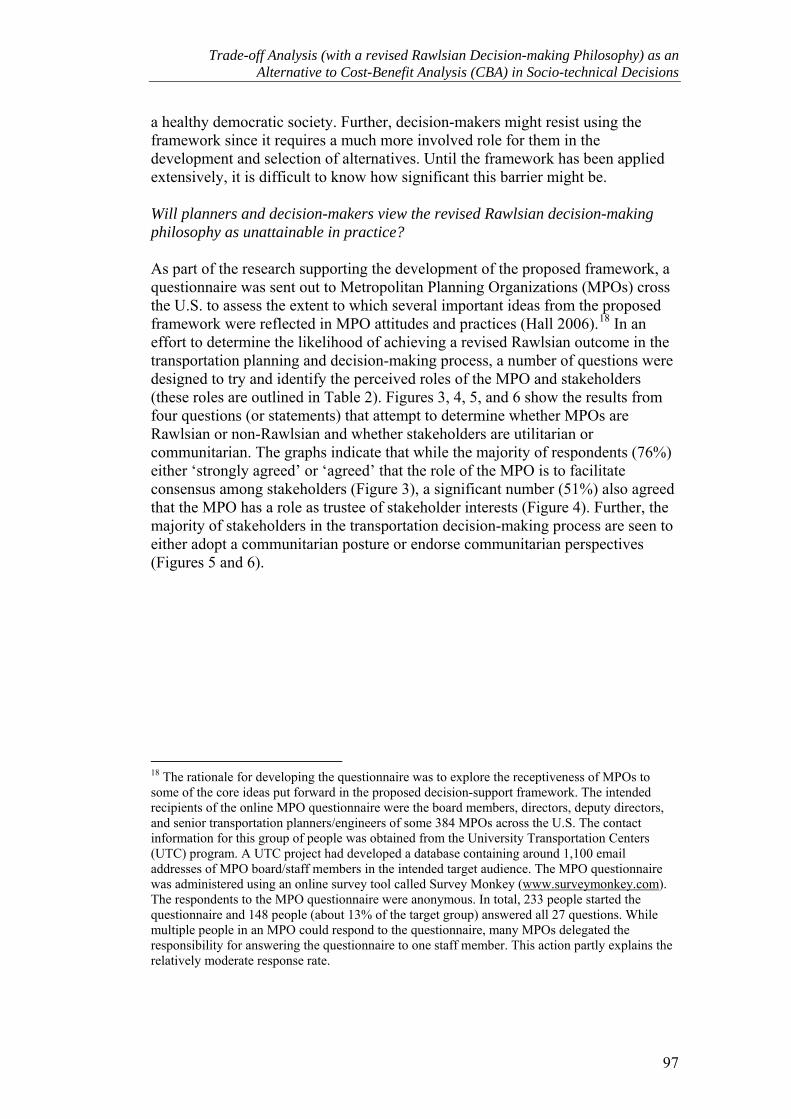
Trade-off Analysis (with a revised Rawlsian Decision-making Philosophy) as an Alternative to Cost-Benefit Analysis (CBA) in Socio-technical Decisions
97
a healthy democratic society. Further, decision-makers might resist using the framework since it requires a much more involved role for them in the development and selection of alternatives. Until the framework has been applied extensively, it is difficult to know how significant this barrier might be. Will planners and decision-makers view the revised Rawlsian decision-making philosophy as unattainable in practice? As part of the research supporting the development of the proposed framework, a questionnaire was sent out to Metropolitan Planning Organizations (MPOs) cross the U.S. to assess the extent to which several important ideas from the proposed framework were reflected in MPO attitudes and practices (Hall 2006).18 In an effort to determine the likelihood of achieving a revised Rawlsian outcome in the transportation planning and decision-making process, a number of questions were designed to try and identify the perceived roles of the MPO and stakeholders (these roles are outlined in Table 2). Figures 3, 4, 5, and 6 show the results from four questions (or statements) that attempt to determine whether MPOs are Rawlsian or non-Rawlsian and whether stakeholders are utilitarian or communitarian. The graphs indicate that while the majority of respondents (76%) either ‘strongly agreed’ or ‘agreed’ that the role of the MPO is to facilitate consensus among stakeholders (Figure 3), a significant number (51%) also agreed that the MPO has a role as trustee of stakeholder interests (Figure 4). Further, the majority of stakeholders in the transportation decision-making process are seen to either adopt a communitarian posture or endorse communitarian perspectives (Figures 5 and 6).
18 The rationale for developing the questionnaire was to explore the receptiveness of MPOs to some of the core ideas put forward in the proposed decision-support framework. The intended recipients of the online MPO questionnaire were the board members, directors, deputy directors, and senior transportation planners/engineers of some 384 MPOs across the U.S. The contact information for this group of people was obtained from the University Transportation Centers (UTC) program. A UTC project had developed a database containing around 1,100 email addresses of MPO board/staff members in the intended target audience. The MPO questionnaire was administered using an online survey tool called Survey Monkey (www.surveymonkey.com). The respondents to the MPO questionnaire were anonymous. In total, 233 people started the questionnaire and 148 people (about 13% of the target group) answered all 27 questions. While multiple people in an MPO could respond to the questionnaire, many MPOs delegated the responsibility for answering the questionnaire to one staff member. This action partly explains the relatively moderate response rate.
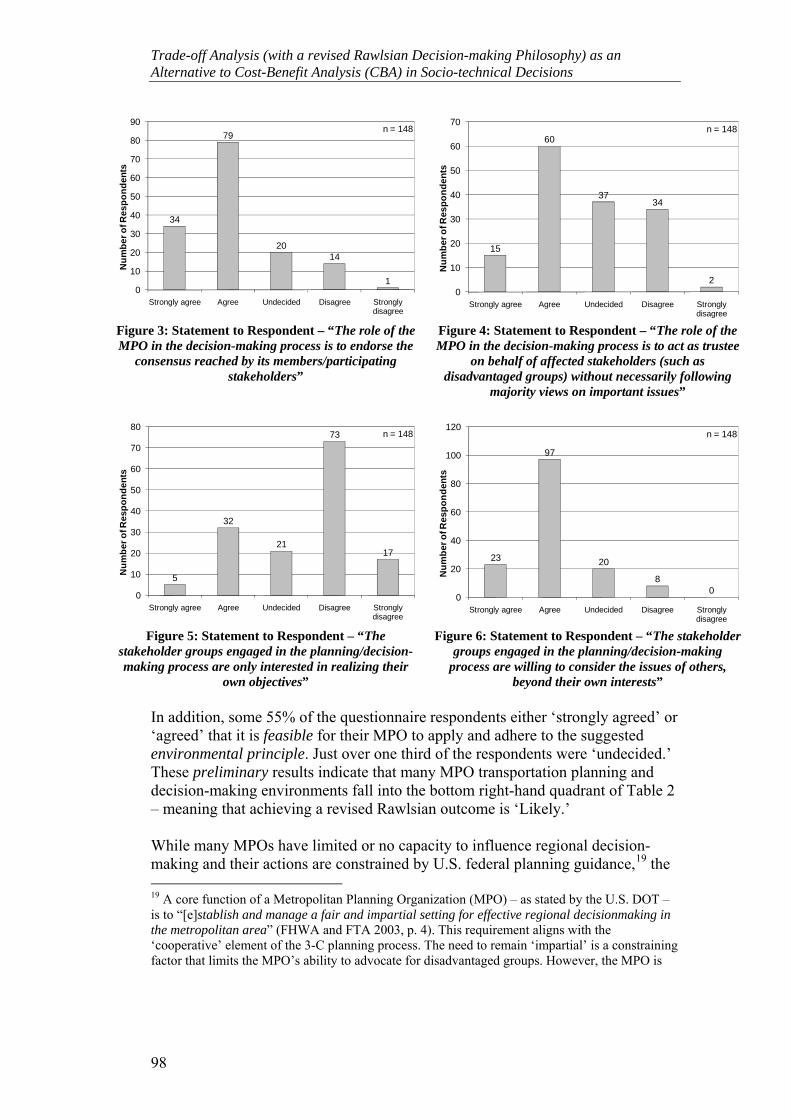
Trade-off Analysis (with a revised Rawlsian Decision-making Philosophy) as an Alternative to Cost-Benefit Analysis (CBA) in Socio-technical Decisions
98
1
1420
79
34
0
10
20
30
40
50
60
70
80
90
Strongly disagree
DisagreeUndecidedAgreeStrongly agree
Num
ber o
f Res
pond
ents
n = 148
2
3437
60
15
0
10
20
30
40
50
60
70
Strongly disagree
DisagreeUndecidedAgreeStrongly agree
Num
ber o
f Res
pond
ents
n = 148
Figure 3: Statement to Respondent – “The role of the MPO in the decision-making process is to endorse the
consensus reached by its members/participating stakeholders”
Figure 4: Statement to Respondent – “The role of the MPO in the decision-making process is to act as trustee
on behalf of affected stakeholders (such as disadvantaged groups) without necessarily following
majority views on important issues”
17
73
21
32
5
0
10
20
30
40
50
60
70
80
Strongly disagree
DisagreeUndecidedAgreeStrongly agree
Num
ber o
f Res
pond
ents
n = 148
08
20
97
23
0
20
40
60
80
100
120
Strongly disagree
DisagreeUndecidedAgreeStrongly agree
Num
ber o
f Res
pond
ents
n = 148
Figure 5: Statement to Respondent – “The stakeholder groups engaged in the planning/decision-making process are only interested in realizing their
own objectives”
Figure 6: Statement to Respondent – “The stakeholder groups engaged in the planning/decision-making
process are willing to consider the issues of others, beyond their own interests”
In addition, some 55% of the questionnaire respondents either ‘strongly agreed’ or ‘agreed’ that it is feasible for their MPO to apply and adhere to the suggested environmental principle. Just over one third of the respondents were ‘undecided.’ These preliminary results indicate that many MPO transportation planning and decision-making environments fall into the bottom right-hand quadrant of Table 2 – meaning that achieving a revised Rawlsian outcome is ‘Likely.’ While many MPOs have limited or no capacity to influence regional decision-making and their actions are constrained by U.S. federal planning guidance,19 the 19 A core function of a Metropolitan Planning Organization (MPO) – as stated by the U.S. DOT – is to “[e]stablish and manage a fair and impartial setting for effective regional decisionmaking in the metropolitan area” (FHWA and FTA 2003, p. 4). This requirement aligns with the ‘cooperative’ element of the 3-C planning process. The need to remain ‘impartial’ is a constraining factor that limits the MPO’s ability to advocate for disadvantaged groups. However, the MPO is
Trade-off Analysis (with a revised Rawlsian Decision-making Philosophy) as an Alternative to Cost-Benefit Analysis (CBA) in Socio-technical Decisions
99
survey results indicate that a revised Ralwsian approach to planning and decision-making at the regional level is not a completely unrealistic proposition. What is evident, however, is that if MPOs are to adopt a Rawlsian approach, they must be given the authority/ability to do so. Further, the revised Rawlsian decision-making philosophy should be seen as a guide rather than a rule that must be adhered to. Its main purpose is to encourage planning and decision-making that reduces inequality and improves the environment. Does integrating the revised Rawlsian decision-making philosophy into the trade-off analysis framework limit the attractiveness of the framework to planners and decision-makers? The trade-off analysis framework combined with the revised Rawlsian decision-making philosophy makes progress towards sustainable development a primary and explicit objective of the decision process. If the revised Rawlsian decision-making philosophy is excluded, the trade-off analysis framework would simply reflect the ideologies of those engaged in the decision process – i.e., sustainability would only be considered if it was an important concern for decision-makers and stakeholders. Decision-support tools such as multi-criteria analysis (MCA) work in this manner. Thus, the proposed approach is likely to be attractive to planners and decision-makers that wish to align their actions and decisions more closely with sustainable development. While equity and environmental concerns are placed at the center of decision-making, the revised Rawlsian decision-making philosophy does not exclude the inclusion of other ideologies or ways of thinking in the evaluation of alternatives. The approach requires decision-makers to consider how an alternative performs with regards to the three principles of justice, but it does not make achieving these principles an absolute requirement. Thus, the approach is pluralistic in that multiple ideologies can be considered and captured by ‘conditional conclusions’ that foster learning.
required “to extend public participation to include people who have been traditionally underserved by the transportation system and services in the region” (ibid, 62, p. 2). The rationale is that “[n]eglecting public involvement can result in proposed solutions that do not address the community’s needs, unnecessary delays, litigation, and can erode public trust” (ibid, p. 2). Hence, the MPO does have a trusteeship role to ensure that the ‘voice’ of all stakeholders is heard – especially those who are underrepresented or underserved – although it is to remain impartial and cannot advocate for certain affected groups. Thus, an interesting question is whether this trusteeship role can be enhanced in a Rawlsian sense to strengthen the MPO’s ability to represent underserved groups. Unless MPOs are able to give preferential consideration to underserved groups, it is unlikely that they would be able to adopt a Rawlsian approach to decision-making.

Trade-off Analysis (with a revised Rawlsian Decision-making Philosophy) as an Alternative to Cost-Benefit Analysis (CBA) in Socio-technical Decisions
100
CONCLUSION
The primary objective of the research behind this paper is to highlight a new direction – i.e., a way of thinking – for decision-making that encourages decisions that support the concept of sustainable development. The distinction of the proposed framework is that it requires decision-makers to make the difficult trade-offs among effects, among actors, and across time periods that tend to be obscured by techniques such as CBA. While the proposed trade-off analysis framework has yet to be applied formally to a real world example, it holds the potential to guide decision-making toward sustainability when combined with a revised Rawlsian decision-making philosophy.
Trade-off Analysis (with a revised Rawlsian Decision-making Philosophy) as an Alternative to Cost-Benefit Analysis (CBA) in Socio-technical Decisions
101
ACKNOWLEDGEMENTS The research upon which this paper is based was generously funded by the Laboratory for Energy and the Environment (LFEE) at MIT and the University Transportation Centers (UTC) Program. DO NOT DELETE (FOOTNOTE REFERENCES): (Pareto Pareto 1896) (Hicks Hicks 1940; Kaldor Kaldor 1939) (Federal Transit Administration (FTA) 2006) (Rousseau 1968) (Beatley 1994) (Partridge Partridge 1976) (Lehman Lehman 1995) (Miller Miller 1999) (Dobson Dobson 1998) (Chapman 2001) (Agyeman 2003) (Etzioni 1990) (Federal Highway Administration (FHWA) and Federal Transit Administration (FTA) 2003) (Ashford and Caldart 2008) (Ackerman and Heinzerling 2004; Ashford 1981; Ashford and Caldart 1996)
REFERENCES Ackerman, F., and Heinzerling, L. (2004). Priceless: On Knowing the Price of
Everything and the Value of Nothing, The New Press, New York. Agyeman, J., Bullard, R. D., and Evans, B. (2003). "JUST Sustainabilities:
Development in an Unequal World." The MIT Press, Cambridge. Ashford, N. A. "The Role of Risk Assessment and Cost-Benefit Analysis in
Decisions Concerning Safety and the Environment." FDA Symposium on Risk/Benefit Decisions and the Public Health, February 17, 1978, Colorado Springs, 159-168.
Ashford, N. A. (1981). "Alternatives to Cost-Benefit Analysis in Regulatory Decisions." Annals of the New York Academy of Science, 363(1), 129-137.
Ashford, N. A. (1999). "A Conceptual Framework for the Use of the Precautionary Principle in Law." Protecting Public Health and the Environment: Implementing the Precautionary Principle, C. Raffensperger and J. A. Tickner, eds., Island Press, Washington, D.C., 198-206.
Ashford, N. A. (2000). "An Innovation-Based Strategy for a Sustainable Environment." Innovation-Oriented Environmental Regulation: Theoretical Approach and Empirical Analysis, J. Hemmelskamp, K. Rennings, and F. Leone, eds., Physica- Verlag Heidelberg, New York, 67-107.
Ashford, N. A. (2002). "Government and Environmental Innovation in Europe and North America." American Behavioral Scientist, 45(9), 1417-1434.
Ashford, N. A. (2004). "Major Challenges to Engineering Education for Sustainable Development: What has to change to make it creative, effective, and acceptable to the established disciplines?" International Journal of Sustainability and Higher Education, 5(3), 239-250.
Ashford, N. A. (2005). "Implementing the Precautionary Principle: Incorporating Science, Technology, Fairness, and Accountability in Environmental, Health, and Safety Decisions." International Journal of Risk Assessment and Management, 5(2/3/4), 112-124.
Ashford, N. A., and Caldart, C. C. (1996). Technology, Law, and the Working Environment, Island Press, Washington, D. C.
Ashford, N. A., and Caldart, C. C. (2008). Environmental Law, Policy, and Economics: Reclaiming the Environmental Agenda, MIT Press, Cambridge.
Trade-off Analysis (with a revised Rawlsian Decision-making Philosophy) as an Alternative to Cost-Benefit Analysis (CBA) in Socio-technical Decisions
102
Ashford, N. A., and Rest, K. M. (2001). "Public Participation in Contaminated Communities." Center for Technology, Policy and Industrial Development, Massachusetts Institute of Technology, Cambridge.
Beatley, T. (1994). Ethical Land Use: Principles of Policy and Planning, The Johns Hopkins University Press, Baltimore.
Bromley, D. W. (1980). "The Benefit-Cost Dilemma." Western Water Resources: Coming Problems and Policy Alternatives, Westview Press, Boulder.
Chapman, G. (2001). "The Intersection of Environmental Planning and Social Justice: Denver's Platte River Greenway," Massachusetts Institute of Technology, Cambridge.
Coase, R. H. (1960). "The Problem of Social Cost." Journal of Law and Economics 3, 1-44.
Congleton, R. D., and Sweetser, W. (1992). "Political Deadlocks and Distributional Information: The value of the veil." Public Choice, 73, 1-19.
Dobson, A. (1998). Justice and the Environment: Conceptions of Environmental Sustainability and Dimensions of Social Justice, Oxford University Press, Oxford.
Donohue, J. J. (1999). "Why We Should Discount the Views of Those Who Discount Discounting." Yale Law Journal, 108, 1901-1910.
Driesen, D. M. (2003). The Economic Dynamics of Environmental Law, MIT Press, Cambridge.
Driesen, D. M. (2004). "The Economic Dynamics of Environmental Law: Cost-Benefit Analysis, Emissions Trading, and Priority-Setting." Boston College Environmental Affairs Law Review, 31(3), 501-528.
Etzioni, A. (1990). "Liberals and Communitarians." Partisan Review, LVII(2), 215-227.
Federal Highway Administration (FHWA), and Federal Transit Administration (FTA). (2003). "The Metropolitan Transportation Planning Process: Key Issues. A Briefing Notebook for Transportation Decisionmakers, Officials, and Staff." FHWA-EP-03-041 (5/04), U.S. Department of Transportation, Washington, D. C.
Federal Transit Administration (FTA). (2006). "Procedures and Technical Methods for Transit Project Planning." Federal Transit Administration (FTA), http://www.fta.dot.gov/printer_friendly/planning_environment_2396.html (accessed on 11/12/06), Washington, D.C.
Glicksman, R. L., and Shapiro, S. A. (2003). Risk Regulation at Risk: Restoring a Pragmatic Balance, Stanford University Press, Stanford.
Government Accountability Office (GAO). (2005). "Highway and Transit Investment: Options for Improving Information on Projects' Benefits and Costs and Increasing Accountability for Results." GAO-05-172, Government Accountability Office, Washington, D. C.
Hall, R. P. (2006). "Understanding and Applying the Concept of Sustainable Development to Transportation Planning and Decision-Making in the U.S.," Massachusetts Institute of Technology, Cambridge, http://esd.mit.edu/students/esdphd/dissertations/hall_ralph.pdf.
Trade-off Analysis (with a revised Rawlsian Decision-making Philosophy) as an Alternative to Cost-Benefit Analysis (CBA) in Socio-technical Decisions
103
Hanley, N., and Spash, C. L. (1993). Cost-Benefit Analysis and the Environment, Edward Elgar, Aldershot.
Harberger, A. C. (1984). "Basic Needs versus Distributional Weights in Social Cost-Benefit Analysis." Economic Development and Cultural Change, 32(3), 455-474.
Heinzerling, L. (1998). "Regulatory Costs of Mythic Proportions." Yale Law Journal, 107, 1981-2070.
Heinzerling, L., and Ackerman, F. (2002). "Pricing the Priceless: Cost-Benefit Analysis of Environmental Protect." The Georgetown Environmental Law and Policy Institute, Washington, D. C.
Hicks, J. R. (1940). "The Valuation of the Social Income." Economica, 7, 105–124.
Kaldor, N. (1939). "Welfare Propositions of Economics and Interpersonal Comparisons of Utility." The Economic Journal(49), 549–552.
Kapp, W. K. (1970). "Environmental Disruption: General Issues and Methodological Problems." Social Science Information, 4, 15-32.
Kelman, S. (1981). "Cost-Benefit Analysis: An Ethical Critique." AEI Journal on Government and Society Regulation, 5(January/February), 33-40.
Kelman, S. (1982). "Cost-Benefit Analysis and Environmental, Safety, and Health Regulation: Ethical and Philosophical Considerations." Cost-Benefit Analysis and Environmental Regulations: Politics, Ethics, and Methods, D. Swartzman, R. A. Liroff, and K. G. Croke, eds., The Conservation Foundation, Washington, D.C., 137-151.
Kriström, B. (2006). "Framework for Assessing the Distribution of Financial Effects of Environmental Policy." The Distributional Effects of Environmental Policy, Y. Serret and N. Johnstone, eds., Edward Elgar, Cheltenham, 79-136.
Lehman, G. (1995). "A Legitmate Concern for Environmental Accounting." Critical Perspectives on Accounting, 6, 393-412.
McAllister, D. M. (1995). Evaluation in Environmental Planning: Assessing Environmental, Social, Economic, and Political Trade-offs, The MIT Press, Cambridge.
Miller, D. (1999). "Social Justice and Environmental Goods." Fairness and Futurity: Essays on Environmental Sustainability and Social Justice, A. Dobson, ed., Oxford University Press, Oxford.
Mishan, E. J. (1988). Cost-Benefit Analysis. An Informal Introduction, Unwin Hyman, London.
O'Brien, M. (1999). "Alternatives Assessment: Part of Operationalizing and Institutionalizing the Precautionary Principle." Protecting Public Health and the Environment: Implementing the Precautionary Principle, C. Raffensperger and J. A. Tickner, eds., Island Press, Washington, D.C., 207-219.
O'Brien, M. (2000). Making Better Environmental Decisions: An Alternative to Risk Assessment, The MIT Press, Cambridge.
Pareto, V. (1896). Cours d’Economie Politique, volume 2, F. Rouge, Lausanne.
Trade-off Analysis (with a revised Rawlsian Decision-making Philosophy) as an Alternative to Cost-Benefit Analysis (CBA) in Socio-technical Decisions
104
Partridge, E. (1976). "Rawls and the Duty to Posterity," University of Utah, Salt Lake City.
Pearce, D., Atkinson, G., and Mourato, S. (2006). Cost-Benefit Analysis and the Environment. Recent Developments, Organisation for Economic Co-Operation and Development (OECD), Paris.
Portney, P., and Weyant, J. P. (1999). "Discounting and Intergenerational Equity." Resources for the Future, Washington, D. C.
Rawls, J. (1971). A Theory of Justice, Harvard University Press, Cambridge. Rousseau, J. (1968). The Social Contract, Penguin Books, London. Sagoff, M. (1988). The Economy of the Earth, Cambridge University Press,
Cambridge. Söderbaum, P. (1973). "Positionsanalys vid beslutsfattande of planering.
Ekonomisk analys pa tvarvetenskaplig grund (Positional Analysis for Decision Making and Planning. Economic analysis on an interdisciplinary basis.)," Esselte Stadium, Stockholm.
Söderbaum, P. (1987). "Environmental Management: A Non-Traditional Approach." Journal of Economic Issues, 21(1), 139-165.
Söderbaum, P. (2000). Ecological Economics: A Political Economics Approach to Environment and Development, Earthscan Publications Ltd., London.
Söderbaum, P. (2001). "Neoclassical Economics, Institutional Theory and Democracy: CBA and Its Alternatives." Economic and Political Weekly, 36( 21), 1846-1854.
Söderbaum, P. "Decision Processes and Decision-making in relation to Sustainable Development and Democracy." The European Society for Ecological Economics (ESEE) conference on European Applications of Ecological Economics, February 12-15, 2003, Tenerife.
Söderbaum, P. (2004). "Decision Processes and Decision-making in Relation to Sustainable Development and Democracy - Where Do we Stand?" The Journal of Interdisciplinary Economics, 14, 41-60.
Swartzman, D. (1982). "Cost-Benefit Analysis in Environmental Regulation: Sources of the Controversy." Cost-Benefit Analysis and Environmental Regulations: Politics, Ethics, and Methods, D. Swartzman, R. A. Liroff, and K. G. Croke, eds., The Conservation Foundation, Washington, D.C., 53-85.
Tribe, L. (1972). "Policy Science: Analysis or Ideology." Philosophy and Public Affairs, 2 (Fall), 66-110.
Winter, H. (2005). Trade-offs: An Introduction to Economic Reasoning and Social Issues, The University of Chicago Press, Chicago.
105
USING SUSTAINABLE TRANSPORTATION PERFORMANCE MEASURES IN CORRIDOR DECISION MAKING
Josias Zietsman1 and Laurence R. Rilett2 1Center for Air Quality Studies, Texas Transportation Institute, 3135 TAMU College Station, TX 77843-3135 [email protected] 2University of Nebraska at Lincoln, Department of Civil Engineering Lincoln, NE 68588-0416 [email protected]
INTRODUCTION The transportation planning process includes many different objectives and reflects the wishes of wide-ranging interests. A sustainable transportation system seeks to ensure that the dimensions of economic development, social equity, and environmental stewardship are addressed within the transportation sector. Decision making in the context of sustainable transportation, therefore, involves the evaluation of a discrete set of alternatives while considering conflicting objectives. For sustainable transportation to be successfully implemented it is essential that the concepts are adequately understood, quantified, and applied (1). The focus of this paper is to show how to identify appropriate performance measures for sustainable transportation and how such measures can be quantified with new and innovative technologies, and how these measures can be used to make decisions. For this research, a corridor in a city of a developed nation and one in a developing nation were selected as test beds. It was shown that the concepts of sustainable transportation are universal across nations and the methodology developed in this paper can be applied across nations. The paper is divided into three sections. The first section describes typical sustainable transportation performance measures. The second section provides a description of the different methods of disaggregation. The third section discusses innovative methods for collecting performance measurement data. The fourth section provides the application and the final section contains the concluding remarks. TYPICAL SUSTAINABILITY PERFORMANCE MEASURES A strategic planning approach will result in specific objectives that need to be addressed to reach the broader goals of sustainable transportation. These objectives
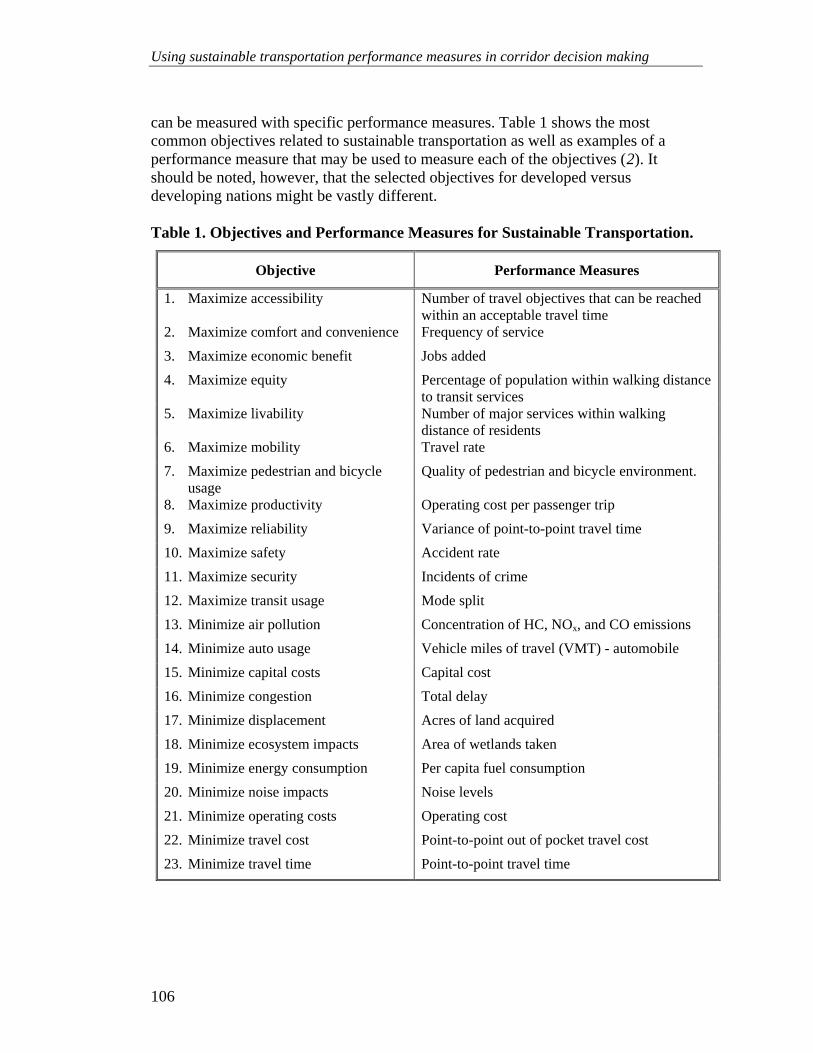
Using sustainable transportation performance measures in corridor decision making
106
can be measured with specific performance measures. Table 1 shows the most common objectives related to sustainable transportation as well as examples of a performance measure that may be used to measure each of the objectives (2). It should be noted, however, that the selected objectives for developed versus developing nations might be vastly different. Table 1. Objectives and Performance Measures for Sustainable Transportation.
Objective Performance Measures
1. Maximize accessibility Number of travel objectives that can be reached within an acceptable travel time
2. Maximize comfort and convenience Frequency of service 3. Maximize economic benefit Jobs added 4. Maximize equity
Percentage of population within walking distance to transit services
5. Maximize livability
Number of major services within walking distance of residents
6. Maximize mobility Travel rate 7. Maximize pedestrian and bicycle
usage Quality of pedestrian and bicycle environment.
8. Maximize productivity Operating cost per passenger trip 9. Maximize reliability Variance of point-to-point travel time 10. Maximize safety Accident rate 11. Maximize security Incidents of crime 12. Maximize transit usage Mode split 13. Minimize air pollution Concentration of HC, NOx, and CO emissions 14. Minimize auto usage Vehicle miles of travel (VMT) - automobile 15. Minimize capital costs Capital cost 16. Minimize congestion Total delay 17. Minimize displacement Acres of land acquired 18. Minimize ecosystem impacts Area of wetlands taken 19. Minimize energy consumption Per capita fuel consumption 20. Minimize noise impacts Noise levels 21. Minimize operating costs Operating cost 22. Minimize travel cost Point-to-point out of pocket travel cost 23. Minimize travel time Point-to-point travel time

Using sustainable transportation performance measures in corridor decision making
107
METHODS OF DISAGGREGATION For a typical transportation system, a number of different types of disaggregation can be considered for quantifying performance measures, namely spatial, temporal, combined spatial and temporal, and the individual level. The individual level can be used as a separate level of disaggregation or in combination with spatial and/or temporal disaggregation. Spatial and temporal disaggregation can each be applied at different levels of detail, which can be defined by the segment lengths and time interval lengths, respectively. Figure 1 shows how the different types of disaggregation are related. The figure shows that there are numerous possible combinations in which the types of disaggregation can be applied. The eventual accuracy of the application depends on factors such as the type of disaggregation that is applied, the level of detail used within each application, and the underlying function of the performance measure that is under analysis. Due to the effect of aggregation bias and the higher level of detail obtained by a more disaggregate approach, it is preferable to use a more disaggregate approach wherever more possible.
Figure 1. Relationship between the Different Types of Disaggregation.
INNOVATIVE METHODS FOR COLLECTING PERFORMANCE MEASUREMENT DATA Travel time, travel time variability, and speed have been identified as important building blocks for quantifying a number of sustainable transportation performance measures. Specifically, these measures can be used as input for quantifying the following sustainable transportation objectives (3,4): i) maximize accessibility; ii) maximize equity; iii) maximize mobility; iv) maximize reliability; v) minimize air
Spatial Spatial and temporal
Temporal
Individual
Disaggregation
Using sustainable transportation performance measures in corridor decision making
108
pollution; vi) minimize congestion; vii) minimize energy consumption; viii) minimize noise impacts; ix) minimize travel cost; and x) minimize travel time.
Two techniques have traditionally been used to measure travel time, namely the license plate technique and the floating car technique. The advent of Intelligent Transportation Systems (ITS), however, has made it possible to obtain travel time information much easier and at a more disaggregate level. The following are examples of ITS techniques that may be used for quantifying travel time, travel time variability, and speed data in urban areas. Automatic Vehicle Identification (AVI) An AVI system consists of an in-vehicle transponder (tag), a roadside reading unit, and a central computer system. When a vehicle, which is equipped with a transponder, passes a roadside reader unit, the unit records information such as the vehicle’s identification number, time and date the tag was read, and the number of the reader unit. This information is then sent, via a modem, from the reader unit to a central computer. The central computer is used to store the tag reads and to establish tag matches. Travel times and speeds are then computed from the matched information and the distances between the AVI readers. Automatic Vehicle Location (AVL) Research among most major car manufacturers is currently moving in a direction where every car in the future might double as a moving sensor. Vehicles might send information about location, travel time, speed, weather conditions, congestion, and road surface conditions to a central computer. Some vehicles are currently equipped with satellite navigation systems, which can provide information on the vehicle’s location, which can be translated into travel times. In addition to the car manufacturers, some major companies such as 3M are also making great strides in their AVL research. Cellular Phone Tracking Cellular telephone systems are radio-based mobile communication systems. It uses many base stations to transmit or receive the signals from the mobile telephones. These base stations are distributed over a service area, normally in a hexagonal pattern. There are three methods that positioning can be derived in a cellular positioning system: i) the signal profiling technique involves measuring the characteristics of the received signal and comparing it with a database of previous measurements; ii) the angle of arrival technique uses a large antenna in order to estimate the angle of arrival of the received signal; and iii) the timing measurement technique requires a receiver to make an accurate determination of the time-of-arrival of received signals. The arrival time of the signal is a function of distance traveled,
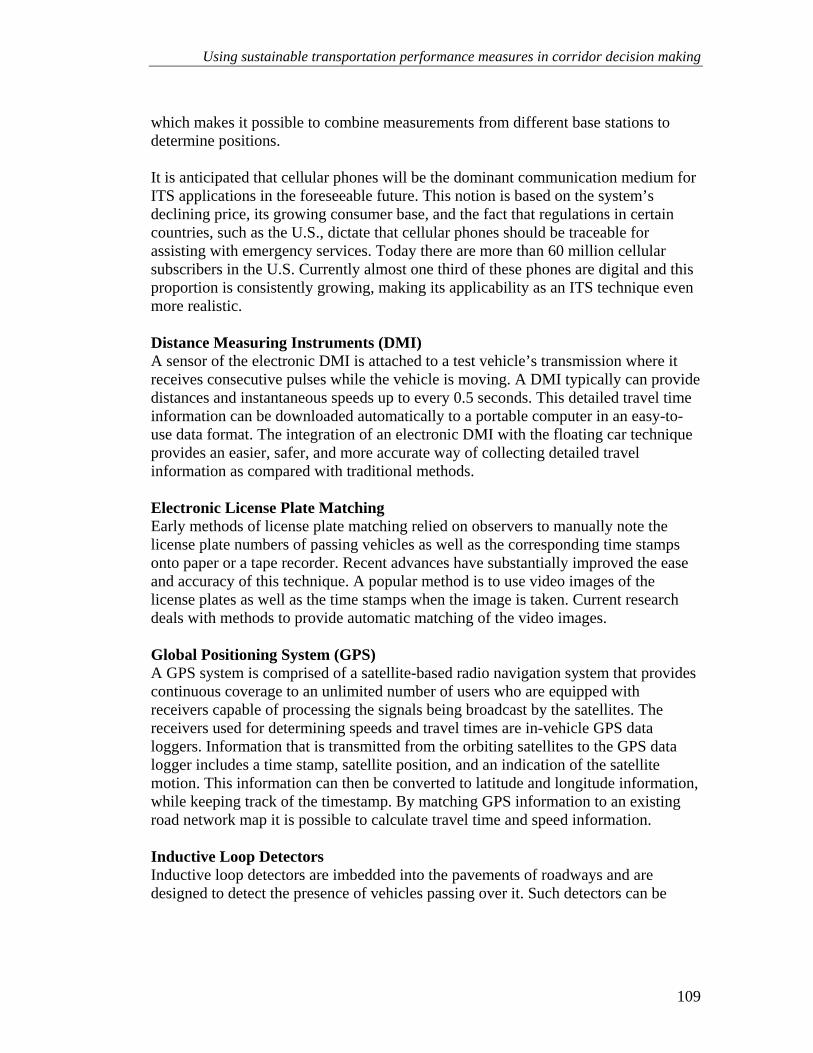
Using sustainable transportation performance measures in corridor decision making
109
which makes it possible to combine measurements from different base stations to determine positions. It is anticipated that cellular phones will be the dominant communication medium for ITS applications in the foreseeable future. This notion is based on the system’s declining price, its growing consumer base, and the fact that regulations in certain countries, such as the U.S., dictate that cellular phones should be traceable for assisting with emergency services. Today there are more than 60 million cellular subscribers in the U.S. Currently almost one third of these phones are digital and this proportion is consistently growing, making its applicability as an ITS technique even more realistic. Distance Measuring Instruments (DMI) A sensor of the electronic DMI is attached to a test vehicle’s transmission where it receives consecutive pulses while the vehicle is moving. A DMI typically can provide distances and instantaneous speeds up to every 0.5 seconds. This detailed travel time information can be downloaded automatically to a portable computer in an easy-to-use data format. The integration of an electronic DMI with the floating car technique provides an easier, safer, and more accurate way of collecting detailed travel information as compared with traditional methods. Electronic License Plate Matching Early methods of license plate matching relied on observers to manually note the license plate numbers of passing vehicles as well as the corresponding time stamps onto paper or a tape recorder. Recent advances have substantially improved the ease and accuracy of this technique. A popular method is to use video images of the license plates as well as the time stamps when the image is taken. Current research deals with methods to provide automatic matching of the video images. Global Positioning System (GPS) A GPS system is comprised of a satellite-based radio navigation system that provides continuous coverage to an unlimited number of users who are equipped with receivers capable of processing the signals being broadcast by the satellites. The receivers used for determining speeds and travel times are in-vehicle GPS data loggers. Information that is transmitted from the orbiting satellites to the GPS data logger includes a time stamp, satellite position, and an indication of the satellite motion. This information can then be converted to latitude and longitude information, while keeping track of the timestamp. By matching GPS information to an existing road network map it is possible to calculate travel time and speed information. Inductive Loop Detectors Inductive loop detectors are imbedded into the pavements of roadways and are designed to detect the presence of vehicles passing over it. Such detectors can be
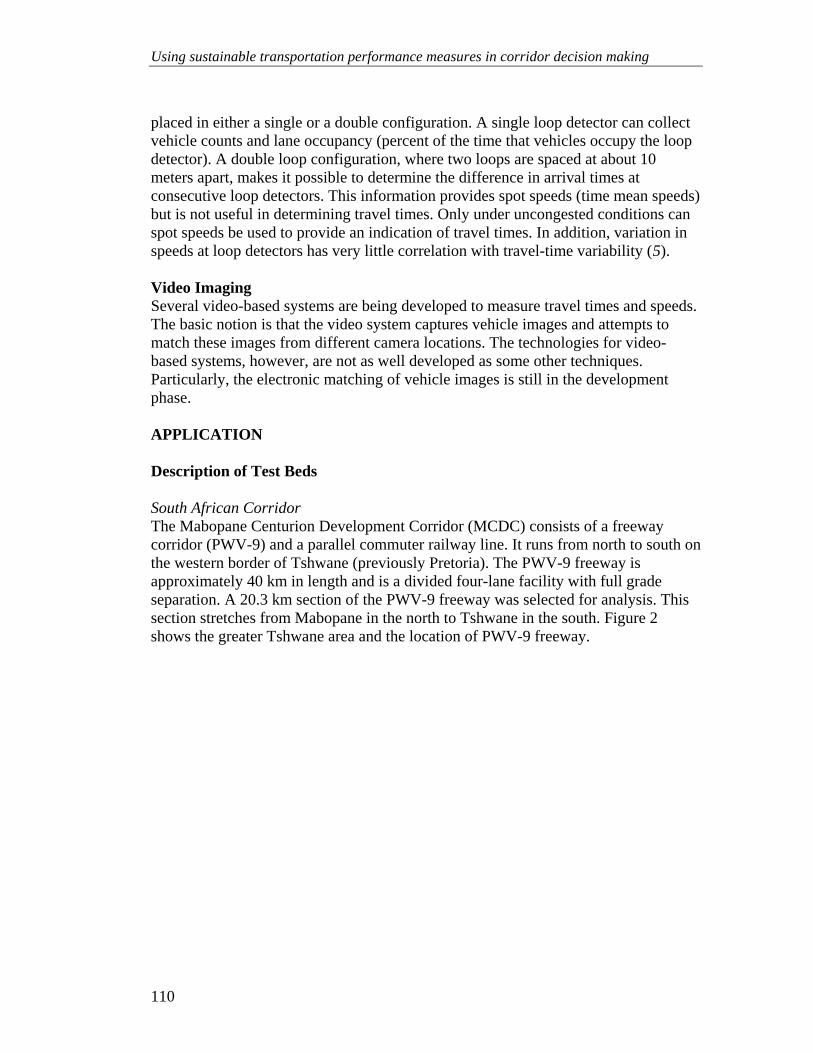
Using sustainable transportation performance measures in corridor decision making
110
placed in either a single or a double configuration. A single loop detector can collect vehicle counts and lane occupancy (percent of the time that vehicles occupy the loop detector). A double loop configuration, where two loops are spaced at about 10 meters apart, makes it possible to determine the difference in arrival times at consecutive loop detectors. This information provides spot speeds (time mean speeds) but is not useful in determining travel times. Only under uncongested conditions can spot speeds be used to provide an indication of travel times. In addition, variation in speeds at loop detectors has very little correlation with travel-time variability (5). Video Imaging Several video-based systems are being developed to measure travel times and speeds. The basic notion is that the video system captures vehicle images and attempts to match these images from different camera locations. The technologies for video-based systems, however, are not as well developed as some other techniques. Particularly, the electronic matching of vehicle images is still in the development phase. APPLICATION Description of Test Beds South African Corridor The Mabopane Centurion Development Corridor (MCDC) consists of a freeway corridor (PWV-9) and a parallel commuter railway line. It runs from north to south on the western border of Tshwane (previously Pretoria). The PWV-9 freeway is approximately 40 km in length and is a divided four-lane facility with full grade separation. A 20.3 km section of the PWV-9 freeway was selected for analysis. This section stretches from Mabopane in the north to Tshwane in the south. Figure 2 shows the greater Tshwane area and the location of PWV-9 freeway.
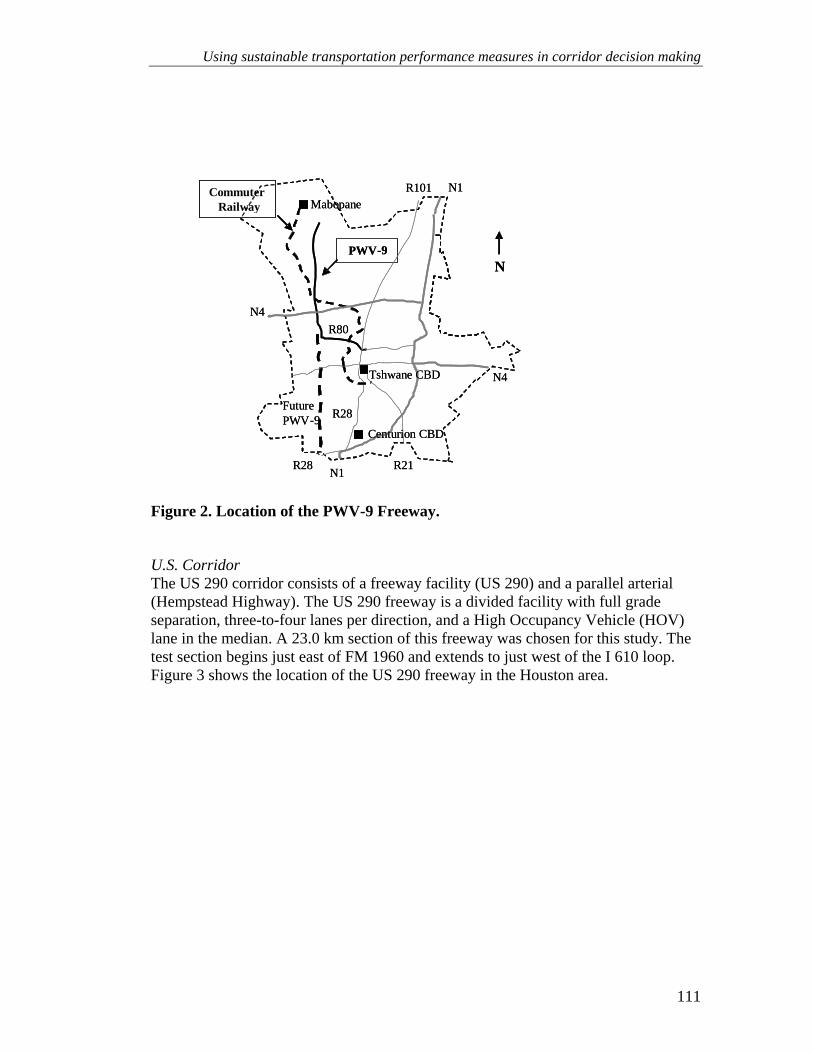
Using sustainable transportation performance measures in corridor decision making
111
Figure 2. Location of the PWV-9 Freeway.
U.S. Corridor The US 290 corridor consists of a freeway facility (US 290) and a parallel arterial (Hempstead Highway). The US 290 freeway is a divided facility with full grade separation, three-to-four lanes per direction, and a High Occupancy Vehicle (HOV) lane in the median. A 23.0 km section of this freeway was chosen for this study. The test section begins just east of FM 1960 and extends to just west of the I 610 loop. Figure 3 shows the location of the US 290 freeway in the Houston area.
Commuter Railway
N
R21R28
N4
N1
N1
PWV-9
R101
Future PWV - 9
Tshwane CBD
Centurion CBD
Mabopane
R28
R80N4
Commuter Railway
N
R21R28
N4
N1
N1
PWV-9
R101
Future PWV - 9
Tshwane CBD
Centurion CBD
Mabopane
R28
R80N4
Using sustainable transportation performance measures in corridor decision making
112
Figure 3. Location of the US 290 Freeway in the Houston Area.
Selection of Decision-Making Method Conventional evaluation techniques for transportation decision making focus primarily on the quantifiable financial and economic aspects of the investment. The public, however, is mostly concerned about sustainability issues such as social equity, safety, and the environment. A distinction can be made between evaluation techniques and evaluation processes (6). An example of the former is a benefit-cost analysis, whereas the latter concerns the full spectrum of cost elements as well as interaction among the key participants in the planning process. The full spectrum of costs includes user costs, external costs, and agency costs. External costs are the costs that are most difficult to measure and include aspects such as changes in property values, noise impact, air pollution, accidents, visual intrusion, and environmental damage (7). Evaluation processes, therefore, are the appropriate techniques for making decisions concerning sustainable transportation systems because:
• deciding upon transportation alternatives is often more of a political process than a technical one;
US 290
I 45
I 610 I 10
US 59
US 59
I 45 N
FM 1960
225
I 10
SH 6
Beltway 8
SH 288
Using sustainable transportation performance measures in corridor decision making
113
• the latest legislation requires a lot of inclusiveness when deciding upon transportation alternatives; and
• evaluation techniques are not able to incorporate the full spectrum of costs when evaluating transportation alternatives.
The major advantage of a multi-criteria analysis is its capacity to account for a wide range of differing, yet relevant criteria. Even if these criteria cannot be expressed in monetary terms, as is the case with externalities, comparisons can still be based on relative priorities (8). Several methods have been developed to assess the relative importance of projects or plans based on multi-criteria analyses (9). After careful consideration it was decided to use the MAUT approach for this study because it is a fairly simple and intuitive approach to decision making. Additionally, it allows the decision maker to allocate relative weights to the various criteria (10). The MAUT approach is an attempt to rigorously apply objective measurement to decision making. The basic hypothesis of MAUT is that in any decision problem there exists a real valued function or utility (U), defined by the set of feasible alternatives that the decision maker seeks, consciously or not, to maximize (11). Each alternative results in an outcome, which may have a value on a number of different dimensions. MAUT seeks to measure these values, one dimension at a time, followed by an aggregation of these values across the dimensions through a weighting procedure. The simplest and most widely used aggregation rule is to take the weighted linear average. In this case, each weight is used in conjunction with each criterion value to produce the final utilities. The MAUT approach consists of the following steps:
Step 1: Identify the various criteria and sub-criteria to be used in the evaluation process.
Step 2: Rank the different criteria and sub-criteria in order of importance. Step 3: Rate the different criteria and sub-criteria on a scale from zero to one,
while reflecting the ratio of relative importance of one criterion over the next.
Step 4: Normalize these weights on a scale from zero to one. Step 5: Determine criteria values for each alternative by using single-attribute
utility functions on linear normalized scales. Step 6: Calculate the utilities for the alternatives by obtaining the weighted
linear sum for the criteria. Equation 1 shows how the utility values can be determined for each alternative and Equation 2 shows how the normalized criteria values are determined from single-attribute utility functions on normalized scales.
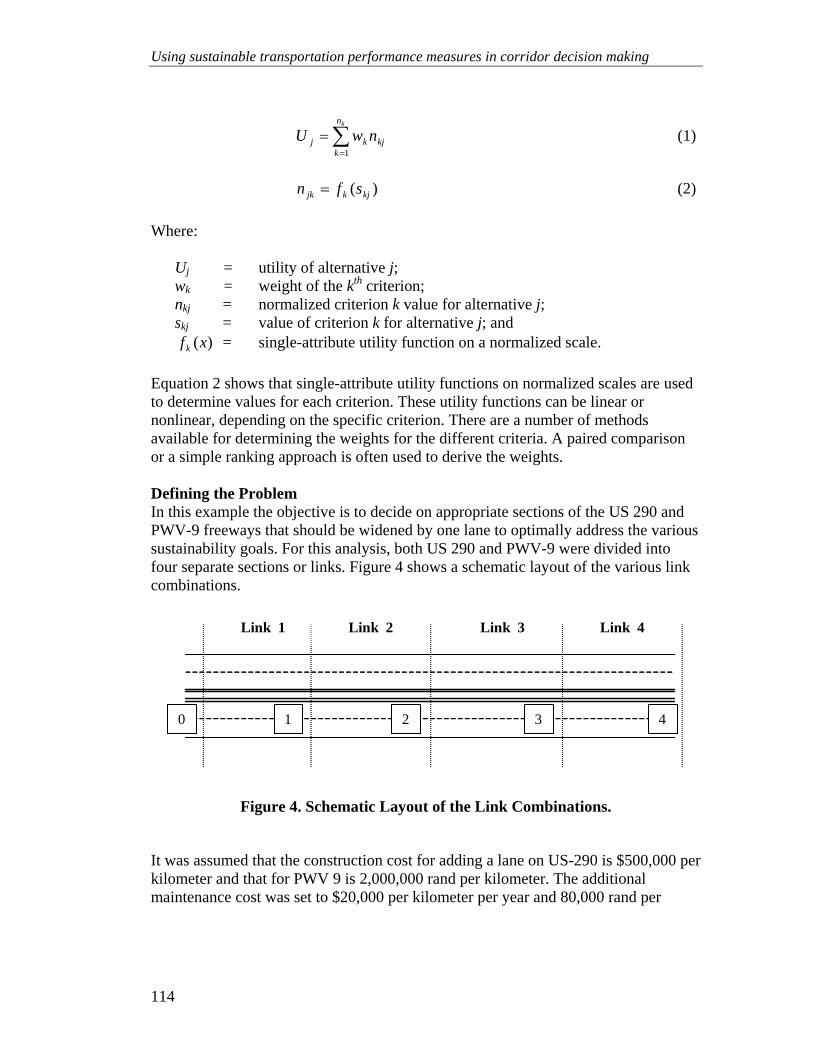
Using sustainable transportation performance measures in corridor decision making
114
∑=
=kn
kkjkj nwU
1
(1)
)( kjkjk sfn = (2)
Where: Uj = utility of alternative j; wk = weight of the kth criterion; nkj = normalized criterion k value for alternative j; skj = value of criterion k for alternative j; and )(xfk = single-attribute utility function on a normalized scale. Equation 2 shows that single-attribute utility functions on normalized scales are used to determine values for each criterion. These utility functions can be linear or nonlinear, depending on the specific criterion. There are a number of methods available for determining the weights for the different criteria. A paired comparison or a simple ranking approach is often used to derive the weights. Defining the Problem In this example the objective is to decide on appropriate sections of the US 290 and PWV-9 freeways that should be widened by one lane to optimally address the various sustainability goals. For this analysis, both US 290 and PWV-9 were divided into four separate sections or links. Figure 4 shows a schematic layout of the various link combinations.
Figure 4. Schematic Layout of the Link Combinations.
It was assumed that the construction cost for adding a lane on US-290 is $500,000 per kilometer and that for PWV 9 is 2,000,000 rand per kilometer. The additional maintenance cost was set to $20,000 per kilometer per year and 80,000 rand per
Link 1 Link 2 Link 3 Link 4
0 4321
Link 1 Link 2 Link 3 Link 4
0 4321
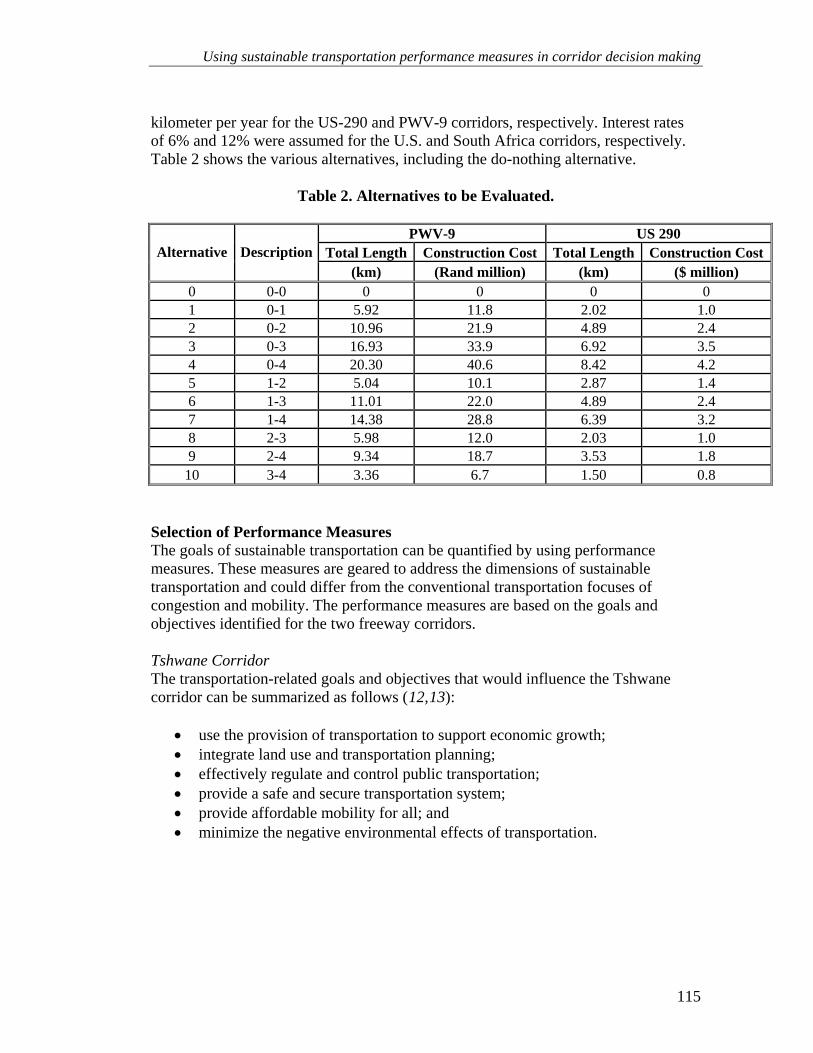
Using sustainable transportation performance measures in corridor decision making
115
kilometer per year for the US-290 and PWV-9 corridors, respectively. Interest rates of 6% and 12% were assumed for the U.S. and South Africa corridors, respectively. Table 2 shows the various alternatives, including the do-nothing alternative.
Table 2. Alternatives to be Evaluated.
PWV-9 US 290 Total Length Construction Cost Total Length Construction CostAlternative Description
(km) (Rand million) (km) ($ million) 0 0-0 0 0 0 0 1 0-1 5.92 11.8 2.02 1.0 2 0-2 10.96 21.9 4.89 2.4 3 0-3 16.93 33.9 6.92 3.5 4 0-4 20.30 40.6 8.42 4.2 5 1-2 5.04 10.1 2.87 1.4 6 1-3 11.01 22.0 4.89 2.4 7 1-4 14.38 28.8 6.39 3.2 8 2-3 5.98 12.0 2.03 1.0 9 2-4 9.34 18.7 3.53 1.8
10 3-4 3.36 6.7 1.50 0.8 Selection of Performance Measures The goals of sustainable transportation can be quantified by using performance measures. These measures are geared to address the dimensions of sustainable transportation and could differ from the conventional transportation focuses of congestion and mobility. The performance measures are based on the goals and objectives identified for the two freeway corridors. Tshwane Corridor The transportation-related goals and objectives that would influence the Tshwane corridor can be summarized as follows (12,13):
• use the provision of transportation to support economic growth; • integrate land use and transportation planning; • effectively regulate and control public transportation; • provide a safe and secure transportation system; • provide affordable mobility for all; and • minimize the negative environmental effects of transportation.

Using sustainable transportation performance measures in corridor decision making
116
Houston Corridor The transportation-related goals and objectives that would influence the US-290 corridor can be summarized as follows (14,15):
• provide a multi-modal transportation system; • enhance and maintain existing infrastructure; • coordinate land use and transportation development; • increase accessibility and mobility options; • protect the environment; • promote energy conservation; • promote a cost effective and affordable transportation system; and • improve safety and security for the transportation system.
Selected Performance Measures The previous discussion points out that the sustainability goals for the Tshwane corridor (although differently phrased) are similar to the sustainability goals for the Houston corridor. Regardless, the proposed procedure of this paper can applied to totally different goals resulting in totally different performance measures. Table 3 shows these goals in relation to the three dimensions of sustainable transportation as well as the specific performance measures that would address the various goals.
Table 3. Selected Sustainability Goals and Performance Measures.
Sustainability Dimension Goals Performance measures
Social • Maximize mobility • Maximize safety
• Travel rate • Accidents per VMT
Economic • Maximize affordability • Point-to-point travel cost
Environmental • Minimize air pollution • Minimize energy use
• VOC, CO, and NOx emissions • Fuel consumption
Determination of Criteria Weights and Values Criteria Weights The use of weights is a controversial issue because it opens up the analysis to a certain amount of subjectivity. It could, however, serve as an important tool to allocate the relative importance of the various factors as perceived by the decision makers. Researchers followed a dual approach for this research, one that includes weights and one without weights.
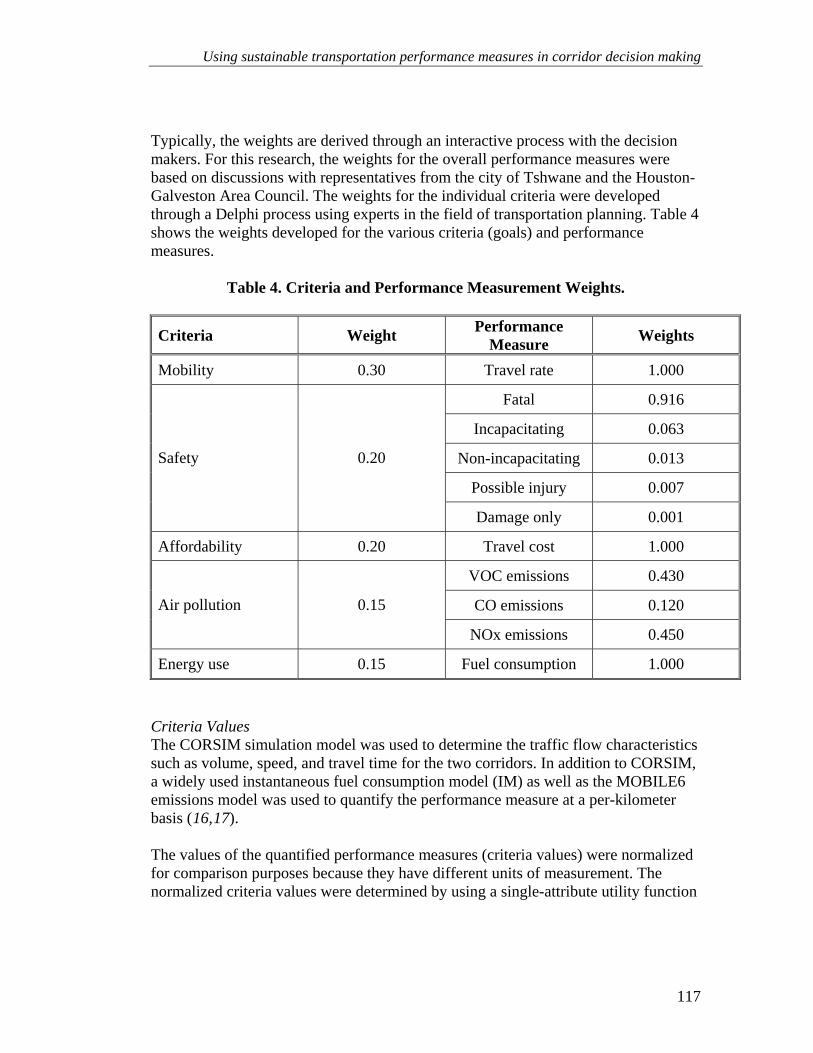
Using sustainable transportation performance measures in corridor decision making
117
Typically, the weights are derived through an interactive process with the decision makers. For this research, the weights for the overall performance measures were based on discussions with representatives from the city of Tshwane and the Houston-Galveston Area Council. The weights for the individual criteria were developed through a Delphi process using experts in the field of transportation planning. Table 4 shows the weights developed for the various criteria (goals) and performance measures.
Table 4. Criteria and Performance Measurement Weights.
Criteria Weight Performance Measure Weights
Mobility 0.30 Travel rate 1.000
Fatal 0.916
Incapacitating 0.063
Non-incapacitating 0.013
Possible injury 0.007
Safety 0.20
Damage only 0.001
Affordability 0.20 Travel cost 1.000
VOC emissions 0.430
CO emissions 0.120 Air pollution 0.15
NOx emissions 0.450
Energy use 0.15 Fuel consumption 1.000 Criteria Values The CORSIM simulation model was used to determine the traffic flow characteristics such as volume, speed, and travel time for the two corridors. In addition to CORSIM, a widely used instantaneous fuel consumption model (IM) as well as the MOBILE6 emissions model was used to quantify the performance measure at a per-kilometer basis (16,17). The values of the quantified performance measures (criteria values) were normalized for comparison purposes because they have different units of measurement. The normalized criteria values were determined by using a single-attribute utility function

Using sustainable transportation performance measures in corridor decision making
118
on a normalized scale. The normalized scale ranges from zero (worst performance) to one (the best performance). Normalization is used because the different performance measures have different units of measurement. Three different shapes — linear, concave, and convex — were used to reflect the driver’s and/or planning organization’s perception concerning the different performance measures. Equation 3 shows the equation for the single-attribute utility functions. Figure 5 shows the shapes of the utility functions for the various performance measures.
parabolacebalinestraightcwhenbxaxU
cx ,0,0)(
)( ≠+=
=+=−
(3)
Figure 5. Shapes of Utility Functions.
Calculating Utility Values There were three applications used to illustrate their effects on the final decision. The first application uses a pure net present worth (NPW) analysis. The other two techniques were based on the MAUT approach, one including criteria weights and the other excluding criteria weights. The sustainability performance measures used in the MAUT approach include fuel consumption, emissions, travel rate, and safety. It should be noted that the change in accidents as a result of the various alternatives was based on the change in VMT between the do-nothing alternative and the one under analysis. The calculation of the NPW is shown as Equation 4, whereas that of the MAUT approach is shown as Equations 1 and 2.
)( jjjj MCTNPW +−= (4) Where: NPWj = net present worth for alternative j;
Travel RateTravel Cost Safety Fuel Consumption
Emissions
Utility
0
1
Travel RateTravel Cost Safety Fuel Consumption
Emissions
Utility
0
1
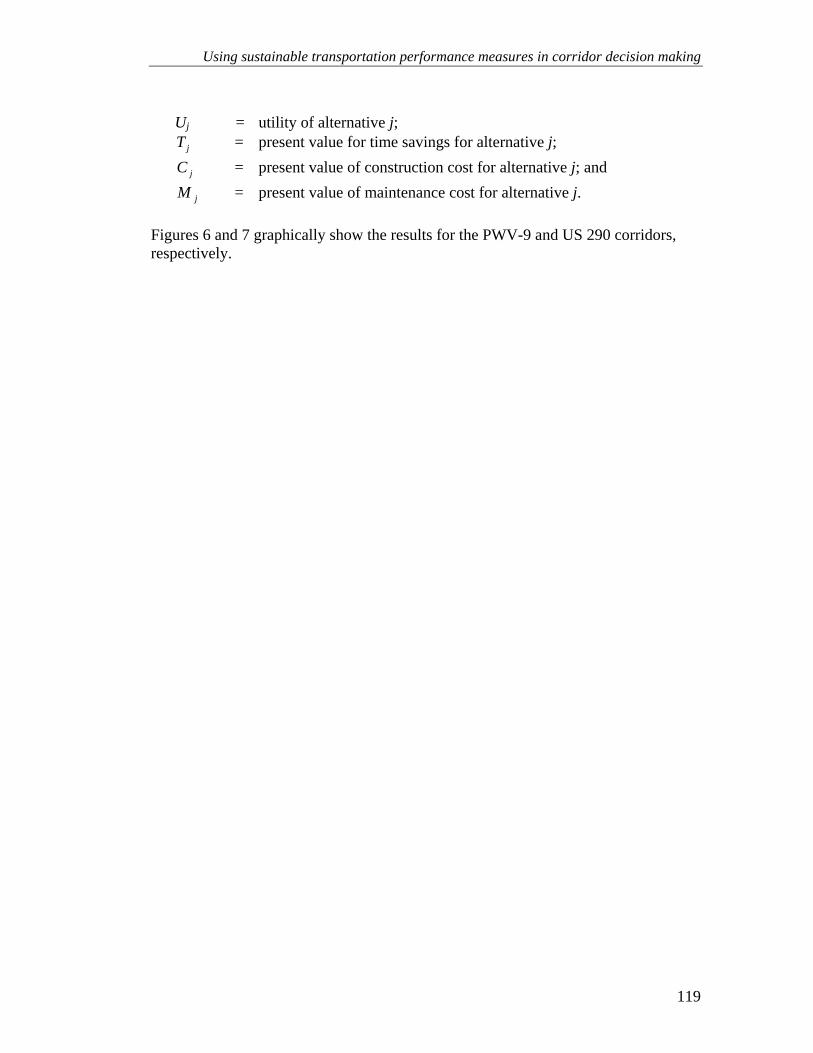
Using sustainable transportation performance measures in corridor decision making
119
Uj = utility of alternative j; jT = present value for time savings for alternative j; jC = present value of construction cost for alternative j; and jM = present value of maintenance cost for alternative j. Figures 6 and 7 graphically show the results for the PWV-9 and US 290 corridors, respectively.
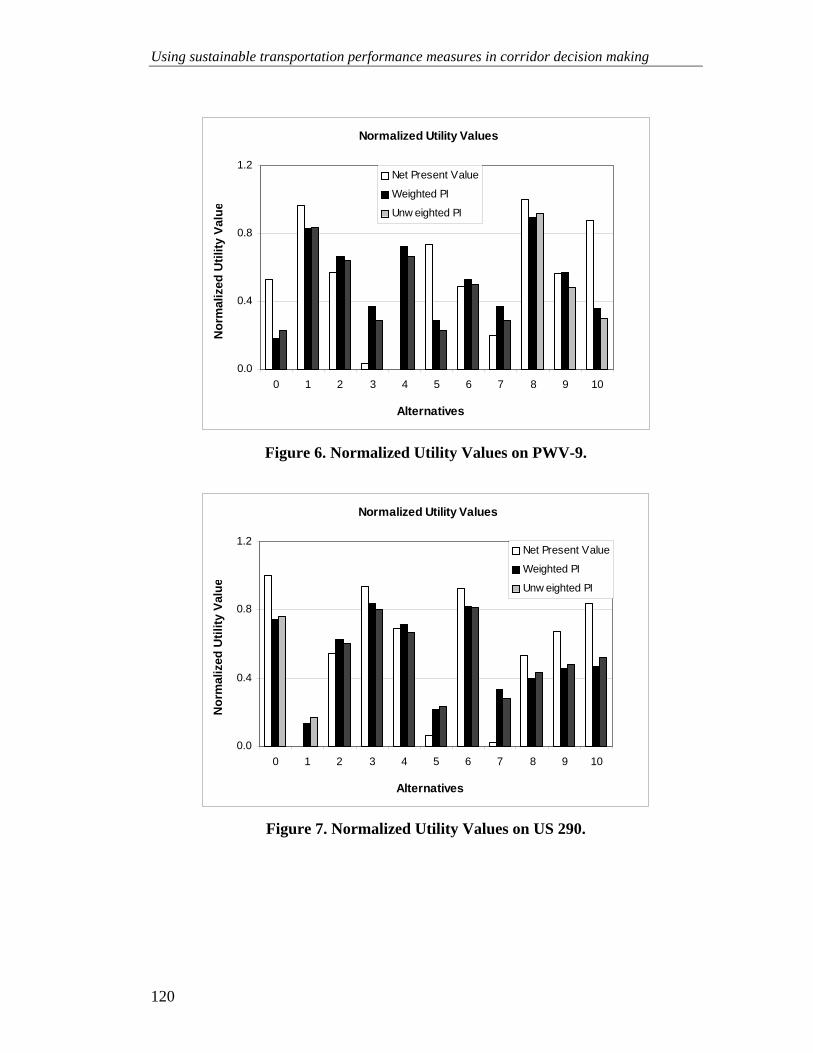
Using sustainable transportation performance measures in corridor decision making
120
Figure 6. Normalized Utility Values on PWV-9.
Figure 7. Normalized Utility Values on US 290.
Normalized Utility Values
0.0
0.4
0.8
1.2
0 1 2 3 4 5 6 7 8 9 10
Alternatives
Nor
mal
ized
Util
ity V
alue
Net Present Value
Weighted PI
Unw eighted PI
Normalized Utility Values
0.0
0.4
0.8
1.2
0 1 2 3 4 5 6 7 8 9 10
Alternatives
Nor
mal
ized
Util
ity V
alue
Net Present Value
Weighted PI
Unw eighted PI
Using sustainable transportation performance measures in corridor decision making
121
Figures 6 and 7 show that there are a wide range of utility values for the various alternatives and applications in the two corridors. Under all three approaches, alternative eight is the best project for the PWV-9 corridor. The projects fairing second and third best, however, differ between the NPW and MAUT approaches, although the weighted and un-weighted MAUT approaches produced the same second and third alternatives. For the US 290 corridor the same three projects were listed as the top three alternatives for both the NPW and MAUT approaches. The order of these projects, however, differs from approach to approach. These figures also show that the two MAUT approaches produce similar results, whereas the results based on the NPW approach are quite different. The analyses, therefore, illustrate that the type of decision-making methodology, and particularly whether the sustainability effects are included, have a direct affect on the final decision. The MAUT approach made it possible to include a broad range of sustainability issues. The decision maker, however, still must choose how to allocate the available funding. CONCLUDING REMARKS This paper illustrates how the concepts of sustainable transportation can be incorporated into corridor decision making using performance measures. The advent of ITS makes it possible to obtain travel time information fairly easily and at a highly disaggregate level. Due to the effect of aggregation bias and the higher level of detail obtained by a more disaggregate approach, it is preferable to use a more disaggregate approach wherever more possible. Quantified performance measures were used in three decision-making methodologies to test their effect on the final decision. The test bed used for this study was comprised of a transportation corridor in Tshwane, South Africa and one in Houston, Texas. The following specific findings were made in this study.
• Performance measures could be identified that addressed the goals and objectives of the two corridors within the three dimensions of sustainable transportation.
• It was shown how these performance measures could be quantified at a disaggregate (link) level by using a micro simulation model and various environmental models.
• The quantified performance measures were then used with the NPW and the weighted and un-weighted MAUT approaches to make decisions regarding transportation improvements. Criteria weights are optional and are used to distinguish between the relative importance of the various criteria.
• The MAUT approach was found to be most conducive to make transportation decisions within the context of sustainable transportation because it made it

Using sustainable transportation performance measures in corridor decision making
122
possible to include a broad range of quantitative and qualitative sustainability issues into the decision-making process.
• The disaggregate approach proposed in this paper makes it possible to isolate individual links within a corridor that should be widened.
• The methodology proposed in this paper can be applied irrespective of the goals of the corridors.
Using sustainable transportation performance measures in corridor decision making
123
REFERENCES
1. Zietsman, J. and L.R. Rilett. Sustainable Transportation: Conceptualization and Performance Measures. Report SWUTC/02/167403-1. Southwest Region University Transportation Center, The Texas A&M University System, College Station, Texas, March 2002.
2. Zietsman, J. and L.R. Rilett. Sustainable Transportation: Conceptualization and Performance Measures. Report SWUTC/02/167403-1. Southwest Region University Transportation Center, The Texas A&M University System, College Station, Texas, March 2002.
3. Abrams, C. M., and J. F. DiRenzo. Measures of Effectiveness for Multimodal Urban Traffic Management, Volume 2: Development and Evaluation of TSM Strategies. Report FHEA-RD-79-113. Federal Highway Administration, U.S. Department of Transportation, Washington, D.C., 1979.
4. Lomax, T. J., and D. L. Schrank. The Keys to Estimating Mobility in Urban Areas, Applying Definitions and Measures that Everyone Understands. Texas Transportation Institute, The Texas A&M University System, College Station, Texas, January 1999.
5. Eisele, W. L., Estimating Travel Time Mean and Variance Using Intelligent Transportation System Data for Real Time and Offline Transportation Applications. Ph.D. Dissertation, Texas A&M University, College Station, Texas, May, 2001.
6. Meyer, M. D., and E. J. Miller. Urban Transportation Planning: A Decision-Oriented Approach. McGraw-Hill, New York, 1984.
7. Euritt, M. A., J. Qin, K. M. Smith, M. T. Martello, and J. Weissemann. Full-Cost Analysis of Urban Passenger Transportation. Report 1356-1. Center for Transportation Research, The University of Texas at Austin, September 1996.
8. Nijkamp, P., and A. van Delft. Multi-Criteria Analysis and Regional Decision-Making. Interprint, Leiden, Netherlands, 1977.
9. Zietsman, J., L.R. Rilett, and S. Kim. Sustainable Transportation Performance Measures for Developing Communities. Report SWUTC/167128, Southwest Region University Transportation Center, The Texas A&M University System, College Station, Texas, October 2003.
10. Mickelson, R. P. Synthesis of Highway Practice 267: Transportation Development Process. National Cooperative Highway Research Program,
Using sustainable transportation performance measures in corridor decision making
124
Transportation Research Board, National Research Council, Washington, D.C., 1998.
11. Olson, D. L. Decision Aids for Selection Problems. Springer, New York, 1996.
12. Strategy for the Transportation Division. City of Tshwane Metropolitan Municipality. Tshwane, South Africa, May 2001.
13. The 2022 Metropolitan Transportation Plan. Houston-Galveston Area Council. Houston, Texas, February 2000.
14. Vision 2020: Metropolitan Transportation Plan. Houston-Galveston Area Council. Houston, Texas, October 1997.
15. Transportation Planning, Operations, and Services in the City of Tshwane, City of Tshwane Metropolitan Municipality. Tshwane, South Africa, 2001.
16. Biggs, D.C. and R. Akcelik. An Energy-Related Model of Instantaneous Fuel Consumption. Australian Road Research Board, 1986.
17. National Research Council. Modeling Mobile Source Emissions. National Academy Press, Washington, D.C., 2000.
125
Does the development of sustainability indicators lead to more sustainable decision-making? A case study of the UK Dr Greg Marsden Senior Lecturer, Transport Policy and Strategy, Institute for Transport Studies, University of Leeds. E-mail: [email protected] Abstract Much work has focused on the development of indicator sets to monitor changes in the sustainability of transport. Such indicator sets are however, often quite divorced from those used in decision-making. This paper takes a case study approach (using England as an example) to demonstrate that, whilst sustainable transport indicators are employed at various levels of the policy process, they often only partially defined, inconsistently applied and have limited impact on decision-making due, in large part, to the assessment process. Critically, the paper highlights the substantial gap in philosophy between cost-benefit analysis based approaches and normative statements of sustainability. The paper concludes by offering some suggestions to maximize the impacts of the findings of the COST Action. Introduction
Sustainability or Sustainable development has been commonly defined as “Economic and social development that meets the needs of the current generation without undermining the ability of future generations to meet their own needs" (WCED, 1987). This definition brought together what is now known as the three pillars of sustainable development; economic development, social development and ecological development under one societal goal of sustainability.
COST Action 356 is a recognition that much remains to be done to convert the notion of sustainability into some form of operational definition which can be applied, through indicators and appropriate assessment systems, to assess progress. This paper describes the challenges faced by the COST Action in a UK context and tries to draw broader conclusions that will inform the Action in its considerations.
The 2005 UK Sustainable Development strategy echoed the main themes of the Bruntland report and focused on:
• Living within environmental limits • Ensuring a strong, healthy and just society • Achieving a sustainable economy (Ibid., p16)
Principles of good governance and the responsible use of sound science are also put forward which aligns itself with the global state of art (DEFRA, 2005). If we
Does the development of sustainability indicators lead to more sustainable decision-making? A case study of the UK
126
wish to see such aims as the bedrock for policy making across all sectors then we must ask a series of questions:
1. What do these high level statements actually mean? – what are the key measures of progress?;
2. What are the goals and limits which define ‘sustainable’ and how will we know when we have reached such goals? – what are the directions of change and what constitutes ‘just’?; and
3. How does transport contribute towards these goals? 4. How do we take decisions that are consistent with this?
In answering the first of these four questions, the COST Action has much good practice to build on. There have been many attempts to define indicator sets to monitor changes in the sustainability of transport over time (Jeon and Amekudzi, 2005; Marsden et al., 2006; Litman, 2007). The findings from this workshop will surely take this work substantially further forward.
This paper concentrates on questions 2, 3 and 4, some aspects of which are also covered elsewhere in the workshop. Research into the implementation of transport policies in the UK suggests that it is not the notion, or even definition of sustainable development and sustainable transportation that is a barrier to implementation but its compatibility with existing assessment processes and the differences in assessment priorities that exist within national government and between different layers of government. This strongly relates to findings from Gudmundsson’s 2003 review of the use of sustainable indicator sets “Even a perfect indicator system for sustainable mobility may be of little relevance if it has no bearing on actual decisions taken” (Gudmundsson, 2003, p200).
Are we clear what we mean by sustainability/sustainable transport? Mitchell et al. (1995) identify four main reasons for using indicators to assess progress in complex systems:
• They allow the synthesis of masses of data • They show the current position in relation to desirable states • They demonstrate progress towards goals and objectives • They communicate current status to stakeholders so that effective
management decisions can be taken that lead towards the targets “Indicators are, therefore, a means of summarising the current position and the direction and rate of change of progress towards a particular goal or objective.” (Marsden et al., 2005, p11). With many environmental indicators the current position and future desired states are already known. For example, air quality levels can be monitored and EU standards exist against which progress can be assessed. Similarly, maximum acceptable levels of noise can be determined. The main issue here is what represents “safe or acceptable” levels and this will change with growing incomes (Kuznets curve type effects – McConnell, 1997) and as scientific knowledge
Does the development of sustainability indicators lead to more sustainable decision-making? A case study of the UK
127
advances (e.g. with greater knowledge about the health impacts of smaller particulates). The goals for other indicators are far less clear. A high profile example is CO2 emissions where transport is an important contributor (Chapman, 2007). Here, agreements have been reached at a national level within the EU on the basis of the Kyoto protocol for cuts in CO2 emissions relative to 1990 levels (and a basket of all six greenhouse gas emissions). The UK adopted a slightly more stringent national target of a 20% cut in domestic CO2 emissions by 2010. What does this mean for transport? No sector specific targets have been arrived at and very little reliable evidence still exists to identify which sectors (transport, domestic, industry, power) remain most cost-effective and feasible to reduce CO2 emissions from. Even if this were known at a national level it is not clear how regional or local authorities would know what their share of reductions should be. It is therefore not at all clear what the end goal is for transport and, for organizations developing transport strategies, what their contribution should be. Whilst this highlights some serious issues these seem surmountable with sufficient research effort and commitment from policy makers. Of greater concern to “sustainable transport” is the assessment of social progress and a just transport system. Lucas et al. (2007) identified transport impacts on social progress under five broad categories: • poverty (and in particular childhood poverty) • housing and crime, • (un)employment, • (literacy) education and • health Two examples of indicators proposed by Lucas et al. are used to highlight the far greater difficulties of operationalising a definition of social sustainability relating to poverty and housing. Lucas et al. (2007) define the “main interaction with transport in terms of an affect on poverty was deemed to be household travel expenditure as a proportion of household income to denote both affordability and over-expenditure” (p7). There is no agreed definition of transport poverty impacts so this is identified based on data from the UK national family expenditure survey. It is known that lower income households spend a greater proportion of their income on travel costs than higher income households. There is also no agreement on what would constitute a sustainable level of expenditure so Lucas et al. assumed that “In order to achieve greater equity, interventions should aim to bring the level of spending in relation to income down for the lowest income group and levelled out as a minimum for all households.” (Ibid.). In further research, Lucas et al. were unable to identify any transport models that could suitably predict these impacts. Similar difficulties were experienced in attempting to understand the interaction between transport and affordable housing for low income groups both in terms of definitions and ability to forecast these measures.
Does the development of sustainability indicators lead to more sustainable decision-making? A case study of the UK
128
In summary, there is actually very little written about what social progress is, how we assess justice and the distribution of impacts between groups and there are even fewer tools capable of forecasting how our plans and strategies are going to impact on these things. In making progress about what we measure attention needs to be given to the following key factors:
• direction of change • desired end states • disaggregation between groups • what constitutes a just distribution
Some of these factors may well be nationally, regionally or locally specific, particularly in social sustainability, but should not be ignored. Are we certain how transport contributes towards these goals? Sustainable development is about achieving more sustainable outcomes. Outcomes refer to the actual impact of the policies. For example, reduced road fatalities, fewer days of poor air quality, higher employment are all outcomes. Some outcomes are straight forward to measure and have very clear linkages with transport interventions. For example, we can measure Killed and Serious Injury accidents and we can relate changes to policies such as the introduction of seat belts and to specific accident black spot improvements. Others such as employment are more difficult. We can measure employment directly and we know transport to be important both in employment choice and as a barrier to entry to the job market (SEU, 2003). However, changes in employment level are subject to much greater variations due to the global economy than individual transport interventions. We should therefore identify appropriate indicators which act as a proxy for the extent to which the transport system supports take up of employment (for example, the % of people within a 30 minute journey time of a major employment centre). These types of indicators are sometimes referred to as “intermediate outcomes” as they are what transport planners can focus on achieving. Other measures that might fit in this category include transport and freight intensity, bus patronage and walking mode share. Transport and freight intensity are measures of whether we are traveling more efficiently per unit GDP and therefore are some proxy to environmental improvements. However, could a target for transport intensity ever be set and justified? How sensible are mode specific targets? - bus patronage might be a proxy for social inclusion but it does not really address whether communities have adequate accessibility to key services. Walk mode share relates to healthier lifestyles and is a proxy for health and potentially environmental improvements but although we should make greater use of active modes how much walking should we do? We rely on these proxy measurements because we are uncertain about the long-term links between transport interventions and measures like health outcomes.
Does the development of sustainability indicators lead to more sustainable decision-making? A case study of the UK
129
However, there is a risk that the transport indicators we can measure become the focus of target setting without referral back to the key outcomes for which they are proxies. In addition, from an economics and project assessment perspective, more transport mode specific intermediate outcomes often do not, of themselves, have an economic value – it is the outcomes (journey times, emissions etc..) they lead to that do. This is discussed further below. In summary, we need to be clear about which indicators are our main goals (outcomes) and which are proxies for progress (intermediate) which help with our overall understanding of the extent to which the transport system is contributing to more sustainable living patterns. How do we take decisions that are consistent with this? As described above, sustainability is a normative concept, defined by a series of indicators, directions of change and end goals. How does this compare to current project appraisal process within Europe? The HEATCO project analyzed the current practice in the European Union (Odgaard et al., 2005) and the state-of-the-art in project appraisal (Bickel et al., 2005) with a special focus on cost-benefit analysis. The methods applied in Europe were classified as one of the following four categories:
1. cost-benefit-analysis (CBA), 2. multi-criteria analysis (MCA) 3. quantitative measurements without weighting of indicators (QM) 4. qualitative measurement or not covered in a formalized method (QM/NC).
Figure 1 shows the results for different types of projects. The predominant approaches are cost benefit or some form of qualitative assessment. It should be acknowledged here that several countries such as the UK and Germany apply a mix of methods which is not reflected in the Figure (Marsden et al., 2006). In the UK for example, since 1997 cost-benefit analysis has been brought together with assessments of other elements of policy covering government’s five objectives for transport policy, namely safety, economy, environment, accessibility and integration. “The findings from its first application, the Trunk Roads Review were broadly positive: a statistical analysis suggested that the new information on reliability impacts and regeneration, for example, had played a significant role in the decisions made; the decision makers had placed significant weight on environmental factors too – in particular noise, landscape and heritage impacts; and the weight placed on the traditional cost-benefit items was broadly consistent with expectations (Nellthorp and Mackie, 2000)… The (‘NATA’) approach has since been promulgated for regional strategies (DETR, 1999) and forms the framework for appraisal at a national level for any scheme >£5m (~€8m) (DfT, 2006).” (Marsden et al., 2008)
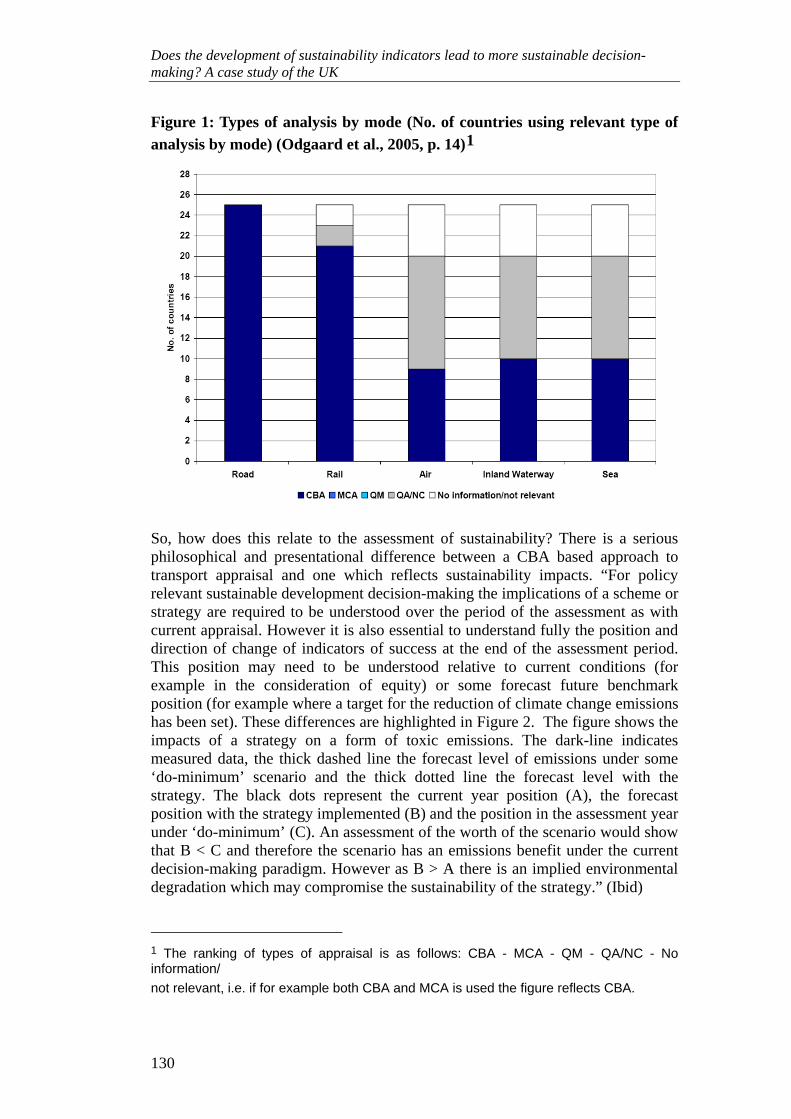
Does the development of sustainability indicators lead to more sustainable decision-making? A case study of the UK
130
Figure 1: Types of analysis by mode (No. of countries using relevant type of analysis by mode) (Odgaard et al., 2005, p. 14)1
So, how does this relate to the assessment of sustainability? There is a serious philosophical and presentational difference between a CBA based approach to transport appraisal and one which reflects sustainability impacts. “For policy relevant sustainable development decision-making the implications of a scheme or strategy are required to be understood over the period of the assessment as with current appraisal. However it is also essential to understand fully the position and direction of change of indicators of success at the end of the assessment period. This position may need to be understood relative to current conditions (for example in the consideration of equity) or some forecast future benchmark position (for example where a target for the reduction of climate change emissions has been set). These differences are highlighted in Figure 2. The figure shows the impacts of a strategy on a form of toxic emissions. The dark-line indicates measured data, the thick dashed line the forecast level of emissions under some ‘do-minimum’ scenario and the thick dotted line the forecast level with the strategy. The black dots represent the current year position (A), the forecast position with the strategy implemented (B) and the position in the assessment year under ‘do-minimum’ (C). An assessment of the worth of the scenario would show that B < C and therefore the scenario has an emissions benefit under the current decision-making paradigm. However as B > A there is an implied environmental degradation which may compromise the sustainability of the strategy.” (Ibid) 1 The ranking of types of appraisal is as follows: CBA - MCA - QM - QA/NC - No information/ not relevant, i.e. if for example both CBA and MCA is used the figure reflects CBA.
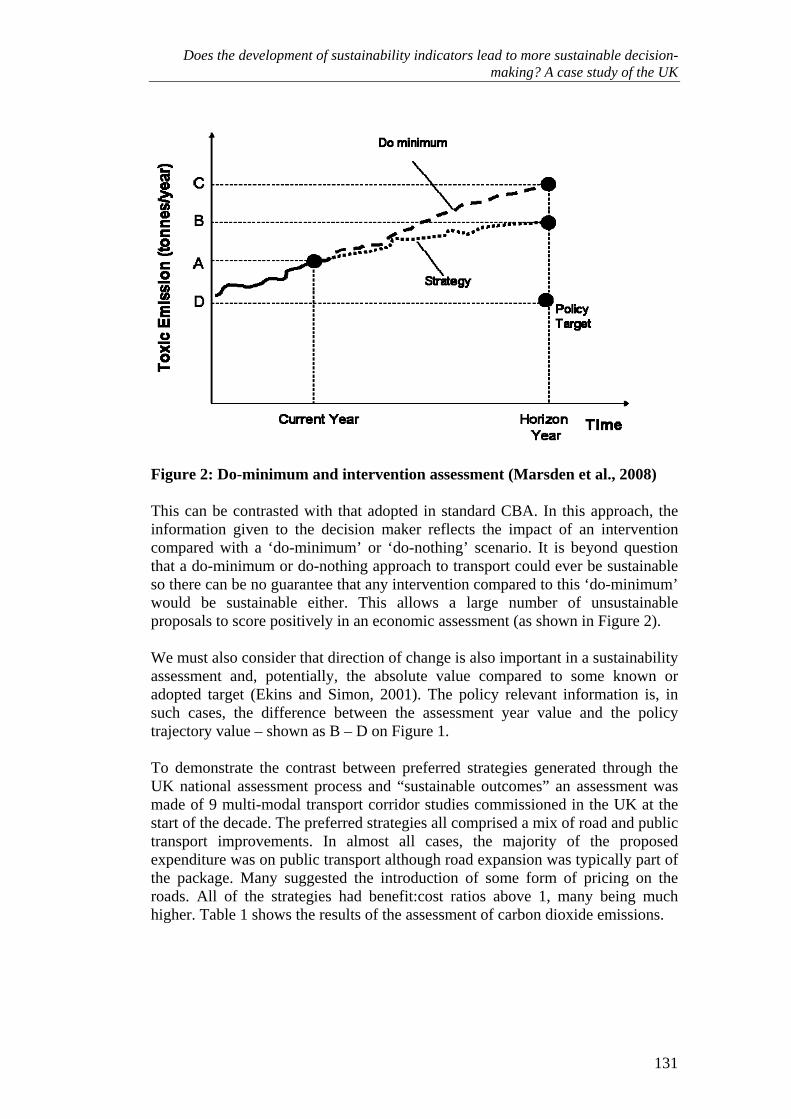
Does the development of sustainability indicators lead to more sustainable decision-making? A case study of the UK
131
Figure 2: Do-minimum and intervention assessment (Marsden et al., 2008) This can be contrasted with that adopted in standard CBA. In this approach, the information given to the decision maker reflects the impact of an intervention compared with a ‘do-minimum’ or ‘do-nothing’ scenario. It is beyond question that a do-minimum or do-nothing approach to transport could ever be sustainable so there can be no guarantee that any intervention compared to this ‘do-minimum’ would be sustainable either. This allows a large number of unsustainable proposals to score positively in an economic assessment (as shown in Figure 2). We must also consider that direction of change is also important in a sustainability assessment and, potentially, the absolute value compared to some known or adopted target (Ekins and Simon, 2001). The policy relevant information is, in such cases, the difference between the assessment year value and the policy trajectory value – shown as B – D on Figure 1. To demonstrate the contrast between preferred strategies generated through the UK national assessment process and “sustainable outcomes” an assessment was made of 9 multi-modal transport corridor studies commissioned in the UK at the start of the decade. The preferred strategies all comprised a mix of road and public transport improvements. In almost all cases, the majority of the proposed expenditure was on public transport although road expansion was typically part of the package. Many suggested the introduction of some form of pricing on the roads. All of the strategies had benefit:cost ratios above 1, many being much higher. Table 1 shows the results of the assessment of carbon dioxide emissions.
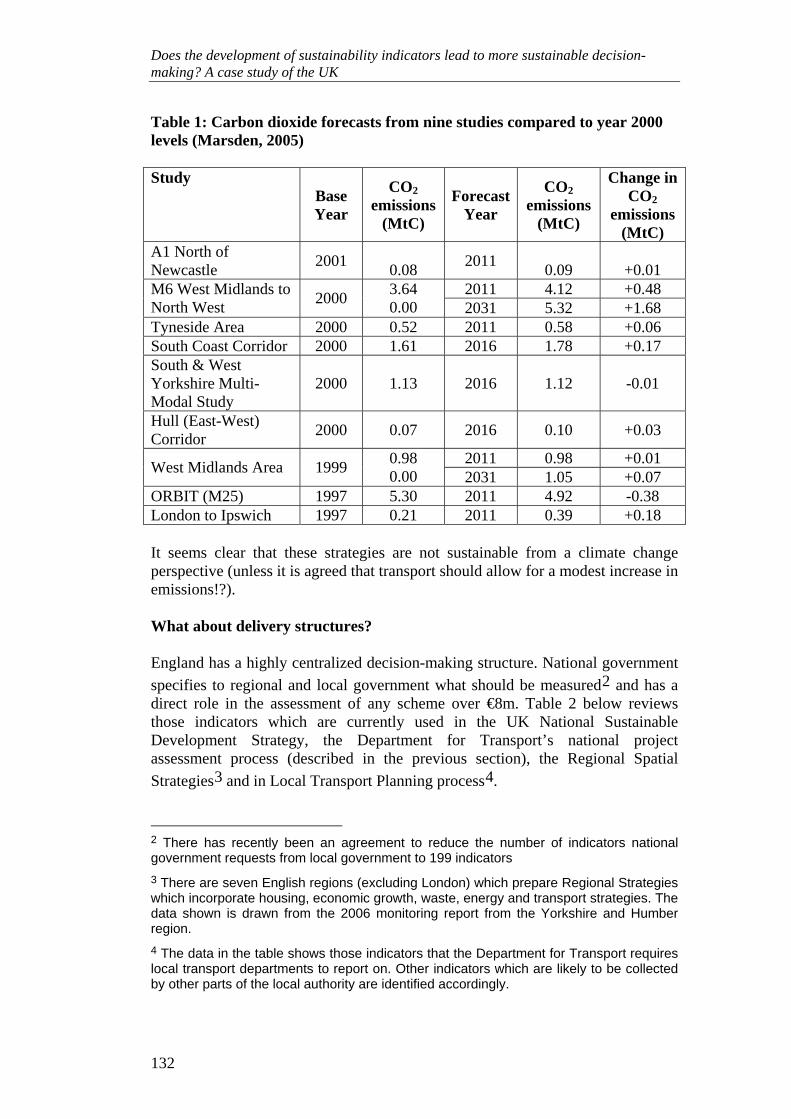
Does the development of sustainability indicators lead to more sustainable decision-making? A case study of the UK
132
Table 1: Carbon dioxide forecasts from nine studies compared to year 2000 levels (Marsden, 2005) Study
Base Year
CO2 emissions
(MtC)
Forecast Year
CO2 emissions
(MtC)
Change in CO2
emissions (MtC)
A1 North of Newcastle 2001 0.08 2011 0.09 +0.01
2011 4.12 +0.48 M6 West Midlands to North West 2000 3.64
0.00 2031 5.32 +1.68 Tyneside Area 2000 0.52 2011 0.58 +0.06 South Coast Corridor 2000 1.61 2016 1.78 +0.17 South & West Yorkshire Multi-Modal Study
2000 1.13 2016 1.12 -0.01
Hull (East-West) Corridor 2000 0.07 2016 0.10 +0.03
2011 0.98 +0.01 West Midlands Area 1999 0.98 0.00 2031 1.05 +0.07
ORBIT (M25) 1997 5.30 2011 4.92 -0.38 London to Ipswich 1997 0.21 2011 0.39 +0.18 It seems clear that these strategies are not sustainable from a climate change perspective (unless it is agreed that transport should allow for a modest increase in emissions!?). What about delivery structures? England has a highly centralized decision-making structure. National government specifies to regional and local government what should be measured2 and has a direct role in the assessment of any scheme over €8m. Table 2 below reviews those indicators which are currently used in the UK National Sustainable Development Strategy, the Department for Transport’s national project assessment process (described in the previous section), the Regional Spatial Strategies3 and in Local Transport Planning process4. 2 There has recently been an agreement to reduce the number of indicators national government requests from local government to 199 indicators 3 There are seven English regions (excluding London) which prepare Regional Strategies which incorporate housing, economic growth, waste, energy and transport strategies. The data shown is drawn from the 2006 monitoring report from the Yorkshire and Humber region. 4 The data in the table shows those indicators that the Department for Transport requires local transport departments to report on. Other indicators which are likely to be collected by other parts of the local authority are identified accordingly.
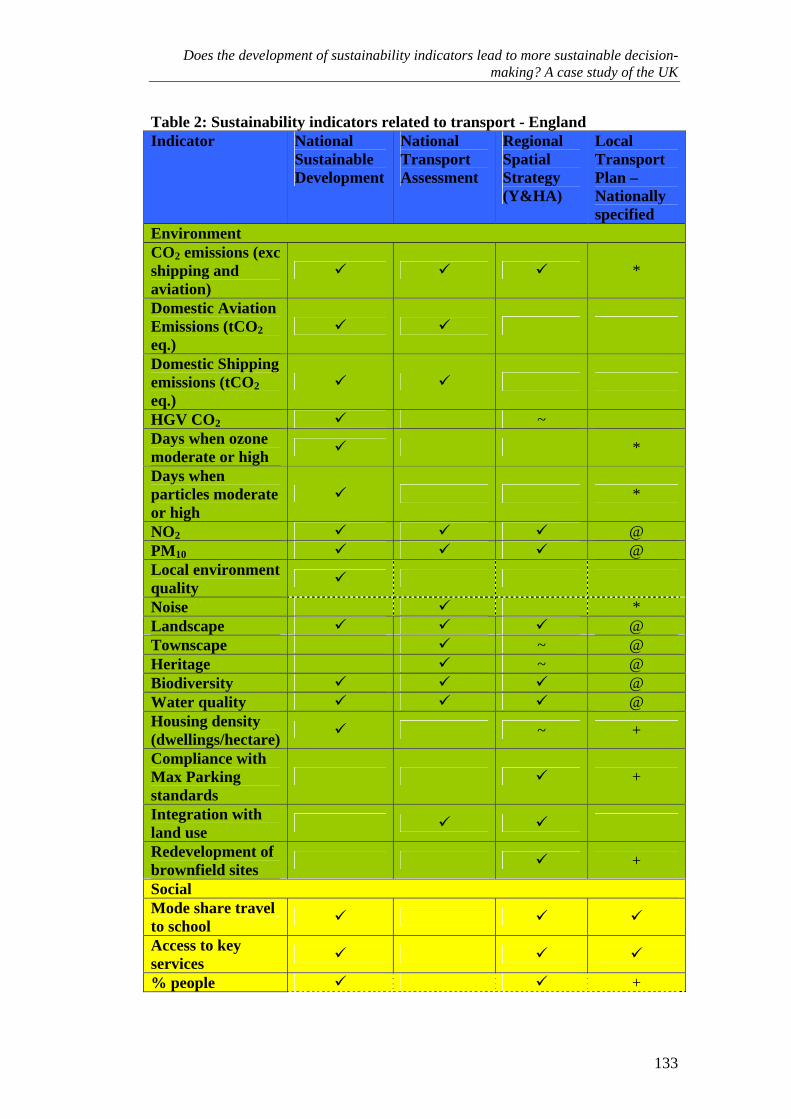
Does the development of sustainability indicators lead to more sustainable decision-making? A case study of the UK
133
Table 2: Sustainability indicators related to transport - England Indicator National
Sustainable Development
National Transport Assessment
Regional Spatial Strategy (Y&HA)
Local Transport Plan – Nationally specified
Environment CO2 emissions (exc shipping and aviation)
*
Domestic Aviation Emissions (tCO2 eq.)
Domestic Shipping emissions (tCO2 eq.)
HGV CO2 ~ Days when ozone moderate or high *
Days when particles moderate or high
*
NO2 @ PM10 @ Local environment quality
Noise * Landscape @ Townscape ~ @ Heritage ~ @ Biodiversity @ Water quality @ Housing density (dwellings/hectare) ~ +
Compliance with Max Parking standards
+
Integration with land use
Redevelopment of brownfield sites +
Social Mode share travel to school
Access to key services
% people +
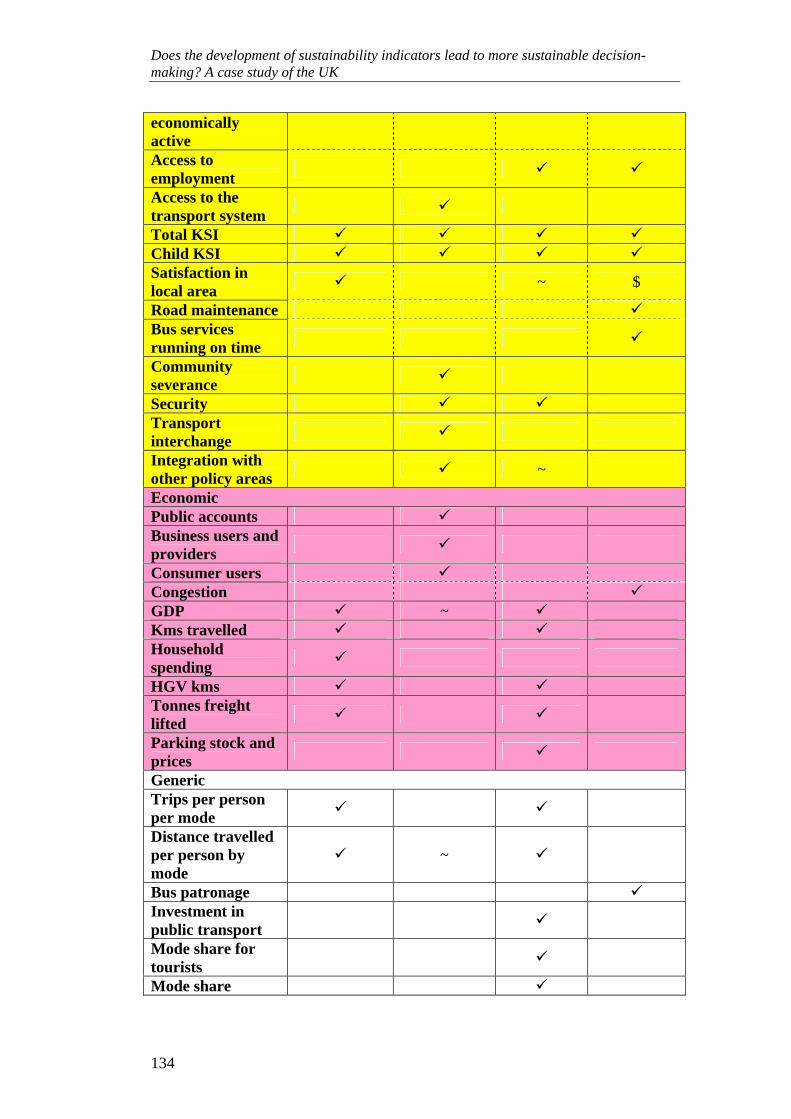
Does the development of sustainability indicators lead to more sustainable decision-making? A case study of the UK
134
economically active Access to employment
Access to the transport system
Total KSI Child KSI Satisfaction in local area ~ $
Road maintenance Bus services running on time
Community severance
Security Transport interchange
Integration with other policy areas ~
Economic Public accounts Business users and providers
Consumer users Congestion GDP ~ Kms travelled Household spending
HGV kms Tonnes freight lifted
Parking stock and prices
Generic Trips per person per mode
Distance travelled per person by mode
~
Bus patronage Investment in public transport
Mode share for tourists
Mode share
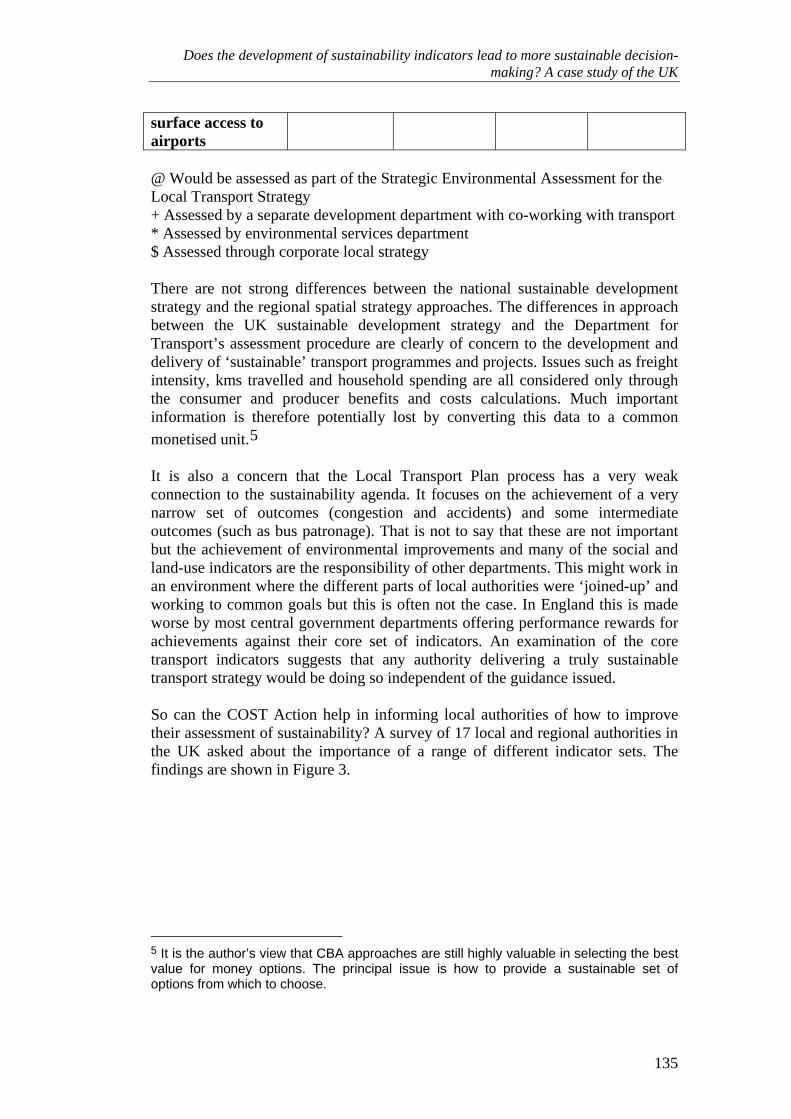
Does the development of sustainability indicators lead to more sustainable decision-making? A case study of the UK
135
surface access to airports @ Would be assessed as part of the Strategic Environmental Assessment for the Local Transport Strategy + Assessed by a separate development department with co-working with transport * Assessed by environmental services department $ Assessed through corporate local strategy There are not strong differences between the national sustainable development strategy and the regional spatial strategy approaches. The differences in approach between the UK sustainable development strategy and the Department for Transport’s assessment procedure are clearly of concern to the development and delivery of ‘sustainable’ transport programmes and projects. Issues such as freight intensity, kms travelled and household spending are all considered only through the consumer and producer benefits and costs calculations. Much important information is therefore potentially lost by converting this data to a common monetised unit.5 It is also a concern that the Local Transport Plan process has a very weak connection to the sustainability agenda. It focuses on the achievement of a very narrow set of outcomes (congestion and accidents) and some intermediate outcomes (such as bus patronage). That is not to say that these are not important but the achievement of environmental improvements and many of the social and land-use indicators are the responsibility of other departments. This might work in an environment where the different parts of local authorities were ‘joined-up’ and working to common goals but this is often not the case. In England this is made worse by most central government departments offering performance rewards for achievements against their core set of indicators. An examination of the core transport indicators suggests that any authority delivering a truly sustainable transport strategy would be doing so independent of the guidance issued. So can the COST Action help in informing local authorities of how to improve their assessment of sustainability? A survey of 17 local and regional authorities in the UK asked about the importance of a range of different indicator sets. The findings are shown in Figure 3.
5 It is the author’s view that CBA approaches are still highly valuable in selecting the best value for money options. The principal issue is how to provide a sustainable set of options from which to choose.
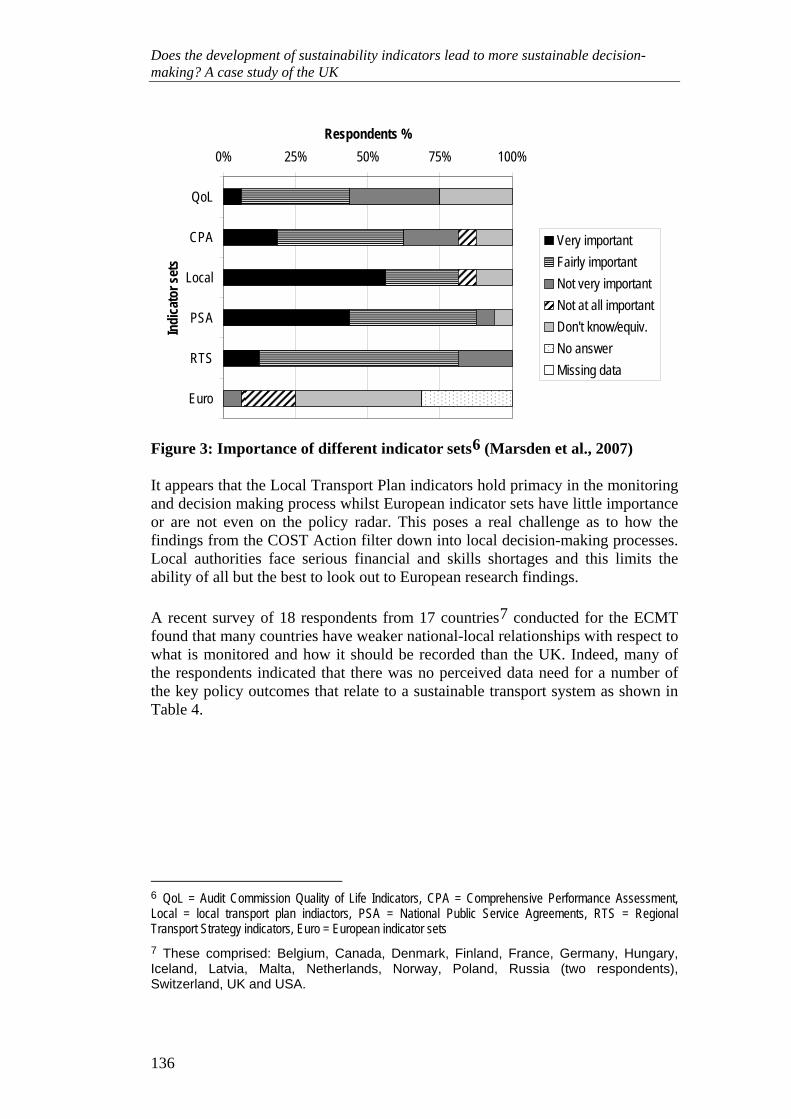
Does the development of sustainability indicators lead to more sustainable decision-making? A case study of the UK
136
0% 25% 50% 75% 100%
QoL
CPA
Local
PSA
RTS
Euro
Indi
cato
r set
s
Respondents %
Very important Fairly important Not very important Not at all important Don't know/equiv.No answerMissing data
Figure 3: Importance of different indicator sets6 (Marsden et al., 2007) It appears that the Local Transport Plan indicators hold primacy in the monitoring and decision making process whilst European indicator sets have little importance or are not even on the policy radar. This poses a real challenge as to how the findings from the COST Action filter down into local decision-making processes. Local authorities face serious financial and skills shortages and this limits the ability of all but the best to look out to European research findings. A recent survey of 18 respondents from 17 countries7 conducted for the ECMT found that many countries have weaker national-local relationships with respect to what is monitored and how it should be recorded than the UK. Indeed, many of the respondents indicated that there was no perceived data need for a number of the key policy outcomes that relate to a sustainable transport system as shown in Table 4.
6 QoL = Audit Commission Quality of Life Indicators, CPA = Comprehensive Performance Assessment, Local = local transport plan indiactors, PSA = National Public Service Agreements, RTS = Regional Transport Strategy indicators, Euro = European indicator sets 7 These comprised: Belgium, Canada, Denmark, Finland, France, Germany, Hungary, Iceland, Latvia, Malta, Netherlands, Norway, Poland, Russia (two respondents), Switzerland, UK and USA.
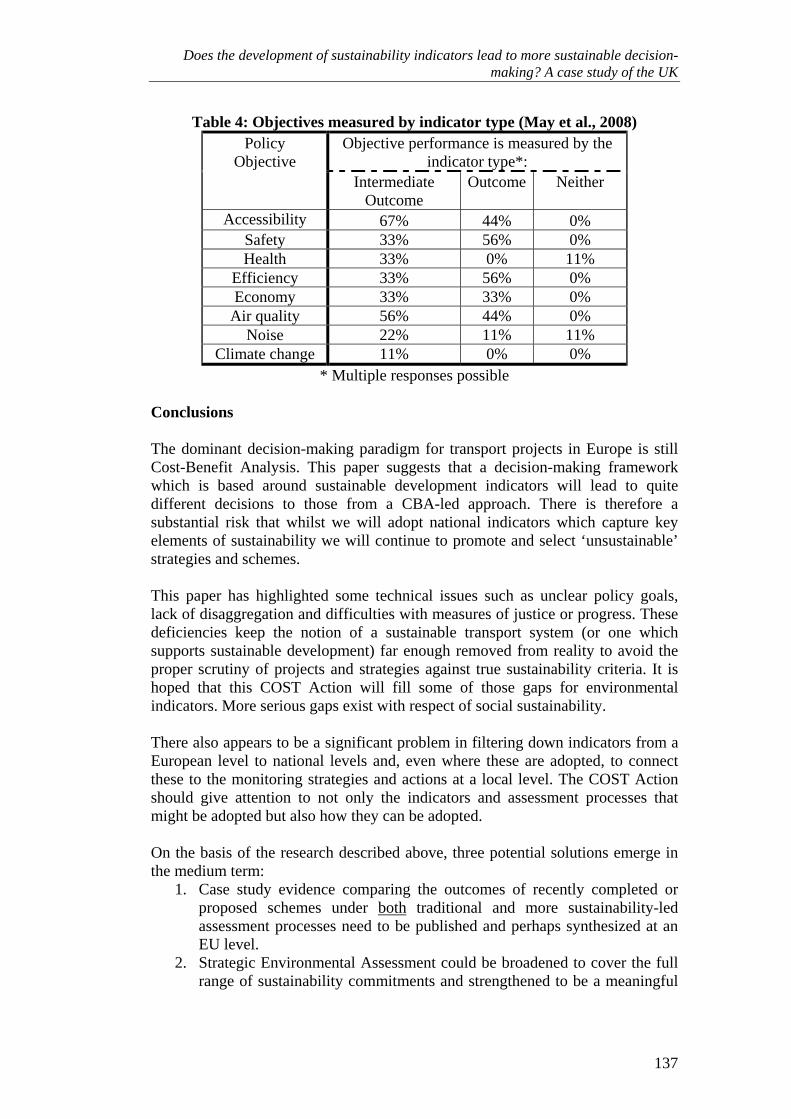
Does the development of sustainability indicators lead to more sustainable decision-making? A case study of the UK
137
Table 4: Objectives measured by indicator type (May et al., 2008) Policy
Objective Objective performance is measured by the
indicator type*: Intermediate
Outcome Outcome Neither
Accessibility 67% 44% 0% Safety 33% 56% 0% Health 33% 0% 11%
Efficiency 33% 56% 0% Economy 33% 33% 0%
Air quality 56% 44% 0% Noise 22% 11% 11%
Climate change 11% 0% 0% * Multiple responses possible
Conclusions The dominant decision-making paradigm for transport projects in Europe is still Cost-Benefit Analysis. This paper suggests that a decision-making framework which is based around sustainable development indicators will lead to quite different decisions to those from a CBA-led approach. There is therefore a substantial risk that whilst we will adopt national indicators which capture key elements of sustainability we will continue to promote and select ‘unsustainable’ strategies and schemes. This paper has highlighted some technical issues such as unclear policy goals, lack of disaggregation and difficulties with measures of justice or progress. These deficiencies keep the notion of a sustainable transport system (or one which supports sustainable development) far enough removed from reality to avoid the proper scrutiny of projects and strategies against true sustainability criteria. It is hoped that this COST Action will fill some of those gaps for environmental indicators. More serious gaps exist with respect of social sustainability. There also appears to be a significant problem in filtering down indicators from a European level to national levels and, even where these are adopted, to connect these to the monitoring strategies and actions at a local level. The COST Action should give attention to not only the indicators and assessment processes that might be adopted but also how they can be adopted. On the basis of the research described above, three potential solutions emerge in the medium term:
1. Case study evidence comparing the outcomes of recently completed or proposed schemes under both traditional and more sustainability-led assessment processes need to be published and perhaps synthesized at an EU level.
2. Strategic Environmental Assessment could be broadened to cover the full range of sustainability commitments and strengthened to be a meaningful

Does the development of sustainability indicators lead to more sustainable decision-making? A case study of the UK
138
filter for proposals. CBA could then be applied only to a sub-set of proposals which meet the broader sustainability goals.
3. The delivery structures for transport policy need to be studied in much greater depth (e.g. the IMPACT and DISTILLATE programmes) so that the best routes and methods for distributing guidance on sustainability assessments are identified.
In the short-term, advocacy of the professionals involved in the COST Action will clearly be an important, but not sufficient, condition to ensure the uptake of better and best practice in sustainability assessment.

Does the development of sustainability indicators lead to more sustainable decision-making? A case study of the UK
139
References Bickel P., Burgess A., Hunt A., Laird J., Lieb C., Lindberg G., Odgaard T. (2005)
HEATCO Deliverable 2 State-of-the-art in project assessment, Chapman, L. (2007) Transport and climate change: a review, Journal of Transport
Geography, 15, 354-367 DEFRA, Department of Environment, Food and Rural Affairs (2005) ‘Securing
the Future: delivering the UK sustainable development strategy’. London:TSO, www.defra.gov.uk
Ekins, P. and Simon, S. (2001) Estimating sustainability gaps: methods and preliminary applications for the UK and the Netherlands, Ecological Economics, 37, p5-22.
Gudmundsson, H. (2003) ‘Making concepts matter: sustainable mobility and indicator systems in transport policy’, International Social Sciences Journal, 176, pp199-217
Jeon, C.M., and Amekudzi, A. Addressing Sustainability in Transportation Systems: Definitions, Indicators, and Metrics, Journal of Infrastructure Systems, March, 31-50, 2005, ASCE
Litman, T. (2007) Well Measured: Developing Indicators for Comprehensive and Sustainable Transport Planning, www.vtpi.org/wellmeas.pdf
Lucas, K., Marsden, G., Brookes, M. and Kimble, M. (2007) An assessment and critique of capabilities for examining the long-term social sustainability of transport and land-use strategies, Forthcoming in Transportation Research Record.
Marsden, G. (2005) The multi modal study transport investment plans. Proceedings of Institution of Civil Engineers: Transport 158 (2), 75-87
Marsden, G., Kelly, C., Snell, C. and Forrester, J. (2005) Sustainable Transport Indicators: Selection and Use, Deliverable C1, DISTILLATE Project, www.distillate.ac.uk
Marsden, G., Kelly, C., Nellthorp, J., Lucas, K, and Brooks M. (2005) A framework for the Appraisal of Sustainability in Transport, Appraisal of Sustainability Project Report, Institute for Transport Studies. Available at http://www.its.leeds.ac.uk/projects/sustainability/project_outputs.htm
Marsden, G., Kelly, C., Hull, A.D., Tricker, R., Lucas, K., Brookes, M., Snell, C. and Forrester, J. (2007) Improving Monitoring and Reporting for Local Authorities: Lessons from the Transport Sector, Deliverable C2, DISTILLATE Project, www.distillate.ac.uk
Marsden, G., Kimble, M., Nellthorp, J. and Kelly, C. (2008) Examining the sustainability of transport strategies: A departure from current assessment methods? Submitted to Transport Policy (December 2007)
May, A.D., Grant-Muller, S., Marsden, G. and Thanos, S. (2008) Improving the collection and monitoring of urban travel data: An international review, 87th Annual Transportation Research Board Meeting, Washington D.C.
McConnell, K. E. (1997) Income and the demand for environmental quality, Environment and Development Economics, 2, p383-399.
Odgaard T., Kelly C., Laird J. (2005) HEATCO Work Package 3: Current practice in project appraisal in Europe. Deliverable 1/Volume 1 (main text)
Does the development of sustainability indicators lead to more sustainable decision-making? A case study of the UK
140
SEU (2003) Making the Connections: transport and social exclusion, Social Exclusion Unit, http://www.cabinetoffice.gov.uk/upload/assets/www.cabinetoffice.gov.uk/social_exclusion_task_force/publications_1997_to_2006/making_transport_2003.pdf
WCED (1987) ‘Our Common Future’, World Commission on Environment and Development, www.un.org
UK Indicator Source National indicators www.sustainable-development.gov.uk/progress/index.htm Regional indicators http://www.yhassembly.gov.uk/Our%20Work/Regional%20Planning/Monitoring%20and%20Implementation/Annual%20Monitoring%20Report/AMR%202006%20Base%20data/ Local Transport Indicators http://www.dft.gov.uk/pgr/regional/ltp/guidance/fltp/fullguidanceonlocaltransport3657 Other Local Indicators http://www.communities.gov.uk/localgovernment/performanceframeworkpartnerships/nationalindicators/
141
ASSESSMENT OF THE LANDSCAPE QUALITY INCLUDING THE HISTORICAL HERITAGE IN ITALY Paolo Ventura Abstract This presentation aims to identify practical indicators and parameters for assessing the landscape in terms of the likely impact of a new infrastructure. The issue is approached from the point of view of the planner. I start with some basic definitions of landscape as a holistic, flexible and ambiguous concept. A variety of specifically Italian methods and typologies of landscape evaluation at different scales in regional and town planning are then identified.
1 Definition of landscape
1.1 The European Convention According to the European Landscape Convention, “Landscape” 1 means: “an area, as perceived by people, whose character is the result of the action and interaction of natural and/or human factors”. Furthermore, The European Landscape Convention gives the following definitions:
1. “Landscape policy” means an expression by the competent public authorities of general principles, strategies and guidelines that permit the taking of specific measures aimed at the protection, management and planning of landscapes;
2. “Landscape quality objective” means the response of the appropriate public authorities to the aspirations of the public for a specific landscape and the features of their surroundings;
3. “Landscape protection” means actions to conserve and maintain the significant or characteristic features of a landscape, justified by its heritage value derived from its natural configuration and/or from human activity;
1 Council of Europe Treaty Series =ETS 176 – 20.X.2000 entry into force 1‐3‐2004. The treaty, signed by 29 countries (2008) covers natural, rural, urban and peri‐urban areas. It includes land, inland water and marine areas. It concerns landscapes that might be considered outstanding as well as everyday or degraded landscapes. The European Landscape Convention applies to the entire territory of the signing countries. The aims of this Convention are to promote landscape protection, management and planning, and to organise European co‐operation on landscape issues.
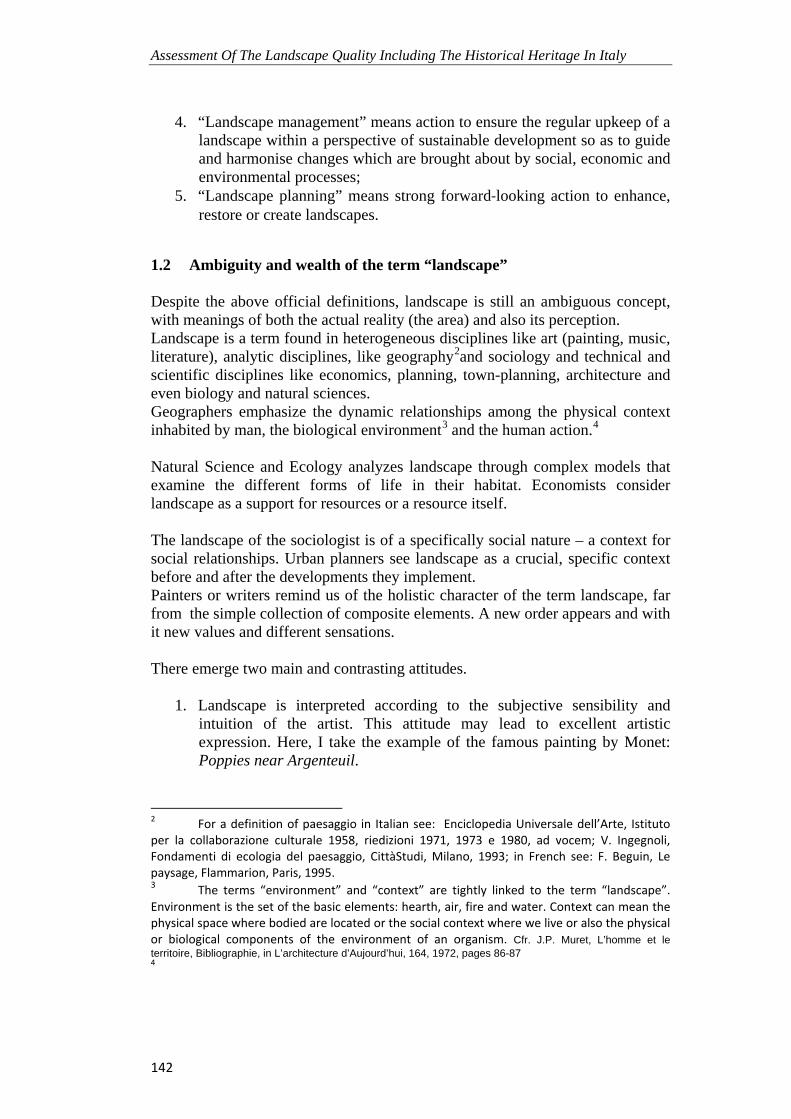
Assessment Of The Landscape Quality Including The Historical Heritage In Italy
142
4. “Landscape management” means action to ensure the regular upkeep of a landscape within a perspective of sustainable development so as to guide and harmonise changes which are brought about by social, economic and environmental processes;
5. “Landscape planning” means strong forward‐looking action to enhance, restore or create landscapes.
1.2 Ambiguity and wealth of the term “landscape” Despite the above official definitions, landscape is still an ambiguous concept, with meanings of both the actual reality (the area) and also its perception. Landscape is a term found in heterogeneous disciplines like art (painting, music, literature), analytic disciplines, like geography2and sociology and technical and scientific disciplines like economics, planning, town-planning, architecture and even biology and natural sciences. Geographers emphasize the dynamic relationships among the physical context inhabited by man, the biological environment3 and the human action.4 Natural Science and Ecology analyzes landscape through complex models that examine the different forms of life in their habitat. Economists consider landscape as a support for resources or a resource itself. The landscape of the sociologist is of a specifically social nature – a context for social relationships. Urban planners see landscape as a crucial, specific context before and after the developments they implement. Painters or writers remind us of the holistic character of the term landscape, far from the simple collection of composite elements. A new order appears and with it new values and different sensations. There emerge two main and contrasting attitudes.
1. Landscape is interpreted according to the subjective sensibility and intuition of the artist. This attitude may lead to excellent artistic expression. Here, I take the example of the famous painting by Monet: Poppies near Argenteuil.
2 For a definition of paesaggio in Italian see: Enciclopedia Universale dell’Arte, Istituto per la collaborazione culturale 1958, riedizioni 1971, 1973 e 1980, ad vocem; V. Ingegnoli, Fondamenti di ecologia del paesaggio, CittàStudi, Milano, 1993; in French see: F. Beguin, Le paysage, Flammarion, Paris, 1995. 3 The terms “environment” and “context” are tightly linked to the term “landscape”. Environment is the set of the basic elements: hearth, air, fire and water. Context can mean the physical space where bodied are located or the social context where we live or also the physical or biological components of the environment of an organism. Cfr. J.P. Muret, L’homme et le territoire, Bibliographie, in L’architecture d’Aujourd’hui, 164, 1972, pages 86-87 4
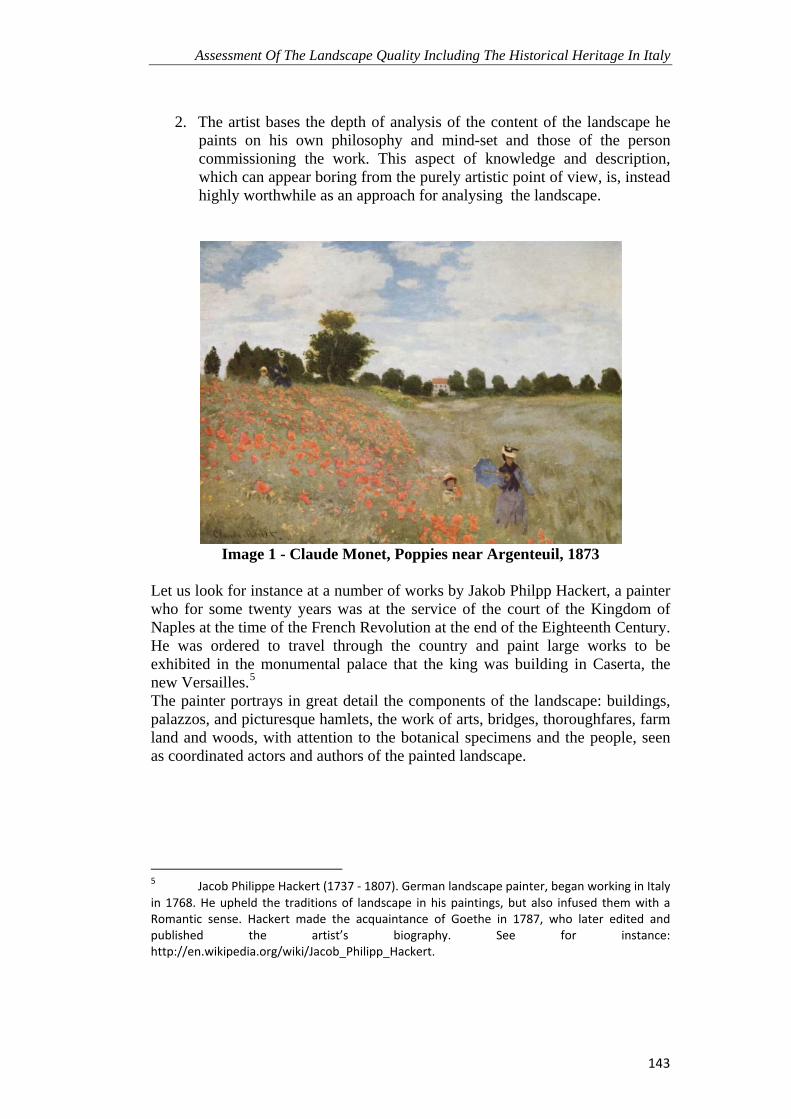
Assessment Of The Landscape Quality Including The Historical Heritage In Italy
143
2. The artist bases the depth of analysis of the content of the landscape he paints on his own philosophy and mind-set and those of the person commissioning the work. This aspect of knowledge and description, which can appear boring from the purely artistic point of view, is, instead highly worthwhile as an approach for analysing the landscape.
Image 1 - Claude Monet, Poppies near Argenteuil, 1873
Let us look for instance at a number of works by Jakob Philpp Hackert, a painter who for some twenty years was at the service of the court of the Kingdom of Naples at the time of the French Revolution at the end of the Eighteenth Century. He was ordered to travel through the country and paint large works to be exhibited in the monumental palace that the king was building in Caserta, the new Versailles.5 The painter portrays in great detail the components of the landscape: buildings, palazzos, and picturesque hamlets, the work of arts, bridges, thoroughfares, farm land and woods, with attention to the botanical specimens and the people, seen as coordinated actors and authors of the painted landscape.
5 Jacob Philippe Hackert (1737 ‐ 1807). German landscape painter, began working in Italy in 1768. He upheld the traditions of landscape in his paintings, but also infused them with a Romantic sense. Hackert made the acquaintance of Goethe in 1787, who later edited and published the artist’s biography. See for instance: http://en.wikipedia.org/wiki/Jacob_Philipp_Hackert.
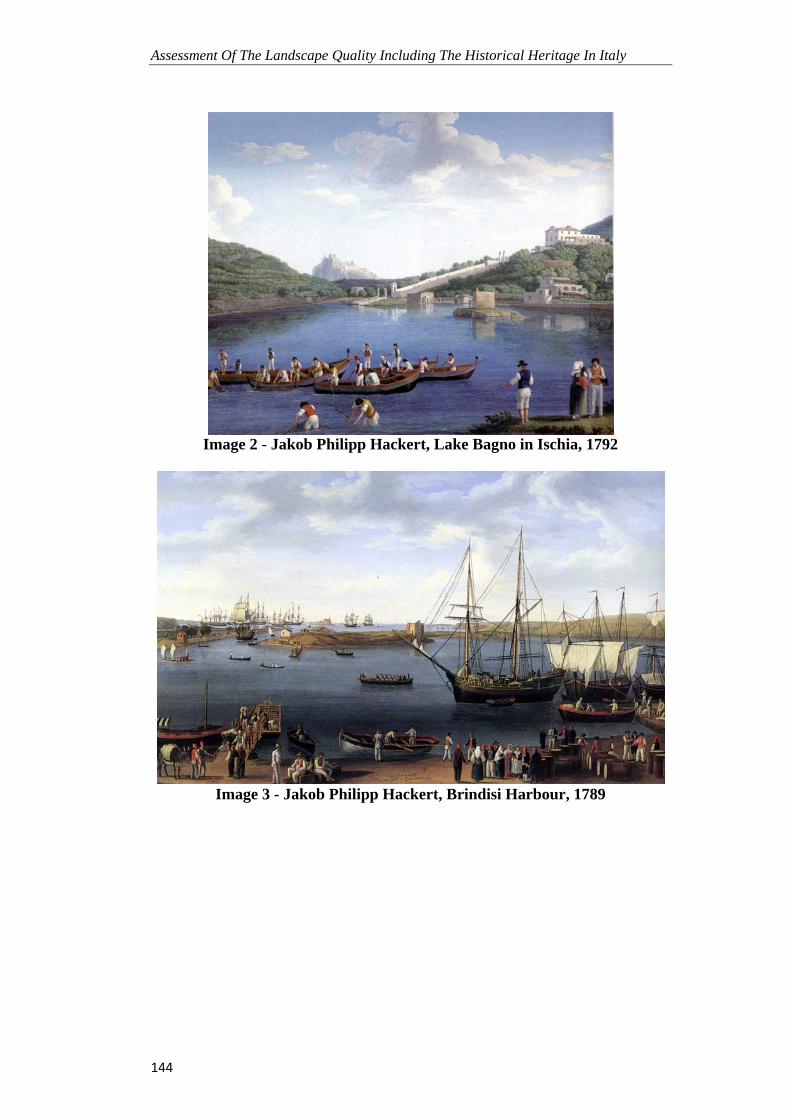
Assessment Of The Landscape Quality Including The Historical Heritage In Italy
144
Image 2 - Jakob Philipp Hackert, Lake Bagno in Ischia, 1792
Image 3 - Jakob Philipp Hackert, Brindisi Harbour, 1789
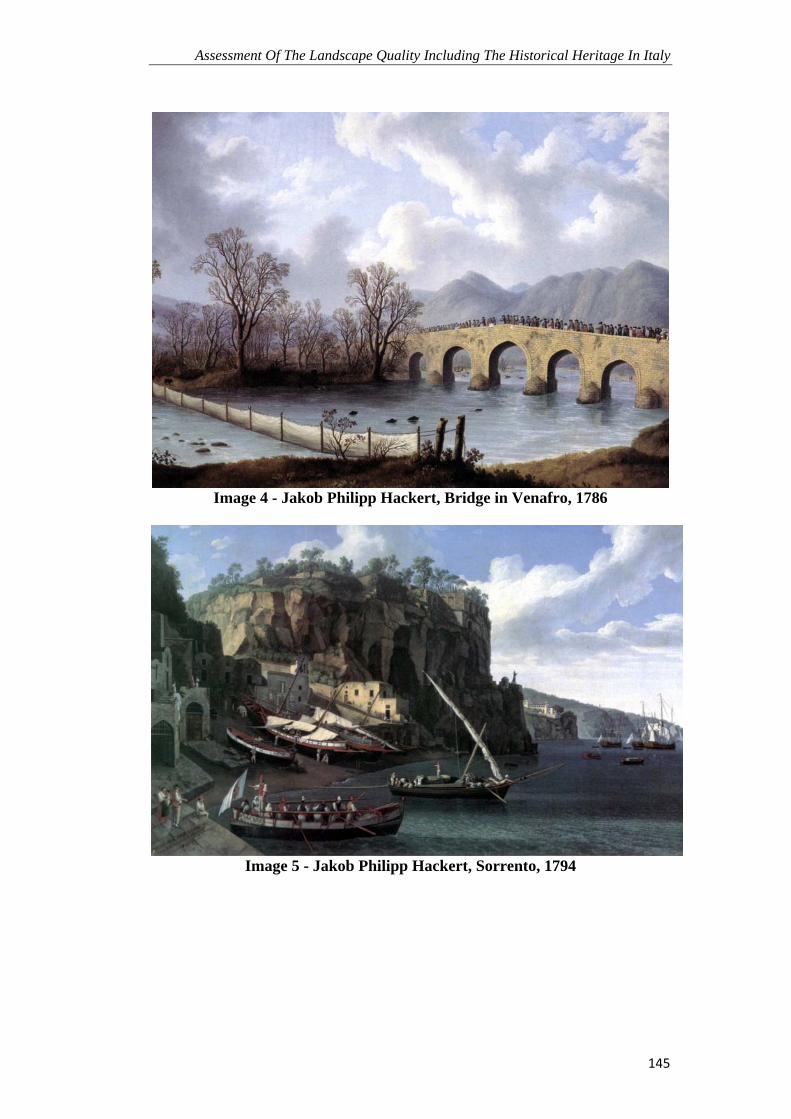
Assessment Of The Landscape Quality Including The Historical Heritage In Italy
145
Image 4 - Jakob Philipp Hackert, Bridge in Venafro, 1786
Image 5 - Jakob Philipp Hackert, Sorrento, 1794

Assessment Of The Landscape Quality Including The Historical Heritage In Italy
146
Image 6 - Bernardo Bellotto, Landscape of the town Pirna, 1753-55
We find a similar attitude in Canaletto’s analytic and descriptive paintings6, but also in the work of more contemporary artists, like the outstanding contemporary Italian photographer Gabriele Basilico. Basilico’s pictures, like the previous paintings, are open manifestos of reflexive thought on how the existing landscape with its significant remnants and permanent vestiges, the historic and cultural product of human activity over the centuries could be transformed and protected.
6 Canaletto (Giovanni Antonio Canal) (1697‐1768). Venetian painter, the most famous view‐painter of the 18th century. By 1723 he was painting dramatic and picturesque views of Venice, marked by strong contrasts of light and shade and free handling. Canaletto was highly influential in Italy and elsewhere. His nephew Bernardo Bellotto took his style to Central Europe and his followers in England included William Marlow and Samuel Scott. (See for instance: http://ftp1.us.proftpd.org/wm/paint/auth/canaletto/)
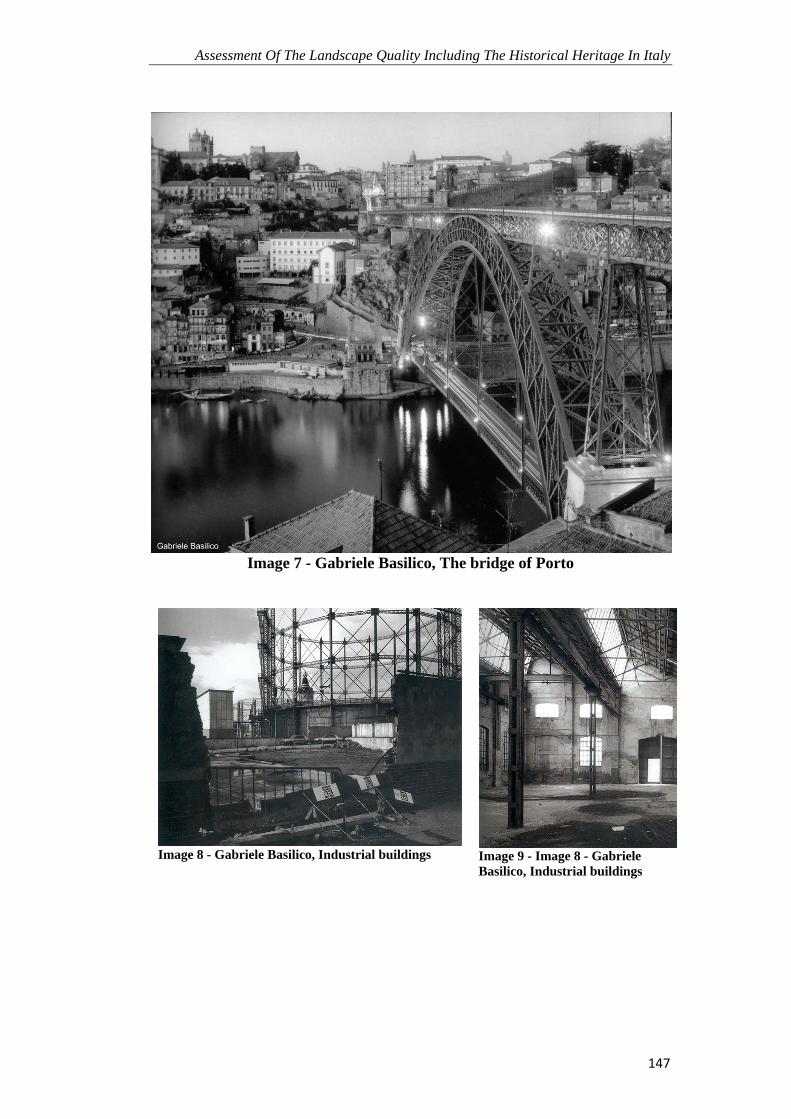
Assessment Of The Landscape Quality Including The Historical Heritage In Italy
147
Image 7 - Gabriele Basilico, The bridge of Porto
Image 8 - Gabriele Basilico, Industrial buildings
Image 9 - Image 8 - Gabriele Basilico, Industrial buildings
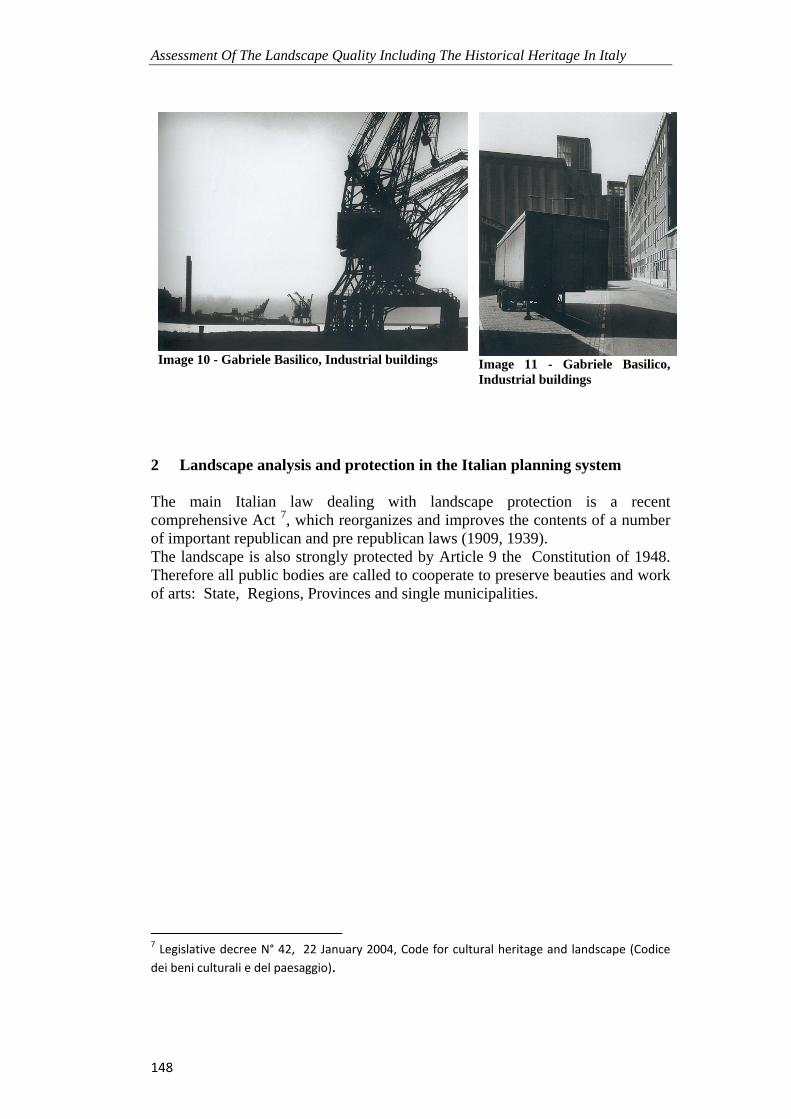
Assessment Of The Landscape Quality Including The Historical Heritage In Italy
148
Image 10 - Gabriele Basilico, Industrial buildings Image 11 - Gabriele Basilico, Industrial buildings
2 Landscape analysis and protection in the Italian planning system The main Italian law dealing with landscape protection is a recent comprehensive Act 7, which reorganizes and improves the contents of a number of important republican and pre republican laws (1909, 1939). The landscape is also strongly protected by Article 9 the Constitution of 1948. Therefore all public bodies are called to cooperate to preserve beauties and work of arts: State, Regions, Provinces and single municipalities.
7 Legislative decree N° 42, 22 January 2004, Code for cultural heritage and landscape (Codice dei beni culturali e del paesaggio).

Assessment Of The Landscape Quality Including The Historical Heritage In Italy
149
2.1 Objects protected by the State
2.1.1 Landmarks and scenic landscape
Image 12 - Florence Cathedral and Baptistery - Landscape threats by a New tramway system Image 13 – Landmarks: Florence
Cathedral and Baptistery
Special buildings of outstanding value are protected by the State. Special scenic landscapes, the distinctive characteristics of which stem from nature, human history and their mutual relationship are protected in a special registry by special state boards. The owners are forbidden to make any transformation of these registered properties, without the prior approval by the relative board. Even the most protected landmarks, however, runs the risk of alteration and misuse.
2.1.2 National Parks In Italy there are 22 National Parks. They cover over a million and half hectares, or approximately 5% of the national territory. National parks enjoy the highest level of protection. They are managed through special plans. There are four kinds of national park, and they are so designated by ad hoc National Park Plans, depending on the characteristics of their prestige and the quality of existing natural resources8
• integral nature reserves, where conservation of the natural environment is absolute;
• oriented nature reserves, where all building is forbidden; • buffer areas, where normal farming may be carried out • socio‐economic improvement areas, where certain compatible activities
can be carried out.
8 See the National Law N°. 394 of 6 December 1991 which outlines the legal framework for the protected areas
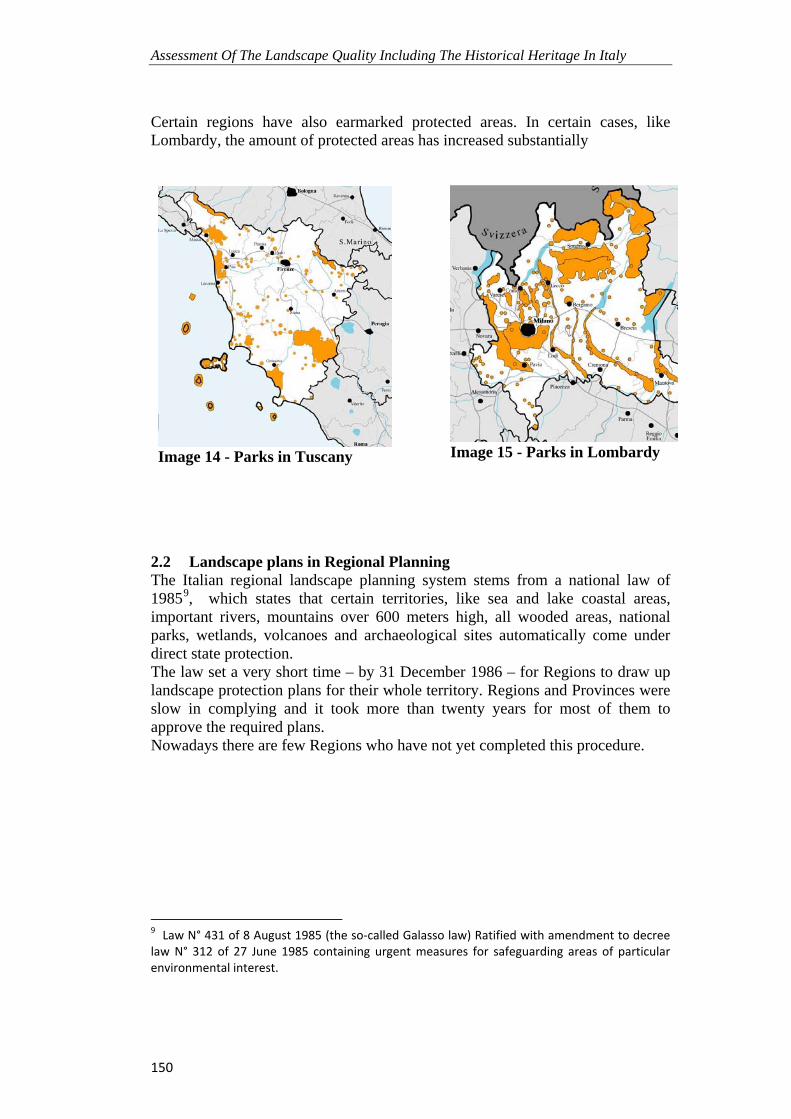
Assessment Of The Landscape Quality Including The Historical Heritage In Italy
150
Certain regions have also earmarked protected areas. In certain cases, like Lombardy, the amount of protected areas has increased substantially
Image 14 - Parks in Tuscany
Image 15 - Parks in Lombardy
2.2 Landscape plans in Regional Planning The Italian regional landscape planning system stems from a national law of 19859, which states that certain territories, like sea and lake coastal areas, important rivers, mountains over 600 meters high, all wooded areas, national parks, wetlands, volcanoes and archaeological sites automatically come under direct state protection. The law set a very short time – by 31 December 1986 – for Regions to draw up landscape protection plans for their whole territory. Regions and Provinces were slow in complying and it took more than twenty years for most of them to approve the required plans. Nowadays there are few Regions who have not yet completed this procedure.
9 Law N° 431 of 8 August 1985 (the so‐called Galasso law) Ratified with amendment to decree law N° 312 of 27 June 1985 containing urgent measures for safeguarding areas of particular environmental interest.
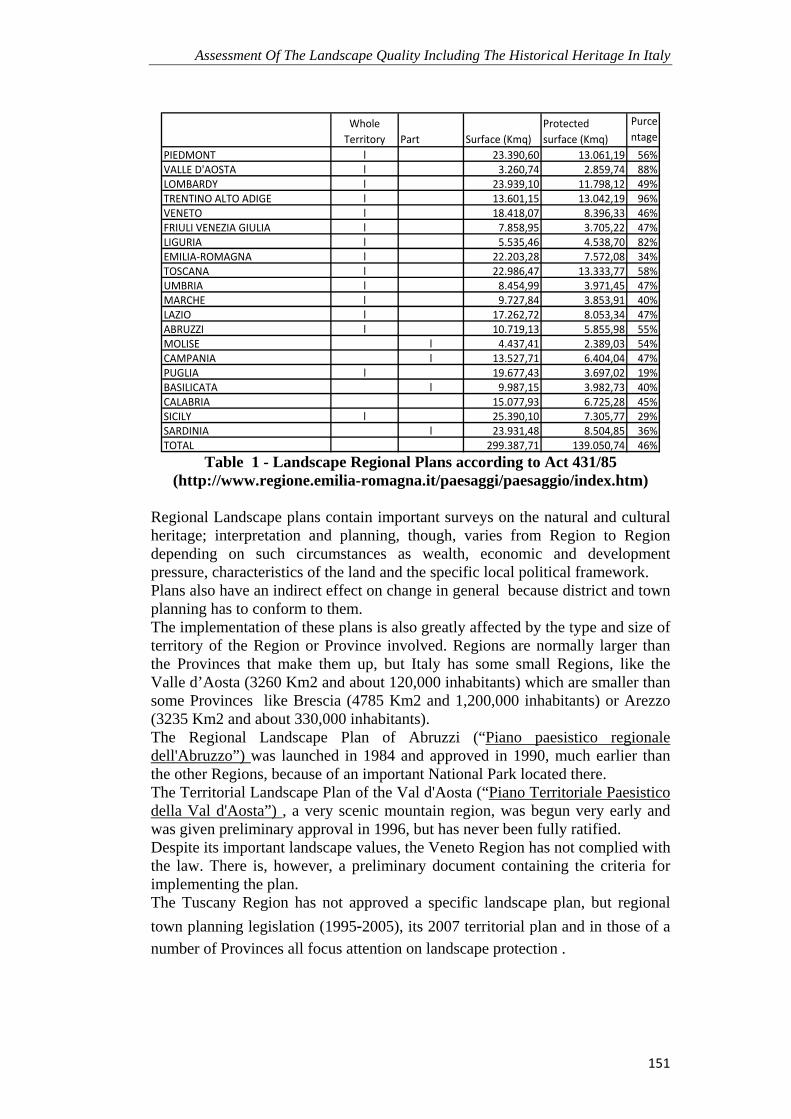
Assessment Of The Landscape Quality Including The Historical Heritage In Italy
151
Whole Territory Part Surface (Kmq)
Protected surface (Kmq)
Purcentage
PIEDMONT l 23.390,60 13.061,19 56%VALLE D'AOSTA l 3.260,74 2.859,74 88%LOMBARDY l 23.939,10 11.798,12 49%TRENTINO ALTO ADIGE l 13.601,15 13.042,19 96%VENETO l 18.418,07 8.396,33 46%FRIULI VENEZIA GIULIA l 7.858,95 3.705,22 47%LIGURIA l 5.535,46 4.538,70 82%EMILIA‐ROMAGNA l 22.203,28 7.572,08 34%TOSCANA l 22.986,47 13.333,77 58%UMBRIA l 8.454,99 3.971,45 47%MARCHE l 9.727,84 3.853,91 40%LAZIO l 17.262,72 8.053,34 47%ABRUZZI l 10.719,13 5.855,98 55%MOLISE l 4.437,41 2.389,03 54%CAMPANIA l 13.527,71 6.404,04 47%PUGLIA l 19.677,43 3.697,02 19%BASILICATA l 9.987,15 3.982,73 40%CALABRIA 15.077,93 6.725,28 45%SICILY l 25.390,10 7.305,77 29%SARDINIA l 23.931,48 8.504,85 36%TOTAL 299.387,71 139.050,74 46%
Table 1 - Landscape Regional Plans according to Act 431/85 (http://www.regione.emilia-romagna.it/paesaggi/paesaggio/index.htm)
Regional Landscape plans contain important surveys on the natural and cultural heritage; interpretation and planning, though, varies from Region to Region depending on such circumstances as wealth, economic and development pressure, characteristics of the land and the specific local political framework. Plans also have an indirect effect on change in general because district and town planning has to conform to them. The implementation of these plans is also greatly affected by the type and size of territory of the Region or Province involved. Regions are normally larger than the Provinces that make them up, but Italy has some small Regions, like the Valle d’Aosta (3260 Km2 and about 120,000 inhabitants) which are smaller than some Provinces like Brescia (4785 Km2 and 1,200,000 inhabitants) or Arezzo (3235 Km2 and about 330,000 inhabitants). The Regional Landscape Plan of Abruzzi (“Piano paesistico regionale dell'Abruzzo”) was launched in 1984 and approved in 1990, much earlier than the other Regions, because of an important National Park located there. The Territorial Landscape Plan of the Val d'Aosta (“Piano Territoriale Paesistico della Val d'Aosta”) , a very scenic mountain region, was begun very early and was given preliminary approval in 1996, but has never been fully ratified. Despite its important landscape values, the Veneto Region has not complied with the law. There is, however, a preliminary document containing the criteria for implementing the plan. The Tuscany Region has not approved a specific landscape plan, but regional town planning legislation (1995‐2005), its 2007 territorial plan and in those of a number of Provinces all focus attention on landscape protection .
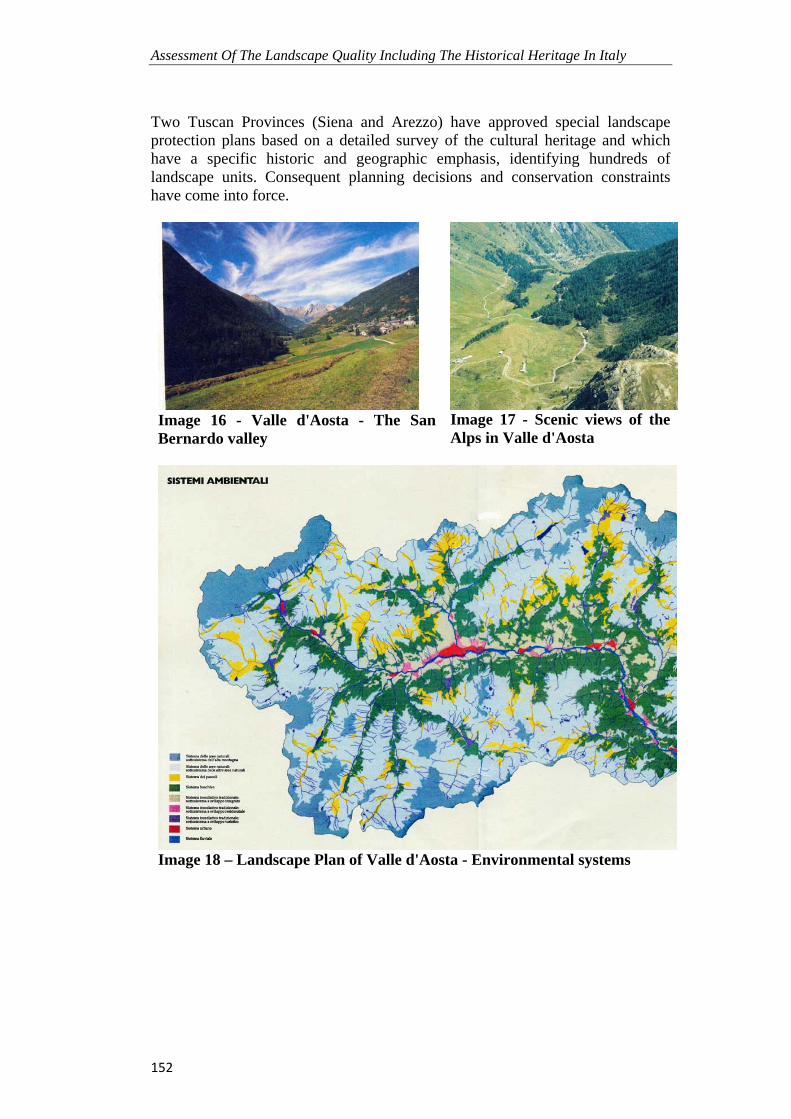
Assessment Of The Landscape Quality Including The Historical Heritage In Italy
152
Two Tuscan Provinces (Siena and Arezzo) have approved special landscape protection plans based on a detailed survey of the cultural heritage and which have a specific historic and geographic emphasis, identifying hundreds of landscape units. Consequent planning decisions and conservation constraints have come into force.
Image 16 - Valle d'Aosta - The San Bernardo valley
Image 17 - Scenic views of the Alps in Valle d'Aosta
Image 18 – Landscape Plan of Valle d'Aosta - Environmental systems
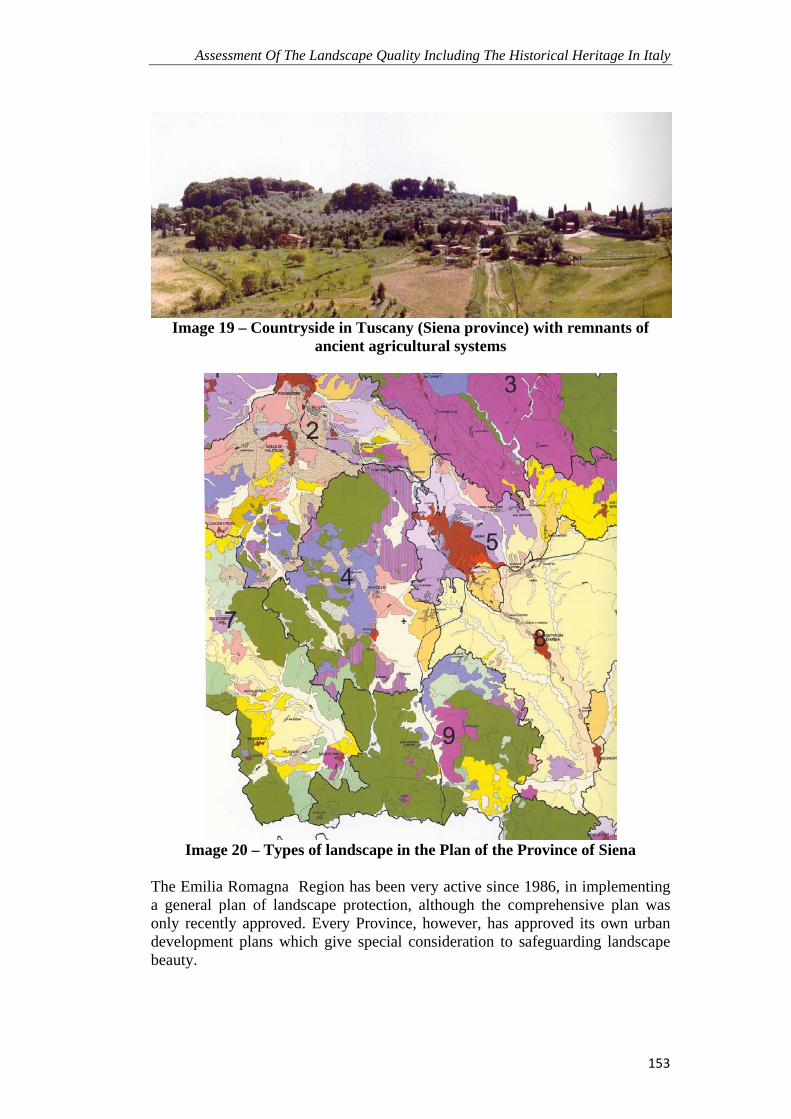
Assessment Of The Landscape Quality Including The Historical Heritage In Italy
153
Image 19 – Countryside in Tuscany (Siena province) with remnants of
ancient agricultural systems
Image 20 – Types of landscape in the Plan of the Province of Siena
The Emilia Romagna Region has been very active since 1986, in implementing a general plan of landscape protection, although the comprehensive plan was only recently approved. Every Province, however, has approved its own urban development plans which give special consideration to safeguarding landscape beauty.
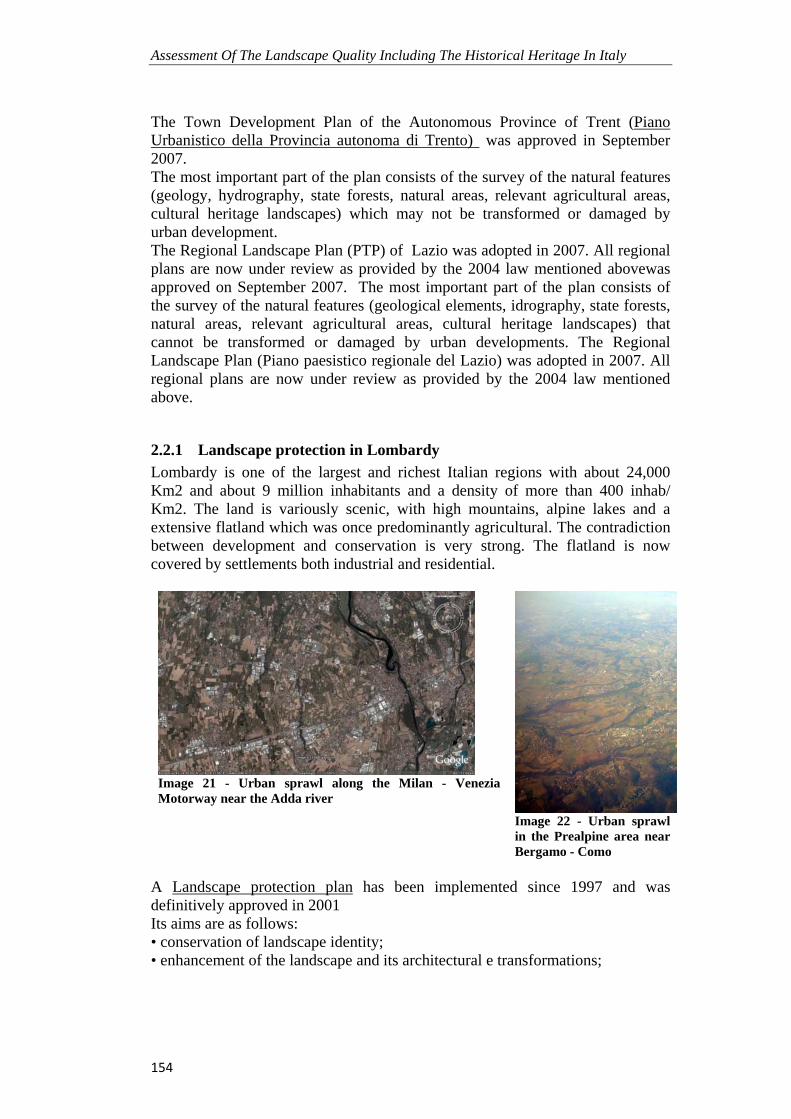
Assessment Of The Landscape Quality Including The Historical Heritage In Italy
154
The Town Development Plan of the Autonomous Province of Trent (Piano Urbanistico della Provincia autonoma di Trento) was approved in September 2007. The most important part of the plan consists of the survey of the natural features (geology, hydrography, state forests, natural areas, relevant agricultural areas, cultural heritage landscapes) which may not be transformed or damaged by urban development. The Regional Landscape Plan (PTP) of Lazio was adopted in 2007. All regional plans are now under review as provided by the 2004 law mentioned abovewas approved on September 2007. The most important part of the plan consists of the survey of the natural features (geological elements, idrography, state forests, natural areas, relevant agricultural areas, cultural heritage landscapes) that cannot be transformed or damaged by urban developments. The Regional Landscape Plan (Piano paesistico regionale del Lazio) was adopted in 2007. All regional plans are now under review as provided by the 2004 law mentioned above.
2.2.1 Landscape protection in Lombardy Lombardy is one of the largest and richest Italian regions with about 24,000 Km2 and about 9 million inhabitants and a density of more than 400 inhab/ Km2. The land is variously scenic, with high mountains, alpine lakes and a extensive flatland which was once predominantly agricultural. The contradiction between development and conservation is very strong. The flatland is now covered by settlements both industrial and residential.
Image 21 - Urban sprawl along the Milan - Venezia Motorway near the Adda river Image 22 - Urban sprawl
in the Prealpine area near Bergamo - Como
A Landscape protection plan has been implemented since 1997 and was definitively approved in 2001 Its aims are as follows: • conservation of landscape identity; • enhancement of the landscape and its architectural e transformations;
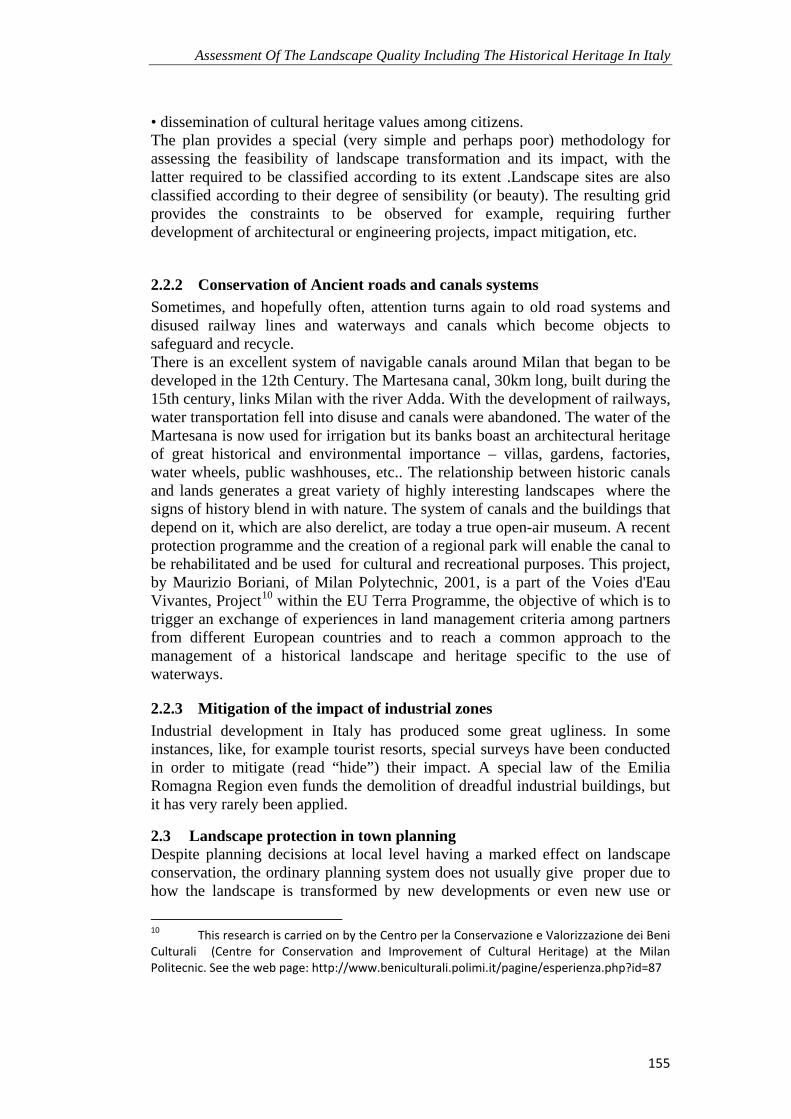
Assessment Of The Landscape Quality Including The Historical Heritage In Italy
155
• dissemination of cultural heritage values among citizens. The plan provides a special (very simple and perhaps poor) methodology for assessing the feasibility of landscape transformation and its impact, with the latter required to be classified according to its extent .Landscape sites are also classified according to their degree of sensibility (or beauty). The resulting grid provides the constraints to be observed for example, requiring further development of architectural or engineering projects, impact mitigation, etc.
2.2.2 Conservation of Ancient roads and canals systems Sometimes, and hopefully often, attention turns again to old road systems and disused railway lines and waterways and canals which become objects to safeguard and recycle. There is an excellent system of navigable canals around Milan that began to be developed in the 12th Century. The Martesana canal, 30km long, built during the 15th century, links Milan with the river Adda. With the development of railways, water transportation fell into disuse and canals were abandoned. The water of the Martesana is now used for irrigation but its banks boast an architectural heritage of great historical and environmental importance – villas, gardens, factories, water wheels, public washhouses, etc.. The relationship between historic canals and lands generates a great variety of highly interesting landscapes where the signs of history blend in with nature. The system of canals and the buildings that depend on it, which are also derelict, are today a true open-air museum. A recent protection programme and the creation of a regional park will enable the canal to be rehabilitated and be used for cultural and recreational purposes. This project, by Maurizio Boriani, of Milan Polytechnic, 2001, is a part of the Voies d'Eau Vivantes, Project10 within the EU Terra Programme, the objective of which is to trigger an exchange of experiences in land management criteria among partners from different European countries and to reach a common approach to the management of a historical landscape and heritage specific to the use of waterways.
2.2.3 Mitigation of the impact of industrial zones Industrial development in Italy has produced some great ugliness. In some instances, like, for example tourist resorts, special surveys have been conducted in order to mitigate (read “hide”) their impact. A special law of the Emilia Romagna Region even funds the demolition of dreadful industrial buildings, but it has very rarely been applied.
2.3 Landscape protection in town planning Despite planning decisions at local level having a marked effect on landscape conservation, the ordinary planning system does not usually give proper due to how the landscape is transformed by new developments or even new use or
10 This research is carried on by the Centro per la Conservazione e Valorizzazione dei Beni Culturali (Centre for Conservation and Improvement of Cultural Heritage) at the Milan Politecnic. See the web page: http://www.beniculturali.polimi.it/pagine/esperienza.php?id=87

Assessment Of The Landscape Quality Including The Historical Heritage In Italy
156
abandonment. This has led to the institution of new landscape plans at the local level.
2.3.1 Conservation of historic town centres This issue was tackled by several plans specifically for historic town centres especially in the Sixties. The transformation of historic town centres are closely monitored, since historic buildings are registered and protected. Methodology has improved through experience .
2.3.2 Urban landscape plans A new kind of planning tool has been recently developed in a number of different areas of Italy which aims to coordinate landscape conservation work. The urban landscape plan is a sort of comprehensive tool, which classifies the whole municipal territory by the varying degrees of its “sensibility” or “vulnerability” to urban transformation. This classification leads to specific procedures of control and authorization. The Landscape Plan of Bolzano (Piano paesistico, 1999) is one of the first of this kind in Italy. Some subregional plans (for instance the Territorial Landscape Plan of the Province of Brescia in the Lombardy Region, approved in 2005) requires local authorities to improve and develop the surveys and implement the consequent conservation measures provided by area-wide plans.
Image 23 - Botticino Landscape Plan – Landscape sensibility of the
municipal territory
Assessment Of The Landscape Quality Including The Historical Heritage In Italy
157
3 Images index Image 1 - Claude Monet, Poppies near Argenteuil, 1873 ............................................143 Image 2 - Jakob Philipp Hackert, Lake Bagno in Ischia, 1792....................................144 Image 3 - Jakob Philipp Hackert, Brindisi Harbour, 1789...........................................144 Image 4 - Jakob Philipp Hackert, Bridge in Venafro, 1786.........................................145 Image 5 - Jakob Philipp Hackert, Sorrento, 1794 ........................................................145 Image 6 - Bernardo Bellotto, Landscape of the town Pirna, 1753-55.........................146 Image 7 - Gabriele Basilico, The bridge of Porto ........................................................147 Image 8 - Gabriele Basilico, Industrial buildings ........................................................147 Image 9 - Image 8 - Gabriele Basilico, Industrial buildings ........................................147 Image 10 - Gabriele Basilico, Industrial buildings ......................................................148 Image 11 - Gabriele Basilico, Industrial buildings ......................................................148 Image 12 - Florence Cathedral and Baptistery Landscape threats by a
New tramway system ...............................................................................149 Image 13 – Landmarks: Florence Cathedral and Baptistery........................................149 Image 14 - Parks in Tuscany........................................................................................150 Image 15 - Parks in Lombardy.....................................................................................150 Image 16 - Valle d'Aosta - The San Bernardo valley ..................................................152 Image 17 - Scenic views of the Alps in Valle d'Aosta.................................................152 Image 18 – Landscape Plan of Valle d'Aosta - Environmental systems......................152 Image 19 – Countryside in Tuscany (Siena province) with remnants of
ancient agricultural systems .....................................................................153 Image 20 – Types of landscape in the Plan of the Province of Siena ..........................153 Image 21 - Urban sprawl along the Milan - Venezia Motorway near the
Adda river.................................................................................................154 Image 22 - Urban sprawl in the Prealpine area near Bergamo - Como .......................154 Image 23 - Botticino Landscape Plan – Landscape sensibility of the
municipal territory....................................................................................156

Assessment Of The Landscape Quality Including The Historical Heritage In Italy
158

COST 356 seminar, Oslo, 20 February 2008
159
APPENDIX I Programme

COST 356 seminar, Oslo, 20 February 2008
160
COST 356 seminar, Oslo, 20 February 2008
161
Towards the definition of a measurable
environmentally sustainable transport
Seminar COST 356 – EST
Wednesday 20 February 2008, TOI, Oslo, Norway Institute of Transport Economics, Gaustadalléen 21, 0349 Oslo
Programme
Objectives There is a strong interest in promoting more sustainable transport patterns in Europe and around the globe. It has therefore become still more important to be able to measure and assess the sustainability of present and future transport trends and policies. The COST Action 356 is a collaboration among European researchers, aiming to move towards the definition of a measurable environmentally sustainable transport (see http://cost356.inrets.fr). COST 356 Action is concerned with how environmental impacts of transport can be measured, how measurements can be transformed to operational indicators and indices, and how indicators are used in planning and decision making. The focus of the action is on the environmental dimension of sustainability, while we are aware that acknowledging the importance of transport for other dimensions of sustainability and that the practical applications of indicators also needs to take into account the wider decision making context.
The Action will host a one-day seminar that will take place at the Institute of Transport Economics or TØI in Oslo, Norway, on February 20th 2008.
There are two main objectives of the seminar: - to present to a larger audience the work carried out so far within the COST action 356 on environmental indicators as measurement tools or decision making tools for environmentally sustainable transport

COST 356 seminar, Oslo, 20 February 2008
162
- to present significant research by other scholars in the same field, allowing the COST action to discuss and take into account the best available current thinking and results . The seminar is open to scientists in the field of environmental indicators and decision making in transport, policy makers and administrators, consultants and other interested actors.
9.00 Registration
9.30 10' Welcome by Lasse Fridstrøm, Managing Director, Institute of Transport Economics
9.40 20' PRESENTATION OF THE COST ACTION 356, OBJECTIVES OF THE SEMINAR AND DEFINITIONS OF INDICATOR
Robert Joumard, chairman of the action
1. Sustainable transport measurement: fundamental challenges Chair: Farideh Ramjerdi (TOI, NO)
10.00 20' THE AIM OF ONTOLOGY FOR TRANSPORT AND ENVIRONMENT
Jacques Teller (Univ. Liège, B) (chairman COST C21)
10.20 20' ROLE OF CONTEXT IN THE DEFINITION AND USE OF ENVIRONMENTAL INDICATORS
Henrik Gudmundsson (DTU, DK)
10.40 20' discussion
11.00 pause
2. Measuring sustainable transport with environmental indicators Chair: Lennart Folkeson (VTI)
11.20 20' CHAINS OF CAUSALITIES OF ENVIRONMENTAL IMPACTS
Robert Joumard (Inrets, F), Santiago Mancebo Quintana, Gerassimos Arapis & Tomasz Zacharz
11.40 20' ASSESSMENT OF THE LANDSCAPE QUALITY INCLUDING THE HISTORICAL HERITAGE
Paolo Ventura (Univ. Firenze, I) (chairman COST C27)
12.00 20' TOWARDS AN INTEGRATED REPORTING ON TRANSPORT, HEALTH AND ENVIRONMENT: ENVIRONMENT AND HEALTH INDICATORS
Dafina Dalbokova and Sonja Kahlmeier (WHO, D)
12.20 20' NOISE INDICATORS
Cristian Camusso (Politecnico Torino, I)
12.40 40' discussion
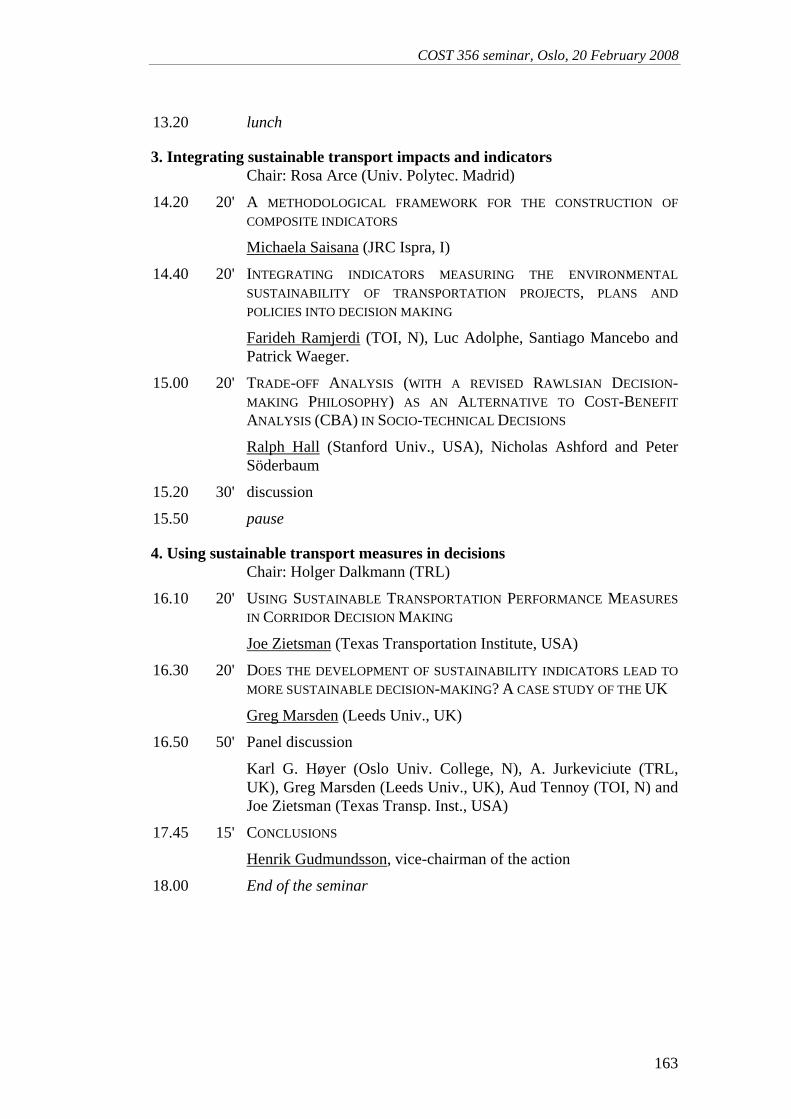
COST 356 seminar, Oslo, 20 February 2008
163
13.20 lunch
3. Integrating sustainable transport impacts and indicators Chair: Rosa Arce (Univ. Polytec. Madrid)
14.20 20' A METHODOLOGICAL FRAMEWORK FOR THE CONSTRUCTION OF COMPOSITE INDICATORS
Michaela Saisana (JRC Ispra, I)
14.40 20' INTEGRATING INDICATORS MEASURING THE ENVIRONMENTAL SUSTAINABILITY OF TRANSPORTATION PROJECTS, PLANS AND POLICIES INTO DECISION MAKING
Farideh Ramjerdi (TOI, N), Luc Adolphe, Santiago Mancebo and Patrick Waeger.
15.00 20' TRADE-OFF ANALYSIS (WITH A REVISED RAWLSIAN DECISION-MAKING PHILOSOPHY) AS AN ALTERNATIVE TO COST-BENEFIT ANALYSIS (CBA) IN SOCIO-TECHNICAL DECISIONS
Ralph Hall (Stanford Univ., USA), Nicholas Ashford and Peter Söderbaum
15.20 30' discussion
15.50 pause
4. Using sustainable transport measures in decisions Chair: Holger Dalkmann (TRL)
16.10 20' USING SUSTAINABLE TRANSPORTATION PERFORMANCE MEASURES IN CORRIDOR DECISION MAKING
Joe Zietsman (Texas Transportation Institute, USA)
16.30 20' DOES THE DEVELOPMENT OF SUSTAINABILITY INDICATORS LEAD TO MORE SUSTAINABLE DECISION-MAKING? A CASE STUDY OF THE UK
Greg Marsden (Leeds Univ., UK)
16.50 50' Panel discussion
Karl G. Høyer (Oslo Univ. College, N), A. Jurkeviciute (TRL, UK), Greg Marsden (Leeds Univ., UK), Aud Tennoy (TOI, N) and Joe Zietsman (Texas Transp. Inst., USA)
17.45 15' CONCLUSIONS
Henrik Gudmundsson, vice-chairman of the action
18.00 End of the seminar

COST 356 seminar, Oslo, 20 February 2008
164

COST 356 seminar, Oslo, 20 February 2008
165
APPENDIX II List of participants
Name Affiliation Address Email
Adolphe, Luc France France -
Althaus, Hans-Jöerg Empa Duebendorf, Switzerland
Antov, Dago Stratum OÜ Estonia -
Arapis, Gerassimos Agricultural University of Athens, Greece
Greece [email protected]
Aschermann, Ralf ANIDEA Graz, Austria [email protected]
Belen, Martín Ramos Universidad Politécnica de Madrid- TRANSyt
Madrid, Spain [email protected]
Berge, Guro Directorate of Public Roads Oslo, Norway [email protected]
Beughedaoui, Menouer University of Blida Blida, Algeria [email protected]
Bækken, Torleif Norwegian Institute for Water Research (NIVA)
Oslo, Norway [email protected]
Calderon, Enrique J Universidad Politécnica de Madrid Madrid, Spain [email protected]
Camusso, Cristian Dipartimento di idraulica Transporti e Infrastrutture Civili (DITIC)
Turin, Italy [email protected]
Dalbokva, Dafina World Health Organization Europe Bonn, Germany [email protected]
Dalkmann, Holger TRL, Environmental Assessment Team
Wokingham, Berkshire, UK
-
Fischer, Thomas Liverpool University Liverpool, UK [email protected]
Folkeson, Lennart VTI Linköping, Sverige [email protected]
Fridstrøm, Lasse Norwegian Centre for Transport Research (TØI)
Oslo, Norway [email protected]
Fyhri, Aslak Norwegian Centre for Transport Research (TØI)
Oslo, Norway [email protected]
Gislerud, Anne Norwegian Pollution Control Authority (SFT)
Oslo, Norway [email protected]
Gudmundsson, Henrik DTU Transport Kgs. Lyngby, Denmark
Hall, Ralph Stanford University Stanford, USA [email protected]
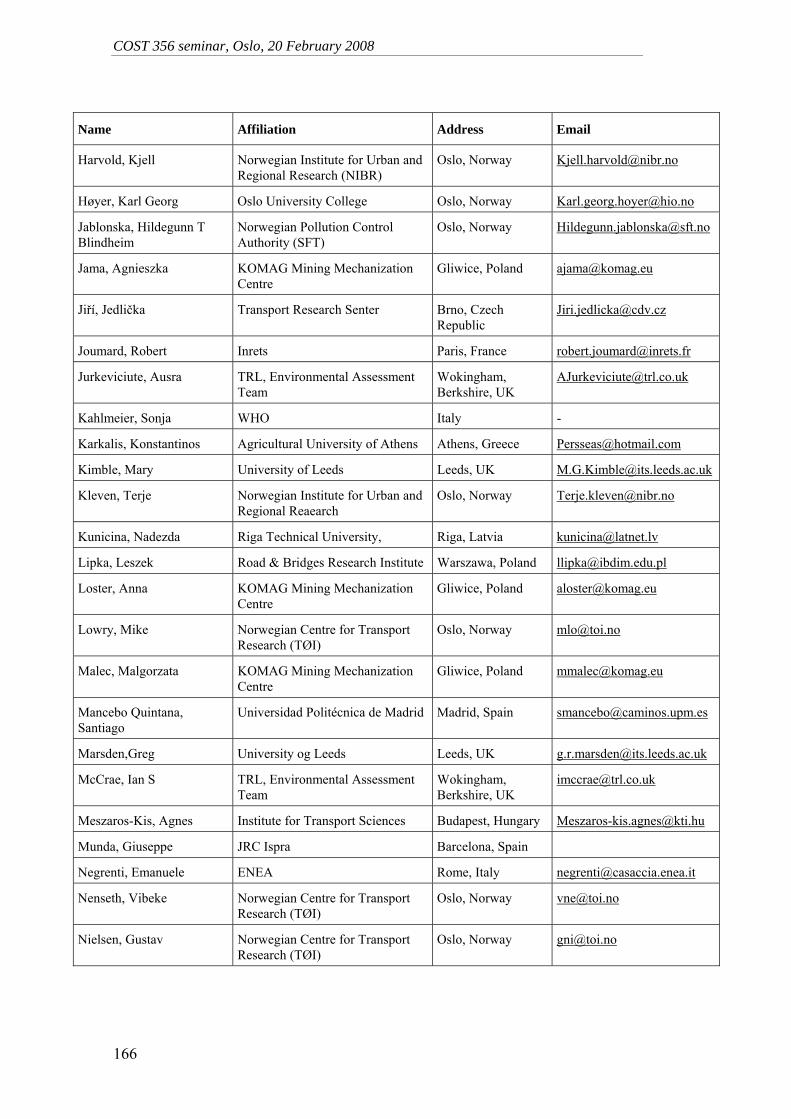
COST 356 seminar, Oslo, 20 February 2008
166
Name Affiliation Address Email
Harvold, Kjell Norwegian Institute for Urban and Regional Research (NIBR)
Oslo, Norway [email protected]
Høyer, Karl Georg Oslo University College Oslo, Norway [email protected]
Jablonska, Hildegunn T Blindheim
Norwegian Pollution Control Authority (SFT)
Oslo, Norway [email protected]
Jama, Agnieszka KOMAG Mining Mechanization Centre
Gliwice, Poland [email protected]
Jiří, Jedlička Transport Research Senter Brno, Czech Republic
Joumard, Robert Inrets Paris, France [email protected]
Jurkeviciute, Ausra TRL, Environmental Assessment Team
Wokingham, Berkshire, UK
Kahlmeier, Sonja WHO Italy -
Karkalis, Konstantinos Agricultural University of Athens Athens, Greece [email protected]
Kimble, Mary University of Leeds Leeds, UK [email protected]
Kleven, Terje Norwegian Institute for Urban and Regional Reaearch
Oslo, Norway [email protected]
Kunicina, Nadezda Riga Technical University, Riga, Latvia [email protected]
Lipka, Leszek Road & Bridges Research Institute Warszawa, Poland [email protected]
Loster, Anna KOMAG Mining Mechanization Centre
Gliwice, Poland [email protected]
Lowry, Mike Norwegian Centre for Transport Research (TØI)
Oslo, Norway [email protected]
Malec, Malgorzata KOMAG Mining Mechanization Centre
Gliwice, Poland [email protected]
Mancebo Quintana, Santiago
Universidad Politécnica de Madrid Madrid, Spain [email protected]
Marsden,Greg University og Leeds Leeds, UK [email protected]
McCrae, Ian S TRL, Environmental Assessment Team
Wokingham, Berkshire, UK
Meszaros-Kis, Agnes Institute for Transport Sciences Budapest, Hungary [email protected]
Munda, Giuseppe JRC Ispra Barcelona, Spain
Negrenti, Emanuele ENEA Rome, Italy [email protected]
Nenseth, Vibeke Norwegian Centre for Transport Research (TØI)
Oslo, Norway [email protected]
Nielsen, Gustav Norwegian Centre for Transport Research (TØI)
Oslo, Norway [email protected]
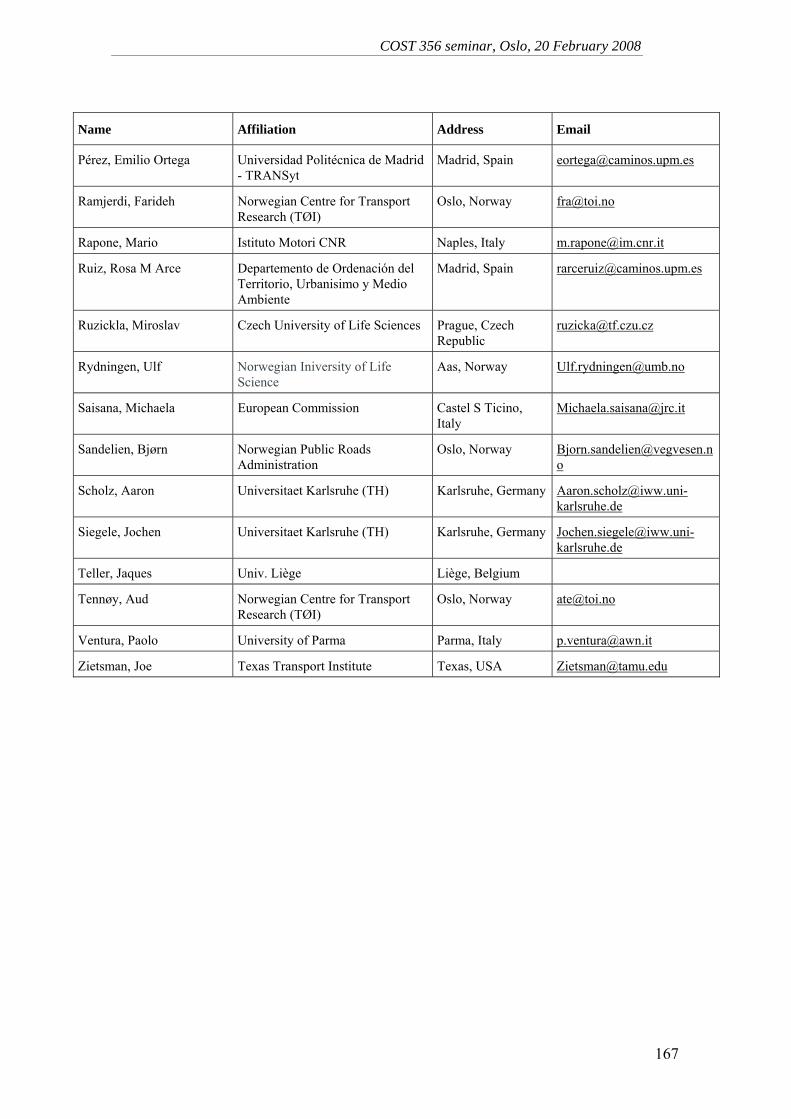
COST 356 seminar, Oslo, 20 February 2008
167
Name Affiliation Address Email
Pérez, Emilio Ortega Universidad Politécnica de Madrid- TRANSyt
Madrid, Spain [email protected]
Ramjerdi, Farideh Norwegian Centre for Transport Research (TØI)
Oslo, Norway [email protected]
Rapone, Mario Istituto Motori CNR Naples, Italy [email protected]
Ruiz, Rosa M Arce Departemento de Ordenación del Territorio, Urbanisimo y Medio Ambiente
Madrid, Spain [email protected]
Ruzickla, Miroslav Czech University of Life Sciences Prague, Czech Republic
Rydningen, Ulf Norwegian Iniversity of Life Science
Aas, Norway [email protected]
Saisana, Michaela European Commission Castel S Ticino, Italy
Sandelien, Bjørn Norwegian Public Roads Administration
Oslo, Norway [email protected]
Scholz, Aaron Universitaet Karlsruhe (TH) Karlsruhe, Germany [email protected]
Siegele, Jochen Universitaet Karlsruhe (TH) Karlsruhe, Germany [email protected]
Teller, Jaques Univ. Liège Liège, Belgium
Tennøy, Aud Norwegian Centre for Transport Research (TØI)
Oslo, Norway [email protected]
Ventura, Paolo University of Parma Parma, Italy [email protected]
Zietsman, Joe Texas Transport Institute Texas, USA [email protected]