Embed Size (px)
Citation preview
1
TOWARDS REFINING THE CLASSIFICATION OF GLASS TRADE
BEADS IMPORTED INTO SOUTHERN AFRICA FROM THE 8th
TO THE
16th
CENTURY AD
Farahnaz Koleinia, Linda C. Prinsloo
a,b, Wim M. Biemond
e, Philippe Colomban
c,d, Anh-
Tu Ngoc,d
, Jan C.A. Boeyense and Maria M. van der Ryst
e
aDepartment of Physics, University of Pretoria, Pretoria, South Africa, 0002.
bCentre for Archaeological Science, School of Earth and Environmental Sciences,
University of Wollongong, Wollongong, NSW 2522, Australia. cSorbonne Universités, UPMC Univ Paris 06, UMR 8233, MONARIS, F-75005, Paris,
France. dCNRS, UMR 8233, IP2CT, MONARIS, F-75005, Paris, France.
eDepartment of Anthropology and Archaeology, University of South Africa, Pretoria,
South Africa, 0003.
AUTHORS FarahnazKoleini, Postdoctoral student
Department of Physics, University of Pretoria, Pretoria, South Africa, 0002.
Email: [email protected]
*Linda C. Prinsloo, Chief Researcher, Research fellow
Department of Physics, University of Pretoria, Pretoria, South Africa, 0002.
Centre for Archaeological Science, School of Earth and Environmental
Sciences,University of Wollongong, Wollongong, NSW 2522, Australia.
Email: [email protected], [email protected]
Tel: 61 24 221 5966
Wim M. Biemond, PhD candidate / Director: Lentswe Archaeological Consultants
Department of Anthropology and Archaeology, University of South Africa, Pretoria,
South Africa, 0003.
Email: [email protected]
Tel: 267 494 0009
Philippe Colomban, Research Prof. Dr.
Sorbonne Universités, UPMC Univ Paris 06, UMR 8233, MONARIS, F-75005, Paris,
France.
CNRS, UMR 8233, IP2CT, MONARIS, F-75005, Paris, France.
Email: [email protected]
Tel: 33 1 4427 2785
Anh-Tu Ngo,Research Engineer
Sorbonne Universités, UPMC Univ Paris 06, UMR 8233, MONARIS, F-75005, Paris,
France.
CNRS, UMR 8233, MONARIS, F-75005, Paris, France.
Email: [email protected]
Tel: 33 1 4427 2785
Jan C.A. Boeyens, Professor
Department of Anthropology and Archaeology, University of South Africa, Pretoria,
South Africa, 0003
Email: [email protected]
Tel: 27 12 429 6359
Maria M. van der Ryst, Senior lecturer
Department of Anthropology and Archaeology, University of South Africa, Pretoria,
South Africa, 0003
Email: [email protected]
Tel: 27 12 429 6477
2
ABSTRACT
Tracing the origin of glass trade beads excavated at archaeological sites
can contribute significantly to dating a site and reconstructing prehistoric trade
routes. Wood developed a temporally sensitive bead sequence dating from the 8th
to the 16th
century AD for beads excavated at southern African sites that is
commonly used by archaeologists to classify beads according to their
morphology. In this study we develop a multidisciplinary methodology to refine
the classification of glass beads based on morphology alone. Glass trade beads
excavated at 11 sites along the upper reaches of the Limpopo River in east-central
Botswana are used as case study. The beads were visually classified according to
their morphological properties (colour, size, etc.) and analysed with Raman
spectroscopy and portable X-ray fluorescence (XRF). Energy Dispersive
Spectroscopy (EDS) of one bead showed that two types of glass were sintered
together to form a recycled product, explaining the divergence of Raman spectra
recorded on different zones. The study confirms the value of a morphological
classification based on existing data sets as a first approach, but demonstrates that
both Raman and XRF measurements can contribute to a more exact classification
of glass beads imported into southern Africa from the East before the 17th
century
AD.
Keywords: Glass trade beads/Iron Age/Botswana/Raman spectroscopy/X-ray fluorescence spectroscopy (XRF)/ Energy dispersive spectroscopy (EDS)
Research aims
Glass beads have been part of indigenous southern African culture and
tradition since they were first imported into the region during the 7th
century AD
[1, 2]. In order to date sites and accurately reconstruct trade routes or connections,
appropriate analytical techniques are essential to correctly classify bead
assemblages. Although a substantial amount of scientific research has been
conducted on the classification of glass trade beads, the field archaeologist still
largely depends on classification by means of morphological parameters, which
may lead to wrongful attributions. In this study we aim to assess the viability of
using two unbiased techniques, namely Raman spectroscopy and X-ray
3
fluorescence spectroscopy (XRF), to refine a bead classification system that relies
on morphological parameters.
Introduction
The most commonly used system to classify beads recovered at
archaeological sites dating from the 8th
to the 16th
century AD in southern Africa
is the temporally sensitive bead sequence (Table S1) developed by Wood [1,
2].The sequence was developed by classifying beads from securely dated sites
according to morphological parameters, after which the attributions were
chemically tested by Robertshaw et al. [3] using Laser ablation - Inductively
Coupled Plasma - Mass Spectrometry (LA-ICP-MS).
In most instances the beads retrieved from southern African archaeological
sites are small monochrome drawn beads and, as a result, they are difficult to
classify unambiguously in the field. The means to chemically analyse beads using
LA-ICP-MS as applied by Robertshaw et al. [3] are also not always readily
available and, due to very large variations in the chemical composition of each
bead series, assignments are not always clear-cut (Table S2). Raman spectroscopy
has been successfully used to classify glass trade beads [4-7] and has the
advantage that information about the composition of the glass, as well as pigments
colouring the glass, can be obtained from the same spectrum or by more than one
spectrum, focusing either on the glass or the pigment. However, Raman
spectroscopy also has its limitations as the intensity of a Raman signature greatly
depends on the number of electrons involved in the bond and some phases are
4
hardly detected. Furthermore, ions that are in many instances the origin of glass
colour do not give special Raman signals, and if classifications depend on the
presence of trace elements (eg. uranium), Raman spectroscopy is not useful.
Recently the progress in developing portable instruments (Raman and XRF)
has made these techniques more accessible to archaeologists. In this study we
endeavour to develop a multidisciplinary methodology to classify glass trade
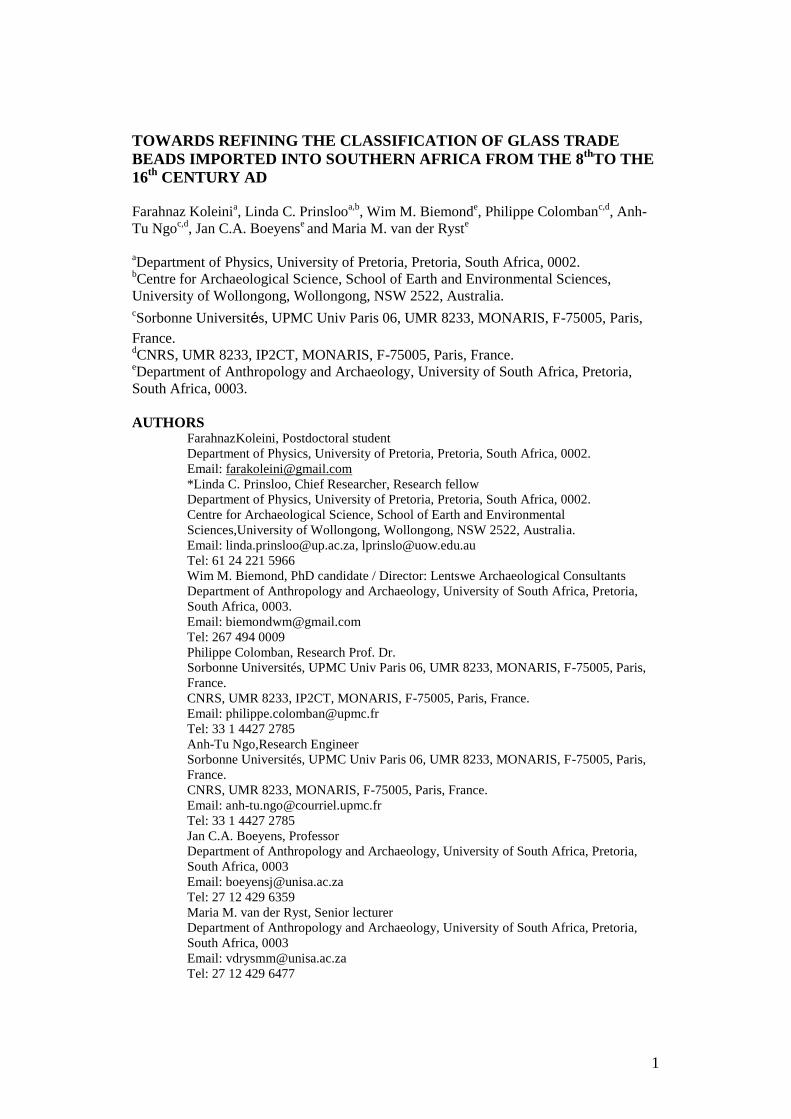
beads, using as case study glass trade beads excavated at 11 sites in the Upper
Limpopo River region in east-central Botswana (Fig. 1). An experienced field
archaeologist classified the beads based on morphological parameters [8],
according to the bead sequence developed by Wood [1, 2]. Using this
Figure 1: Map of the region indicating the sites where the beads were excavated. (K - Kudumatse
Village; MEP - Mmamabula Energy Project) in relationship to the important archaeological sites
of K2 and Mapungubwe.
5
classification as a guideline, representative beads were selected for Raman
measurements and the spectra compared to the spectral database of the beads
excavated at Mapungubwe [4, 5]. Based on the classification of bead types
according to their Raman spectra, beads were selected for XRF analyses in order
to form a link between the chemical composition and Raman spectrum of a bead.
Materials and methods
3.1 Archaeological context and samples
A substantial number of glass trade beads (1014) were recovered from Iron
Age sites in the Mahalapye area of east-central Botswana (Fig.1). The sites are in
the proximity of the upper reaches of the Limpopo River on Basinghall Farm, at
Kudumatse Village and at the Mmamabula Energy Project [8]. These locations
are about 280 km south-west of Mapungubwe and 120 km south of
Toutswemogala, two prominent Middle Iron Age capitals in southern Africa. The
excavations were carried out as part of a formal research project on Basinghall
Farm [8], as well as Cultural Resource Management (CRM) impact assessments
in the adjacent area [unpublished reports].
The excavated sites on Basinghall and adjacent areas, as well as their
allocated site numbers, are shown in Fig. 1. Middle Iron Age (c. AD 900–1300)
African farmer sites in the research area can be assigned either to the dominant
Toutswe chiefdom in the region or to the minority or subject Eiland people on its
fringes [9]. All the Toutswe and Eiland sites from which beads were retrieved for
this analysis can be classified as small commoner settlements or outposts.

6
Extensive trade networks were established between the Toutswe chiefdom in
eastern Botswana and K2 (c. AD 1020–1220) and its successor, Mapungubwe (c.
AD 1220–1300), two major political centres situated near the confluence of the
Shashe and Limpopo Rivers. K2 and Mapungubwe served as key nodes for the
import and distribution of glass beads that reached the southern African interior
through the Indian Ocean trading network [1].
Late Iron Age sites (c. AD 1300–1850) in the study area can be attributed to
Tswana-speaking African farmers who were the producers of distinctive red- and
black-coloured Letsibogo facies pottery. They settled in small villages in which
residential units were arranged around central cattle byres [10]. Letsibogo
communities traded with Shona (Kalanga-speaking) groups to the north which
were located within the sphere of influence of the Khami state (15th
century to
mid-17th
century AD) with its headquarters in south-western Zimbabwe. Khami
was one of the successor states that emerged after the decline of Great Zimbabwe
(c. AD 1300–1450) [8].
A list of the excavated sites, including their location, associated radiocarbon
dates and the number of beads retrieved from each site, is given in Table 1[8]. The
beads were labelled according to the site of origin, followed by the colour of the
bead (in abbreviation), as well as its number. Sites 37-A3-1, 37-A3-16, 37-C1-4,
37-C1-8 and 36-D2-35 are associated with the Toutswe ceramic facies, while 37-
C1-19, 37-C1-25, 36-D2-14, 35-D3-1 and 36-D1-3 represent the Letsibogo
ceramic facies. Only one site yielded ceramics from the Eiland ceramic facies,
namely 37-C1-7. The retrieved beads were tentatively classified (Table 1)
7
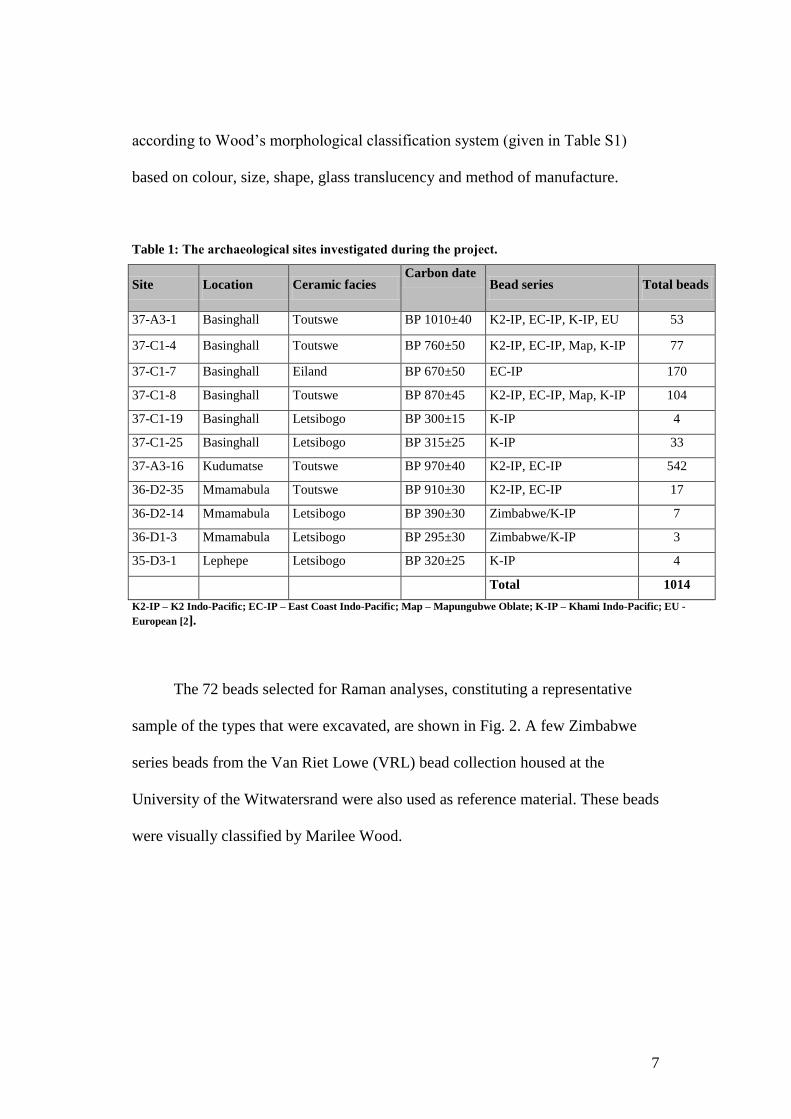
according to Wood’s morphological classification system (given in Table S1)
based on colour, size, shape, glass translucency and method of manufacture.
Table 1: The archaeological sites investigated during the project.
Site Location Ceramic facies Carbon date
Bead series Total beads
37-A3-1 Basinghall Toutswe BP 1010±40 K2-IP, EC-IP, K-IP, EU 53
37-C1-4 Basinghall Toutswe BP 760±50 K2-IP, EC-IP, Map, K-IP 77
37-C1-7 Basinghall Eiland BP 670±50 EC-IP 170
37-C1-8 Basinghall Toutswe BP 870±45 K2-IP, EC-IP, Map, K-IP 104
37-C1-19 Basinghall Letsibogo BP 300±15 K-IP 4
37-C1-25 Basinghall Letsibogo BP 315±25 K-IP 33
37-A3-16 Kudumatse Toutswe BP 970±40 K2-IP, EC-IP 542
36-D2-35 Mmamabula Toutswe BP 910±30 K2-IP, EC-IP 17
36-D2-14 Mmamabula Letsibogo BP 390±30 Zimbabwe/K-IP 7
36-D1-3 Mmamabula Letsibogo BP 295±30 Zimbabwe/K-IP 3
35-D3-1 Lephepe Letsibogo BP 320±25 K-IP 4
Total 1014
K2-IP – K2 Indo-Pacific; EC-IP – East Coast Indo-Pacific; Map – Mapungubwe Oblate; K-IP – Khami Indo-Pacific; EU -
European [2].
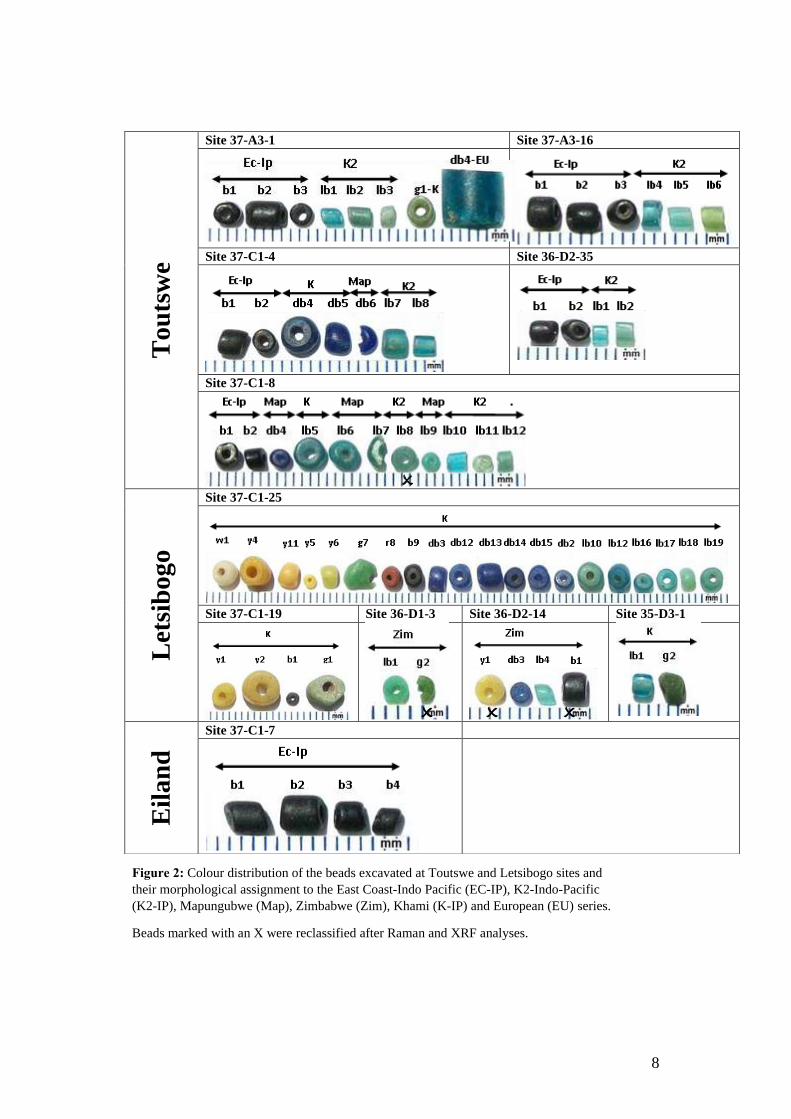
The 72 beads selected for Raman analyses, constituting a representative
sample of the types that were excavated, are shown in Fig. 2. A few Zimbabwe
series beads from the Van Riet Lowe (VRL) bead collection housed at the
University of the Witwatersrand were also used as reference material. These beads
were visually classified by Marilee Wood.
8
Figure 2: Colour distribution of the beads excavated at Toutswe and Letsibogo sites and
their morphological assignment to the East Coast-Indo Pacific (EC-IP), K2-Indo-Pacific
(K2-IP), Mapungubwe (Map), Zimbabwe (Zim), Khami (K-IP) and European (EU) series.
Beads marked with an X were reclassified after Raman and XRF analyses.
To
uts
we
Site 37-A3-1 Site 37-A3-16
Site 37-C1-4 Site 36-D2-35
Site 37-C1-8
Let
sib
ogo
Site 37-C1-25
Site 37-C1-19 Site 36-D1-3 Site 36-D2-14 Site 35-D3-1
Eil
an
d
Site 37-C1-7

9
3.2 Raman measurements
Raman spectra of the beads were recorded with three different Raman
instruments. The majority of the beads were analysed with an HR Raman
instrument (Horiba JobinYvon, France). A 458 nm line of an Ar+ ion Coherent
laser was used as excitation source and a microscope attachment (Olympus) made
it possible to focus on a selected area on the bead using a 50x objective.
Some beads were analysed with a portable HE532 (Horiba JobinYvon,
France) spectrometer equipped with a Peltier effect-cooled CCD detector. A 532
nm Nd/YAG Ventus laser (Quantum, UK) excitation source with a maximum
power output of 80 mW (for dark coloured beads) or 300 mW (for clear lighter
coloured beads) was used for the analysis. The laser power at the sample was
about 4 mW and 20 mW respectively. The laser source was connected by means
of optic fibres to a remote SuperHead® (Horiba JobinYvon), equipped with
Nikon 50x or Mitutoyo 50x and 200x long working distance objectives. It was
previously observed that, due to the optical fibre connection between the remote
optical head and an edge filter to eliminate the Rayleigh scattering, the
background of the spectra recorded with the portable instrument is artificially
increased [11]. This problem was solved by changing the first point for baseline
correction from 200 cm-1
to 400 cm-1
, which results in spectra similar to those
recorded by high-resolution laboratory Raman instruments [11].
A few beads were also analysed using a T64000 Raman spectrometer
(Horiba JobinYvon, France). A 514.6 nm laser line from a mixed gas Krypton-
Argon laser (Coherent) was used as excitation source. A long working distance
10
50x objective fixed to an Olympus microscope was used to obtain spectra with a
spectral resolution of ~2 cm-1
. Laser power at the sample was 10 mW.
3.3 XRF measurements
A portable Thermo Scientific Niton XL3t GOLDD spectrometer was used
for the semi-quantitative X-ray fluorescence (XRF) measurements of the selected
glass beads. The spectrometer consists of a 4 Watt Ag anode X-ray tube, capable
of a maximum voltage output of 50 kV at a current of 200 µA as well as a
Geometrically Optimized Large area Drift Detector (GOLDD). Due to the small
sizes of the beads a Niton XL3 portable test stand was used to measure the beads.
The instrument was calibrated by using the fundamental parameters as employed
by Mining Cu/Zn modes. Four range methods, namely main, low, high and light
with measurement duration of 100 seconds each, were applied to detect
amounts/traces of 36 elements. The limit of detection of the elements (LOD) was
calculated using a 2-sigma range. The concentration of an element in each sample
is given in parts per million (ppm) and then manually converted to wt%. The
concentration of the elements lighter than Mg, such as sodium and oxygen, which
could not be directly detected with the portable instrument used, was calculated
by subtracting the sum of the weight percent of the measured elements from the
total weight.
11
3.4 Energy dispersive spectroscopy (EDS)
A green opaque bead (C1-19-g1) (Fig. 6), which produced different Raman
signatures depending on the zone of the bead that was sampled, was sliced using a
Struers Minitom Diamond disk. A JEOL JSM 55 10LV SEM microscope coupled
with a 500 Digital Processing XRF system was used for local analysis and to
obtain an elemental distribution map of a bead cross section.
Results and discussion
Colour and morphological parameters
The beads were rinsed in sterile water to clear away the surface dirt but some
corrosion products may still be present. The beads were then classified according
to morphological parameters using Wood’s southern African bead sequence
(Table S1, Fig. 2). They were grouped into the K2-Indo-Pacific (K2-IP), East
Coast Indo-Pacific (EC-IP), Mapungubwe Oblate (Map), Zimbabwe (Zim) and
Khami-Indo-Pacific (K-IP) series. It should be noted that all the IP series are
related in terms of origin — they come from South Asia and could therefore have
a similar base chemical composition. Such beads were made for over 2000 years,
so through time (and even at any one time) they would have been made at
different places in the region, accounting for differences in chemistry. Thus the
differences between the K2-IP/EC-IP and the Khami (K-IP) series have temporal
significance. Based on the Raman results 26 beads were selected for analyses with
XRF measurements.
12
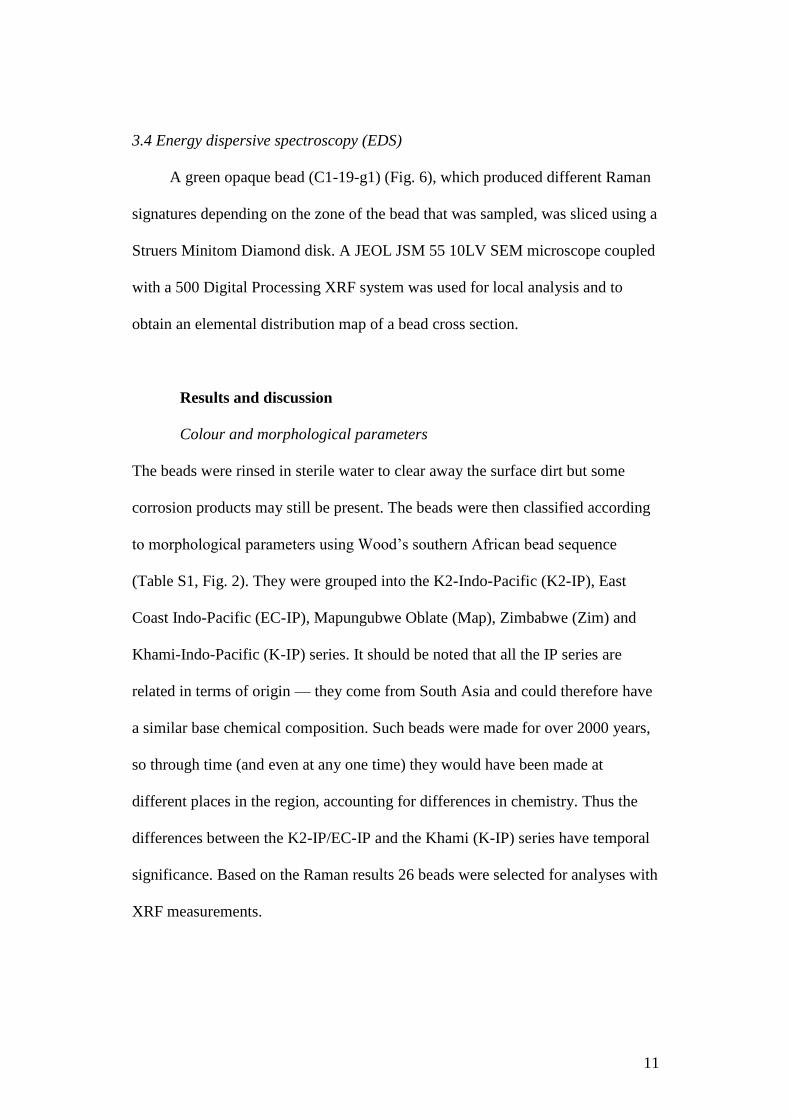
4.2 Raman and XRF results for the glass matrix
The Raman spectrum of glass consists of two broad bands, one around 500
cm-1
(SiO4 bending vibrations), and one around 1000 cm-1
(SiO4 stretching
vibrations). Previous studies on glass and glass beads [4, 11-16] developed a
useful method for the classification of glass spectra based on the plot of
wavenumber positions of the peak maxima of the bending against stretching
envelopes. Based on the results from this study (Fig. 3), four groups can be
distinguished, with one group containing only one bead. A representative Raman
spectrum of each group is presented in Fig. 4A and the XRF results of 26 beads
selected are given in Table 2 and Fig. 5A. The four groups based on Raman
spectra can be defined as follows:
Figure 3. Classification of bead spectra by plotting maximum intensity peak positions
of the bending and stretching bands against each other. ( Toutswe; ▲ Letsibogo and
Eiland. Colour fill represents the colour of the beads).
13
A)
B) 200 400 600 800 1000 1200
Ram
an
In
ten
sit
y
Wavenumber/cm-1
a
b
c
d
602
633
715 775
288378 481
1090
950
570
285
330
425597
990
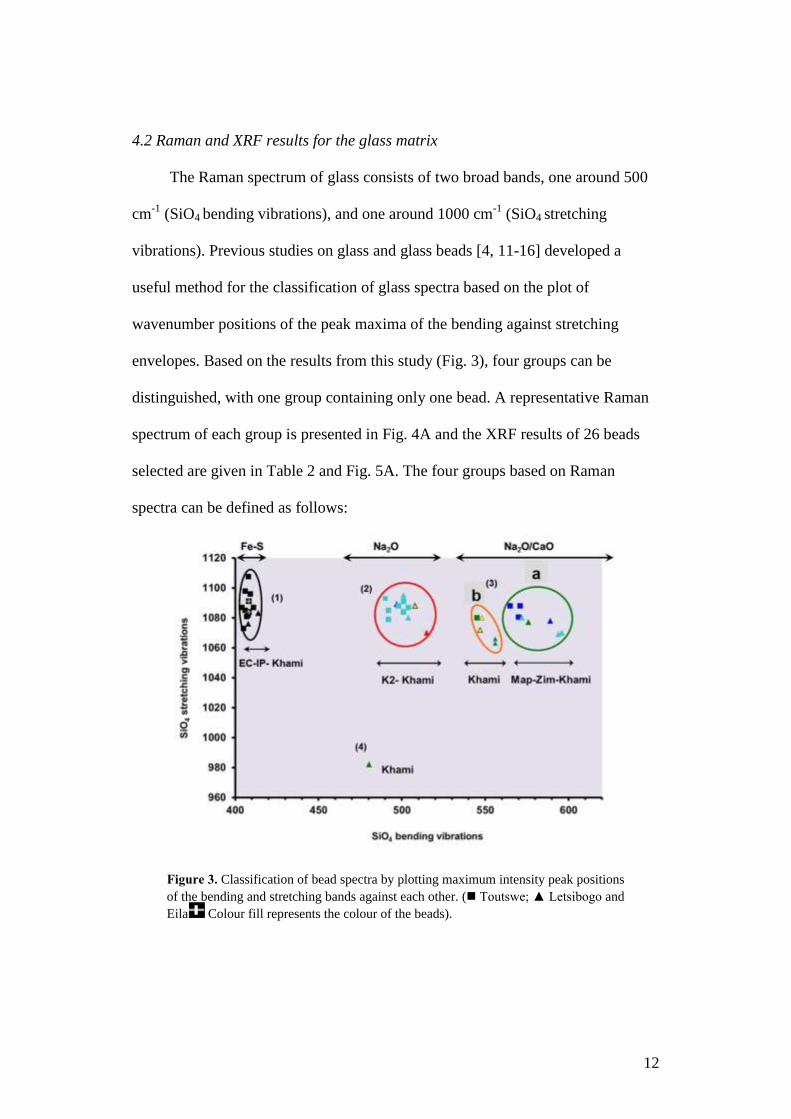
C)Figure 4 A) Baseline-subtracted Raman spectra representative of the groups
identified in Figure 3: a, b = Group 1; c, d = Group 2; e = Group 3a; f = Group 3b and
g = Group 4
B). a) Fe-S chromophore in a black Zimbabwe series bead b) Glass matrix of the
same black Zimbabwe series bead c) Fe-S chromophore in a black Mapungubwe
Oblate d) Tin oxide opacifier in a light blue Zimbabwe series bead
C): Raman spectra of a) Yellow pigment - lead tin yellow (type II) b) Light yellow-
orange pigment c) White bead d) Tin oxide recorded as opacifier in the Mapungubwe
Oblate bead series.
14
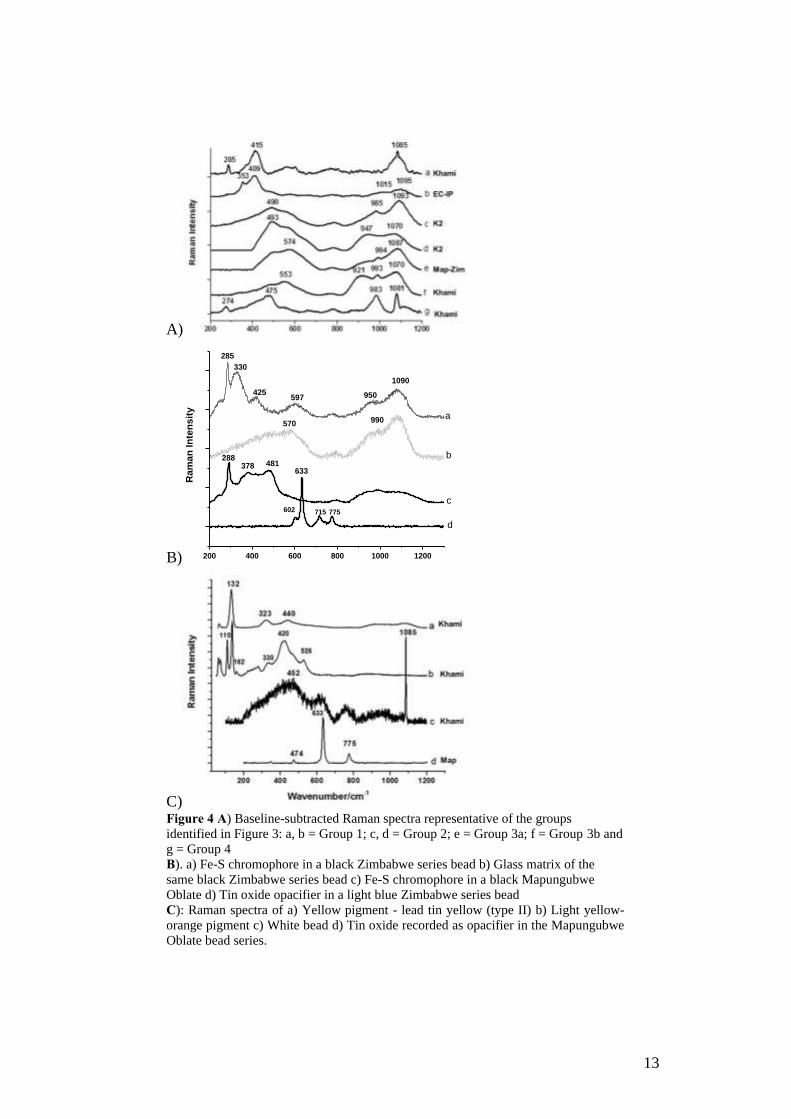
Table 2: XRF measurement results of the principal glass matrix elements (wt%) Class/Fig3 Series/N Mg Ca K Al Fe Si Others/Na&O
Group (1) EC-IP/4 0-0.4 0.9-1.6 3.1-4.8 6.2-7.4 1.1-2.2 36.8-42.8 41.0-46.6
Group (2) K2-IP/3 0 1.2-2.1 3.9-5.6 5.3-8.3 1.3-1.6 41.1-46.0 38.4-39.3
Group (2) K-IP/7 0-0.8 1.3-5.3b 2.1-4.0 3.8-10.0 1.1-3.1
a 36.2-44.5 37.1-48.8
Group (3a) K-IP/5 0-1.0 1.7-2.6 2.1-4.5 6.5-8.7 1.5-2.6 35.5-46.4 35.1-41.0
Group (3a) Map/3 0.9-1.7 2.3-4.2 3.1-3.3 4.9-6.7 0.8-1.4 42.4-44.2 35.8-38.9
Group (3b) K-IP/3 0.5-1.1 1.8-3.2 2.0-5.0 6.8-9.3 2.5-4.8a 34.6-35.6 41.0-46.0
Group (4) Unknown 0.7 24.8 b 0.7 1.5 0.6 6.8 63.0
Note: a Fe was used as colouring agent.
b Calcium carbonate inclusions present in the bead.
4.2.1 Group 1 (Fig. 3)
All the black beads in this study fall into this group displaying spectra with
strong peaks around 400-410 cm-1
and 1073-1110 cm-1
(Fig. 4A, a & b), similar to
spectra reported for black EC-IP beads excavated at Mapungubwe and for black
glass samples from India [4, 5]. The strong peak between 408-415 cm-1
(Fig. 4A,
a &b) is attributed to the Fe-S chromophore, with the shoulder at ca. 350 cm-1
(Fig. 4A, b) appearing when a higher concentration of chromophore is present [4,
5]. Black beads from the Mapungubwe Oblate [4] and Zimbabwe series were also
coloured by the Fe-S chromophore, but have different Raman spectra as can be
seen in Fig. 4B (a), a spectrum recorded on a black Zimbabwe bead (classified by
Wood) from the VRL collection. Raman spectroscopy can thus effectively
distinguish between black beads from the Indo-Pacific (EC-IP and K-IP) and
Mapungubwe Oblate/Zimbabwe series. Bead D2-14-b1 was classified as a
Zimbabwe series bead based on its apparent morphology, but the Raman spectrum
places it in Group 1. It therefore rather belongs to the EC-IP or K-IP bead series.
15
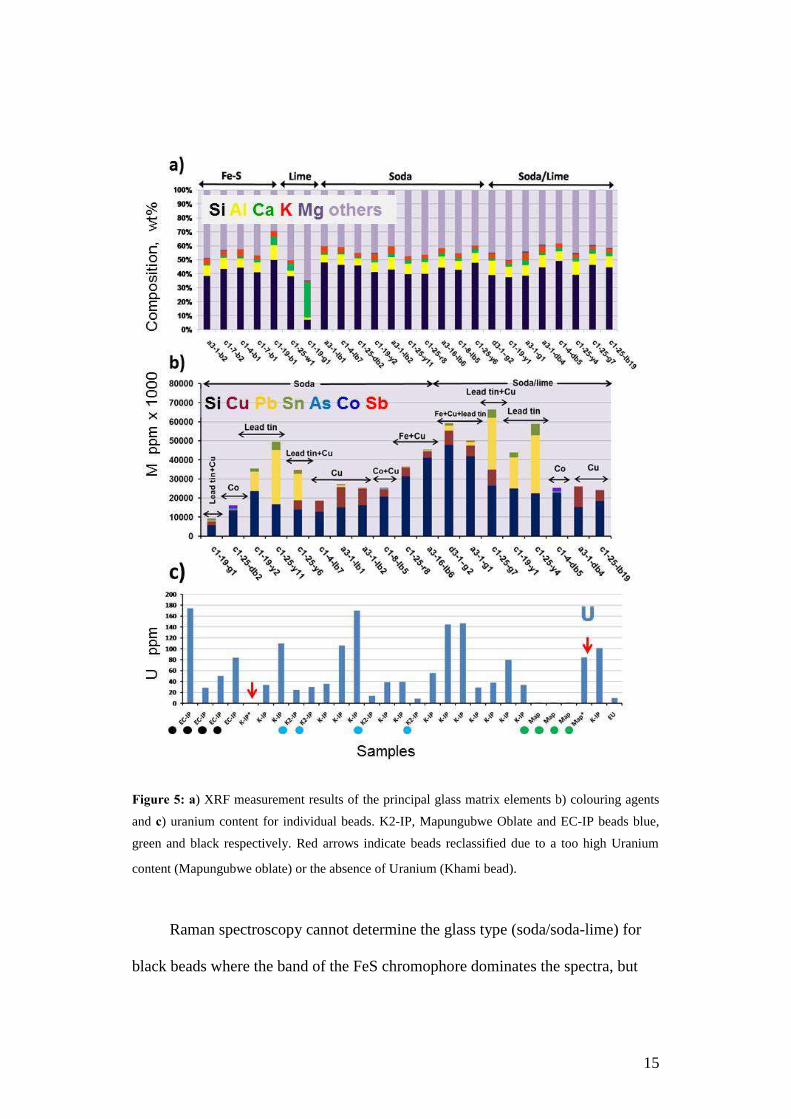
Figure 5: a) XRF measurement results of the principal glass matrix elements b) colouring agents
and c) uranium content for individual beads. K2-IP, Mapungubwe Oblate and EC-IP beads blue,
green and black respectively. Red arrows indicate beads reclassified due to a too high Uranium
content (Mapungubwe oblate) or the absence of Uranium (Khami bead).
Raman spectroscopy cannot determine the glass type (soda/soda-lime) for
black beads where the band of the FeS chromophore dominates the spectra, but
16
according to XRF measurements (Group 1,Table 2) all the black beads are made
of soda-based glass with high aluminium content (7%) and low amounts of
calcium (<1.5%) and magnesium (<0.3%). This is compatible with an Indo-
Pacific origin. Bead C1-19-b1 with higher aluminium (10%) and calcium (5.8%)
content is also consistent with an Indo-Pacific origin, but contains no uranium
(Fig. 5C) and therefore does not fit into the EC-IP and K-IP series which have a
high uranium content [3]. This bead might originate from a production site where
different raw materials were used.
Group 2 (Fig.3)
Typical for soda (Na2O) glass spectra have strong peaks around 490-500
cm-1
and 1073-1110 cm-1
[17] and two categories of spectra were identified (Fig.
4A, c, d) that differ in the shape of the stretching band. The first group (blue to
blue-green K2-IP) has a weak peak around 990 cm-1
and a strong peak around
1090 cm-1
(Fig.4A, c), which was previously reported for the K2-IP bead series
[5]. A few K-IP beads have similar spectra, indicating that the glass structure is
similar to K2-IP beads, as also noted by Robertshaw et al. [3]. The second
spectrum type (Fig. 4A, d), has two strong and broad peaks in the stretching
envelope (947 cm-1
and 1070-1090 cm-1
) and was recorded for blue-green to green
K2-IP beads, one yellow and one red K-IP bead. The increase of iron ions in a
glass matrix causes an increase in the intensity of the peak at ca. 940 cm-1
[18]. It
is suspected Fe was added to shift the blue colour (due to Cu) to green for the K2-
17
IP series and also to change the shade of the yellow and red colours of the K-IP
beads, thus increasing the intensity of this peak.
4.2.3 Group 3 (Fig. 3)
Spectra with strong peaks around ca. 540-600 cm-1
and 1060-1090 cm-1
are
typical of soda-lime (Na2O/CaO) glass. Two categories of spectra were recorded
for this group. The first type, with bending and stretching envelopes at ca. 570-
600 and 1070-1090 cm-1
respectively (Fig. 4A, e), is typical of Mapungubwe
Oblates [4, 5] and Zimbabwe series beads (see spectra of Zimbabwe series beads
from the VRL Collection in Fig. 4B, a, b). According to the Raman spectra,
Zimbabwe and Mapungubwe Oblate beads have the same basic glass structure, as
also highlighted in the study of Robertshaw et al. [3]. The same type of spectrum
was recorded for a number of beads classified morphologically as K-IP (C1-4-
db4-5; C1-25-lb12, 16, 17; C1-25-g7), as well as for one K2-IP bead (C1-8-lb8)
and one large dark green-blue European (A3-1-db4) bead. Bead C1-8-lb8 was
reclassified as a K-IP bead, as K2-IP beads are made of soda glass and do not
belong in this soda-lime glass group. With the exception of one green bead, the
colours of the beads in this group range from light blue to dark (cobalt) blue. It
should be noted that K-IP beads excavated in South Africa and Zimbabwe were
made of soda glass. The K-IP beads from elsewhere in Botswana (Bosutswe, Tora
Nju, Toutswemogala) contain high levels of magnesium and calcium, indicating
that they were made of plant-ash glass [3]. Most of the Khami beads in this study

18
were made of soda-lime glasses with low concentrations of magnesium, pointing
to the existence of another category of K-IP beads.
The second type of spectra, with bending and stretching maxima around ca.
540-560 and 1060-1080 cm-1
respectively (Fig. 4A, f), is associated with blue-
green, green and yellow beads, which are represented by Zimbabwe (D1-3-g2,
D2-14-y1) and K-IP (D3-1-g2, A3-1-g1, C1-19-y1) beads in this study. The
increase in intensity of the peak around ca. 920-940 cm-1
can be attributed to
higher levels of iron in the glass matrix. The Raman spectra of the two above-
mentioned Zimbabwe series beads, which were found at Letsibogo sites, indicate
that they belong to the K-IP series due to their higher iron content. Zimbabwe and
Mapungubwe Oblate series beads contain iron in the ordinary range [3].
The glass composition of the K-IP beads in Group 3a and b is the same except for
higher concentrations of iron which is acting as colouring agent in Group 3b
(Table 2). In the soda/lime-based glasses the difference between the Mapungubwe
Oblate/Zimbabwe and K-IP beads is related to a higher aluminium and iron
content in the latter (see Table 2). The low uranium content of Mapungubwe
Oblates (see green circled beads in Fig. 5C) and the Zimbabwe series beads
(<5ppm) in comparison to the other bead series (see Fig. 5C) can be used to
distinguish between them [3]. The uranium content of the cobalt blue
Mapungubwe Oblate classified bead C1-8-db4 is much higher uranium than the
other Mapungubwe Oblates (see Fig. 5C) and is probably an intrusion of a K-IP
series bead into the13th-century Toutswe site.
19
4.2.4 Group 4 (Fig.3)
A 17th
-century Letsibogo site yielded a pale green opaque K-IP bead (C1-
19-g1) with a unique spectrum indicating a considerable amount of calcite
(characteristic peaks at 1080 cm-1
and 274 cm-1
) and a strong peak at 983 cm-1
usually attributed to lead-containing glass (Fig.4A, g).The strong peak at ca. 980
cm-1
shows that the glass has a depolymerised structure (similar to lead-rich glass)
[12,13] with only two oxygen bridges connecting the SiO4 tetrahedra. In this case
the high calcium content (25%) of the glass might be responsible for
depolymerising the glass structure (Table 2, Group 4 and Fig. 5A). Additional
Raman measurements on the bead showed that the bead is heterogeneous in
composition as different types of Raman spectra were recorded on different zones
(Fig. 6 bottom). Spectra of zones 1 and 2 are typical of soda-lime glass, while for
zone 3 a spectrum similar to Fig. 4A, g, with the stretching envelope at 988 cm-1
and the peaks of calcite very prominent. Additional EDS analyses confirmed the
heterogeneous composition of this glass bead.
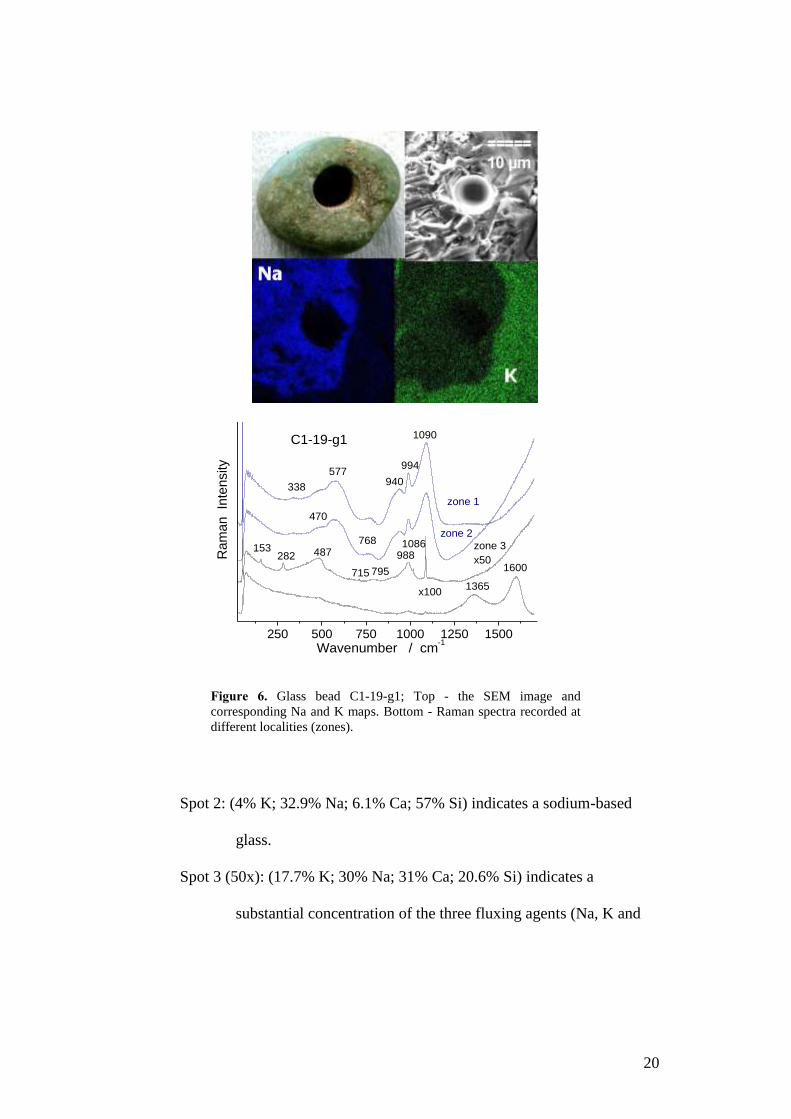
4.3 EDS measurements of the green K-IP glass bead C1-19-g1
EDS measurements on the green bead C1-19-g1 at three separate localities
(Fig. 6) show diverse ratios for some principal glass elements (K/Na/Ca/Si),
namely:
Spot 1: (15% K; 6.6% Na; 5.8% Ca; 72.6% Si) points to a potassium glass
(Raman spectra of zones 1&2 in Fig. 6).
20
Figure 6. Glass bead C1-19-g1; Top - the SEM image and
corresponding Na and K maps. Bottom - Raman spectra recorded at
different localities (zones).
Spot 2: (4% K; 32.9% Na; 6.1% Ca; 57% Si) indicates a sodium-based
glass.
Spot 3 (50x): (17.7% K; 30% Na; 31% Ca; 20.6% Si) indicates a
substantial concentration of the three fluxing agents (Na, K and
250 500 750 1000 1250 1500
768
470
795
988153 487
1365
1600
940
994
1086
1090
577
338
715
282
C1-19-g1
x100
zone 3
x50
zone 2
zone 1
Ram
an
Inte
nsity
Wavenumber / cm-1
21
Ca) and forms a third phase or it may be relics of the raw material
used.
Spot 4 (100x): (17.7% K; 30% Na; 31% Ca; 21.3% Si) has the same
composition as Spot 3. Spots 3 and 4 correlate with the Raman
spectrum of zone 3 in Fig. 6.
In general a high level of chlorine is also present. (This is likely a
characteristic of the raw material used.)
The SEM image (Fig.6, top right) and the corresponding soda and
potassium elemental distribution maps (Fig.6, blue and green image) show that
two distinctive glass grains were cemented by a calcium-rich interphase. This
bead therefore consists of different glass types (recycling), which were processed
again with incomplete melting as previously reported for Roman/Punic glass
beads [16]. A similar process was documented by Wood [1] for garden roller
glass beads that were locally made from recycled K2-IP series glass beads. The
origin of this bead is unknown. Glass containing a high amount of potassium is
quite rare, but typical of glass used for stained glass windows in Europe [13, 19].
In the southern African context, the only other example of a glass bead containing
such high potassium content is a large round black bead found among black beads
recovered from the grave area on Mapungubwe Hill [4]. Raman and EDS
measurements suggest that C1-19-g1 is a new variety of bead produced from
recycled glass rather than a K-IP series bead. The study also demonstrates that
analyses in which mean composition measurements are used to classify beads, or
22
where only one small spot is probed, are not very appropriate to characterise glass
beads containing a mixture of different types of glass.
4.4 Pigments and opacifiers
Two yellow pigments were detected in yellow and green beads through their
Raman spectra, namely lead tin yellow (type II) as seen in Fig. 4C (a) [20] and a
yellow/orange pigment (Fig. 4C, b). Both these pigments were also used to colour
the yellow and orange Mapungubwe Oblates [4 - 6]. It appears that between the
8th
and 16th
centuries yellow beads were coloured using the same pyrochlore
pigments and therefore cannot be diagnostic of a specific kind of bead. No
antimony was detected by the XRF measurements on the yellow beads.
Calcium carbonate (characteristic peak at 1085 cm-1
, Fig. 4C, c), detected in
the spectrum of an off-white K-IP bead (C1-25-w1), acted as pigment in the
absence of other pigments/colouring agents. XRF measurements confirm the
higher calcium content (5.3%) in comparison to other beads in the soda group
(Fig.5A).
Tin oxide (cassiterite), with a sharp strong peak at 633 cm-1
and a medium
peak at 775 cm-1
(Fig. 4C, d), was reported as opacifier in turquoise, bright green,
bright yellow and orange-coloured Mapungubwe Oblates [4] and also in
Zimbabwe series beads (Fig. 4B, d).
The presence of metallic ions cannot be detected using Raman spectroscopy
but XRF measurements showed that copper (0.5-1%) was used to colour blue-
green K2-IP and some K-IP series beads, as well as the European bead (A3-1-

23
db4) (Fig. 5B). The cobalt (dark blue) beads were coloured by cobalt (0.1-0.2
wt%) in association with arsenic (As) (~450-750 ppm). Indications are that the
ancient source of cobalt was an arsenate-bearing mineral such as erythrite
(Co3(AsO4)2) that was imported from Iran (Quansar, Kashan) [21,22], Oman and
Northern Hijaz [23].
XRF measurements show that iron in the glass was deliberately added to
alter the shade of blue towards green as blue-green beads have higher
concentrations of iron (>4%) than light blue beads (1-1.6%) (Fig. 5B).
A combination of Cu, Fe and lead tin yellow was used to colour beads from
the K-IP series (A3-1-g1 and D3-1-g2) green, while for the remaining yellow and
green beads the same mixture of Cu and lead tin yellow type (II) was used as
previously detected in the Mapungubwe Oblates (Fig. 5B).
The XRF measurements on the red K-IP bead (C1-25-r8) reveal a higher
concentration of iron (3.1 wt%), which was used as a reducing agent to form
atomic copper or cuprite (Cu2O) in the glass melt as also reported in red EC-IP
beads by Robertshaw et al. [3].
4.5 Proposed methodology to classify glass trade beads
A first approach is to classify beads according to morphological
parameters as described by Wood [2] and then select representative beads for
Raman analyses. (Fig. 7).
24
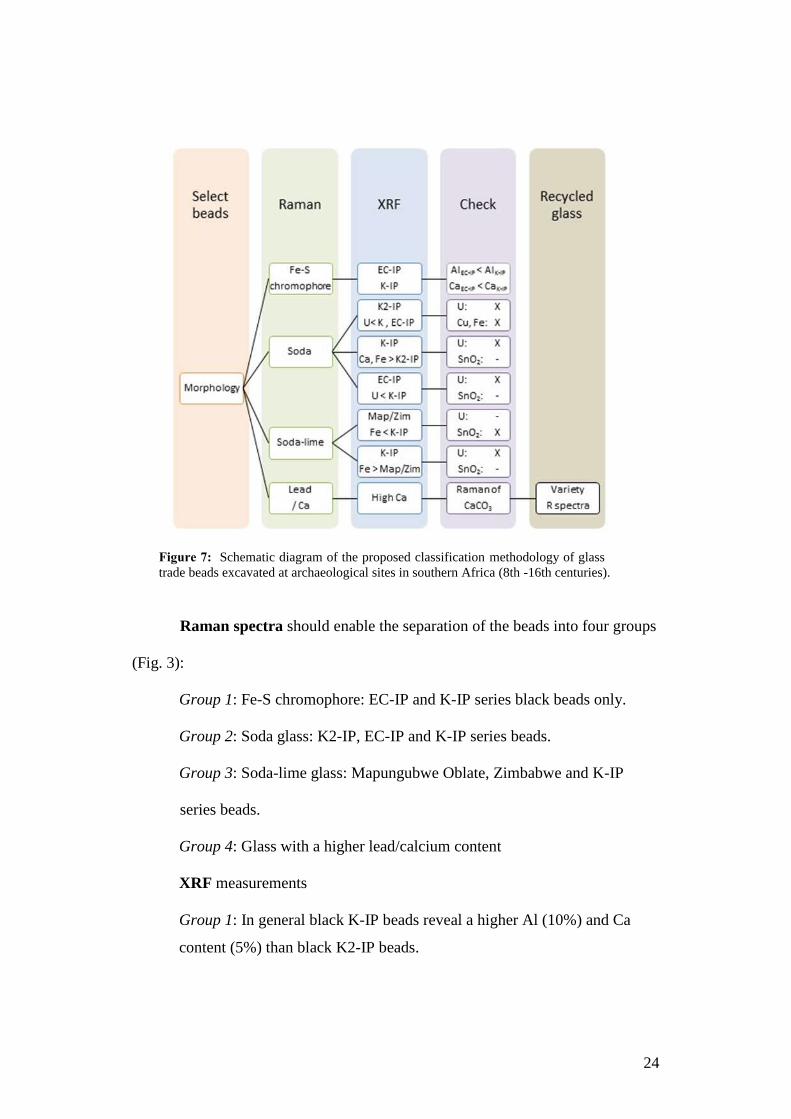
Figure 7: Schematic diagram of the proposed classification methodology of glass
trade beads excavated at archaeological sites in southern Africa (8th -16th centuries).
Raman spectra should enable the separation of the beads into four groups
(Fig. 3):
Group 1: Fe-S chromophore: EC-IP and K-IP series black beads only.
Group 2: Soda glass: K2-IP, EC-IP and K-IP series beads.
Group 3: Soda-lime glass: Mapungubwe Oblate, Zimbabwe and K-IP
series beads.
Group 4: Glass with a higher lead/calcium content
XRF measurements
Group 1: In general black K-IP beads reveal a higher Al (10%) and Ca
content (5%) than black K2-IP beads.
25
Group 2: In general K-IP beads have higher Al (10%), Ca (5%) and Fe
(3%) contents than K2-IP beads.
Group 3: Iron content of Map/Zim beads is less than in K-IP beads. SnO2
present in opaque Map and Zim beads.
Group 4: Beads with a high calcium/potassium content.
Further checkpoints
Groups 1 and 2: Uranium content of K2-IP < EC-IP/K-IP.
Group 3: Uranium content of Mapungubwe Oblate/Zimbabwe series beads
<5ppm.
Group 4: Detection of CaCO3 on nearly all spots using Raman
spectroscopy.
Recycled glass
Group 4: Confirm the use of recycled glass by Raman and EDS
measurements at multiple spots on the bead.
Conclusions
Raman and XRF measurements confirmed that the morphological
classification of the selected beads was 92% correct. Only a few beads were
reclassified based on the basic chemical composition of the glass or uranium
content (Fig. 2). In these cases the morphology of the beads is similar, although
they are chemically different. A combination of visual classification, Raman
spectroscopy and an elemental study (XRF) of the beads is a satisfactory non-
destructive method to classify beads into specific series.
The advantages of Raman spectroscopy are that by recording one spectrum
on a glass bead it is possible to distinguish between soda and soda-lime glass,
black beads from an Indo-Pacific origin can be recognised immediately and the
identification of some pigments and opacifiers can help to classify beads
26
unambiguously. We have also demonstrated that the results obtained using LA-
ICP-MS can be correlated to the results of XRF analyses using a portable
instrument eg. and that the determination of uranium content in glass is a very
useful parameter to assist in the correct classification of beads. Where the
classification of beads is dependent on the concentration of trace elements LA-
ICP-MS is a better technique to use.
An EDS study of an opaque green bead showed that it was made by
recycling different glasses with the addition of compound(s) to generate a liquid
phase to promote the sintering of the glass grains. Different Raman signatures as a
function of the sampling spot are an indication of recycled glasses, which was
confirmed by elemental mapping. This bead does not belong in any of the existing
bead series and its provenance is unknown.
The sites that we studied mostly date to one period of time and occupation,
a fact which facilitated the correct morphological identification of the beads. Our
next step will be to analyse bead assemblages from sites that are not so securely
dated and where beads imported from Europe are mixed with earlier beads.
Hopefully the guidelines established in this study will assist in differentiating
between beads imported into southern Africa before the 17th
century AD from the
East and those beads imported subsequently from Europe that in many cases were
copies of the older beads.
27
ACKNOWLEDGEMENTS
The authors wish to thank Marilee Wood for selecting bead samples from
the Van Riet Lowe bead collection, University of the Witwatersrand, for our use
as reference material. Noemi Fischbach, SettakornUpasen and ElisabettaStanzani
are acknowledged for help with some measurements. Farahnaz Koleini and Linda
C. Prinsloo acknowledge the financial contribution from the National Research
Foundation (NRF) of South Africa and Philippe Colomban from EGIDE
PROTEA. We also benefited from the insightful comments of three anonymous
reviewers.
REFERENCES
[1] M. Wood, Making connections: relationships between international trade and
glass beads from the Shashe-Limpopo Area, South African Archaeological
Society, Goodwin Series 8 (2000) 78-90.
[2] M. Wood, A glass bead sequence for Southern Africa from the 8th
to the 16th
century AD, J AfriArchaeo 9(1) (2011) 67-84.
[3] P. Robertshaw, M. Wood, E. Melchiorre, R.S. Popelka-Filcoff, M.D.
Glascock, Southern African glass beads: chemistry, glass sources and patterns of
trade, J ArchaeolSci37(8) (2010) 1898-1912.
[4] L.C. Prinsloo, Ph. Colomban, A Raman spectroscopic study of the
Mapungubwe Oblates: glass trade beads excavated at an Iron Age archaeological
site in South Africa, J Raman Spectrosc39(1) (2008) 79-90.
[5] L.C. Prinsloo, A. Tournié, Ph. Colomban, A Raman spectroscopic study of
glass trade beads excavated at Mapungubwe hill and K2, two archaeological sites
in southern Africa, raises questions about the last occupation date of the hill, J
ArchaeolSci38(12) (2011) 3264-3277.
[6] A. Tournié, L.C. Prinsloo, Ph. Colomban, Raman classification of the glass
beads excavated on Mapungubwe hill and K2, two archaeological sites in South
Africa,J Raman Spectrosc43(4) (2012) 532-542.
28
[7] L.C. Prinsloo, J.C.A.Boeyens, M.M. Van der Ryst, G. Webb., Raman
signatures of the modern pigment (Zn,Cd)S1_xSex and glass matrix of a red bead
from Magoro Hill, an archaeological site in Limpopo Province, South Africa,
recalibrate the settlement chronology,J MolStruct1023 (2012) 123-127.
[8] W.M. Biemond, The Iron Age sequence around a Limpopo river floodplain on
Basinghall Farm, Tuli Block, Botswana, during the second millennium AD, MA
dissertation in Archaeology, University of South Africa, 2014.
[9] J.R. Denbow, Iron Age economics: herding, wealth and politics along the
fringes of the Kalahari Desert during the Early Iron Age. Ph.D. thesis, Indiana
University, Bloomington, U.S.A, 1983.
[10] T.N. Huffman, Handbook to the Iron Age: the archaeology of pre-colonial
farming societies in southern Africa, Pietermaritzburg, University of KwaZulu-
Natal Press, 2007.
[11] M.C. Caggiani, Ph. Colomban, C. Valotteau, A. Mangone, P.
Cambon,Mobile Raman spectroscopy analysis of ancient enamelled glass
masterpieces,Anal Methods 5 (2013) 4345-4354.
[12] Ph.Colomban, Polymerisation degree andRaman identification of ancient
glassesused for jewellery, ceramics enamels and mosaics, J Non-Cryst Solids 323
(2003) 180-187.
[13] Ph. Colomban, A. Tournié, L. Bellot-Gurlet, Raman identification of glassy
silicates used in ceramics, glass and jewellery:a tentative differentiation guide,J
Raman Spectrosc37(8) (2006) 841-852.
[14] P. Ricciardi, P. Colomban, A. Tournié, M. Macchiarola, N. Ayed,A non-
invasive study of Roman Age mosaic glass tesserae by means of Raman
spectroscopy, J ArchaeolSci 36 (2009) 2551-2559.
[15] A. Ceglia, G. Nuyts, S. Cagno, W. Meulebroeck, K. Baert, P. Cosyns, K.
Nys, H. Thienpont, K. Janssens, H. Terryn, A XANES study of chromophores:
the case of black glass,Anal Methods6 (2014) 2662-2671.
[16] Ph. Colomban, G. March, L. Mazerolles, T. Karmous, N. Ayed, A. Ennabli,
H. Slim, Raman identification of materials used for jewellery and mosaics in
Ifriqiya, J Raman Spectrosc34(3) (2003) 205-213.
[17] P. Colomban, A. Tournié, M.C. Caggiani, C. Paris,Pigments and
enamelling/gilding technology of Mamluk mosque lamps and bottle, J Raman
Spectrosc 43 (2012) 1975-1984.
29
[18] K. Baert, W. Meulebroeck, H. Wouters, P. Cosyns, K. Nys, H. Thienpont, H.
Terryn, Using Raman spectroscopy as a tool for the detection of iron in glass, J
Raman Spectrosc 42(9) (2011) 1789-1795.
[19] A. Tournié, P. Ricciardi, Ph. Colomban, Glass corrosion mechanisms: A
multiscale analysis, Solid State Ionics 179(38) (2008) 2142–2154.
[20] I.M. Bell, R.J.H. Clark, P.J. Gibbs, Raman spectroscopic library of natural
and synthetic pigments pre- ~1850 AD,SpectrochimActa A-M 53(12) (1997)
2159-2179.
[21] Y. Porter, Shangarf et Lâzhvarddans le monde iranien, in ―Circulation des
monnaies, des marchandises et des biens‖, Res. Orientales, V, Groupe pour
l’Etude de la Civilisation du Moyen-Orient (1993) 147-157.
[22] Y. Porter, Le cobalt dans le monde iranien (IXe-XVIe siècles). Notes sur son
utilisation en céramique et son commerce,TAOCI 1 (2000) 5-14.
[23] Ph. Colomban, Rocks as blue, green and black pigments/dyes of glazed
pottery and enameled glass artefacts - A review, Eur J Mineral 25 (2013) 863–
879.
30
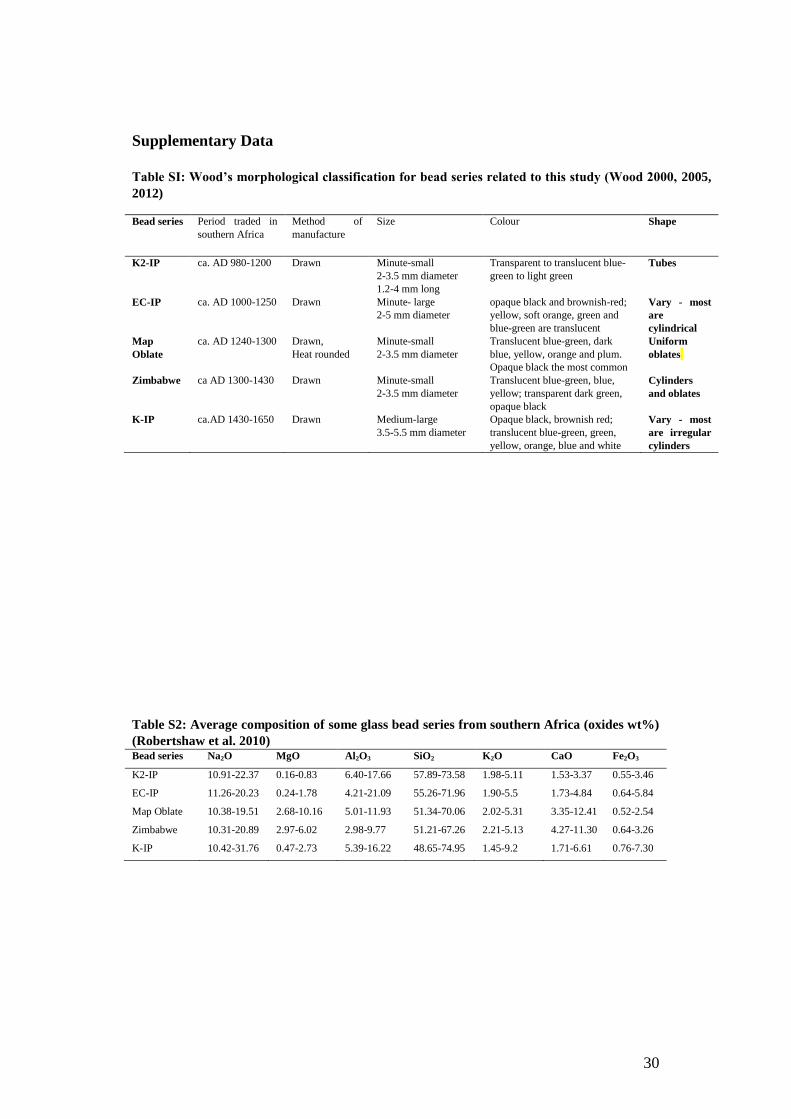
Supplementary Data
Table SI: Wood’s morphological classification for bead series related to this study (Wood 2000, 2005,
2012)
Bead series Period traded in
southern Africa
Method of
manufacture
Size Colour Shape
K2-IP ca. AD 980-1200 Drawn Minute-small
2-3.5 mm diameter
1.2-4 mm long
Transparent to translucent blue-
green to light green
Tubes
EC-IP ca. AD 1000-1250 Drawn Minute- large
2-5 mm diameter
opaque black and brownish-red;
yellow, soft orange, green and
blue-green are translucent
Vary - most
are
cylindrical
Map
Oblate
ca. AD 1240-1300 Drawn,
Heat rounded
Minute-small
2-3.5 mm diameter
Translucent blue-green, dark
blue, yellow, orange and plum.
Opaque black the most common
Uniform
oblates
Zimbabwe ca AD 1300-1430 Drawn Minute-small
2-3.5 mm diameter
Translucent blue-green, blue,
yellow; transparent dark green,
opaque black
Cylinders
and oblates
K-IP ca.AD 1430-1650 Drawn Medium-large
3.5-5.5 mm diameter
Opaque black, brownish red;
translucent blue-green, green,
yellow, orange, blue and white
Vary - most
are irregular
cylinders
Table S2: Average composition of some glass bead series from southern Africa (oxides wt%)
(Robertshaw et al. 2010)
Bead series Na2O MgO Al2O3 SiO2 K2O CaO Fe2O3
K2-IP 10.91-22.37 0.16-0.83 6.40-17.66 57.89-73.58 1.98-5.11 1.53-3.37 0.55-3.46
EC-IP 11.26-20.23 0.24-1.78 4.21-21.09 55.26-71.96 1.90-5.5 1.73-4.84 0.64-5.84
Map Oblate 10.38-19.51 2.68-10.16 5.01-11.93 51.34-70.06 2.02-5.31 3.35-12.41 0.52-2.54
Zimbabwe 10.31-20.89 2.97-6.02 2.98-9.77 51.21-67.26 2.21-5.13 4.27-11.30 0.64-3.26
K-IP 10.42-31.76 0.47-2.73 5.39-16.22 48.65-74.95 1.45-9.2 1.71-6.61 0.76-7.30