Embed Size (px)
Citation preview
Towards Real-time Customer Experience Predictionfor Telecommunication Operators
Ernesto Diaz-Aviles, Fabio Pinelli, Karol Lynch, Zubair Nabi,Yiannis Gkoufas, Eric Bouillet, and Francesco Calabrese
IBM Research – Ireland{e.diaz-aviles, fabiopin, karol_lynch, zubairn,
yiannisg, bouillet, fcalabre}@ie.ibm.com
Eoin Coughlan and Peter HollandIBM Now Factory – Ireland
{eoin.coughlan, peter.holland}@ie.ibm.com
Jason SalzwedelVodacom – South Africa
Abstract—Telecommunications operators (telcos) traditionalsources of income, voice and SMS, are shrinking due to customersusing over-the-top (OTT) applications such as WhatsApp orViber. In this challenging environment it is critical for telcosto maintain or grow their market share, by providing userswith as good an experience as possible on their network. Butthe task of extracting customer insights from the vast amountsof data collected by telcos is growing in complexity and scaleeverey day. How can we measure and predict the quality of auser’s experience on a telco network in real-time? That is theproblem that we address in this paper. We present an approachto capture, in (near) real-time, the mobile customer experience inorder to assess which conditions lead the user to place a call to atelco’s customer care center. To this end, we follow a supervisedlearning approach for prediction and train our Restricted RandomForest model using, as a proxy for bad experience, the observedcustomer transactions in the telco data feed before the user placesa call to a customer care center. We evaluate our approach usinga rich dataset provided by a major African telecommunication’scompany and a novel big data architecture for both the trainingand scoring of predictive models. Our empirical study shows oursolution to be effective at predicting user experience by inferringif a customer will place a call based on his current context.
These promising results open new possibilities for improvedcustomer service, which will help telcos to reduce churn rates andimprove customer experience, both factors that directly impacttheir revenue growth.
Keywords-Telecom operators; Customer Care; Big Data;Predictive Analytics.
I. INTRODUCTION
The number of mobile-cellular subscriptions worldwide isapproaching the number of people on earth, with the de-veloping countries accounting for over three quarters of theworld’s total [1]. We are becoming more and more dependenton our mobile phones – GPS navigation, voice and text overdata, and social media exchanges are just a few examples.We demand to be always online since our work and leisure
activities are impacted otherwise. Telcos struggle to meet thesehigh demands in a market where traditional voice or text plansare disappearing in favor of data services supporting a diverserange of mobile apps.
A clear up-to-date understanding of customer experienceand satisfaction is a key competitive advantage for telcos [2].However, telcos face the challenge of dealing with largeamounts of information generated by the mobile users everysecond. For example, mobile data traffic is forecasted to reach24.3 Exabytes per month by 2019, which corresponds to a10-fold growth from 2014 to 2019 [3]. Such large and fastmobile data makes it harder for telcos to extract customerinsights in a timely enough manner to react to potential causesof poor customer experience.
One option the operators have is to directly ask their sub-scribers using surveys but this mechanism, although reliableand widely used in the industry, is infeasible for real-timeor large scale settings. Ideally, if telcos were able to measurecustomer satisfaction at any point in time and identify potentialcauses of poor customer experience, it would be easier forthem to address such issues promptly, before they deteriorateand impact a larger number of subscribers.
In this paper, we propose an alternative approach to inferthe experience of every telco customer in (near) real-time bymining data already available to the telcom operator. Thisinformation consists of anonymized mobile phone Internetusage data associated to device location and specific appstatus (e.g., download rate, retransmitted packets, throughput)as illustrated in Figure 1.
We make the assumption that a user’s bad experience canbe inferred by looking at the network performance for heruse of specific mobile applications and services. However, itis very difficult to determine if such network performance isindeed perceived as an overall good or bad experience by the
arX
iv:1
508.
0288
4v2
[cs
.CY
] 2
4 Se
p 20
15
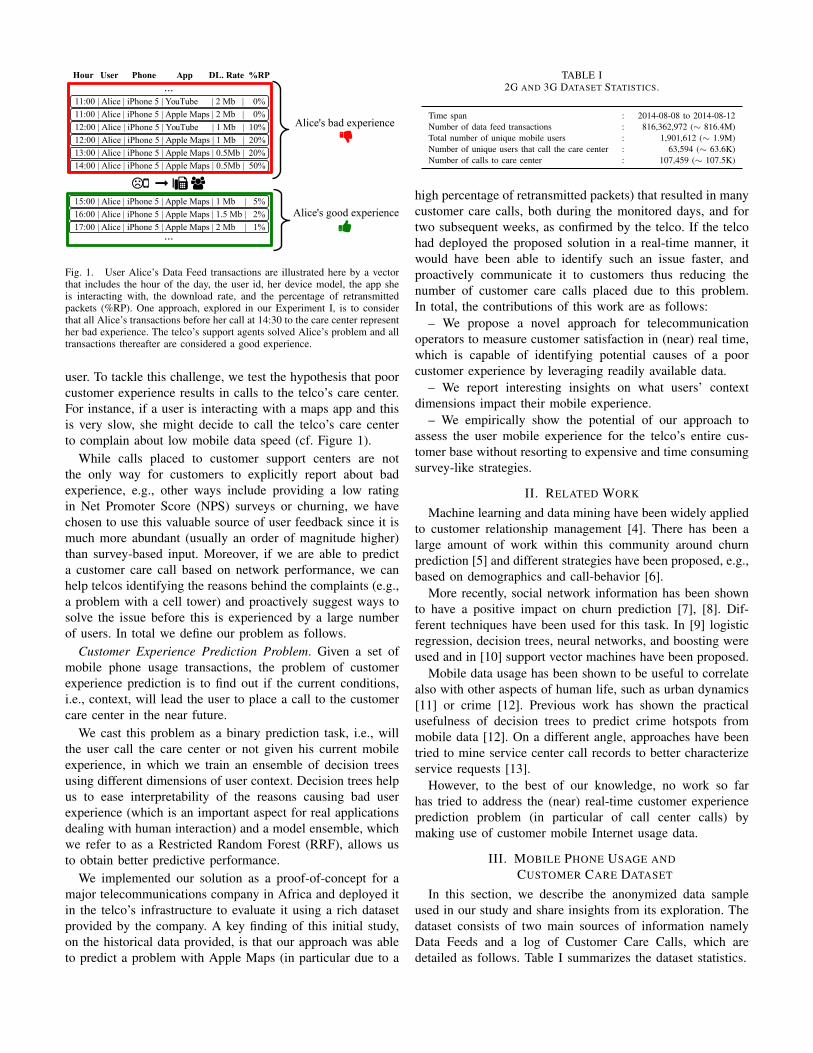
11:00 | Alice | iPhone 5 | YouTube | 2 Mb | 0%
11:00 | Alice | iPhone 5 | Apple Maps | 2 Mb | 0%
12:00 | Alice | iPhone 5 | YouTube | 1 Mb | 10%
12:00 | Alice | iPhone 5 | Apple Maps | 1 Mb | 20%
Hour User Phone App DL. Rate %RP
13:00 | Alice | iPhone 5 | Apple Maps | 0.5Mb | 20%
14:00 | Alice | iPhone 5 | Apple Maps | 0.5Mb | 50%
15:00 | Alice | iPhone 5 | Apple Maps | 1 Mb | 5%
16:00 | Alice | iPhone 5 | Apple Maps | 1.5 Mb | 2%
17:00 | Alice | iPhone 5 | Apple Maps | 2 Mb | 1% ...
...
l
Alice's bad experience
Alice's good experience
Fig. 1. User Alice’s Data Feed transactions are illustrated here by a vectorthat includes the hour of the day, the user id, her device model, the app sheis interacting with, the download rate, and the percentage of retransmittedpackets (%RP). One approach, explored in our Experiment I, is to considerthat all Alice’s transactions before her call at 14:30 to the care center representher bad experience. The telco’s support agents solved Alice’s problem and alltransactions thereafter are considered a good experience.
user. To tackle this challenge, we test the hypothesis that poorcustomer experience results in calls to the telco’s care center.For instance, if a user is interacting with a maps app and thisis very slow, she might decide to call the telco’s care centerto complain about low mobile data speed (cf. Figure 1).
While calls placed to customer support centers are notthe only way for customers to explicitly report about badexperience, e.g., other ways include providing a low ratingin Net Promoter Score (NPS) surveys or churning, we havechosen to use this valuable source of user feedback since it ismuch more abundant (usually an order of magnitude higher)than survey-based input. Moreover, if we are able to predicta customer care call based on network performance, we canhelp telcos identifying the reasons behind the complaints (e.g.,a problem with a cell tower) and proactively suggest ways tosolve the issue before this is experienced by a large numberof users. In total we define our problem as follows.
Customer Experience Prediction Problem. Given a set ofmobile phone usage transactions, the problem of customerexperience prediction is to find out if the current conditions,i.e., context, will lead the user to place a call to the customercare center in the near future.
We cast this problem as a binary prediction task, i.e., willthe user call the care center or not given his current mobileexperience, in which we train an ensemble of decision treesusing different dimensions of user context. Decision trees helpus to ease interpretability of the reasons causing bad userexperience (which is an important aspect for real applicationsdealing with human interaction) and a model ensemble, whichwe refer to as a Restricted Random Forest (RRF), allows usto obtain better predictive performance.
We implemented our solution as a proof-of-concept for amajor telecommunications company in Africa and deployed itin the telco’s infrastructure to evaluate it using a rich datasetprovided by the company. A key finding of this initial study,on the historical data provided, is that our approach was ableto predict a problem with Apple Maps (in particular due to a
TABLE I2G AND 3G DATASET STATISTICS.
Time span : 2014-08-08 to 2014-08-12Number of data feed transactions : 816,362,972 (∼ 816.4M)Total number of unique mobile users : 1,901,612 (∼ 1.9M)Number of unique users that call the care center : 63,594 (∼ 63.6K)Number of calls to care center : 107,459 (∼ 107.5K)
high percentage of retransmitted packets) that resulted in manycustomer care calls, both during the monitored days, and fortwo subsequent weeks, as confirmed by the telco. If the telcohad deployed the proposed solution in a real-time manner, itwould have been able to identify such an issue faster, andproactively communicate it to customers thus reducing thenumber of customer care calls placed due to this problem.In total, the contributions of this work are as follows:
– We propose a novel approach for telecommunicationoperators to measure customer satisfaction in (near) real time,which is capable of identifying potential causes of a poorcustomer experience by leveraging readily available data.
– We report interesting insights on what users’ contextdimensions impact their mobile experience.
– We empirically show the potential of our approach toassess the user mobile experience for the telco’s entire cus-tomer base without resorting to expensive and time consumingsurvey-like strategies.
II. RELATED WORK
Machine learning and data mining have been widely appliedto customer relationship management [4]. There has been alarge amount of work within this community around churnprediction [5] and different strategies have been proposed, e.g.,based on demographics and call-behavior [6].
More recently, social network information has been shownto have a positive impact on churn prediction [7], [8]. Dif-ferent techniques have been used for this task. In [9] logisticregression, decision trees, neural networks, and boosting wereused and in [10] support vector machines have been proposed.
Mobile data usage has been shown to be useful to correlatealso with other aspects of human life, such as urban dynamics[11] or crime [12]. Previous work has shown the practicalusefulness of decision trees to predict crime hotspots frommobile data [12]. On a different angle, approaches have beentried to mine service center call records to better characterizeservice requests [13].
However, to the best of our knowledge, no work so farhas tried to address the (near) real-time customer experienceprediction problem (in particular of call center calls) bymaking use of customer mobile Internet usage data.
III. MOBILE PHONE USAGE ANDCUSTOMER CARE DATASET
In this section, we describe the anonymized data sampleused in our study and share insights from its exploration. Thedataset consists of two main sources of information namelyData Feeds and a log of Customer Care Calls, which aredetailed as follows. Table I summarizes the dataset statistics.

(a) Download data (GB). (b) Retransmitted packets (%). (c) Callers to care center (%).
Fig. 2. Spatial distribution.
– Data Feeds. This dataset is collected in real-time usinga probe installed within the telecom operator’s infrastruc-ture. The data is aggregated on-the-fly to generate DataFeeds, which encapsulate low-level summary information us-ing customer-centric Internet measurements for different ag-gregation time periods (e.g., 1 hour in our case) and for agiven technology such as 2G, 3G or 4G [14]. An illustrativeexample of data feed is shown in Figure 1. In our use case,we have access to 2G and 3G data. Tables II and III presenta list of fields captured in the Data Feed.
– Customer Care Calls. This dataset is a log of callsreceived by the telco care center. This collection includes fieldssuch as the date and time of the call, its duration, as well asadditional fields identifying the support agent taking the calland his or her level of expertise.
Spatial distribution. Figures 2(a), 2(b), and 2(c) showthe distribution over the geographical area of analysis corre-sponding to the total download volume in GB, percentage ofretransmitted packets, and percentage of customer care callerswith respect to the total customers population, respectively.We can observe that the most congested areas, i.e., heavydownload traffic, are the ones that suffer a high percentageof retransmissions, which lead to a larger number of customercalls from these areas, a behavior that is intuitively expected.
Temporal distribution of customer care calls. In Figure 3,we report the hourly number of customer care calls. We cansee that the care center receives calls continuously also duringthe weekend (e.g., 9th and 10th of August).
Users that call the care center vs. the ones that donot call. Figures 4(a) and 4(b) show the distributions of thetotal download data volume for users that called the carecenter (callers) and the ones that did not call (no-callers),respectively. The callers’ distribution has a longer tail to higherdownload volumes indicating that they are more data intensiveusers (Figure 4(a)). Similarly, Figures 4(c) and 4(d) show thedistribution of retransmitted packets for callers and no-callers,respectively. We can highlight again the longer tail on thedistribution of the callers indicating that if users experiencea higher percentage of retransmitted packets they are morelikely to call. Finally, Figures 5(a) and 5(b) contrast the mostpopular applications and devices for callers and no-callers.
08-08-2014
09-08-2014
10-08-2014
11-08-2014
12-08-2014
Time (hour)
0
20
40
60
80
100
N. of ca
lls
Fig. 3. Temporal distribution of customer care calls (per hour).
This preliminary analysis shows that user contextual infor-mation – location, type of device, data volume, retransmittedpackets, used applications – can help discriminate users withbad experience. This insight will be used to drive the devel-opment of the prediction models in Section IV.
IV. OUR APPROACH
Based on our data exploration we observe promising cor-relations between the data available in the Data Feed and theregistered calls to the care center, which can help us with thetask at hand of predicting user experience in real-time. Tothis end, we present in this section the formalization of ourapproach, which we call Restricted Random Forest (RRF),and discuss the architecture of our deployed proof-of-conceptsolution.
A. Restricted Random Forest (RRF)We cast the problem as a binary prediction task and we use
a supervised approach to solve it, while also considering thetelco’s requirement to have an explanation of the causes of abad experience.

0 10 20 30 40 50 60 70 80Percentage of users
GoogleTalk
blackberryservices
GoogleAnalytics
HTTPS
HTTPBrowsing
HTTPGeneric
No callers
Callers
(a) Top-10 applications.
0 2 4 6 8 10 12
Percentage of users
iPhone 4S
Blackberry 9900
iPhone 5S
BlackBerry STL100-1_ Z10_ RFG81UW
Samsung GALAXY S4 GT-I9500
Blackberry 9360
BlackBerry 9720
Blackberry 9300
Blackberry 8520
Blackberry 9320
Devices
No callers
Callers
(b) Top-10 devices.
Fig. 5. Applications and Devices for callers and no-callers.
0 100 200 300 400 500 600Volume
0
20
40
60
80
100
Percentage of users
(a) Download data (MB) for callers.
0 100 200 300 400 500 600Volume
0
20
40
60
80
100
Percentage of users
(b) Download data (MB) for no-callers.
0 10 20 30 40 50 60 70 80 90 100Percentage of Retransmitted packets
0
20
40
60
80
100
Percentage of users
(c) Retransmitted packets for callers (%).
0 10 20 30 40 50 60 70 80 90 100Percentage of Retransmitted packets
0
20
40
60
80
100
Percentage of users
(d) Retransmitted packets for no-callers (%).
Fig. 4. Users that call the care center vs. the ones that do not call.
Let us denote by U the set of all mobile users in thetelecommunications network. For a given time period B anda user u ∈ U , we consider a set of N transactions observed inthe data stream of the form S = {(x1, y1), . . . , (xN , yN )}Bu .Each transaction xi is represented as a feature vector thatsummarizes the mobile user context and is associated to aclass yi that takes the value of +1 if the customer u places acall to the care center, and −1 otherwise.
The idea is to build models offline using data from the recenthistory, e.g., previous day (B = 1 day), and once learnedthe scoring (classification) of the Data Feed transactions isperformed online, which allow us to predict if a set oftransactions (user experience) will lead the customer to placea call to the care center in the immediate short horizon, e.g.,within the current day.
Our RRF solution is based on an ensemble of decisiontrees [15] for classification, which are very intuitive and easyto interpret. We learn individual decision trees T to keepinterpretability and in order to boost predictive performance
we combine them in an ensemble. Let us denote with M thenumber of decision trees in our ensemble, then the modelsare combined by majority voting and the most-voted class ispredicted:
y = fM (x) = argmaxy
M∑m=1
I(y = Tm(x; Θm)) ,
where Θm are the model parameters of tree Tm and I(a) isan indicator function that is 1 if a is true and 0 otherwise.
Our approach is clearly inspired by random forest ensem-bles [15], the main difference is that we explicitly specify thefeatures to be used in each training bag, rather than using arandom subset of features as in random forest.
Remember that one of the main requirements from the telcofor this solution was to emphasize interpretability, even at theexpense of predictive performance.
B. ArchitectureThe deployment of our solution requires a system with two
key capabilities:(1) The ability to process massive amounts (in the order ofpetabytes) of historical telco network and call center data inorder to build predictive models based on previous customerbehaviour.(2) The ability to process fast high bandwidth telco networkdata (in the order of terabytes per hour) for predicting customerbehavior based on recent experience and historical models.
In other words, our architecture requires a batch layerfor model training and a speed layer for model scoring. Inpractice, the scale of the historical data prohibits the learningof predictive models in a timely manner without employinga parallel approach. The greater relevance of recent telcoand call center data to the predictive models makes havingshort batch cycle times even more critical (i.e., the longerthe batch cycle the more outdated current models are by theend of the cycle). Thus we partition the telco data by date,and train independently on each partition, as reflected in ourevaluation (Section V). This approach to partitioning simplifiesdata ingestion and is effective when deploying models as itfacilitates the weighting of models built using newer historical

Fig. 6. System architecture for modeling and scoring telco network data.
data, over those built using older historical data, if needed.Figure 6 sketches the architecture of our solution.
It is instructive to compare the described system architecturewith systems adhering to the Lambda architecture modelfor data stores [16]. Such systems consist of three maincomponents – a batch layer, a speed layer, and a serving layer –and like our proposed system input data is fed to both thebatch layer and the speed layer. The proposed system sharesmany aspects of a Lambda architecture based system, namelythe speed layer, batch layer, and simultaneous ingestion. Thegoals of our system differ to those of a data store though,that is, our system currently has no requirement for a servinglayer for unified querying of both the batch and speed layers.Rather the batch layer exports a model directly to the speedlayer, which can be used to trigger actions based on real-timepredictions.
Infrastructure of our Solution.We now describe in more detail the subset of the overall
system used in our on-site evaluation at the telco. Thiscorresponds to the batch and speed components shown inFigure 6. We used the IBM BigInsights for Apache Hadoopproduct [17] for the batch processing middleware layer andthe IBM Infosphere Streams product for the speed processingmiddleware layer [18].
BigInsights was installed on a 4-node cluster of IBM Powersystems, and Infosphere Streams was installed on a separateIBM Power system machine. The historical telco data wasstored in HDFS1 on the BigInsights cluster and a component ofBigInsights called Big R (a middleware layer for distributing Rcode) was used for off-line model building. Infosphere Streamswas used for real-time scoring of live telco data2 by deployingthe models built using Big R. BigInsights models were sharedwith Infosphere Streams by generating a PMML3 version of
1HDFS: Hadoop Distributed File System2For the purposes of our evaluation we read the stored telco data from disk
rather than live from the telco network.3PMML: Predictive Model Markup Language
the model and persisting it within HDFS.
V. EMPIRICAL EVALUATION
As discussed earlier, it is very difficult to determine whatis a good or bad user experience at every single moment ofthe day and without asking the users for direct feedback. Whatthen is the best way to infer bad experience from a time seriesof Internet usage information? To answer this question we testtwo approaches:– Approach I. Here we use the observed user transactions inthe Data Feed before the user places a call to the care centeras proxy for bad experience. We also (optimistically) assumethat the issue motivating the call is solved by the care center,so the following user activities reflect a good experience. Thuswe label each user transaction accordingly and train our modelensemble. For real-time classification, we used the ensembleto score each new transaction from the Data Feed and thenaggregate, for each user, her transactions and predicted class(will call the service center or not) in order to assess what isthe overall user experience during a given time period (e.g., 1day).– Approach II. For this approach, we assume that theissue motivating the call is the result of a perceived poorexperience in a relatively long time period. Thus, differentlyfrom Approach I, we aggregate and summarize the transactionsper user over a period of time before training the classifiers.
We conduct two experiments in this section in order toevaluate each of the aforementioned approaches. We first detailthe experimental setting common to both assessments and thenreport the results for Experiment I and Experiment II, whichrespectively explore approaches I and II. Finally, we concludethis section with a discussion of our findings.
A. Experimental SettingsWe partition the telco data using a daily temporal split. We
reserve as the test set all Data Feed transactions from the lastday in our collection, i.e., 2014-08-12, and the rest of thedata constitutes the training set.
We use precision, recall, and f1 as the metrics to assess theperformance of our approach. They are defined as follows.
precision =TP
TP + FP
recall =TP
TP + FN
f1 = 2 ∗ precision ∗ recallprecision + recall
where TP, FP, and FN are the number of true positives, falsepositives, and false negatives, respectively.
We prefer these metrics over accuracy given the unbalancednature of the problem. Note that, in our collection, only a smallpercentage of all users made a call to the service center. Thus,obtaining a high accuracy would be trivial, e.g., by predictingno calls at all to the care center.
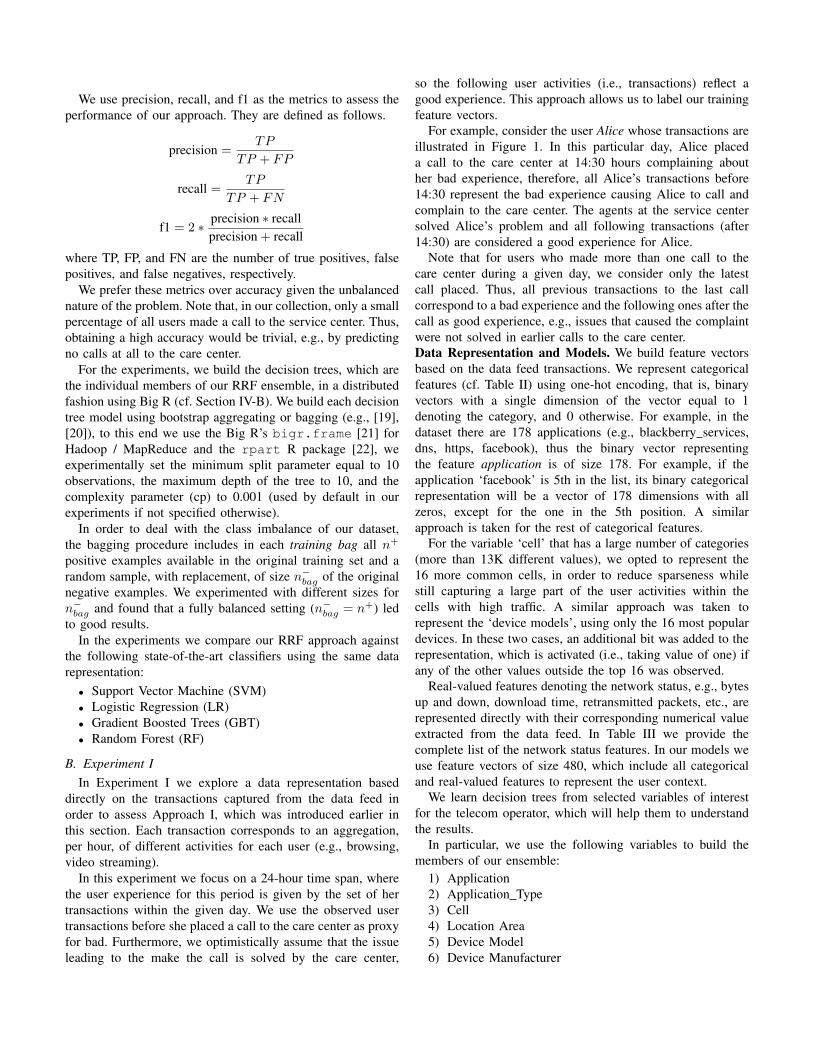
For the experiments, we build the decision trees, which arethe individual members of our RRF ensemble, in a distributedfashion using Big R (cf. Section IV-B). We build each decisiontree model using bootstrap aggregating or bagging (e.g., [19],[20]), to this end we use the Big R’s bigr.frame [21] forHadoop / MapReduce and the rpart R package [22], weexperimentally set the minimum split parameter equal to 10observations, the maximum depth of the tree to 10, and thecomplexity parameter (cp) to 0.001 (used by default in ourexperiments if not specified otherwise).
In order to deal with the class imbalance of our dataset,the bagging procedure includes in each training bag all n+
positive examples available in the original training set and arandom sample, with replacement, of size n−bag of the originalnegative examples. We experimented with different sizes forn−bag and found that a fully balanced setting (n−bag = n+) ledto good results.
In the experiments we compare our RRF approach againstthe following state-of-the-art classifiers using the same datarepresentation:
• Support Vector Machine (SVM)• Logistic Regression (LR)• Gradient Boosted Trees (GBT)• Random Forest (RF)
B. Experiment IIn Experiment I we explore a data representation based
directly on the transactions captured from the data feed inorder to assess Approach I, which was introduced earlier inthis section. Each transaction corresponds to an aggregation,per hour, of different activities for each user (e.g., browsing,video streaming).
In this experiment we focus on a 24-hour time span, wherethe user experience for this period is given by the set of hertransactions within the given day. We use the observed usertransactions before she placed a call to the care center as proxyfor bad. Furthermore, we optimistically assume that the issueleading to the make the call is solved by the care center,
so the following user activities (i.e., transactions) reflect agood experience. This approach allows us to label our trainingfeature vectors.
For example, consider the user Alice whose transactions areillustrated in Figure 1. In this particular day, Alice placeda call to the care center at 14:30 hours complaining abouther bad experience, therefore, all Alice’s transactions before14:30 represent the bad experience causing Alice to call andcomplain to the care center. The agents at the service centersolved Alice’s problem and all following transactions (after14:30) are considered a good experience for Alice.
Note that for users who made more than one call to thecare center during a given day, we consider only the latestcall placed. Thus, all previous transactions to the last callcorrespond to a bad experience and the following ones after thecall as good experience, e.g., issues that caused the complaintwere not solved in earlier calls to the care center.Data Representation and Models. We build feature vectorsbased on the data feed transactions. We represent categoricalfeatures (cf. Table II) using one-hot encoding, that is, binaryvectors with a single dimension of the vector equal to 1denoting the category, and 0 otherwise. For example, in thedataset there are 178 applications (e.g., blackberry services,dns, https, facebook), thus the binary vector representingthe feature application is of size 178. For example, if theapplication ‘facebook’ is 5th in the list, its binary categoricalrepresentation will be a vector of 178 dimensions with allzeros, except for the one in the 5th position. A similarapproach is taken for the rest of categorical features.
For the variable ‘cell’ that has a large number of categories(more than 13K different values), we opted to represent the16 more common cells, in order to reduce sparseness whilestill capturing a large part of the user activities within thecells with high traffic. A similar approach was taken torepresent the ‘device models’, using only the 16 most populardevices. In these two cases, an additional bit was added to therepresentation, which is activated (i.e., taking value of one) ifany of the other values outside the top 16 was observed.
Real-valued features denoting the network status, e.g., bytesup and down, download time, retransmitted packets, etc., arerepresented directly with their corresponding numerical valueextracted from the data feed. In Table III we provide thecomplete list of the network status features. In our models weuse feature vectors of size 480, which include all categoricaland real-valued features to represent the user context.
We learn decision trees from selected variables of interestfor the telecom operator, which will help them to understandthe results.
In particular, we use the following variables to build themembers of our ensemble:
1) Application2) Application Type3) Cell4) Location Area5) Device Model6) Device Manufacturer

TABLE IICATEGORICAL FEATURES EXTRACTED FROM DATA FEED. GPRS REFERS TO THE GENERAL PACKET RADIO SERVICE, WHICH IS A PACKET ORIENTED
MOBILE DATA SERVICE ON THE 2G AND 3G CELLULAR COMMUNICATION SYSTEM’S GLOBAL SYSTEM FOR MOBILE COMMUNICATIONS (GSM).
Feature Description
Protocol Protocol used during the transaction. Values: tcp and udp.
Application Application used during the transaction – Android Market, Apple Maps, WhatsApp, etc.
APN Access Point Name. Examples: internet, mobi, lte, etc.
SGSN In a GPRS network, SGSN handles all packet switched data within the network.
GGSN GGSN internetworks between the GPRS and external packet switched networks.
Cell Cell associated to the transaction.
Location Area location area of the transaction.
Device Manufacturer E.g.: HTC, Huawei, LG, Nokia, Samsung, Sony-Ericsson.
Device Model E.g.: HTC One, Huawei Ascend, Nexus 5, Nokia Lumia, Samsung Galaxy
QoS Quality of service category. Values: Gold, Silver, and Bronze.
RAT Radio Access Type. Values: GERAN and UTRAN.
Rule type Aggregation dimension for customer summary: video or web browsing.
TABLE IIINETWORK STATUS FEATURES EXTRACTED FROM DATA FEED.
# Description # Description1 Bytes Up 28 Minimum download TCP User Throughput2 Bytes Down 29 Upload Application User Throughput: Uploaded Bytes in each range3 Bytes Total 30 Upload Application User Throughput: Time Spent in each range4 Uplink Packets 31 Download Application User Throughput: Downloaded Bytes in each range5 Downlink Packets 32 Download Application User Throughput: Time Spent in each range6 Total Packets 33 Total Round Trip Time7 Retransmissions Up Link 34 Count of Round Trip Time8 Retransmissions Down Link 35 Total Round Trip Time (Smoothed)9 Retransmissions Total 36 Count of Round Trip Time (Smoothed)10 Server Setup Time 37 TCP RTT Distribution: Packets in each range11 Count of Server Setup Time 38 Maximum upload Application User Throughput12 Client Setup Time 39 Application User Throughput Bytes Up13 Count of Client Setup Time 40 Application User Throughput Active Time Up14 Time to First Byte 41 Maximum upload User Throughput15 Count of Time to First Byte 42 User Throughput Bytes Up16 Download Time 43 User Throughput Active Time Up17 Count of Download Time 44 Maximum download Application User Throughput18 Upload Time 45 Application User Throughput Bytes Down19 Count of Upload Time 46 Application User Throughput Active Time Down20 New TCP Connection Count 47 Maximum download User Throughput21 Throughput Bytes Up 48 User Throughput Bytes Down22 Throughput Upload Time 49 User Throughput Active Time Down23 Throughput Bytes Down 50 Video Time to Start Distribution: Video Count in each range24 Throughput Download Time 51 Video Playback Gap Ratio Distribution: Total Play Time in each range25 Maximum upload TCP User Throughput 52 Video Bitrate Distribution: Playback Time per Range26 Minimum upload TCP User Throughput 53 Volume of Video downloaded: Bytes per Range27 Maximum download TCP User Throughput 54 Time to First page object displayed: Count in each range– – 55 Full web page load time: Count in each range

TABLE IVMOST IMPORTANT VARIABLES FOR CLASSIFICATION
ACCORDING TO THE DECISION TREES.
Model Most Important Variables
T_Application BlackBerry services, Facebook, http (generic),Twitter, Tango, BlackBerry messenger, Androidmarket, Apple Maps, Microsoft Push NotificationService (MPNS), MSN Webmail.
T_Device_Model BlackBerry 9720, iPhone 4s, BlackBerry 9300,BlackBerry 9360, iPhone5.
T_Network_KPI Client/Server setup time, packets count (up,down, total), bytes count (up, down, total), uploadtime, new TCP connections, retransmitted packets(up, down, total), application round trip time,TCP round trip time.
7) Network KPIsFor the models corresponding to the location area we used
a complexity parameter (cp) value of cp=0.00015. For the restwe used the default setting for our experiments, i.e., cp=0.001.
For all classifiers, we set their parameters via cross valida-tion, and the corresponding values are as follows. We trainedthe SVM for 100 epochs using Stochastic Gradient Descent(SGD) with an initial learning rate η0 = 0.1 and decreased itgradually at every iteration, the regularization constant was setto λ = 0.0001. The Logistic regression model was regularizedusing a complexity constant C = 1. For the GBT and RFensembles, we used 250 and 2000 estimators, respectively,with a maximum depth of 4 for each of decision trees membersof the ensemble. We set the maximum number of features toconsider when splitting a node equal to the square root of thenumber of features in our data. Furthermore, for GBT we seta learning rate of 0.1.Results. The performance for the prediction of the overall userexperience in the testing day is shown in Figure 7(a). In orderto compute this per user aggregate, for all models as well as forthe baseline, we use majority voting on the user transactions inthe test set. That is, if the user has more transactions predictedas “call” than the ones predicted as “no-call”, then the overalluser experience for the given day is considered a bad one, anda good experience otherwise.
The baseline corresponds to a model that predicts for thetest day (2014-08-12) based on the transactions distributionof call/no-call from the previous day (2014-08-11). Moreprecisely, for each transaction in the test set, we predict ifit will lead to a call or not to the care center by tossing abiased coin with 13% probability of labeling as positive (call)and 0.87% otherwise.
Table IV lists the most important variables reportedby the T_Application, T_Device_Model, andT_Network_KPI decision trees, built from the Application,Device Model, and Network KPIs variables, respectively.
C. Experiment IIHere we explore a different approach to characterize the
bad experiences of users w.r.t. the approach described in
TABLE VFEATURES PER APPLICATION FOR EXPERIMENT II.
Feature
1 Total bytes downloaded in the last 24 hours.
2 Hourly average number of retransmitted packets.
3 Max. time needed by the user to receive the first byte froman application in the last 24 hours.
4 Min. download time experienced by the user in the last 24hours.
5 Min. upload time experienced by the user in the last 24 hours.
6 Min. hourly averaged Round Trip Time in the last 24 hours.
7 Min. hourly averaged upload throughput.
8 Min. hourly averaged download throughput.
9 Hourly averaged customer experience score (CES), a metricheuristically computed by the telco based on the networkstatus.
Experiment I.We assume that the level of service was poor in the latest
24 hours in which the user made a call. Instead of focusing oneach single transaction, we provide a summary per applicationof the user experience in the last 24 hours.
For example, considering Alice’s (unlabeled) transactionsin Figure 1, the corresponding summaries for YouTube andAppleMaps, could look as follows, both labeled as bad expe-rience, since Alice called the service center that day:
24h SUMMARY | Alice | iPhone 5 | Apple Maps | 1.2 Mb | 14%
24h SUMMARY | Alice | iPhone 5 | YouTube | 1.5 Mb | 5%
Data Representation and Models. We build the summariesof user mobile activity considering the most visited cell, thedevice used, and aggregated network-related features or keyperformance indicators (KPIs) for the top 10 applications interms of downloaded bytes across all the users.
We decided to consider only those applications since theyrepresent the ones with more interactions with the networkand the ones that might have higher expectations for theusers. Therefore if a poor Quality-of-Service affects theseapplications is more likely that a user complains about thenetwork in general.
The top 10 applications are: HTTP, BlackBerry services,Facebook, Google, Apple Maps, YouTube, Android Market,SSLv3, Twitter, WhatsApp, which correspond to the dimen-sions for the feature vectors for Experiment II.
For each of these applications we use the features describedin Table V to compute the aggregated KPIs.
Regarding the most visited cell for a subscriber, this repre-sents the cell where the user spent most “active” time. We donot report all the cells, but we label as “other cell” the set ofcells with less than 7 users, since the mean for the antennadistribution is 6.8. We consider 751 distinct locations in total.
A similar approach has been used for the Device Modelfeature, where we use a dummy field, “other device”, for all

precision recall f1
0.0
0.2
0.4
0.6
0.8
1.0
BaselineSVMLRGBTRFRRF
(a) Experiment I
precision recall f1
0.0
0.2
0.4
0.6
0.8
1.0
BaselineSVMLRGBTRFRRF
(b) Experiment II
Fig. 7. User-based predictive performance.
devices used by less than 5 users, which corresponds to themedian of the device distribution. We consider 193 differentdevices. We use the median instead of the mean to select thecut-off point in this case, because the device distribution ismuch more skewed than the cell’s one.
For instance, considering the Apple Maps application, weaggregate all the downloaded bytes for a specific user in thelast 24 hours. Note that this feature set takes into account anheuristic computed by the telco, named Customer ExperienceScore – CES, that corresponds to predefined quality thresholdsof user network variables. For instance, if the minimumdownload throughput is high, the CES is consider to be poor.
In total, for each user we aggregate her experience at thedaily level, and we label this summary as positive or negativebased on whether she made a customer care call in that dayor not.
In Experiment II we trained the SVM for 1000 epochs alsousing SGD. The initial learning rate was set to η0 = 0.001and the regularization constant to λ = 0.01. For the rest ofthe classifiers, we found that the same parametrization used forExperiment I yielded the best results during cross validation.
Results. The baseline is computed as follows. We consider theratio of positive and negative samples in the day before theevaluation (2014-08-11). For each user in the test day (2014-08-12), we predict based on this ratio whether she will callor not the care center by tossing a biased coin with 25.77%probability of labeling as positive (call) and 74.23% labelingas negative (no call).
The results are shown in Figure 7(b). Considering the f1score, our RRF approach achieves the best f1 score, ourensemble improves roughly 59% the results obtained withthe baseline model. Random Forest (RF) delivers the bestprecision against all models at the expense of recall.
Poor CES > 5%
Total Bytes > 4K
Yes No
Yes
Total Bytes < 150KYes
No
Max (time to first byte) > 282sYes
Retransmitted bytes > 25%
Yes
No
Min (Down Throughput) > 1.2
Yes
No
Max (time to first byte) > 391s
Yes
Fig. 8. Model built using aggregated KPIs computed for a subset of theapplications.
D. Analysis and Discussion
From the results of Experiment I and II (cf. Figure 7) wecan observe that our RRF model ensembles achieve an f1 scoreimprovement of roughly 85% and 57% over the baseline usingApproach 1 and 2, respectively. RRF also compares favorablyagainst the state-of-the-art classifiers in both experiments.
Approach 1 is simpler to implement since it works at theData Feed transaction level. Thus the predictions are computedin real-time directly for the user transactions observed in theData Feed. The overall user experience, at any given point intime, can be computed by aggregating the predictions collecteduntil that moment on a per user basis, e.g., by majority votingas we did in Experiment I. In addition, the trees generatedby this approach provide useful information on the relevanceof the individual variables for classification (cf. Table IV),which can be used to support telco’s insights on the mostimportant dimensions, e.g., applications, mobile devices, ornetwork KPIs, that impact the user experience.
For real-time prediction under Approach II we first need

to aggregate and summarize transactions per user, and thenkeep an up-to-date version of this user profile. Then, theseprofiles can be used to assess the user experience at anytime. Models learned using Approach II can easily associateproblems related to specific applications. For instance, theApple Maps retransmission rate, which corresponds to a nodein the decision tree shown in Figure 8, identifies the cause of amajor issue experienced in the telco network, which triggered alarge number of customer care calls, both during the monitoreddays, and for two subsequent weeks, as confirmed by theoperator. This is a promising result indicating that if the telcohad deployed the proposed solution in a real-time manner,it would have been able to identify such an issue before anavalanche of calls are placed to the care center.
In future work we plan to explore a hybrid strategy thatunifies our two approaches, in which predictions for userexperience will be made simultaneously and combined in realtime. This strategy would leverage the advantages of eachapproach at capturing the user experience for short (transactionlevel) and long terms (user profile) simultaneously, as well aspreserving the interpretability of the models.
The low precision of our models reflects how challengingthis task is. We are currently experimenting with other treeensemble strategies, similar to random forests [15], in orderto improve precision, e.g., by relaxing the interpretabilityconstraint. One possible direction would be to include in amodel ensemble a one-class classifier to better address theunbalance observed in our dataset, i.e., only a limited numberof users actually call the care center to report an issue. Observethat the improvements for f1 are largely thanks to recall, whichalso indicates an increase in the number of false positives. Thatis, the model falsely predicting that the user will call the carecenter. Within the proactive customer care use case the telcois still interested in exploring a sample of such false positives,since they might indicate reasons for poor experience even ifthe customer did not call the care center. We plan to explorea relevance ranking mechanism for such instances, e.g., basedon user behavior, and present the telco agents only a short listof interesting instances to examine.
We also want to explore additional features to train ourmodels and improve their performance. Temporal and seasonalfeatures such as the day of the week, month, and time of theday are important and should be considered when analyzingdata streams for longer periods than the one studied here, i.e.,5 days of data. Furthermore, modeling the quality and userperception of an app based on additional sources, such asthe user rating given in app market places or social mediaopinions, is an interesting direction to consider.
The customer care logs available to us for this study arenoisy and the reason associated with each call was eitheruncategorized or not precise enough to be modeled explicitly.This is a clear limitation of our study. However, it would bestraightforward for telcos, that have full access to these reportsand their history, to leverage this important information as partour approach.
Finally, we plan to explore in more detail the individual
aspects of user behavior to build personalized models for usersor segments of users directly from the data stream (e.g., as in[23]), an approach that we expect will be able to predict moreaccurately the mobile experience of each subscriber.
VI. CONCLUSION AND FUTURE WORK
In this paper we have presented a novel approach to estimatein near-real-time the user experience for telco customers froma rich set of mobile phone activity data and a log of customercalls to the telco’s care center.
We presented the real-world solution to tackle this problemand carried out an empirical evaluation that shows that ourapproach achieves promising results that overall show the po-tential for measuring user experience at any point in time andwithout intrusively eliciting explicit feedback from customers.
Our approach for user experience prediction can be lever-aged to improve churn forecasting models as well as toindirectly estimate network promoter scores (NPS), a metricwidely used in the telco industry to estimate future revenue.
REFERENCES
[1] “The World in 2014: ICT Facts and Figures,” International Telecommu-nication Union (ITU), Tech. Rep., 2014.
[2] A. Swinscoe, “A Story About The Benefits Of Proactive Customer Ser-vice. Forbes.” http://www.forbes.com/sites/adrianswinscoe/, (accessedonline: 2015-03).
[3] Cisco, “Visual Networking Index – Mobile Forecast Highlights,2014 – 2019,” http://www.cisco.com/c/dam/assets/sol/sp/vni/forecasthighlights mobile, (accessed online: 2015-07).
[4] E. W. Ngai, L. Xiu, and D. C. Chau, “Application of data miningtechniques in customer relationship management: A literature reviewand classification,” Expert systems with applications, 2009.
[5] S.-Y. Hung, D. C. Yen, and H.-Y. Wang, “Applying data mining totelecom churn management,” Expert Systems with Applications, 2006.
[6] C.-P. Wei and I.-T. Chiu, “Turning telecommunications call detailsto churn prediction: a data mining approach,” Expert systems withapplications, 2002.
[7] Y. Richter, E. Yom-Tov, and N. Slonim, “Predicting customer churn inmobile networks through analysis of social groups.” in SDM, 2010.
[8] M. Rowe, “Mining user lifecycles from online community platforms andtheir application to churn prediction,” in ICDM, 2013.
[9] M. C. Mozer, R. Wolniewicz, D. B. Grimes, E. Johnson, andH. Kaushansky, “Predicting subscriber dissatisfaction and improving re-tention in the wireless telecommunications industry,” IEEE Transactionson Neural Networks, 2000.
[10] Y. Zhao, B. Li, X. Li, W. Liu, and S. Ren, “Customer churn predictionusing improved one-class support vector machine,” in Advanced datamining and applications. Springer, 2005.
[11] J. Reades, F. Calabrese, A. Sevtsuk, and C. Ratti, “Cellular census:Explorations in urban data collection,” IEEE Pervasive Computing,2007.
[12] A. Bogomolov, B. Lepri, J. Staiano, N. Oliver, F. Pianesi, and A. Pent-land, “Once Upon a Crime: Towards Crime Prediction from Demograph-ics and Mobile Data,” in ICMI, 2014.
[13] P.-N. Tan, H. Blau, S. Harp, and R. Goldman, “Textual data mining ofservice center call records,” in KDD, 2000.
[14] IBM, “Now Factory,” https://ibm.biz/IBM NowFactory, (accessed on-line: 2015-07).
[15] T. J. Hastie, R. J. Tibshirani, and J. H. Friedman, The elements ofstatistical learning: data mining, inference, and prediction, ser. Springerseries in statistics, 2009.
[16] N. Marz and J. Warren, Big Data: Principles and best practices ofscalable realtime data systems. Manning Publications Co., 2015.
[17] IBM, “BigInsights for Apache Hadoop,” https://ibm.biz/IBMBigInsights, (accessed online: 2015-07).
[18] IBM, “Streams,” https://ibm.biz/IBM Streams, (accessed: 2015-07).[19] R. Polikar, “Ensemble based systems in decision making,” Circuits and
Systems Magazine, IEEE, vol. 6, no. 3, Third 2006.

[20] Z.-H. Zhou, “Ensemble learning,” in Encyclopedia of Biometrics, 2009.[21] IBM, “Big R,” https://ibm.biz/IBM BigR, (accessed online: 2015-07).[22] T. Therneau, B. Atkinson, and B. Ripley, rpart: Recursive Partitioning
and Regression Trees, 2014, version 4.1-8.[23] E. Diaz-Aviles, L. Drumond, L. Schmidt-Thieme, and W. Nejdl, “Real-
time top-n recommendation in social streams,” in RecSys, 2012.