Embed Size (px)
Citation preview
ITC-SS21/Copyright 2010 IEICE
Towards QoE Management for Scalable VideoStreaming
Thomas Zinner∗, Osama Abboud†, Oliver Hohlfeld‡, Tobias Hossfeld∗, Phuoc Tran-Gia∗
∗ University of Wuerzburg, Institute of Computer Science, Chair of Distributed Systems, Wuerzburg, GermanyeMail: [zinner|hossfeld|trangia]@informtik.uni-wuerzburg.de
†Multimedia Communications Lab, Technische Universitaet Darmstadt, GermanyeMail: [email protected]
‡ Chair Intelligent Networks, Technische Universitaet Berlin / Deutsche Telekom Laboratories, GermanyeMail: [email protected]
Abstract—Video streaming applications are a major driverfor the evolution of the future Internet. In this paper weintroduce a framework for QoE management for videostreaming systems based on H.264/SVC codec, the scalableextension of H.264/AVC. A relevant feature is to control theuser perceived quality of experience (QoE) by exploitingparameters offered by SVC. A proper design of a controlmechanisms requires the quantification of the main influenceparameters on the QoE. For this purpose, we conducted anextensive measurement study and quantified the influence ofi) video resolution, ii) scaling method, iii) network conditionsin terms of packet loss and iv) video content types on theQoE by means of the SSIM and PSNR full-reference metrics.Further, we discuss the trade-off between these differentcontrol knobs and their influence on the QoE.
I. INTRODUCTION
In Next Generation Networks (NGNs), video streamingis expected to be the killer application dominating thetraffic share worldwide. According to [1], Internet videowill account for over 60 % of all consumer Internet trafficin 2013 and will generate over 18 exabytes per month.The user will demand high-quality image resolutions thatmay require bandwidths greater than what is supported inthe current Internet architecture. Massive investments bynetwork and service providers are one pathway to copewith the emerging challenges. In this paper, we proposean alternative approach referred to as QoE managementwhich will lead to much more economic and efficient useof the available resource while improving the quality ofexperience (QoE) for end users.
In particular, QoE management includes a) the moni-toring of the current situation from the network’s and theuser’s point of view as well as b) control mechanisms todynamically adapt the video system to deliver the optimalQoE. The monitoring of the current situation aims atretrieving information about (i) the network environmentof the user, like fixed FTTH or DSL access, or wirelessWiMAX, WLAN or 3G access; (ii) the current networkconditions like available end-to-end througphut or packetloss; (iii) user related topics, like the capabilities of the end
The work has been conducted in the project G-Lab, funded by theGerman Ministry of Educations and Research (Forderkennzeichen 01BK 0800, G-Lab). The authors alone are responsible for the content ofthe paper.
frame rateimage quality
resolutionhigh
highhigh
QoE not acceptedby user
low
Provisioning ofgood QoE
Fig. 1. Acceptable area of QoE control knob settings
device (CPU power, resolution) or SLAs with the networkor service operator; (iv) service and application specificinformation, like used video codec or type of content(sports clip, music clip, news, etc.). Similar investigationsfor the mapping from QoS to QoE have been conductedfor voice and web traffic in [2], [3].
The QoE control mechanism takes into account themonitoring information and adjusts corresponding influ-ence factors. For video streaming systems, the dynamicadapation of the video quality according to the currentsituation can be smartly realized with the de facto stateof the art video codec H.264 and its scalable extension(H.264/SVC). This extension provides an integrated solu-tion for different temporal, spatial and quality scalabilitiesand a seamless switching between, e.g., different resolu-tions or frame rates. The concept enables an adoption ofthe delivered video quality to the available bandwidth. Incase of network problems like congestion, the resolution,and thereby the necessary bandwidth, could be reduced inorder to avoid packet loss and the emerging video qualitydegradation. In this context, the question occurs how theend user perceives the actual quality of the deliveredvideo. In particular, is a user more satisfied with i) alow resolution, but a smooth video playout or ii) a highresolution at the cost of quality degradations due to packetloss in the network.
Figure 1 illustrates the acceptable area of QoE controlknob settings for SVC in a spider plot. The differentaxes denote the influence of the control knob settings onthe QoE. A highly sophisticated QoE control mechanimsdetermines the optimal settings in terms of best QoE withminimal costs. The focus of the paper is the quantificationof the acceptable area, i.e. of different influence factors
64
ITC-SS21/Copyright 2010 IEICE
!"#$%&$'($
)*
!"#$+*$'($
)*
!"#$,*$'($
)*
-.$%&$'($
)*
-.$+*$'($
)*
-.$+*$'($
)*
'.$%&$'($
)*
'.$+*$'($
)*
'.$,*$'($
)*
15 Hz 30 Hz 60 Hz Temporal
Scalability
Spatial
Scalability
CIF
SD
HD
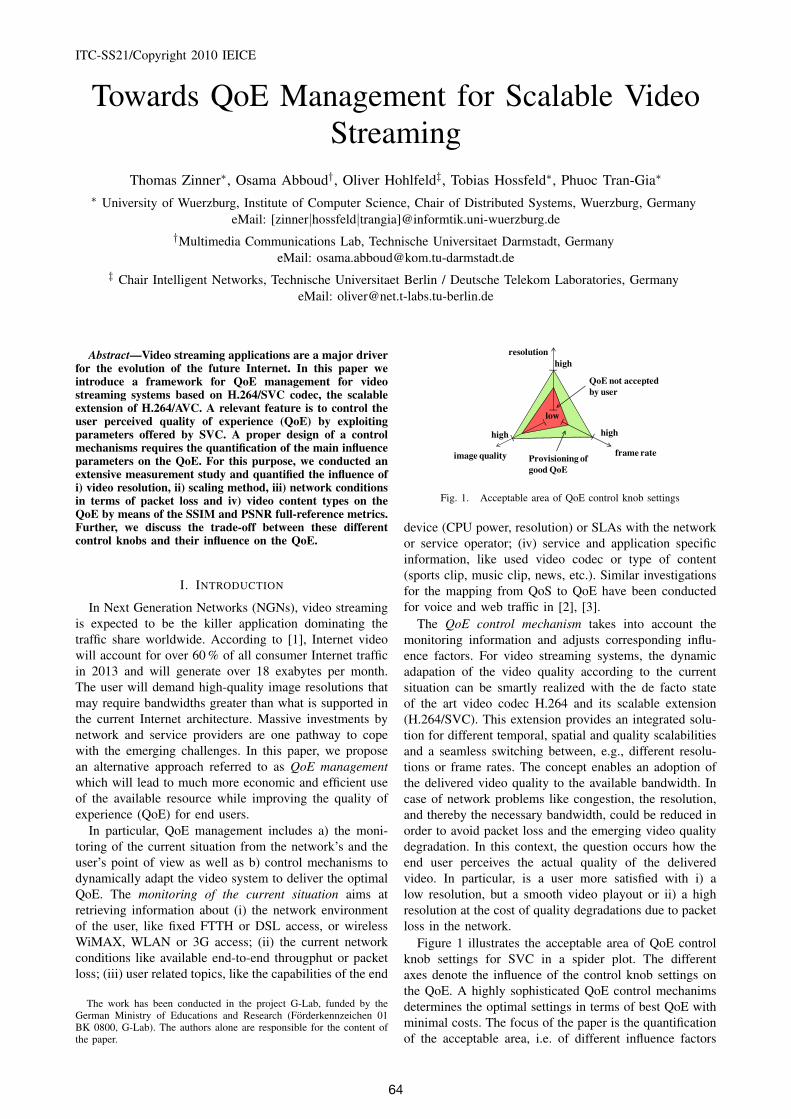
Fig. 2. SVC Cube, illustrating the possible scalability dimensions fora video file
and control knob settings on the QoE and the requiredresources (bandwidth, CPU). This is mandatory in orderto design appropriate QoE control mechanisms. We relyon objective QoE metrics like PSNR and SSIM whichallow to conduct extensive measurement studies and toderive simple relationships applicable in QoE control. Inparticular, we take a closer look at the influence of packetloss, the content type of the video and its resolution, aswell as the scaling method. The scaling method is anadditional control knob on application layer. User prefer towatch a video clip in an adequate size [4], that means, theywill scale up the video, if possible, to be displayed on fullscreen. For resizing, the various interpolation algorithmsdiffer in their computational complexity at the user deviceas well as the achieved video quality.
The main contribution of the paper is twofold. First,we conduct extensive measurement studies for the quan-tification of the QoE for different control knobs (videoresolution and scaling method), network problems (packetloss) and video content types. The measurement resultssupport results well-known from literature [4]–[6] andconfirm similar conclusions for the de facto video standardH.264. Second, we compose the investigated control knobsfor a common QoE control mechanisms. The measurementresults are a first step to define thresholds fo a highlysophisticated QoE control.
The remainder of this paper is structured as follows.Section II gives comprehensive background on scalablevideo coding and existing work which links main influencefactors of different video dimensions on the user perceivedquality. In addition, metrics for quantifying QoE are brieflyintroduced. By means of laboratory measurement studies,we quantify the influence factors on QoE which allowto design control mechanism in the QoE managementframework. The measurement methodology is discussed inSection III, while the measurement results are presentedin Section IV. Finally, Section V concludes this work andgives an outlook on future work.
II. BACKGROUND
A. Scalable Video Coding
The video codec H.264/SVC, cf. [7], [8], is based onH.264/AVC, a video codec used widely in the Internet, forinstance by video platforms (e.g., YouTube, GoogleVideo)or video streaming applications (e.g., Zattoo). H.264/AVCis a so called single-layer codec, which means that dif-ferent encoded video files are needed to to support het-erogeneous end user devices. The Scalable Video Coding
(SVC) extension of H.264/AVC enables the encoding of avideo file at different qualities within the same layeredbit stream. This includes besides different resolutionsalso different frequencies (frames displayed per second)and different qualities w.r.t. Signal-to-Noise Ratio (SNR).Different qualities can be considered as a special case ofspatial scalability with identical picture size for base andenhancement layers. These three dimensions are denotedto as spatial, temporal and quality scalability. Figure 2gives an example of different possible scalabilities fora video file. The scalable video file can be watched inthree different temporal resolutions (15Hz, 30Hz, 60Hz),three different spatial resolutions (CIF, SD, HD) and threedifferent quality resolutions (Q0, Q1, Q2). The left bottom“subcube”, CIF resolution with 15 Hz and quality Q0, isthe base layer which is necessary to play the video file.Based on this layer different enhancement layers permita better video experience with a higher resolution, betterSNR or higher frame rate, respectively. The more subcubesalong any of the three axes are available the higher thequality in this respect is. If all subcubes are availablethe video can be played back in highest quality. If allsubcubes within quality Q0 are available, the video canbe played back in HD-resolution with 60 Hz, but onlywith a low SNR. This concepts allows an adaptation of thevideo quality to the service parameters, for instance to theconnection throughput. Due to the integration of differentlayers within one video file a seamless switch betweendifferent layers is possible. Thus, the bandwidth of avideo stream may be adjusted to the network conditions.If the offered end-to-end throughput is not sufficient forplaying back the video file in maximum quality it ispossible to reduce the delivered frame rate, image qualityor resolution. Therefore the bandwidth of the video streamcan be reduced, that means the bandwidth is adopted tothe offered network quality of service parameters. Theinfluence of a bandwidth reduction on the user perceivedquality is discussed in the next subsection. In order toinvestigate the capabilities of SVC we emulated the codecbehavior with H.264/AVC. It has to be noted that weconsider UDP-based video streaming in this paper. Thus,packet loss results in artifacts or missing frames in thevideo. Transmitting the video with TCP faces a differentkind of QoE degradation, that is stalling of the video.
B. Main Influence Factors of Different Video Dimensionson the User Perceived Quality
When using a video codec like H.264, bandwidth re-duction is usually achieved by one of the following ways(i) reduce the image resolution of the video, (ii) decreasethe image quality due to higher image compression rates(larger quantization), or (iii) reduce the frame rate (fps).Recently user surveys have been conducted investigatingthe impact of these influence factors on the subjectivequality of digital video, especially in the context ofmobile environments. In [5] Buchinger et al. describedthe interconnection between the compression rate and theframe rate in mobile environments. It turns out, that, fora given resolution, users prefer a video higher imagequality, i.e. lower compression rate, and low frame rateinstead of a video with medium picture quality and high
65
ITC-SS21/Copyright 2010 IEICE
frame rate. Similar investigations have been carried out byMcCarthy et al., cf. [6]. For their experiments they showedtest videos on desktop computers and palmtops in twodifferent resolutions, 352x244 for the desktop experimentsand 176x144 for the palmtop experiments. The conductedsurveys confirm, that users tend to neglect a reductionof the frame rate, but that a decrease of picture qualityleads to dissatisfied users. Our work differs from theapproaches mentioned above, since we investigate H.264encoded video sequences with higher resolutions. Further,we use objective metrics for determining the Qualityof Experience instead of subjective ones like MOS oracceptability.
The issue how a video clip with given resolution shouldbe displayed on the screen is discussed by Knoche, cf.[4]. He discovered that the video has to be displayed atan adequate size. This includes that users prefer to resizethe video picture to the highest possible size with stilla sufficient image quality. His work does not include aninvestigation of resizing mechanisms. Usually, this is doneby the player either with simple mechanisms like nearestneighborhood interpolation or more sophistic mechanismslike cubic or bicubic polynomial interpolation. The morecomplex the resizing algorithm, the more expensive isit in terms of CPU and energy consumption. On theother hand a more complex algorithm might increase theuser perceived quality. An investigation of this issue isperformed with full reference models in Section IV-A.Yamagishi [9] discuss the influence of the coded bit rate onthe video quality. This differs from our contribution sincewe detail the different scalability mechanisms provided byH.264/SVC.
C. Quantifying Quality of Experience
Quality of Experience is defined as the subjectivelyperceived acceptability of a service [10]. The perceivedquality can be investigated in subjective tests, wherepresented stimuli—such as impaired video sequences—are rated by subjects under controlled conditions. Theobtained rating expresses the subjective Quality of Expe-rience (sQoE), typically described by the Mean OpinionScore (MOS).
However, subjective tests are time-consuming, expen-sive and have to be undertaken manually, which doesnot allow for automatic quality ratings by software. Thisaspect motivates objective metrics, which are designedto correlate with human perception, and, thus avoid costand time intensive empirical evaluations. Estimates for thequality obtained by metrics are called objective Quality ofExperience (oQoE). A more comprehensive discussion onthis subject can be found in [11].
Quality metrics can be classified into three categoriesby the required amount of reference information [12]:Full-reference (FR) metrics are based on frame-by-framecomparison between a reference video and the video tobe evaluated; No-reference (NR) metrics have to makeassumptions about the video content and distortions, e.g.by evaluating the blockiness of a frame, as a commonartifact in block-based compression algorithms such asMPEG; Reduced-reference (RR) metrics evaluate the testvideo based on a subset of features previously extracted
from the reference video. Based on the complex nature ofcognitive aspects and the human visual system, objectivequality metrics do not capture its entire complexity andfocus on aspects, which have been shown to correlatewell with human perception in subjective tests. Thus,they are biased by model limitations and limited in theirperformance.
In this paper, we focus on two full reference metrics,PSNR and SSIM, due to the availability of the unimpairedreference video in laboratory conditions. The peak signal-to-noise ratio (PSNR) [13] as a FR metric has beenfound not to correlate well with human perception [14],as it is defined as a binary comparision of images andthus neglects the complex human perception. The PSNRis appealing due to its easy computation and physicalmeaning, and, therefore often used as a reference.
In principle, the subjective judgement of video qualitydepends on factors such as content (e.g. interview, soccermatch, movie) or context (e.g. viewed on a mobile device,HDTV capable screen). Subjective tests showed a mea-sureable content dependency [15], which is not reflectedby SSIM and PSNR. However, Huynh-Thu and Ghanbari[16] argue that PSNR is a valid quality measure as longas the video content and its codec is not changed.
The Structural Similarity Index Metric (SSIM) [17]introduced by Wang et al. is motivated by the assumptionthat human visual perception is highly adapted for ex-tracting structural information. It has been shown to havea high correlation with image [17] and video quality [18].
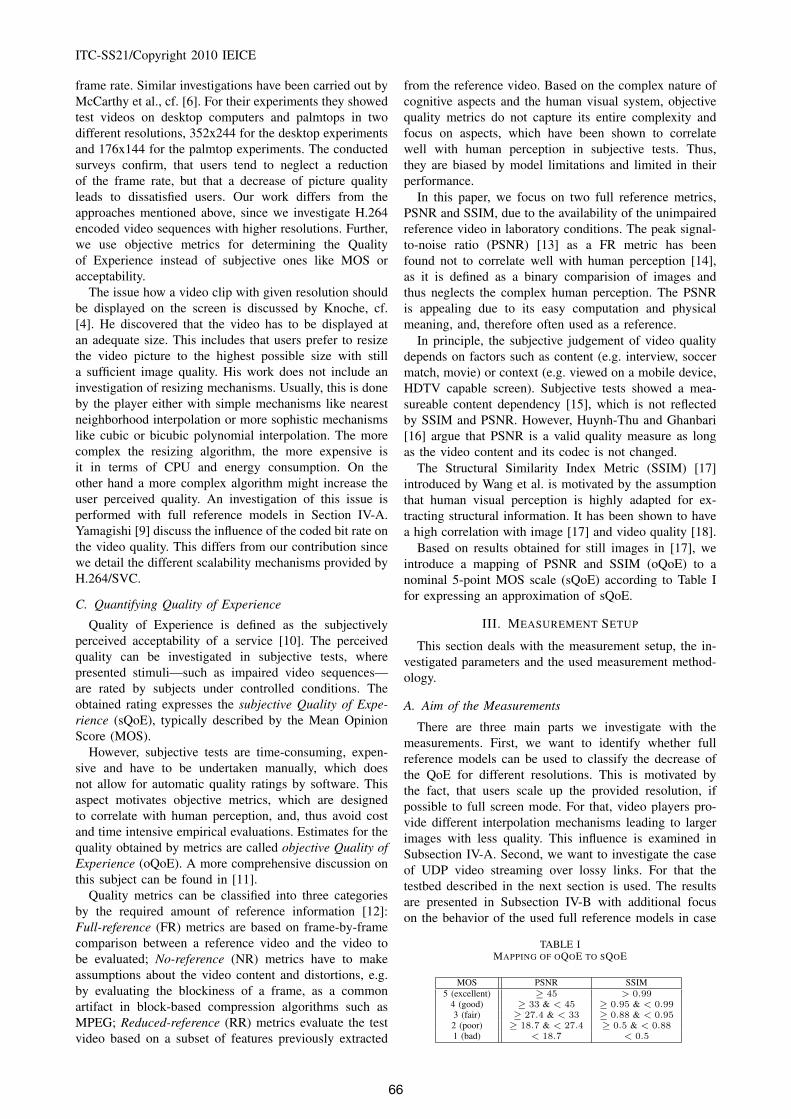
Based on results obtained for still images in [17], weintroduce a mapping of PSNR and SSIM (oQoE) to anominal 5-point MOS scale (sQoE) according to Table Ifor expressing an approximation of sQoE.
III. MEASUREMENT SETUP
This section deals with the measurement setup, the in-vestigated parameters and the used measurement method-ology.
A. Aim of the Measurements
There are three main parts we investigate with themeasurements. First, we want to identify whether fullreference models can be used to classify the decrease ofthe QoE for different resolutions. This is motivated bythe fact, that users scale up the provided resolution, ifpossible to full screen mode. For that, video players pro-vide different interpolation mechanisms leading to largerimages with less quality. This influence is examined inSubsection IV-A. Second, we want to investigate the caseof UDP video streaming over lossy links. For that thetestbed described in the next section is used. The resultsare presented in Subsection IV-B with additional focuson the behavior of the used full reference models in case
TABLE IMAPPING OF OQOE TO SQOE
MOS PSNR SSIM5 (excellent) ≥ 45 > 0.99
4 (good) ≥ 33 & < 45 ≥ 0.95 & < 0.993 (fair) ≥ 27.4 & < 33 ≥ 0.88 & < 0.952 (poor) ≥ 18.7 & < 27.4 ≥ 0.5 & < 0.881 (bad) < 18.7 < 0.5
66
ITC-SS21/Copyright 2010 IEICE
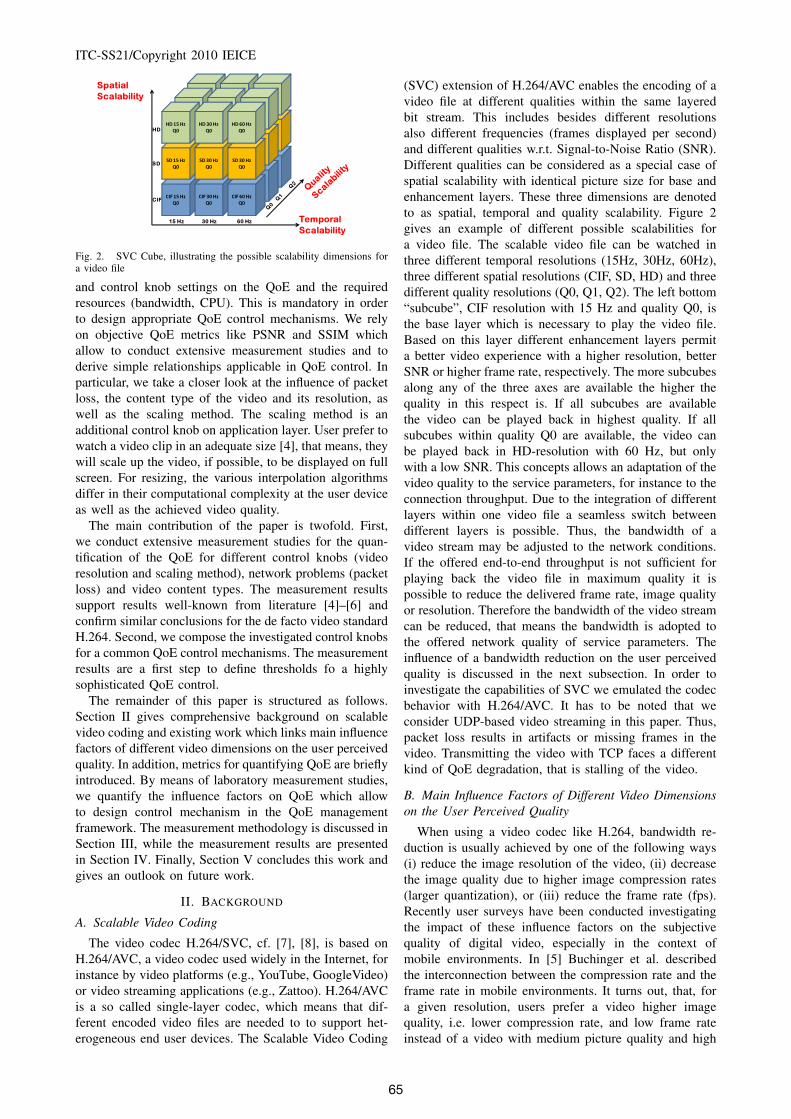
Fig. 3. Measurement Setup
of different content. The last issue we investigate is theinfluence of quality degradation in case of lossy links fordifferent resolutions. Here we want to discuss which ofthe following cases users prefer:
1) best available video with high bandwidth require-ments which is disturbed due to network congestionor
2) video in a lower resolution which is not disturbed.Results of this study are provided in Subsection IV-C.
B. Measurement Setup
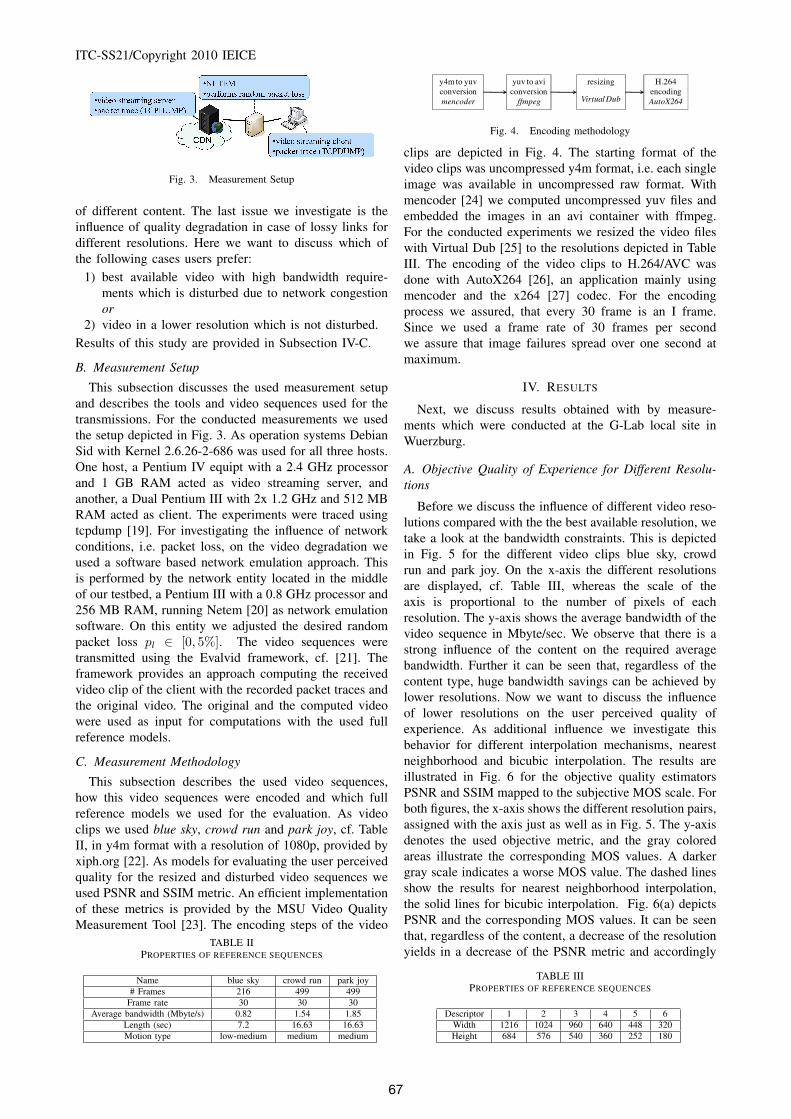
This subsection discusses the used measurement setupand describes the tools and video sequences used for thetransmissions. For the conducted measurements we usedthe setup depicted in Fig. 3. As operation systems DebianSid with Kernel 2.6.26-2-686 was used for all three hosts.One host, a Pentium IV equipt with a 2.4 GHz processorand 1 GB RAM acted as video streaming server, andanother, a Dual Pentium III with 2x 1.2 GHz and 512 MBRAM acted as client. The experiments were traced usingtcpdump [19]. For investigating the influence of networkconditions, i.e. packet loss, on the video degradation weused a software based network emulation approach. Thisis performed by the network entity located in the middleof our testbed, a Pentium III with a 0.8 GHz processor and256 MB RAM, running Netem [20] as network emulationsoftware. On this entity we adjusted the desired randompacket loss pl ∈ [0, 5%]. The video sequences weretransmitted using the Evalvid framework, cf. [21]. Theframework provides an approach computing the receivedvideo clip of the client with the recorded packet traces andthe original video. The original and the computed videowere used as input for computations with the used fullreference models.
C. Measurement Methodology
This subsection describes the used video sequences,how this video sequences were encoded and which fullreference models we used for the evaluation. As videoclips we used blue sky, crowd run and park joy, cf. TableII, in y4m format with a resolution of 1080p, provided byxiph.org [22]. As models for evaluating the user perceivedquality for the resized and disturbed video sequences weused PSNR and SSIM metric. An efficient implementationof these metrics is provided by the MSU Video QualityMeasurement Tool [23]. The encoding steps of the video
TABLE IIPROPERTIES OF REFERENCE SEQUENCES
Name blue sky crowd run park joy# Frames 216 499 499
Frame rate 30 30 30Average bandwidth (Mbyte/s) 0.82 1.54 1.85
Length (sec) 7.2 16.63 16.63Motion type low-medium medium medium
y4m to yuvconversionmencoder
yuv to aviconversion
ffmpeg
resizing
Virtual Dub
H.264 encodingAutoX264
Fig. 4. Encoding methodology
clips are depicted in Fig. 4. The starting format of thevideo clips was uncompressed y4m format, i.e. each singleimage was available in uncompressed raw format. Withmencoder [24] we computed uncompressed yuv files andembedded the images in an avi container with ffmpeg.For the conducted experiments we resized the video fileswith Virtual Dub [25] to the resolutions depicted in TableIII. The encoding of the video clips to H.264/AVC wasdone with AutoX264 [26], an application mainly usingmencoder and the x264 [27] codec. For the encodingprocess we assured, that every 30 frame is an I frame.Since we used a frame rate of 30 frames per secondwe assure that image failures spread over one second atmaximum.
IV. RESULTS
Next, we discuss results obtained with by measure-ments which were conducted at the G-Lab local site inWuerzburg.
A. Objective Quality of Experience for Different Resolu-tions
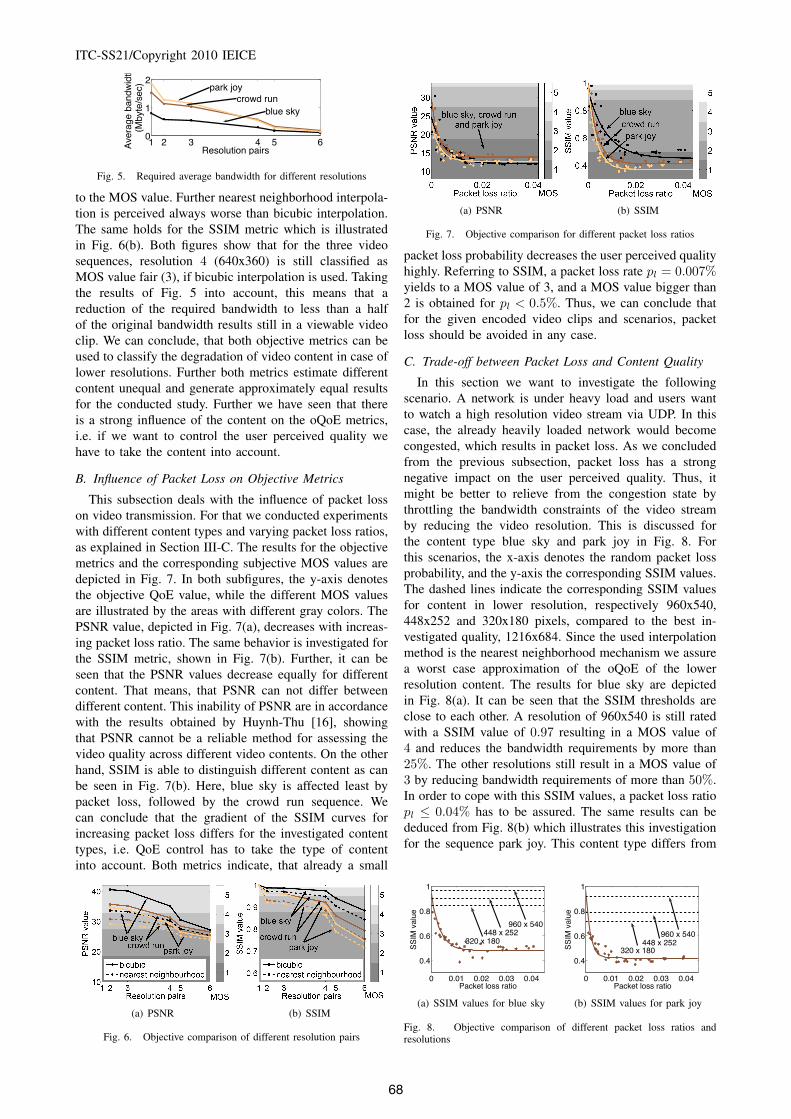
Before we discuss the influence of different video reso-lutions compared with the the best available resolution, wetake a look at the bandwidth constraints. This is depictedin Fig. 5 for the different video clips blue sky, crowdrun and park joy. On the x-axis the different resolutionsare displayed, cf. Table III, whereas the scale of theaxis is proportional to the number of pixels of eachresolution. The y-axis shows the average bandwidth of thevideo sequence in Mbyte/sec. We observe that there is astrong influence of the content on the required averagebandwidth. Further it can be seen that, regardless of thecontent type, huge bandwidth savings can be achieved bylower resolutions. Now we want to discuss the influenceof lower resolutions on the user perceived quality ofexperience. As additional influence we investigate thisbehavior for different interpolation mechanisms, nearestneighborhood and bicubic interpolation. The results areillustrated in Fig. 6 for the objective quality estimatorsPSNR and SSIM mapped to the subjective MOS scale. Forboth figures, the x-axis shows the different resolution pairs,assigned with the axis just as well as in Fig. 5. The y-axisdenotes the used objective metric, and the gray coloredareas illustrate the corresponding MOS values. A darkergray scale indicates a worse MOS value. The dashed linesshow the results for nearest neighborhood interpolation,the solid lines for bicubic interpolation. Fig. 6(a) depictsPSNR and the corresponding MOS values. It can be seenthat, regardless of the content, a decrease of the resolutionyields in a decrease of the PSNR metric and accordingly
TABLE IIIPROPERTIES OF REFERENCE SEQUENCES
Descriptor 1 2 3 4 5 6Width 1216 1024 960 640 448 320Height 684 576 540 360 252 180
67
ITC-SS21/Copyright 2010 IEICE
1 2 3 4 5 60
1
2
Resolution pairsAver
age
band
wid
th
(Mby
te/s
ec)
blue sky
park joycrowd run
Fig. 5. Required average bandwidth for different resolutions
to the MOS value. Further nearest neighborhood interpola-tion is perceived always worse than bicubic interpolation.The same holds for the SSIM metric which is illustratedin Fig. 6(b). Both figures show that for the three videosequences, resolution 4 (640x360) is still classified asMOS value fair (3), if bicubic interpolation is used. Takingthe results of Fig. 5 into account, this means that areduction of the required bandwidth to less than a halfof the original bandwidth results still in a viewable videoclip. We can conclude, that both objective metrics can beused to classify the degradation of video content in case oflower resolutions. Further both metrics estimate differentcontent unequal and generate approximately equal resultsfor the conducted study. Further we have seen that thereis a strong influence of the content on the oQoE metrics,i.e. if we want to control the user perceived quality wehave to take the content into account.
B. Influence of Packet Loss on Objective Metrics
This subsection deals with the influence of packet losson video transmission. For that we conducted experimentswith different content types and varying packet loss ratios,as explained in Section III-C. The results for the objectivemetrics and the corresponding subjective MOS values aredepicted in Fig. 7. In both subfigures, the y-axis denotesthe objective QoE value, while the different MOS valuesare illustrated by the areas with different gray colors. ThePSNR value, depicted in Fig. 7(a), decreases with increas-ing packet loss ratio. The same behavior is investigated forthe SSIM metric, shown in Fig. 7(b). Further, it can beseen that the PSNR values decrease equally for differentcontent. That means, that PSNR can not differ betweendifferent content. This inability of PSNR are in accordancewith the results obtained by Huynh-Thu [16], showingthat PSNR cannot be a reliable method for assessing thevideo quality across different video contents. On the otherhand, SSIM is able to distinguish different content as canbe seen in Fig. 7(b). Here, blue sky is affected least bypacket loss, followed by the crowd run sequence. Wecan conclude that the gradient of the SSIM curves forincreasing packet loss differs for the investigated contenttypes, i.e. QoE control has to take the type of contentinto account. Both metrics indicate, that already a small
(a) PSNR (b) SSIM
Fig. 6. Objective comparison of different resolution pairs
(a) PSNR (b) SSIM
Fig. 7. Objective comparison for different packet loss ratios
packet loss probability decreases the user perceived qualityhighly. Referring to SSIM, a packet loss rate pl = 0.007%yields to a MOS value of 3, and a MOS value bigger than2 is obtained for pl < 0.5%. Thus, we can conclude thatfor the given encoded video clips and scenarios, packetloss should be avoided in any case.
C. Trade-off between Packet Loss and Content Quality
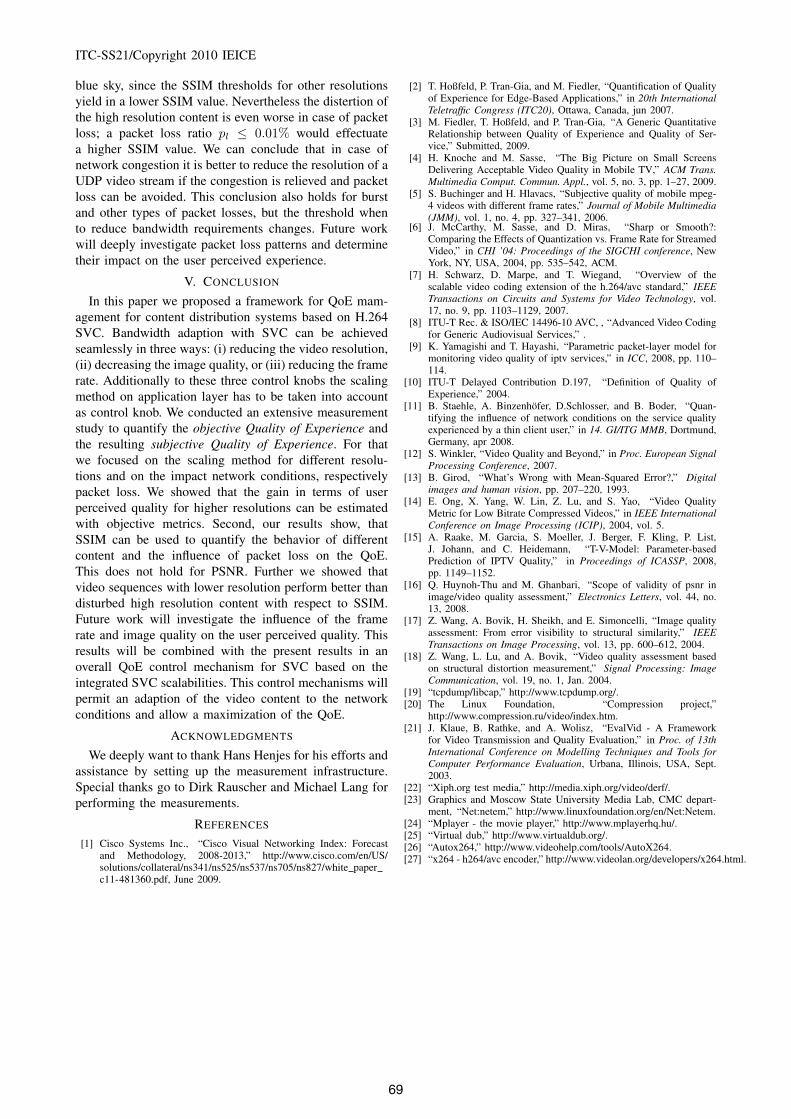
In this section we want to investigate the followingscenario. A network is under heavy load and users wantto watch a high resolution video stream via UDP. In thiscase, the already heavily loaded network would becomecongested, which results in packet loss. As we concludedfrom the previous subsection, packet loss has a strongnegative impact on the user perceived quality. Thus, itmight be better to relieve from the congestion state bythrottling the bandwidth constraints of the video streamby reducing the video resolution. This is discussed forthe content type blue sky and park joy in Fig. 8. Forthis scenarios, the x-axis denotes the random packet lossprobability, and the y-axis the corresponding SSIM values.The dashed lines indicate the corresponding SSIM valuesfor content in lower resolution, respectively 960x540,448x252 and 320x180 pixels, compared to the best in-vestigated quality, 1216x684. Since the used interpolationmethod is the nearest neighborhood mechanism we assurea worst case approximation of the oQoE of the lowerresolution content. The results for blue sky are depictedin Fig. 8(a). It can be seen that the SSIM thresholds areclose to each other. A resolution of 960x540 is still ratedwith a SSIM value of 0.97 resulting in a MOS value of4 and reduces the bandwidth requirements by more than25%. The other resolutions still result in a MOS value of3 by reducing bandwidth requirements of more than 50%.In order to cope with this SSIM values, a packet loss ratiopl ≤ 0.04% has to be assured. The same results can bededuced from Fig. 8(b) which illustrates this investigationfor the sequence park joy. This content type differs from
0 0.01 0.02 0.03 0.04
0.4
0.6
0.8
1
Packet loss ratio
SSIM
val
ue
960 x 540448 x 252
320 x 180
(a) SSIM values for blue sky
0 0.01 0.02 0.03 0.04
0.4
0.6
0.8
1
Packet loss ratio
SSIM
val
ue
960 x 540448 x 252
320 x 180
(b) SSIM values for park joy
Fig. 8. Objective comparison of different packet loss ratios andresolutions
68
ITC-SS21/Copyright 2010 IEICE
blue sky, since the SSIM thresholds for other resolutionsyield in a lower SSIM value. Nevertheless the distertion ofthe high resolution content is even worse in case of packetloss; a packet loss ratio pl ≤ 0.01% would effectuatea higher SSIM value. We can conclude that in case ofnetwork congestion it is better to reduce the resolution of aUDP video stream if the congestion is relieved and packetloss can be avoided. This conclusion also holds for burstand other types of packet losses, but the threshold whento reduce bandwidth requirements changes. Future workwill deeply investigate packet loss patterns and determinetheir impact on the user perceived experience.
V. CONCLUSION
In this paper we proposed a framework for QoE mam-agement for content distribution systems based on H.264SVC. Bandwidth adaption with SVC can be achievedseamlessly in three ways: (i) reducing the video resolution,(ii) decreasing the image quality, or (iii) reducing the framerate. Additionally to these three control knobs the scalingmethod on application layer has to be taken into accountas control knob. We conducted an extensive measurementstudy to quantify the objective Quality of Experience andthe resulting subjective Quality of Experience. For thatwe focused on the scaling method for different resolu-tions and on the impact network conditions, respectivelypacket loss. We showed that the gain in terms of userperceived quality for higher resolutions can be estimatedwith objective metrics. Second, our results show, thatSSIM can be used to quantify the behavior of differentcontent and the influence of packet loss on the QoE.This does not hold for PSNR. Further we showed thatvideo sequences with lower resolution perform better thandisturbed high resolution content with respect to SSIM.Future work will investigate the influence of the framerate and image quality on the user perceived quality. Thisresults will be combined with the present results in anoverall QoE control mechanism for SVC based on theintegrated SVC scalabilities. This control mechanisms willpermit an adaption of the video content to the networkconditions and allow a maximization of the QoE.
ACKNOWLEDGMENTS
We deeply want to thank Hans Henjes for his efforts andassistance by setting up the measurement infrastructure.Special thanks go to Dirk Rauscher and Michael Lang forperforming the measurements.
REFERENCES
[1] Cisco Systems Inc., “Cisco Visual Networking Index: Forecastand Methodology, 2008-2013,” http://www.cisco.com/en/US/solutions/collateral/ns341/ns525/ns537/ns705/ns827/white paperc11-481360.pdf, June 2009.
[2] T. Hoßfeld, P. Tran-Gia, and M. Fiedler, “Quantification of Qualityof Experience for Edge-Based Applications,” in 20th InternationalTeletraffic Congress (ITC20), Ottawa, Canada, jun 2007.
[3] M. Fiedler, T. Hoßfeld, and P. Tran-Gia, “A Generic QuantitativeRelationship between Quality of Experience and Quality of Ser-vice,” Submitted, 2009.
[4] H. Knoche and M. Sasse, “The Big Picture on Small ScreensDelivering Acceptable Video Quality in Mobile TV,” ACM Trans.Multimedia Comput. Commun. Appl., vol. 5, no. 3, pp. 1–27, 2009.
[5] S. Buchinger and H. Hlavacs, “Subjective quality of mobile mpeg-4 videos with different frame rates,” Journal of Mobile Multimedia(JMM), vol. 1, no. 4, pp. 327–341, 2006.
[6] J. McCarthy, M. Sasse, and D. Miras, “Sharp or Smooth?:Comparing the Effects of Quantization vs. Frame Rate for StreamedVideo,” in CHI ’04: Proceedings of the SIGCHI conference, NewYork, NY, USA, 2004, pp. 535–542, ACM.
[7] H. Schwarz, D. Marpe, and T. Wiegand, “Overview of thescalable video coding extension of the h.264/avc standard,” IEEETransactions on Circuits and Systems for Video Technology, vol.17, no. 9, pp. 1103–1129, 2007.
[8] ITU-T Rec. & ISO/IEC 14496-10 AVC, , “Advanced Video Codingfor Generic Audiovisual Services,” .
[9] K. Yamagishi and T. Hayashi, “Parametric packet-layer model formonitoring video quality of iptv services,” in ICC, 2008, pp. 110–114.
[10] ITU-T Delayed Contribution D.197, “Definition of Quality ofExperience,” 2004.
[11] B. Staehle, A. Binzenhofer, D.Schlosser, and B. Boder, “Quan-tifying the influence of network conditions on the service qualityexperienced by a thin client user,” in 14. GI/ITG MMB, Dortmund,Germany, apr 2008.
[12] S. Winkler, “Video Quality and Beyond,” in Proc. European SignalProcessing Conference, 2007.
[13] B. Girod, “What’s Wrong with Mean-Squared Error?,” Digitalimages and human vision, pp. 207–220, 1993.
[14] E. Ong, X. Yang, W. Lin, Z. Lu, and S. Yao, “Video QualityMetric for Low Bitrate Compressed Videos,” in IEEE InternationalConference on Image Processing (ICIP), 2004, vol. 5.
[15] A. Raake, M. Garcia, S. Moeller, J. Berger, F. Kling, P. List,J. Johann, and C. Heidemann, “T-V-Model: Parameter-basedPrediction of IPTV Quality,” in Proceedings of ICASSP, 2008,pp. 1149–1152.
[16] Q. Huynoh-Thu and M. Ghanbari, “Scope of validity of psnr inimage/video quality assessment,” Electronics Letters, vol. 44, no.13, 2008.
[17] Z. Wang, A. Bovik, H. Sheikh, and E. Simoncelli, “Image qualityassessment: From error visibility to structural similarity,” IEEETransactions on Image Processing, vol. 13, pp. 600–612, 2004.
[18] Z. Wang, L. Lu, and A. Bovik, “Video quality assessment basedon structural distortion measurement,” Signal Processing: ImageCommunication, vol. 19, no. 1, Jan. 2004.
[19] “tcpdump/libcap,” http://www.tcpdump.org/.[20] The Linux Foundation, “Compression project,”
http://www.compression.ru/video/index.htm.[21] J. Klaue, B. Rathke, and A. Wolisz, “EvalVid - A Framework
for Video Transmission and Quality Evaluation,” in Proc. of 13thInternational Conference on Modelling Techniques and Tools forComputer Performance Evaluation, Urbana, Illinois, USA, Sept.2003.
[22] “Xiph.org test media,” http://media.xiph.org/video/derf/.[23] Graphics and Moscow State University Media Lab, CMC depart-
ment, “Net:netem,” http://www.linuxfoundation.org/en/Net:Netem.[24] “Mplayer - the movie player,” http://www.mplayerhq.hu/.[25] “Virtual dub,” http://www.virtualdub.org/.[26] “Autox264,” http://www.videohelp.com/tools/AutoX264.[27] “x264 - h264/avc encoder,” http://www.videolan.org/developers/x264.html.
69