Embed Size (px)
Citation preview

175 JOURNAL OF FACADE DESIGN & ENGINEERING VOLUME 6 / NUMBER 3 / 2018
Towards New Metrics for the Characterisation of the Dynamic Performance of Adaptive Façade Systems
Lorenza Bianco1,2, †, Ylenia Cascone1, Stefano Avesani3, Pascal Vullo3, Timea Bejat2, Roel Loonen4,
Stefan Koenders4, Francesco Goia5, Valentina Serra1, Fabio Favoino1*
* corresponding author1 Politecnico di Torino, Department of Energy, Torino, Italy, [email protected] Univ Grenoble Alpes, CEA, LITEN, DTS, SBST/LCEB, INES, Grenoble, France3 Institute for Renewable Energy. Eurac Research, Bolzano, Italy 4 Eindhoven University of Technology, the Netherlands 5 Department of Architecture and Technology, Faculty of Architecture and Design, Norwegian University of Science and Technology,
NTNU, Trondheim, Norway
† This paper is dedicated to the memory of Dr. Lorenza Bianco, a bright and inspiring colleague who recently passed away.
Abstract Traditional façade characterisation metrics such as U-value and g-value are of limited value in the design process of buildings with adaptive façades. This issue is particularly important for adaptive façade components that have the capability of controlling thermal energy storage in the construction thermal mass. Building performance simulations can help to analyse the performance of buildings with adaptive façades, but such studies usually only provide information about the energy and comfort performance at room level. Consequently, there is a need for development and testing of new façade-level performance metrics that can be used to compare the performance of different adaptive façade components. This paper presents experiences and lessons learned from four European R&D projects that have introduced novel metrics to capture the dynamic performance of adaptive opaque façades. Characteristics of the different metrics are described, and their similarities and differences are compared and contrasted. The paper highlights the main benefits of metrics that can capture dynamic effects, and concludes by providing directions for future work.
Keywordsadaptive façade, double skin, adaptive insulation, performance metrics, experimental characterisation
DOI 10.7480/jfde.2018.3.2564

176 JOURNAL OF FACADE DESIGN & ENGINEERING VOLUME 6 / NUMBER 3 / 2018
1 INTRODUCTION
Adaptive façades have the ability to adjust their configuration or physical properties in response
to changes in interior and exterior boundary conditions. When this adaptation is controlled
in an effective way, such façades offer a remarkable potential for comfort improvements
and energy savings (Loonen, Trčka, Cóstola, & Hensen, 2013). Typical examples of adaptive
façades include switchable windows (Favoino, Overend, & Jin, 2015), dynamic insulation (Jin,
Favoino, & Overend, 2017) (Favoino, Jin & Overend, 2017) and movable exterior shading screens
(Fiorito et al., 2016).
During the design phase of buildings with adaptive façades, there is a need for quantitative
information about the performance of such systems (Loonen, Singaravel, Trčka, Cóstola, & Hensen,
2014). This information can support the decision-making process and the comparison with
alternative advanced and traditional façade systems. One way to obtain this information is with
the help of building performance simulations. In this way, performance can be expressed in terms
of indicators that are of direct interest to the relevant stakeholders (e.g. life-cycle costs or comfort
exceedance hours), while accounting for dynamic operational strategies of the adaptive façade
(Loonen, Favoino, Hensen, & Overend, 2017). It must be realised, however, that such simulations
require detailed inputs about the characteristics of the building, the façade system, and the way
it will be used. This type of information is generally not available in the earlier design stages.
Moreover, the availability of component models for innovative adaptive façade systems tends to be
scarce, while a high level of user expertise is required to get meaningful simulation results. As a
consequence, there is a need for simpler methods and metrics to characterise the performance of
adaptive façade components.
FIG. 1 Linear regression analysis to identify the U-value in a conventional and in a PCM glazing unit (Goia et al. 2014)

177 JOURNAL OF FACADE DESIGN & ENGINEERING VOLUME 6 / NUMBER 3 / 2018
Recent research has highlighted how conventional performance metrics, such as the U-value,
cannot be used to describe the performance of adaptive systems, as the thermophysical behaviour
is too far from the assumptions under which this metric can be measured or calculated. This
fact can be seen in Fig. 1, where a comparison between conventional glazing and PCM glazing is
shown, as far as the assessment of the in-situ U-value (Goia Perino, & Serra, 2014) is concerned.
The graphs in Fig. 1 represent the relationship between the indoor – outdoor temperature difference
(ƍout,air
- ƍout,in
) and the heat flux through the glazed component, for the glazing with an air cavity
(traditional double glazing unit with clear glass, DGU_CG) and for the PCM filled glazing (DGU_PCM).
While a conventional glazing unit (DGU_CG) can be characterised in terms of U-value, which is
quantified by the slope of the linear regression line (y=2.25x, thus U-value = 2.25 W/m2K), the inertial
effect in PCM glazing (DGU_PCM) prevents the assessment of a U-value being carried out, as it is
impossible to identify a linear relationship between temperature difference and heat flux through
the glazing (U-value).
Other studies have highlighted the importance of performance metrics for capturing the
performance of transparent ventilated façades. Di Maio and Van Paassen (2001) used, for the first
time, the concept of pre-heating efficiency (ηPH
) for transparent double skin façades using the air
cavity to pre-heat the supply ventilation air. Corgnati, Perino, and Serra (2007) developed these
concepts further, adopting the dynamic insulation efficiency (ε) for transparent double skin façades,
using the cavity air to remove solar loads transmitted through the glazing (outdoor air curtain
ventilation strategy). The common characteristics of these metrics are:
– both are developed to measure the additional amount of solar radiation either added or removed by
means of the ventilation mechanisms of the façade or room behind it;
– they are normalised with respect to the boundary conditions (temperatures, amount of solar
radiation, solar geometry etc.), so that they are, to a large extent, independent from them;
– they are based on hourly or daily data, which are averaged over a longer period;
– they are not derived from physical parameters (based on a physical model), but are derived from time
series of data (experimental or simulated), of the order of months or years.
– the thermal storage mechanisms and thermal mass is not accounted for, and these metrics are
therefore applicable only to light-weight façade components (typically transparent façades).
2 METHODOLOGY
This paper presents experiences and lessons learned from four adaptive façade R&D projects
carried out at different institutes across Europe, with particular emphasis on the identification and
application of new performance metrics for adaptive façades. The following four R&D projects are
presented: (i) the ACTive, RESponsive and Solar façade module (ACTRESS) at Politecnico di Torino; (ii)
the SMARTglass project at Politecnico di Torino; (iii) the ADAPTIWALL multi-functional lightweight
façade panel at INES CEA and EURAC, and (iv) the Active Insulation Project at TU Eindhoven.
In particular, the paper first presents specific performance metrics devised into the four different
adaptive façade projects. This is organised into four different sections (one per project) in which
a first description of the adaptive façade system is given, the definitions and characteristics of
all metrics are provided, together with the quantification of the specific metric for the related
adaptive façade system. Finally, similarities and differences between the different metrics are
contrasted, identifying their main benefits, the specific adaptive technology they refer to, and how

178 JOURNAL OF FACADE DESIGN & ENGINEERING VOLUME 6 / NUMBER 3 / 2018
they can capture the dynamic effect of the adaptive system. The paper concludes by providing
directions for future work.
3 PERFORMANCE METRICS FOR THE ACTRESS PROJECT
The ACTRESS (ACTive RESponsible and Solar) Multifunctional Façade Module (MFM) was developed
in the context of an Italian national research project (PRIN) between 2008 and 2010. It is made of
two different sub-systems: an Opaque Sub-Module (OSM) and a Transparent Sub-Module (TSM).
For the purposes of this paper, only the OSM is discussed (as the TSM metrics are not relevant
for this paper). A comprehensive description of the MFM and of its performance can be found in
Favoino, Goia, Perino, and Serra (2013) and (2016). The OSM (Fig. 2) is made up of the following
(from outside to inside):
– an external skin is formed by an amorphous silicon PV panel (aSi PV, η pv = 6%, g-value pv = 0.27);
– 120mm ventilated air cavity (floor to floor height) which can be operated in either thermal buffer,
supply air, outdoor air curtain and exhaust air modes (with natural, hybrid and mechanical
ventilation) according to the boundary conditions.
– an opaque sandwich wall composed of: a double VIP (Vacuum Insulation Panel) layer (R=10
m^2K/W); two layers of Phase Change Materials (PCMs) directly facing the indoor environment with
melting temperatures of 27 °C and 23 °C, respectively; an electric heated foil directly powered by
the aSi PV panels, in between the two PCM layers, thus allowing for active thermal energy storage
(activation of the PCM on-on-demand); an internal and external gypsum board (one facing the
ventilated cavity and one the internal environment). This system is effectively a solar LHTES (Latent
Heat Thermal Energy Storage System).
The design of the OSM aimed to minimise the heat losses and gains (by conduction and ventilation)
by means of the opaque cavity ventilation and the VIP panels, and by storing the solar energy directly
into the PCM layers to be supplied to the indoor environment when needed.

179 JOURNAL OF FACADE DESIGN & ENGINEERING VOLUME 6 / NUMBER 3 / 2018
FIG. 2 Front view of the ACTRESS prototype (left) and cross sections and energy balance of the Solar LHTES (right)
To characterise the performance of this ventilated solar LHTES, alongside with the measured
U-value of the system (of 0.1 W/m2K1, in line with the calculation from physical parameters of the
VIP, gypsum, and PCM layers), different performance metrics were used. These are presented in
the following sections: 3.1.1 and 3.1.2, which are adapted from the above mentioned metrics for
transparent façades, and 3.1.3 and 3.2.1 to .3, which are newly developed.
3.1 PERFORMANCE METRICS FOR THE VENTILATED CAVITY
3.1.1 Dynamic insulation efficiency – ε [-]
Dynamic insulation efficiency (ε [-], Corgnati et al., 2007) ε is defined as the capability of the opaque
module to reduce the entering heat fluxes (due to temperature differential and solar radiation) by
means of the façade ventilation (between 0 and 1), when operating in Outdoor Air Curtain (OAC)
mode, i.e. mainly in mid-season and summer. According to the boundary conditions of the system
considered, it can be defined for the Opaque Ventilated Cavity only (OVF) or for the whole OSM
(including the PCM). For the specific case (Fig. 3), with the low G-value of the PV layer, the summer
mechanical ventilation and the use of the PCM, the OSM is, on average (50% cumulative frequency),
adiabatic (completely eliminating the heat gains or reversing them, when ε > 1).
𝜀𝜀 = !!"#$!!"#
[-]
Equation 1
1 The measured U-value resulted from a long-term measurement (Favoino et al. 2013).

180 JOURNAL OF FACADE DESIGN & ENGINEERING VOLUME 6 / NUMBER 3 / 2018
3.1.2 Pre-heating efficiency – η PH
[-]
Pre-heating efficiency (η PH
[-], DiMaio & Van Paassen, 2001) represents the ratio between the quantity
of energy (enthalpy) in the air that flows inside the façade and the energy (enthalpy) necessary to
pre-heat the ventilation air (it has a value between 0 and 1). In the specific case (Fig. 4), during the
day (solar radiation I higher than 1), the heat losses through the air supplied to the indoor space
are halved (approx. 0.50) on average (50% cumulative frequency); when also considering night-time
operation, these heat losses are reduced only by 20%.
η−
=−
exh inletPH
out in
T TT T [-]
Equation 2
FIG. 3 Dynamic insulation efficiency of the OSM (Favoino et al. 2016)
FIG. 4 Preheating efficiency of the OSM (Favoino et al. 2016)
3.1.3 Thermal buffer efficiency – η TB
[-]
Thermal buffer efficiency (η TB
[-]) is a novel parameter (Favoino et al., 2013) similar to the so-called
adjustment factor btr defined in the ISO 13789:2007 Standard (EN ISO, 2007), used when operating
in Thermal Buffer (TB) mode, defining a reduction factor (from -1 to 1) for the heat losses due to
increased temperature of the cavity. In the specific case (Fig. 5), when adopting a thermal buffer
strategy, the heat losses by conduction of the OSM can be reduced, on average (50% cumulated
frequency) by 25% during the day (I higher than 1), or by only 5% when night-time operations
are also considered. Negative values represent higher heat losses, due to radiation, to the
night-sky during winter.
η−
=−
out cavTB
out in
T TT T
[-]
Equation 3

181 JOURNAL OF FACADE DESIGN & ENGINEERING VOLUME 6 / NUMBER 3 / 2018
FIG. 5 Thermal buffer efficiency of the OSM (Favoino et al. 2016)
FIG. 6 Efficiency of the LHTES (Favoino et al. 2016)
As far as the LHTES (e.g. PCM layers) is concerned, the analysis was carried out by analysing the
energies accumulated/transmitted through the opaque sub module, by means of a first principle
analysis of the daily energies exchanged across the solar LHTES system (QPV
, QIN
and QVIP
, as defined
in Fig. 2). Due to the dynamics of the solar LHTES, particular attention should be paid to the starting
time of the daily first principle analysis. Moreover, these are not calculated as hourly or sub-hourly
values, but as daily values, therefore longer duration testing is needed to elaborate on results in
metrics that are independent from outdoor boundary conditions.
3.2 PERFORMANCE METRICS FOR THE LATENT HEAT THERMAL ENERGY STORAGE SYSTEM
3.2.1 Utilisation factor of the solar LHTES system– η LHTES
Utilisation factor of the solar LHTES system ( η LHTES
[-]) is defined as the ratio between the energy stored
in the PCM layer and the solar energy converted by the PV panels, over a daily period. It gives
straightforward information about the fraction of converted thermal energy that is stored in the
latent energy buffer, but it does not provide any information about the fraction of the converted
energy that is actually used as a positive contribution to the room heating. In fact, only part of the
heat is released towards the indoor environment after it is stored in the PCM or directly, while the
remaining part is lost towards the ventilated air cavity of the OSM. The η LHTES
(value between 0 and 1)
measures the efficiency of storing solar converted electrical energy into the specific latent heat
thermal energy storage system, independently of its position or integration in the building.
𝜂𝜂!"#$% =!!"#$%! ∙!"! !"! !
!!"
!!"∙!"! !"!!! !"
[-]
Equation 4

182 JOURNAL OF FACADE DESIGN & ENGINEERING VOLUME 6 / NUMBER 3 / 2018
3.2.2 Utilisation factor of the usable energy of the LHTES– η LHTES-Usable
[-]
Utilisation factor of the usable energy of the LHTES (η LHTES-Usable
[-]) is defined by the ratio between the
energy delivered towards the indoor environment by the LHTES during its discharge phase and the
energy stored in the LHTES over a daily period (ini and end subscripts indicate the start and the end
of the discharge phase of the PCM in the LHTES). This efficiency describes the amount of energy that
can be delivered to the indoor environment in order to reduce space heating compared to the total
energy stored in the LHTES. The complementary part of this energy that which is lost from the
LHTES. The η LHTES-usable
measures the efficiency of integrating the latent heat storage into the building
envelope, and specifically into the OSM of the ACTRESS MFM.
η!"#$%!!"#$%& =!!"#$%! ∙!"!"#
!"!
!!"#$%! ∙!"! !"! !!!"
[-]
Equation 5
3.2.3 Utilisation factor of the OSM system– η OSM
[-]
Utilisation factor of the OSM system( η OSM
[-]) is defined as the ratio between the thermal
energy released by the LHTES towards the indoor environment over a single day, and the PV-
converted energy, over the same time interval. It measures the efficiency of delivering the solar
converted electric energy towards the indoor environment, after being stored in the designed latent
heat thermal energy storage integrated into the building envelope, for space heating purposes. This
efficiency is higher than η LHTES-Usable
as, in addition to the energy converted by the PV, it also includes
the thermal energy flowing to the LHTES from the air cavity. Meanwhile, the difference between hLHTES
and hOSM
gives a measure of the energy dissipated by the LHTES towards the air cavity.
η!"# =!!"#! ∙!!! !"! !
!"#
!!"∙!!! !"!!! !"
[-]
Equation 6
In the specific case (Fig. 6), on average (50% of cumulated frequency), on a daily basis, about 80%
of the solar energy converted by the PV is stored in the latent heat storage (η LHTES
), but only 30%
is delivered to the indoor environment, as most of the converted solar energy is lost to the air
cavity (despite the presence of the VIP insulation). This is due to the much higher temperature
differential towards the LHTES and the cavity, as compared to that between the LHTES and the
indoor environment.

183 JOURNAL OF FACADE DESIGN & ENGINEERING VOLUME 6 / NUMBER 3 / 2018
The results show that the performance on the OSM cannot be described only by standardised metrics
such as the U-value. In fact, the specific measured U-value corresponds to the calculated one,
although the heat losses and gains through conduction and convection could be much less than the
calculated ones by means of U-value, due to the different operating modes of the system. In addition
to these performance metrics, metrics that consider the daily total energy balance of the façade
system are also considered, although, for brevity, these are not presented here for the ACTRESS
project, but will be discussed in the context of the following projects.
4 PERFORMANCE METRICS IN THE SMARTGLASS PROJECT
The SMARTglass project, funded by Regione Piemonte in 2010 (Goia et al. 2014), was part of the
activities of the Cost Action 1403 Adaptive Façades Network. The experimental campaigns, which
were carried out in two phases at the TWINS outdoor test facility in Politecnico di Torino, Italy,
involved the following technologies (Fig. 7):
– DGU: a reference double glazing unit (clear glass panes) with air;
– DGU_PCM: a double glazed unit (clear glass panes) with cavity filled with PCM (paraffin wax)
– TGU : a reference low-e triple glazing unit with 90% argon;
– TGU_TT : the TGU with an adjacent thermotropic layer (switch in the optical properties in the range
28 °C to 34 °C (Bianco, Goia, Serra, & Zinzi, 2015)) on the outer side;
– TGU_TT+PCM(IN): the TGU with an adjacent thermotropic layer on the outer side and its inner cavity
filled with PCM (paraffin wax with a melting temperature range between 33 °C and 37 °C);
– TGU_TT+PCM(OUT): the TGU with an adjacent thermotropic layer on the outer side and its outer
cavity filled with the PCM.
A comprehensive description of the experimental test rig, materials, technologies and their
performance during the different phases was presented in Goia et al., (2014) (Phase 1) and Bianco,
Cascone, Goia, Perino, and Serra (2017a) and (2017b) (Phase 2).

184 JOURNAL OF FACADE DESIGN & ENGINEERING VOLUME 6 / NUMBER 3 / 2018
FIG. 7 Test cell and scheme of the SMARTglass technologies (Phase 2: Bianco et al., 2017b)
Compared to standard glazing, a PCM-based glazed unit (either double or triple pane unit) seeks
to ameliorate the indoor surface temperature’s fluctuation and reduce energy gains and losses.
Through the interaction with the incident solar radiation, the PCM layer in these systems acts as a
storage medium and as a solar shading device. When combined with a thermotropic layer (TGU_
TT+PCM), a higher degree of control over the system is intended, as the thermotropic layer acts as a
switchable shading system capable of regulating the phase change of the PCM.
In order to characterise the performance of these technologies, alongside the analysis of the hourly
profiles of various physical properties (outdoor surface temperature, heat flux, transmitted solar
irradiance, solar transmittance and visible transmittance), an equivalent solar factor was also
evaluated from the in-situ measurements, calculated from daily measurement.
A full description of the methodology to evaluate the G-value on a daily basis from non-calorimetric
measurement is given in Goia and Serra, (2018). The measurement of the equivalent G-value
adopted an innovative measurement method enabling estimates of this metric based on the daily
energy balance of the façade (Favoino et al., 2016; Bianco et al., 2017a), although a low accuracy
of this measurement was achieved in this case mainly due to the variation in diurnal behaviour
of the PCM-filled glazing systems, due to the strong influence of varying boundary conditions
(temperatures and solar radiation) (Bianco et al. 2017a).
Total daily energies and long-term total energies (for a certain number of consecutive days for each
season) were additionally analysed.

185 JOURNAL OF FACADE DESIGN & ENGINEERING VOLUME 6 / NUMBER 3 / 2018
4.1 FAÇADE ENERGY BALANCE PERFORMANCE METRICS
4.1.1 Total daily energy – E24,tot [Wh/m2]
Total daily energy (E24,tot
[Wh/m2], Bianco et al., 2017a; Goia et al., 2014) is defined as the integral over
24 hours of the total heat flux (sum of the indoor surface heat flux and of the transmitted solar
irradiance) crossing the glazing system. To remove the effect of the solar irradiation of the previous
day, the integration limits for its calculation were chosen from 07:00 to 07:00 + 1day during winter
and from 05:00 to 05:00 + 1day during summer. This metric is most suited to comparing the
performance of components that are tested under the same boundary conditions, whereas a proper
selection of the days to analyse is required when comparing data that were not simultaneously
measured. In the specific case, similar values of E24,tot
for the reference technology ensured
comparability among different datasets (Fig. 8). A data selection methodology for this purpose is
detailed in Bianco et al. (2017a). The daily total energy can provide concise information for comparing
the performance of several technologies, but additional information is needed to understand the
dynamics of the system. As positive and negative energies are summed, an E24,tot
e.g. close to zero
does not imply constant adiabatic conditions throughout the day, but only that the energy losses are
balanced by the energy gains.
𝐸𝐸!",!"! = 𝑞𝑞!"#$ + 𝐼𝐼!"!":!! !!!"#!!!":!! 𝑑𝑑𝑑𝑑
Equation 7
FIG. 8 Daily total energy crossing the technologies during selected winter days (left) (Bianco et al., 2017a) and summer days (right) (Bianco et al., 2017b)
4.1.2 Long-term total energy – En,tot
[Wh/m2/HDD]
Long-term total energy (En,tot
[Wh/m2/HDD], Bianco et al., 2017a) is defined as the total energy over a
representative period, normalised over the heating (or cooling) degree days of the same period
(HDD or CDD), extending the total daily energy concept in Section 4.1.1. In this way, when comparing
more datasets, the influence on the results due to slight differences in the boundary conditions

186 JOURNAL OF FACADE DESIGN & ENGINEERING VOLUME 6 / NUMBER 3 / 2018
can be minimised. As for the total daily energy, the long-term total energy alone is not sufficient to
understand the dynamics of the system, and the best comparability is obtained with simultaneous
measurements. However, this metric provides more concise information of the seasonal performance
of a system by removing the dependency on some of the boundary conditions of a single day,
provided that a representative time period is analysed (Fig. 9). In fact, if this metric is able to
normalise on the HDD or CDD, this does not account for solar radiation and, depending on the type of
building and internal loads, the baseline temperature used to calculate HDD and CDD might change.
𝐸𝐸!,!"! =!!",!"!
!"#$ !"#!!!
!!"!!!"#!"#$ !"#!!!
Equation 8
FIG. 9 Normalised total energy during a period in winter (left) (Bianco et al., 2017a) and summer (right) (Bianco et al., 2017b)
The considerations that could be drawn by the presented metrics supported the analyses of the
hourly profiles of various physical properties. Although they provide overall and concise information,
alone they cannot give sufficient insight on the dynamicity of the system, and a reference is always
needed, especially for metrics that are not normalised on the boundary conditions.
5 PERFORMANCE METRICS FOR THE ADAPTIWALL PROJECT
The ADAPTIWALL project sought to develop new adaptive façade prototypes for building renovation
(www.adaptiwall.eu). One of the prototypes consisted of a lightweight concrete with additives
for efficient thermal storage and load bearing capacity. Depending on the extrinsic control of
two hydraulic circuits (one exposed to the internal and one to the external environments), the
lightweight concrete was charged or discharged (heated up or cooled down). The idea was to control
the heat transfer to/from the indoor environment by storing heat in the thermal buffer and by
controlling the flow rate in the two hydraulic circuits. The build-up of a representative construction
is shown in Fig. 10.

187 JOURNAL OF FACADE DESIGN & ENGINEERING VOLUME 6 / NUMBER 3 / 2018
FIG. 10 Adaptiwall representative construction. Vertical black bars represent the heat flux plate meters integrated in the construction.
Four different small-scale ADAPTIWALL prototypes of 1m² were tested at a test site in Algete (Madrid)
and monitored from October 2015 to June 2016. The lightweight thermal buffer has a thickness of
16cm and is composed of lightweight concrete with incorporated phase change material (PCM) using
a vacuum impregnation technique. The prototypes were comprised of a cladding made of 4mm clear
float glass leaving a 15mm cavity. The total thickness of the panel was 40cm. The characteristics of
the four prototypes are summarised in Table 1.
PROTOTYPE 1 PROTOTYPE 2 PROTOTYPE 3 PROTOTYPE 4
Concrete type C20/25, Lightweight concrete
C20/25, Lightweight concrete
C20/25, Lightweight concrete
C20/25, very fluid concrete (Consistency class S5)
Additives Without PCM Without PCM PCM and alumina Micro encapsulated PCM and alumina
Solution to avoid over-heating
Fan Sun screen Sun screen Sun screen
TABLE 1 Characteristics of Adaptivewall prototypes
The performance evaluation of ADAPTIWALL requires adequate metrics able to characterise the
charging and discharging processes and their efficiencies. After a literature review, the metrics
defined for ACTRESS by Favoino et al. (2016) have been considered as basis for the data analysis of
the measurement data of the first test campaign. Metrics have been calculated using the heat fluxes
defined as reported in Fig. 10. Q*EXT
,Q*INT
, Q*AirGap
and Q*INSIDE
have been measured thanks to four heat
flux plate meters integrated in the construction.Q*Buffer outside
and Q*Buffer inside
are equal to respectively
Q*EXT
, Q*INT
but with different signs. Q*OLOOP
and Q*ILOOP
are heat fluxes of water loops in W/m² calculated
from the difference between the measured inlet and outlet temperatures and from the mass flow
rate estimation. Mass flow rates in the hydraulic loops are naturally circulated in these first prototype
configurations. Hence, such flows have been calculated from the inlet-outlet temperature difference

188 JOURNAL OF FACADE DESIGN & ENGINEERING VOLUME 6 / NUMBER 3 / 2018
and from the calculation of the hydraulic losses along the pipes. Q*Buffer
is calculated as in Equation 9.
Q*Buffer
is 0 at each time step if the right term of Equation 9 is lower than 0.
𝑄𝑄!"##$% = (𝑄𝑄!"!!# + 𝑄𝑄!"# + 𝑄𝑄!"# ) [W/m²]
Equation 9
5.1.1 Daily energy e24 for typical days
Daily energy e24 for typical days (e_24,inside
is the heat flow through the border layer between the wall
and the room integrated over 24 hours, as in Equation 10. This is analogous to the previous presented
metric E24,tot
. Analogously for ACTRESS and SMARTGlass project, the integration start and end points
need to be carefully selected, taking into account solar radiation, and charging and discharging
processes. Moreover, the integrated daily energy can also be done for the other layers, giving useful
information for the construction optimisation (Fig. 11 and 12 for Prototype 1 and 3, respectively).
𝑒𝑒!",!"#!$! = 𝑄𝑄!"#!$%!!" !!!"#!!" 𝑑𝑑𝑑𝑑
Equation 10
FIG. 11 e24 metric for Adaptiwall prototype 1 FIG. 12 e24 metric for Adaptiwall prototype 3

189 JOURNAL OF FACADE DESIGN & ENGINEERING VOLUME 6 / NUMBER 3 / 2018
5.1.2 Usable heat efficiency ŋusable
Usable heat efficiency (ŋusable
) indicates how much heat is discharged to the inside of the room
compared to the charged heat inside the buffer over a 24 hour period, similarly to the definition in
(5). The discharge period is defined as the period when the ILOOP of the switchable insulation is
open. Fig. 13 shows the cumulated distribution function of ŋusable
. The values have a rather linear
distribution and usually range between about 0.1 and 0.4 and they do not highlight any relevant
improvements due to the use of PCM (prototypes 3 and 4). Prototype 4 has the most different
behaviour. The reason for this is that PCM is integrated in the lightweight concrete with an
aluminium casing (6.5% of total concrete weight). As a consequence, no mixing between concrete and
PCM occurs. Hence, PCM activation happens with a time shift compared to the other prototype with
impregnated lightweight aggregates directly in the concrete. Nevertheless, the best performance is
reached by Prototype 4 with the maximum value around 0.42.
𝜂𝜂!"#$%& =!!"##$! !"!"# !"#$!!"#$
!"#$" !"#$!!"#$
!!"##$%! !"!!"!! !"#
!!"
Equation 11
FIG. 13 ηusable cumulative frequency distribution for Adaptiwall prototypes
FIG. 14 ηusable cumulative frequency distribution for Adaptiwall prototypes
5.1.3 Total system heat efficiency ŋtotal
Total system heat efficiency (ŋtotal
) expresses the overall efficiency of the system (Equation 6.1). It is
the ratio of the heat supplied to the room by the heat charged into the buffer. Differently from ŋusable
,
in this case the heat from the internal loop is integrated over 24 hours as the denominator, similarly
to the definition in (6). Having a higher range of values compared to ŋusable
highlights the impact of
the high thermal inertia. In other words, the internal loop also keeps distributing heat towards the
indoor once the water flow stops. In Fig. 14, the same trend of Prototype 4 as for ŋusable
is observed
(see explanation in the previous lines).

190 JOURNAL OF FACADE DESIGN & ENGINEERING VOLUME 6 / NUMBER 3 / 2018
𝜂𝜂!"!#$ =!!"##$! !"!!"!! !"#
!!"
!!"##$%! !"!!"!! !"#
!!"
Equation 12
The values of ŋusable
and ŋtotal
are rather low, although comparable with the results from the ACTRESS
prototype. In the case of ŋusable
, one reason could be that after the discharge period, as it was defined,
the internal radiator is still warm and is further transmitting heat to the inside. Therefore, the
way this parameter is defined, i.e. starting and ending time of the integration of the heat fluxes,
needs to be carefully considered, and needs to be adapted to the dynamics of the system. Another
relevant aspect to be more carefully considered is the effect of longterm accumulation of heat in
the big thermal mass of the storage and of course the uncertainty of the mass flow in the inner
and outer water loops.
6 PERFORMANCE METRICS FOR THE ACTIVE INSULATION PROJECT
Active Insulation is a dynamic insulation system that can either block or stimulate heat exchange
between inside and outside (Koenders, Loonen, & Hensen, 2018). The system uses a structure of
air ducts on the front and back sides of the insulation panel in combination with two low-voltage
fans to actuate an air flow. The system is sealed with aluminium foil on both sides to create a
closed system. When AIS is in the off-state (i.e. the fans are off), it acts as a regular insulation
panel because the stagnant air contributes to achieving a high thermal resistance. However, when
the fans are switched on, the insulation layer gets bypassed, thereby promoting heat exchange
between inside and outside. Active Insulation can be used to provide passive cooling during cool
summer nights, however, in this article the emphasis is on its potential to transfer solar heat gains
during sunny winter days.
Next to measuring the system’s U-value in the on and off state, the system can also be characterised
by determining its efficiency in gaining heat from solar radiation. Detailed information about the
heat fluxes throughout the whole structure are needed to determine this efficiency. To reduce the
influence of any other parameters, an adapted TMY weather file for Amsterdam is used for this
simulation-based characterisation. The outside air temperature has a fixed value to exclude influence
of a fluctuating temperature on the heat transfer in the structure. Several fixed temperatures are
studied, to determine the effect of outside temperature on efficiency. A typical sunny day was chosen
to determine the efficiency of Active Insulation.
To determine the efficiency of the system, four daily heat flows through the structure are analysed:
the heat flow at the outer surface (Qoutside surface,daily
), the heat flow at the interface where the Active
Insulation extracts the heat from the outer layer (QAI,outside,daily
), the heat flow at the interface where
the Active Insulation transfers the heat to the inner layer (QAI,inside,daily
), and the heat flow at the inner
surface (Qinside surface,daily
). Several efficiencies of the structure are calculated.
191 JOURNAL OF FACADE DESIGN & ENGINEERING VOLUME 6 / NUMBER 3 / 2018
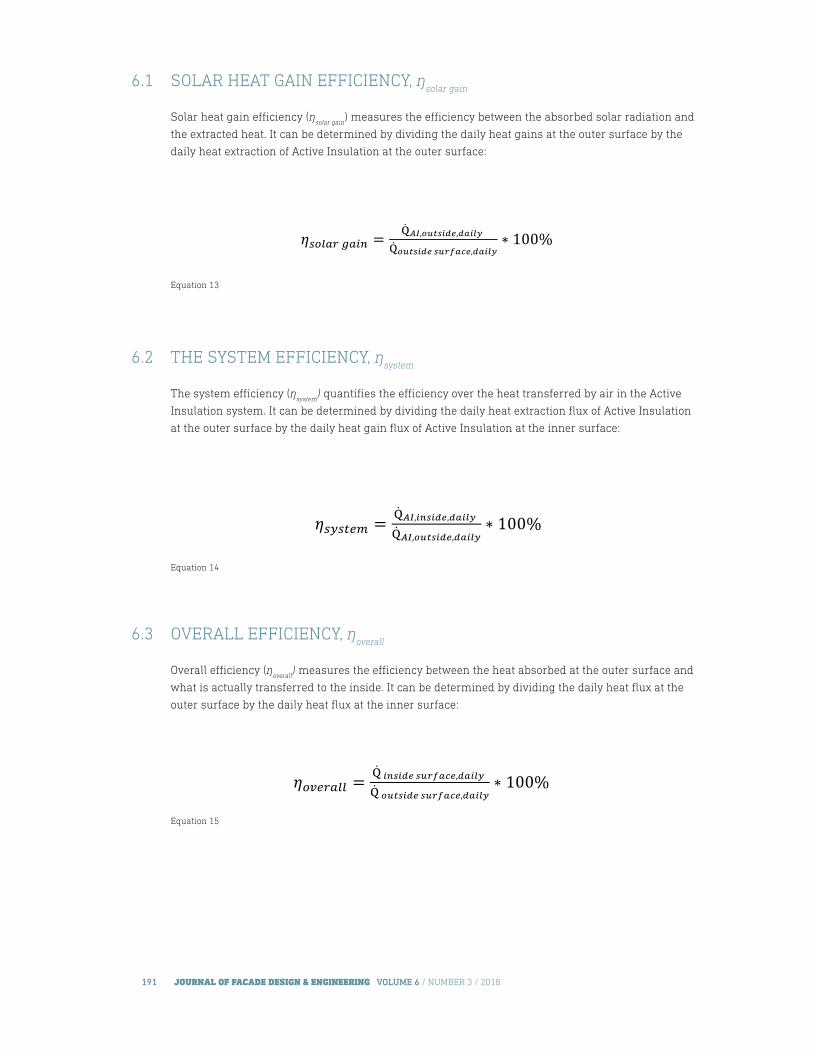
6.1 SOLAR HEAT GAIN EFFICIENCY, ŋsolar gain
Solar heat gain efficiency (ŋsolar gain
) measures the efficiency between the absorbed solar radiation and
the extracted heat. It can be determined by dividing the daily heat gains at the outer surface by the
daily heat extraction of Active Insulation at the outer surface:
𝜂𝜂!"#$% !"#$ =!!",!"!"#$%,!"#$%
!!"#$%&' !"#$%&',!"#$%∗ 100%
Equation 13
6.2 THE SYSTEM EFFICIENCY, ŋsystem
The system efficiency (ŋsystem
) quantifies the efficiency over the heat transferred by air in the Active
Insulation system. It can be determined by dividing the daily heat extraction flux of Active Insulation
at the outer surface by the daily heat gain flux of Active Insulation at the inner surface:
𝜂𝜂!"!#$% = !!",!"#!$%,!"#$% !!",!"#$%&',!"#$%
∗ 100%
Equation 14
6.3 OVERALL EFFICIENCY, ŋoverall
Overall efficiency (ŋoverall
) measures the efficiency between the heat absorbed at the outer surface and
what is actually transferred to the inside. It can be determined by dividing the daily heat flux at the
outer surface by the daily heat flux at the inner surface:
𝜂𝜂!"#$%&& =! !"#!$% !"#$%&',!"#$% ! !"#$%&' !"#$%&',!"#$%
∗ 100%
Equation 15

192 JOURNAL OF FACADE DESIGN & ENGINEERING VOLUME 6 / NUMBER 3 / 2018
Fig. 15 is a graphical representation of the heat flows and efficiencies described.
FIG. 15 Active Insulation - overview of heat flows and efficiencies
For this specific case, the results from the simulation are shown in Table 2, expressed in daily heat
flow values into the zone. For comparative reasons, the analysis was carried out for cases in which
Active Insulation is switched on during the day and for cases in which it is not used. Results indicate
a significant increase in heat transferred to the inside when the Active Insulation system is activated.
JUNE 5, AMSTERDAM
[Wh/m² daily] [Wh/m² daily] [Wh/m² daily] [Wh/m² daily]
0°C Active Ins. OFF 2749.4 0.0 0.0 29.0
Active Ins. ON 2749.4 303.3 298.9 298.7
5°C Active Ins. OFF 2749.3 0.0 0.0 35.2
Active Ins. ON 2749.3 336.3 331.5 335.0
10°C Active Ins. OFF 2749.3 0.0 0.0 42.1
Active Ins. ON 2749.3 374.6 369.3 376.5
15°C Active Ins. OFF 2749.3 0.0 0.0 49.8
Active Ins. ON 2749.3 419.3 413.4 424.4
20°C Active Ins. OFF 2749.9 0.0 0.0 59.0
Active Ins. ON 2749.9 472.3 465.6 483.6
TABLE 2 Active Insulation heat fluxes at different outside temperatures
Using the above mentioned equations, the efficiencies of the system can be determined with the
given heat flows. For different exterior temperatures, the efficiencies are calculated and shown in
Table 3. The efficiency of the Active Insulation system is constant at 98.5% for all temperatures.
However, the solar gain efficiency is increasing with an increasing temperature. This is due to
the fact that the difference between the surface temperature and the air temperature decreases,

193 JOURNAL OF FACADE DESIGN & ENGINEERING VOLUME 6 / NUMBER 3 / 2018
resulting in lower convective losses from the surface. The overall efficiency is mainly determined by
the solar gain efficiency and thus also increases with temperature (Table 3).
OUTDOOR CONDITION
[%] [%] [%]
0°C 11.03 98.56 10.87
5°C 12.23 98.57 12.19
10°C 13.63 98.57 13.70
15°C 15.25 98.58 15.44
20°C 17.17 98.59 17.59
TABLE 3 Efficiencies of the Active Insulation system for different temperatures
The results presented here show that characterising the Active Insulation system with one U-value
or heat gain efficiency is not possible. The system is dynamic in such a way that its performance is
influenced by dynamic weather data, but also by design and control parameters. Detailed simulations
and experiments with prototypes will need to show the actual performance increase of Active
Insulation for a specific situation.
7 DISCUSSION AND CONCLUSIONS
Using a combination of experiments and simulations, different indicators for adaptive opaque
façades were identified. These are summarised in Table 4. These are not in the order of appearance
in the paper (by project), but are ordered by similarity of characteristics (adaptive façade system
technology, time frame etc.).
The main difference between the presented metrics, and the standard way to evaluate the
performance of façades as U-value, G-value, and so on, is that the presented metrics cannot be
calculated directly from physical characteristics of the materials adopted in a typical façade multi-
layer system / construction, and do not have a general physical meaning. Instead, these metrics are
derived from either experimental or numerical datasets, with the aim to quantify the performance
of the system to achieve a certain objective (i.e. pre-heat supply air, reduce heat losses or gains,
deliver solar radiation through an opaque component to the adjacent room etc.). As a result, most
of the metrics devised in the presented projects are defined as dimensionless efficiencies or ratios
over known quantities, which could be calculated based on boundary conditions and other physical
parameters. It is worth noting the analogy in the definition of these metrics (or efficiency) between
adaptive façade systems and Heating Ventilation and Air Conditioning (HVAC) systems, as both could
have different operating modes and controls.
The main differences between the novel metrics presented are related to the dynamic nature of the
adaptive system to be characterised. This can be divided into: i) short-term (sub-hourly or hourly
metrics), related to the performance of fast reactive system, as ventilated cavity, either open or
closed loop; ii) mid-term (daily metrics), related to the performance of systems that are storing and
exchanging energy with the indoor environment over a daily cycle (mainly related to solar daily cycle
and charge and discharge period of solar energy in the thermal mass of the building envelope); iii)
long-term (monthly and seasonal metrics), adopted to normalise a certain metric over the boundary

194 JOURNAL OF FACADE DESIGN & ENGINEERING VOLUME 6 / NUMBER 3 / 2018
conditions of a longer period (heating or cooling season). Nevertheless, in order to provide a useful
insight into the performance of dynamic façade systems and be normalised over a certain range /
distribution of boundary conditions, short- and mid-term metrics can also be evaluated over a longer
period, considering their cumulative distribution, as shown in the graphs presented in this paper.
With the mid-term metrics, particular attention should be paid to the starting and ending time of
the integration of the heat flows, as these depend on the starting and ending time of the charge /
discharge cycles and/or of the solar daily cycle (which is seasonally dependent).
Moreover, for long-term metrics, the definition of the baseline temperature of the HDD and CDD
could depend on the type of climate (amount of available solar radiation as compared to the seasonal
temperature variation), type of building (mainly related to the amount of internal thermal mass and
endogenous occupation loads) and type / dynamics of the HVAC system adopted.
For most of the projects presented, the metrics adopted are derived from experimental data, although
when physical numerical models of the adaptive façade systems become available, a longer time
series of data could be generated to calculate the performance metric, or the system could be
tested in specific boundary conditions in order to understand their influence over the performance
metric (cf. Active Insulation Project, Section 5). Although due to the complexity of adaptive
façade components, physical models are not always available (Loonen et al., 2017) or reliable
(Favoino et al., 2017).
It is unlikely that a single set of metrics can be adopted to satisfy all performance quantification
needs for any kind of adaptive façade system, due to the intrinsic differences (also in terms of
dynamics) of different technologies. Therefore, future work is needed to investigate the differences
and common features between adaptive façade performance metrics, and to cross validate them
between different projects / technologies and data-sets. The aim of such work would be, rather than
to develop a specific metric, to develop a methodology to characterise the performance of adaptive
façade systems. In fact, being able to quantify the performance of an adaptive façade system through
specific metrics would allow an easier comparison with that of alternative adaptive façade systems
and with that of traditional static building envelopes.

195 JOURNAL OF FACADE DESIGN & ENGINEERING VOLUME 6 / NUMBER 3 / 2018
ADAPTIVE FAÇADE
SYSTEM
# METRIC [UNITS] EQ. REF. PROJECT DATA
SOURCE
TIME
FRAME
Ventilated Cavity –
Open Loop
1 Dynamic insulation efficiency –
ε [-] (1) Corgnati et al. (2007)
AC
TR
ES
S
Exp
erim
enta
l
Su
b-h
ourl
y, H
ourl
y, C
um
ula
ted
freq
uen
cy o
ver
lon
ger
peri
od
2 Pre-heating efficiency –
η PH
[-] (2) Di Maio and Van Passen (2001)
Closed Cavity 3 Thermal buffer efficiency –
η TB
[-] (3) Favoino et al. (2013)
Ventilated cavity -
Closed Loop
4 Solar heat gain efficiency -
[-] (11) Koenders et al. (2018)
AC
TIV
E IN
SU
LAT
ION
Sim
ula
tion5 The system efficiency -
[-] (12)
6 Overall efficiency -
[-] (13)
Opaque Solar
LHTES*
7 Utilization factor of the solar LHTES
system –
η LHTES
[-] (4) Favoino et al. (2016)
AC
TR
ES
S
Exp
erim
enta
l
Dai
ly (s
olar
rad
iati
on/
char
ge-d
isch
arge
cyc
les)
, Cu
mu
late
d fr
equ
ency
ove
r lo
nge
r
peri
od
8 Utilization factor of the usable energy of
the LHTES –
η LHTES-Usable
[-] (5)
9 Usable heat efficiency –
[-] (5.1) N/A
AD
AP
-
TI-
WA
LL
10 Utilization factor of the OSM system –
η OSM
[-] (6) Favoino et al. (2016)
AC
TR
ES
S
11 Total system heat efficiency –
[-] (6.1) N/A
AD
AP
-
TI-
WA
LL
Transparent Solar
LHTES*
12 Total daily energy – E24,tot
[Wh/m2] (7) Bianco et a. (2017a)
SM
AR
T-
GLA
SS
Exp
erim
enta
l
Opaque Solar
LHTES*
13 Daily energy –
e24
[Wh/m2] (10) N/AA
DA
P-
TI-
WA
LL
Transparent Solar
LHTES*
14 Long-term total energy –
En,tot
[Wh/m2/HDD] (8) Bianco et a. (2017a)
SM
AR
T-
GLA
SS
Mon
thly
,
Sea
son
al* LHTES: Latent Heat Themal Energy Storage
TABLE 4 Adaptive façade system metrics summary
AcknowledgementsThis paper is dedicated to the memory of Dr. Lorenza Bianco, a bright and inspiring colleague who recently passed away, who contributed to most of the projects presented in this paper and who was an active part of the COST Action TU1403 – Adaptive Façade Network.
The research activities of the ACTRESS project (Section 3) were carried out in the framework of the Italian PRIN 2007, funded by the Italian Minister of Research and Education.
The research activities regarding the SMARTGLASS project (Section 4) were carried out in the framework of the regional POLIGHT project ‘SMARTGLASS’, funded by Regione Piemonte.

196 JOURNAL OF FACADE DESIGN & ENGINEERING VOLUME 6 / NUMBER 3 / 2018
The research activities of the ADAPTIWALL project (Section 5) were carried out in the framework of the European Union’s Seventh Framework Programme for research, technological development and demonstration under grant agreement no 608808, and with the support of the project FACEcamp n. ITAT1039, funded by European Regional Development Fund and Interreg ITA AUT programme.
The European COST Action TU1403 ‘Adaptive Façades Network’ (2014-2018, http://www.tu1403.eu) is gratefully acknowledged for financially supporting the research study and for providing excellent research networking between the involved authors, as well as with international experts.
ReferencesAldawoud, A. (2013). Conventional fixed shading devices in comparison to an electrochromic glazing system in hot, dry climate.
Energy and Buildings, 59, pp.104-110. Bianco, L. (2014). Involucri trasparenti innovativi. Modellazione e sperimentazione su componenti dinamici e sistemi di facciata attivi.
[Innovative transparent envelopes. Modelling and experimentation on dynamic components in active façade systems]. (Doc-toral Thesis), Politecnico di Torino, Torino, Italy. doi:10.6092/polito/porto/2548139
Bianco, L., Goia, F., Serra, V., & Zinzi, M. (2015). Thermal and Optical Properties of a Thermotropic Glass Pane: Laboratory and In-Field Characterization. Energy Procedia 78, pp.116–121. doi:10.1016/j.egypro.2015.11.124
Bianco, L., Cascone, Y., Goia, F., Perino, M., & Serra, V. (2017a). Responsive glazing systems: Characterisation methods and winter performance. Solar Energy 155, pp. 372–387. doi:10.1016/j.solener.2017.06.029
Bianco L., Cascone Y., Goia F., Perino M., & Serra V. (2017b). Responsive glazing systems: Characterisation methods, summer per-formance and implications on thermal comfort. Solar Energy 158, pp.819-836. doi: doi.org/10.1016/j.solener.2017.09.050
Corgnati S.P., Perino M., & Serra V. (2007). Experimental assessment of the performance of an active transparent façade during actual operating conditions. Solar Energy 81:8, pp.993-1013.
EN ISO (2007). ISO 13789:2007. Thermal performance of buildings -- Transmission and ventilation heat transfer coefficients -- Calcu-lation method
DiMaio, F., & Van Passen, A.H.C. (2001). Modelling the air infiltrations in the second skin façade. In: Proceedings of IAQVEC 2001 – The 4th International Conference on Indoor Air Quality, Ventilation and Energy Conservation in Buildings, 2-5 October 2001, Changsha (China), pp.873-880.
Favoino F., Goia F., Perino M., & Serra V. (2013). Experimental assessment of the energy performance of an advanced responsive multifunctional façade module, Energy and Buildings, Available online 19 September 2013, ISSN 0378-7788, http://dx.doi.org/10.1016/j.enbuild.2013.08.066
Favoino F., Goia F., Perino M., & Serra V. (2016). Experimental analysis of the energy performance of an Active, RESponsive and Solar (ACTRESS) façade module, Solar Energy 133, doi: 10.1016/j.solener.2016.03.044.
Favoino, F., Jin, Q., & Overend, M. (2017). Design and control optimisation of adaptive insulation systems for office buildings. Part 1: Adaptive technologies and simulation framework, Energy 127, pp.301-309. Retrieved from https://doi.org/10.1016/j.energy.2017.03.083.
Favoino, F., Overend, M., & Jin, Q., (2015). The optimal thermo-optical properties and energy saving potential of adaptive glazing technologies. Applied Energy 156, pp.1–15.
Fiorito, F., Sauchelli, M., Arroyo, D., Pesenti, M., Imperadori, M., Masera, G., & Ranzi, G. (2016). Shape morphing solar shadings: A review. Renewable and Sustainable Energy Reviews, vol. 55(C), pp. 863-884. New York: Elsevier.
Goia, F., Perino, M., & Serra, V. (2013). Improving thermal comfort conditions by means of PCM glazing systems. Energy and Build-ings 60, pp.442–452. doi: 10.1016/j.enbuild.2013.01.029
Goia, F,. Perino, M., & Serra, V. (2014). Experimental analysis of the energy performance of a full-scale PCM glazing prototype. Solar Energy 100, pp.217–233. doi: 10.1016/j.solener.2013.12.002
Goia, F., & Serra, V., (2018). Analysis of a non-calorimetric method for assessment of in-situ thermal transmittance and solar factor of glazed systems. Solar Energy 166, pp.458–471. doi: 10.1016/j.solener.2018.03.058
Jin, Q., Favoino, F., & Overend, M., (2017). Design and control optimisation of adaptive insulation systems for office buildings. Part 2: A parametric study for a temperate climate. Energy 127, pp.634–649. doi:10.1016/j.energy.2017.03.096
Koenders, S., Loonen, R.C.G.M., & Hensen, J.L.M. (2018). Investigating the potential of a closed-loop dynamic insulation system for opaque building elements. Energy and Buildings 173, pp.409-427. doi: 10.1016/j.enbuild.2018.05.051
Loonen R.C.G.M., Favoino F., Hensen J.L.M., & Overend, M. (2017). Review of current status, requirements and opportunities for building performance simulation of adaptive façades, Journal of Building Performance Simulation, doi:10.1080/19401493.2016.1152303
Loonen, R.C.G.M., Singaravel, S., Trčka, M., Cóstola, D., & Hensen, J.L.M., (2014). Simulation-based support for product development of innovative building envelope components. Automation in Construction 45. doi:10.1016/j.autcon.2014.05.008
Loonen, R.C.G.M., Trčka, M., Cóstola, D., & Hensen, J.L.M., (2013). Climate adaptive building shells: State-of-the-art and future chal-lenges. Renewable and Sustainable Energy Reviews 25, pp.483–493. doi:10.1016/j.rser.2013.04.016