Embed Size (px)
Citation preview

Australian Institute of Health and Welfare
Canberra
Cat. no. HSE 75
Towards national indicators of safety and quality in health care
September 2009

© Australian Institute of Health and Welfare 2009
This work is copyright. Apart from any use as permitted under the Copyright Act 1968, no part may be reproduced without prior written permission from the Australian Institute of Health and Welfare. Requests and enquiries concerning reproduction and rights should be directed to the Head, Media and Communications Unit, Australian Institute of Health and Welfare, GPO Box 570, Canberra ACT 2601.
A complete list of the Institute’s publications is available from the Institute’s website <www.aihw.gov.au>.
ISBN 978 1 74024 961 4
Suggested citation
Australian Institute of Health and Welfare 2009. Towards national indicators of safety and quality in health care. Cat. no. HSE 75. Canberra: AIHW.
Australian Institute of Health and Welfare
Board Chair
Hon. Peter Collins, AM, QC
Director
Penny Allbon
Any enquiries about or comments on this publication should be directed to:
Earl Dudley Health Care Safety and Quality Unit Australian Institute of Health and Welfare GPO Box 570 Canberra ACT 2601
Phone: (02) 6244 1058
Email: [email protected]
Published by the Australian Institute of Health and Welfare
The Australian Institute of Health and Welfare is Australia’s national health and welfare statistics and information agency. The Institute’s mission is
better information and statistics for better health and wellbeing.
Please note that there is the potential for minor revisions of data in this report. Please check the online version at <www.aihw.gov.au> for any amendments.

iii
Contents
Acknowledgements............................................................................................................................ vi Abbreviations.....................................................................................................................................vii Summary ........................................................................................................................................... viii 1. Introduction....................................................................................................................................1
1.1 Background..............................................................................................................................1 1.2 Purpose of this report .............................................................................................................2
2 Methods ..........................................................................................................................................4 2.1 Consultation.............................................................................................................................4 2.2 Scope .........................................................................................................................................4 2.3 Definitions of safety and quality...........................................................................................6 2.4 Framework for the indicators................................................................................................8 2.5 Support projects ....................................................................................................................11 2.6 How the indicators were selected.......................................................................................11
3 Recommended indicators: a summary ....................................................................................15 3.1 List of recommended indicators .........................................................................................15 3.2 Alignment with the indicator framework .........................................................................16 3.3 Measurability, data sources and international comparisons ..........................................21
4 Taking the indicators forward ..................................................................................................25 4.1 Reporting of indicators – public reporting, levels and frequency, reporting formats 25 4.2 Priorities for further development......................................................................................32
Appendix 1: Recommended indicators ..........................................................................................41 Enhanced primary care services in general practice ...............................................................41 General practices using a register and recall system for patients with chronic disease ....44 People with moderate to severe asthma who have a written asthma action plan..............48 Management of hypertension in general practice ...................................................................53 Management of arthritis and musculoskeletal conditions .....................................................57 Mental health care plans in general practice ............................................................................60 Annual cycle of care for people with diabetes mellitus..........................................................64 Cervical cancer screening rates ..................................................................................................69 Immunisation rates for vaccines in the national schedule .....................................................73 Eye testing for target groups ......................................................................................................77 Quality of community pharmacy services................................................................................80 Developmental health checks in children.................................................................................82 People receiving a medication review.......................................................................................85 Assessment for risk of venous thromboembolism in hospital...............................................89

iv
Pain assessment in the Emergency Department......................................................................92 Reperfusion for acute myocardial infarction in hospitals ......................................................95 Stroke patients treated in a stroke unit ...................................................................................100 Complications of transfusion....................................................................................................103 Health Care Associated Infections acquired in hospital.......................................................107 Staphylococcus aureus (including MRSA) bacteraemia in hospitals .....................................112 Adverse drug events in hospital ..............................................................................................116 Malnutrition in hospitals and residential aged care facilities ..............................................122 Pressure ulcers in hospitals and residential aged care facilities..........................................125 Falls resulting in patient harm in hospitals and residential aged care facilities ...............130 Complications of anaesthesia ...................................................................................................135 Accidental puncture/laceration in hospital ...........................................................................139 Obstetric trauma - third and fourth degree tears ..................................................................142 Birth trauma - injury to neonate...............................................................................................148 Postoperative haemorrhage......................................................................................................152 Postoperative venous thromboembolism ...............................................................................155 Unplanned return to operating theatre...................................................................................158 Unplanned re-admission to an Intensive Care Unit..............................................................161 Hospital Standardised Mortality Ratio (HSMR)....................................................................165 Death in low mortality DRGs ...................................................................................................170 Independent peer review of surgical deaths ..........................................................................172 Discharge medication management for acute myocardial infarction.................................175 Timely transmission of discharge summaries........................................................................178 Mental health admitted patients having seclusion................................................................180 Post-discharge community care for mental health patients.................................................184 Quality of palliative care ...........................................................................................................188 Functional gain achieved in rehabilitation .............................................................................191 Multidisciplinary care plans in sub-acute care ......................................................................195 Oral health in residential aged care.........................................................................................197 Unplanned hospital re-admissions..........................................................................................200 Inappropriate co-prescribing of medicines ............................................................................204 Selected potentially preventable hospitalisations .................................................................207 End-stage kidney disease in people with diabetes................................................................212 Lower-extremity amputation in people with diabetes .........................................................215 Cancer survival...........................................................................................................................219 Failure to diagnose.....................................................................................................................223 Potentially avoidable deaths.....................................................................................................225 Patient experience ......................................................................................................................228
v
Presence of appropriate incident monitoring arrangements ...............................................231 Accreditation of health care services .......................................................................................233
Appendix 2: Consultation Process.................................................................................................239 National Indicators Advisory Group ......................................................................................239 Key messages from stakeholder consultation ........................................................................240 Proposed indicators that were removed or revised and new indicators added ...............242 Consultation Feedback – in detail............................................................................................245
Appendix 3: Types of indicators and how they are used..........................................................256 Appendix 4: Alignment with the indicator framework ............................................................259 Appendix 5: Support Projects ........................................................................................................266
OECD patient safety indicators................................................................................................266 Measuring and reporting mortality.........................................................................................267 Primary care ................................................................................................................................269
Appendix 6: National Hospital Morbidity Database ................................................................270 References..........................................................................................................................................272 List of tables ......................................................................................................................................275 List of figures ....................................................................................................................................276

vi
Acknowledgements
The Australian Commission on Safety and Quality in Health Care funded this work and has been closely involved in the production of this report.
The report was prepared by staff of the Health Care Safety and Quality Unit at the Australian Institute of Health and Welfare with valuable assistance provided by other AIHW staff. Many people provided helpful comment including staff from the Commission and members of the project’s National Indicators Advisory Group.

vii
Abbreviations
ACHS Australian Council on Healthcare Standards
ACSQHC Australian Commission on Safety and Quality in Health Care
AGPN Australian General Practice Network
AHMAC Australian Health Ministers’ Advisory Council
AHMC Australian Health Ministers’ Conference
AHRQ Agency for Healthcare Research and Quality
AHS Australian Hospital Statistics
AIHW Australian Institute of Health and Welfare
AR-DRG Australian Refined - Diagnosis Related Group
BEACH Bettering the Evaluation And Care of Health
COAG Council of Australian Governments
DGP Division of General Practice
DRG Diagnosis Related Group
HCQI Health Care Quality Indicators
ICD-9-CM International Statistical Classification of Diseases and Related Health Problems, Ninth Revision, Clinical Modification
ICD-10 International Statistical Classification of Diseases and Related Health Problems, Tenth Revision
ICD-10-AM International Statistical Classification of Diseases and Related Health Problems, Tenth Revision, Australian Modification
MBS Medicare Benefits Schedule
NCCH National Centre for Classification in Health
NHHRC National Health and Hospitals Reform Commission
NHMD National Hospital Morbidity Database
NHMRC National Health and Medical Research Council
NHPA National Health Priority Area
NHPC National Health Performance Committee
NICS National Institute of Clinical Studies
NIAG National Indicators Advisory Group
NHMD National Hospital Morbidity Database
NMDS National Minimum Data Set
NPS National Prescribing Service
NPDC National Perinatal Data Collection
OECD Organisation for Economic Co-operation and Development
RACGP Royal Australian College of General Practitioners

viii
Summary
This report sets out recommendations for a set of 55 national indicators of safety and quality in health care (Table 1). The report concludes the National Indicators Project, a major project funded by the Australian Commission on Safety and Quality in Health Care (the Commission) and undertaken by the Australian Institute of Health and Welfare (AIHW) in close consultation with the Commission and a wide range of clinical and other stakeholders.
What does the indicator set cover?
The scope of this indicator set is the safety and quality of clinical care provided to patients across the Australian health care system. Thirteen indicators apply to primary and community health services, 25 to hospitals, six to specialised health services, and five to residential aged care. Eleven indicators apply to multiple or all types of health services. Established indicators were not identified for services such as ambulance, dental services and community pharmacy.
The focus is on safety and four quality domains: appropriateness, effectiveness, continuity, and responsiveness. Most (42) of the indicators in the set reflect appropriateness of care, responding to the growing emphasis on evidence-based health care and best practice guidelines; and 25 relate to safety.
The indicators cover the national health priority areas and major burden of disease and injury groups. However, this coverage is uneven with some areas currently under-represented (for example, cancer), and others possibly over-represented (for example, cardiovascular disease).
There are some indicators in common between this proposed indicator set and the COAG National Healthcare Agreement Performance Indicators. The purpose of the two sets, however, is distinct. While this set serves specific purposes around the improvement of safety and quality, the COAG set aims more broadly to measure the performance of governments. The National Health Agreements include 70 indicators, including 16 indicators that relate to health care safety and quality and are reflected in the indicator set proposed here.
Are the indicators ready for use?
Most of the indicators (40 out of 55) can be reported immediately. Just over half of these (21 out of 40) require some more work so that reporting can be fully in line with the recommended specification.
The other 15 indicators cannot be reported immediately. For seven of these, decisions need to be made about the indicator definition, and information development will be necessary because data for calculating the indicator are not currently available. For the other eight of these indicators, a concept has been proposed but further investigation and consultation would be required before a robust indicator could be developed.

ix
How might public reporting of these Indicators make a difference?
The AIHW suggests that, broadly, public reporting on these indicators could serve two main purposes: to provide transparency and to inform decision-making about overall priorities and system-level strategies for safety and quality improvement; and to inform quality improvement activities of service providers. Reporting to serve these purposes may not only be national but also at the level of states, territories and individual facilities and organisations. All of the recommended indicators are suitable for national public reporting, and most are also suitable for use at other levels. The ability to act directly to improve health care safety and quality arguably lies primarily at the facility and organisation level.
Table 1.1: Health care safety and quality indicators by quality domain
Service Category/Indicator
Saf
e
Ap
pro
pri
ate
Eff
ecti
ve
Co
nti
nu
ou
s
Res
po
nsi
ve
Primary care and community health services
1 Enhanced primary care services in general practice
2 General practices with a register and recall system for patients with chronic disease
3 People with moderate to severe asthma who have a written asthma action plan
4 Management of hypertension in general practice
5 Management of arthritis and musculoskeletal conditions
6 Mental health care plans in general practice
7 Annual cycle of care for people with diabetes mellitus
8 Cervical cancer screening rates
9 Immunisation rates for vaccines in the national schedule
10 Eye testing for target groups
11 Quality of community pharmacy services
12 Developmental health checks in children
13 People receiving a medication review
Hospitals
14 Assessment for risk of venous thromboembolism in hospitals
15 Pain assessment in the emergency department
16 Reperfusion for acute myocardial infarction in hospitals
17 Stroke patients treated in a stroke unit
18 Complications of transfusion
19 Health care associated infections acquired in hospital
20 Staphylococcus aureus (including MRSA) bacteraemia in hospitals
21 Adverse drug events in hospitals
22 Intentional self-harm in hospitals
23 Malnutrition in hospitals and residential aged care facilities
24 Pressure ulcers in hospitals and residential aged care facilities
25 Falls resulting in patient harm in hospitals and residential aged care facilities
26 Complications of anaesthesia
27 Accidental puncture/laceration in hospitals
28 Obstetric trauma - third and fourth degree tears
29 Birth trauma—injury to neonate
30 Postoperative haemorrhage
31 Postoperative venous thromboembolism
32 Unplanned return to operating theatre
33 Unplanned re-admission to an intensive care unit
34 Hospital standardised mortality ratio (HSMR)
35 Death in low mortality DRGs

x
Service Category/Indicator
Saf
e
Ap
pro
pri
ate
Eff
ecti
ve
Co
nti
nu
ou
s
Res
po
nsi
ve
Hospitals (continued)
36 Independent peer review of surgical deaths
37 Discharge medication management for acute myocardial infarction
38 Timely transmission of discharge summaries
Specialised health services
39 Mental health admitted patients having seclusion
40 Post-discharge community care for mental health patients
41 Quality of palliative care
42 Functional gain achieved in rehabilitation
43 Multi-disciplinary care plans in sub-acute care
(5) Management of arthritis and musculoskeletal conditions
Residential aged care
44 Oral health in residential aged care
(13) People receiving a medication review
(23) Malnutrition in hospitals and residential aged care facilities
(24) Pressure ulcers in hospitals and residential aged care facilities
(25) Falls resulting in patient harm in hospitals and residential aged care facilities
Multiple service categories
45 Unplanned hospital re-admissions
46 Inappropriate co-prescribing of medicines
47 Selected potentially preventable hospitalisations
48 End stage kidney disease in people with diabetes
49 Lower-extremity amputation in people with diabetes
50 Cancer Survival
51 Failure to diagnose
52 Potentially avoidable deaths
All service categories
53 Patient experience
54 Presence of appropriate incident monitoring arrangements
55 Accreditation of health care services

1
1. Introduction
This chapter provides background to the development of the national indicators and explains the purpose of this report, in relation to the broader role of the Australian Commission on Safety and Quality in Health Care (the Commission, ACSQHC) in leading and coordinating improvements in safety and quality in health care in Australia.
1.1 Background
The Commission
Health ministers established the Australian Commission on Safety and Quality in Health Care in 2006 with a broad charter to improve safety and quality across the health care system in Australia. The Commission’s role is to:
• Lead and coordinate improvements in safety and quality in health care in Australia by identifying issues and policy directions, and recommending priorities for action, disseminating knowledge, and advocating for safety and quality
• Report publicly on the state of safety and quality including performance against national standards
• Recommend national data sets for safety and quality, working within current multilateral governmental arrangements for data development, standards, collection and reporting
• Provide strategic advice to Health Ministers on best practice thinking to drive quality improvement, including implementation of strategies
• Recommend nationally agreed standards for safety and quality improvement.
The National Indicators project
The ACSQHC commissioned the Australian Institute of Health and Welfare (AIHW) to develop a set of safety and quality indicators through the National Indicators project. The broad objectives were to:
• Recommend indicators for national reporting on safety and quality
• Enable the ACSQHC to ‘report publicly on the state of safety and quality’
• Enable the ACSQHC to advise Ministers on whether existing reporting processes and collections should be continued, enhanced, or replaced.
The indicators have been developed in a manner consistent with the broad direction of the Commission’s Information Strategy (ACSQHC 2007). In particular, it is intended that the indicators:
• Are suitable for public reporting purposes
• Cover the entire health care system
• Have meaning at a clinical and health service level

2
• Identify areas where action is needed
• Facilitate international benchmarking
• Are based on routinely collected data where available
• Align with national data standards.
The AIHW has developed the recommended indicator set based on these principles in close consultation with the Commission and the project’s National Indicators Advisory Group (NIAG) and through national consultation with a wide range of stakeholders throughout the health care system.
The Commission is currently developing a national strategic framework for safety and quality in health care, based on three concepts: patient centred health care, systemisation of evidence-based health practice and building a culture so ‘safety is how we do business.’ Future work could include aligning the recommended indicators with this framework.
1.2 Purpose of this report This report recommends a set of national safety and quality indicators and outlines:
• The national information needs that can or should be met through a national safety and quality indicator set (the indicator framework)
• The extent to which the indicators meet the identified information needs and other selection criteria for the indicators (including international comparability)
• The data specifications, including appropriate population, for each of the recommended indicators (where known)
• The current availability and quality of data for the recommended indicators
• Data for indicators where data are readily available to the AIHW
• The need for data development work to achieve national comparability for the recommended indicators, and to fill gaps in indicator coverage
• Options for national reporting and information use
• Options for international comparison.
Linked with other work in progress, such as work on a national safety and quality framework, this report will help in developing national reporting.
Public reporting
A key purpose of the indicator set is to assist the Commission to report publicly on the state of safety and quality in health care. The Commission is working with jurisdictions, private providers and consumers to develop models for the use of the indicators and reporting to identify significant variations and to support improvements in the safety and quality of health care.
The AIHW suggests that, broadly, reporting on indicators could serve two main purposes: to provide transparency and to inform decision-making about overall priorities and system-level strategies for safety and quality improvement; and to inform quality improvement activities of service providers. Indicators which could serve one or both of these purposes have been included in the recommended indicator set.

3
Reporting to serve these purposes could include not only national reporting but also ongoing monitoring and reporting at state and territory level and by individual facilities and organisations. The degree to which this reporting should be public varies. Issues regarding public reporting, frequency and form of reporting are explored in section 4.1.

4
2 Methods
This chapter describes the key concepts and methods that guided the development of the indicator set. It includes the consultation undertaken, the scope of the indicator set, the definitions of safety and quality, a framework for the indicators, and how the indicators were selected, including three support projects which informed indicator selection.
2.1 Consultation The methods used to develop the indicator set have been selected in close consultation with the project’s National Indicators Advisory Group (NIAG). NIAG was established in February 2008 to provide advice, information, expertise and critical thought, and to act as a sounding board for the project. It was chaired by the Chief Executive of the Commission, with a diverse range of members (Appendix 2). NIAG provided useful practical advice to the AIHW on areas of health care to be covered and on indicator selection.
In addition to ongoing consultation with NIAG, the Commission and informally with a range of stakeholders throughout the project, the AIHW undertook a formal national consultation process from November 2008 until February 2009.
During the consultation period, AIHW and ACSQHC representatives participated in a range of forums and events to raise awareness of the project, gain direct feedback and advice, and advise stakeholders on how to access further information and provide more detailed feedback. Invitation to provide written comment was extended to a wide range of stakeholders, as listed in Appendix 2.
To inform and facilitate consultation throughout the period, a suite of documents were made available on a password protected section of the AIHW website. This included a discussion paper (Towards national indicators of safety and quality in health care), reports on the three support projects, and a feedback form.
2.2 Scope The scope of the proposed safety and quality indicators is the health care system in Australia. It covers the entire spectrum of clinical health care. The starting point for defining the scope in operational terms was to adopt the following definition, endorsed by NIAG:
‘Settings in which clinical care is delivered by registered practitioners where the primary purpose of the setting is health care’.
On the advice of stakeholders and NIAG, dental care, ambulance services and residential aged care have also been included in the broad scope, although these are not always regarded as ‘health care’.
‘Clinical care’ was clarified as health care provided to patients. Most of public health is out of scope—particularly areas such as health promotion, environmental health, safety promotion activities and occupational health and safety. Therefore, indicators relating to health promotion and preventive activities such as population-wide health education programs (to discourage smoking, for example) have not been included in the recommended set.

5
However, indicators of some specific preventive activities of clinicians are included, such as cervical cancer screening.
Cascading indicator sets
The set of indicators recommended in this report aims to provide a broad overview of health care safety and quality in Australia. However a single set of indicators such as this must be of a manageable size and it cannot provide a detailed view for all areas of the health system and all aspects of health care. It is for this reason that different indicator sets are needed to provide this more comprehensive view.
The concept of cascading indicator sets is used to describe this relationship between different indicator sets, as explained in the report ‘A set of performance indicators across the health and aged care system’ (AIHW 2008b). Figure 1.1 provides an illustration of this concept.
Key:
Orange: Indicators relating to specific types of services
Blue: Indicators relating to specialty groups
Pink: Indicators relating to specific population groups
Green: Other indicators of health care safety and quality
Figure 1.1: How the national safety and quality indicator set relates to other indicator sets
Other indicator sets continue to provide different views of the health system such as for:
• Specific types of services, for example, Key Performance Indicators for Public Sector Mental Health Services (see < http://www.mhnocc.org/Benchmarking/>)
• Safety and quality of care for specialty groups, for example, Australian Council on Healthcare Standards (ACHS) clinical indicator sets (see <http://www.achs.org.au/>), or
• Specific population groups, for example, the Aboriginal and Torres Strait Islander Health Performance Framework (see <http://www.aihw.gov.au/ publications/index.cfm/title/10664>)
6
• Overall performance of governments, such as the COAG National Healthcare Agreement Performance Indicators (see <http://www.coag.gov.au/ intergov_agreements/ federal_financial_relations/index.cfm>).
As well as their concern with safety and quality aspects, these sets typically address other features of health services, such as their efficiency.
2.3 Definitions of safety and quality
Safety
This project uses the definition of safety adopted by the National Health Performance Committee (NHPC 2001: 17):
‘the avoidance or reduction to acceptable levels of actual or potential harm from health care or the environment in which health care is delivered’.
The focus of the definition is on preventing adverse or undesired health outcomes. The definition is used widely by different health organisations with minor variations. For example, it is defined as:
• Freedom from accidental injury (Institute of Medicine 2000: 18)
• The degree to which health care processes avoid, prevent, and ameliorate adverse outcomes or injuries that stem from the processes of health care (Kelley & Hurst 2006: 13)
• Freedom from hazard; that is, a circumstance or agent that can lead to harm, damage or loss (Runciman et al. 2007: 296-97).
Quality
There is no universally accepted definition of quality of health care. A common theme is that quality is about making the system better. Runciman et al. defines it as ‘the extent to which a health care service or product produces a desired outcome/s’ (Runciman et al. 2007: 297).
Quality is a multi-faceted concept which is often described in terms of its constituent dimensions, which can be referred to as domains of quality.
For the purposes of this project, the notion of quality began with the nine dimensions of health system performance in the NHPC’s National Health Performance Framework (NHPC 2001): effective, appropriate, efficient, responsive, accessible, safe, continuous, capable and sustainable.
In consultation with NIAG, it was decided that the indicator set should focus on four quality domains as defined by the NHPC (in addition to the safety domain):
• Appropriateness—‘care/intervention/action provided is relevant to the client’s needs and based on established standards’
• Effectiveness—‘care, intervention or action achieves desired outcome’
• Continuity of care—‘ability to provide uninterrupted, coordinated care or service across programs, practitioners, organisations and levels over time’

7
• Responsiveness—‘service provides respect for persons and is client orientated, including respect for dignity, confidentiality, participation in choices, promptness, quality of amenities, access to social support networks and choice of provider’.
In considering its notion of quality and how to apply it, NIAG agreed that the emphasis should be on appropriateness and that appropriateness indicators should be based on nationally agreed best practice guidelines wherever possible.
As noted by the NHPC, appropriateness overlaps with effectiveness. Typically, appropriateness is measured by process indicators and effectiveness by outcome indicators. Measures of appropriateness reflect the growing emphasis on evidence-based health care supported by guidelines and decision-support tools. Measures of effectiveness reflect public interest in whether the health care that they receive results in recovery, improved functioning or survival.
Although the domain of efficiency is sometimes regarded as important in considering quality of care, it was not included in this project. The domains of capability and sustainability were also not included explicitly. However, aspects of capability (an individual’s or service’s capacity to provide a health service based on skills and knowledge) and sustainability (a system’s or organisation’s capacity to provide infrastructure such as workforce, facilities and equipment, and to be innovative and respond to emerging needs) are relevant to some process and structure indicators in the proposed set.
Accessibility
The exclusion of accessibility from the dimensions of quality for this project deserves a special note. Accessibility is defined by the NHPC as the ability of people to obtain health care at the right place and right time irrespective of income, cultural background or physical location.
NIAG decided not to include accessibility mainly because of the project’s focus on the safety and quality of clinical health care actually given to patients, as opposed to whether health care services are provided or how readily patients can obtain entry to the health care system. For example, waiting times for services are not included, although the time that patients wait for services could affect the outcome of the services once they are received. It is important to note that a range of access indicators (such as elective surgery waiting times and emergency department waiting times) are reported nationally elsewhere, such as in the AIHW’s annual Australian Hospital Statistics reports.
Although access to care was not a focus, some outcome indicators in the proposed set reflect it as well as appropriateness and/or safety of care. An example is the potentially preventable hospitalisations indicator, which reflects access to and quality of non-hospital health care services. For such indicators it was judged that, although reflecting access issues, they also provide an indication of appropriateness that was important to include.
Equity
Equity has not been listed as a separate dimension of quality. Rather, it is regarded as relevant to all dimensions of safety and quality, as in the National Health Performance Framework. The NHPC (2001:1) notes that ‘equity was integral to the entire framework’. This is also in line with the thinking of the OECD, which defines equity as ‘the extent to which a system deals fairly with all concerned’ (Kelly & Hurst 2006: 13).
8
Equity is assessed by calculating and comparing values of the indicators for specific population or patient subgroups. The subgroups include patients of different provider types or subgroups, Indigenous and non-Indigenous people, different socio-economic groups, and residents of cities, rural and remote areas. Most of the indicators recommended in this report can be disaggregated by region of residence and by Indigenous status.
The National Hospital Morbidity Database (NHMD) is the source of data for several of the proposed indicators and can support these types of equity analyses. It includes variables that record a patient’s address, Indigenous status, age and sex, and the jurisdiction and sector (public or private) of the health facility. However, the range of details such as these is often not available in other data sources.
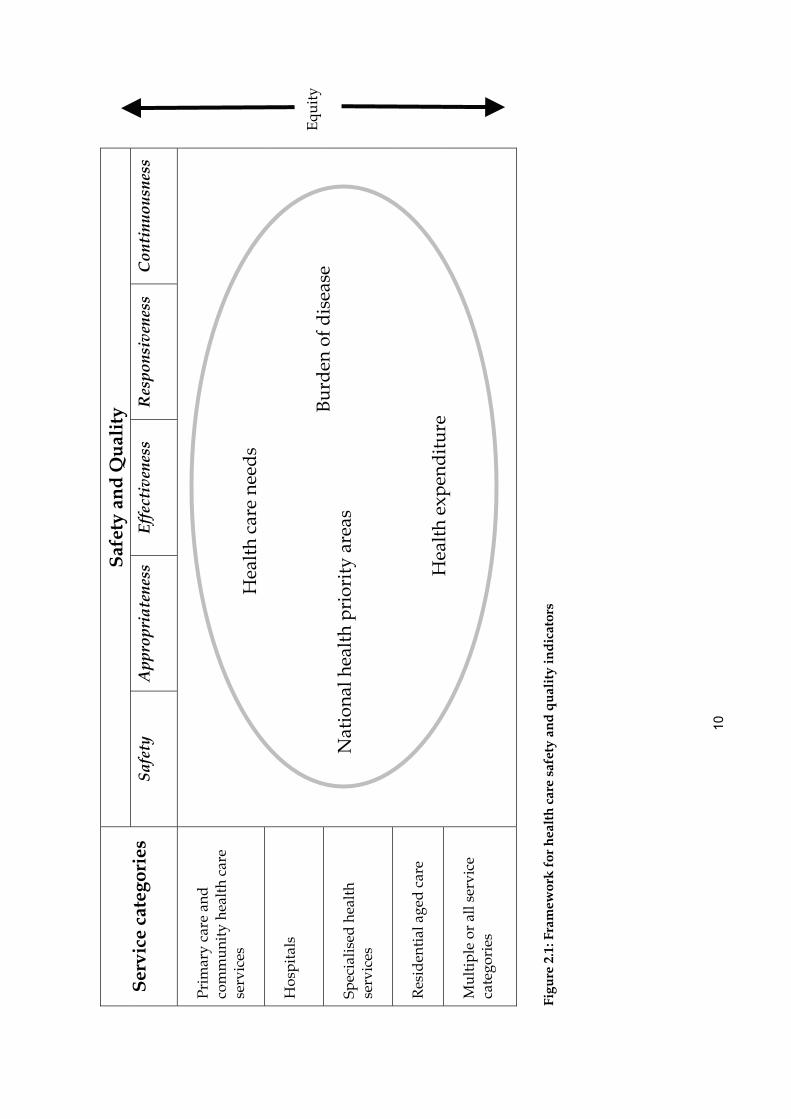
2.4 Framework for the indicators NIAG endorsed a framework for the indicator set to be used to help ensure coverage of the health system and of the different dimensions of quality. The framework (Figure 2.1) incorporated the relevant dimensions of quality from the National Health Performance Framework (as outlined above), and takes account of various views of the health care system, such as health care ‘settings’, health care ‘needs’ and other views.
The ‘health care settings’ view broadly includes the most common settings in which care is given, often describing the types of location but also the kinds of people receiving the care and the types of health professionals giving it. It is difficult to define ‘settings’ with any precision, and in a number of cases the categories overlap.
Six ‘service categories’ have been included. They have been based on the health service categories used in Australia’s health 2008 (AIHW 2008a), with an additional category of residential aged care. As this project specifically excluded aspects of the health care system focussed on public health, the service category ‘public health services’ used in Australia’s health 2008 has not been included.
The six service categories are:
• Primary care and community health care services—general practitioners, dental, allied health, community health, ambulance and royal flying doctors, complementary and alternative health, primary health care for Aboriginal and Torres Strait Islander peoples
• Hospitals—admitted patient care, emergency department, and out-patient and other non-admitted patient care
• Specialised health services—specialist medical practitioners, specialised mental health, sexual and reproductive health, alcohol and other drug treatment, hearing, palliative care, health services in the Australian defence force
• Residential aged care
• Multiple service categories—an additional category for the purposes of this project which includes those indicators which span multiple (but not all) categories of health or residential aged care service, and for which there is no clear distinction between the responsibilities or contribution of particular services
• All service categories—an additional category for the purposes of the project which includes those indicators which apply to all categories of health and aged care service. (for convenience of reporting, the ‘multiple’ and ‘all’ service categories are

9
combined in some summary sections of this report, including the depiction of the indicator framework in figure 2.1).
Five of the indicators in the set relate to more than one service category, however there is a distinct role for each service provider so they have not been included in ‘multiple service categories’. Instead, they are listed under each service category that applies (for example, ‘Malnutrition in care settings’ has been listed under both ‘Hospitals’ and ‘Residential aged care’).
The ‘health care needs’ view of the health care system focuses on health consumers and their health care needs. The broad categories used are staying healthy, getting better, living with chronic conditions, and coping with end of life. These categories are based on a framework used by the OECD for its Health Care Quality Indicators (HCQI) project.
Another view of the health care system is policy relevance, as expressed by the seven national health priority areas. These areas have been endorsed by the Australian Health Ministers' Advisory Council (AHMAC) and they are: arthritis and musculoskeletal conditions, asthma, cancer control, cardiovascular health, diabetes mellitus, injury prevention and control, and mental health.
Yet a further framework element is disease and injury groups which cause the major burden on Australians. Burden of disease is measured using a unit of measure called the DALY (disability-adjusted life year). One DALY is one year of ‘healthy life’ lost due to a disease or injury. YLD (years of life lost to disability) represents the non-fatal component of the DALY and has been used for this project to identify the key burden of disease areas. There are seven disease and injury areas having the greatest level of contribution to the burden of disease and injury. They are cancer, cardiovascular disease, mental disorders, neurological and sense disorders, chronic respiratory diseases, diabetes and musculoskeletal diseases (AIHW2008a: Table 2.17)
While the indicator set is not designed to focus on health expenditure as such, areas of great expenditure are always important to consider. Two ways of assessing coverage have been used in this respect. The first relates to the major areas described in AIHW reports on the expenditure on health goods and services in Australia (AIHW 2008d: Table A.3). Five of the areas used in the reports’ framework which have contributed the most to total expenditure are Hospitals, Medical services, Dental services, Community health and other, and Other health practitioners. Expenditure on medications has been excluded here because this only reflects the quantity and costs of medications prescribed, rather than aspects of the quality of the related clinical health care provision.
The second is in relation to the broad groups of disease and injury accounting for the greatest amount of health expenditure. These have been reported in Australia’s Health 2008 (AIHW 2008a: Table 8.9) and are cardiovascular, oral health, mental disorders, musculoskeletal, neoplasms (including cancer), injuries, respiratory, digestive system, nervous system, and genitourinary.
Assigning indicators to the various categories in the indicator framework is mostly straight-forward. Special judgment has been exercised in some cases; not all indicators have been able to be assigned to a category within each ‘view’ and some indicators have been viewed as relevant to more than one category.
10
Saf
ety
and
Qu
alit
y S
ervi
ce c
ateg
orie
s Sa
fety
A
ppro
pria
tene
ssEf
fect
iven
ess
Res
pons
iven
ess
Cont
inuo
usne
ss
Pri
mar
y ca
re a
nd
com
mu
nity
hea
lth
care
se
rvic
es
Hos
pita
ls
Spec
ialis
ed h
ealt
h se
rvic
es
Res
iden
tial
age
d c
are
Mu
ltip
le o
r al
l ser
vice
ca
tego
ries
Figu
re 2
.1: F
ram
ewor
k f
or h
ealt
h c
are
safe
ty a
nd
qu
alit
y in
dic
ator
s
Hea
lth
expe
ndit
ure
Bu
rden
of d
isea
se
Nat
iona
l hea
lth
prio
rity
are
as
Hea
lth
care
nee
ds
Equ
ity
11
2.5 Support projects
Three support projects were undertaken in parallel with the National Indicators Project, to support the selection of national indicators. Summaries of the reports from these projects are provided in Appendix 5.
The first was an analysis of patient safety indicators developed by the Organisation for Economic Cooperation and Development (OECD). It demonstrated that some of the indicators may be suitable for incorporation into a national health care safety and quality indicator set for Australia. Such indicators could be suitable for international comparisons.
The second study, Measuring and Reporting Mortality, assessed the feasibility of national indicators of in-hospital mortality, using routinely collected admitted patient data. The study concluded that hospital administrative data are suitable for generating hospital standardised mortality ratios for three mortality groups (high-risk cases, lower-risk cases and all cases) and for individual hospitals and hospital peer groups. It recommends that the indicators be used as screening tools signalling that safety and quality problems might exist and could be further investigated. The Measuring and Reporting Mortality report has now been published (AIHW 2009).
The third study provided further detail on the national indicators relating to primary health care, to inform the consultation process. In addition the report provided information on indicators of safety and quality in primary health care in use in Australia and internationally and potential sources of data for primary health care indicators in Australia. Different methods of analysing and presenting primary health care indicators were discussed and examples provided.
2.6 How the indicators were selected The indicators were selected to achieve broad coverage of important safety and quality issues in Australia, drawing on some existing indicator sets, on the framework and support projects, and on an assessment of how ‘useful’ and measurable any candidate indicators were likely to be.
A preliminary list of possible indicators was compiled and an initial selection of 67 indicators made. This selection was primarily aimed at ensuring a broad coverage of the major issues of importance for health care safety and quality in Australia. The decisions taken were based on:
• Initial consultations with stakeholders
• A scan of the environment to identify key and emerging issues for safety and quality in Australia and internationally (involving 29 different sources including the OECD and the Agency for Healthcare Research and Quality (AHRQ 2008))
• Advice from the ACSQHC on the development of performance indicators for the National Healthcare Agreement.
The initial list was discussed by NIAG at its July 2008 meeting, and subsequently refined and amended to a set of 58 which were proposed in the Towards National Indicators of Safety and Quality in Health Care discussion paper. This discussion paper formed the basis of

12
consultations with a wide range of stakeholders across Australia from November 2008 to February 2009.
Drawing on feedback received through the consultation process and continued work within the AIHW to populate the indicators with readily available data, this list was revised to the 55 recommended in this report. This included the removal of a number of the proposed indicators (for further details see section 3.5) and addition of several new or alternative indicators.
Sentinel events
‘Sentinel events’ are events which potentially or actually lead to serious harm to patients and can signal serious failures in the system. They are routinely collated for all public hospitals in Australia and were reported in summary for public and private hospitals by the Commission (ACSQHC 2008). On the advice of NIAG, no measures of specific sentinel events have been included in this set even though such indicators would be within scope as defined in section 2.2.
In part the decision of NIAG was taken because the total number of sentinel events is small (in 2004–05, the number was 130 across Australia’s entire public hospital sector (AIHW/ACSQHC 2007)). Counts of sentinel events are therefore unlikely to be sensitive enough to changes in safety, so they are not considered to be reliable indicators.
Although there are no indicators for specific sentinel events, a related structure indicator has been included. It focuses on the appropriate monitoring of incidents including sentinel events at health care facilities.
Indicator analysis and assessment
As part of the process of selecting the recommended indicator set, a range of analyses was done to determine the usefulness of individual indicators and of the set as a whole.
Typically, the criteria used to select the indicators include various measures of indicator usefulness. For example, the NHPC (NHPC 2001) says that indicators should:
• Be worth measuring
• Be measurable for diverse populations
• Be understood by people who need to act
• Galvanise action
• Be relevant to policy and practice
• Measurement over time will reflect results of actions
• Be feasible to collect and report
• Comply with national processes of data definitions.
Additional criteria have been formulated to apply to sets of indicators as opposed to individual indicators:
• Cover the spectrum of the health issue
• Reflect a balance of indicators for all appropriate parts of the framework
• Identify and respond to new and emerging issues

13
• Provide feedback on where the system is working well, as well as for areas for improvement.
Several of these criteria are applied through our assessment of the indicators against the framework, which has been designed to ensure coverage of the relevant health care safety and quality issues, policy relevance (through inclusion of the NHPAs), and coverage of all aspects of the health care system.
Stakeholder advice on which indicators were useful and should be included also contributed to decisions about exclusion, inclusion or refinement.
A further analysis was undertaken to establish the measurability of the selected indicators. The indicators recommended have not been limited to those for which data are readily available, so the set was assessed to identify those which are able to be reported now and those which require further development.
Four categories of measurability have been used in the indicator summaries in Appendix 1:
• Currently reportable – as per recommended specification
• Currently reportable – data development required to meet recommended specifications
• Not currently reportable – indicator and/or data development required
• Concept proposed for further development.
‘Data development required’ indicates that further work is needed to develop or update data sources to enable national reporting of the indicator (for example, when data are collected in some jurisdictions but not all, or when an additional data element is needed in an existing data collection).
‘Indicator development required’ indicates that the most appropriate definition, numerator and denominator for the indicator need to be identified and agreed (for example, when there are several possible ways of measuring the concept).
‘Concept proposed for further development’ indicates that a concept is important but needs work because there is currently no agreed definition and no means of measurement. Please refer to section 4.2 for further discussion.
Review of international comparisons available for each of the indicators has also been undertaken.
Further detail regarding the measurability of each of the recommended indicators is provided in the indicator summaries in Appendix 1, including:
• The data specifications, including appropriate population, for each of the recommended indicators (where known)
• The current availability and quality of data for the recommended indicators
• Data for indicators where data are readily available to the AIHW
• Any suggested data development work to achieve national comparability for the recommended indicators, and to fill gaps in indicator coverage.
National Healthcare Agreement performance indicators
There is some overlap between the performance indicators in the National Healthcare Agreement and the indicators proposed here. The National Healthcare Agreement includes

14
18 indicators relevant to health care safety and quality, and have been reflected in the indicators in this report. This overlap is noted in the indicator descriptions in Appendix 1.

15
3 Recommended indicators: a summary
This section provides summary information on the recommended indicator set, including a list of the indicators, key messages from stakeholders, and an assessment of the indicators against the criteria detailed in Section 2 (including the indicator framework, indicator measurability, and international comparisons available).
Detailed information on each of the recommended indicators is available in Appendix 1, including rationale, indicator specification, and example reporting where data has previously been published or was otherwise readily available to the AIHW.
Detailed information on the alignment of each of the indicators to the indicator framework is available in Appendix 3.
3.1 List of recommended indicators
Table 3.1 Health care safety and quality indicators
Primary care and community health services 1 Enhanced primary care services in general practice 2 General practices with a register and recall system for patients with chronic disease 3 People with moderate to severe asthma who have a written asthma action plan 4 Management of hypertension in general practice 5 Management of arthritis and musculoskeletal conditions 6 Mental health care plans in general practice 7 Annual cycle of care for people with diabetes mellitus 8 Cervical cancer screening rates 9 Immunisation rates for vaccines in the national schedule 10 Eye testing for target groups 11 Quality of community pharmacy services 12 Developmental health checks in children 13 People receiving a medication review Hospitals
14 Assessment for risk of venous thromboembolism in hospitals 15 Pain assessment in the emergency department 16 Reperfusion for acute myocardial infarction in hospitals 17 Stroke patients treated in a stroke unit 18 Complications of transfusion 19 Health care associated infections acquired in hospital 20 Staphylococcus aureus (including MRSA) bacteraemia in hospitals 21 Adverse drug events in hospitals 22 Intentional self-harm in hospitals 23 Malnutrition in hospitals and residential aged care facilities 24 Pressure ulcers in hospitals and residential aged care facilities 25 Falls resulting in patient harm in hospitals and residential aged care facilities 26 Complications of anaesthesia 27 Accidental puncture/laceration in hospitals 28 Obstetric trauma - third and fourth degree tears 29 Birth trauma – injury to neonate 30 Postoperative haemorrhage 31 Postoperative venous thromboembolism 32 Unplanned return to operating theatre

16
33 Unplanned re-admission to an intensive care unit 34 Hospital standardised mortality ratio (HSMR) 35 Death in low mortality DRGs 36 Independent peer review of surgical deaths 37 Discharge medication management for acute myocardial infarction 38 Timely transmission of discharge summaries Specialised health services
39 Mental health admitted patients having seclusion 40 Post-discharge community care for mental health patients 41 Quality of palliative care 42 Functional gain achieved in rehabilitation 43 Multi-disciplinary care plans in sub-acute care (5) Management of arthritis and musculoskeletal conditions
Residential aged care 44 Oral health in residential aged care
(13) People receiving a medication review (23) Malnutrition in hospitals and residential aged care facilities (24) Pressure ulcers in hospitals and residential aged care facilities (25) Falls resulting in patient harm in hospitals and residential aged care facilities
Multiple service categories 45 Unplanned hospital re-admissions 46 Inappropriate co-prescribing of medicines 47 Selected potentially preventable hospitalisations 48 End stage kidney disease in people with diabetes 49 Lower-extremity amputation in people with diabetes 50 Cancer Survival 51 Failure to diagnose 52 Potentially avoidable deaths All service categories
53 Patient experience 54 Presence of appropriate incident monitoring arrangements 55 Accreditation of health care services
3.2 Alignment with the indicator framework An analysis of the alignment of the indicators with the framework is summarised in Tables 3.2 to 3.7. The indicators have been grouped under the headings for service categories and assessed against the other elements of the framework.
Appropriateness and safety are the most frequent dimensions of safety and quality associated with the proposed indicators, consistent with the elements of quality that were chosen for special emphasis in this project (see Section 2.3).
All National Health Priority Areas are covered by the indicators, although there is an emphasis on cardiovascular health.
The mapping of the indicators to the burden of disease and injury groups and to the health expenditure groupings was not a straight-forward process. The approach taken was to map an indicator to such a group only if this was the primary focus of the indicator. If the indicator encompassed several groups it was not mapped; for example, ‘failure to diagnose’ has not been mapped to a specific disease/group as it might relate to any area. Therefore, the distribution presented in Tables 3.3 to 3.6 probably understates the coverage of the major burden of disease and injury and expenditure groups.

17
The distribution of indicators across the ‘health care needs’ domains is uneven, with the ‘Getting better’ and ‘Living with chronic conditions’ categories accounting for the majority of indicators. Such an imbalance is not surprising given the focus on clinical care. However, it remains a matter of judgment whether the current distribution across the categories is ideal.
The five indicators that appear in more than one service category have only been counted once in these assessments, in the first category in which they are listed (see Table 3.1). This means that residential aged care is under-represented in these tables.
Through this analysis, a number of areas appear to be under-represented and this is discussed in section 4.2.

18
Tab
le 3
.2: D
istr
ibu
tion
of
ind
icat
ors
by
dim
ensi
ons
of q
ual
ity
D
imen
sio
n o
f Q
ual
ity (
a)
Hea
lth
Ser
vice
Cat
ego
ry
Saf
ety
Ap
pro
pri
aten
ess
Eff
ecti
ven
ess
C
on
tin
uit
y o
f C
are
Res
po
nsi
ven
ess
Prim
ary
care
and
com
mun
ity h
ealth
se
rvic
es
1
13
2 9
2
Hos
pita
ls
18
17
10
2 1
Spe
cial
ised
hea
lth s
ervi
ces
1
5 1
3 1
Res
iden
tial a
ged
care
0
1 1
1 0
Mul
tiple
or
all s
ervi
ce c
ateg
orie
s
5 4
9 4
3
To
tal
25
42
23
19
7
(a)
An
indi
cato
r ca
n be
ass
ocia
ted
with
mor
e th
an o
ne d
imen
sion
of q
ualit
y. In
dica
tors
that
app
ear
in m
ore
than
one
ser
vice
cat
egor
y ha
ve o
nly
been
cou
nted
on
ce,
in th
e fir
st c
ateg
ory
in w
hich
the
y ar
e lis
ted.
Tab
le 3
.3: D
istr
ibu
tion
(a) o
f in
dic
ator
s b
y N
atio
nal
Hea
lth
Pri
orit
y A
reas
N
atio
nal
He
alth
Pri
ori
ty A
rea
(a)
Hea
lth
Ser
vice
Cat
ego
ry
Art
hri
tis
and
mu
scu
losk
ele
tal
con
dit
ion
s A
sth
ma
Can
cer
Co
ntr
ol
Car
dio
vasc
ula
r h
ealt
h
Dia
bet
es
mel
litu
s In
jury
pre
ven
tio
n
and
co
ntr
ol
Men
tal
hea
lth
Prim
ary
care
and
com
mun
ity h
ealth
se
rvic
es
1
1 1
1 1
0 0
Hos
pita
ls
0 0
0 5
0 1
0
Spe
cial
ised
hea
lth s
ervi
ces
0
0 0
0 0
0 2
Res
iden
tial a
ged
care
0
0 0
0 0
1 0
Mul
tiple
or
all s
ervi
ce c
ateg
orie
s
0 1
1 1
2 1
0
To
tal
1 2
2 7
3 3
2
(a)
Not
all
indi
cato
rs a
re a
ssoc
iate
d w
ith a
Nat
iona
l Hea
lth P
riorit
y A
rea.
An
indi
cato
r ca
n be
ass
ocia
ted
with
mor
e th
an o
ne N
atio
nal H
ealth
Prio
rity
Are
a. In
dica
tors
tha
t ap
pear
in m
ore
than
one
ser
vice
cat
egor
y ha
ve o
nly
been
cou
nted
onc
e, in
the
first
cat
egor
y in
whi
ch t
hey
are
liste
d.

19
Tab
le 3
.4: D
istr
ibu
tion
(a) o
f in
dic
ator
s b
y m
ajor
bu
rden
of
dis
ease
gro
up
s
M
ajo
r B
urd
en o
f D
isea
se G
rou
ps(a
)
Hea
lth
Ser
vice
Cat
ego
ry
Men
tal
dis
ord
ers(b
)
(13.
3%
) N
euro
log
ica
l an
d s
ens
e d
iso
rder
s (1
1.9
%)
Ch
ron
ic r
esp
ira
tory
d
isea
se (
7.1
%)
Dia
bet
es
(5.5
%)
Car
dio
vasc
ula
r d
isea
se (
18.0
%)
Mu
scu
losk
ele
tal
dis
ease
s (4
.0%
) C
ance
r
(19.
0%
)
Prim
ary
care
and
com
mun
ity h
ealth
se
rvic
es
1
1 1
1 1
1 1
Hos
pita
ls
0 0
0 0
5 0
0
Spe
cial
ised
hea
lth s
ervi
ces
2
0 0
0 0
0 0
Res
iden
tial a
ged
care
0
0 0
0 0
0 0
Mul
tiple
ser
vice
cat
egor
ies
0
0 0
2 0
0 1
To
tal
3 1
1 3
6 1
2
(a)
Not
all
indi
cato
rs a
re a
ssoc
iate
d w
ith a
bur
den
of d
isea
se.
An
indi
cato
r ca
n be
ass
ocia
ted
with
mor
e th
an o
ne b
urde
n of
dis
ease
. In
dica
tors
that
app
ear
in m
ore
than
one
ser
vice
cat
egor
y ha
ve o
nly
been
cou
nted
onc
e,
in t
he fi
rst c
ateg
ory
in w
hich
they
are
list
ed.
(b)
Per
cent
ages
sho
wn
are
the
prop
ortio
n of
tota
l ‘di
sabi
lity-
adju
sted
life
yea
r’ at
trib
utab
le to
the
dise
ase
grou
p (s
ee T
able
2.1
7 of
AIH
W 2
008)
. Oth
er d
isea
se g
roup
s no
t lis
ted
in t
he ta
ble
cum
ulat
ivel
y co
ntrib
uted
14.
3% t
o to
tal b
urde
n of
dis
ease
.
Tab
le 3
.5: D
istr
ibu
tion
(a) o
f in
dic
ator
s b
y m
ajor
are
as o
f h
ealt
h e
xpen
dit
ure
up
dat
ed
M
ajo
r A
reas
of
Hea
lth
Exp
en
dit
ure
(a)
Hea
lth
Ser
vice
Cat
ego
ry
Ho
spit
als(b
) (39
.0%
) M
edic
al s
ervi
ces
(19.
1%
) D
enta
l se
rvic
es (
6.6
%)
Co
mm
un
ity
hea
lth
an
d o
ther
(5.
0%
) O
ther
hea
lth
p
ract
itio
ner
s (3
.8%
)
Prim
ary
care
and
com
mun
ity h
ealth
ser
vice
s
0 12
0
4 1
Hos
pita
ls
25
0 0
0 0
Spe
cial
ised
hea
lth s
ervi
ces
2
4 0
4 2
Res
iden
tial a
ged
care
0
0 0
0 0
Mul
tiple
or
all s
ervi
ce c
ateg
orie
s
10
10
4 7
4
To
tal
37
26
4 15
7
(a)
An
indi
cato
r ca
n be
ass
ocia
ted
with
mor
e th
an o
ne m
ajor
are
a of
exp
endi
ture
. In
dica
tors
that
app
ear
in m
ore
than
one
ser
vice
cat
egor
y ha
ve o
nly
been
cou
nted
onc
e, in
the
first
cat
egor
y in
whi
ch
they
are
list
ed.
(b)
Per
cent
ages
sho
wn
are
the
prop
ortio
ns o
f to
tal h
ealth
exp
endi
ture
for
200
6-07
(se
e F
igur
e 4.
1 of
AIH
W 2
008)
. O
ther
are
as o
f hea
lth e
xpen
ditu
re n
ot li
sted
in t
he ta
ble
cum
ulat
ivel
y co
ntrib
uted
26
.5%
to
tota
l exp
endi
ture
.

20
Tab
le 3
.6: D
istr
ibu
tion
(a) o
f in
dic
ator
s b
y m
ajor
dis
ease
an
d in
jury
gro
up
con
trib
uti
ng
to m
ajor
are
as o
f h
ealt
h e
xpen
dit
ure
M
ajo
r D
isea
se a
nd
Inju
ry G
rou
p c
on
trib
uti
ng
to
Maj
or
Are
as o
f H
ealt
h E
xpe
nd
itu
re(a
)
Hea
lth
Ser
vice
Cat
ego
ry
Car
dio
vasc
ula
r(b
) (11
.2%
)
Ora
l h
ealt
h
(10.
1%
)
Men
tal
dis
ord
ers
(7.8
%)
Mu
scu
losk
ele
tal
(7.5
%)
Neo
pla
sms
(7.2
%)
Inju
ries
(6.5
%)
Res
pir
ato
ry
(6.3
%)
Dig
esti
ve
sys
tem
(5
.9%
)
Ner
vou
s s
yste
m
(5.2
%)
Gen
ito
-u
rin
ary
(4.5
%)
Prim
ary
care
and
com
mun
ity
heal
th s
ervi
ces
1 0
1 1
1 0
1 0
1 0
Hos
pita
ls
5 0
0 0
0 2
0 0
0 0
Spe
cial
ised
hea
lth s
ervi
ces
0 0
2 0
0 0
0 0
0 0
Res
iden
tial a
ged
care
0
1 0
0 0
0 0
0 0
0
Mul
tiple
ser
vice
cat
egor
ies
0
0 0
0 1
0 0
0 0
0
To
tal
6 1
3 1
2 2
1 0
1 0
(a)
Not
all
indi
cato
rs a
re a
ssoc
iate
d w
ith a
bro
ad d
isea
se g
roup
. A
n in
dica
tor
can
be a
ssoc
iate
d w
ith m
ore
than
one
bro
ad d
isea
se g
roup
. Ind
icat
ors
that
app
ear
in m
ore
than
one
ser
vice
cat
egor
y ha
ve o
nly
been
cou
nted
on
ce,
in th
e fir
st c
ateg
ory
in w
hich
the
y ar
e lis
ted.
(b)
Per
cent
ages
sho
wn
are
the
prop
ortio
ns o
f to
tal h
ealth
exp
endi
ture
for
200
4-05
(se
e T
able
8.9
of
AIH
W 2
008)
. O
ther
dis
ease
and
inju
ry g
roup
s no
t lis
ted
in th
e ta
ble
cum
ula
tivel
y co
ntrib
uted
28.
8% t
o to
tal h
ealth
ex
pend
iture
.
Tab
le 3
.7: D
istr
ibu
tion
of
ind
icat
ors
by
hea
lth
nee
ds
dom
ain
D
imen
sio
n o
f Q
ual
ity (
a)
Hea
lth
Ser
vice
Cat
ego
ry
Sta
yin
g h
ealt
hy
Get
tin
g B
ette
r L
ivin
g w
ith
ch
ron
ic
con
dit
ion
s C
op
ing
wit
h e
nd
of
life
Prim
ary
care
and
com
mun
ity h
ealth
se
rvic
es
4
0 8
0
Hos
pita
ls
0 20
0
0 S
peci
alis
ed h
ealth
ser
vice
s
0 2
2 1
Res
iden
tial a
ged
care
1
0 0
0 M
ultip
le o
r al
l ser
vice
cat
egor
ies
1
3 4
0
Tot
al
6 25
14
1
(a)
Ind
icat
ors
that
app
ear
in m
ore
than
one
ser
vice
cat
egor
y ha
ve o
nly
been
cou
nted
onc
e, in
the
first
cat
egor
y in
whi
ch t
hey
are
liste
d.

21
3.3 Measurability, data sources and international comparisons A majority of the indicators are able to be reported immediately, though in more than half of these cases current reporting is not completely in line with the recommended specifications. The overall picture is summarised in Table 3.8 below. Following this is a summary of the relevant data sources and the frequency with which reporting can be done using these sources (Table 3.9), and a discussion and summary table (Table 3.10) of the international comparisons available for these indicators.

22
Tab
le 3
.8: D
istr
ibu
tion
of
ind
icat
ors
by
mea
sura
bil
ity
cate
gory
Cu
rren
tly
rep
ort
able
–
as p
er r
eco
mm
en
ded
sp
ecif
ica
tio
n
Cu
rren
tly
rep
ort
able
–
dat
a d
eve
lop
me
nt
req
uir
ed t
o m
eet
reco
mm
end
ed s
pec
ific
atio
n
No
t c
urr
entl
y re
po
rta
ble
–
ind
ica
tor
an
d/o
r d
ata
de
velo
pm
ent
req
uir
ed
Co
nce
pt
pro
po
sed
fo
r fu
rth
er
de
velo
pm
ent
Enh
ance
d pr
imar
y ca
re s
ervi
ces
in g
ener
al
prac
tice
Gen
era
l pra
ctic
es w
ith a
reg
iste
r an
d re
call
syst
em fo
r pa
tien
ts w
ith c
hron
ic d
isea
se
Ass
essm
ent f
or r
isk
of v
enou
s th
rom
boem
bol
ism
in h
ospi
tals
M
anag
emen
t of
chro
nic
pain
in a
rthr
itis
in
mus
culo
skel
etal
con
ditio
ns
Men
tal h
ealth
car
e pl
ans
in g
ener
al p
ract
ice
Peo
ple
with
mod
erat
e to
sev
ere
ast
hma
who
ha
ve a
writ
ten
asth
ma
plan
P
ain
asse
ssm
ent i
n th
e em
erge
ncy
depa
rtm
ent
Tim
ely
tran
smis
sion
of d
isch
arge
sum
mar
ies
Ann
ual c
ycle
of c
are
for
peop
le w
ith d
iabe
tes
me
llitu
s M
anag
emen
t of
hyp
ert
ensi
on in
gen
eral
pr
actic
e In
depe
nden
t pe
er
revi
ew
of s
urgi
cal d
eath
s Q
ualit
y of
pal
liativ
e ca
re
Sel
ecte
d po
tent
ially
pre
vent
able
ho
spita
lisat
ions
R
eper
fusi
on fo
r a
cute
myo
card
ial i
nfar
ctio
n in
hos
pita
ls
Dis
char
ge m
edic
atio
n m
anag
eme
nt fo
r ac
ute
myo
card
ial i
nfar
ctio
n In
appr
opria
te c
o-pr
escr
ibin
g of
me
dici
nes
End
sta
ge k
idne
y di
seas
e in
peo
ple
with
di
abet
es
Str
oke
patie
nts
trea
ted
in a
str
oke
unit
Ora
l hea
lth in
res
iden
tial a
ged
care
P
atie
nt e
xpe
rien
ce
Low
er-e
xtre
mity
am
puta
tion
in p
eop
le w
ith
diab
etes
H
ealth
car
e as
soci
ated
infe
ctio
ns a
cqui
red
in
hosp
ital
Com
plic
atio
ns o
f tra
nsfu
sion
F
ailu
re to
dia
gno
se
Com
plic
atio
ns o
f ana
esth
esia
S
taph
yloc
occu
s au
reus
(in
clud
ing
MR
SA
) ba
cter
aem
ia in
hos
pita
ls
Pre
senc
e of
app
ropr
iate
inci
dent
mon
itorin
g ar
rang
emen
ts
Qua
lity
of c
omm
unity
pha
rmac
y se
rvic
es
Acc
iden
tal p
unct
ure/
lace
ratio
n in
hos
pita
ls
Adv
erse
dru
g ev
ents
in h
ospi
tals
Mul
ti-di
scip
linar
y ca
re p
lans
in s
ub-a
cute
ca
re
Obs
tetr
ic tr
aum
a –
third
and
fou
rth
deg
ree
tear
s In
tent
iona
l sel
f har
m in
hos
pita
ls
Birt
h tr
aum
a –
inju
ry to
neo
nate
U
npla
nned
ret
urn
to o
pera
ting
thea
tre
Pos
tope
rativ
e ha
emor
rha
ge
Unp
lann
ed r
e-ad
mis
sion
to a
n In
tens
ive
Car
e U
nit
Pos
tope
rativ
e ve
nous
thro
mbo
embo
lism
D
eath
in lo
w m
orta
lity
DR
Gs
Hos
pita
l sta
ndar
dise
d m
orta
lity
ratio
(H
SM
R)
Men
tal h
ealth
inpa
tient
s ha
ving
sec
lusi
on
Pos
t-di
scha
rge
com
mun
ity c
are
for
men
tal
heal
th p
atie
nts
Peo
ple
rece
ivin
g a
med
icat
ion
revi
ew
Can
cer
surv
ival
P
ress
ure
ulce
rs in
hos
pita
ls a
nd r
esid
entia
l ag
ed c
are
faci
litie
s
Pot
entia
lly a
void
able
dea
ths
Fal
ls r
esul
ting
in p
atie
nt h
arm
in h
ospi
tals
an
d re
side
ntia
l age
d ca
re fa
cilit
ies
Acc
redi
tatio
n of
hea
lth c
are
serv
ices
M
aln
utrit
ion
in h
ospi
tals
and
res
iden
tial a
ged
care
fa
cilit
ies
Cer
vica
l can
cer
scre
enin
g ra
tes
Unp
lann
ed h
ospi
tal r
e-ad
mis
sion
s
Im
mun
isat
ion
rate
s fo
r va
ccin
es in
the
natio
nal s
ched
ule
Fun
ctio
nal g
ain
achi
eved
in r
ehab
ilita
tion
D
evel
opm
ent h
ealth
che
cks
in c
hild
ren
E
ye te
stin
g fo
r ta
rget
gro
ups

23
Table 3.9: Data sources and indicator measurability category
Measurability category(a) Data source Data availability
A B C D
NHMD Annual 8 10
Emergency department NMDS Annual 1
National Perinatal Data Collection Annual 1
Mental health care national minimum datasets (admitted, residential and/or community)
Annual 1 1
AIHW National Mortality Database Annual 1
Australasian Association of Cancer Registries
Annual 1
Medicare Australia (MBS) Continuous 3 3
Medicare Australia (PBS) Continuous 1
Australia and New Zealand Dialysis and Transplant Registry (ANZDATA)
Annual 1
National stroke audit Every 2 years 1
Accreditation organisations Annual 1
National Cervical Screening Program Annual 1
Immunisation Registers (adult and child) Annual 1
None identified (or not confirmed) 4 7 9
(a) A – Currently reportable – as per recommended specification
B - Currently reportable – data development required to meet recommended specification
C - Not currently reportable – indicator and/or data development required
D - Concept proposed for further research and development
International comparisons were identified for over half of the indicators (29 of 55), and further comparisons may have been found if the search had been extended to sources in languages other than English. This includes a mix of indicators which are already in use and some which are proposed indicators. Proposed indicators include those in the Pan-Canadian Primary Health Care Indicators set, which do not have a confirmed commencement date as yet, and those in the OECD Patient Safety Indicators set which are being collected and reported for the first time in 2009.
The strong representation of the UK and USA as sources for international comparisons (Table 3.8) reflects the large amount of work dedicated to patient safety and quality in those two countries. Europe, Canada and New Zealand provide more international comparisons than Table 3.8 implies because they participate in the OECD and so their data are often included under the OECD category.

24
Table 3.10: Distribution (a) of indicators by availability of international comparisons
International source of indicator (a)
Health Service Category OECD
New Zealand
European Union
United Kingdom
United States of America Canada
Primary care and community health services
2 0 1 4 4 2
Hospitals 9 2 0 6 11 1
Specialised health services
1 0 0 0 0 0
Residential aged care 0 0 0 0 0 0
Multiple or all service categories
3 1 1 2 3 3
Total 15 3 2 12 18 6
(a) Not all indicators have international comparisons available. Some indicators have more than one available international comparison.

25
4 Taking the indicators forward
This section briefly discusses issues suggested for consideration by the Commission in planning to implement and build upon this indicator set. These suggestions draw on discussions with the Commission and with NIAG, and on feedback from stakeholders through the consultation process.
Section 4.1 provides advice on how to use the indicators, including public reporting, the levels at which indicators should be reported, and possible reporting formats.
Section 4.2 provides information to assist in prioritising work to implement and build upon the recommended indicators, including information on which indicators already have relevant work in progress, health sector reform processes that may impact on indicator work more generally, and gaps in the coverage of the indicator set.
4.1 Reporting of indicators – public reporting, levels and frequency, reporting formats A key purpose of this project has been to enable the Commission to report publicly on the state of safety and quality in health care. However, the appropriateness and usefulness of public reporting of indicators in the health area remains a contentious issue in Australia. High level national reporting of data on health care safety and quality has been undertaken to a limited extent by the National Health Performance Committee and in publications such as in the AIHW’s Australia’s health. However, Australia has yet to follow the lead of countries such as the United States of America and United Kingdom which have adopted detailed regular public reporting at the provider level.
Reporting of indicators of safety and quality in health arguably could serve two main purposes: to provide transparency and to inform decision-making about overall priorities and system-level strategies for safety and quality improvement; and to inform quality improvement activities of service providers. To achieve these purposes a combination of both national level reporting and reporting at lower levels, for example facility and organisation level, could be required.
Public reporting
Where recommendations are made to provide public reporting as a means of improving quality in health care, a number of assumptions typically underpin this including: that data are accurate; that the public can access, correctly interpret and act upon report contents; that reports motivate hospital clinicians and managers to improve quality of care; and that there are no unintended adverse effects of public reporting (Scott & Ward 2006).
These assumptions are mirrored by a range of areas of concern regarding public reporting including that:
• There is uncertainty whether consumers’ views of and decision-making regarding health care are significantly impacted by publicly reported information on health care quality. There is evidence that consumers rate anecdotal evidence from family

26
and friends more highly than empirical evidence. As discussed by Marshall et al. (2000), the reasons for consumers’ lack of interest in and use of such data may include difficulty in understanding the information, disinterest in the nature of the information available, lack of trust in the data, lack of timely access to the information, and lack of choice.
• Similarly, as evident in the feedback received from a number of our stakeholders through the consultation process, there continue to be concerns among some practitioners regarding public reporting on the safety and quality of health care, relating particularly to whether the data are reliable and whether selected indicators provide a valid reflection of the quality of care and outcomes achieved.
• Potential adverse consequences of public reporting in terms of the behaviours and practices of health care providers, as identified by Scott and Ward (2006), may include: gaming, early discharge, avoidance of high risk patients, out-sourcing of high risk patients, adoption of defensive medicine, withdrawal or disengagement, and tunnel vision. The adoption of such behaviours could lead to an inappropriate shift in focus from the needs of patients to meeting reporting requirements.
• It is important to consider risk adjustment in public reporting where comparisons are made between different providers and jurisdictions. A failure to do so may lead to concerns about the validity of the reporting and may diminish its usefulness as a tool to drive quality improvements.
While the question of whether to report publicly, particularly at the facility or organisation level, remains contentious in Australia, evidence suggests this could be the most effective approach (Fung et al. 2008). For example, a study by Hibbard et al. (2003) compared the degree to which performance information stimulated quality improvement activity in hospitals if it was publicly reported or if hospitals received private reports. They reported finding strong evidence that “....making performance information public stimulates quality improvement in the areas where performance is reported to be low. Since quality improvement efforts among the public-report hospitals appear to be significantly greater than in hospitals given only private reports, there is added value to making performance information public.”
While public reporting has reportedly been found to stimulate quality improvement activities, the link to improvement in outcomes has yet to be clearly demonstrated, and the effect of public reporting on aspects of safety and quality including effectiveness, safety and responsiveness (patient-centeredness) remains uncertain (Fung et al. 2008).
Similarly, while the impact of public reporting on quality improvement activity at the facility and organisation level has been extensively reviewed, the impact of public reporting at other levels has not. For example, Fung et al. (2008) found no published studies of the effect of public reporting of performance data on quality improvement activity among physicians or physician groups.
In part these findings (or the lack thereof) may reflect the level at which the responsibility and particularly the ability to act on the information lies. For most of the proposed indicators this is mixed in terms of responsibility; however the ability to directly act arguably lies primarily at the facility and organisation level. Governments have responsibility for the health system as a whole and are able to influence quality improvement initiatives and activities through policy and funding (which will to a degree be influenced by indicator reporting). However they are often unable to take direct action to improve safety and quality. Similarly, specific clinician or professional groups and educational institutions have

27
a level of responsibility in terms of establishing standards of practice; however, they have limited ability to take direct action to improve safety and quality. Within the bounds of these policies, standards and levels of funding, facilities and organisations are able to take action in response to issues identified through indicator reporting, managing and targeting resources and activity within the facility or organisation (including clinicians and other staff) to remedy problems identified and improve practice.
Frequency and levels of reporting
A related issue for consideration is the frequency and timeliness of reporting. National level data for most of the recommended indicators are updated annually (as per Table 3.9), therefore, annual national public reporting may be the most appropriate option. While this may be sufficient in terms of transparency and accountability, and to a degree for driving continuous improvement (as improvement programmes typically take time to develop, implement, and deliver results), it will not suffice at the local level where more timely feedback would be needed to influence changes in practice. It is generally more feasible for local reporting to be undertaken more frequently and with a shorter time lag than national reporting.
It will thus be important that these indicators are not only used for national reporting and monitoring but that they are also used on an ongoing basis at lower levels, particularly facility and organisation level, in order to drive and monitor the progress of continuous improvement activities, and provide timely alerts to enable prompt response to issues as they arise.
All of the proposed indicators in this set are suitable for use at the national level, and most are also suitable for use at lower levels, including by individual facilities and organisations. The indicator specifications in Appendix 1 detail the suggested disaggregations for use of each indicator at each appropriate level. The suggested levels of reporting for each indicator are summarised in Table 4.1.
Table 4.1 Health care safety and quality indicators by level of reporting
Service category/Indicator National Sub-
national Facility/ Organisation
Primary care and community health services 1 Enhanced primary care services in general practice
2 General practices with a register and recall system for patients with chronic disease
3 People with moderate to severe asthma who have a written asthma action plan
4 Management of hypertension in general practice 5 Management of arthritis and musculoskeletal conditions 6 Mental health care plans in general practice 7 Annual cycle of care for people with diabetes mellitus 8 Cervical cancer screening rates 9 Immunisation rates for vaccines in the national schedule 10 Eye testing for target groups 11 Quality of community pharmacy services 12 Developmental health checks in children 13 People receiving a medication review

28
Service category/Indicator National Sub-national
Facility/ Organisation
Hospitals 14 Assessment for risk of venous thromboembolism in hospitals 15 Pain assessment in the emergency department 16 Reperfusion for acute myocardial infarction in hospitals 17 Stroke patients treated in a stroke unit 18 Complications of transfusion 19 Health care associated infections acquired in hospital 20 Staphylococcus aureus (including MRSA) bacteraemia in hospitals 21 Adverse drug events in hospitals 22 Intentional self-harm in hospitals 23 Malnutrition in hospitals and residential aged care facilities 24 Pressure ulcers in hospitals and residential aged care facilities 25 Falls resulting in patient harm in hospitals and residential aged care
facilities
26 Complications of anaesthesia 27 Accidental puncture/laceration in hospitals 28 Obstetric trauma - third and fourth degree tears 29 Birth trauma – injury to neonate 30 Postoperative haemorrhage 31 Postoperative venous thromboembolism 32 Unplanned return to operating theatre 33 Unplanned re-admission to an intensive care unit 34 Hospital standardised mortality ratio (HSMR) 35 Death in low mortality DRGs 36 Independent peer review of surgical deaths 37 Discharge medication management for acute myocardial infarction 38 Timely transmission of discharge summaries Specialised health services
39 Mental health admitted patients having seclusion 40 Post-discharge community care for mental health patients 41 Quality of palliative care 42 Functional gain achieved in rehabilitation 43 Multi-disciplinary care plans in sub-acute care (5) Management of arthritis and musculoskeletal conditions
Residential aged care 44 Oral health in residential aged care
(13) People receiving a medication review (23) Malnutrition in hospitals and residential aged care facilities (24) Pressure ulcers in hospitals and residential aged care facilities (25) Falls resulting in patient harm in hospitals and residential aged care
facilities
Multiple service categories 45 Unplanned hospital re-admissions 46 Inappropriate co-prescribing of medicines 47 Selected potentially preventable hospitalisations 48 End stage kidney disease in people with diabetes 49 Lower-extremity amputation in people with diabetes 50 Cancer Survival 51 Failure to diagnose 52 Potentially avoidable deaths All service categories
53 Patient experience 54 Presence of appropriate incident monitoring arrangements 55 Accreditation of health care services
29
The indicators which are not suitable for use below the national level are as follows:
• Cancer survival
• End stage kidney disease in people with diabetes
• Lower-extremity amputation in people with diabetes
• Potentially avoidable deaths
These indicators span the health care system over the long term and so generally cannot meaningfully be attributed to specific types of health care service or geographic or administrative area. However, the potentially avoidable deaths indicator may have some meaning at the state/territory level for ‘treatable conditions’ that may reflect shorter term health care provision.
In addition, some of the indicators are suitable for use at a sub-national level (for example, state and territory, or other relevant geographic or administrative grouping such as Divisions of General Practice), but generally not for reporting down to individual facility and organisation level, as follows:
• Selected potentially preventable hospitalisations
• Unplanned hospital re-admissions.
These indicators are outcome indicators which span the health care system, but reflect service provision over a more recent timeframe so may meaningfully be looked at in relation to current health care service provision within a particular geographic or administrative area.
For use at lower levels, the key difference from use of the indicators for national reporting will be in the disaggregations used. In general, at state and territory level, further comparisons or disaggregations of the indicators could include comparing health service areas and individual facilities or organisations, using the national data as a benchmark. At the facility and organisation level, national and state and territory data should be used for benchmarking, with possible further disaggregation of the data (depending on the indicator) by locations or specialities within the facility, casemix factors, types of procedure or medication, and in some instances comparing individual clinicians.
Related to this, the indicator specifications in Appendix 1 detail the data source to be used for national reporting. For use at lower levels, the relevant feeder or source system should be used, for example practice information systems in general practices, or patient administration systems in hospitals. Similarly, at each level the denominator should be adjusted to reflect the relevant population, for example state and territory residents rather than all Australian residents, separations from an individual hospital rather than all hospitals.

30
Options for consideration and reporting formats
Taking into account these considerations, two key options for the Commission in respect to public reporting are suggested:
• Public reporting – full
– Public reporting on all of the proposed indicators at national and lower levels (particularly facility and organisation) as appropriate with disaggregations or comparisons: over time; by facility groupings (for example, hospital peer groups, public versus private sector): by administrative, political or geographical groupings (for example, state and territory, division of general practice, health service area); by remoteness; and for individual facilities and organisations.
– This approach would include not only national public reporting by the Commission (or other appropriate body), but also routine public reporting by states and territories (for example providing comparisons by health service areas, and facilities or organisations) and by individual facilities and organisations.
• Public reporting – partial
– Public reporting is only at the national level with comparisons over time and disaggregations by facility groupings, by state and territory, and remoteness.
– Under this approach, the same activities in terms of using the indicators at state and territory and facility and organisation levels should still take place (i.e. undertaking ongoing monitoring against the indicators and benchmarking against the national data), however this information would not be made publicly available.
A key issue to be considered relating to these options, reflected in the areas of concern regarding public reporting discussed above, is how the data are actually presented. The following 4 examples of health indicator reporting demonstrate some of the approaches that can be taken to dealing with these issues.
Variable Life Adjusted Display (VLAD) (Queensland)
Queensland is using the VLAD method, whereby indicators provide an alert to potential system issues. The following discussion regarding this approach is drawn from information available on the VLAD website: <http://www.health.qld.gov.au/quality/vlad.asp>
VLAD is a screening tool to identify the place to start in examining possible areas of concern (or strength) for safety and quality of care. It does this by flagging certain indicators which warrant further investigation.
The VLAD methodology provides a graphical overview of clinical outcomes over a course of selected time and plots the cumulative difference between expected and actual outcome.
A flag is initiated where the VLAD line meets the lower or upper control limits in the graphical representation. When a VLAD flags at a particular point it is suggesting that over time there have been more patients experiencing the outcome than expected, up until this patient. The suggested way of viewing this is to firstly look for flags and then look backwards from this flagging point to see if there is a change in the trend or not. It is what leads up to the point at which the VLAD line meets the control limit (the track) which is most important rather than the actual point itself (the crossing).

31
The VLAD is a quality monitoring tool and must be interpreted as such. The occurrence of a flag should not be immediately interpreted as indicating good or bad performance as there are many possible explanations as to why the VLAD will flag, one reason being simply chance.
Where review is initiated, it has been recommended that the ‘pyramid’ model of investigation’ be adopted. In summary, the pyramid model of investigation suggests a hierarchical approach to identify causation. Under this model, factors at the base of the pyramid are more likely to be causes than factors at the apex – the factors in ascending order (from base upwards) are: data; patient case mix; structure or resource; process of care; professional.
VLADs for each hospital are made available as part of the release of the Annual Public Hospital Performance Report required under the Health Services Act 1991. The Report includes the management action plans arising from the results of any hospital reviews conducted.
VLADs do not provide definitive answers about the quality of care. They are used to develop ideas about why variations in reported outcomes occur and suggest possible solutions, be they ways of improving data quality, improving casemix adjustment, or implementing system changes to improve quality of care.
Critical to the approach is that there is not just monitoring — the monitoring is tied in with systems that ensure that investigation, learning and action occur as a result of a flag (Duckett et al. 2007).
Healthcare Commission Annual Health Check reports (UK)
These annual reports are publicly available online at the Healthcare Commission’s website, as an example the 2006-7 report is available at <http://www.healthcarecommission.org.uk/_db/_documents/Annual_health_check_national_overview_2006-2007.pdf >
These reports provide an overview of the performance of health care service providers across the UK, including relating to safety and quality of care. The annual report includes international comparisons, national summary data and comparisons, comparisons between geographic regions (including using geographic mapping), and comparisons and ratings for health trusts against a range of measures.
Reporting is largely in the form of ratings rather than actual numbers or rates. So, for example, ‘quality of services’ is rated for each trust as either weak, fair, good, or excellent. This form of presentation provides an indication as to the level of quality of these providers in relation to agreed national standards and targets, but limits the degree to which data could be misinterpreted by users of the report.
Other similar forms of presentation used include star ratings (ranging from 1 to 4 stars) and ‘traffic light’ style reporting where ‘green’ indicates good performance, ‘amber’ indicates that performance is acceptable but borderline so should be reviewed, and ‘red’ indicates poor performance and that action is required as a priority to address it.
Underpinning this national public reporting is ongoing monitoring of performance within health care trusts and within individual facilities and organisations, including local-level annual public reporting.
32
Annual Health Indicators reports and web portal (Canada)
Annual health indicator reports are publicly available online at the Canadian Institute of Health Information (CIHI) website, as an example the 2008 report can be downloaded from <http://secure.cihi.ca/cihiweb/products/HealthIndicators2008_ENGweb.pdf>.
These reports provide an overview of the performance of health care service providers across Canada, including relating to safety and quality of care. The annual report includes international comparisons, national summary data and comparisons, and comparisons between health service areas against a range of measures. In contrast to the UK reports, these reports in Canada do include actual rates.
Underpinning this national public reporting is ongoing monitoring of performance within health service areas and within individual facilities and organisations. This is supported by regular feedback from CIHI on some specific measures (for example, HSMRs) and provision of a range of data and analytic tools on the CIHI web portal. This portal is not publicly accessible, instead providing access for health care providers to a data warehouse including data submitted from providers across the country, to facilitate ongoing monitoring, comparisons and benchmarking, and assist in improving data quality. Further detail, including a demonstration of the portal tool is available at <http://secure.cihi.ca/cihiweb/dispPage.jsp?cw_page=cihi_portal_e>
Commonwealth Fund (US)
The Commonwealth Fund web site <http://www.whynotthebest.org> allows health care providers, researchers, and professionals to conduct side-by-side comparisons of 4,500 hospitals nationwide, track performance over time against benchmarks, and access information to inform improvements in health care quality.
The website provides functionality enabling users to:
• Find the top-performing hospitals in the country on 24 nationally recognised measures of health care quality, including care provided for heart attack, heart failure, and pneumonia, and prevention of surgical infection
• Compare a hospital against its peers and measure performance against top performers and state and national averages
• Access case studies of high-performing hospitals and a library of tools offering lessons and strategies on ways to improve care.
4.2 Priorities for further development This section provides information to assist in prioritising work to implement and build upon the recommended indicators. This includes information on which indicators require further work, which of these relate to work already planned or in progress, health sector reform processes that may impact on indicator work more generally, and what gaps in the coverage of the indicator set remain to be resolved.

33
Development required and related work in progress
The indicator summaries in Appendix 1 include discussion of further development suggested or required for each of the recommended indicators. This section summarises these recommendations.
The recommended indicators have been categorised into four groups based on whether they are able to be reported immediately and what further development work may be required as follows:
• Currently reportable – as per recommended specification
– The proposed numerator and denominator for these indicators can currently be collected and reported nationally. Future data development work may be proposed to enhance the collection and/or reporting of some of the indicators, but is not an immediate priority.
• Currently reportable – data development required to meet recommended specification
– These indicators can be reported with data that is currently available, but to report exactly as per the recommended specification some data development is required. Data development suggested for indicators in this category may involve refinement of data items in data collections or linkage with other data collections, to address gaps in data availability (for example, for identification of specific population groups), or to enable consistent/comprehensive national reporting.
• Not currently reportable – indicator and/or data development required
– Indicators in this category are generally clearly defined, however a suitable data source is not currently available, has yet to be identified, and/or substantial development is required in order to operationalise the indicator. This may include the development of new data items within existing data collections, or development of new data collections. In some cases there are identified issues to be resolved regarding the indicator definition.
• Concept proposed for further development
– These are areas that are considered of importance in terms of health care safety and quality, but where a suitable indicator has yet to be identified and/or developed, and where there are a number of potential means of measurement depending on the indicator specification agreed upon. Further development work is required to identify a suitable indicator(s) and to enhance existing data collections or develop new ones to enable data collection and reporting.
The distribution of the indicators according to these categories is summarised below:
Category Category description Indicators
A Currently reportable – as per recommended specification 19
B Currently reportable – data development required to meet recommended specification 21
C Not currently reportable – indicator and/or data development required 7
D Concept proposed for further development 8
The following table specifies the category for each indicator and which indicators reflect performance indicators in the National Healthcare Agreement (NHA). For category B, C and D indicators, the table also shows whether or not there is related work known to be already in progress and for which separate development work is expected to occur.

34
Table 4.2 Health care safety and quality indicators measurability category and related work
Service category/indicator Category NHA
Other related work in
progress
No related work
known to be in
progress Primary care and community health services
1 Enhanced primary care services in general practice A 2 General practices with a register and recall system for
patients with chronic disease B
3 People with moderate to severe asthma who have a written asthma action plan
B 4 Management of hypertension in general practice B 5 Management of arthritis and musculoskeletal conditions D 6 Mental health care plans in general practice A 7 Annual cycle of care for people with diabetes mellitus A 8 Cervical cancer screening rates A 9 Immunisation rates for vaccines in the national schedule A 10 Eye testing for target groups B 11 Quality of community pharmacy services D 12 Developmental health checks in children B 13 People receiving a medication review B Hospitals
14 Assessment for risk of venous thromboembolism in hospitals
C 15 Pain assessment in the emergency department C 16 Reperfusion for acute myocardial infarction in hospitals B 17 Stroke patients treated in a stroke unit B 18 Complications of transfusion C 19 Health care associated infections acquired in hospital B 20 Staphylococcus aureus (including MRSA) bacteraemia in
hospitals B
21 Adverse drug events in hospitals B 22 Intentional self-harm in hospitals B 23 Malnutrition in hospitals and residential aged care facilities B 24 Pressure ulcers in hospitals and residential aged care
facilities B
25 Falls resulting in patient harm in hospitals and residential aged care facilities
B 26 Complications of anaesthesia A 27 Accidental puncture/laceration in hospitals A 28 Obstetric trauma - third and fourth degree tears A 29 Birth trauma – injury to neonate A 30 Postoperative haemorrhage A 31 Postoperative venous thromboembolism A 32 Unplanned return to operating theatre B 33 Unplanned re-admission to an intensive care unit B 34 Hospital standardised mortality ratio (HSMR) A 35 Death in low mortality DRGs B 36 Independent peer review of surgical deaths C 37 Discharge medication management for acute myocardial
infarction C
38 Timely transmission of discharge summaries D
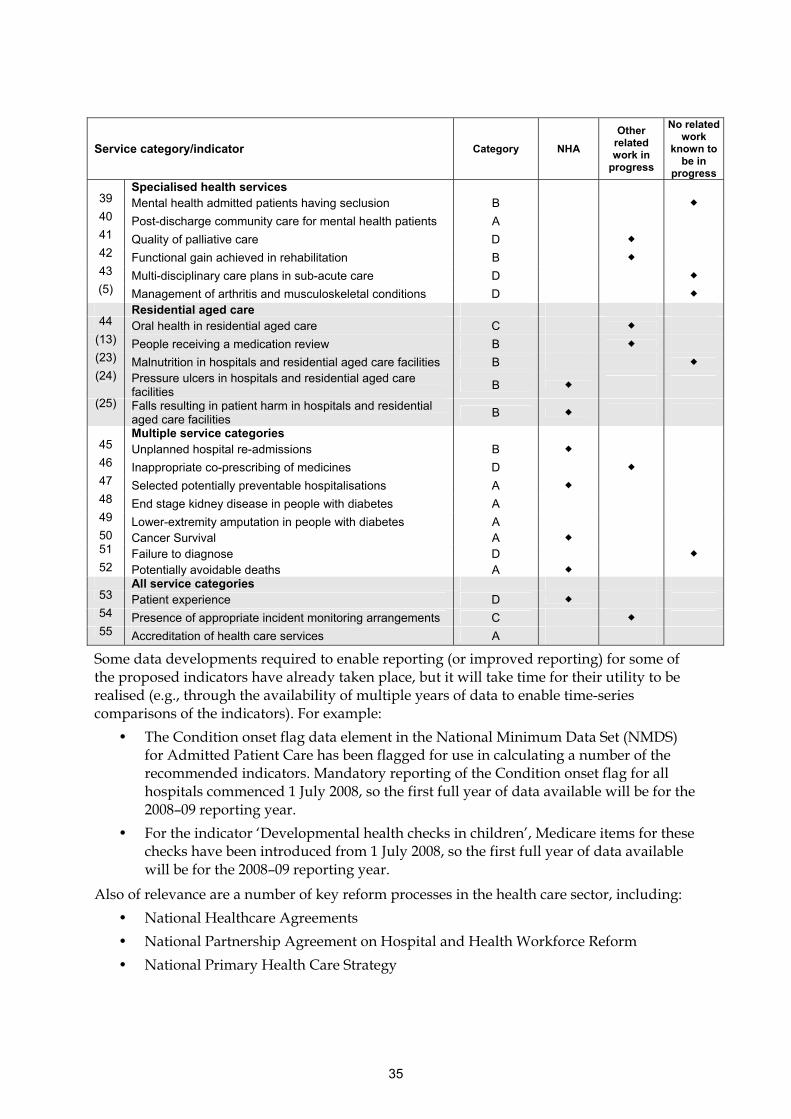
35
Service category/indicator Category NHA
Other related work in
progress
No related work
known to be in
progress Specialised health services
39 Mental health admitted patients having seclusion B 40 Post-discharge community care for mental health patients A 41 Quality of palliative care D 42 Functional gain achieved in rehabilitation B 43 Multi-disciplinary care plans in sub-acute care D (5) Management of arthritis and musculoskeletal conditions D
Residential aged care 44 Oral health in residential aged care C
(13) People receiving a medication review B (23) Malnutrition in hospitals and residential aged care facilities B (24) Pressure ulcers in hospitals and residential aged care
facilities B
(25) Falls resulting in patient harm in hospitals and residential aged care facilities
B Multiple service categories
45 Unplanned hospital re-admissions B 46 Inappropriate co-prescribing of medicines D 47 Selected potentially preventable hospitalisations A 48 End stage kidney disease in people with diabetes A 49 Lower-extremity amputation in people with diabetes A 50 Cancer Survival A 51 Failure to diagnose D 52 Potentially avoidable deaths A All service categories
53 Patient experience D 54 Presence of appropriate incident monitoring arrangements C 55 Accreditation of health care services A
Some data developments required to enable reporting (or improved reporting) for some of the proposed indicators have already taken place, but it will take time for their utility to be realised (e.g., through the availability of multiple years of data to enable time-series comparisons of the indicators). For example:
• The Condition onset flag data element in the National Minimum Data Set (NMDS) for Admitted Patient Care has been flagged for use in calculating a number of the recommended indicators. Mandatory reporting of the Condition onset flag for all hospitals commenced 1 July 2008, so the first full year of data available will be for the 2008–09 reporting year.
• For the indicator ‘Developmental health checks in children’, Medicare items for these checks have been introduced from 1 July 2008, so the first full year of data available will be for the 2008–09 reporting year.
Also of relevance are a number of key reform processes in the health care sector, including:
• National Healthcare Agreements
• National Partnership Agreement on Hospital and Health Workforce Reform
• National Primary Health Care Strategy

36
• Consideration of the final report of the National Health and Hospitals Reform Commission
The findings and recommendations of these various reform processes, and in particular the policy responses by the Commonwealth and State and Territory authorities, will need to be considered in the implementation of the National safety and quality indicators. Following is an overview of four papers released through these processes.
The National Healthcare Agreements and the National Partnership Agreements on Hospital and Health Workforce Reform have had a direct influence on the selection of indicators and their specifications.
The National Primary Care Strategy and the National Health and Hospitals Reform Commission, have recently released reports. Other reform processes presently underway, may or may not have an impact on the development of the National safety and quality indicators. These include:
• Preventative Health Taskforce
• Review of Maternity Services
• National eHealth Strategy
• A review of the MBS is being undertaken by the Department of Health and Ageing
National Healthcare Agreement
The National Healthcare Agreement (NHA) aims to improve health outcomes for all Australians and the sustainability of the Australian health system. The identified long-term objectives of the NHA are:
• Prevention – Australians are born health and remain healthy
• Primary and community health – Australians receive appropriate health quality and affordable primary and community health services
• Hospital and related care – Australians receive appropriate high quality and affordable hospital and hospital related care
• Aged care – Older Australians receive appropriate high quality and affordable health and aged care services
• Patient experience – Australians have positive health and aged care experiences which take account of individual circumstances and care needs
• Social inclusion and Indigenous health – Australia’s health system promotes social inclusion and reduces disadvantage, especially for Indigenous Australians
• Sustainability - Australians have a sustainable health system
A parallel process to the national indicators project was the development of a set of indicators as part of the National Healthcare Agreements (NHA). The indicators developed as part of the NHA informed the indicator selection process for the national indicators of safety and quality. As a result, there are 16 indicators which are included in both the NHA set and the National safety and quality indicators set (as noted in Table 4.2):
• People with moderate to severe asthma who have a written asthma action plan
• Mental health care plans in general practice
• Annual cycle of care for people with diabetes mellitus
• Cervical cancer screening rates

37
• Immunisation rates for vaccines in the national schedule
• Developmental health checks in children
• Staphylococcus aureus (including MRSA) bacteraemia in hospitals
• Adverse drug events in hospital
• Intentional self-harm in hospitals
• Falls resulting in patient harm in hospitals and residential aged care facilities
• Pressure ulcers in hospitals and residential aged care facilities
• Unplanned hospital re-admissions
• Selected potentially preventable hospitalisations
• Cancer survival
• Potentially avoidable deaths
• Patient experience
Further details can be found at:
<http://www.coag.gov.au/intergov_agreements/federal_financial_relations/docs/IGA_FFR_ScheduleF_National_Healthcare_Agreement.pdf>
National Partnership Agreement on Hospital and Health Workforce Reform
In November 2008 the Council of Australian Governments (COAG) agreed to a National Partnership (NP) which is aimed at improving the efficiency and capacity of public hospitals.
The objectives of the NP are to reform and improve:
• The efficiency of public hospital services
• Health workforce capability and supply
• The volume and quality of sub-acute services
• The functioning of emergency departments
And thereby support an efficient and effective public hospital system which delivers high quality and safe services to patients. The NP is aimed at contributing to a range of outcomes and objectives. Those of relevance to the National indicators project include:
• Improved health outcomes and patient experience and satisfaction
• A hospital system which is better integrated with other health services; will provide the right services in the right place at the right time; and smooth patients’ transitions between health settings through assessment, referral and follow up at key points in patients’ health journeys
• Increased supply, capacity and quality of subacute services
• Better outcomes for patients in emergency departments
Further details can be found at:
<http://www.coag.gov.au/intergov_agreements/federal_financial_relations/docs/national_partnership/national_partnership_on_hospital_and_health_workforce_reform.pdf>
National Health and Hospitals Reform Commission (NHHRC) Final Report
The final report was released on 30 June 2009. Key issues discussed in this final report of relevance to the National Indicators Project are as follows:

38
• The report recommends a nationally consistent approach to the collection and comparative reporting of indicators which monitor safety and quality of healthcare. This should include ‘clinical quality’ measures. In addition the report recommends the development and conduct of regular national patient experience surveys and reporting on patient-reported outcome measures.
• The NHHRC recommends public reporting by hospitals, primary health care services, and residential aged care services, through accreditation requirements on how they are progressing with quality improvement activities and research.
• More broadly, there are numerous references to a need for improved information, including regarding safety and quality issues, and the future role of electronic patient records
In addition, the report proposes the following key reform directions of relevance to health care safety and quality information:
“19 - We recommend embedding a strong focus on quality and health outcomes across all primary health care services. This requires the development of sound patient outcomes data for primary health care. We also want to see the development of performance payments for prevention, timeliness and quality care.
13 - To support people’s decision making and management of their own health we recommend that, by 2012, every Australian should be able to have a personal electronic health record that will at all times be owned and controlled by that person.
29 - We recommend there be financial incentives to reward good performance in outcomes and timeliness of care. One element of this should be for timely provision of suitable clinical information (such as discharge information) including details of any follow-up care required.
32 - To support quality improvement, we recommend that data on quality and safety should be collated, compared and provided back to hospitals, clinical units and clinicians in a timely fashion to expedite quality and quality improvement cycles. Hospitals should also be required to report on their strategies to improve safety and quality of care and actions taken in response to identified safety issues.
33 - To improve accountability, we recommend that public and private hospitals be required to report publicly on performance against a national set of indicators which measure access, efficiency and quality of care provided.
34 - To better understand people’s use of health services and health outcomes across different care settings, we recommend that public and private hospital episode data should be collected nationally and linked to MBS and PBS data using a patient’s Medicare card number.
88.9 - The Commonwealth, state and territory governments would agree to establish national approaches to health workforce planning and education, professional registration, patient safety and quality (including service accreditation), e-health, performance reporting (including the provision of publicly available data on the performance of all aspects of the health system), prevention and health promotion, private hospital regulation, and health intervention and technology assessment.
95 - We believe that incentives for improved outcomes and efficiency should be strengthened in health care funding arrangements.”

39
Towards a national primary care strategy, Discussion paper
The Draft National Primary Health Care Strategy, which was released in August 2009, provides a guide to future policy and practice in primary health care in Australia. The accompanying report draws attention to a lack of good quality information and performance measures which can be used to support primary healthcare professionals, consumers, funders and policy makers.
The issues discussed which are relevant to the National Indicators Project and the future development of safety and quality indicators for primary healthcare include:
• Key Priority Area 2: Better management of chronic conditions.
– Indicators of potentially preventable hospital admissions and other evidence-based clinical indicators of quality chronic disease management have been proposed to monitor the impact of a recommended new approach to improve the continuity and coordination of care for individuals with chronic disease.
• Key Priority Area 4: Improving quality, safety, performance and accountability.
– The report proposes that the incidence of avoidable errors which are attributable to safety and quality issues be measured. This would be a component of a recommended framework for safety and quality in primary healthcare, which is based on improved information and quality assurance systems.
Further detail can be found at:
<www.yourhealth.gov.au/internet/yourhealth/publishing.nsf/Content/nphc-draft-report-toc/$FILE/NPHC-Draft.pdf>
and
< www.yourhealth.gov.au/internet/yourhealth/publishing.nsf/Content/nphc-draftreportsupp-toc/$FILE/NPHC-supp.pdf>
Identified gaps in coverage
Reviewing the alignment of the indicators with the framework, as discussed in section 3.2, the following areas appear to be under-represented:
• Dental services and oral health: third highest area of health expenditure (6.6%), and second largest major disease and injury group contributing to health expenditure (10.1%) - one indicator
• Neurological and sense disorders: 11.9% of burden of disease - one indicator
• Mental health: 7.8% of major disease and injury groups contributing to health expenditure, 13.3% of burden of disease, and one of the seven national health priority areas - three indicators
• Arthritis and musculoskeletal conditions: 7.5% of major disease and injury groups contributing to health expenditure, and one of the 7 national health priority areas - one indicator
• Cancer: largest burden of disease area (19%), 7.2% of major disease and injury groups contributing to health expenditure, and one of the seven national health priority areas - two indicators
In part this is a reflection of the scope of this indicator set, which has specifically excluded most aspects of public health. As such, indicators relating to health promotion and

40
preventative activities such as population-wide health education programmes (e.g. smoking cessation) have not been included.
More importantly however, under-representation of these areas reflects a key gap in the current set of indicators, namely the limited coverage of health care delivered by allied health providers and specialised health providers. For each of the above areas, a significant proportion of health care delivery will be through allied health providers (e.g. physiotherapists, chiropractors, and a range of others are typically involved in treatment/management of musculoskeletal conditions) and/or specialised health providers (including the private practice activities of psychologists, psychiatrists, oncologists, rheumatologists, orthodontists, and other specialists).
Under-representation of these types of health care reflects a combination of factors, in particular the scarcity of data available from these areas of health provision, the diverse range of practitioners involved, and of their service delivery models. In terms of the differing service delivery models, a particular issue in these areas of health care delivery is the greater reliance on private funding and user-pays service provision.
In the absence of the type of funding and political levers that are available to drive data collection, reporting and quality improvement activities in other areas of health provision such as hospital-based care, alternative approaches in these areas will need to be investigated. This may include, for example:
• Joint work with private health insurers who have various levels of involvement with these health care providers both directly (e.g. through contractual arrangements giving ‘approved provider’ status) and indirectly through rebates paid to health insurance holders for their use of these services
• Joint work with relevant professional or clinical groups to develop and implement agreed standards of practice (if these do not already exist), and accompanying appropriate data collection and reporting arrangements

41
Appendix 1: Recommended indicators
Enhanced primary care services in general practice
Indicator number: 1
Description: Use of Enhanced Primary Care (EPC) items within general practice
Indicator status: Currently reportable – as per recommended specification
Rationale (clinical/policy): The prevalence of chronic disease is increasing in Australia, and is estimated to be responsible for around 70% of the total burden of disease. The National Chronic Disease Strategy, which was endorsed by health ministers, includes the following key principles:
• Adopt a population health approach and reduce health inequalities
• Prioritise health promotion and illness prevention
• Achieve person-centred care and optimise self-management
• Provide the most effective care
• Facilitate coordinated and integrated multidisciplinary care across services, settings and sectors
• Achieve significant and sustainable change
(NHPAC 2005).
Care planning and case conferencing services for people, of any age, with chronic conditions and complex multidisciplinary care needs are funded via the Enhanced Primary Care (EPC) Medicare items. These MBS items provide a framework to support a multidisciplinary approach to health care through a more flexible, efficient and responsive match between care recipients’ needs and services available. The proportion of GPs who use these particular EPC items is a proxy measure of the extent of GP involvement in continuity and coordination of care (NHPC 2004).
Indicator Source: NHPC (modified)
Endorsement: AHMAC
Numerator: Number of MBS EPC items for multidisciplinary care planning and case conferencing (MBS items; 720 - 731).
Denominator: Total population
Indicator type: Process
Disaggregation: National: Indigenous status, Remoteness of DGP
DGP: Individual general practices
Practice: Individual clinicians
Related Indicators: 2 – General practices with a register and recall system for patients with chronic disease 3 – People with moderate to severe asthma who have a written asthma action plan

42
4 – Management of hypertension in general practice 5 – Management of arthritis and musculoskeletal condition 7 – Annual cycle of care within general practice for people with diabetes
47 – Selected potentially preventable hospitalisations
Issues/Comments: The goal of this indicator is to provide an indication of the extent to which GPs are involved in the continuity and coordination of care. However, it should be noted that it is not regarded as providing a direct measure of the quality of chronic disease management by GPs.
This proposed indicator differs from the indicator as specified by the NHPC (which focussed on the proportion of GPs claiming EPC items), so that it provides a better measure of the rate of utilisation of the items.
There is a possibility that this indicator would under-estimate the extent to which GPs undertake appropriate chronic disease management, if the EPC items are not being claimed.
For use at the Division or practice level, the denominator for this indicator could be estimates of the population of patients, or estimates of the population of patients with relevant chronic conditions.
The data presently available through MBS statistics online allows presentation of rate of MBS items per 100,000 persons enrolled in Medicare (see figure below). However, for this proposed indicator, the recommended denominator would be the estimated resident population.
Framework elements
Health needs domain: Living with chronic conditions
Quality Domain: Appropriate, continuous
Service category: Primary care and community health services
Area of expenditure: Medical services
National Data Comments
National data currently available Medicare provide information on Medicare Benefits Schedule (MBS)
Data development required MBS Indigenous status data (based on Voluntary Indigenous Identification) is in need of improvement.
Data source DoHA/Medicare Australia
Data collection arrangements Continuous collection of claims lodged with Medicare Australia.
Data continuously available
No international comparisons available

43
Presentation of available data
0
2,000
4,000
6,000
8,000
10,000
12,000
14,000
16,000
NSW VIC QLD SA WA TAS ACT NT Australia
Rate per 100,000 population
2003-04 2004-05 2005-06 2006-07 2007-08
Notes
1. The Medicare rate is calculated by dividing the number of specific MBS items processed during the time period (financial year) by the number of people enrolled in Medicare during that period, expressed as a rate per 100,000.
2. The numerator and denominator as presented above are consistent with the proposed safety and quality indicator. However, the recommended disaggregations were not available and so the data has been presented disaggregated by jurisdiction.
3. It should be noted that the recommended disaggregations could be accessed through Medicare, however, for the purposes of this report readily accessible data was utilised.
Source: Medicare – MBS Statistics Online.
EPC items for care planning and case conferencing (MBS items; 720 - 731), 2003–04 to 2007–08, by State and Territory, per 100,000 population
What these data show
• Nationally, the rate of EPC items for care planning and case conferencing increased from 1,241 per 100,000 in 2003–04 to 10,159 per 100,000 in 2007–08.
• The data show different rates of usage of the MBS items across jurisdictions, with NSW having the highest rate and ACT the lowest.
• These differences may reflect differing levels of use of the EPC item by GPs, actual differences in rates of care planning and case conferencing, differences in prevalence of chronic disease or a combination of these factors.
References
NHPAC 2005. National Health Priority Action Council 2005. National Chronic Disease Strategy. Canberra: Australian Government Department of Health and Ageing.
NHPC 2004. National Health Performance Committee 2004. National report on health sector performance indicators 2003`. Canberra: Australian Institute of Health and Welfare.

44
General practices using a register and recall system for patients with chronic disease
Indicator number: 2
Description: The proportion of general practices using electronic register/recall/reminder systems to identify patients with a chronic disease for review and appropriate action
Indicator status: Currently reportable – data development required to meet recommended specification
Rationale (clinical/policy): Sustained improvements in health outcomes for people with chronic diseases such as diabetes have been associated with a more systematic approach in general practice including intensive follow up, use of clinical management guidelines integrated with self-management support programs and more effective use of nurse case managers and non-physician care providers. Systematic care includes having a disease register, regular recall and review, protected time, a practice nurse, clear written guidelines and a system for auditing standards of care. (PHC RIS 2008, Griffin 1998)
The use of register/recall/reminder systems are an important component of high quality chronic disease management, allowing practices to identify those patients with chronic disease, recall them as required and ensure they are providing comprehensive patient care (DoHA 2008, Georgiou et al. 2004).
Indicator Source: Australian General Practice Network (AGPN) National Performance Indicators (2008–2012) (modified)
Numerator: The number of general practices using a register/recall/reminder system (electronic and/or manual) to identify patients with a chronic disease for review and appropriate action
Denominator: The number of general practices
Indicator type: Structure
Disaggregation: National: Remoteness of DGP
DGP: Individual general practices
Related Indicators: 1 – Enhanced primary care services in general practice 3 – People with moderate to severe asthma who have a written asthma action plan 4 – Management of hypertension in general practice
7 – Annual cycle of care within general practice for people with diabetes
47 – Selected potentially preventable hospitalisations
Issues/Comments: The use of register/recall/reminder systems within Divisions of General Practice is currently reported as part of the Australian General Practice Network (AGPN) National Performance Indicators (2008–2012), as the number and proportion of Divisions using register/recall/reminder systems. However, this indicator specifies a rate per total number of general practices for national reporting (See data development below).

45
Framework elements
Health needs domain: Living with chronic conditions
Quality Domain: Appropriate, continuous, capable
Service category: Primary care and community health services
Area of expenditure: Medical services
National Data Comments
Data currently available Through Divisions of General Practice (DGP) (not national)
Data development required Data relating to the number of individual general practices are not currently reported by PHC RIS.
The required data, relating to the number of practices within a Division using a register/recall/reminder system, could be provided either directly to PHC RIS or possibly obtained directly through an agreement with the individual Divisions
Data source To be determined
Data collection arrangements The Annual Survey of Divisions of General Practice requires Divisions to obtain data from at least 80% of practices in the Division. For national reporting this indicator would need to cover all general practices. The following questions relate to the use of a practice-based system and are to be answered at practice level (not Division or pathology-based systems), even if the system is not currently used by all GPs in the practice.
Standard National Questions:
Q1 Does the practice have at least one register/recall/reminder system to identify patients with a chronic disease? [Y] [N]
Q2 If yes, are any of the register/recall/reminder systems electronic? [Y] [N]
Q3 If yes to Q1 and 2, please indicate how many chronic diseases are represented on the electronic practice system(s).
No international comparisons available
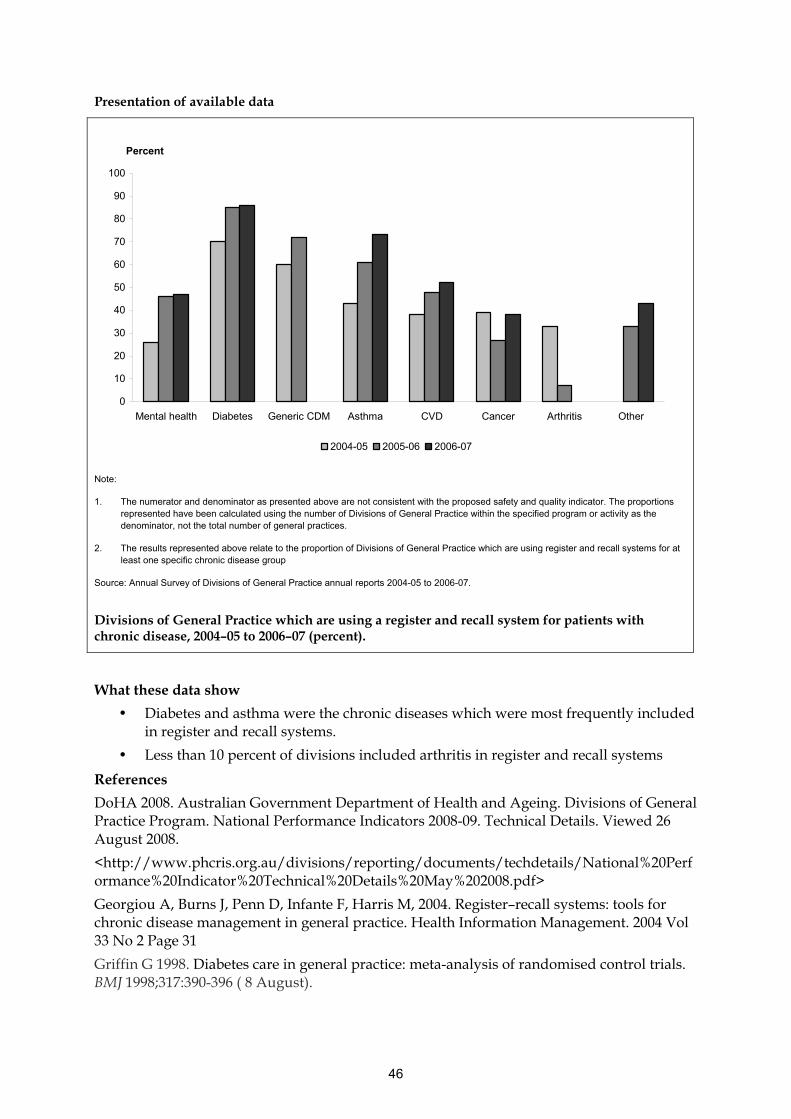
46
Presentation of available data
0
10
20
30
40
50
60
70
80
90
100
Mental health Diabetes Generic CDM Asthma CVD Cancer Arthritis Other
Percent
2004-05 2005-06 2006-07
Note:
1. The numerator and denominator as presented above are not consistent with the proposed safety and quality indicator. The proportions represented have been calculated using the number of Divisions of General Practice within the specified program or activity as the denominator, not the total number of general practices.
2. The results represented above relate to the proportion of Divisions of General Practice which are using register and recall systems for at least one specific chronic disease group
Source: Annual Survey of Divisions of General Practice annual reports 2004-05 to 2006-07.
Divisions of General Practice which are using a register and recall system for patients with chronic disease, 2004–05 to 2006–07 (percent).
What these data show
• Diabetes and asthma were the chronic diseases which were most frequently included in register and recall systems.
• Less than 10 percent of divisions included arthritis in register and recall systems
References
DoHA 2008. Australian Government Department of Health and Ageing. Divisions of General Practice Program. National Performance Indicators 2008-09. Technical Details. Viewed 26 August 2008.
<http://www.phcris.org.au/divisions/reporting/documents/techdetails/National%20Performance%20Indicator%20Technical%20Details%20May%202008.pdf>
Georgiou A, Burns J, Penn D, Infante F, Harris M, 2004. Register–recall systems: tools for chronic disease management in general practice. Health Information Management. 2004 Vol 33 No 2 Page 31
Griffin G 1998. Diabetes care in general practice: meta-analysis of randomised control trials. BMJ 1998;317:390-396 ( 8 August).

47
PHC RIS 2008. Primary Health Care Research and Information Service. National Performance Indicators for Divisions of General Practice March 2007. Viewed 26 August 2008. <http://www.phcris.org.au/divisions/reporting/div/list.php>

48
People with moderate to severe asthma who have a written asthma action plan
Indicator number: 3
Description: Proportion of people with moderate to severe asthma who have a recent, written Asthma Action Plan, developed in consultation with their GP
Indicator status: Currently reportable – data development required to meet recommended specification
This indicator is to be reported under the National Healthcare Agreement
Rationale (clinical/policy): Asthma is a National Health Priority Area. The Commonwealth government’s Asthma Management Program aims to encourage best practice asthma management. A major specific objective of the Program is to improve the quality of care provided by general practitioners to people with moderate to severe asthma (ACAM 2005a). The Asthma Management Program includes funding via the Practice Incentives Program (PIP), which is aimed at encouraging GPs to implement the Asthma annual cycle of care (previously known as the Asthma 3+ Visit Plan). This involves a series of three GP visits by patients with moderate to severe asthma, for the purpose of diagnosis and assessment, patient education, and development and review of a written asthma action plan (ACAM 2005a).
A written asthma action plan (AAP) enables people with asthma to recognise deterioration promptly and respond appropriately, by integrating changes in symptoms or peak expiratory flow measurements with written instructions to introduce or alter medication. It has been shown that asthmatics benefit from the use of an AAP and that there is a relationship between achievement of asthma control with the use of an AAP and an increase in the patient’s quality of life. There is also evidence that the use of a written AAP, in conjunction with training in self-management and regular medical review, improves outcomes, including the need for hospitalisation, GP visits and medication and lung function, in people with asthma. When used in conjunction with regular follow-up and education, an AAP can improve quality of life and asthma control. However, the use of written asthma action plans in isolation from these associated elements has not been shown to improve health outcomes in people with asthma. (AIHW 2004)
Asthma action plans may be provided in various formats. The following features, which are common to most of the AAPs that have been shown to be beneficial, are considered to be the four essential components of an AAP:
• The AAP must be written
• The AAP must be individually prescribed and not a generic example
• The AAP must contain information to allow you to recognise the onset of an exacerbation
• The AAP must contain information on what action to take in response to that exacerbation (usually increase or commence steroids and/or seek urgent medical care) (AIHW 2004).

49
Source: Australian Centre for Asthma Monitoring (modified)
Endorsement: AHMAC
Numerator: Number of unique individuals who have received an asthma cycle of care (MBS group A42).
NB. Provision and review of an AAP is included as part of the asthma cycle of care (see Issues/comments below).
Denominator: Total population (Population with moderate to severe asthma, if available – see Issues/comments below).
Indicator type: Process
Disaggregation: National: Indigenous status, Age, Remoteness of DGP
DGP: Individual general practices
Practice: Individual clinicians
Related Indicators: 1 – Enhanced primary care services in general practice 2 – General practices with a register and recall system for patients with chronic disease
47 – Selected potentially preventable hospitalisations
Issues/Comments: In defining the target population as individuals with moderate to severe asthmatics, this indicator does not differentiate between stable and unstable asthmatics, as well as newly diagnosed versus long-term asthmatics. Similarly, the issue of the currency of the asthma action plan is not addressed, so an AAP which was developed several years previously would be included in the calculation of this indicator. These issues may need to be reviewed.
The number of individuals with moderate to severe asthma is not currently known with any degree of accuracy (see Data development required below). Hence, for national reporting, it is recommended that the denominator be the total population, pending availability of estimates of the population with moderate to severe asthma. For reporting at the level of Divisions of General Practice, or within individual general practices, local estimates of numbers of patients with moderate to severe asthma could be used as the denominator.
In order to claim the MBS items for the completion of the asthma cycle of care, at a minimum, the following must be completed:
• At least two asthma related consultations within 12 months for a patient with moderate to severe asthma (at least one of which (the review consultation) is a consultation that was planned at a previous consultation)
• Documented diagnosis and assessment of level of asthma control and severity of asthma
• Review of the patient’s use of and access to asthma related medication and devices
• Provision to the patient of a written AAP (if the patient is unable to use a written AAP - discussion with the patient about an alternative method of providing an AAP, and documentation of the discussion in the patient's medical records)
• Provision of asthma self-management education to the patient
• Review of the written or documented AAP.
AAPs which are provided as part of a discharge plan from hospital would not be identified by the proposed indicator, and nor would AAPs provided in other public sector settings.

50
Further work would be required to determine the significance of these sources of AAPs, particularly for national reporting.
It is possible that GP-provided AAPs would be under-estimated with this indicator, as some GPs may be providing AAPs, or otherwise undertaking appropriate asthma management but not claiming using the MBS items.
The data presently available through MBS statistics online allows presentation of rate of MBS items per 100,000 persons enrolled in Medicare (see figure below). However, for this proposed indicator, the recommended denominator would be the estimated resident population.
Framework elements
Health needs domain: Living with chronic conditions
Quality Domain: Appropriate, continuous
Service category: Primary care and community health services
NHPA: Asthma
Burden of disease: Chronic respiratory disease
Disease expenditure: Respiratory
Area of expenditure: Medical services
National Data Comments
National data currently available Medicare provide information on Medicare Benefits Schedule (MBS)
Data development required Data development would be required to identify people with moderate to severe asthma. For national reporting, sources could include the National Health Survey, or data from state/territory CATI population health surveys. At the Division or practice level, local data sources could be used to estimate numbers of patients with moderate to severe asthma. The timeframe for ‘recent’ AAPs would need to be determined.
MBS Indigenous status data (based on Voluntary Indigenous Identification) is in need of improvement.
Data source DoHA/Medicare Australia
Data collection arrangements Continuous collection of claims lodged with Medicare Australia.
Data continuously available
No international comparisons available
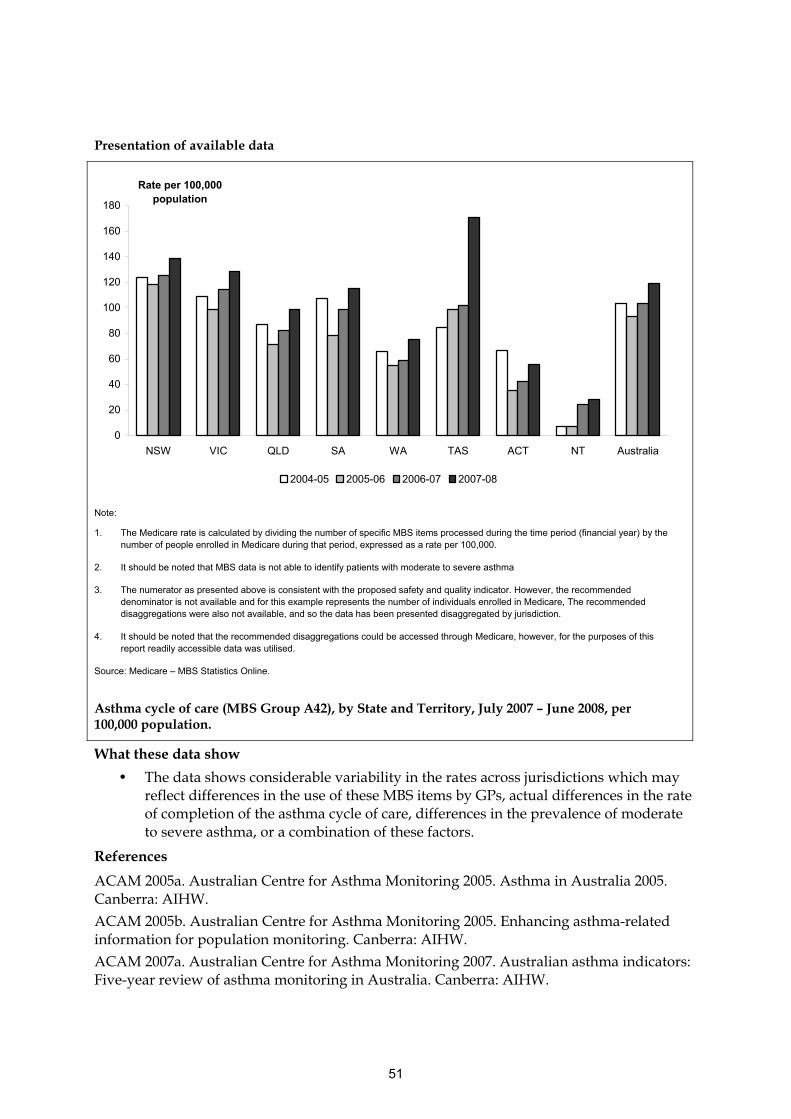
51
Presentation of available data
0
20
40
60
80
100
120
140
160
180
NSW VIC QLD SA WA TAS ACT NT Australia
Rate per 100,000 population
2004-05 2005-06 2006-07 2007-08
Note:
1. The Medicare rate is calculated by dividing the number of specific MBS items processed during the time period (financial year) by the number of people enrolled in Medicare during that period, expressed as a rate per 100,000.
2. It should be noted that MBS data is not able to identify patients with moderate to severe asthma
3. The numerator as presented above is consistent with the proposed safety and quality indicator. However, the recommended denominator is not available and for this example represents the number of individuals enrolled in Medicare, The recommended disaggregations were also not available, and so the data has been presented disaggregated by jurisdiction.
4. It should be noted that the recommended disaggregations could be accessed through Medicare, however, for the purposes of this report readily accessible data was utilised.
Source: Medicare – MBS Statistics Online.
Asthma cycle of care (MBS Group A42), by State and Territory, July 2007 – June 2008, per 100,000 population.
What these data show
• The data shows considerable variability in the rates across jurisdictions which may reflect differences in the use of these MBS items by GPs, actual differences in the rate of completion of the asthma cycle of care, differences in the prevalence of moderate to severe asthma, or a combination of these factors.
References
ACAM 2005a. Australian Centre for Asthma Monitoring 2005. Asthma in Australia 2005. Canberra: AIHW.
ACAM 2005b. Australian Centre for Asthma Monitoring 2005. Enhancing asthma-related information for population monitoring. Canberra: AIHW.
ACAM 2007a. Australian Centre for Asthma Monitoring 2007. Australian asthma indicators: Five-year review of asthma monitoring in Australia. Canberra: AIHW.

52
ACAM 2007b. Australian Centre for Asthma Monitoring 2007. Survey questions for monitoring national asthma indicators. Canberra: AIHW
AIHW 2004. Australian Institute of Health and Welfare 2004: Baker DF, Marks GB, Poulos LM and Williamson M 2004. Review of proposed National Health Priority Area asthma indicators and data sources. Canberra: AIHW

53
Management of hypertension in general practice
Indicator number: 4
Description: The proportion of patients who have been prescribed an antihypertensive agent and who were not at their target blood pressure (BP)
Indicator status: Currently reportable – data development required to meet recommended specification
Rationale (clinical/policy): Cardiovascular health is a National Health Priority Area, and relates to the health of the heart and blood vessels.
Hypertension, which is defined as systolic BP ≥ 140 mmHg and/or diastolic BP ≥ 90 mmHg. A high BP is a major risk factor for development of coronary heart disease, stroke, heart failure and kidney failure. While high BP is associated with a higher risk of the previously mentioned complications, when hypertension is controlled, the risk of these complications, and overall mortality due to these complications, is reduced (NPS 2006, AIHW 2008).
In 2007–08 hypertension was the most frequently managed clinical problem in general practice in Australia (Britt et al. 2008). In Australia in 2003, about 8 percent of the total burden of disease was attributable to hypertension (AIHW 2008).
The 1999–2000 Australian Diabetes, Obesity and Lifestyle Study (AusDiab study) measured people’s BP and the results indicated that 30% of Australians aged 25 years and over (3.7 million) had high systolic or diastolic blood pressure or were on medication for hypertension (AIHW 2008).
Indicator Source: National Prescribing Service
Numerator: Number of adult patients prescribed an antihypertensive agent who were not at their target blood pressure
Denominator: Number of adult patients prescribed an antihypertensive agent
Indicator type: Outcome
Disaggregation: National: Indigenous status, Age, Socioeconomic status, Remoteness of DGP.
DGP: Individual general practices, Indigenous status, Age, Socioeconomic status
Practice: Individual clinicians, Indigenous status, Age, Socioeconomic status
Related Indicators: 1 – Enhanced primary care services in general practice 2 – General practices with a register and recall system for patients with chronic diseases 48 – Selected potentially preventable hospitalisations
Issues/Comments: While ideally the proportion of patients not at their target BP should be low, this may be affected by the following factors:
• Some patients, especially the elderly, may not tolerate the specified blood pressure targets

54
• Patients not responding to antihypertensive therapy may have poor compliance
• Secondary hypertension, that is, hypertension which is associated with a variety of conditions, such as renal disorders, endocrine disorders and vascular disorders (Dorland’s medical dictionary), is relatively resistant to standard therapy
• Newly diagnosed patients are likely to have blood pressures above their target values for some time while lifestyle interventions and drug therapy are being implemented
(NPS 2006).
Framework elements
Health needs domain: Living with chronic conditions
Quality Domain: Appropriate, effective
Service category: Primary care and community health services
NHPA: Cardiovascular health
Burden of disease: Cardiovascular disease
Disease expenditure: Cardiovascular
Area of expenditure: Medical services
National Data Comments
Data currently available National Prescribing Service (national sample)
Data development required The National Prescribing Service (NPS) Quality Use of Medicine indicators involve an in-practice system for medical practitioners to monitor their/their practice’s performance against the NPS indicators. The capacity for national reporting from this source would need to be determined.
The Australian General Practice Statistics and Classification Centre, as part of the Bettering the Evaluation and Care of Health (BEACH) program, have previously reported on hypertensive patients, their treatment regimens, and target BP as part of one of the Supplementary Analysis of Nominated Data (SAND) for 2006-07. For patients with diagnosed and treated hypertension, information was collected on whether their BP was at, above or below target values. Capacity for ongoing collection of this information would need to be determined.
Both the National Prescribing Service and the Australian Primary Care Collaboratives (APCC) are currently undertaking work aimed at including data relating to management of hypertension as part of their respective electronic practice information tools. This could be a future data source for this indicator.

55
Development of a national electronic data collection of general practice data could also provide a potential future source of data for this indicator.
MBS Indigenous status data (based on Voluntary Indigenous Identification) is in need of improvement.
Data Source To be determined (as per above)
No international comparisons available
Presentation of available data
At target BP Higher than target BP Lower than target BP
Note
1. The numerator and denominator as presented above include all patients diagnosed with hypertension. The proposed indicator would restrict the numerator and denominator to patients on anti-hypertensive medication.
2. For this survey, over 95% of patients were on at least one medication for hypertension.
3. There were 660 patients who had their BP measured and target BP recorded.
4. The recommended disaggregations were not available using the current data for this indicator.
Source: AIHW:AGPSCC 2007.
Patients with diagnosed hypertension who were higher, lower and at their target blood pressure, Australia, 2006–07 (Percent)
56
What these data show
• There were 65.9% of patients with diagnosed hypertension at or below their target BP, and 34.1% higher than their target.
• The rate of patients not reaching their target BP may reflect patient-specific factors as noted in issues/comments above, the effectiveness of the GPs management of hypertension, or a combination of both.
References
AIHW:AGPSCC 2007. AIHW:Australian GP Statistics and Classification Centre, 2007. SAND abstract No. 98 from the BEACH program: Management of hypertension and angina in general practice patients. Sydney: AGPSCC.
Britt H, Miller GC, Charles J, Henderson J, Bayram C, Harrison C, Valenti L, Fahridin S, Pan Y, & O’Halloran J 2008. General practice activity in Australia 1998–99 to 2007–08: 10 year data tables. Canberra: Australian Institute of Health and Welfare.
Dorlands Illustrated Medical Dictionary 2000.Philadelphia: Saunders.
NPS 2006. National Prescribing Service 2006. Indicators of Quality Prescribing in Australian General Practice. Sydney: NPS.

57
Management of arthritis and musculoskeletal conditions
Indicator number: 5
Description: Number of people with chronic arthritis and musculoskeletal conditions with appropriately managed pain and/or a high level of functioning/quality of life.
Indicator status: Concept proposed for further development
Rationale (clinical/policy): Findings from the 2004–05 National Health Survey revealed that chronic arthritis and musculoskeletal conditions affect more than six million people, or 31 percent of the population, in Australia (AIHW 2008). Arthritis and musculoskeletal conditions became a National Health Priority Area in 2002, and in 2003 accounted for four percent of the total disease burden in Australia (AIHW 2008, AIHW 2005).
These conditions are a highly heterogeneous group, which include more than 150 forms of arthritis and musculoskeletal conditions. Their causes include overuse of joints, congenital anomalies, metabolic or biochemical abnormalities, infections, inflammatory conditions, trauma and cancer (AIHW 2008).
Individuals with chronic arthritis and musculoskeletal conditions have their functioning and quality of life significantly affected (Arthritis Australia 2004). Having more impact in older age groups, these conditions limit an individual’s mobility and also create difficulty with performing a range of routine tasks. The quality of their day-to-day life is low in terms of physical functioning, bodily pain and role performance. In view of the great number of those affected, the societal impacts of these diseases and conditions are considerable (Kelsey & Hochberg 1988; Arthritis Australia 2004).
The impact on functioning and quality of life which are caused by chronic arthritis and musculoskeletal conditions includes:
• Limiting the ability to live independently
• Reducing the capacity to maintain or gain employment
• Limiting social participation
• Requirements for informal care
(AIHW 2005)
The majority of treatment for arthritis and musculoskeletal conditions is aimed at managing pain and improving functioning and health-related quality of life (AIHW 2005).
The goal of this indicator is to assess the proportion of people with arthritis and other musculoskeletal conditions with appropriately managed pain and/or a high level of functioning/quality of life.
The concept of health-related quality of life (HRQoL) is based in the individual’s perceived physical and mental health over time, and aims to measure the impact that a disease or disability has on their daily life, for example, the ability to live independently (AIHW 2005).There are two basic approaches to functioning/quality of life measurement. Firstly, there are generic tools which provide a summary of quality of life or functioning over a

58
range of domains. Secondly, there are specific tools which focus on problems associated with specific diseases, patient groups, or areas of functioning.
Measurement of pain (and appropriate management of pain) can also be undertaken in different ways, for example, patient rated severity of pain, or clinical opinion on adequacy of pain management.
Numerator: To be determined
Denominator: Number of people with chronic arthritis and musculoskeletal conditions
Indicator type: Outcome
Disaggregation: To be determined
Related Indicators: 1 – Enhanced primary care services in general practice
42 – Functional gain achieved in rehabilitation 53 – Patient experience
Issues/Comments: As noted above, there are a number of potential means of measurement and related issues which may need to be considered in defining and operationalising this indicator. Restricting this indicator to a particular condition, such as rheumatoid arthritis may be appropriate, at least in the first stage of operationalising this indicator.
Framework elements
Health needs domain: Living with chronic conditions
Quality Domain: Effective, responsive, appropriate, continuous
Service category: Primary care and community health services, Specialised health services
NHPA: Arthritis and musculoskeletal conditions
Burden of disease: Musculoskeletal diseases
Disease expenditure: Musculoskeletal
Area of expenditure: Medical services, Other health practitioners, Community health and other
National Data Comments
Data currently available No
Data development required To be determined
Data source To be determined
No international comparisons available
References
AIHW 2005. Australian Institute of Health and Welfare 2005. Arthritis and musculoskeletal conditions in Australia, 2005. Canberra: AIHW.
AIHW 2008. Australia’s Health 2008. Canberra: AIHW.
Arthritis Australia 2004. The voice of arthritis: a social impact study of arthritis in Australia,. Sydney: Arthritis Australia.

59
Kelsey JL & Hochberg MC 1988. Epidemiology of chronic musculoskeletal disorders. Annual Review of Public Health 9:379-401.

60
Mental health care plans in general practice
Indicator number: 6
Description: Proportion of people with mental illness with GP care plans
Indicator status: Currently reportable – as per recommended specification
This indicator is to be reported under the National Healthcare Agreement
Rationale (clinical/policy): Mental health is one of Australia’s National Health Priority Areas, with mental illness being one of the more prevalent conditions affecting the Australian population (AIHW 2008b). In 2007 the Australian Bureau of Statistics (ABS) conducted a National Survey of Mental health and Wellbeing, with one of the findings of this survey being that one in five (20% or 3.2 million) Australians had a mental disorder in a 12 month period (ABS 2008a).
Mental illness is one of the leading causes of non-fatal burden of disease in Australia, and is associated with increased exposure to health risk factors, poorer physical health, and higher rates of death from many causes including suicide (AIHW 2008a).
It is recognised that primary care, and in particular general practice, is a major point of contact for individuals with mental illness (Johnson 2007). Funding is provided through the Medical Benefits Scheme (MBS) for general practitioners to prepare a mental health care plan for patients with mental illness. The MBS items incorporate a model for best practice primary health care of patients with mental disorders (including patients with both chronic and non-chronic disorders) that comprises assess and plan; provide and/or refer for appropriate treatment and services; and review/ongoing management as required (DoHA 2008).
Numerator: Number of individuals with a mental health care plans (MBS item 2710)
Denominator: Total population (Population with mental illness if available – see issues/comments below).
Indicator type: Process
Disaggregation: National: Indigenous status, Remoteness of DGP
DGP: Individual general practices
Practice: Individual clinicians
Related Indicators: 40 – Post-discharge community care for mental health patients
Issues/Comments: It should be noted that this indicator provides an indication of the extent to which GPs are utilising MBS mental health care plan items. It is not regarded as a direct measure of the quality of mental health management by GPs.
It would be assumed that each person with a mental health care plan would have a mental illness. It is not certain that this is a correct assumption.
There is limited information on the number of people with mental illness and uncertainty about what definition of mental illness should be used (see also Data development required below). Hence, for national reporting, it is recommended that the denominator be the total population or, if considered suitable, prevalence estimates from the National Survey of Mental Health and Wellbeing. For reporting at the level of Divisions of General Practice, or

61
within individual general practices, local estimates of numbers of patients with mental illness could be used as the denominator.
It is possible that this indicator will under-estimate appropriate mental health management by GPs who are providing appropriate care but not using the MBS items.
The data presently available through MBS statistics online allows presentation of rate of MBS items per 100,000 persons enrolled in Medicare (see figure below). However, for this proposed indicator, the recommended denominator would be the estimated resident population.
MBS Indigenous status data (based on Voluntary Indigenous Identification) is in need of improvement.
Framework elements
Health needs domain: Living with chronic conditions
Quality Domain: Appropriate
Service category: Primary care and community health services
Burden of disease: Mental disorders
Area of expenditure: Medical services
Disease expenditure: Mental disorders
NHPA: Mental Health
National Data Comments
National data currently available
Data development required Data development would be required to identify people with mental illness, as noted above. For national reporting, sources could include the National Survey of Mental Health and Wellbeing, or possibly K10 data from state/territory CATI population health surveys. At the Division or practice level, local data sources could be used to estimate numbers of patients with mental illness. There may need to be consideration of how recently the care plan item needs to have been claimed.
Data source DoHA/Medicare – Medicare Benefits Schedule (MBS)
Data collection arrangements Continuous collection of claims lodged with Medicare Australia.
Data available continuously
No international comparisons available

62
Presentation of available data
0
500
1000
1500
2000
2500
3000
NSW VIC QLD SA WA TAS ACT NT
Rate per 100,000 population
2006-07 2007-08
Notes
1. The Medicare rate is calculated by dividing the number of specific MBS items processed during the time period (financial year) by the number of people enrolled in Medicare during that period, expressed as a rate per 100,000.
2. The numerator as presented above is consistent with the proposed safety and quality indicator. However, the recommended denominator is not available and for this example represents the number of individuals enrolled in Medicare, The recommended disaggregations were also not available, and so the data has been presented disaggregated by jurisdiction.
3. It should be noted that the recommended disaggregations could be accessed through Medicare, however, for the purposes of this report readily accessible data was utilised.
Source: Medicare – MBS Statistics Online.
Mental health care plans (MBS item 2710) by State and Territory, 2006–07 to 2007–08, per 100,000 population.
What these data show
• The marked increase in the use of mental health plans between 2006–07 and 2007–08 may reflect the introduction of the Better Access to mental health services program, replacing the previous Better Outcomes program.
• Rates of use of mental health care plans differ across the jurisdictions with highest rates of use in Victoria and lowest in NT. This may reflect difference in the rate of use of the items by GPs, actual differences in the rate of use of mental health care plans, differences in the prevalence of mental illness or a combination of these factors.
References
ABS 2008. Australian Bureau of Statistics 2008. National Survey of Mental Health and Wellbeing: Summary of Results, 2007. Accessed 02/12/2008.
<http://www.abs.gov.au/AUSSTATS/[email protected]/mf/4326.0>
AIHW 2008a. Australian Institute of Health and Welfare 2008. Mental health services in Australia 2005–06. Canberra: AIHW.

63
AIHW 2008b. National Health Priority Areas: Mental Health. Accessed 02/12/2008.
<http://www.aihw.gov.au/nhpa/mentalhealth/index.cfm>
DoHA 2008. Australian Government Department of Health and Ageing 2008. Better Access to Psychiatrists, Psychologists and General Practitioners through the MBS. Accessed 02/12/2008.
<http://www.health.gov.au/internet/main/publishing.nsf/Content/health-pcd-programs-amhpm-pdf-explan>
Johnson C 2007. Managing mental health issues in general practice. Australian Family Physician 36:202-5.

64
Annual cycle of care for people with diabetes mellitus Indicator number: 7
Description: Proportion of people with diabetes mellitus who have received an annual cycle of care within general practice
Indicator status: Currently reportable – as per recommended specification
This indicator is to be reported under the National Healthcare Agreement
Rationale (clinical/policy): Diabetes mellitus became a National Priority Area in 1996. In November 2005, the Australian Health Ministers’ Conference endorsed a national strategic policy approach to manage and improve chronic disease prevention and care in the Australian population. This national approach comprises three complementary components: the National Chronic Disease Strategy, the National Service Improvement Frameworks and the Blueprint for Chronic Disease Surveillance. These provide an overarching framework for addressing the burden of chronic disease including diabetes, and for providing information to monitor progress (AIHW 2008b).
It is recognised that poor management of diabetes increases the risk of a range of complications, which are the major causes of the associated morbidity and mortality in people with diabetes (AIHW 2008a). The goal of diabetes management is for the diabetic patient to have a life that is as healthy and as normal as possible (AIHW 2008a).
Through the MBS the Australian Government provides funding for general practitioners (GPs) to undertake an ‘annual cycle of care’ for people with diabetes. The Royal Australian College of General Practitioners (RACGP) and Diabetes Australia guidelines describe the minimum level of care for people with diabetes which are aimed at monitoring glycaemic control, and preventing or delaying the onset of complications (AIHW 2008a). In order to claim MBS items for the annual cycle of care, the following must be completed:
• Measurement of glycated haemoglobin (HbA1c) levels.
• Review of smoking status, physical activity and nutrition.
• Measurement of body mass index (BMI).
• Measurement of blood pressure and serum lipids (cholesterol, triglycerides and HDL).
• Medication review.
• Comprehensive eye examination.
• Foot examination.
• Measurement of urinary albumin excretion (‘microalbuminuria’ test).
• Self-care education
(Diabetes Australia 2008).
Determining the proportion of people with diabetes who have completed an annual cycle of care provides a measure of the extent to which GPs are able to provide continuity or coordination of care for the prevention and management of diabetes mellitus (NHPC 2004).

65
Indicator Source: NHPC NHPA
Endorsement: AHMAC
Numerator: The number of people with diabetes mellitus who have received an annual cycle of care within general practice (MBS Group A41).
Denominator: Estimated number of people with diabetes mellitus managed within general practice
Indicator type: Process
Disaggregation: National: Indigenous status, Socioeconomic status, Remoteness of DGP, Sex
DGP: Individual general practices, Indigenous status, Socioeconomic status, Sex
Practice: Individual clinicians, Indigenous status, Socioeconomic status, Sex
Related Indicators: 1 – Enhanced primary care services in general practice 2 - General practices with a register and recall system for patients with chronic disease
47 – Selected potentially preventable hospitalisations 48 - End stage kidney disease in people with diabetes 49 – Lower-extremity amputation in people with diabetes
Issues/Comments: Currently, completion of an annual cycle of care for diabetes attracts a ‘diabetes incentive payment’ through Medicare. However, this payment is restricted to accredited practices that are registered for the Practice Incentive Program (PIP), which represents around 66 percent of all practices (SCRGSP 2009). Also, a GP may not necessarily claim the incentive payment even though they are eligible to do so.
The denominator for this indicator could be based on the number of individuals who have at least one HbA1c test performed during the reporting period. This information is not available at present. As an alternative, it may be possible to report this indicator as a population rate, as has been proposed for a number of other indicators relating to GP management of chronic conditions; these include ‘people with asthma with a written action plan’ and ‘enhanced primary care services in general practice.’
The data presently available through MBS statistics online allows presentation of rate of MBS items per 100,000 persons enrolled in Medicare (see figure below). However, for this proposed indicator, the recommended denominator would be the estimated resident population.
MBS Indigenous status data (based on Voluntary Indigenous Identification) is in need of improvement.
Framework elements
Health needs domain: Living with chronic conditions
Quality Domain: Appropriate, continuous
Service category: Primary care and community health services
NHPA: Diabetes Mellitus
Burden of disease: Diabetes

66
Area of expenditure: Medical services
National Data Comments National data currently available Limitations as discussed in ‘Issues/comments’ above.
Data development required Data development required to enable identification of patients who have at least one HbA1c test performed during the reporting period.
Data source Medicare – Medicare Benefits Schedule (MBS)
Data collection arrangements Continuous collection of claims lodged with Medicare Australia.
Data available continuously
International comparisons available:
• USA: Agency for Healthcare Research and Quality - National Healthcare Quality Report (HbA1c, Retinopathy screen, Foot examination).
• UK: Healthcare Commission – Primary Care Trusts Balanced Scorecard (Retinopathy screen)
• OECD: Health care quality indicators project – Selecting Indicators for the Quality of Diabetes Care at the Health Systems Level in OECD Countries report (HbA1c, LDL-cholesterol, Nephropathy screen, Retinopathy screen) (proposed indicator – to be reported for the first time for 2008–09).

67
Presentation of available data
0
200
400
600
800
1000
1200
NSW VIC QLD SA WA TAS ACT NT Total
Rate per 100,000 population
2004-05 2005-06 2006-07 2007-08
Notes
1. The Medicare rate is calculated by dividing the number of specific MBS items processed during the time period (financial year) by the number of people enrolled in Medicare during that period, expressed as a rate per 100,000.
2. The numerator as presented above is consistent with the proposed safety and quality indicator. However, the recommended denominator and disaggregations were not available, and so the rate has been calculated using the number of people enrolled in Medicare by and presented disaggregated by jurisdiction.
3. It should be noted that the recommended disaggregations as well as the proposed denominator can be accessed through Medicare, however, for the purposes of this report readily accessible data was utilised.
Source: Medicare – MBS Statistics Online.
MBS items (Group A41) for diabetes annual cycle of care (per 100,000 population), 2004–05 to 2007–08.
What these data show
• Use of the MBS item for diabetes annual cycle of care has increased across Australia from 2004–05 to 2007–08
• The data shows different per capita rates across jurisdictions which may reflect differences in the use of the MBS items by GPs, actual differences in the rate of diabetes annual cycles of care being provided, or a combination of both.
References
AIHW 2008a. Australian Institute of Health and Welfare 2008. Diabetes: Australian Facts 2008. Canberra: AIHW.
AIHW 2008b. Australian Institute of Health and Welfare. Change to health information committees under the Australian Health Ministers Advisory Council in 2008. Accessed 17/09/2008. <http://www.aihw.gov.au/committees/hdsc/index.cfm>

68
Diabetes Australia 2008. Diabetes Management in General Practice 14th Ed. Sydney: Diabetes Australia.
Greenfield S, Nicolucci A and Mattke S 2004. Selecting indicators for the quality of diabetes care at the health systems level in OECD countries. Directorate for Employment, Labour and Social Affairs Group on Health, OECD.
NHPC 2004. National Health Performance Committee 2004. National report on health sector performance 2003. Canberra. AIHW.
Roughhead EE, Barratt J, Gilbert AL, Peck R and Killer G 2008. Diabetes processes of care in the Australian veteran population. Diabetes Research and Clinical Practice 79:299-304.
SCRGSP 2009. Steering Committee for the Review of Government Service Provision 2009. Report on Government Services 2009. Canberra. Productivity Commission.

69
Cervical cancer screening rates
Indicator Number 8
Description: Screening rates for cervical cancer for women aged 20–69 years.
Indicator status: Currently reportable – as per recommended specification
This indicator is to be reported under the National Healthcare Agreement
Rationale (clinical/policy): Cancer contributes more to Australia’s burden of disease than any other disease group and is a National Health Priority Area. Regular cancer screening aims to reduce mortality and morbidity by maximising early detection, and has shown to be effective for breast, bowel and cervical cancer.
Screening for cervical cancer is particularly effective as this is one of the few cancers where early detection can identify pre-cancerous lesions which rarely cause any symptoms. The introduction of the Pap smear in the 1960s, and the National Cervical Screening Program in 1991, has led to a drop in resulting death rates in the order of 75 percent (AIHW 2008a).
The Program was set up to maintain and expand the recruitment of women aged between 20 and 69 as clients for regular Pap tests. Participation rates in the Program are higher amongst the economically advantaged than the economically less advantaged, and amongst city dwellers compared to their rural and remote counterparts, and these differences are reflected in lower versus higher mortality rates from cervical cancer. The risk of death due to cervical cancer amongst Indigenous women, compared to other Australian women, remains particularly high (AIHW 2008b).
Cervical screening is largely provided by GPs, although other providers such as family planning clinics and women’s health services also provide Pap smear services. States and territories take responsibility for supporting screening programs through recruitment activities and the support of population registers and reminder systems. The Australian Government is the primary source of funding for cervical screening (through the MBS) (NHPC 2004).
Indicator Source: NHPC (endorsed by the National Cervical Screening Program)
Numerator: Number of women in target group who have been screened for cervical cancer in the last two years
Denominator: Number of women aged 20–69 years
Indicator type: Process
Disaggregation: National: State/Territory, Remoteness of DGP, Indigenous status, Socioeconomic status
DGP: Individual general practices, Indigenous status
Practices: Individual clinicians, Indigenous status
Related Indicators: 50 – Cancer survival

70
Issues/Comments: In most OECD countries which monitor cervical cancer screening rates, including those countries with a lower rate of cervical cancer mortality than Australia, the recommended period to check for a screen is three or five years (NHMRC 2005). To foster international comparisons, the National Cervical Screening Program also endorses three and five-year screening rate indicators (AIHW 2008b).
The majority of cervical cancers in Australia are caused by Human Papilloma Virus (HPV) types 16 and 18, for which there is now a highly effective vaccination available, particularly when administered to females before the onset of sexual activity. Pap tests are still strongly recommended for women in the target group who have received cervical cancer vaccination (NSW CC 2009).
Framework elements
Health needs domain: Staying healthy
Quality Domain: Appropriate, continuous
Service category: Primary care and community health services
NHPA: Cancer control
Burden of disease: Cancer
Disease expenditure: Neoplasms
Area of expenditure: Medical services, Community health and other
National Data Comments
National data currently available
No data development required
Data source National Cervical Screening Program
Data collection arrangements Collected and reported by the AIHW
Data available annually
Time lag from collection to reporting: Approximately two years following the financial year for which data were collected
International comparisons available: • Canada: Pan-Canadian Primary Health Care Indictors Report
• USA: Commonwealth Fund – First Report and Recommendations of the Commonwealth Fund’s International Working Group on Quality Indicators
• European Union: included in proposed indicator set for the European Community Health Indicators (ECHI) project (proposed indicator only).
• USA: National Committee for Quality Assurance – included in the Healthcare Effectiveness Data and Information Set (HEDIS)

71
Presentation of available data
0
10
20
30
40
50
60
70
80
NSW VIC QLD WA SA TAS ACT NT Australia
Percent
1996-97 2003-04 2005-06
Notes:
1. The numerator, denominator and disaggregation as presented above are consistent with the proposed safety and quality indicator
2. The NSW Pap register commenced in July 1996; therefore data have been estimated for the period January to July 1996.
3. In the 2003-04 and 2005-06 reporting periods the Victorian registries only registered women with a Victorian address.
4. Since the National Cervical Screening Program commenced, the ACT has only registered women with an ACT address.
5. The Queensland Health Pap register began operations in February 1999; therefore no data are available for 1996-97.
6. The NT Pap register commenced in March 1996; therefore data have been estimated for the period to March 1996.
7. Rates are the number of women screened as a percentage of the eligible female population calculated as the average of the ABS estimated resident population and age-standardised to the Australian population at 30 June 2001.
8. Participation rates have been adjusted for the estimated proportion of women who have had a hysterectomy.
9. These data exclude women who have opted not to be on the cervical cytology register.
Source: AIHW 2008b.
Participation of women aged 20-69 years in the National Cervical Screening Program, by state and territory, 1996–97, 2003–04 and 2005–06 (per cent)
What these data show
• In the two year period 2005–2006, there was a decline in participation compared with 2003–2004 rates in Victoria, South Australia and the Northern Territory, and increases in Western Australia and the Australian Capital Territory.
• The highest participation rates for 2005–2006 were in Victoria (64.3%) and South Australia (64.5%) and the lowest in Queensland (57.7%) and the Northern Territory (54.5%).

72
References
AIHW 2008a. Australia’s Health 2008. Canberra: AIHW.
AIHW 2008b. Cervical screening in Australia 2005–2006. Canberra: AIHW.
NHMRC 2005. National Health and Medical Research Council 2005. Screening to prevent cervical cancer: guidelines for the management of asymptomatic women with screen detected abnormalities. Canberra: NHMRC.
NHPC 2004. National Health Performance Committee 2004. National report on health sector performance 2003. Canberra. AIHW.
NSW CC 2009. New South Wales Cancer Council, 2009. Cervical cancer vaccine fact sheet. Viewed 19 March 2009. <http://www.cancercouncil.com.au/editorial.asp?pageid=253#15a>
73
Immunisation rates for vaccines in the national schedule
Indicator Number 9
Description: Rates of children fully vaccinated and rates of adults vaccinated against specific infectious diseases.
Indicator status: Currently reportable – as per recommended specification
This indicator is to be reported under the National Healthcare Agreement
Rationale (clinical/policy): Vaccination is vital for minimising morbidity and mortality from infectious diseases. It protects both individuals and the community by increasing the general level of immunity and minimising the spread of infection (DoHA/NHMRC 2008). Largely because of the success of nationwide immunisation programs, the proportion of deaths in Australia that were due to infectious diseases declined from 15 percent in 1922 to around one percent in 2005 (AIHW 2008). In 2003, childhood immunisable diseases accounted for <0.1% of Australia’s burden of disease (Begg et al. 2007). Vaccinations scheduled for at-risk adults are similarly important for the health of the population. Epidemiological studies show a 50 percent reduction in the risk of hospitalisation for influenza amongst adults 65 years and older, and an 86 percent reduction in the incidence of vaccine-preventable invasive pneumococcal disease among North Queensland Indigenous adults, following vaccination (DoHA/NHMRC 2008).
The Australian State and Territory Governments work through the Immunise Australia Program to raise national immunisation rates. The Australian Childhood Immunisation Register (ACIR) plays a role in collecting information on vaccinations that can be used to support vaccination reminders and monitoring of immunisation rates (DoHA 2009).
Australia’s general practices play a major role in the delivery of the National Immunisation Program, funded through Medicare. Over two-thirds of Australia’s childhood vaccinations were provided through general practices in 2006–07, and over 98 percent of vaccinated adults 65 years and older received their vaccination from a general practitioner or other doctor in 2006 (AIHW 2008).
Indicator Source: Immunise Australia Program (endorsed by AHMAC) NHPC (childhood immunisation; influenza vaccinations for adults 65+ years)
Numerator: Number of persons in target group who have received vaccines on the current National Immunisation Program Schedule:
• Children aged 1, 2 and 5 years
• Indigenous adults aged 50 and over
• Adults aged 65 and over
Denominator: Number of persons in target group
Indicator type: Outcome
Disaggregation: National: State/Territory, Indigenous status, Remoteness of DGP, At-risk populations (see Issues/comments below)
74
DGP: Individual general practices, Indigenous status, At-risk population
Practices: Individual clinicians, Indigenous status, At-risk population
Related Indicators: 47 – Selected potentially preventable hospitalisations
Issues/Comments: There needs to be clarification as to the age at which the immunisation status of children is assessed, that is, whether it is assessed at the age by which immunisation is recommended, or following a period of time for catch-up vaccinations. In addition, there also needs to be clarification of the types of vaccines to be included for adults. Influenza vaccination should be included, but other vaccines have lower priority.
The National Immunisation Schedule (DoHA 2008) includes additional recommended vaccinations for particular at-risk groups. These could be the basis for a conceptually related but differently defined indicator. For instance, Indigenous children in high-risk areas are scheduled to receive pneumococcal polysaccharide and Hepatitis A vaccinations between the ages of 18–24 months. An indicator focused on full vaccination would therefore count these children as not fully vaccinated even if they had received all of the vaccinations scheduled for other children.
Recommendations on best practice evolve over time. For example, the current National Schedule lists influenza vaccinations for all Indigenous Australians over 49 years, and for at-risk Indigenous Australians between 15 and 49 years. However, the latest recommendation is to provide influenza vaccinations for all Indigenous Australians aged 15 years or older (DoHA/NHMRC 2008). If and when a change of this magnitude is made to the National Schedule, the related indicator rate could be expected to change, particularly in the first few years as the change takes effect. Minor changes to the National Schedule in the last several years have had the effect of producing spikes in childhood immunisation rates (AIHW 2008).
Framework elements Health needs domain: Staying healthy
Quality Domain: Appropriate, continuous
Service category: Primary care and community health services
Burden of disease: Infections and parasitic diseases
Disease expenditure: Infections and parasitic
Area of expenditure: Medical services, Community health and other
National Data Comments
National data currently available
No data development required Data development to address particular at-risk groups could be considered as a future initiative
Data source Australian Childhood Immunisation Register (childhood vaccinations)
Australian Institute of Health and Welfare (influenza and pneumococcal disease adult vaccination surveys)
Data collection arrangements Collected by the above organisations

75
Data available quarterly for childhood immunisations, and periodically for adult vaccination surveys
Time lag from collection to reporting: Childhood immunisation data available 1 month after the end of each quarter
Adult vaccination data available 1 year after survey year
International comparisons available
• USA: Agency for Healthcare Research and Quality - National Healthcare Quality Report (recommended vaccinations for children aged 19-35 months).
• UK: Healthcare Commission – Primary Care Trusts Balanced Scorecard (Influenza, MMR for adolescents)
• Canada: Pan-Canadian Primary Health Care Indictors Report (Child immunisation, Influenza and pneumococcal immunisation for over 65 years)
• OECD: Health care quality indicators project – Selecting Indicators for the Quality of Health Promotion, Prevention and Primary Care at the Health Systems Level in OECD Countries (MMR for adolescents; Influenza and pneumococcal immunisation for high-risk groups)
Presentation of available data
0
10
20
30
40
50
60
70
80
90
100
ACT NSW VIC QLD SA WA TAS NT Australia
Percent
12-15 months 24-27 months
Note:
1. The numerator, denominator and disaggregation as presented above are consistent with the proposed safety and quality indicator.
2. For the categories used above, age has been calculated as at 31 March 2008.
3. Only those vaccines which have been administered before 12 months, 24 months, and 72 months are included in the coverage calculation
Source: Medicare Australia, Australian Childhood Immunisation Register, 2008.
Children vaccinated with the highest level schedule (as appropriate), by age-group and State and Territory, as at 30 June 2008 (per cent)

76
What these data show
• For the 12-15 month age-group, ACT had the highest proportion of fully immunised children (93.5%) and WA had the lowest (90.1%).
• For the 24-27 month age-group, ACT had the highest proportion of fully immunised children (94.8%) and WA had the lowest (91.2%).
• For the 60-63 month age-group Victoria had the highest proportion of fully immunised children (90.5%) and WA had the lowest (84.1%).
References
AIHW 2008. Australia’s Health 2008. Canberra: AIHW cat. no. AUS 99.
Begg S, Vox T, Barker B, Stevenson C, Stanley L, Lopez AD, 2007. The burden of disease and injury in Australia. Canberra: AIHW.
DoHA/NHMRC 2008. Australian Government Department of Health and Ageing and the National Health and Medical Research Council 2008. The Australian Immunisation Handbook 9th edition. Canberra: Commonwealth of Australia.
DoHA 2008. Australian Government Department of Health and Ageing 2008. National Immunisation Program (NIP) Schedule. Viewed 16 March 2009. <http://www.immunise.health.gov.au/internet/immunise/publishing.nsf/Content/nips>
DoHA 2009. Australian Government Department of Health and Ageing. Immunise Australia Program. Viewed 16 March 2009. <http://www.immunise.health.gov.au/>.

77
Eye testing for target groups
Indicator Number 10
Description: The proportion of particular at-risk groups who have had at least one eye examination within the last two years.
Indicator status: Currently reportable – data development required to meet recommended specification
Rationale (clinical/policy): In 2005 the Australian Health Ministers’ Conference endorsed the National Framework for Action to Promote Eye Health and Prevent Avoidable Blindness and Vision Loss (Australian Government 2005). The key areas addressed by the Framework are:
• Reducing the risk of eye disease and injury
• Increasing early detection
• Improving access to eye health care services
• Improving the systems and quality of care
• Improving the underlying evidence base.
Community studies show that a significant proportion of eye disease conditions go undetected and untreated (Australian Government 2005). Early detection would help prevent this problem which potentially affects up to half of Australia's cases of vision loss and one quarter of Australia's cases of ‘legal blindness’ (Taylor & Keeffe 2001). Examples of eye diseases which can be treated effectively if detected early include glaucoma, trachoma, and certain forms of macular degeneration, where early diagnosis and treatment may prevent up to 98 percent of severe vision loss (Australian Government 2005). For people with sight-threatening eye conditions which are untreatable with current medical technology, early diagnosis is still important so as to enable them to make the necessary career, financial and lifestyle decisions (Australian Government 2005).
Numerator: Number of persons in target group who have received at least one optometry eye examination (identified by MBS item 10900) in the last two years
Denominator: Number of persons in target group (see Issues/comments below)
Indicator type: Process
Disaggregation: National: State/Territory, Indigenous status, Socioeconomic status, Remoteness, At-risk populations (see Issues/comments below)
State/Territory: Indigenous status, Socioeconomic status, Remoteness, At-risk populations (see Issues/comments below)
Issues/Comments: A recent review of data sources relating to eye health concluded that the key area ‘increasing early detection’ was only moderately informed by the existing data sources (AIHW 2007).
Although the Eye Health Action Framework advises that target groups should have regular eye checks, the target population and recommended time interval have not been defined. The two year period proposed here is based on the time period used in the MBS schedule for claims by optometry services relating to eye checks. Further development work would be required to define the appropriate target population and time interval for this indicator.

78
Framework elements
Health needs domain: Staying healthy
Quality Domain: Appropriate, continuous
Service category: Primary care and community health services
Burden of disease: Neurological and sense disorders
Disease expenditure: Nervous system
Area of expenditure: Medical services
National Data Comments
National data currently available Limitations as discussed in ‘Issues/comments’ above
Data development required At present, the MBS item data can be disaggregated by age-groups. At risk populations need to be defined, and may not be able to be identified with MBS data. Data sources to identify them for denominator data at the national level would also need to be identified.
A possible alternative to collect the information required for the indicator would be via a population health survey, but data development would be required.
MBS Indigenous status data (based on Voluntary Indigenous Identification) is in need of improvement.
Data source Medicare – Medical Benefits Schedule (MBS)
Data collection arrangements Continuous collection of claims lodged with Medicare Australia
Data available continuously
International comparisons available:
UK National Health Service – for the age group 65-69 free eye testing is available every two years, and for those 70 years and older, eye testing is completely free.
References
ABS/AIHW 2008. Australian Bureau of Statistics and the Australian Institute of Health and Welfare 2008. The health and welfare of Australia's Aboriginal and Torres Strait Islander Peoples 2008. Canberra: Australian Bureau of Statistics.
AHRQ 2003. American Health Quality Association, 2003. Improving care for diabetes. <http://www.ahqa.org/pub/quality/161_689_2974.cfm>
AIHW, 2007. Australian Institute of Health and Welfare 2007. A Guide to Australian Eye Health Data. Canberra: AIHW .
AIHW, 2008a. Australian Institute of Health and Welfare 2008. Australia’s Health 2008. Canberra: AIHW.

79
AIHW, 2008b. Australian Institute of Health and Welfare 2008. Eye health in Australia: A hospital perspective. Canberra: AIHW.
Australian Government, 2005. National Framework for Action to Promote Eye Health and Prevent Avoidable Blindness and Vision Loss. Endorsed by the Australian Ministers’ Health Conference November 2005. Canberra: Commonwealth of Australia.
McCarty CA, Lloyd-Smith CW, Lee SE, Livingston PM, Stanislavsky YL, Taylor HR, 1998. Use of eye care services by people with diabetes: the Melbourne Visual Impairment Project. British Journal of Ophthalmology 82:410-14.
Royal National Institute for the Blind, 2008. Low take-up of eye examinations – further information. Viewed 18 March 2009. < <http://www.rnib.org.uk/xpedio/groups/public/documents/publicwebsite/public_statslow.hcsp>
Taylor HR, Keeffe JE. 2001. World blindness: a 21st century perspective. British Journal of Ophthalmology 85:261-66.

80
Quality of community pharmacy services Indicator number: 11
Description: To be determined
Indicator status: Concept proposed for further development
Rationale (clinical/policy): As a component of the primary health care system, community pharmacy services are critical in providing appropriate and timely delivery of medicines (DoHA 2005). This is supported by the International Pharmaceutical Federation which states that, ‘all practicing pharmacists are obliged to ensure that the service they provide to every patient is of appropriate quality’ (IPF 1997).
In Australia, the Pharmacy Guild of Australia and the Pharmaceutical Society of Australia, in partnership, worked to develop a quality assurance program for Australian community pharmacies (Chapman et al. 2005). Established in 1998, the Quality Care Pharmacy Program (QCPP) is aimed at raising the standards of service that pharmacies provide to the public. Currently, over 86 percent of Australian Community Pharmacies are accredited under the QCPP program. To ensure that pharmacies are meeting the required Standard in all areas of their business, they are required to undergo an external audit every two-years (QCPP 2008).
Numerator: To be determined
Denominator: To be determined
Indicator type: To be determined
Disaggregation: To be determined
Related Indicators: 13 – People receiving a medication review
46 – Inappropriate co-prescribing of medicines 55 – Accreditation of health care services
Issues/Comments: The current processes of review and audit of professional pharmacy standards are currently undertaken only by pharmacies accredited by the QCPP. Ideally, any future indicator of the quality of community pharmacy would involve all pharmacies, either as a part of an expanded role for the QCPP, or as a part of an alternative program.
Future consultation and development work could be undertaken to develop agreed measures of the safety and quality of community pharmacy.
Framework elements
Quality Domain: Appropriate, capable
Service category: Primary care and community health services
National Data Comments
Data not currently available
Data development required Dependent on indicator selection as per above.
Data source Dependent on indicator selection as per above
No international comparisons available
81
References
Chapman J, Roberts M & Stokes J 2005. Final Report: Evaluation of the Quality Care Pharmacy Program. Australia: Pharmacy Guild of Australia.
DoHA 2005. Australian Government Department of Health and Ageing. The Fourth Community Pharmacy Agreement. Accessed 13/03/2009.
<http://www.health.gov.au/internet/main/publishing.nsf/Content/F7FBDB333D030BFFCA2570C000003A44/$File/4cpacompilation.pdf>
IPF 1997. International Pharmaceutical Federation 1997. Standards for quality of pharmacy services: Good pharmacy practice. Accessed 13/03/2009.
<http://www.fip.org/files/fip/Statements/latest/Dossier%20004%20total.PDF>
QCPP 2008. Pharmacy Guild: Quality Care Pharmacy Program. Accessed 09/10/2008. <http://www.guild.org.au/qcpp/content.asp?id=127>
The Pharmacy Guild of Australia - <http://www.guild.org.au/qcpp/content.asp?id=123 (viewed 22/09/2008)>

82
Developmental health checks in children
Indicator Number 12
Description: Proportion of children who have received a developmental health check at the age of 4 years
Indicator status: Currently reportable – data development required to meet recommended specification
This indicator is to be reported under the National Healthcare Agreement
Rationale (clinical/policy): In 2008 the Australian Government introduced the Healthy Kids Check funded through Medicare items 709 and 711. Its purpose is to ensure that four-year old children in Australia receive a basic check-up to assess whether they are healthy, fit and ready to learn when they begin school (DoHA 2009). A complete health check involves both mandatory items and additional items for consideration.
Mandatory items:
• Height and weight
• Eyesight check (visual inspection; visual acuity test; enquire as to amblyopia, eye infection or injury, or a family history of eyesight problems)
• Hearing check (ear examination, enquiring into parental concerns)
• Oral health check (teeth and gums; enquire into tooth brushing and visits to the dentist)
• Toilet habits check (independently use toilet, bedwetting)
• Known or suspected allergies check
Additional items for consideration:
• Discussion of eating habits
• Discussion of physical activity
• Enquiries into speech and language development
• Enquiries into fine and gross motor skills
• Enquiries into behaviour and mood
• Other examinations as considered necessary
The Healthy Kids Check can be performed by medical practitioners excluding specialists or consultant physicians (item 709), usually a GP and preferably the child’s ‘usual doctor’. It can also be undertaken by a registered/enrolled practice nurse on behalf of the GP (item 711). (DoHA 2009).
The mandatory items are designed to note potential causes for concern that should lead to specialist referrals, and/or to stimulate the additional items’ points of discussion and enquiry in the event of clinical evidence for related delays to the child’s physical, social and intellectual development (DoHA 2009).

83
Indicator Source: National Health and Hospitals Reform Commission
Numerator: Number of children aged 4 years who have received a developmental health check (MBS items 709 or 711) during their fourth year of life
Denominator: Population of children aged 4 years
Indicator type: Process
Disaggregation: National: State/Territory, Indigenous status, Remoteness of DGP, Clinician performing check (i.e. MBS item 709 for medical practitioner and item 711 for nurse).
DGP: Individual general practices, Indigenous status
Practice: Individual clinicians
Related Indicators: 9 – Immunisation rates
Issues/Comments: The use of MBS items for the numerator for this indicator is an interim measure, because it only captures checks undertaken in the private sector. Data development work would need to be undertaken to capture checks undertaken in the public sector, including in community health settings and pre-schools.
The denominator for the MBS items could exclude those children who had not received their scheduled vaccinations. However, if they were not excluded, this measure could become a composite measure reflecting both immunisation rates and health check rates, which may be appropriate.
Children who have not received their scheduled vaccinations for four-year olds are ineligible for a Healthy Kids Check.
Framework elements Health needs domain: Staying healthy
Quality Domain: Appropriate, continuous
Service category: Primary care and community health services
Area of expenditure: Medical services
National Data Comments
Data currently available MBS items 709 and 711 (introduced on 1 July 2008)
Data development required To capture checks undertaken in the public sector (see above)
MBS Indigenous status data (based on Voluntary Indigenous Identification) is in need of improvement.
Data source DoHA/Medicare – Medical Benefits Schedule (MBS)
Data collection arrangements Continuous collection of claims lodged with Medicare Australia
Data available continuously
International comparisons available
• USA: Agency for Healthcare Research and Quality - National Healthcare Quality Report includes the following items: height, weight, vision check and health advice.

84
• UK: the Performance Management Framework for the SureStart Children’s Centres includes measures relating to speech, language and behaviour. The National Child Measurement Program includes height and weight measures at reception and at 6 years.
References
Allen KJ, Hill DJ, Heine RG, 2006. Medical Journal of Australia. Practice Essentials – Allergy. 4. Food allergy in childhood. Medical Journal of Australia 185 (7):394-400.
DoHA 2009. Australian Government Department of Health and Ageing 2009. Medicare Healthy Kids Check MBS items 709 and 711. Viewed 19 March 2009.
Douglass JA & O’Hehir RE, 2006. Medical Journal of Australia. Practice Essentials – Allergy. 1. Diagnosis, treatment and prevention of allergic disease: the basics. Medical Journal of Australia 185 (4):228-33.
Kemp AS, 2003. EpiPen epidemic: suggestions for rational prescribing in childhood food allergy. Journal of Paediatric Child Health 39 (5):376-77.
SA 2008. Government of South Australia Children, Youth and Women’s Health Service 2008. Bedwetting. Parenting SA Parenting Easy Guide 22. Viewed 20 March 2009. <http://www.parenting.sa.gov.au/pegs/peg22.pdf>
Wald ER, Di Lorenzo C, Cipriani L, Colborn DK, Burgers R, Wald A, 2009. Bowel habits and toilet training in a diverse population of children. Journal of Paediatric Gastroenterology and Nutrition 48 (3): 294-98.

85
People receiving a medication review Indicator number: 13
Description: People who have received a medication review in the last 12 months. This includes both community dwelling persons and residential aged care facility residents.
Indicator status: Currently reportable – as per recommended specification
Rationale (clinical/policy): Medications are the most frequently utilised health intervention in Australia, for example, in any two week period around 70 percent of people will have taken at least one medicine, and for older people this increases around 90 percent (ACSQHC 2008). In Australia medicines are associated with more adverse events than any other aspect of health care, and it is estimated that there are at least 80,000 medication-related hospitalisations in Australia each year and it is believed that between 32 and 69 percent of these are avoidable (Roughead 2002, ACSQHC 2008).
There are a number of recognised risk factors which associated with medication-related adverse events, these include:
• Currently taking five or more regular medications
• Taking more than 12 doses of medication/day
• Significant changes made to the medication regimen in the last three months
• Medication with a narrow therapeutic index or medications requiring therapeutic monitoring
• Symptoms suggestive of an adverse drug reaction
• Sub-therapeutic response to treatment with medicines
• Suspected non-compliance or inability to manage medication related therapeutic devices
• Patients having difficulty managing their own medicines because of literacy or language difficulties, dexterity problems or impaired sight, confusion/dementia or other cognitive difficulties
• Patients attending a number of different doctors, both general practitioners and specialists
• Recent discharge from a facility/hospital (in the last four weeks).
(DoHA 2009)
Evidence from a number of studies conducted in Australia, for patients at risk of medication-related adverse events, have shown that medication review may result in:
• Improved patient satisfaction, understanding of and concordance with medication regimen
• Positive clinical benefits, in terms of the patient's health and quality of life
• Improved relationships between GP, patient and pharmacist
• A reduction in health care costs.
(DoHA 2009)
There are currently two different programs supporting medication reviews which are funded through Medicare. Firstly, the Home Medicine Review (HMR, Medicare item 900) utilises the specific knowledge and expertise of each of the health care professionals

86
involved. In collaboration with the GP, a pharmacist comprehensively reviews the patient's medication regimen in a home visit. After discussion of the visit findings and report with the pharmacist, the GP and patient agree on a medication management plan. (DoHA 2009)
Secondly, the Residential Medication Management Review (RMMR, Medicare item 903) is for residents of aged care homes who are likely to benefit from such a service. In particular, it is for residents for whom quality use of medicines may be an issue, or who are at risk of medication misadventure because of a significant change in their condition or medication regimen. (DoHA 2009)
Numerator: Number of people who have received either a HMR (MBS item 900)
or RMMR (MBS item 903) in the last 12 months
Denominator: Total population
Indicator type: Process
Disaggregation: National: Indigenous, Remoteness, Community dwelling /residential aged care, DGP
DGP: Individual general practices
Practices: Individual clinicians
Related Indicators: 11 – Quality of Community Pharmacy services
46 – Inappropriate co-prescribing of medicines
47 – Selected potentially preventable hospitalisations
Issues/Comments: Medicare benefits for RMMRs are available only to people receiving Commonwealth subsidised aged care. People receiving care in other institutions not funded under the Aged Care Act are eligible for HMR services.
The data presently available through MBS statistics online allows presentation of rate of MBS items per 100,000 persons enrolled in Medicare (see figure below). However, for this proposed indicator, the recommended denominator would be the estimated resident population.
Framework elements
Health needs domain: Living with chronic conditions
Quality Domain: Safe, appropriate
Service category: Multiple service categories (Primary and community health services, Residential aged care).
Area of expenditure: Medical services
National Data Comments
National data currently available MBS data are available for items 900 and 903.
Data development required MBS Indigenous status data (based on Voluntary Indigenous Identification) is in need of improvement.
Data source DoHA/Medicare Australia – MBS

87
Data collection arrangements Continuous collection of claims lodged with Medicare Australia.
Data available continuously
No international comparisons available
Presentation of available data
0
50
100
150
200
250
300
350
400
NSW VIC QLD SA WA TAS ACT NT Total
Rate per 100,000 population
900 903
Notes
1. The rate is calculated by dividing the number of specific MBS items processed during the time period (financial year) by the number of people enrolled in Medicare during that period, expressed as the number of items per 100,000 Medicare enrolees.
2. The numerator and denominator as presented are consistent with the proposed safety and quality indicator. However, the recommended disaggregations were not available, and so the data has been presented disaggregated by jurisdiction.
Source: Medicare – MBS Statistics Online.
Home Medicine Review (MBS item 900) and Residential Medication Management Review (MBS item 903) per 100,000 population, by State and Territory, July 2007 to June 2008.
What these data show
• The data shows different rates across jurisdictions which may reflect differences in the use of the MBS items by GPs, the rate of provision of medication reviews, or a combination of both.

88
References
ACSQHC 2008. Australian Commission on Safety and Quality in Health Care 2008. Windows into Safety and Quality in Health Care 2008, ACSQHC, Sydney.
DoHA 2009. Department of Health and Ageing. Medication Management Reviews. Viewed 14 April 2009.
<http://www.health.gov.au/internet/main/publishing.nsf/Content/health-epc-dmmr-answers.htm>
Roughead EE, 2002. The nature and extent of drug-related hospitalisations in Australia. Journal of Quality in Clinical Practice vol. 19 pp. 19–22.

89
Assessment for risk of venous thromboembolism in hospital Indicator Number: 14
Description: Proportion of admitted adult patients who are assessed for risk of venous thromboembolism (VTE).
Indicator status: Not currently reportable – indicator and/or data development required
Rationale (clinical/policy): Thromboembolism is the formation in a blood vessel of a clot (thrombus) that breaks loose and is carried by the blood stream to plug another vessel (Medicinenet.com 22 August 2008). VTE are major, potentially fatal complications of hospital admission. The incidence of VTE varies with age, medical condition, type of surgery and prolonged immobilisation (NSW TAG 2007).
It has been estimated that VTE affects 1–2 per 1000 people in the general population in Australia each year, usually as deep venous thrombosis (DVT) of the leg or pulmonary embolism (PE). The incidence increases from 1 in 10 000 for individuals younger than 40 years to 1 in 100 for those older than 60 years (Ho et al. 2005). It is estimated to cause about 5,300 deaths annually (Access Economics 2008). Incidence of VTE has been found to be around 135 times greater among hospitalised patients compared to those in the community. Assessing patients for risk of VTE and then undertaking appropriate prophylaxis can substantially reduce this burden (NSW TAG 2007).
There is a strong evidence base for VTE preventive measures, and they are relatively cheap and straightforward to implement. Best practice guidelines suggest that all admitted adult patients should be assessed for risk of VTE, and then appropriate action taken according to the level of risk ascertained. VTE risk assessment should help guide appropriate treatment options, including the choice of prophylactic therapy (NSW TAG 2007). The NICS/NHMRC Australian guidelines for prevention of VTE are currently under development and are expected to be completed by July 2009.
The National Institute of Clinical Studies (NICS) has identified the widespread underuse of VTE prophylaxis in Australian hospitals as an evidence practice gap (NICS 2003). The prevention of VTE in hospitals has been identified internationally as a stand-out opportunity to improve patient safety.
Indicator Source: NSW Therapeutic Advisory Group (TAG) Indicators for Quality Use of Medicines (QUM) in Australian hospitals
Numerator: Number of adult admitted patients that have a documented VTE risk assessment
Denominator: Number of adult admitted patients in reference period
Indicator type: Process
Disaggregation: National: Public Hospital Peer Group, Public/private hospital sector, Disease groups (including cancer patients), Speciality type (medical, surgical), Indigenous, Remoteness of facility, State/Territory.
State/Territory: Public Hospital Peer Group, Public/private hospital sector, Disease groups (including cancer patients), Speciality type

90
(medical, surgical), Indigenous, Remoteness of facility, Health service region, Facility/organisation
Facility/Organisation: Disease groups, Indigenous, Speciality type
Related Indicators: 31 – Postoperative venous thromboembolism
Issues/Comments: The development of the NICS/NHMRC Australian guidelines for prevention of VTE are expected to be completed by July 2009. At that time this indicator should be reviewed to ensure that it aligns with the guidelines.
A limitation of the indicator is that it will not measure whether prophylactic measures were taken, or whether they were appropriate or effective (although indicator 31 will reflect that). However, it is unlikely that no action would be taken if a patient was assessed as being at high risk of VTE.
Framework elements Health needs domain: Getting Better
Quality Domain: Appropriate
Service category: Hospitals
NHPA: Cardiovascular health
Burden of disease: Cardiovascular disease
Disease expenditure: Cardiovascular
Area of expenditure: Hospitals
National Data Comments
National data not currently available Limited data has been collected in NSW for NSW TAG/ Clinical Excellence Commission (CEC) on a random sample of admitted adult patients over a one month period.
Data development required A standardised approach for documentation of VTE risk assessment would ideally be adopted across all health care facilities, to facilitate data collection and comparability of data between institutions. Substantial development is required to collect data on risk assessments at a national level. Data development could also be directed at creating a new data element for the Admitted Patient Care NMDS to record whether a risk assessment had been conducted. The NMDS data could also be used to estimate the denominator population.
Data source National audit of random sample of patients or a new data element added to the Admitted Patient Care NMDS.
Data collection arrangements Recommend that this be collected by States and Territories for both private and public hospitals
No international comparisons available

91
References
Access Economics 2008. The burden of venous thromboembolism in Australia. Canberra: Access Economics.
Ho WK, Hankey GJ, Lee CH, and Eikelboom JW 2005. Venous thromboembolism: diagnosis and management of deep venous thrombosis. Medical Journal of Australia 2005; 182 (9): 476-481. <http://www.mja.com.au/public/issues/182_09_020505/ho10889_fm.html>
Medicinenet.com. Viewed 22 August 2008. (<http://www.medterms.com/script/main/art.asp?articlekey=25032>)
NSW TAG 2007. NSW Therapeutic Advisory Group 2007. Indicators for Quality Use of Medicines in Australian Hospitals. <http://www.ciap.health.nsw.gov.au/nswtag/publications/QUMIndicators/1.2.pdf>
NICS 2003. National Institute of Clinical Studies 2003. Evidence Practise Gaps Report Vol 1. Melbourne: NICS

92
Pain assessment in the Emergency Department Indicator Number: 15
Description: Proportion of patients who have a pain score recorded on triage
Indicator status: Not currently reportable – indicator and/or data development required
Rationale (clinical/policy): There are more than six million presentations to public hospital emergency departments in Australia annually (AIHW 2008). Studies, both locally and internationally, have reported that pain is the chief complaint in 78–86 percent of presenting patients (Rupp & Delaney 2004, Karwowski-Soulié et al. 2006). There is evidence that emergency department patients receive suboptimal pain management (Rupp & Delaney 2004).
In Australia, there is an awareness of the need to improve the management of acute pain. This was supported by the publication of the first edition of Acute pain management: scientific evidence, endorsed by the National Health and Medical Research Council (NHMRC 2008). Relevant initiatives have included the Pain Management Project of the National Institute of Clinical Studies (NICS), the development of the ‘Operational principles for acute pain management’ by the Victorian Quality Council and a Statement on patients’ rights to pain management by the Australian and New Zealand College of Anaesthetists and the Faculty of Pain Medicine (NHMRC 2008, NICS 2008, VQC 2003, ANZCA 2002).
To ensure optimal management of acute pain, it is recommended that emergency departments adopt systems to ensure adequate assessment of pain, provision of timely and appropriate analgesia, frequent monitoring and reassessment of pain (NHMRC 2008).
The severity of the patient’s pain can be determined as a part of the triage process which occurs in emergency departments, with the patient’s ‘pain score’ being determined using an appropriate validated pain assessment tool. There are a variety of assessment tools which can be used to determine the level of pain experienced by the patient, including:
• Categorical rating scales: which use words to describe the severity of pain, for example, none or mild through to severe.
• Numerical rating scales: these systems can include patients rating their pain intensity on a scale of 0 to 10, where 0 equals no pain and 10 equals severe pain
(ANZCA 2005).
Numerator: Number of patients with a pain score recorded on triage
Denominator: Total number of patients triaged in hospital emergency department
Indicator type: Process
Disaggregation: National: Public hospital peer group, Public/private hospital sector, Indigenous, Remoteness of facility, State/Territory.
State/Territory: Public hospital peer group, Public/private hospital sector, Indigenous, Remoteness of facility, Health service region, Facility/organisation
Facility/Organisation: Indigenous
93
Related Indicators: 5 – Management of arthritis and musculoskeletal conditions 53 – Patient experience
Issues/Comments: Patient’s experience of pain management in hospital emergency department could be included within Indicator 49, Patient Experience.
Future development of this indicator could include information on the time to treatment (i.e. analgesia). This concept could also be expanded to include the time taken to achieve a particular reduction in pain severity.
Framework elements
Health needs domain: Getting better
Quality Domain: Appropriate/responsive
Service category: Hospitals
Area of expenditure: Hospitals
National Data Comments
National data currently not available
Data development required Data development could be undertaken to include an additional data element in the Non-admitted Patient Emergency Department NMDS for collection of this indicator. The data element could be whether the patient had a pain assessment at triage, using an appropriate validated pain assessment tool.
Data source To be determined
No international comparisons available
References
AIHW 2008. Australian Institute of Health and Welfare 2008. Australian hospital statistics 2006–07. Canberra: AIHW.
ANZCA 2002. Australian and New Zealand College of Anaesthetists 2002. Statement on patients’ rights to pain management. Viewed 8 August 2008, <http://www.anzca.edu.au/resources/professional-documents/professional-standards/pdfs/PS45.PDF>
ANZCA 2005. Australia and New Zealand College of Anaesthetists and Faculty of Pain Medicine 2005. Acute pain management: scientific evidence. <http://www.anzca.edu.au/resources/books-and-publications/acutepain.pdf>
NHMRC 2008. National Health and Medical Research Council 2008. National Emergency Care Pain Management Initiative
NICS 2008. National Institute of Clinical Studies 2008. Effective Practice Program, Information Pack 2008. <http://www.nhmrc.gov.au/media/_files/nics/nics-effective-practive.pdf>
Karwowski-Soulié F, Lessenot-Tcherny S, Lamarche-Vadel A, Bineau S, Ginsburg C, Meyniard O, et al. Pain in an emergency department: an audit. European journal of

94
emergency medicine: official journal of the European Society for Emergency Medicine. 2006 August; 13(4):218-24
Rupp T, Delaney KA. Inadequate analgesia in emergency medicine. Annals of Emergency Medicine. 2004 Apr;43(4):494-503.
VQC 2003. Victorian Quality Council 2003. Operational Principles for Acute Pain Management In Victoria. Victorian Quality Council. March 2003
95
Reperfusion for acute myocardial infarction in hospitals Indicator Number: 16
Description: Proportion of eligible Acute Myocardial Infarction (AMI) patients who receive reperfusion within recommended timeframes
Indicator status: Currently reportable – data development required to meet recommended specification
Rationale (clinical/policy): Each year an estimated 17 million people die from cardiovascular diseases worldwide (WHO 2008). Acute myocardial infarction (AMI) is a leading cause of these deaths. Coronary heart disease is the leading cause of death and the largest single contributor to the burden of disease in Australia (AIHW 2008).
Coronary Heart Disease including AMI has been identified as a major health issue by the National Service Improvement Framework for Heart, Stroke and Vascular Disease (NHPAC 2006) and is included in the National Health Priority Area of cardiovascular health.
The ‘guidance on the use of drugs for early thrombolysis in the treatment of acute myocardial’ (NICE 2002) states that infarction AMI is caused by blockage of a coronary artery by a thrombus or clot. This is usually the result of rupture of an atherosclerotic plaque within the artery. The heart muscle supplied by that artery is damaged or dies because of lack of oxygen (ischaemia). Patients with AMI may develop heart failure or potentially fatal cardiac arrhythmias as a result of damage to the heart muscle. These and other complications may occur early, within the first few hours of the event, or may develop over the subsequent months or years. Onset of AMI symptoms is usually rapid and the highest risk of death is within the first hour of experiencing symptoms – around one third of all AMI deaths occur within the first hour (NICE 2002).
Australian guidelines for managing acute coronary syndromes advise that patients with electrocardiogram ST segment elevation AMI should receive fibrinolytic therapy, percutaneous coronary intervention (PCI) or a combination of both. ST segment elevation on ECG is the sole criterion required to identify eligible patients for emergency reperfusion (NHF/CSA 2006).
The choice of reperfusion therapy will depend on a number of factors, including:
• Time delay to PCI
• Time from symptom onset to first medical contact
• Time to hospital fibrinolysis
• Contraindications to fibrinolytic therapy
• Location and size of infarction
• Presence of cardiogenic shock; and special circumstances.
In general, PCI is the treatment of choice, but only if:
• It can be performed promptly; and
• It is performed by appropriately qualified interventional cardiologists in an appropriate facility.
(NHF/CSA 2006)
When PCI is not promptly available, fibrinolytic therapy should be used.

96
The acceptable delay to PCI will vary with time from symptom onset to presentation. Time to PCI in this context relates to time from presentation to balloon inflation, not arrival at a PCI-capable hospital or even at the catheter laboratory (NHF/CSA 2006).
In general a time delay of 90 minutes from first medical contact to balloon inflation is the maximum desirable, otherwise fibrinolysis should be used. This time is arrived at by presuming a delay of 30 minutes from presentation to delivery of fibrinolysis and recognising that PCI is of benefit if performed within 60 minutes of potential fibrinolysis (NHF/CSA 2006).
Numerator: The number of eligible patients (patients identified as candidates for emergency reperfusion) with an AMI requiring reperfusion who received:
• Fibrinolysis within 30 minutes and/or
• PCI within 90 minutes of presentation to the emergency department
Denominator: The total number of patients with an AMI requiring reperfusion.
Indicator type: Process
Disaggregation: National: Public Hospital Peer Group, Public/private hospital sector, Indigenous, Remoteness of facility, State/Territory.
State/Territory: Public Hospital Peer Group, Public/private hospital sector, Indigenous, Remoteness of facility, Health service region, Facility/organisation
Facility/Organisation: Indigenous
Related indicators: 37 – Discharge medication management for Acute Myocardial Infarction
Issues/Comments: The focus of this indicator is on the appropriateness of hospital management of AMI, hence the focus on the time between presentation and treatment, rather than the onset of symptoms and treatment.
Some ambulance paramedics can now give thrombolysis before arrival at the emergency department. However this is not captured in the indicator proposed here.
The quality of Indigenous status data is not considered to be adequate for analysis purposes for the ACT and Tasmania.
Framework elements
Health needs domain: Getting better
Quality Domain: Appropriate
Service category: Hospitals
NHPA: Cardiovascular health
Burden of disease: Cardiovascular health
Disease expenditure: Cardiovascular
Area of expenditure: Hospitals
National Data Comments
Data currently available ACHS collects data on timing of thrombolysis for AMI

97
(not national) from organisations participating in its programs
Data development required Information needed to calculate this indicator includes time of presentation to hospital, time of diagnosis with ST segment elevation AMI and time of administration of reperfusion.. Development of standardised processes for data collection and/or audit are required, and may include adding items to the Non-admitted patient Emergency Department Care NMDS, and/or to the Admitted Patient Care NMDS.
Data source Random medical record audits or data sources used for ACHS data collection initially, however longer term data source may be the NMDSs as per above.
International comparisons available • UK: Healthcare Commission – Acute Care Balanced Scorecard (time to thrombolysis).

98
Presentation of available data
40.0
50.0
60.0
70.0
80.0
90.0
100.0
2001 2002 2003 2004 2005 2006 2007
Per 100 patients
Note
1. The numerator and denominator as presented above are not consistent with the proposed National safety and quality indicator. The recommended disaggregations were not available, so the data has been presented as the total rate for participating health care organisations.
2. There were 68 health care organisations which provided data to ACHS for this indicator in 2007. A few of these organisations are based in New Zealand rather than Australia.
Source: ACHS 2008
Patients with an AMI requiring thrombolysis who receive thrombolytic therapy within one hour of presentation to an emergency department, Australia, 2001–2007 (per 100 patients with AMI who receive thrombolytic therapy)
What these data show
• There was little change in the rate of patients with AMI who received thrombolysis within one hour of presenting to an emergency department over the time series.
References
ACHS 2008. The Australian Council on Healthcare Standards Australasian Clinical indicator report 2001–2007. Sydney: ACHS
AIHW 2008. Australian Institute of Health and Welfare 2008. Australia’s health 2008. Canberra: AIHW.
NHPAC 2006. National Health Priority Action Council 2006. National Service Improvement framework for heart, stroke and vascular disease. Canberra: Australian Government. Department of Health and Aging.
NICE 2002. National Institute for Clinical Excellence 2002. Guidance on the use of drugs for early thrombolysis in the treatment of acute myocardial infarction. Issued 2002. Reviewed

99
2005. London: NHS. <http://www.nice.org.uk/nicemedia/pdf/52_Thrombolysis_full_guidance.pdf>
NHF/CSA 2006. The National Heart Foundation of Australia and The Cardiac Society of Australia and New Zealand 2006. Guidelines for the management of acute coronary syndromes 2006 Medical Journal of Australia; 2006 Apr 17; 184 (8 Suppl);S9-S29. <http://www.mja.com.au/public/issues/184_08_170406/suppl_170406_fm.pdf>
WHO (World Health Organisation) Viewed 26 August 2008. <http://www.who.int/cardiovascular_diseases/resources/atlas/en/>

100
Stroke patients treated in a stroke unit Indicator Number: 17
Description: Proportion of patients admitted to hospital with acute stroke who are treated in specialised stroke units
Indicator status: Currently reportable – data development required to meet recommended specification
Rationale (clinical/policy): Stroke occurs when a blood vessel to the brain is blocked, resulting in part of the brain dying. This causes loss of function of the affected part of the brain, leading to death or impairment in any or all of a range of functions including movement of body parts, vision, planning, communication, and swallowing. There are two main types of stroke: one is caused by blood clots or other particles (ischaemic strokes) and one by bleeding (haemorrhagic strokes). Ischaemic strokes occur more than five times as often as haemorrhagic strokes; however, haemorrhagic strokes have a much higher fatality rate. Stroke is Australia’s second biggest killer after heart disease claiming 12,533 lives in 2002 (9.4% of all deaths). Every year there are approximately 40,000 to 48,000 stroke events in Australia (AIHW 2008; NHPAC 2006).
Stroke has been identified as a major health issue in the National Service Improvement Framework for Heart, Stroke and Vascular Disease (NHPAC 2006) and is included in the National Health Priority Area of cardiovascular health.
Stroke unit care is defined as dedicated, co-ordinated care for stroke patients in hospital under a multidisciplinary team who specialise in stroke management. Twenty-six randomised controlled trial studies provide overwhelming and consistent evidence that stroke unit care significantly reduces death and disability (approximately a 20 percent improvement) after stroke compared with conventional care in general wards (SUTC 2007).
Access to stroke units remains variable throughout Australia, particularly in regional and rural Australia (NSF 2007).
Indicator Source: National Stroke Foundation (NSF)
Numerator: Number of patients admitted to hospital with acute stroke who are managed in specialised stroke units within the specified timeframe
Denominator: Number of patients admitted to hospital with acute stroke within the specified timeframe
Indicator type: Process
Disaggregation: National: Remoteness, Indigenous, Public/private hospital sector, State/Territory.
State/Territory: Remoteness, Public/private hospital sector, Health service region
Issues/Comments: In an evaluation of clinical indicators for acute stroke this indicator rated highly on all criteria for selection (clinical relevance, consumer relevance and level of evidence) and was a statistical predictor of outcome along with three other indicators: aspirin within 48 hours of ischaemic stroke, assessed by physiotherapy within 48 hours, and assessed by speech pathology within 48 hours. These indicators were also consistently found to be associated with predicting a greater chance of death or dependency (NSF 2008a).

101
A nationally acceptable definition of Stroke Units would be required to ensure accurate collection of this indicator. The minimum standards for stroke unit care published in the NSF Acute Stroke Services Framework 2008 outline what are considered to be the essential elements of organised stroke unit care and could be the basis of a definition for the indicator.
Framework elements Health needs domain: Getting better
Quality Domain: Appropriate, Accessible
Setting: Hospitals
NHPA: Cardiovascular health
Burden of disease: Cardiovascular disease
Disease expenditure: Cardiovascular
Area of expenditure: Hospitals
National Data Comments
Data currently available National Stroke Audit data collected by the National
(National sample) Stroke Foundation.
The first National Stroke Audit was undertaken in 2007 by the National Stroke Foundation. The objectives of the audit program were to describe the services and resources available in hospitals and to determine whether provision of clinical stroke care was consistent with evidence based recommendations. A total of 89 hospitals participated in the audit (covering 2,724 patients with stroke). Data were collected by audit of medical records for first 40 consecutive patients in the participating hospitals over a three month audit period (NSF 2008b).
Data development required Audit questions have been developed but further development is needed to standardise the data collection process and embed the audit process at facility level, and for collection within the private hospital sector. This work could include the addition of an item to the Admitted Patient Care NMDS to record whether patients received care in a stroke unit. The National Stroke Foundation is currently working with ACHS to have the indicators included as part of its clinical indicator program.
Data available at two yearly intervals from the National Stroke Audit
Time lag from collection to reporting <12 months
International comparisons available
• UK: Healthcare Commission – Acute Care Balanced Scorecard (stroke care)
References
AIHW 2008. Australian Institute of Health and Welfare 2008. Australia’s health 2008. Canberra: AIHW.

102
NHPAC 2006. National Health Priority Action Council 2006. National Service Improvement framework for heart, stroke and vascular disease. Canberra: Australian Government.
NSF 2007. National Stroke Foundation 2007. Clinical Guidelines for Acute Stroke Management. NSF: Melbourne.
NSF 2008a. National Stroke Foundation 2008. Clinical Indicators for Acute Stroke Management. NSF: Melbourne (unpublished report).
NSF 2008b. National Stroke Foundation 2008. National Stoke Audit Clinical Report Acute Services. NSF: Melbourne.
SUTC 2007. Stroke Unit Trialists’ Collaboration 2007. Organised inpatient (stroke unit) care for stroke. Cochrane Database of Systematic Reviews 2007, Issue 4. Art. No.: CD000197. DOI: 10.1002/14651858.CD000197.pub2.

103
Complications of transfusion Indicator number: 18
Description: Number of adverse events attributable to the administration of blood and/or blood products in health care
Indicator status: Not currently reportable – indicator and/or data development required
Rationale (clinical/policy): Errors in the requesting, supply (including transport) and administration of blood and blood products can lead to significant adverse outcomes for patients, including death. Surveillance programs that are designed to detect such errors are termed ‘haemovigilance’. They monitor the ‘transfusion chain’, that is, from the point of collection of blood and its components through transfusion and the follow-up of recipients (EHN 2009).
The National Blood Authority (NBA) in Australia is establishing a National Heamovigilance Program. It will be based on the work of the Haemovigilance Project Working Group and their Initial Australian Haemovigilance Report 2008” (NBA 2008).
The adverse events associated with the transfusion of blood and blood products which have been proposed for the NBA’s National Haemovigilance Program include:
• Sentinel event
– haemolytic transfusion reaction resulting from ABO incompatibility
• Other serious transfusion reactions
– immediate haemolytic transfusion reaction (other than ABO)
– delayed haemolytic transfusion reaction
– severe febrile non-haemolytic transfusion reaction
• Incorrect blood component transfused
• Transfusion infections
– bacterial
– viral
– parasitic
– other serious infections such as variant Creutzfeldt-Jakob disease
• Transfusion-related acute lung injury
• Allergic reactions (severe)
• Anaphylaxis/anaphylactic reactions
• Transfusion-associated graft-versus-host disease
• Post-transfusion purpura
• Transfusion-associated circulatory overload
Haemolytic transfusion reaction resulting from ABO incompatibility is also a sentinel event for Australian public hospitals.
In Australia, there is little risk of transfusing transmitted infections, such as HIV or HCV, as a result of procedures and processes implemented by legislation to minimise the risk. The major risk of adverse events associated with the transfusion of blood or blood products is linked to the administration of these products in the hospital environment (ANZSBT 2004).

104
In its Initial Australian Haemovigilance Report 2008 the NBA noted that of the more than 600 transfusion-related incidents which were reported over the preceding 3-5 years, about 65 percent were due to procedural errors (NBA 2008).
Numerator: Adverse events associated with the transfusion of blood and blood products
Denominator: To be determined
Indicator type: Outcome
Disaggregation: National: Public hospital peer group, Public/private sector, remoteness, Indigenous, State/Territory, Type of adverse event
State/Territory: Public hospital peer group, Public/private sector, remoteness, Indigenous, Type of adverse event, Health service area, Facility/organisation
Facility/Organisation: Type of adverse event
Issues/Comments: This indicator could be used to report the number of adverse events or a rate of events. This is due to the fact that while there is information available regarding the number and type of blood products which are issued annually in Australia, there is no accurate data on the number of these products which are transfused (NBA 2009) (see data development required below).
The key recommendation from the NBA haemovigilance report (2008) is the development of an enduring national haemovigilance program. To support the proposal it is recommended that states and territories continue to align their reporting systems with the agreed data set to create a comprehensive national minimum data set.
Incident reporting systems, which are currently in use across different jurisdictions and across public and private sectors, could be used to provide numerator data for this indicator. However, the coverage of incident monitoring is not complete, so its coverage in relation to transfusion adverse events would need to be determined, and/or another data collection mechanism identified. Queensland and Victoria use haemovigilance specific incident reporting systems (NBA 2008) which could provide a model for a national approach. For admitted patients, ICD-10-AM coded diagnoses of transfusion adverse events would be another approach that could be pursued.
The use of different reporting systems itself is not a barrier to national reporting of this indicator, however ensuring data comparability across the different jurisdictions and public and private sectors would be a key part of the future data development work which would be required to operationalise this indicator.
The NBA is undertaking work to enable each jurisdiction to analyse its ability to capture and deliver standardised national haemovigilance data. This work will be completed in the first-half of 2009, and the NBA would then be able to evaluate the timelines and resources required to achieve national reporting.
The ICD-10-AM diagnosis and external cause codes are currently not specific enough for recording the above range of different adverse events associated with the transfusion of blood and blood products (see data development required below).
The quality of Indigenous status data is not considered to be adequate for analysis purposes for the ACT and Tasmania.
Framework elements

105
Health needs domain: Getting Better
Quality Domain: Appropriate, Safe
Setting: Hospitals
Area of expenditure: Hospitals
National Data Comments
Data currently available Partial data are currently available from the NHMD and haemovigilance incidence systems
Data development required Denominator data for admitted patients could potentially be sourced from the Admitted Patient Care NMDS. However, current coding standards (ICD-10-AM standard 0302) state that a particular blood or blood product transfusion should only be coded once for each separation, irrespective of the number of units of that type of product transfused. This coding convention would ideally be changed to record numbers of units of products transfused.
Numerator data could also potentially be sourced from the NHMD. However, the current ICD-10-AM coding is not specific for the range of adverse events identified by the NBA. For example, ‘delayed haemolytic transfusion reaction’, ‘severe allergic reaction’, ‘transfusion associated graft versus host disease’, post-transfusion purpura’, and ‘febrile non-haemolytic transfusion reaction’ are likely to all be coded to T80.9 ‘unspecified complication following infusion, transfusion and therapeutic injection’.
Data linkage (between records for separate admissions to hospital) would be required to identify some of the adverse events, as the delay in onset means that they are likely to occur post-discharge. For example: ‘transfusion associated graft versus host disease’ occurs 1-6 weeks post-transfusion; ‘delayed haemolytic transfusion reaction’ occurs 24 hours to 28 days post-transfusion; and ‘post-transfusion purpura’ occurs within 12 days post-transfusion.
Data source To be determined.
One option may be a combination of routinely collected administrative data, for example the NHMD, with data from incident management systems and/or specific haemovigilance systems.
International comparisons available
• USA: Agency for Healthcare Research and Quality – Guide to Patient Safety Indicators (ABO and Rhesus only).
• OECD: Health care quality indicators project – Selecting Indicators for Patient Safety at the Health Systems Level in OECD Countries (Proposed indicator - ABO and Rhesus only).

106
Presentation of available data
0 10 20 30 40 50 60 70 80 90 100
Incorrect blood component transfused
Acute transfusion reaction
Delayed transfusion reaction
Transfusion associated graft versus host disease
Transfusion associated lung injury
Post-transfusion purpura
Bacterial infection
Viral infection
Wrong blood in tube
Near miss
Incident type
Per cent
Note
1. The Victorian Department of Human Services piloted the Better Safer Transfusion STIR project during July to October 2006. Six health services, which included 12 hospitals, contributed data.
2. There were 42 incidents reported as part of the STIR project during July to October 2006.
3. The incident categories used as part of the STIR project are not identical to the incident categories which have been proposed for the NBAs National Haemovigilance Program.
Source: National Blood Authority 2008
Incidents reported - Serious Transfusion Incident Reporting (STIR) project, Victoria, 2006 (per cent of total incidents reported)
What these data show
• The STIR report identified 17 (40%) acute transfusion reactions and 18 (43%) pre-transfusion procedural errors in a total of 42 reported incidents. The procedural errors consisted of five ‘wrong blood in tube’ incidents and 13 near misses.
References
ANZSBT 2004. Australia & New Zealand Society of Blood Transfusion 2004. Guidelines for the administration of blood components. Accessed 23/01/2009. <http://www.anzsbt.org.au/publications/documents/AdminGiudelinesOct2004.pdf>
EHN 2009. European Haemovigilance Network 2009. Haemovigilance definition. Accessed 23/01/2009. www.ehn-org.net/portal.aspx
National Blood Authority (NBA) 2008. Initial Australian Haemovigilance Report 2008. Canberra: NBA.

107
Health Care Associated Infections acquired in hospital Indicator Number: 19
Description: Proportion of separations with a Health Care Associated Infections (HCAI), acquired in hospital.
Indicator status: Currently reportable – data development required to meet recommended specification (only if using NHMD).
Rationale (clinical/policy): HCAI are, by definition, infections which are acquired in health care establishments and infections that occur as a result of health care interventions, as well as infections which present after patients leave the health care establishments.
The prevention and control of HCAI is an essential element of patient safety, and is the responsibility of all who care for patients (Cruikshank & Ferguson 2008). HCAIs can be serious or even life threatening to those affected. Infectious agents evolve and constantly present new challenges in the health care setting. These challenges include increasing numbers of immuno-compromised patients, increasingly complex medical procedures and increasing prevalence of antimicrobial-resistant organisms. The need to continually modify and improve procedures to reduce HCAI is important in order to meet these challenges (DoHA 2004).
The National Health and Medical Research Council, in collaboration with the Australian Commission on Safety and Quality in Healthcare (ACSQHC), is currently revising the guidelines and in 2009 aims to develop evidence based guidelines that will provide a national approach to the prevention and control of infectious disease across the range of Australian health care settings.
This indicator focuses on HCAI acquired specifically in hospital. The ACSQHC estimated that almost two million patient days are lost to infection per year in Australian hospitals (Cruikshank & Ferguson 2008).
Indicator Source: OECD (modified)
Numerator: To be determined (See Issues/comments below)
Denominator: To be determined (See Issues/comments below).
Indicator type: Outcome
Disaggregation: National: Type of infection (see Issues/comments below), Public/private hospital sector, Public Hospital Peer Group, Speciality/patient group (see Issues/comments below), Remoteness, Indigenous, State/Territory.
State/Territory: Type of infection, Public/private hospital sector, Public Hospital Peer Group, specialty/patient group, Indigenous, Remoteness, Health service region, Facility/organisation
Facility/Organisation: Type of infection (see Issues/comments below), specialty/patient group, Remoteness
Related indicators: 19 – Staphylococcus aureus (including MRSA) bacteraemia in acute care hospitals

108
Issues/Comments: It should be noted that there are different options which could be considered with regards the future reporting of this indicator. Firstly, an aggregated rate may be reported for all infections identified as HCAI for all causative organisms and from all sites of infection and patient groups. In calculating this option, the numerator would represent all HCAI reported and the denominator would be the total number of separations.
Secondly, as discussed in Cruickshank and Ferguson (2008), the rates of HCAI could be determined for specific infection sites, populations and causative organisms. For example:
• Specific infection sites or populations
– Bloodstream infection (BSI): Staphylococcus aureus bacteraemia (including MRSA), central line associated BSI in all ICUs.
– Surgical site infection (SSI): include all coronary artery bypass graft surgery, major joint prosthesis insertion, and other important surgeries.
– Speciality/Patient group: Obstetric, medical, surgical, neonatal, and so forth.
• Specific organisms
– Multi-resistant organisms: The organisms with the greatest impact on the health-care system in developed countries are methicillin-resistant Staphylococcus aureus (MRSA), vancomycin-resistant Enterococcus (VRE), multi-resistant gram negative bacteria.
– Clostridium difficile associated disease
– Rotavirus infection: the major agent of paediatric hospital-acquired diarrhoea across the world
For these various options there would be differences in the numerator and denominator used to calculate the specific rates. For example, the number of surgical-site infections and/or specific surgical-site infections recorded, with the denominator in this case representing the number of separations for all surgical patients and/or the specific type of surgery.
There are two potential data sources for this indicator. Firstly, the National Hospital Morbidity Database (NHMD). The indicator ‘Selected infections due to medical care’ was reported in the OECD Patient Safety Indicator support project using NHMD data. However, the specifications of this indicator meant that it was restricted to selected infections, primarily those related to intravenous lines, catheters, vascular devices and therapeutic injections. Future development work could be undertaken to enhance the NHMD as a comprehensive source of data for calculating this indicator (see data development required below). In addition, the Condition onset flag may be used to determine if the HCAI was acquired in hospital or was present on admission. An advantage using the NHMD is that this provides the opportunity for international comparisons of this indicator.
Secondly, HCAI rates could be obtained through the use of hospital infection surveillance systems. However, Cruickshank and Ferguson (2008), noted that during 2007 the ACSQHC commissioned an online survey aimed at infection control practitioners. One of the key findings of this survey was that there is a lack of standardised and strategic approaches to health care associated infection (HAI) surveillance across most states and territories (see data development required below).

109
Framework elements Health needs domain: Getting better
Quality Domain: Safe
Setting: Hospitals
Disease expenditure: Infections and parasitic
Area of expenditure: Hospitals
National Data Comments
Data currently available (not national) Currently ACHS reports on a number of individual infection control related indicators:
Surgical site infections
Central line associated blood stream infections
Haemodialysis associated blood stream infections
Neonatal infections
Healthcare associated methicillin-resistant Staphylococcus aureus (MRSA) morbidity
Data development required The NHMD was utilised for the support project OECD Patient safety indicators. However, the calculations undertaken in this report did not utilise the condition onset flag. It would be useful to test the national data, with the inclusion of the condition onset flag, for this indicator. In addition, development work could be undertaken to allow for the reporting of the various specific conditions, causative organisms, and so forth, which are discussed in Issues/comments above.
The capacity of hospital-based surveillance systems to be utilised for national reporting of HCAI would be the development of a National Surveillance Minimum Data Set to collect the information required in a nationally consistent form.
Data source To be determined
Data collection arrangements NHMD - provided to the Australian Institute of Health and Welfare under the National Health Information Agreement
Data available annually
Time lag from collection to reporting: Less than 12 months after the end of the collection year.
International comparisons available
• USA: Agency for Healthcare Research and Quality – Guide to Patient Safety Indicators (selected infections due to medical care)
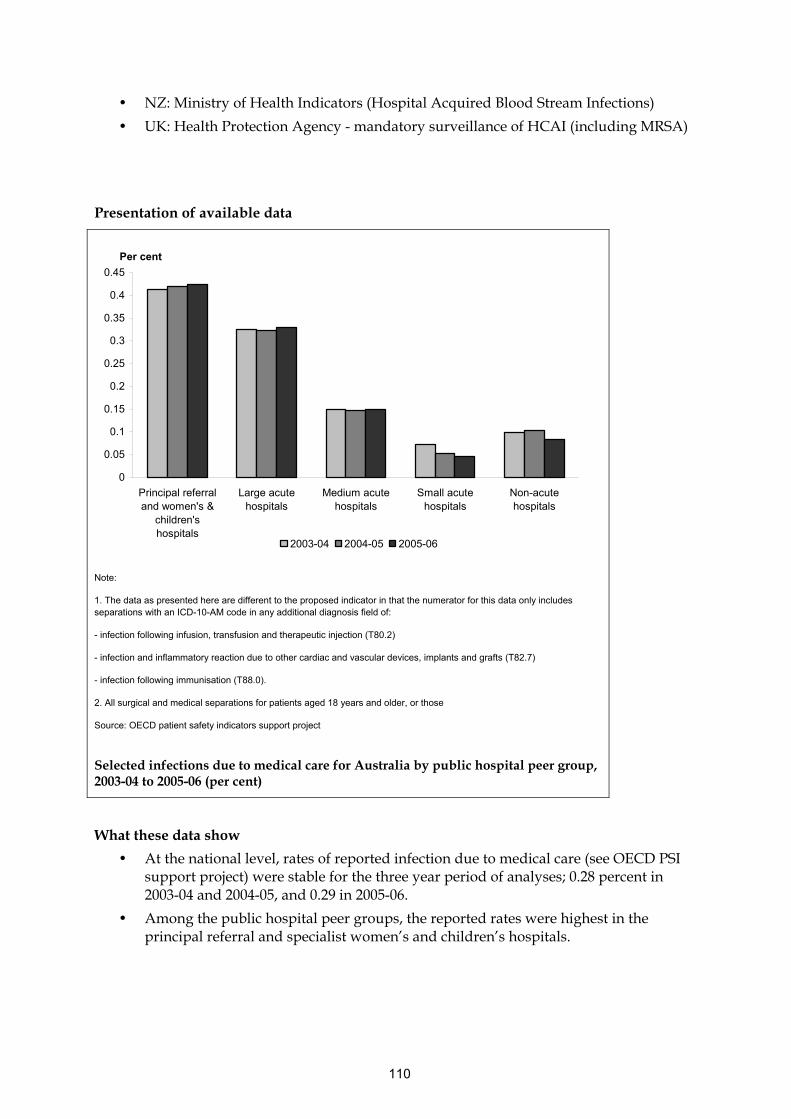
110
• NZ: Ministry of Health Indicators (Hospital Acquired Blood Stream Infections)
• UK: Health Protection Agency - mandatory surveillance of HCAI (including MRSA)
Presentation of available data
0
0.05
0.1
0.15
0.2
0.25
0.3
0.35
0.4
0.45
Principal referraland women's &
children'shospitals
Large acutehospitals
Medium acutehospitals
Small acutehospitals
Non-acutehospitals
Per cent
2003-04 2004-05 2005-06
Note:
1. The data as presented here are different to the proposed indicator in that the numerator for this data only includes separations with an ICD-10-AM code in any additional diagnosis field of:
- infection following infusion, transfusion and therapeutic injection (T80.2)
- infection and inflammatory reaction due to other cardiac and vascular devices, implants and grafts (T82.7)
- infection following immunisation (T88.0).
2. All surgical and medical separations for patients aged 18 years and older, or those
Source: OECD patient safety indicators support project
Selected infections due to medical care for Australia by public hospital peer group, 2003-04 to 2005-06 (per cent)
What these data show
• At the national level, rates of reported infection due to medical care (see OECD PSI support project) were stable for the three year period of analyses; 0.28 percent in 2003-04 and 2004-05, and 0.29 in 2005-06.
• Among the public hospital peer groups, the reported rates were highest in the principal referral and specialist women’s and children’s hospitals.

111
References
Collignon PJ, Wilkinson IJ, Gilbert GL, Grayson ML and Whitby RM 2006. Health care-associated Staphylococcus aureus bloodstream infections: a clinical quality indicator for all hospitals The Medical Journal of Australia Vol 184 (8), pp 404-406.
Cruickshank M & Ferguson J (Eds.) 2008. Reducing harm to patients from health care associated infection: The role of surveillance. Sydney: ACSQHC.

112
Staphylococcus aureus (including MRSA) bacteraemia in hospitals Indicator Number: 20
Description: Number of patients with Staphylococcus aureus (including MRSA) bacteraemia in acute care hospitals.
Indicator status: Currently reportable – data development required to meet recommended specification
This indicator is to be reported under the National Healthcare Agreements.
Rationale (clinical/policy): Staphylococcus aureus, including methicillin-resistant S. aureus (MRSA), may be the causative organism for a number of conditions ranging from minor to life threatening, for example, from stitch abscesses to septic phlebitis, chronic osteomyelitis, pneumonia, meningitis, endocarditis and bacteraemia (NCCH 2008).
According to Collignon et al. 2006, bacteraemia caused by S. aureus are a frequent and serious cause of morbidity and mortality globally, both in the community and hospital setting. In addition, the authors state that the incidence of healthcare-associated S. aureus bacteraemia should be a useful indicator of the quality of care, as many of these infections are potentially preventable. Also, the proportion of S. aureus bacteraemia due to MRSA compared to methicillin-sensitive S. aureus (MSSA) provides an indication of the hospital’s level of MRSA control. (Collignon et al. 2006)
Numerator: Number of patients with Staphylococcus aureus (including MRSA) bacteraemia in acute care hospitals
Indicator type: Outcome
Disaggregation: National: Public/private hospital sector, Public Hospital Peer Group, Patient group, Remoteness, State/Territory, MRSA/MSSA
State/Territory: Public/private hospital sector, Public Hospital Peer Group, Patient group, Remoteness, Health service area, Facility/organisation, MRSA/MSSA
Facility/Organisation: Patient group, Hospital/Community acquired, MRSA/MSSA
Related indicators: 18 - Health Care Associated Infections (HCAI) acquired in hospital
Issues/Comments: One potential data source for this indicator is the National Hospital Morbidity Database (NHMD). However, there is no ICD-10AM code available which is specific to S. aureus bacteraemia. Some preliminary work has been undertaken to examine future options for including a specific code which can be used to identify cases of S. aureus (including MRSA) bacteraemia in hospitals.
Alternatively, S. aureus bacteraemia rates could also be derived using data generated through the use of hospital infection control surveillance systems. This information along with data on the onset of infection could be recorded by infection control staff on the hospital infection surveillance system. Data of each hospital should record whether the infection had a hospital or community onset and whether the episode was health care associated (Collignon et al. 2006). However, Cruickshank and Ferguson (2008) noted that during 2007 the ACSQHC commissioned an online survey aimed at infection control practitioners. One of the key
113
findings of this survey was that there is a lack of standardised and strategic approaches to health care associated infection (HAI) surveillance across most states and territories.
Framework elements Health needs domain: Getting better
Quality Domain: Safe, effective
Setting: Hospitals
Disease expenditure: Infections and parasitic
Area of expenditure: Hospitals
National Data Comments
National data currently available Sub-national data is available for those health care organisations reporting the Australasian Council of Healthcare Standards (ACHS) Infection Control Indicators.
Data development required Development of an ICD- 10AM code for Staphylococcus aureus (including MRSA) bacteraemia.
Data source To be determined
International Comparisons
• NZ: Ministry of Health Indicators (Hospital Acquired Blood Stream Infections)
• UK: Health Protection Agency - mandatory surveillance of HCAI (including MRSA)

114
Presentation of available data
0.00
0.50
1.00
1.50
2.00
2.50
3.00
3.50
4.00
4.50
5.00
2005 2006 2007
Per 10,000 overnight occupied bed days
ICU Non-ICU
Note
1. This data represents the rate of new MRSA HCAI in sterile sites. The proposed indicator is restricted to bacteraemia, rather than all infections in sterile sites.
2. The proposed indicator is a number of cases of Staphylococcus aureus bacteraemia. The ACHS indicator is presented as a rate of MRSA sterile site infections per 10,000 overnight occupied bed days
3. For 2007 there were 123 health care organisations that provided data on this indicator. A few of these organisations are based in New Zealand rather than Australia.
Source: ACHS 2008
New MRSA HCAI in sterile sites for ICU and non-ICU patients 2005–2007 (per 10,000 overnight occupied bed days)
What these data show
• The rate of sterile site MRSA infections in ICU units was over five-times the rate for non-ICU patients.
• The rates of sterile site MRSA infections were relatively stable over the three years 2005 to 2007.
References
ACHS 2008. The Australian Council on Healthcare Standards 2006. Clinical Indicator users manual 2008. Sydney: ACHS.
AIHW 2008. Australian Institute of Health and Welfare 2008. A set of performance indicators across the health and aged care system. Canberra: AIHW.

115
Collignon PJ, Wilkinson IJ, Gilbert GL, Grayson ML and Whitby RM 2006. Health care-associated Staphylococcus aureus bloodstream infections: a clinical quality indicator for all hospitals. The Medical Journal of Australia Vol 184 (8), pp 404-406
Cruickshank M & Ferguson J (Eds.) 2008. Reducing harm to patients from health care associated infection: The role of surveillance. Sydney: ACSQHC.
Johnson P, Howden B and Bennett C 2006. Staphylococcus aureus: a guide for the perplexed. The Medical Journal of Australia Vol 184 (8): 374-375
NCCH 2008. National Centre for Classification in Health 2008. The international statistical classification of diseases and related health problems, 10th revision, Australian modification (ICD-10-AM), Australian Classification of Health Interventions (ACHI) and Australian Coding Standards (ACS), 6th ed. Sydney: University of Sydney

116
Adverse drug events in hospital Indicator Number: 21
Description: Adverse drug events occurring in hospital.
Indicator status: Currently reportable – data development required to meet recommended specification
This indicator is to be reported under the National Healthcare Agreement.
Rationale (clinical/policy): Adverse events due to medication include events caused by errors in the prescribing or administration of the medication, as well as those instances where a patient has an adverse drug reaction even though the medication was appropriately prescribed and administered. Examples of this latter category include allergic reactions and hypersensitivity which are less preventable than adverse events due to medication error (ACSQHC 2002). Adverse drug events are expensive and cause serious morbidity. Not all adverse drug events are preventable, but overseas experience and experience within Australia shows than the number of these adverse events can be reduced substantially.
Separations involving adverse drug events account for about a quarter of all separations in hospital with adverse events identifiable in routinely collected hospital admitted patient data (AIHW 2008).
Numerator: Separations from hospital with an adverse drug event which occurred in hospital as defined by ICD-10-AM external cause codes (See appendix for relevant ICD-10-AM codes.)
Denominator: Separations from hospital
Indicator type: Outcome
Disaggregation: National: Public/private hospital sector, Public Hospital Peer Group, Indigenous, Remoteness, State/Territory, Selected drug groups (e.g. anticoagulants, sedatives, hypnotics and anti-anxiety drugs, and analgesics).
State/Territory: Public/private hospital sector, Public Hospital Peer Group, Indigenous, Remoteness, Selected drug groups, Health service region, Facility/organisation
Facility/Organisation: Selected drug groups, Medication error/adverse drug reaction
Issues/Comments: Currently, adverse drug events that can be identified in the hospital data are limited to those occurring when the drug is used correctly.
Interpretation of differences in rates needs to be undertaken taking into consideration potential effects of different casemix.
Readmissions for treatment of adverse drug events that occurred in a previous admission should be included as well as events that occur and are treated within the one admission. From the collection of 2008–09 data, disaggregation to present those adverse drug events that occurred prior to admission and those which occurred during the stay in hospital will be available through the variable Condition onset flag.

117
This indicator currently does not include adverse drug events that occur in the community. Such adverse drug events may be detected and treated in an emergency department, not requiring admission, or by a general practitioner.
The quality of Indigenous status data is not considered to be adequate for analysis purposes for the ACT and Tasmania.
Framework elements Health needs domain: Getting better
Quality Domain: Safe, appropriate, continuous
Setting: Hospitals
NHPA: Injury prevention and control
Disease expenditure: Injuries
Area of expenditure: Hospitals
National Data Comments
Data currently available Data are collected by ACHS from organisations participating in their programs.
Data development required Further refinement of ICD-10-AM codes is needed to ensure capture of adverse events occurring when drugs are not used correctly (e.g. overdose given, drug given to wrong patient) and to ensure correct identification of relevant readmissions. Some of the adverse events occurring when drugs are not used correctly could be captured by careful analysis of accidental and exposure codes for various substances (X40 through X44) include accidental overdose, wrong drug given or taken accidents in the use of drugs. Also there are codes for suicidal/homicidal intent.
Data source National Hospital Morbidity Database (NHMD).
Data collection arrangements Provided to the Australian Institute of Health and Welfare under the National Health Information Agreement
Data available annually
Time lag from collection to reporting: Less than 12 months after the end of the collection year.
No international comparisons available

118
Presentation of available data
0
0.2
0.4
0.6
0.8
1
1.2
2001 2002 2003 2004 2005 2006 2007
ADR per 100 non same-day seperations
Note: The data as presented here are different to the proposed indicator in that these data only includes organisations that report data to the ACHS (In 2007 there were 226 records from 137 organisations); the proposed indicator includes all hospitals. A few of the reporting organisations are based in New Zealand rather than Australia.
(a) Reported as a mean rate over all organisations submitting data.
Source: ACHS 2008
(a) Adverse drug reactions which were reported within the health care organisation (per 100 non same-day separations)
What these data show
Reported average rates of adverse drug reactions declined over the period 2005 to 2007.
References
ACHS 2008. The Australian Council on Healthcare Standards Australasian Clinical indicator report 2001–2007. Sydney: ACHS
ACSQHC 2002. Australian Council for Safety and Quality in Health Care 2002. Second National Report on Patient Safety: Improving Medication Safety. Sydney: ACSQHC.
AIHW 2008. Australian Institute of Health and Welfare 2008. Australian hospital statistics 2006–07. Canberra: AIHW.
NCCH 2008. National Centre for Classification in Health 2008. The international statistical classification of diseases and related health problems, 6th edition, Australian modification (ICD-10-AM). Sydney: University of Sydney.
119
Appendix – ICD-10-AM Code list
External Causes of Morbidity and Mortality
Drugs, medicaments and biological substances causing adverse effects in therapeutic use (Y40–Y59)
Y40 Systemic antibiotics
Y41 Other systemic anti-infectives and antiparasitics
Y42 Hormones and their synthetic substitutes and antagonists, not elsewhere classified
Y43 Primarily systemic agents
Y44 Agents primarily affecting blood constituents
Y45 Analgesics, antipyretics and anti-inflammatory drugs
Y46 Antiepileptics and antiparkinsonism drugs
Y47 Sedatives, hypnotics and antianxiety drugs
Y48 Anaesthetics and therapeutic gases
Y49 Psychotropic drugs, not elsewhere classified
Y50 Central nervous system stimulants, not elsewhere classified
Y51 Drugs primarily affecting the autonomic nervous system
Y52 Agents primarily affecting the cardiovascular system
Y53 Agents primarily affecting the gastrointestinal system
Y54 Agents primarily affecting water-balance and mineral and uric acid metabolism
Y55 Agents primarily acting on smooth and skeletal muscles and the respiratory system
Y56 Topical agents primarily affecting skin and mucous membrane and ophthalmological, otorhinolaryngological and dental drugs
Y57 Other and unspecified drugs and medicaments
Y58 Bacterial vaccines
Y59 Other and unspecified vaccines and biological substances
NCCH 2008

120
Intentional self-harm in hospitals
Indicator Number: 22
Description: Intentional self-harm by admitted patients in hospital.
Indicator status: Currently reportable – data development required to meet recommended specification
This indicator is to be reported under the National Healthcare Agreement.
Rationale (clinical/policy): Intentional self-harm (including resultant suicides) is a serious adverse event in hospital, and is a marker of the quality of care and duty of care.
Health care professionals play a key role in the early detection and intervention in managing patients identified as being at risk of self harm. Management of a person at risk of suicide requires assessment of risk, an estimation of the level of risk and appropriate interventions to minimise the risk (NSW Health 2004).
However, prevention of self harm is a part of the broader duty of care of a hospital for its patients. Incidents of intentional self harm in hospitals thus provide an indication as to the quality of care provided to all patients, not just those who are assessed as being at risk.
Numerator: Separations with an ICD-10-AM diagnosis code for intentional self harm (X60–X84) in any secondary diagnosis field
Denominator: The total number of separations.
Indicator type: Outcome
Disaggregation: National: Indigenous status, Age group, Remoteness, Public Hospital Peer Group, Public/private hospital sector, State/Territory
State/Territory: Indigenous status, Age group, Remoteness, Public Hospital Peer Group, Public/private hospital sector, Health service region, Facility/organisation
Facility/Organisation: Indigenous status, Age, Location in hospital (e.g. general ward, psychiatric ward)
Issues/Comments: Admissions for treatment of self-harm that occurred in a previous admission should be included as well as self-harm that occurs and is treated within the one admission.
Suicide and self-harm are neither mutually exclusive nor inextricably linked. Deliberate self-harm is not necessarily a suicide attempt, and engaging in self-harm may not mean that a person is attempting suicide (DoHA 2005).
The quality of Indigenous status data is not considered to be adequate for analysis purposes for the ACT and Tasmania.
Framework elements Health needs domain: Getting better
Quality Domain: Safe, effective, appropriate
Setting: Hospitals
Disease expenditure: Injuries
Area of expenditure: Hospitals

121
National Data Comments
National data currently available
Data development required Data development would be required to identify cases where a patient is re-admitted for treatment of intentional self harm that occurred during a previous admission. This indicator is presented as a count and as a rate, as the absolute count of episodes of patient self-harm is of interest as well as the rate. Interpretation of differences in rates needs to be undertaken taking into consideration potential effects of different casemix.
Data source National Hospital Morbidity Database (NHMD)
Data collection arrangements Provided to the Australian Institute of Health and Welfare under the National Health Information Agreement
Data available annually
Time lag from collection to reporting: Less than 12 months after the end of the collection year.
No international comparisons available
References
NSW Health 2004. New South Wales Government Department of Health 2004. Suicide Risk Assessment and Management Protocols: General Hospital Ward. Sydney: NSW Health
DoHA 2005. Australian Government Department of Health and Ageing. National safety priorities in mental health: a national plan for reducing harm. Accessed 13/03/2009. <http://www.health.gov.au/internet/main/publishing.nsf/Content/mental-pubs-n-safety-toc~mental-pubs-n-safety-3~mental-pubs-n-safety-3-sui>

122
Malnutrition in hospitals and residential aged care facilities Indicator Number: 23
Description: Number of individuals who become malnourished whilst in hospital or a residential aged care facility
Indicator status: Currently reportable – data development required to meet recommended specification
Rationale (clinical/policy): Malnutrition refers to deviations from a normal nutritional state, and has been defined as including:
• Inadequate nutritional status
• Undernourishment due to poor dietary intake
• Poor appetite
• Muscle wasting
• Weight loss
(Gaskill et al. 2008).
Nutritional status is recognised as an important factor which can impact an individual’s quality of life and overall health status. In Australian studies, the prevalence of malnutrition has been found to be 12-42 percent in acute settings; 6-49 percent in rehabilitation settings; and about 50 percent in residential aged care (Banks et al. 2007, Gaskill et al. 2008). The studies did not differentiate between individuals who became malnourished during their time in hospital or aged care facility and those who were malnourished prior to admission, whereas the proposed indicator would be focussed on individuals who become malnourished whilst in hospital or residential aged care facility.
Rates of malnutrition increase with increasing length of stay in hospital, and with increasing care needs and age in residential aged care (Gaskill et al. 2008, Banks et al. 2007). The incidence of malnutrition is strongly associated with increased morbidity and mortality; increased incidence of pressure ulcers and infections; and an increased risk of falls (Gaskill et al. 2008).
Numerator: Hospitals
Number of separations where malnutrition was recorded with a condition onset flag of 1, condition with onset during the episode of admitted patient care. (See appendix for relevant ICD-10-AM codes.)
Residential aged care
Total number of residents becoming malnourished while in a residential aged care facility
Denominator: Hospitals
Total number of hospital separations with length of stay greater than a week
Residential aged care
Total number of residents sampled in annual survey.
123
Indicator type: Outcome
Disaggregation: National: Type of facility, Indigenous status, Remoteness of facility, State/Territory, Public Hospital Peer Group, Public/private sectors, Care needs of patients (see data development below)
State/Territory: Type of facility, Indigenous status, Remoteness of facility, Public Hospital Peer Group, Public/private sectors, Care needs of patients, Health service region
Facility/Organisation: Care needs of patients, Duration of stay
Related Indicators: 44 - Oral health in residential aged care
Issues/Comments: There is some reported variability when the different assessment tools which are used to diagnose malnutrition are compared. However, the Subjective Global Assessment (SGA) has been found to be a valid and reliable tool with good inter-relater reliability and aligns with the ICD-10-AM (see appendix below) definition for malnutrition (Banks et al. 2007).
Categorising malnutrition as having occurred whilst the patient was in the hospital or residential aged care facility would require a nutritional risk screening, and subsequent nutritional assessment if found at risk to occur at admission, and at routine intervals during the stay in hospital or residential aged care, for example, weekly in acute settings and monthly in long-stay settings (ADA 1994).
Framework elements Health needs domain: Getting Better
Quality Domain: Appropriate, Safe, responsive
Service category: Multiple service categories (Hospitals, Residential aged care).
Area of expenditure: Hospitals, residential aged care
National Data Comments
National data currently available Only for cases that occur in hospital
Data development required Refinement of ICD-10-AM codes and coding instructions to ensure capture of all cases of malnutrition. Development of dedicated surveys to enable reporting of cases occurring in residential aged care.
Alternative methods of collection would be required to identify malnutrition occurring in residential aged care facilities.
The Aged Care Funding Instrument (ACFI) database, which is held by the Department of Health and Ageing, contains data relating to the classification of care needs of residents on admission to residential care and when their care needs subsequently change. This database, if linked with the data source for this indicator (NHMD), could potentially enable disaggregation of this indicator by level of care need in residential aged care patients.
Data source To be determined
No international comparisons available

124
References
Banks M, Ash S, Bauer J & Gaskill D 2007. Prevalence of malnutrition in adults in Queensland public hospitals and residential aged care facilities. Nutrition & Dietetics 64:172-8.
Gaskill D, Black LJ, Isenring EA, Hassall S, Sanders F & Bauer JD 2008. Malnutrition prevalence and nutrition issues in residential aged care facilities. Australian Journal on Ageing 27:189-94.
NCCH 2008. National Centre for Classification in Health 2008. The international statistical classification of diseases and related health problems, 6th edition, Australian modification (ICD-10-AM). Sydney: University of Sydney.
Appendix – ICD-10-AM Code list
E43 Unspecified severe protein energy malnutrition
In adults, BMI <18.5 kg/m2 or unintentional loss of weight (≥ 10%) with evidence of suboptimal intake resulting in severe loss of subcutaneous fat and/or severe muscle wasting.
E44 Protein-energy malnutrition of moderate and mild degree
In adults, BMI < 18.5 kg/m2 or unintentional loss of weight (5-9%) with evidence of suboptimal intake resulting in moderate loss of subcutaneous fat and/or moderate muscle wasting.
NCCH 2008

125
Pressure ulcers in hospitals and residential aged care facilities Indicator Number: 24
Description: Pressure ulcers arising in hospitals and residential aged care facilities)
Indicator status: Currently reportable – data development required to meet recommended specification
This indicator is to be reported under the National Healthcare Agreement.
Rationale (clinical/policy): Pressure ulcers, also referred to as decubitus ulcers, bed sores or pressure sores, are lesions caused by prolonged unrelieved pressure resulting in a lack of blood flow to an area of the body and subsequent damage of underlying tissue. Pressure ulcers significantly reduce the quality of life of patients and increase the costs of patient care, as well as length of hospital stay (AWMA 2001).
During the period 2003 to 2006 the Victorian Quality Council (VQC) undertook three state-wide pressure ulcer point prevalence surveys within Victoria’s acute and subacute health services. The first survey identified a 26.5 percent, prevalence of pressure ulcers, approximately two thirds of those ulcers were acquired during the hospital admission. In the third state-wide pressure ulcer point prevalence survey completed in 2006, the state-wide mean pressure ulcer prevalence was 17.6 percent (VQC 2005; VQC 2006).
It is widely accepted that a majority of pressure ulcers are preventable with good quality nursing care and implementation of evidence based practice (Millar & Mattke 2004). There is evidence to support the introduction of evidence-based care practices to reduce the incidence and duration of pressure ulcers both in hospitals and residential aged care facilities (Prentice & Stacey 2001; DoHA 2007). On this evidence a number of state/territory health departments have introduced guidelines and prevalence surveys in hospitals.
Numerator: Hospitals
Number of separations where a grade II to IV pressure ulcer was recorded with a condition onset flag of 1, condition with onset during the episode of admitted patient care. (See appendix for relevant ICD-10-AM codes.)
Residential aged care
Number of residents with a grade II to IV pressure ulcer detected by examination on a census date, including determination of whether the ulcer arose during the time in residential aged care.
Denominator: Hospitals
Total number of hospital separations
Residential aged care
Total number of residents sampled in annual survey.
Indicator type: Outcome

126
Disaggregation: National: Indigenous status, Remoteness of facility, Public Hospital Peer Group, Public/private hospital sector, State and Territory, Place of Occurrence (i.e. hospital or residential aged care)
State/Territory: Indigenous status, Remoteness of facility, Public Hospital Peer Group, Public/private hospital sector, Place of Occurrence (i.e. hospital or residential aged care), Health service region, Facility/organisation
Facility/Organisation: Grade of pressure ulcer, Duration of stay, Care needs of residents
Issues/Comments: This indicator will only capture pressure ulcers that occur in hospital, and the subset of pressure ulcers that occur in a residential aged care facility that require hospitalisation.
The Victoria Pressure Ulcer Point Prevalence Survey (PUPPS) found that only 4.5 percent of patients identified with a pressure ulcer had a corresponding diagnosis code in their admitted patient care data (VQC 2005; VQC 2006). This suggests that a large number of pressure ulcers are not coded, this may be due to coder error or lack of documentation in the medical records. A prevalence survey, as an alternative to administrative data, may be a more appropriate method of measuring this indicator. Pressure Ulcer Point Prevalence surveys have been undertaken/proposed in other states including South Australia (SAHealth 2006) and Western Australia (DOHWA 2009). However prevalence surveys are expensive and timely to undertake.
This indicator is restricted to stage II to IV pressure ulcers. This is due to the difficulty of recognising Stage 1 pressure ulcers and likelihood to lead to the underreporting of these ulcers. A number of international pressure ulcer prevalence studies do not include Stage 1 pressure ulcers (VQC 2006).
The quality of Indigenous status data is not considered to be adequate for analysis purposes for the ACT and Tasmania.
Framework elements Health needs domain: Getting better
Quality Domain: Appropriate, effective
Service category: Multiple Service Categories (Hospitals, Residential aged care)
Disease expenditure: Skin diseases
Area of expenditure: Hospitals
National Data Comments
National data currently available Only for cases that occur in hospital or occur in residential aged care and result in hospitalisation.
Data development required Refinement of ICD-10-AM codes and coding instructions to ensure capture of all relevant pressure ulcers (e.g. all pressure ulcers grade II-IV). Development of dedicated surveys to enable reporting of cases occurring in residential aged care.
The Aged Care Funding Instrument (ACFI) database, which is held by the Department of Health and Ageing, contains data relating to the classification of

127
care needs of residents on admission to residential care and when their care needs subsequently change. This database, if linked with the data source for this indicator (NHMD), could potentially enable disaggregation of this indicator by level of care need in residential aged care patients.
Data source National Hospital Morbidity Database (NHMD). Annual survey of residential aged care.
Data collection arrangements NHMD is provided to the Australian Institute of Health and Welfare under the National Health Information Agreement
Data available annually
Time lag from collection to reporting: Less than 12 months after the end of the collection year.
International comparisons:
• USA: Agency for Healthcare Research and Quality – Guide to Patient Safety Indicators
• OECD: Health care quality indicators project – Selecting Indicators for Patient Safety at the Health Systems Level in OECD Countries

128
Presentation of available data
0
1
2
3
4
5
6
Principalreferral andwomen's &children'shospitals
Large acutehospitals
Mediumacute
hospitals
Small acutehospitals
Non-acutehospitals
Other,including
psychiatricand un-peered
Per cent of separations
2003-04 2004-05 2005-06
Note: These data as presented here is different to the proposed indicator in that, the numerator for this data includes separations with an ICD-10-AM code for pressure ulcer (L89.-) in any additional diagnosis field. There are a number of exclusions including separations with a major skin disorder or paralysis, separations with a length of stay of less than 5 days and separations with a principal diagnosis for pregnancy, childbirth and puerperium.
Source: OECD patient safety indicators support project
Pressure ulcer for Australia by public hospital peer group, 2003–04 to 2005–06 (per cent of separations)
What these data show
Across all peer groups except Medium acute hospitals, the rates of reported pressure ulcer increased for each year of collection
There was variability in the reported rates within public hospital peer groups. The reported rate was highest for non-acute hospitals, possibly reflecting differences in case mix.
References
AWMA 2001. Australian Wound Management Association 2001. Clinical practice guidelines for the prediction and prevention of pressure ulcers. West Leederville WA: Cambridge Publishing.
Department of Health WA (DOHWA) 2009. SQuIRE Guide, Pressure Ulcer Prevention. Western Australia: Department of Health
DoHA 2007. Australian Government Department of Health and Ageing 2007. Clinical IT in aged product trial - Trial of a system for prevention and management of pressure ulcers—Report. Viewed 8 August 2008,

129
<http://www.health.gov.au/internet/main/publishing.nsf/Content/AB2946CC847A1D16CA2573B5007ACD9C/$File/PRIME%20Product.pdf >.
Millar J and Mattke S 2004. Selecting indicators for patient safety at health systems level in OECD countries. OECD Health Technical Paper, no. 18. Paris: OECD.
NCCH 2008. National Centre for Classification in Health 2008. The international statistical classification of diseases and related health problems, 6th edition, Australian modification (ICD-10-AM). Sydney: University of Sydney.
Prentice J and Stacey M 2001. Pressure ulcers: the case for improving prevention and management in Australian health care settings. Primary Intention 9:111–120
South Australia’s Department of Health (SAHealth) 2006. Pressure Ulcer Point Prevalence Auditing In South Australia. South Australia: Department of Health
VQC 2005. Victorian Quality Council 2005. VQC State-wide PUPPS 2 report 2004 Pressure ulcer point prevalence survey. Melbourne: Victorian Quality Council.
VQC 2006. Victorian Quality Council 2006. PUPPS 3—Pressure ulcer point prevalence survey Statewide report 2006. Melbourne: Victorian Quality Council.
Appendix – ICD-10-AM Code list
ICD-10-AM 5th edition Decubitus Ulcer diagnosis codes:
L891 Decubitus [pressure] ulcer, stage II
L892 Decubitus [pressure] ulcer, stage III
L893 Decubitus [pressure] ulcer, stage IV
L899 Decubitus [pressure] ulcer, unspecified
NCCH 2008

130
Falls resulting in patient harm in hospitals and residential aged care facilities Indicator Number: 25
Description: Falls resulting in patient harm in hospitals and residential aged care facilities
Indicator status: Currently reportable – data development required to meet recommended specification
This indicator is to be reported under the National Healthcare Agreements
Rationale (clinical/policy): Falls are a major cause of morbidity and mortality for Australians, especially older women. Falls are a leading cause of injury and death among people aged 65 years and over, with one in three people over 65 years falling each year (ACSQHC 2005). The Quality in Australian Health Care Study reported 66 falls in hospital (representing 2.9% of adverse events), 21 percent of falls resulted in permanent disability, five percent in death and 62 percent of falls were highly preventable (Wilson et al 1995). Adverse outcomes relating to falls include bone fracture, head injury, joint disruption, and soft tissue contusion and laceration resulting in pain, functional impairment, disability, fear-of-falling, depression, loss of independence and confidence, and admission to residential care (Kannus et al 2006).
‘Hospital settings are actually associated with increased risk of falling. On admission, the older patient accumulates additional falls risk factors including a new, strange environment with poorly recognised external dangers for falling. This is often combined with confusion, acute illness and balance-affecting medication, in addition to chronic risk factors such as comorbidities, muscle weakness and impaired balance and gait’ (Kannus et al 2006).
The results of a prospective quality improvement project, using a hospital-based, multi-strategy prevention approach to reduce the risk of falls and fall-induced serious injuries among frail, older patients in hospital aged-care wards, was associated with a 19 percent reduction in the risk of falls and a 77percent reduction in the risk of falls resulting in serious injury (Kannus et al 2006).
Numerator: Hospitals
Number of separations where a fall resulting in patient harm was recorded with a condition onset flag of 1, condition with onset during the episode of admitted patient care. (See appendix for relevant ICD-10-AM codes.)
Residential aged care
Number of residents with a fall resulting in harm detected on examination and recorded in an incident monitoring system.
Denominator: Hospitals
Total number of hospital separations.
Residential aged care
Total number of residents in aged care facilities.
Indicator type: Outcome

131
Disaggregation: National: Age, Sex, Indigenous status, Remoteness of facility, Public Hospital Peer Group, Public/private hospital sector, State/Territory, Place of Occurrence (i.e. hospital or residential aged care)
State/Territory: Indigenous status, Remoteness of facility, Public Hospital Peer Group, Public/private hospital sector, Place of Occurrence, Health service region, Facility/organisation
Facility/Organisation: Location in hospital, Care needs of residents
Related indicators: 42 – Functional gain achieved in rehabilitation
Issues/Comments: To be coded as a fall ‘resulting in harm’ a fall would have to result in increased patient care and therefore meet the definition of additional diagnosis. An additional diagnosis is defined as: ’A condition or complaint either coexisting with the principal diagnosis or arising during the episode of admitted patient care, episode of residential care or attendance at a health care establishment, as represented by a code’(NCCH 2008).
The quality of Indigenous status data is not considered to be adequate for analysis purposes for the ACT and Tasmania.
Framework elements Health needs domain: Getting better
Quality Domain: Safe
Service category: Multiple Service Categories (Hospitals, residential aged care facilities)
NHPA: Injury prevention and control
Disease expenditure: Injuries
Area of expenditure: Hospitals, residential aged care facilities
National Data Comments
National data currently available Falls resulting in patient harm can be identified in the National Hospital Morbidity Database (NHMD). The condition onset flag is used to differentiate falls that occur during the episode of admitted patient care and those not noted as occurring during the episode of admitted patient care.
Falls data are also collected by ACHS from hospitals participating in the ACHS Clinical indicator program.
Currently no data are collected for residential aged care facilities.
Data development required Use of NHMD would benefit from improvements in place of occurrence codes and use of condition onset flag.
The Aged Care Funding Instrument (ACFI) database, which is held by the Department of Health and Ageing, contains data relating to the classification of care needs of residents on admission to residential care and when their care needs subsequently change. All

132
ACFI data can be disaggregated by the level of care need. This information would need to be linked to the data collected on falls in residential aged care.
Data source National Hospital Morbidity Database (NHMD) for admitted patient hospital care.
Data collection arrangements Provided to the Australian Institute of Health and Welfare under the National Health Information Agreement
Data available annually
Time lag from collection to reporting: Less than 12 months after the end of the collection year.
International comparisons available
OECD: Health care quality indicators project – Selecting Indicators for Patient Safety at the Health Systems Level in OECD Countries. Reported as ‘patient falls’ and ‘in-hospital hip fracture or fall’.

133
Presentation of available data
0.00
0.10
0.20
0.30
0.40
0.50
0.60
2005 2006 2007
per 100 occupied bed days
All falls Falls requiring intervention Falls for 65 years and older
Note:
1. There were 329 hospitals which provided data for Patient falls in 2007.
2. There were 230 hospitals which provided data for Patient falls requiring intervention in 2007.
3. There were 214 hospitals which provided data for Patient falls for people aged 65 years and older.
4. The data as presented above only includes falls occurring in hospital and not those occurring in residential aged care as proposed in this indicator. Also the recommended disaggregation’s are not available.
A few of the organisations represented here are based in New Zealand rather than Australia.
Source: ACHS 2008
Patient falls, falls requiring intervention and falls in people aged 65 years and older, 2005–2007 (per 100 occupied bed days)
What these data show
The rates of falls and falls that require intervention remained essentially constant for the three years presented.
Increased rates of falls were reported for the 65 years and older age-group.
References
ACHS 2008. The Australian Council on Healthcare Standards Australasian Clinical indicator report 2001–2007. Sydney: ACHS
ACSQHC 2005. The Australian Council for Safety and Quality in Health Care 2005. Best practice guidelines for Australian hospitals and residential aged care facilities. Sydney: ACSQHC.
Kannus P, Khan K and Lord S 2006. Preventing falls among elderly people in the hospital environment. MJA 2006; 184 (8): 372-373

134
NCCH 2008. National Centre for Classification in Health 2008. The international statistical classification of diseases and related health problems, 6th edition, Australian modification (ICD-10-AM). Sydney: University of Sydney.
Wilson R, Runciman W, Gibberd R, Harrison B, Newby L and Hamilton J 1995. The Quality in Australian Health Care Study MJA 1995; 163(6):458-471
Appendix – ICD-10-AM Code list
Falls: W00 –W19
NCCH 2008

135
Complications of anaesthesia
Indicator Number: 26
Description: Proportion of surgical patients with complications of anaesthesia, including anaesthetic overdose, adverse reaction, or endotracheal tube misplacement.
Indicator status: Currently reportable – as per recommended specification
Rationale (clinical/policy): Anaesthetisation of patients is a high risk activity, with many potential adverse outcomes. Death due to anaesthesia is rare but complications related to anaesthetic care are more frequent. These can range from postoperative nausea to equipment failure resulting in severe conditions such as acute myocardial infarction (Millar & Mattke 2004).
Indicator Source: Aus PSI
Numerator: Separations with an ICD-10-AM diagnosis code for complication of anaesthesia in any secondary diagnosis field. (See <www.health.vic.gov.au/auspsi/technical-documents for relevant ICD-10-AM codes>.)
Denominator: All surgical separations, 18 years and older or MDC 14 (Pregnancy, Childbirth, and Puerperium), defined by an ICD-10-AM procedure code for an operating room procedure or anaesthetic. (See <www.health.vic.gov.au/auspsi/technical-documents for relevant ICD-10-AM codes>.)
Exclusions: Separations with an ICD-10-AM diagnosis code for complication of anaesthesia in the principal diagnosis field.
Separations with codes for self-inflicted injury, poisoning due to anaesthetics (X46, T410, T411, T412, T413) and an ICD-10-AM diagnosis code for active drug dependence or active nondependent abuse of drugs.
(See <www.health.vic.gov.au/auspsi/technical-documents for relevant ICD-10-AM codes>.)
Indicator type: Outcome
Disaggregation: National: Public Hospital Peer Group, Public/private hospital sector, State/Territory, Indigenous, Remoteness of facility
State/Territory: Public Hospital Peer Group, Public/private hospital sector, Indigenous, Remoteness of facility, Health service region, Facility/organisation
Facility/Organisation: Individual clinician, Complication type, Procedure type
Issues/Comments: The Agency for Healthcare Research and Quality (AHRQ) developed quality indicators to measure health care quality by using readily available hospital inpatient administrative data. The AHRQ patient safety indicators (PSIs) were developed using ICD-9-CM codes (AHRQ 2006). These indicators have now been translated by Victoria’s Department of Human Services to suit Australian ICD-10-AM codes and conventions; these are referred to as the Aus PSIs. This indicator has been aligned with the Aus PSI indicator

136
definition (Department of Human Services Victoria 2009). It is recommended that the appropriateness of these indicators be tested with Australian data.
This indicator is also included in the OCD patient safety indicator set. Use of the OECD PSI specifications enables international comparisons.
Internationally, there are some concerns about the validity of this indicator and whether it is consistently related to adverse outcomes. In US data for example (Zhan & Miller 2003) this indicator was associated with excess charges but not with excess mortality or length of stay.
A further issue with this indicator may be the reliability of recording of less severe complications such as postoperative nausea. Review of which complications should be included in the indicator may thus be appropriate.
The quality of Indigenous status data is not considered to be adequate for analysis purposes for the ACT and Tasmania.
Framework elements Health needs domain: Getting better
Quality Domain: Safe
Service category: Hospitals
Area of expenditure: Hospitals
National Data Comments
National data currently available
Data development required None
Data source National Hospital Morbidity Database (NHMD)
Data collection arrangements Provided to the Australian Institute of Health and Welfare under the National Health Information Agreement
Data available annually
Time lag from collection to reporting Less than 12 months after the end of the collection year.
International comparisons available:
• USA: Agency for Healthcare Research and Quality – Guide to Patient Safety Indicators
• OECD: Health care quality indicators project – Selecting Indicators for Patient Safety at the Health Systems Level in OECD Countries

137
Presentation of available data
0
0.02
0.04
0.06
0.08
0.1
0.12
0.14
0.16
0.18
Principal referral andwomen's & children's
hospitals
Large acute hospitals Medium acute hospitals
Per cent of separations
2003-04 2004-05 2005-06
Note: The numerator, denominator and disaggregation of the indicator as presented above is consistent with the proposed National safety and quality indicator
Figures presented here are the proportion of anaesthetic complications by all surgical separations
Source: OECD patient safety indicators support project
Complications of anaesthesia for Australia by selected public hospital peer group, 2003–04 to 2005–06 (per cent of separations)
What these data show
• Rates for the principal referral and specialist women’s and children’s hospitals were marginally higher than large and medium public acute hospitals.
References
ARHQ 2006. AHRQ Quality Indicators, Patient Safety Indicators Overview. Viewed 9 March 2009 <http://www.qualityindicators.ahrq.gov/psi_overview.htm>
Department of Human Services Victoria 2009. Aus PSI Patient Safety Indicators. Viewed 5 March 2009 <http://www.health.vic.gov.au/auspsi>
Millar J & Mattke S 2004. Selecting Indicators for Patient Safety at Health Systems Level in OECD Countries. OECD Health Technical Paper, no. 18. Paris: OECD.
Zhan C & Miller MR 2003. Administrative data based patient safety research: a critical review. Quality and Safety in Health Care 12:58-63.

138
Drösler S 2008. Facilitating Cross-National Comparisons of Indicators for Patient Safety at the Health-System Level in the OECD Countries. Directorate for Employment, Labour and Social Affairs Group on Health, OECD.
Millar J & Mattke S 2004. Selecting Indicators for Patient Safety at Health Systems Level in OECD Countries. OECD Health Technical Paper, no. 18. Paris: OECD.
Zhan C & Miller MR 2003. Administrative data based patient safety research: a critical review. Quality and Safety in Health Care 12:58-63.
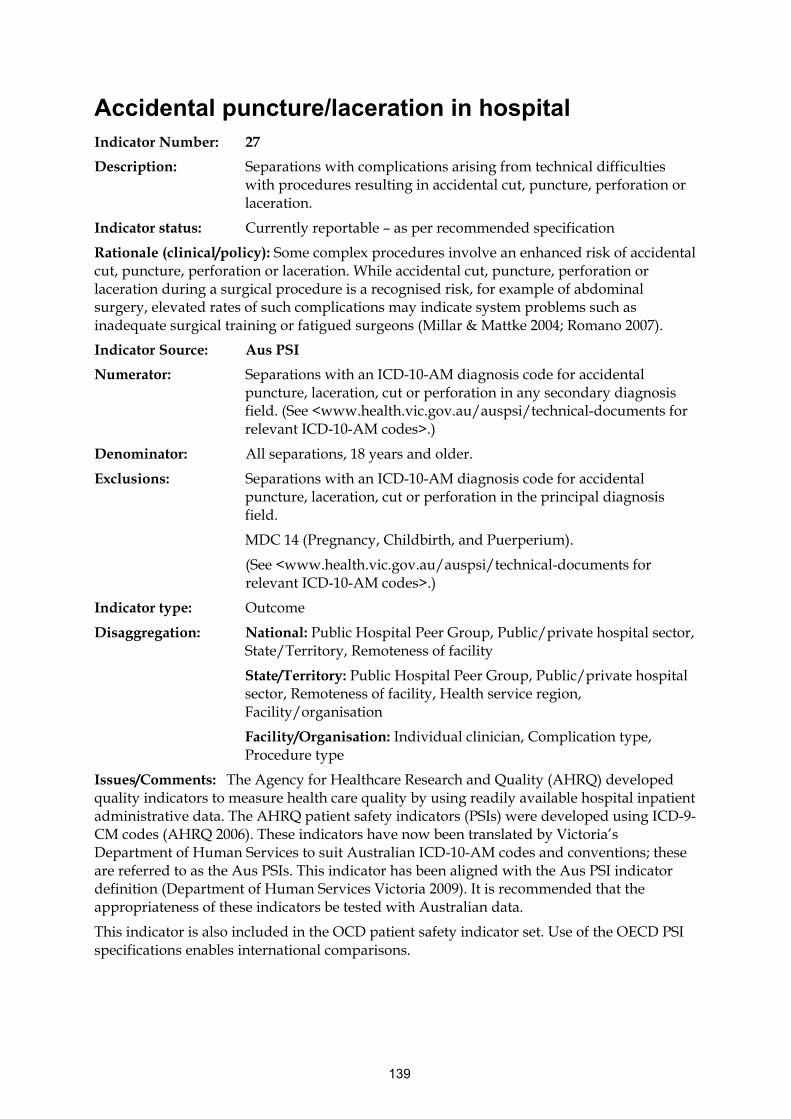
139
Accidental puncture/laceration in hospital Indicator Number: 27
Description: Separations with complications arising from technical difficulties with procedures resulting in accidental cut, puncture, perforation or laceration.
Indicator status: Currently reportable – as per recommended specification
Rationale (clinical/policy): Some complex procedures involve an enhanced risk of accidental cut, puncture, perforation or laceration. While accidental cut, puncture, perforation or laceration during a surgical procedure is a recognised risk, for example of abdominal surgery, elevated rates of such complications may indicate system problems such as inadequate surgical training or fatigued surgeons (Millar & Mattke 2004; Romano 2007).
Indicator Source: Aus PSI
Numerator: Separations with an ICD-10-AM diagnosis code for accidental puncture, laceration, cut or perforation in any secondary diagnosis field. (See <www.health.vic.gov.au/auspsi/technical-documents for relevant ICD-10-AM codes>.)
Denominator: All separations, 18 years and older.
Exclusions: Separations with an ICD-10-AM diagnosis code for accidental puncture, laceration, cut or perforation in the principal diagnosis field.
MDC 14 (Pregnancy, Childbirth, and Puerperium).
(See <www.health.vic.gov.au/auspsi/technical-documents for relevant ICD-10-AM codes>.)
Indicator type: Outcome
Disaggregation: National: Public Hospital Peer Group, Public/private hospital sector, State/Territory, Remoteness of facility
State/Territory: Public Hospital Peer Group, Public/private hospital sector, Remoteness of facility, Health service region, Facility/organisation
Facility/Organisation: Individual clinician, Complication type, Procedure type
Issues/Comments: The Agency for Healthcare Research and Quality (AHRQ) developed quality indicators to measure health care quality by using readily available hospital inpatient administrative data. The AHRQ patient safety indicators (PSIs) were developed using ICD-9-CM codes (AHRQ 2006). These indicators have now been translated by Victoria’s Department of Human Services to suit Australian ICD-10-AM codes and conventions; these are referred to as the Aus PSIs. This indicator has been aligned with the Aus PSI indicator definition (Department of Human Services Victoria 2009). It is recommended that the appropriateness of these indicators be tested with Australian data.
This indicator is also included in the OCD patient safety indicator set. Use of the OECD PSI specifications enables international comparisons.

140
This hospital-based indicator does not capture occurrence of accidental puncture/laceration in other health care settings, for example in procedural general practice. Further investigation in this area may be appropriate.
The quality of Indigenous status data is not considered to be adequate for analysis purposes for the ACT and Tasmania.
Framework elements Health needs domain: Getting better
Quality Domain: Safe
Service category: Hospitals
Area of expenditure: Hospitals
National Data Comments
National data currently available
No data development required
Data source National Hospital Morbidity Database (NHMD)
Data collection arrangements Provided to the Australian Institute of Health and Welfare under the National Health Information Agreement
Data available annually
Time lag from collection to reporting: Less than 12 months after the end of the collection year.
International comparisons available
• USA: Agency for Healthcare Research and Quality – Guide to Patient Safety Indicators
• OECD: Health care quality indicators project – Selecting Indicators for Patient Safety at the Health Systems Level in OECD Countries (Technical difficulty with procedure)

141
Presentation of available data
0
0.02
0.04
0.06
0.08
0.1
0.12
0.14
0.16
0.18
0.2
Principal referraland women's &
children'shospitals
Large acutehospitals
Medium acutehospitals
Small acutehospitals
Non-acutehospitals
Per cent of separations
2003-04 2004-05 2005-06
Note: The numerator, denominator and disaggregation of indicator as presented above is consistent with the
proposed National safety and quality indicator
Figures presented here are the proportion of accidental puncture/laceration by all surgical separations
Source: OECD patient safety indicators support project
Technical difficulty with procedure/accidental puncture or laceration for Australia by public hospital peer group, 2003–04 to 2005–06 (per cent of separations)
What these data show
• Rates of reported technical difficulty with procedure were stable across all public hospital peer groups.
• Among the public hospital peer groups, the reported rates were highest in the principal referral and specialist women’s and children’s hospitals and large acute hospital peer groups.
References
ARHQ 2006. AHRQ Quality Indicators, Patient Safety Indicators Overview. Viewed 9 March 2009 <http://www.qualityindicators.ahrq.gov/psi_overview.htm>
Department of Human Services Victoria 2009. Aus PSI Patient Safety Indicators. Viewed 5 March 2009 <http://www.health.vic.gov.au/auspsi>
Romano P 2007. Selecting indicators for patient safety at the health systems level in OECD countries: Summary of recent US experience. Paper presented at the OECD HCQI patient safety subgroup meeting on 24th October 2007 and expert group meeting on 26th October 2007
Millar J & Mattke S 2004. Selecting Indicators for Patient Safety at Health Systems Level in OECD Countries. Paris: OECD.

142
Obstetric trauma - third and fourth degree tears Indicator Number: 28
Description: The proportion of women having their first baby who sustained a third or fourth degree perineal tear while giving birth vaginally
Indicator status: Currently reportable – as per recommended specification
Rationale (clinical/policy): Obstetric trauma during delivery is often preventable and third and fourth degree perineal laceration can produce significant long term morbidity for women following childbirth, and can result in increased duration of hospitalisation or readmission for repair.
A third degree tear is an injury to the perineum involving the anal sphincter or recto-vaginal septum. A fourth degree tear is an injury to the perineum involving the anal sphincter complex and the anal epithelium. Known risk factors associated with third and fourth degree tears include women who have never given birth (primipara), foetal presentation, induction of labour, duration of labour (particularly duration of second stage), birth weight and instrumental deliveries (RCOG 2001).
There are practices that clinicians can use to reduce or minimise the risk of severe perineal trauma. These include antenatal determination of the baby’s weight, monitoring the position of the baby’s head throughout the labour, being aware of the baby’s head position at all times, selective use of medio-lateral episiotomy, and maternal positioning during the second stage of labour (ACHS 2007; WHA 2007). Perineal massage was determined to be effective in increasing the chance of delivery with an intact perineum for women with a first vaginal delivery but not for women with a previous vaginal birth (Labrecque et al. 1999).
Indicator Source: Women’s Hospitals Australasia Core Maternity Indicators
Numerator: The number of third and fourth degree tears for women having their first baby while giving birth vaginally
Denominator: The number of women having their first baby who gave birth vaginally
Indicator type: Outcome
Disaggregation: National: Indigenous, Remoteness of facility, Public Hospital Peer Group, Public/private hospital sector, State/Territory, Instrument delivery
State/Territory: Indigenous, Remoteness of facility, Public Hospital Peer Group, Public/private hospital sector, Instrument delivery, Health service region, Facility/organisation
Facility/Organisation: Individual clinician, Instrumental deliveries
Related indicators: 29 – Birth trauma – injury to neonate
Issues/Comments: First-time deliveries carry the highest relative risk for third- and fourth-degree lacerations. Because subsequent deliveries have different levels of risk, this indicator only includes first deliveries. However, the indicator could include all deliveries, disaggregated by first and subsequent deliveries in the presentation of the data. The Agency for Healthcare Research and Quality (AHRQ) and the OECD have also developed a patient safety indicator (PSI) for obstetric trauma. The AHRQ and OECD PSIs disaggregate by type

143
of delivery (instrument, non-instrument, caesarean section) to further adjust for risk. The AHRQ PSIs have been translated by Victoria’s Department of Human Services to suit Australian ICD-10-AM codes and conventions; these are referred to as the Aus PSIs (AHRQ 2006). The Women’s Hospitals Australasia Core Maternity Indicator was used because it restricts the numerator to women having their first baby while the OECD definition includes all women.
The quality of Indigenous status data is not considered to be adequate for analysis purposes for the ACT and Tasmania.
Framework elements Quality Domain: Safe, appropriate
Service category: Hospitals
Disease expenditure: Maternal conditions
Area of expenditure: Hospitals
National Data Comments
National data currently available With the exception of one State, midwives/perinatal data collection forms for all States and Territories include the data elements required for this indicator.
Data are also available in the NHMD on third and fourth degree tears but not first births. The ACHS also collects data on 3rd and 4th degree tears but not first births from organisations participating in its programs.
Data development required Western Australia would need to adjust their current collection form to include the option of a fourth degree tear. The definition of perineal status ‘other’ needs to be standardised between states. Addition of Perineal Status and related flags as per below to the Perinatal National Minimum Data Set (NMDS) is recommended.
Perineal status is a compound variable that collects information about lacerations and the use of episiotomy. Using this data element alone it is not possible to separate the 3rd and 4th degree lacerations that occur in association with an episiotomy from lacerations of lesser significance. NPDC data requests have, since 2001, included a request for two flags in addition to the ‘perineal status’: one for episiotomy and one for 3rd or 4th degree tear. These have not, up to now been used for routine reporting. Application of these flags can overcome the limitations of ‘perineal status.’
Data source National Perinatal Data Collection (NPDC).
The National Hospital Morbidity Data Collection could also be used. The value of NHMD data is that these data can distinguish between lacerations and extensions of episiotomy wounds if the correct codes are applied to repair procedures. However, while correctly applied

144
procedure codes can distinguish between lacerations and extensions to episiotomy wounds, the NHMD cannot distinguish between women having a first birth and women having a subsequent birth.
Public hospital peer groups derived from NHMD data could also be applied to NPDC data.
Data collection arrangements The data is based on births reported to the perinatal data collection in each state and territory in Australia. Midwives and other staff complete notification forms for each birth, using information obtained from mothers and from hospital or other records. Selected information is compiled annually into a national dataset by the AIHW National Perinatal Statistics Unit. The dataset includes all the data elements specified in the NMDS as well as additional data elements.
The Perinatal National Minimum Data Set (NMDS) is a specification for perinatal data elements for mandatory collection and reporting at a national level, and depends on a national agreement to collect the data in a uniform way.
Data available annually
Time lag from collection to reporting Greater than 12 months following the end of the collection year
International comparisons available
• USA: Agency for Healthcare Research and Quality – Guide to Patient Safety Indicators (disaggregated as with/without instrumentation and caesarean births)
• OECD: Health care quality indicators project – Selecting Indicators for Patient Safety at the Health Systems Level in OECD Countries
NB. The AHRQ and OECD indicators record incidents of obstetric trauma for all births and are not restricted to primiparous women.

145
Presentation of available data
Figures presented here are the proportion of third and fourth degree tears of all vaginal delivery with instrument
Obstetric trauma – vaginal delivery with instrument for Australia by public hospital peer group, 2003–04 to 2005–06 (per cent of separations)
0.00
1.00
2.00
3.00
4.00
5.00
6.00
7.00
8.00
9.00
10.00
Principalreferral and women's & children's hospitals
Large acute hospitals
Medium acutehospitals
Small acutehospitals
Non-acutehospitals
Per cent of
separations
2003-04 2004-05 2005-06

146
0.00
0.50
1.00
1.50
2.00
2.50
Principalreferral andwomen's &children'shospitals
Large acutehospitals
Medium acutehospitals
Small acutehospitals
Non-acutehospitals
Per cent of sparations
2003-04 2004-05 2005-06
Note: The data as presented here is different to the proposed indicator in that:
- This indicator includes all women while the proposed indicator only includes women having their first baby.
Figures presented here are the proportion of third and fourth degree tears of all vaginal delivery without instrument
Source: OECD patient safety indicators support project
Obstetric trauma – vaginal delivery without instrument for Australia by public hospital peer group, 2003–04 to 2005–06 (per cent of separations)
What these data show
• The rates for the principal referral and specialist women’s and children’s hospitals peer group were the highest for the public hospital peer groups.
• The rates of delivery with instrument are approximately four times higher than the rates of delivery without instrument across all public hospital peer-groups.
References
ACHS 2007. The Australian Council on Healthcare Standards 2007. Clinical Indicator users manual 2007. Sydney: ACHS.
ARHQ 2006. AHRQ Quality Indicators, Patient Safety Indicators Overview. Viewed 9 March 2009 <http://www.qualityindicators.ahrq.gov/psi_overview.htm>
Labrecque M, Eason E, Marcoux S, Lemieux F, Pinault JJ, Feldman P and Laperrière L 1999. Randomized controlled trial of prevention of perineal trauma by perineal massage during pregnancy. Laval University: Canada. Viewed 16 February 2009 <http://www.ncbi.nlm.nih.gov/pubmed/10076134>

147
RCOG 2001. Royal College of Obstetricians and Gynaecologists 2001. Management of third and fourth degree perineal tears following vaginal delivery 2001. <http://www.rcog.org.uk/resources/Public/pdf/Perineal_Tears_No29.pdf>
WHA 2007. Women’s Hospitals Australasia 2007. Supporting excellence in Maternity Care: The Core maternity Indicators Project. Canberra: WHA

148
Birth trauma - injury to neonate Indicator number: 29
Description: Injury acquired during delivery for infants born live in hospital.
Indicator status: Currently reportable – as per recommended specification
Rationale (clinical/policy): Birth trauma can lead to prolonged disability resulting in substantial resource utilisation for treatment, care and rehabilitation. Birth trauma injury is preventable and occurrence may be due to system failure, poor antenatal care or poor obstetric practice (Millar & Mattke 2004).
This is an internationally comparable indicator included in the OECD patient safety indicator set and is an issue that is of consumer concern.
Indicator Source: Aus PSI
Numerator: Separations with an ICD-10-AM diagnosis code for birth trauma in any secondary diagnosis field. (See <www.health.vic.gov.au/auspsi/technical-documents for relevant ICD-10-AM codes>.)
Denominator: All newborns, defined as neonates with an ICD-10-AM diagnosis code for an in-hospital live birth. (See <www.health.vic.gov.au/auspsi/technical-documents for relevant ICD-10-AM codes>.)
Exclusions: For the calculation of this indicator, exclusions apply to the numerator only.
Separations with a subdural or cerebral haemorrhage (subgroup of birth trauma) and any diagnosis code for pre-term infant (denoting birth weight less than 2,500 grams or less than 37 weeks gestation).
Separations with an injury to skeleton (subgroup of birth trauma) and an ICD-10-AM diagnosis code of osteogenesis imperfecta.
(See <www.health.vic.gov.au/auspsi/technical-documents for relevant ICD-10-AM codes>.)
Indicator type: Outcome
Disaggregation: National: Public Hospital Peer Group, Public/private hospital sector, Method of delivery (normal vaginal delivery, instrumental delivery, caesarean section), Indigenous, Remoteness of facility, State/Territory.
State/Territory: Public Hospital Peer Group, Public/private hospital sector, Method of delivery (normal vaginal delivery, instrumental delivery, caesarean section), Indigenous, Remoteness of facility, Health service region, Facility/organisation
Facility/Organisation: Individual clinician, Method of delivery
Related Indicators: 28 - Obstetric trauma - third and fourth degree tears
Issues/Comments: The Agency for Healthcare Research and Quality (AHRQ) developed quality indicators to measure health care quality by using readily available hospital inpatient administrative data. The AHRQ patient safety indicators (PSIs) were developed using ICD-9-

149
CM codes (AHRQ 2006). These indicators have now been translated by Victoria’s Department of Human Services to suit Australian ICD-10-AM codes and conventions; these are referred to as the Aus PSIs. This indicator has been aligned with the Aus PSI indicator definition (Department of Human Services Victoria 2009). It is recommended that the appropriateness of these indicators be tested with Australian data.
This indicator is also included in the OCD patient safety indicator set. Use of the OECD PSI specifications enables international comparisons.
This indicator has been widely used in the obstetric community in the US, although it is more commonly based on chart review rather than administrative data. Only in-hospital births are included. (Kristensen et al 2007)
The project team conducted extensive empirical analyses on the PSIs and found that birth trauma generally performs well on several different dimensions, including reliability, relatedness of indicators, and persistence over time (AHRQ 2006).
This indicator could be further refined through a review of codes included in the numerator, for example considering the addition of brachial plexus (P14.3) injuries and upper limb palsies (P13.4).
The quality of Indigenous status data is not considered to be adequate for analysis purposes for the ACT and Tasmania.
Framework elements Quality Domain: Safe
Service category: Hospitals
Disease expenditure: Neonatal
Area of expenditure: Hospitals
National Data Comments
National data currently available
No data development required
Data source National Hospital Morbidity Database (NHMD)
Data collection arrangements Provided to the Australian Institute of Health and Welfare under the National Health Information Agreement
Data available annually
Time lag from collection to reporting: Less than 12 months after the end of the collection year.
International comparisons available
• USA: Agency for Healthcare Research and Quality – Guide to Patient Safety Indicators
• OECD: Health care quality indicators project – Selecting Indicators for Patient Safety at the Health Systems Level in OECD Countries
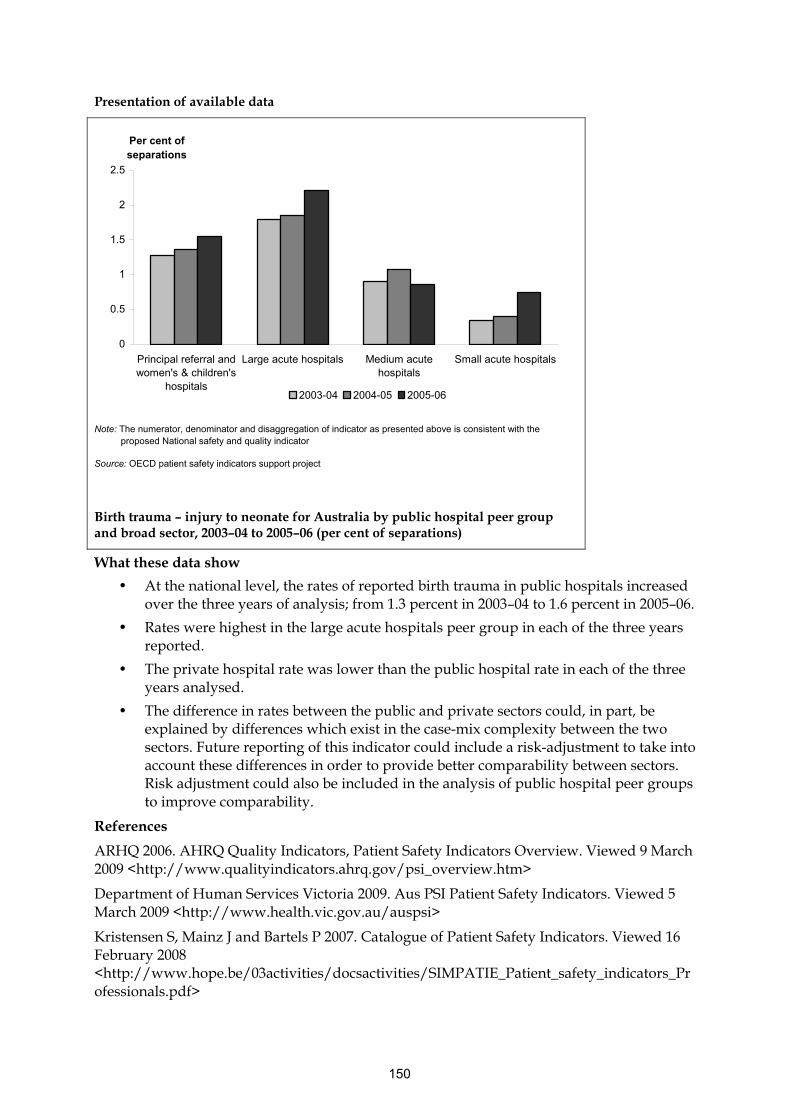
150
Presentation of available data
0
0.5
1
1.5
2
2.5
Principal referral andwomen's & children's
hospitals
Large acute hospitals Medium acutehospitals
Small acute hospitals
Per cent of separations
2003-04 2004-05 2005-06
Note: The numerator, denominator and disaggregation of indicator as presented above is consistent with the
proposed National safety and quality indicator
Source: OECD patient safety indicators support project
Birth trauma – injury to neonate for Australia by public hospital peer group and broad sector, 2003–04 to 2005–06 (per cent of separations)
What these data show
• At the national level, the rates of reported birth trauma in public hospitals increased over the three years of analysis; from 1.3 percent in 2003–04 to 1.6 percent in 2005–06.
• Rates were highest in the large acute hospitals peer group in each of the three years reported.
• The private hospital rate was lower than the public hospital rate in each of the three years analysed.
• The difference in rates between the public and private sectors could, in part, be explained by differences which exist in the case-mix complexity between the two sectors. Future reporting of this indicator could include a risk-adjustment to take into account these differences in order to provide better comparability between sectors. Risk adjustment could also be included in the analysis of public hospital peer groups to improve comparability.
References
ARHQ 2006. AHRQ Quality Indicators, Patient Safety Indicators Overview. Viewed 9 March 2009 <http://www.qualityindicators.ahrq.gov/psi_overview.htm>
Department of Human Services Victoria 2009. Aus PSI Patient Safety Indicators. Viewed 5 March 2009 <http://www.health.vic.gov.au/auspsi>
Kristensen S, Mainz J and Bartels P 2007. Catalogue of Patient Safety Indicators. Viewed 16 February 2008 <http://www.hope.be/03activities/docsactivities/SIMPATIE_Patient_safety_indicators_Professionals.pdf>

151
Millar J and Mattke S 2004. Selecting Indicators for Patient Safety at Health Systems Level in OECD Countries. OECD Health Technical Paper, no. 18. Paris: OECD.
152
Postoperative haemorrhage Indicator Number: 30
Description: Proportion of hospital separations with a surgical procedure that involve a postoperative haemorrhage or haematoma.
Postoperative haemorrhage refers to bleeding after a surgical procedure.
Indicator status: Currently reportable – as per recommended specification
Rationale (clinical/policy): Postoperative haemorrhage or haematoma following a surgical procedure, may occur immediately after the surgery or be delayed, and need not be restricted to the surgical wound. Common causes of postoperative haemorrhage are from tissues which cannot be entirely prevented from bleeding and depend on blood clotting to stop the haemorrhage, problems in the normal clotting mechanism of blood, and clips or ties around blood vessels becoming loose (Medicine.Net 2008).
In an American study, patient-level variables identified as risk factors included admission type (that is, elective, urgent, emergency), age, sex, procedure, and co-morbidities. Hospital-level variables included size, location, and teaching status (Shufelt et al. 2005).
Indicator Source: Aus PSI
Numerator: Separations with an ICD-10-AM diagnosis code for postoperative haemorrhage or haematoma in any additional diagnosis field and codes for postoperative control of haemorrhage or drainage of haematoma in any procedure field (See <www.health.vic.gov.au/auspsi/technical-documents for relevant ICD-10-AM codes>.)
Denominator: All surgical separations, for patients aged 18 years and older, with a code for an operating room procedure (See <www.health.vic.gov.au/auspsi/technical-documents for relevant ICD-10-AM codes>.)
Indicator type: Outcome
Disaggregation: National: Public Hospital Peer Group, Public/private hospital sector, Indigenous, Remoteness of facility, State/Territory.
State/Territory: Public Hospital Peer Group, Public/private hospital sector, Remoteness of facility, Health service region, Facility/organisation
Facility/Organisation: Individual clinician, Procedure type, Admission type, Patient group (e.g. trauma, coagulopathy)
Related indicators: 32 – Unplanned return to operating theatre
45 – Unplanned hospital re-admissions
Issues/Comments: The Agency for Healthcare Research and Quality (AHRQ) developed quality indicators to measure health care quality by using readily available hospital inpatient administrative data. The AHRQ patient safety indicators (PSIs) were developed using ICD-9-CM codes (AHRQ 2006). These indicators have now been translated by Victoria’s Department of Human Services to suit Australian ICD-10-AM codes and conventions; these

153
are referred to as the Aus PSIs. This indicator has been aligned with the Aus PSI indicator definition (Department of Human Services Victoria 2009). It is recommended that the appropriateness of these indicators be tested with Australian data.
In a review of the Agency for Healthcare Research and Quality (AHRQ) Patient Safety Indicators (PSIs), panellists noted that some patients may be at higher risk for developing a postoperative haemorrhage or haematoma. They suggested that where possible, this indicator be stratified for patients with coagulopathies and those on anticoagulants with underlying clotting differences. They also suggested that this indicator be stratified for trauma and non-trauma patient, noting that patients admitted for trauma may be at a higher risk for developing postoperative haemorrhage or may have a haemorrhage diagnosed that occurred during the trauma (AHRQ 2007).
The quality of Indigenous status data is not considered to be adequate for analysis purposes for the ACT and Tasmania.
Framework elements Health needs domain: Getting better
Quality Domain: Safe, appropriate
Service category: Hospitals
Area of expenditure: Hospitals
National Data Comments
National data currently available Data is available from the NHMD
No data development required
Data source National Hospital Morbidity Database (NHMD)
Data collection arrangements Provided to the Australian Institute of Health and Welfare under the National Health Information Agreement
Data available annually
Time lag from collection to reporting: Less than 12 months after the end of the collection year.
International comparisons available
• USA: Agency for Healthcare Research and Quality – Guide to Patient Safety Indicators (haemorrhage and haematoma)
References
ARHQ 2007. AHRQ Quality Indicators Guide to Patient Safety Indicators, version 3.1. Viewed 10, September 2008 <http://www.qualityindicators.ahrq.gov/downloads/psi/psi_guide_v31.pdf>.
ARHQ 2006. AHRQ Quality Indicators, Patient Safety Indicators Overview. Viewed 9 March 2009 <http://www.qualityindicators.ahrq.gov/psi_overview.htm>
Department of Human Services Victoria 2009. Aus PSI Patient Safety Indicators. Viewed 5 March 2009 <http://www.health.vic.gov.au/auspsi>
Medicine.Net. Accessed 10 September 2008. <http://www.medterms.com/script/main/art.asp?articlekey=11017>

154
Shufelt JL, Hannan EL, Gallagher BK 2005. The Postoperative Haemorrhage and Hematoma Patient Safety Indicator and Its Risk Factors. American Journal of Medical Quality, vol. 20 no. 4 pp210–218.

155
Postoperative venous thromboembolism Indicator Number: 31
Description: The proportion of surgical separations with postoperative venous thromboembolism.
Indicator status: Currently reportable – as per recommended specification
Rationale (clinical/policy): Venous thromboembolism (VTE) can have serious consequences for a patient including pain, loss of function and sometimes death. Incidence of VTE is widely acknowledged as an indicator of the quality of postoperative care, and can reflect inappropriate or inadequate medical and nursing care. VTE invariably prolongs the duration of hospitalisation and requires additional medical intervention (Millar & Mattke 2004).
Indicator Source: Aus PSI
Numerator: Separations with an ICD-10-AM diagnosis code for pulmonary embolism or deep vein thrombosis in any secondary diagnosis field. (See <www.health.vic.gov.au/auspsi/technical-documents for relevant ICD-10-AM codes>.)
Denominator: All surgical separations, 18 years and older, defined by an ICD-10-AM procedure code for an operating room procedure or anaesthetic.
(See <www.health.vic.gov.au/auspsi/technical-documents for relevant ICD-10-AM codes>.)
Indicator type: Outcome
Disaggregation: National: State/Territory, Public Hospital Peer Group, Public/private hospital sector, Indigenous, Remoteness of facility, Patient groups
State/Territory: Public Hospital Peer Group, Public/private hospital sector, Remoteness of facility, Patient groups, Health service region, Facility/organisation
Facility/Organisation: Individual clinicians, Procedure type
Related indicators: 14 - Assessment for risk of venous thromboembolism in hospitals
Issues/Comments: The Agency for Healthcare Research and Quality (AHRQ) developed quality indicators to measure health care quality by using readily available hospital inpatient administrative data. The AHRQ patient safety indicators (PSIs) were developed using ICD-9-CM codes (AHRQ 2006). These indicators have now been translated by Victoria’s Department of Human Services to suit Australian ICD-10-AM codes and conventions; these are referred to as the Aus PSIs. This indicator has been aligned with the Aus PSI indicator definition (Department of Human Services Victoria 2009). It is recommended that the appropriateness of these indicators be tested with Australian data.
This indicator is also included in the OCD patient safety indicator (PSI) set. Use of the OECD PSI specifications enables international comparisons.
This indicator currently does not capture post discharge events; that would only be possible with data linkage. Post hospital events may be captured in hospital data if the event requires hospitalisation. However, it may not be the same hospital in which the surgery was performed. Linkage with mortality data could provide information on deaths related to VTE.

156
Consideration could be given to expanding this indicator to include patients with medical conditions as well as surgical patients.
The quality of Indigenous status data is not considered to be adequate for analysis purposes for the ACT and Tasmania.
Framework elements Health needs domain: Getting better
Quality Domain: Safe, appropriate, effective
Service category: Hospitals
NHPA: Cardiovascular health
Burden of disease: Cardiovascular disease
Disease expenditure: Cardiovascular
Area of expenditure: Hospitals
National Data Comments
National data currently available
Data development required Indicator could be expanded to include patients with medical conditions as opposed to just surgical patients. Data linkage could enable expansion of reporting to include some post-discharge events.
Data source National Hospital Morbidity Database (NHMD)
Data collection arrangements Provided to the Australian Institute of Health and Welfare under the National Health Information Agreement
Data available annually
Time lag from collection to reporting: Less than 12 months after the end of the collection year.
International comparisons available
• USA: Agency for Healthcare Research and Quality – Guide to Patient Safety Indicators
• OECD: Health care quality indicators project – Selecting Indicators for Patient Safety at the Health Systems Level in OECD Countries
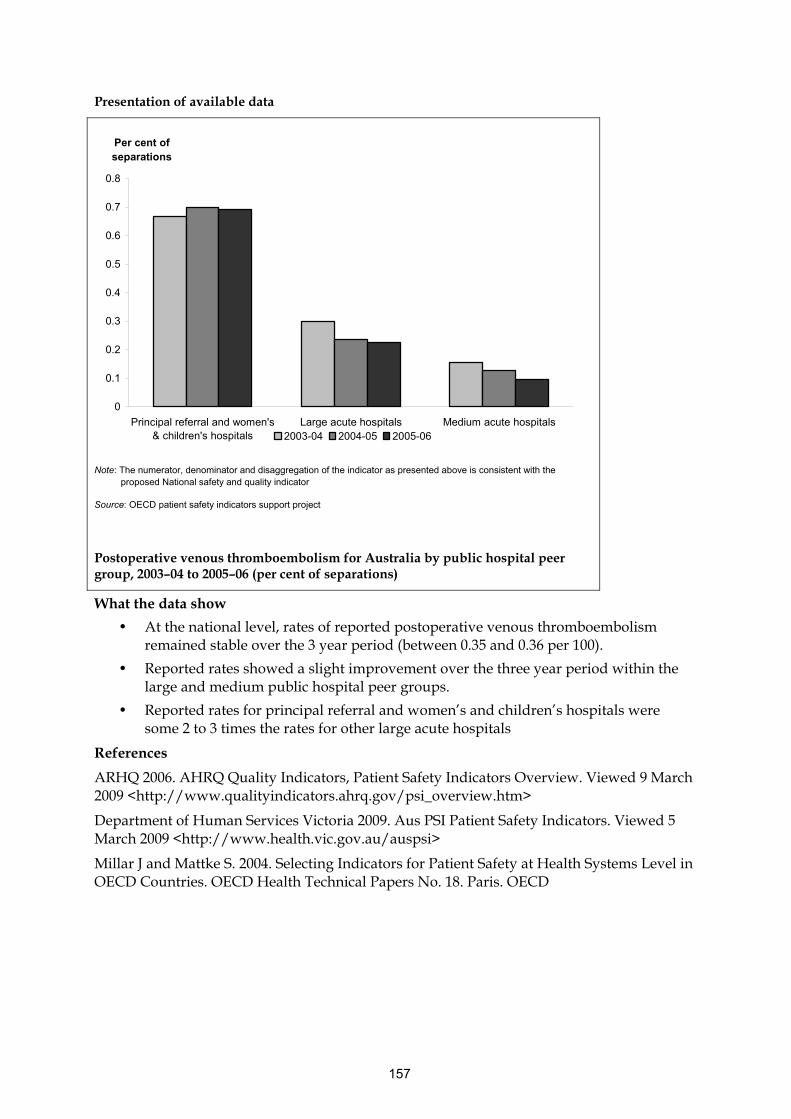
157
Presentation of available data
0
0.1
0.2
0.3
0.4
0.5
0.6
0.7
0.8
Principal referral and women's& children's hospitals
Large acute hospitals Medium acute hospitals
Per cent of separations
2003-04 2004-05 2005-06
Note: The numerator, denominator and disaggregation of the indicator as presented above is consistent with the
proposed National safety and quality indicator
Source: OECD patient safety indicators support project
Postoperative venous thromboembolism for Australia by public hospital peer group, 2003–04 to 2005–06 (per cent of separations)
What the data show
• At the national level, rates of reported postoperative venous thromboembolism remained stable over the 3 year period (between 0.35 and 0.36 per 100).
• Reported rates showed a slight improvement over the three year period within the large and medium public hospital peer groups.
• Reported rates for principal referral and women’s and children’s hospitals were some 2 to 3 times the rates for other large acute hospitals
References
ARHQ 2006. AHRQ Quality Indicators, Patient Safety Indicators Overview. Viewed 9 March 2009 <http://www.qualityindicators.ahrq.gov/psi_overview.htm>
Department of Human Services Victoria 2009. Aus PSI Patient Safety Indicators. Viewed 5 March 2009 <http://www.health.vic.gov.au/auspsi>
Millar J and Mattke S. 2004. Selecting Indicators for Patient Safety at Health Systems Level in OECD Countries. OECD Health Technical Papers No. 18. Paris. OECD

158
Unplanned return to operating theatre Indicator Number: 32
Description: Unplanned return to the operating theatre during the same admission.
Indicator status: Currently reportable – data development required to meet recommended specification
Rationale (clinical/policy): Unplanned return in this context refers to the necessity for a further operation for complication(s) related to a previous operation/procedure in the operating room. Unplanned return of a patient to the operating room during the same admission may reflect possible problems in the performance of procedures and/or less than optimal patient management (ACHS 2007).
Indicator Source: ACHS
Numerator: The number of separations having an unplanned return to the operating room during the time period under study.
Denominator: The total number of separations who have an operation or procedure in the operating room, during the time period under study.
Indicator type: Outcome
Disaggregation: National: Admission type, Indigenous, Remoteness of facility, Public Hospital Peer Group, Public/private hospital sector, State/Territory
State/Territory: Admission type, Indigenous, Remoteness of facility, Public Hospital Peer Group, Public/private hospital sector, Health service region, Facility/organisation
Facility/Organisation: Admission type, Procedure type, Individual clinician
Related indicators: 19 – Health care associated infections (HCAI) acquired in hospital
30 – Postoperative haemorrhage
33 – Unplanned re-admission to intensive care unit
45 – Unplanned hospital re-admissions
Issues/Comments: Patients returning to the operating room from the recovery room are included in the numerator figure. When there are multiple returns to the operating room within the same admission are only counted once.
Data for national reporting of unplanned returns to an operating theatre in the same admission are currently not available. Future data development work includes definitional work around how ‘unplanned return’ is defined and recorded.
The quality of Indigenous status data is not considered to be adequate for analysis purposes for the ACT and Tasmania.
Framework elements Health needs domain: Getting better
Quality Domain: Appropriate, effective, safe
Service category: Hospitals
Area of expenditure: Hospitals

159
National Data Comments
Data currently available (not national) Data are collected by ACHS from organisations participating in their programs.
Data development required NHMD could be used for reporting if data development was undertaken. A new data element would be required to record unplanned returns to theatre. It could be based on data collected for the ACHS indicator.
Data source National Hospital Morbidity Database (NHMD)
Data collection arrangements Provided to the Australian Institute of Health and Welfare under the National Health Information Agreement
Time lag from collection to reporting
No international comparisons available

160
Presentation of available data
0
0.1
0.2
0.3
0.4
0.5
0.6
1998 1999 2000 2001 2002 2003 2004 2005 2006
Rate per 100 patients
Note: The data as presented here are different to the proposed indicator in that these data only includes organisations that report data to the ACHS (average 283 organisations a year); the proposed indicator includes all hospitals. A few of the reporting organisations are based in New Zealand rather than Australia.
(a) Reported as a mean rate over all organisations submitting data.
Source: ACHS 2008
Unplanned return to operating theatre in the same admission, 1998–2006 (per 100 patients)
What these data show
• Reported average rates of unplanned returns to operating theatre generally declined over the period 2001 to 2006.
References
ACHS (The Australian Council on Healthcare Standards) 2007. Clinical Indicator users manual 2007. Sydney: ACHS.
ACHS 2008. The Australian Council on Healthcare Standards Australasian Clinical indicator report 2001–2007. Sydney: ACHS

161
Unplanned re-admission to an Intensive Care Unit Indicator Number: 33
Description: Unplanned re-admissions to an ICU within the same admission, up to (and including) 72 hours post discharge from the intensive care unit.
Indicator status: Currently reportable – data development required to meet recommended specification
Rationale (clinical/policy): As an indicator of the quality of care, a readmission to ICU may reflect the less than optimal management of a patient at risk of clinical deterioration, it may reflect premature discharge from the ICU as a consequence of inadequate resources, poor discharge planning or may reflect the quality of general ward care (Campbell et al. 2008; Elliott 2006).
For this indicator, restriction to those readmissions which occur in the time frame of 72 hours aims to differentiate deficiencies in management from complications and/or progression of the disease process. Admissions after this time are more likely to be complications of the disease process.
As defined by ACHS (2007) unplanned readmission refers to:
• An unexpected re-admission for further treatment of the same condition for which the patient was previously admitted to the intensive care unit
• An unexpected re-admission for treatment of a condition related to one for which the patient was previously admitted to the intensive care unit
• An unexpected admission for a complication of the condition for which the patient was previously admitted to the intensive care unit.
(ACHS 2007)
Indicator Source: ACHS
Numerator: The total number of unplanned re-admissions into an intensive care unit within seventy-two hours of discharge from an intensive care unit, during the time period under study.
Paediatric and neonatal patients are excluded
Denominator: The total number of admissions into an intensive care unit, during the time period under study.
Paediatric and neonatal patients are excluded.
Indicator type: Outcome
Disaggregation: National: Public Hospital Peer Group, Public/private hospital sector, Indigenous, Remoteness of facility, State/Territory
State/Territory: Public Hospital Peer Group, Public/private hospital sector, Indigenous, Remoteness of facility, Health service region, Facility/organisation
Facility/Organisation: Individual clinician.
Related indicators: 19 – Health care associated infections acquired in hospital
32 – Unplanned return to operating theatre

162
45 – Unplanned hospital re-admissions
Issues/Comments: Kapadia and Bhojani (2003) raised the issue that patient transfer from ICU to the ward may be dictated by pressure for beds and other non-medical factors. They suggest that a very low rate of readmissions may reflect an overtly cautious approach of the treatment of patients in ICU rather than serve as a marker of ICU ‘quality’.
Further clarification on the technical specifications of this indicator is needed. It is not stated in the ACHS definition of this indicator whether only patients surviving to discharge from ICU should be included in the denominator.
The quality of Indigenous status data is not considered to be adequate for analysis purposes for the ACT and Tasmania.
Framework elements Health needs domain: Getting better
Quality Domain: Appropriate, effective, safe
Service category: Hospitals
Area of expenditure: Hospitals
National Data Comments
Data currently available (not national) Data are collected by ACHS from organisations participating in their programs.
Data development required NHMD could be used for reporting if data development was undertaken. A new data element would be required to record unplanned returns to ICU. It could be based on data collected for the ACHS indicator.
Data source National Hospital Morbidity Database
Data collection arrangements Provided to the Australian Institute of Health and Welfare under the National Health Information Agreement
Data available annually
Time lag from collection to reporting: Less than 12 months after the end of the collection year.
No international comparisons available

163
Presentation of available data
0
0.5
1
1.5
2
2.5
1998 1999 2000 2001 2002 2003 2004 2005 2006
Rate per 100 admissions to ICU
Note: The data as presented here are different to the proposed indicator in that this data only includes organisations that report data to the ACHS (average 93 organisations a year); the proposed indicator includes all hospitals. A few of the reporting organisations are based in New Zealand rather than Australia.
In addition, the suggested disaggregations by hospital peer group and sector were not available.
(a) Reported as a mean rate over all organisations submitting data
Source: ACHS 2008
Unplanned re-admission to an Intensive Care Unit, 2001–2006 (per 100 admissions to ICU)
What these data show
• The mean rates for unplanned readmission to the ICU ranged from about 1.4 percent to 1.9 percent per 100 admissions to ICU between 1998 and 2006.
References
ACHS (The Australian Council on Healthcare Standards) 2007. Clinical Indicator users manual 2007. Sydney: ACHS.
ACHS 2008. The Australian Council on Healthcare Standards Australasian Clinical indicator report 2001–2007. Sydney: ACHS
Campbell AJ, Cook JA, Adey G & Cuthbertson BH 2008. Predicting death and readmission after intensive care discharge. British Journal of Anaesthesia 100:656-62.

164
Elliott M 2006. Readmission to intensive care: a review of the literature. Australian Critical Care 19:96-104.
Kapadia FN and Bhojani KS 2003. Application of the Australian Council on Healthcare Standards clinical markers of quality of care to the ICU of an Indian tertiary referral hospital. Indian Journal of Critical Care Medicine. Vol 7, pp 18-20.

165
Hospital Standardised Mortality Ratio (HSMR) Indicator Number: 34
Description: The ratio comparing the observed number of hospital separations that result in the patient’s death with the number of separations expected to result in death based on the patients’ risk profile
Indicator status: Currently reportable – as per recommended specification
Rationale (clinical/policy): The report ‘Measuring and Reporting Mortality in Hospital Patients’ (AIHW: Ben-Tovim et al. 2009), provides detailed discussion of the policy and clinical rationale for the Hospital Standardised Mortality Ratio (HSMR) indicator. The report also reviews the large body of literature in Australia and elsewhere which has addressed the issue of patient deaths in hospital and the development of the HSMR as a useful measure of patient mortality rates.
The risk of death for a patient differs markedly owing to such factors as the patient’s age and co-morbidities, and the urgency of the patient’s admission. Mortality risk adjustment following the Canadian Referred Mortality Model (CIHI 2007) endeavours to accommodate these factors and so calculate the expected probability that any hospital stay would end in the patient’s death. Using the Australian National Hospital Morbidity Database (NHMD), the analysis can similarly calculate how many patient deaths would be expected in any hospital over any period. The HSMR numerator, the recorded number of patient deaths, as a percentage of the denominator distinguishes hospitals with the expected or lower than expected number of hospital deaths from those with significantly more patient deaths than expected. A high or rising HSMR might flag potential quality deficiencies in hospital care, where further investigation could be required. A low or falling HSMR on the other hand might signal good health-care standards from which lessons could be learned (AIHW: Ben-Tovim et al. 2009).
Analysis of the NHMD data over the three-year period from 2004–05 to 2006–07 found that:
• In the case of the larger hospitals with numerous patient stays, how a hospital fared in terms of a favourable or less than favourable HSMR tended to remain stable over the three years
• When all three years’ data were analysed together, some indication emerged that the HSMR declined over time, which is to say that the probability decreased of in-hospital patient mortality after taking into account the patients’ risk profile.
The ‘Measuring and Reporting Mortality in Hospital Patients’ study also addresses the question of whether the HSMR indicator should be expanded to include deaths up to 30 days post-discharge as well as in-hospital deaths. It suggests this enhancement may be of benefit, but was unable to investigate it fully owing to the lack of nation-wide data linkage connecting hospital administrative information and other registry data. Accordingly, the in-hospital mortality version of the indicator is recommended for application at the current time.
AIHW: Ben-Tovim et al. (2009) recommend that HSMR analysis be conducted on three groups of cases:
• Group 1: High risk cases (20% of cases, 80% of in hospital deaths)
• Group 2: lower risk cases (all other in-scope cases; that is, the other 80% of cases including 20% of in-hospital deaths

166
• Group 3: All cases and all in-hospital deaths.
Numerator: Observed number of in-hospital deaths amongst selected principal diagnosis groups:
• Group 1: Separations with high-risk principal diagnoses, associated with 80% of in-hospital deaths.
• Group 2: Separations with lower-risk principal diagnoses, which are all those which are not covered by Group 1
• Group 3: All separations
Denominator: Expected number of in-hospital deaths amongst selected principal diagnosis groups.
• Group 1: Separations with high-risk principal diagnoses, associated with 80% of in-hospital deaths.
• Group 2: Separations with low-risk principal diagnoses, which are all those which are not covered by Group 1
• Group 3: All separations
Indicator type: Outcome
Disaggregation: National: Public hospitals (except small hospitals), Public Hospital Peer Group, Public/Private sector, Remoteness of facility, State/Territory, diagnosis group
State/Territory: Public hospitals (except small hospitals), Public Hospital Peer Group, Public/Private sector, Remoteness of facility, diagnosis group, Health service region, Facility/organisation
Facility/Organisation: Clinical speciality
Related Indicators: 35 – Death in low mortality DRGs 36 – Independent peer review of surgical deaths
52 – Potentially avoidable deaths
Issues/Comments: A feature of HSMRs is that they are by definition 100 percent for the full body of analysed data, and the point of comparison is between subsets whose HSMR is above or below 100 percent. For instance, AIHW: Ben-Tovim et al. (2009) compared three years above and below 100 percent, and at a finer grained level showed the distribution of HSMRs for public hospital peer groups and individual hospitals within peer groups. Additional potential comparisons could be between jurisdictions and sectors (public versus private).
Incorporation of socio-economic status measured by SEIFA score did not substantially add to the discriminatory power of the risk-adjustment modelling. This may be because socio-economically associated differences in patients’ risk are already captured in the Canadian Referred Mortality Model (RACM) variables. Related disaggregations such as Indigenous status and geographical remoteness were not explored. The study also trialled a refinement to the RACM, called the elaborated risk-adjusted mortality (ERM) model, which incorporated interactions between the risk factors. In proposing the ERM, AIHW: Ben-Tovim et al. (2009) however noted that greatly increased computation would be required compared to the RACM, and that international comparisons in the current state of play would still need to defer to RACM-generated results.

167
The addition of the condition onset flag to Australia’s National Hospital Morbidity Database (NHMD) has the potential to identify co-morbidities which arose during the hospital stay and so should be excluded from the risk-adjustment calculations. It therefore has the potential to improve the HSMR analysis.
The Australian Commission for Safety and Quality held a workshop in March 2009 to discuss measurement and reporting of mortality. One issue raised, stemming from the Canadian experience, is the need to monitor how palliative care is coded in the analysed records. Patients treated within designated palliative care services (but not other palliative care patients), are excluded from the HSMR analysis. Hence, whether hospitals provide palliative care in designated services, and how they identify palliative care for the NHMD could affect their HSMR calculation.
Other data issues with implications for HSMR analysis are variations in admission practices, the threshold at which hospitals would record an admission as emergency (and so higher risk) rather than elective, and differences between hospitals in recognising and coding additional diagnoses (with implications for co-morbidity adjustment).
The workshop generally supported work to investigate the inclusion in the analysis of deaths up to 30 days post-discharge as well as in-hospital deaths. Workshop participants were of the general opinion that the HSMR indicator as currently developed would be ready for immediate operation. They were of the view that planning should allow for revision of indicator methods in coming years, to take advantage of improvements in methods and data, and advances in hospitals’ capacity to deliver high-quality care. Following such revisions, and perhaps on a periodic basis as well, HSMRs should be recalculated so that the overall HSMR is reset to 100 percent.
The HSMR indicator has particular value when used as one component of a suite of monitoring arrangements that deal with mortality in hospitals. Examples include the related indicators of death in low mortality DRGs, independent peer review of surgical deaths and potentially avoidable (hospital) deaths, as well the variable life-adjusted displays (VLADs) developed by Queensland Health for reporting in-hospital mortality for the five conditions of acute myocardial infarction, heart failure, stroke, pneumonia and fractured neck of femur (Duckett et al. 2007).
Framework elements Quality Domain: Safe, effective, appropriate
Service category: Hospitals
Area of expenditure: Hospitals
National Data Comments
National data currently available NHMD could be used for reporting. Data improvements (such as the inclusion of private hospital identifiers) could improve the usefulness of the analysis. Various enhancements to the analysis method may also prove useful - see AIHW: Ben-Tovim et al. (2009) for detailed discussion.
Data development required No data development has been identified as required. However, investigation of enhancements to the analysis method may identify data development needs, such as in relation to the untested condition onset flag and palliative care type data.

168
Data source National Hospital Morbidity Database
Data collection arrangements Provided to the Australian Institute of Health and Welfare under the National Health Information Agreement
Data available annually
Time lag from collection to reporting: Less than 12 months after the end of the collection year.
International comparisons available
• Canada: Canadian Institute for Health Information report - HSMR: A New Approach for Measuring Hospital Mortality Trends in Canada
• UK: Dr Foster Intelligence® report – The Hospital Guide

169
Presentation of available data
0
50
100
150
200
250
Principalreferral
Specialistwomen's &children's
Large majorcities
Large regional& remote
Small regionalacute
Remote acute
Mean HSMR
2004-05 2005-06 2006-07
Note: The numerator, denominator and disaggregation of the indicator as presented above are consistent with the proposed National safety and quality indicator
Source: AIHW 2009
Mean HSMR by hospital peer group, 2004–05 to 2006–07
What these data show
• There was a tendency for HSMRs to decrease over time for peer groups principal referral, specialist women’s and children’s and large major cities
• It should be recognised that that these are results of a demonstration analysis. Although they offer support for the view that Australian hospital morbidity data provide an adequate basis for calculation of indicators of in-hospital mortality, caution should be taken not to over interpret these results, which have some limitations.
References
AIHW: Ben-Tovim D, Woodman R, Harrison JE, Pointer S, Hakendorf P, Henley G, 2009. Measuring and reporting mortality in hospital patients. Canberra: AIHW.
CIHI 2007. Canadian Institute for Health Information 2007. HSMR: A new approach for measuring hospital mortality trends in Canada. Ottawa: CIHI.
Duckett SJ, Coory M and Sketcher-Baker K 2007. Identifying variations in quality of care in Queensland Hospitals. Medical Journal of Australia 2007; 187 (10): 571-575.

170
Death in low mortality DRGs Indicator Number: 35
Description: Separations or hospital episodes of care ending in death where the separations are in a Diagnosis Related Group (DRG) with a mortality rate less than 0.5%.
Indicator status: Currently reportable – as per recommended specifications
Rationale (clinical/policy): Mortality as an outcome of hospital care is readily understood by patients’ families and the general public as a tragic outcome, especially for low-mortality DRGs where a notable risk of mortality would not be anticipated or communicated to the patient (and family).
A study by Hannan et al. (1989) found that, after adjustment for patient and hospital characteristics, patients in low-mortality DRGs who died were approximately five times more likely than other patients who died to have received care that did not meet professionally recognised standards.
Based on a study of US hospital administrative data, AHRQ (2007) found the reliability of deaths in low mortality DRGs as an indicator to be good. AHRQ concluded that this is a useful indicator for use at the facility level as long as appropriate risk adjustment and disaggregation by DRG are undertaken. The analysis was regarded as able to flag potential issues for investigation, because the cause of the death might be contained in medical information not captured by the administrative data.
Indicator Source: Aus PSI
Numerator: Separations, 18 years and older, in low-mortality DRGs, defined as DRGs with a total mortality rate less than 0.5 percent over the previous three years or less than 0.5 percent in any of the previous three years nationally. (See <www.health.vic.gov.au/auspsi/technical-documents for relevant AR-DRGs>.)
Denominator: Separations with separation type of ‘death’.
Exclusions: Separations with any code for trauma, immunocompromised state or cancer. (See <www.health.vic.gov.au/auspsi/technical-documents for relevant ICD-10-AM codes>.)
Indicator type: Outcome
Disaggregation: National: Public Hospital Peer Group, Public/private hospital sector, Indigenous, Remoteness of facility, State/Territory
State/Territory: Public Hospital Peer Group, Public/private hospital sector, Indigenous, Remoteness of facility, Health service region, Facility/organisation
Facility/Organisation: Individual clinician, Indigenous
Related Indicators: 34 – Hospital Standardised Mortality Ratio 36 – Independent peer review of surgical deaths
Issues/Comments: The Agency for Healthcare Research and Quality (AHRQ) developed quality indicators (including patient safety indicators) to measure health care quality by using readily available hospital admitted patient administrative data (based on ICD-9-CM
171
codes used in the United States) (AHRQ 2006). The patient safety indicators in this set have been translated by Victoria’s Department of Human Services to suit Australian ICD-10-AM codes and conventions; they are referred to as the Aus PSIs (Department of Human Services Victoria 2009).
This indicator has been aligned with the Aus PSI indicator specification. It is recommended that the appropriateness of it be tested with Australian data.
According to AHRQ (2007), this indicator should be stratified by DRG type, that is, medical, surgical, psychiatric, obstetric, and paediatric. However, this disaggregation has not been investigated in the Australian context.
The quality of Indigenous status data is not considered to be adequate for analysis purposes for the ACT and Tasmania.
Framework elements Quality Domain: Safe, effective
Service category: Hospitals
Area of expenditure: Hospitals
National Data Comments
National data currently available Data is available from the NHMD.
Data development required None.
Disaggregations by DRG type (medical, surgical, psychiatric, obstetric, and paediatric) could be investigated.
Data source National Hospital Morbidity Database (NHMD)
Data collection arrangements Provided to the Australian Institute of Health and Welfare under the National Health Information Agreement
Data available annually
Time lag from collection to reporting: Less than 12 months after the end of the collection
year.
International comparisons available
• USA: Agency for Healthcare Research and Quality – Guide to Patient Safety Indicators
References
AHRQ 2007. Agency for Healthcare Research and Quality 2007. Guide to Patient Safety Indicators, Version 3.1, 2007. Viewed 11 September 2008 <http://www.qualityindicators.ahrq.gov/downloads/psi/psi_guide_v31.pdf>.
ARHQ 2006. AHRQ Quality Indicators, Patient Safety Indicators Overview. Viewed 9 March 2009 <http://www.qualityindicators.ahrq.gov/psi_overview.htm>
Department of Human Services Victoria 2009. Aus PSI Patient Safety Indicators. Viewed 5 March 2009 <http://www.health.vic.gov.au/auspsi>
Hannan EL, Bernard HR, O’Donnell JF and Kilburn H, Jr. 1989. A methodology for targeting hospital cases for quality of care record reviews. American Journal of Public Health 79:430-6.
172
Independent peer review of surgical deaths Indicator Number: 36
Description: Proportion of hospitals with a peer review (audit) process for in-hospital deaths related to surgery.
Indicator status: Not currently reportable – indicator and/or data development required
Rationale (clinical/policy): A surgical audit is the systematic, critical analysis of the quality of surgical care that is reviewed by peers against explicit criteria or recognised standards, and then used to further inform and improve surgical practice with the ultimate goal of improving the quality of care for patients (RACS 2008).
The original mortality audit was established in Scotland (Scottish Audit of Surgical Mortality). The template was adapted for the Australian environment and in 2001 the Western Australian Audit of Surgical Mortality (WAASM) was initiated (RACS 2009). Since this time the Australian and New Zealand Audit of Surgical Mortality (ANZASM), a bi-national initiative of the Royal Australasian College of Surgeons, was establish as a network of regional audits of surgical mortality throughout Australia and New Zealand. These audits provide a peer review assessment for each death occurring during a surgical admission (RACS 2008). Other state based versions of surgical mortality audits include the NSW Collaborative Hospitals Audit of Surgical Mortality (CHASM), Victorian Audit of Surgical Mortality (VASM) and the Queensland Audit of Surgical Mortality (QASM).
This audit process is designed to gather information on factors involved in the death of patients undergoing surgical treatment. Gathering information from multiple sources over time will allow the detection of emerging trends in the outcomes from surgical care. The aim is to identify any system or process errors and develop strategies to redress these (Eno & Spigelman 2000).
Semmens et al. (2005) conducted a prospective audit using peer review of all cases of patients who died while under the care of a Western Australian surgeon between 2002 and 2004. He concluded that the WAASM has helped to change surgical practice and emphasises the importance of ongoing systematic audit. The participation of surgeons demonstrates their commitment to accountability.
Numerator: Total number of hospitals with a peer review process for in-hospital deaths related to surgery.
Denominator: Total number of hospitals.
Indicator type: Structure
Disaggregation: National: Public hospital peer groups, Public/private sector, Remoteness of facility, State/territory
State/Territory: Public hospital peer groups, Public/private sector, Remoteness of facility, Health service region, Facility/organisation
Related Indicators: 34 – Hospital standardised mortality ratio 35 – Death in low mortality DRGs
Issues/Comments: An alternative or addition to simply looking at the proportion of hospitals that have a peer review process for surgical deaths could be to look more

173
specifically at the implementation of the process – for example looking at the number of surgical deaths that occurred in a given time period and the proportion of those that were subject to the peer review process, or looking at the findings of peer reviews and actions taken as a result.
Implementation and/or further development of this indicator may be dependent on the Accreditation work currently being undertaken by the ACSQHC. If a requirement to have an independent peer review process for surgical deaths becomes part of the accreditation process, this indicator would not be required.
Rates of participation in WAASM are reported in the WAASM 2007 annual report. All in-hospital deaths are reported to WAASM from both public and private hospitals, and all deaths in which a surgeon was involved with the care of the patient are included in the audit, whether or not the patient underwent a surgical procedure. WAASM sends the consultant surgeon associated with the case a structured proforma for completion. The completed proforma is returned to WAASM, is de-identified and then assessed by a ‘first-line’ assessor. Percentage of participation in the surgical audit is calculated on the completion and return of the proformas. The audit process is complete once the proforma has been assessed either by the first- or second-line assessor.
Framework elements Quality Domain: Effective, safe
Service category: Hospitals
Area of expenditure: Hospitals
National Data Comments
Data currently available (not national) Some states and territories have implemented, or are in the process of implementing, systems relating to audit of surgical mortality
Data development required The collection of peer review of surgical deaths in hospitals is currently collected through some jurisdictional surgical audit programs. However, these data sources are not nationally reported. Data development work could be directed at standardising and collating data from these systems.
Alternatively future data development to include an item in the National Public Hospital Establishments Database would allow for this collection at a national level.
Data source State and territory audit of surgical mortality programs
International comparisons available
• UK: Scottish Audit of Surgical Mortality

174
References
RACS 2008. Royal Australian College of Surgeons 2008. Surgical Audit and Peer Review. Melbourne: RACS.
RACS 2009. Melbourne: Royal Australian College of Surgeons. Viewed 16 April 2009, <http://www.surgeons.org>.
Eno LM and Spigelman AD 2000. A survey of surgical audit in Australia: Whiter clinical governance? Journal of Quality in Clinical Practice vol. 20 pp. 2–4.
Semmens JB, Aitken RJ, Sanfilippo FM, Mukhtar SA, Haynes NS and Mountain JA 2005. The Western Australian Audit of Surgical Mortality: advancing surgical accountability. Medical Journal of Australia vol. 183 pp. 504–8.

175
Discharge medication management for acute myocardial infarction Indicator Number: 37
Description: The proportion of patients with Acute Myocardial Infarction (AMI) without contraindications who receive a discharge prescription or supply of medication for antiplatelet medication, beta-blocker, angiotensin-modifying medication, and lipid-modifying medication.
Indicator status: Not currently reportable – indicator and/or data development required
Rationale (clinical/policy): Coronary Heart Disease including AMI has been identified as a major health issue by the National Service Improvement Framework for Heart, Stroke and Vascular Disease (NHPAC 2006) and is included in the National Health Priority Area of cardiovascular health.
Evidenced based guidelines for the management of Acute Coronary Syndromes (including AMI) were developed and published in 2006 by the National Heart Foundation and the Cardiac Society of Australia and New Zealand (NHF & CSANZ). They provide a general framework for appropriate practice, subject to clinician judgement regarding individual patients taking into account each patient’s co-morbidities and contraindications to drug treatment (NHF & CSANZ 2006). The guidelines incorporate recommendations for implementing systems of care for patients with acute coronary syndromes, the management of acute chest pain, investigations, and the management of patients with both ST-segment-elevation myocardial infarction (STEMI) and those with non-ST-segment-elevation acute coronary syndromes.
Initiating long-term therapy with a number of medications should be considered before discharge for all patients who have had an AMI (NHF & CSANZ 2006). The guidelines for management of acute coronary syndromes (NHF & CSANZ 2006) also recommends other predischarge and longer term considerations including life style advice (e.g. smoking cessation, good nutrition, moderate alcohol intake), cardiac rehabilitation programs, fish oil tablets etc.
The recommended discharge medications according to the NHF & CSANZ 2006 are:
• Antiplatelet medications
– Aspirin is recommended for all patients unless contraindicated. Clopidogrel should be given in addition to aspirin, unless contraindicated. Clopidogrel is recommended for some patients, in particular, after stent implantation, with the duration of therapy depending on the particular type of stent and circumstances of implantation. Clopidogrel may also be prescribed as an alternative when aspirin is contraindicated, or in addition to aspirin, particularly in patients with unstable angina or recurrent cardiac events.
• Beta blockers
– It is recommended that most patients be prescribed beta blockers unless contraindicated
• Angiotensin-modifying medication
– It is recommended that angiotensin-converting enzyme (ACE) inhibitor be prescribed early and its use reviewed later. For those patients in which ACE

176
inhibitors are poorly tolerated, Angiotensin II-receptor antagonists may be prescribed.
• Lipid-modifying medication
– It is recommended that Statin therapy be initiated in hospital for all patients.
• Anticoagulants
– Warfarin is recommended for those patients at high risk of systemic thromboembolism because of atrial fibrillation, mural thrombus, congestive heart failure or previous embolisation
• Nitrates
– It is recommended that all patients be prescribed a short-acting nitrate (unless contraindicated) and provided with a written action plan for chest pain
Numerator: The number of patients with a diagnosis of AMI on discharge who receive a discharge prescription or supply of medication for:
• Antiplatelet medication
• Beta-blocker
• Angiotensin-modifying medication
• Lipid-modifying medication
Denominator: The total number of patients with a diagnosis of AMI on discharge
Indicator type: Process
Disaggregation: National: Public Hospital Peer Group, Public/private hospital sector, Indigenous status, Remoteness of facility, State/Territory.
State/Territory: Public Hospital Peer Group, Public/private hospital sector, Indigenous status, Remoteness of facility, Health service region, Facility/organisation
Facility/Organisation: Individual clinician
Related Indicators: 16– Reperfusion for Acute Myocardial Infarction in hospitals
4 – Management of hypertension in general practice
Issues/Comments: Data from the NSW Towards a Safer Culture8 project from 2004–2006 shows contraindications to ACE-inhibitors are uncommon. The mean annual rate of contraindications to ACE-inhibitors was 0.8 percent. NSW TAG therefore found it would be reasonable to expect at least a 95 percent compliance rate for their indicator, patients with CHF that are prescribed appropriate medications at discharge (NSW TAG 2007).
The National Prescribing Service (NPS) is currently undertaking a project aimed at optimising Discharge Management of Acute Coronary Syndromes (DMACS) in hospitals. The main areas of the study are: the prescription of cardiovascular medications; education on lifestyle modifications; and communication with patients and GPs. Key findings include:
• Among 1,545 patients with a discharge diagnosis of ACS, guideline-recommended therapies were prescribed most frequently - antiplatelet agents (97%) and statins (92%), compared with angiotensin-modifying drugs (78%) and beta blockers (75%)
• 57 percent of 1,545 patients with diagnosis of ACS were referred to cardiac rehabilitation before discharge.

177
The final results of the DMACS project are expected by December 2009 (NPS 2009). This indicator definition has been aligned with the NPS DMACS project.
Framework elements Health needs domain: Getting better
Quality Domain: Appropriate
Service category: Hospitals
NHPA: Cardiovascular health
Burden of disease: Cardiovascular disease
Disease expenditure: Cardiovascular
Area of expenditure: Hospitals
National Data Comments
Data currently not available
Data development required An audit similar to the Discharge Management of Acute Coronary Syndromes project conducted by the NPS could be replicated on a national level.
International comparisons available
• OECD: Health care quality indicators project – Selecting Indicators for Quality of Cardiac Care at the Health Systems Level in OECD Countries (prescription of Aspirin, ACE inhibitor, Beta-blocker and Statin reported as separate indicators)
• USA: Agency for Healthcare Research and Quality - National Healthcare Quality Report (prescribed aspirin, beta-blocker, ACE inhibitor or A2-receptor antagonist)
• USA: Joint Commission on Accreditation of Healthcare Organization - Core Hospital Indicators (prescribed aspirin, beta-blocker, ACE inhibitor)
References
NHF & CSANZ 2006. The National Heart Foundation of Australia and The Cardiac Society of Australia and New Zealand 2006. Guidelines for the management of acute coronary syndromes 2006. Medical Journal of Australia; 2006 Apr 17; 184 (8 Suppl);S9-S29.
NHPAC 2006. National Health Priority Action Council 2006. National Service Improvement framework for heart, stroke and vascular disease. Canberra: Australian Government. Department of Health and Ageing
National Prescribing Service (NPS) 2009. NPS audit reveals positive prescribing practices in hospitals. Medial release. 18 March . Sydney.
NSW TAG (NSW Therapeutic Advisory Group) August 2007. Indicators for Quality Use of Medicines in Australian Hospitals. <http://www.ciap.health.nsw.gov.au/nswtag/publications/QUMIndicators/1.2.pdf>
178
Timely transmission of discharge summaries Indicator Number: 38
Description: Proportion of hospital patients with discharge summaries transmitted to the patient’s General Practitioner within recommended timeframes after discharge.
Indicator status: Concept proposed for further development
Rationale (clinical/policy): Transition, or discharge, planning is particularly crucial in providing high quality care, and particularly for patients with complex care needs, such as those with certain chronic diseases, who are more likely to have physical, social, and/or cognitive impairments that place them at greater risk in the community (CCU 2003, Preen et al. 2005).
The discharge summary document is an essential vehicle for communication between hospitals and general practitioners; it provides clinical and administrative information necessary for continuity of care (Callen & Alderton 2007).
Numerator: Separations for patients for whom a discharge summary is transmitted to the patient’s General Practitioner within recommended timeframes after discharge
Denominator: All separations
Exclusions: Separations for repeat treatments such as chemotherapy and renal dialysis.
Indicator type: Process
Disaggregation: National: Indigenous status, Remoteness of facility, Public Hospital Peer Group, Public/private hospital sector, State/Territory
State/Territory: Indigenous status, Remoteness of facility, Public Hospital Peer Group, Public/private hospital sector, Health service region, Facility/organisation
Related Indicators: 45 – Unplanned hospital re-admissions 47 – Selected potentially preventable hospitalisations 40 – Post-discharge community care for mental health patients 53 – Patient experience
Issues/Comments: A definition of and agreed standard for discharge summaries will need to be developed. The definition should include the recommended requirements and specify data elements that would be considered mandatory. For example, a detailed current medicines list could be a mandatory component and include comment about those medicines that have changed during admission.
Agreement will need to be reached on what the recommended timeframe should be. Commonly suggested timeframes are 24 hours or 48 hours, however factors including method of transmission, time of discharge, and accuracy and quality of the information need to be taken into account.
Consideration should also be given to extending the indicator to include discharge summaries sent to all health care providers responsible for the patient’s care, not just general practitioners.
179
Framework elements Health needs domain: Getting better
Quality Domain: Effective, appropriate, continuous
Service category: Hospitals
Area of expenditure: Hospitals
National Data Comments
Data currently not available
Data development required The National Hospital Morbidity Database (NHMD) could potentially be modified to include a data item on whether a discharge summary had been transmitted to the patient’s general practitioner, and/or at what time after discharge.
Data source To be confirmed
Data collection arrangements To be confirmed
No international comparisons available
References
Callen JL and Alderton M 2007. Are general practitioners satisfied with electronic discharge summaries? Health Information Management Journal 36(1) 2007
CCU 2003. Continuing Care Unit - Metropolitan Health and Aged Care Division 2003. Improving patient transition from hospital to the community: A good practice guide for hospitals. Melbourne: Victorian Government Department of Human Services.
Preen DB, Bailey BE, Wright A, Kendall P, Phillips M, Hung J et al. 2005. Effects of a multidisciplinary, post-discharge continuance of care interventions on quality of life, discharge satisfaction, and hospital length of stay: a randomised controlled trial. International Journal for Quality in Health Care 17:43-51.
180
Mental health admitted patients having seclusion Indicator number: 39
Description: This indicator measures the frequency at which seclusion is used for public mental health patients.
Indicator status: Not currently reportable – indicator and/or data development required
Rationale (clinical/policy): The use of seclusion in public sector mental health service organisations is regulated under legislation and/or policy of each jurisdiction. High levels of seclusion are widely regarded as inappropriate treatment because it creates significant risks for people with mental illness, including serious injury or death, re-traumatisation of people who have a history of trauma, loss of dignity and other psychological harm (DoH WA 2006).
The National safety priorities in mental health: a national plan for reducing harm (NMHWG 2005) is the first national statement about safety improvement activity in mental health. The reduction, and where possible, elimination of seclusion in mental health services has been identified as a priority in this national plan.
In 2008 the Australian Health Minister's Advisory Council’s Mental Health Standing Committee endorsed seclusion as a Key Performance Indicator for the national framework (NMHPS 2008)
Indicator Source: Key Performance Indicators for Australian Public Mental Health Services
Endorsement: Australian Health Minister's Advisory Committee's Mental Health Standing Committee
Numerator: Total number of admitted patient seclusion events occurring in public mental health services.
Denominator: Total number of accrued patient days within the public mental health services
Indicator type: Outcome
Disaggregation: National: State/Territory, target population (see issues/comments
below)
State/Territory: Hospital peer group, target population (see issues/comments below), Health service region, Mental health service organisation
Facility/Organisation: Target population, Duration of seclusion
Related indicators: 6 – Mental health care plans in general practice
40 – Post-discharge community care for mental health patients
Issues/Comments: The use of seclusion registers is governed by either legislation or mandatory policy within each State or Territory. However, these data sources are not nationally reported (see data development required below).
The duration of seclusion may be a useful piece of information to augment an indicator of the frequency of seclusion as it would provide more information on the performance of services. However, capacity to collect information regarding duration varies substantially across jurisdictions.

181
Public sector specialised mental health services categorise four target population groups. ‘Child and adolescent’ services focus on people aged less than 18 years. ‘Older person’ services focus on those aged over 65 years. ‘Forensic’ services focus on people whose mental health condition has led them to commit, or be suspected of, a criminal offence or make it likely that they reoffend without adequate treatment of containment. ‘General’ services focus on the adult population aged 18 to 64 years (AIHW 2008).
The use of seclusion has not been authorised for community residential facilities in any jurisdiction.
The applicability to private hospitals, and other health care settings, could be investigated as a part of possible future expansion of the scope of this indicator.
Framework elements Health needs domain: Getting better
Quality Domain: Appropriate, safe, responsive
Service category: Specialised health services
NHPA: Mental health
Burden of disease: Mental disorders
Disease expenditure: Mental disorders
Area of expenditure: Hospitals
National Data Comments
National data not available Admitted patient data (including designated units in public hospitals and public psychiatric hospitals) are collected through the National Hospital Morbidity Database (NHMD) which could be used as a source to report the denominator data.
Sub-national data is available for those health care organisations reporting the Australasian Council of Healthcare Standards (ACHS) Mental Health Inpatient Indicators.
Data development required The collection of seclusion data through jurisdictional seclusion registers which is a requirement under seclusion legislation. However, these data sources are not nationally reported. Data development work could be directed at standardising and collating data from these systems.
Alternatively future data development to include an intervention code for seclusion in the Australian Classification of Health Interventions would allow collection of this indicator through the NHMD.
Data source See above
Data collection arrangements See above
No international comparisons

182
Presentation of available data
0.0
2.0
4.0
6.0
8.0
10.0
12.0
2001 2002 2003 2004 2005 2006 2007
Rate per 100 admitted patients
Note:
1. The numerator and denominator presented above are not consistent with the proposed safety and quality indicator.
2. The rate reported is per 100 inpatients.
3. Reported as a mean rate over all organisations submitting data.
Source: ACHS 2008.
Instances of at least one episode of seclusion for admitted patients, 2001–2007 (per 100 admitted patients)
What these data show
• The number of seclusion episodes per 100 admitted patients in reporting hospitals ranged from about 9.5 to 11.0 between 2001 and 2007.
References
ACHS 2008. Australian Council on Healthcare Standards 2008. Australasian Clinical Indicator Report: 2001-2007. Sydney: ACHS.
AIHW 2008. Australian Institute of Health and Welfare 2008. Mental health services in Australia 2005–06. Canberra: AIHW
DoH WA 2006. Department of Health, Government of Western Australia 2006 Operational Circular 13 April 2006
NMHPS 2008. National Mental Health Performance Subcommittee 2008. Key Performance Indicators for Australian Public Mental Health Services: Technical Specification Summary, June 2008. Accessed 14 April 2009.

183
<http://www.mhnocc.org/Benchmarking/KPI%20Specifications_Revised%20Summary_20080730.pdf>
NMHWG 2005. National Mental Health Working Group 2005. National safety priorities in mental health: a national plan for reducing harm. Canberra: Commonwealth of Australia.

184
Post-discharge community care for mental health patients Indicator number: 40
Description: Proportion of separations from the mental health service organisation's acute inpatient unit(s) for which a community ambulatory service contact was recorded in the seven days immediately following that separation.
Indicator status: Currently reportable – as per recommended specification
Rationale (clinical/policy): Discharge from hospital is a critical transition point in the delivery of mental health care. People who leave hospital after an admission for an episode of mental illness have heightened vulnerability, and without adequate follow-up, they may relapse or be readmitted. It is also a period of great stress and uncertainty for families and carers (ISC 2004).
A responsive community support system for persons who have experienced an acute psychiatric episode requiring hospitalisation is essential to maintain clinical and functional stability and to minimise the need for hospital readmission (ISC 2004).
Indicator Source: Key Performance Indicators for Australian Public Mental Health Services
Endorsement: National Mental Health Working Group of the Australian Health Ministers Advisory Council: endorsed 2005
Numerator: Number of separations from the mental health service organisation's acute inpatient unit(s) for which a public sector community mental health contact was recorded in the seven days immediately following that separation.
Denominator: Total number of separations for the mental health service organisation's acute inpatient unit(s).
Exclusions:
• Same day separations
• Separations due to death
• Separations where the patient left against medical advice
• Statistical and change of care type separations
• Separations that end by transfer.
Indicator type: Process
Disaggregation: National: Remoteness, Program type, State/Territory, Target population (see issues/comments below)
States/Territories: Remoteness, Program type, Target population, Health service region, Facility/organisation
Facility/Organisation: Target population, Program type
Related Indicators: 6 – Mental health care plans in general practice
38 – Timely transmission of discharge summaries

185
39 – Mental health inpatients having seclusion
45 – Unplanned hospital re-admissions
Issues/Comments: Post-discharge community care (community mental health contacts) can include either face-to-face, telephone or video link service delivery modes. Service contacts would either be with a client, carer or family member or another professional or mental health worker involved in providing care and do not include contacts of an administrative nature (e.g. telephone contact to schedule an appointment) except where a matter would need to be noted on a patient's record (AIHW 2005).
Public sector specialised mental health services categorise four target population groups. ‘Child and adolescent’ services focus on people aged less than 18 years. ‘Older person’ services focus on those aged over 65 years. ‘Forensic’ services focus on people whose mental health condition has led them to commit, or be suspected of, a criminal offence or make it likely that they reoffend without adequate treatment of containment. ‘General’ services focus on the adult population aged 18 to 64 years (AIHW 2005).
A time period of seven days has been adopted as an initial basis for the measurement of follow up community care pending empirical review. As an alternative to setting a seven-day threshold and only counting contacts within that period, this indicator could instead measure median days between last contact and admission.
It should be noted that no single pathway or treatment that is appropriate to all mental health consumers exists. The pathways are complex and impacted on by a range of clinical, demographic and social issues. However, this is addressed by having a broad definition of ‘follow-up’. For example, a 10 minute telephone call and a face-to-face visit are both categorised as ‘follow-up’.
This indicator currently captures activity only in the public sector.
Framework elements Health needs domain: Getting better
Quality Domain: Appropriate, continuous, accessible
Service category: Primary care and community health services, Specialised health services
NHPA: Mental health
Burden of disease: Mental disorders
Disease expenditure: Mental disorders
Area of expenditure: Medical services, Community health and other
National Data Comments
National data currently available The current indicator was developed to be feasible within existing data collection arrangements.
Data development required Data development is required around the scope of collection (currently only public sector), program type (adult, children and adolescent, older persons, forensic), and to link inpatient with community data (i.e. move to a unique state-wide patient identifier or statistical linkage mechanisms)

186
Further work would be required to determine the availability and usefulness of private sector data.
Data source National Minimum Data Set (NMDS): Community Mental Health Care/Admitted Patient Mental Health Care
Data collection arrangements Provided to the Australian Institute of Health and Welfare under the National Health Information Agreement
International comparisons available
• OECD: Health care quality indicators project – Selecting Indicators for Quality of Mental Health Care at the Health Systems Level in OECD Countries(7 and 30 days post-discharge) (Proposed indicator only)
Presentation of available data
0
10
20
30
40
50
60
70
80
VIC QLD WA ACT NT NSW SA TAS
Percent
2005-06 2006-07
Notes
1. NSW, SA and Tasmania differ from the other jurisdictions by having less capacity to track post-discharge follow-up between hospitals and community service organisations, due to lack of unique patient identifier or data matching systems. This can contribute to an appearance of lower follow-up rates for these jurisdictions.
2. The numerator, denominator and disaggregation of indicator as presented above is consistent with the proposed safety and quality indicator
Source: COAG National Action Plan on Mental Health – Progress Report 2006-07.
Post-discharge mental health patients receiving 7-day community follow-up, State and Territory mental health services, 2005–06 to 2006–07 (percent).

187
What these data show
• For those jurisdictions with more capacity to track post-discharge follow-up (see Note above), the Australian Capital Territory had the highest rate of follow-up while the Northern Territory had the lowest rate during 2006–07 (73% and 36% respectively)
References
AIHW 2005. Service contact. Canberra: AIHW. Viewed 4 September 2008, <http://meteor.aihw.gov.au/content/index.phtml/itemId/268983>.
ISC 2004. Information Strategy Committee AHMAC National Mental Health Working Group 2004. Key Performance Indicators for Australian Public Mental Health Services Viewed: 13 August 2008, <http://www.mhnocc.org/Benchmarking/Key%20Performance%20Indicators%20for%20Australian%20Public%20Mental%20Health%20Services.pdf>.

188
Quality of palliative care Indicator number: 41
Description: Quality of palliative care as assessed by patients, carers and palliative care workers
Indicator status: Concept proposed for further development
Rationale (clinical/policy): The WHO (2007: 3) define palliative care as, ‘an approach that improves the quality of life of patients and their families facing the problems associated with life-threatening illness, through the prevention and relief of suffering by means of early identification and impeccable assessment, and treatment of pain and other problems – physical, psychological and spiritual.’
Ideally, palliative care:
• Provides relief from pain and other distressing symptoms
• Affirms life and regards dying as a normal process
• Intends neither to hasten or postpone death
• Integrates psychological and spiritual aspects of patient care
• Offers a support system to help patients live as actively as possible until death
• Offers a support system to help the family cope during the patient’s illness and in bereavement
• Uses a team approach to address the needs of patients and their families, including bereavement counselling if indicated
• Will enhance quality of life, and may also positively influence the course of illness
• Is applicable early in the course of illness, in conjunction with other therapies that are intended to prolong life, such as chemotherapy or radiation therapy, and includes those investigations needed to better understand and manage distressing clinical complications (PCA 2005).
In Australia during 2005–06, there were 25,741 palliative care separations from Australian hospitals for admitted patients who received care in a specific hospice or palliative care unit within a hospital, according to a palliative care program, or where the principal clinical intent was deemed to be palliative. Currently, no national data are available about the number of palliative care services that are delivered in non-admitted settings, such as through community health services (AIHW 2008).
The National Palliative Care Strategy: A National Framework for Palliative Care Service Development (October 2000) is aimed at supporting the development and provision of best practice palliative care across Australia to those who need it, so that people who are dying have access to an appropriate service, at the right time, and in the right place. The Strategy has three goals:
• Awareness and understanding
• Quality and effectiveness
• Partnerships in care (DoHA 2000).
The Palliative Care Outcomes Collaboration (PCOC) is a collaboration between four Australian universities which aims to develop and support a national benchmarking system that will contribute to improved palliative care outcomes. In September 2008 the PCOC
189
published the report Patient and Carer Experiences National Survey Results. There were two survey tools which were used to gather the patient and carer responses: the Patient Outcome Scale (POS) 2 and the FAMCARE 2 (PCOC 2008).
Responses sought from patients include:
• Over the past three days, have you been affected by pain?
• Over the past three days, have other symptoms (e.g. feeling sick, having a cough or constipation) been affecting how you feel?
Responses sought from carers include:
• The way in which the patient’s condition and likely progress have been explained by the palliative care team
• Speed with which symptoms are treated.
A survey tool, such as that being utilised by the PCOC, may provide the basis for National reporting on safety and quality of palliative care. However, final decisions regarding what are the most appropriate measures for national reporting on the safety and quality of palliative care will require further investigation and consultation (see Issues/comments below). The indicator would be an outcome indicator if modelled on the patient questions above.
Numerator: To be determined
Denominator: To be determined
Indicator type: Outcome
Disaggregation: To be determined (see issues/comments below)
Related Indicators: 50 – Cancer survival 53 – Patient experience
Issues/Comments: The usefulness of survey tools, such as that being utilised by the PCOC, for national reporting on the safety and quality of palliative care services would have to be evaluated.
Some of the challenges in developing a comprehensive national indicator(s) for the safety and quality of palliative care services include:
• Palliative care can occur in a variety of settings, including:
– The patient’s home
– Community settings
– Admitted patient palliative care units in hospitals (Public and private sectors)
– Other locations in hospitals (Public and private sectors).
• A wide variety of people can be involved in providing palliative care, including:
– Medical practitioners, including GPs, palliative care specialists, and other specialist physicians
– Nurses, including specialist and generalist nurses
– Allied health professionals, including psychologists and pharmacists
– Aboriginal health workers
– Support workers, including nurse assistants and personal care attendants.

190
In addition, as mentioned above, there are currently no national data are available regarding the number of palliative care services that are delivered in non-admitted settings, such as through community health services and in the home.
Development work would be required to identify the scope of palliative care that is delivered to non-admitted patients. Further work would then be required to determine what coverage a national indicator of the safety and quality of palliative care services would have for non-admitted palliative care.
Framework elements Health needs domain: Coping with end of life
Quality Domain: Effective, appropriate, safe, accessible
Service category: Specialised health services
Area of expenditure: Medical services, Hospitals, Community health and other
National Data Comments
National data not available
Data development required To be determined
Data source To be determined
No international comparisons available
References
AIHW 2008. Australian Institute of Health and Welfare 2008. Australia’s health 2008. Canberra: AIHW.
PCOC 2008. Palliative Care Outcomes Collaboration 2008. Patient and Carer Experiences
National Survey Results. Accessed 14 April 2009.
<http://chsd.uow.edu.au/pcoc/documents/national_report_patient_and_carer_experiences_sept08.pdf>
DOHA 2008. Australian Government Department of Health and Ageing. Palliative Care. Accessed 9 September 2008. <http://www.health.gov.au/internet/main/publishing.nsf/Content/Palliative+Care-1>
DoHA 2000. Australian Government Department of Health and Ageing. The National Palliative Care Strategy. Accessed 14 April 2009.
<http://www.health.gov.au/internet/main/publishing.nsf/Content/palliativecare-pubs-npcstrat.htm~palliativecare-pubs-npcstrat-3.htm>
NHHRC 2009. National Health and Hospital Reform Commission 2009. A Healthier Future For All Australians – Interim Report December 2008. Canberra: Commonwealth of Australia.
PCA 2005. Palliative Care Australia 2005. Standards for Providing Quality Palliative Care for all Australians. Canberra: PCA.
WHO 2007. World Health Organisation 2007. Cancer Control, Knowledge into Action: Palliative Care. Geneva: WHO

191
Functional gain achieved in rehabilitation Indicator number: 42
Description: Proportion of patients discharged from a completed rehabilitation program for which there is documented evidence of functional gain.
Indicator status: Currently reportable – data development required to meet recommended specification
Rationale (clinical/policy): According to the Australasian Faculty of Rehabilitation Medicine (AFRM) of the Royal Australasian College of Physicians (RACP), rehabilitation programs aim to help people with loss of function or ability due to injury, disease, impairment or disorder. Rehabilitation:
• Maximises the person’s level of independence (physically, psychologically and socially)
• Restores lost function
• Prevents new or further functional loss (AFRM 2008).
Rehabilitation care is care in which the clinical intent or treatment goal is to improve the functional status of a patient with an impairment, disability or handicap. A key aspect of a rehabilitation program is assessment of function, which should include both cognitive and physical function, to assess improvement. This may be through the use of a standardised instrument, such as the UB Foundation Activities’ Functional Independence Measure (FIMTM). The Australian Rehabilitation Outcomes Centre’s minimum data set for rehabilitation includes the FIM instrument as the functional assessment tool (AROC 2005).
The Council of Australian Governments (2008) has a focus on Australia’s sub-acute health care services, including rehabilitation, through the National Partnership (NP) agreement on Hospital and Health Workforce Reform. The NP contains the performance indicator ‘patient outcomes’ (C18) which includes mention of FIMTM measure for rehabilitation.
Indicator Source: Australian Council of Health Care Standards (ACHS) Version 4 Rehabilitation Medicine Clinical Indicators (as developed in consultation with the Australasian Rehabilitation Outcomes Centre (AROC))
Numerator: Total number of patients discharged from a completed rehabilitation program (see issues/comments) for whom there is documented evidence of functional gain. A functional assessment score is measured on admission and on discharge. If the functional assessment score is higher on discharge than on admission the outcome is functional gain achieved.
Denominator: Total number of patients discharged from a completed rehabilitation program.
Indicator type: Outcome
Disaggregation: National: AN-SNAP class (see issues/comments below), Public Hospital Peer Group, Public/private hospital sector, Indigenous status, remoteness of facility, State/territory
State/Territory: Age, AN-SNAP class (see issues/comments below), Public Hospital Peer Group, Public/private hospital sector,

192
Indigenous status, remoteness of facility, Health service region, Facility/organisation
Facility/Organisation: AN-SNAP class
Related Indicators: 5 – Management of arthritis and musculoskeletal conditions
16 – Stroke patients treated in a stroke unit
Issues/Comments: A completed rehabilitation program occurs when a patient finishes their program and undergoes a functional assessment prior to episode end. Patients who die or those who have a suspension of rehabilitation treatment that leads to a care type change to acute care are not counted as having completed their rehabilitation program.
It is recognised that most rehabilitation patients achieve some level of functional improvement. However, this indicator provides a measure as to what proportion of patients are actually achieving functional gain and thus (indirectly) of the effectiveness of the rehabilitation program.
AROC currently reports rehabilitation functional gains by each of 16 Australian National Sub-acute and Non-acute Patient (AN-SNAP) classes. A national safety and quality indicator could report data for each of the 16 classes, or for different subcategories of rehabilitation patients.
The ACHS version four rehabilitation indicators include an indicator of functional gain achieved by patients that have completed a rehabilitation program, developed in conjunction with AROC. However, this indicator was only trialled for the first time in 2008, and so published data are not currently available.
The FIMTM instrument is a proprietary instrument. Development work could be undertaken to assess the suitability of other instruments which can be used to measure functional gain.
There has been an increasing emphasis on the provision of ambulatory rehabilitation. However, at this time there is a lack of information collected from this section of the rehabilitation sector which could inform this proposed indicator. As such, this indicator is currently only specified for admitted patients. Ideally though, functional gain for patients of non-admitted rehabilitation care would also be included.
Framework elements Health needs domain: Living with chronic conditions
Quality Domain: Appropriate, continuous, accessible
Service category: Specialised health services
Area of expenditure: Medical services, Community and other, Other health practitioners
National Data Comments
Data currently available (not national) Sub-national data reported by AROC (Simmonds and Stevermuer 2008). Sub-national (including New Zealand) data currently being collected by ACHS
Data development required Admitted patient data are collected through the National Hospital Morbidity Database (NHMD).

193
Enhancement of the NHMD could allow this to be used as a possible source to report on this indicator.
Data source To be determined
Data collection arrangements To be determined
No international comparisons available
Presentation of available data
0 5 10 15 20 25
Stroke
Brain dysfunction
Neurological conditions
Spinal cord dysfunction
Amputation of limb
Arthritis
Orthopaedic conditions
Orthopaedic fractures
Orthopaedic: joint replacements
Pulmonary
Debility
Other impairments
Other disabling impairments
Mean improvement in FIM Measure
Note: The numerator and denominator as presented above are not consistent with the proposed safety and quality indicator.
Source: Simmonds & Stevermuer 2008.
Mean improvement in Functional Independence Measure by AN-SNAP category, 2006
What these data show
• On average, there was an improvement in the average FIM score for all AN-SNAP categories
• The categories of Brain function and Stroke achieved the highest mean improvement in FIMTM during 2006.

194
References
ACHS (Australian Council of Health Care Standards) 2008. Rehabilitation Medicine Indicators Clinical Indicator Users’ Manual. Version 4 for Use in 2008. <http://chsd.uow.edu.au/aroc/documents/rehabilitation_indicators_v4_trial.pdf>
AFRM (Australasian Faculty of Rehabilitation Medicine) 2008. Submission to the National Health and Hospitals Reform Commission. <http://afrm.racp.edu.au/index.cfm?objectid=0F7AE593-9D8B-CDD1-A2096977C34069AA>
AROC 2005. Change in Functional Independence Measure (FIM) Item Scores, as a Measure of Outcome in Orthopaedics in Australia, 2005. Accessed 10/03/2009
<http://chsd.uow.edu.au/aroc/documents/05_06/ahoc_fim_poster.pdf>
Council of Australian Governments, 2008. National Partnership Agreement on Hospital and Health Workforce Reform. Viewed 20 March 2009. <http://www.coag.gov.au/intergov_agreements/federal_financial_relations/docs/national_partnership/national_partnership_on_hospital_and_health_workforce_reform.rtf>
Simmonds F and Stevermuer T 2008. The AROC Annual Report: the state of rehabilitation in Australia 2006. Australian Health Review 32 (1):85-110.

195
Multidisciplinary care plans in sub-acute care Indicator Number: 43
Description: Proportion of patients beginning a sub-acute care program or transiting between sub-acute services that have an agreed multidisciplinary care plan.
Indicator status: Concept proposed for further development
Rationale (clinical/policy): The Council of Australian Governments (2008) has recognised the importance of Australia’s sub-acute health care services within the National Partnership Agreement on Hospitals and Health Workforce Reform. For the purposes of this agreement sub-acute care is defined to include rehabilitation, palliative care, geriatric evaluation management, and psychogeriatric care. Under this agreement, jurisdictions will be eligible to receive a proportional share (based on age-weighted population) of $500m available from the Commonwealth in 2008/9 to fund enhancements to sub-acute care services as per the agreed implementation plan over the five years between 2008–09 and 2012–13. The performance indicators to demonstrate improved service delivery include expansion of the multidisciplinary sub-acute workforce (C11) and evidence of agreed multidisciplinary care plans (C19).
This agreement comes as part of a growing awareness of the importance of multidisciplinary care plans in sub-acute care. The National Chronic Disease Strategy (NHPAC 2005) endorsed a ‘self-management’ model which puts the patient at the centre of a coordinated multidisciplinary care plan for patients whose chronic condition requires the engagement of multiple specialties. NSW Health (2006) endorsed the same approach for the chronically ill and nominated the responsibility of care coordination to be managed either by a single care coordinator or by various members of the multidisciplinary team. Explicit support for a multidisciplinary approach to sub-acute care has been repeatedly advanced by Australia’s care provider communities in the areas of rehabilitation (Simmonds & Stevermuer 2008), palliative (Davidson et al. 2004; Hudson et al. 2008), and geriatrics (ASGM 2005).
Numerator: Number of patients with an agreed multidisciplinary health care plan at transition points beginning or between sub-acute care services
Denominator: Number of instances of a patient starting on a sub-acute health care program or transiting between sub-acute care services
Indicator type: Process
Disaggregation: To be determined
Related Indicators: 1 – Enhanced Primary Care services in General Practice
39 – Functional gain in Rehabilitation
Framework elements Health needs domain: Living with chronic conditions
Quality Domain: Appropriate, continuous
Service category: Primary care and community health services
Area of expenditure: Medical services, Community health and others, Other health practitioners

196
National Data Comments
National data currently not available
Data development required
No data source or data collection arrangements
No international comparisons available
References
ASGM 2005. Australian Society for Geriatric Medicine 2005. Position Statement No. 5: Orthogeriatric Care – revised 2005. Australasian Journal on Ageing 24 (3):178-83.
Australian Government 2008. Towards a National Primary Health Care Strategy: A discussion paper from the Australian Government. Canberra: Department of Health and Ageing.
Council of Australian Governments, 2008. National Partnership Agreement on Hospital and Health Workforce Reform. Viewed 20 March 2009. <http://www.coag.gov.au/intergov_agreements/federal_financial_relations/docs/national_partnership/national_partnership_on_hospital_and_health_workforce_reform.rtf >
Davidson PM, Glenn P, Introna KRN, et al., 2004. Integrated, collaborative palliative care in heart failure: The St. George Heart Failure Service experience. The Journal of Cardiovascular Nursing 19 (1):68-75.
Gray LC, Travers CM, Bartlett HP, et al., 2008. Transition care: will it deliver? Medical Journal of Australia 188 (4):251-53.
Hudson P, Quinn K, O’Hanlon B, Aranda S, 2008. Family meetings in palliative care: multidisciplinary clinical practice guidelines. BMC Palliative Care 7:12.
Mitchell GK, Tieman JJ, Shelby-James TM, 2008. Multidisciplinary care planning and teamwork in primary care. Medical Journal of Australia 188 (8 Suppl):S61-S64.
NHPAC 2005. National Health Priority Action Council 2005. National Chronic Disease Strategy. Endorsed by the Australian Health Ministers’ Conference. Canberra: Australian Government Department of Health and Ageing.
NSW Department of Health, 2006. NSW Chronic Care Program Phase Three: 2006–09, NSW Chronic Disease Strategy. Sydney: NSW Department of Health.
Preen DB, Bailey BES, Wright, A., et al., 2005. Effects of a multidisciplinary, post-discharge continuance of care intervention on quality of life, discharge satisfaction, and hospital length of stay: a randomized control trial. International Journal for Quality in Health Care 17 (1):43-51.
Simmonds F & Stevermuer T 2008. The AROC Annual Report: the state of rehabilitation in Australia 2006. Australian Health Review 32 91):85-110.

197
Oral health in residential aged care Indicator Number: 44
Description: The proportion of older people living in residential aged care facilities who have an oral health care plan
Indicator status: Not currently reportable – indicator and/or data development required
Rationale (clinical/policy): Australia’s National Oral Health Plan 2004-2013 was prepared by The National Advisory Committee on Oral Health (NACOH) and endorsed by Health Ministers in 2004. The Plan addresses seven action areas:
• Promoting oral health across the population
• Children and adolescents
• Older people
• Low income and social disadvantage
• People with special needs
• Aboriginal and Torres Strait Islander peoples
• Workforce (NACOH 2004).
According to the NACOH (2004), oral disease is more prevalent amongst older people (65 years or older) than the general community, with one survey in 1987–8 finding a 90 percent prevalence of periodontal disease amongst 60-90 year olds. In addition, people with cognitive impairment are at a particular risk of oral disease, and a literature review by Pearson and Chalmers (2004) identified people with dementia in residential care as a group at very high risk. Oral disease is not only uncomfortable or painful but can also make eating and talking difficult, and is significantly associated with poorer general wellbeing amongst residential care residents (AIHW:DSRU 2001).
According to the NACOH (2004), as Australia's population continues to age, and as the retention of natural teeth into advanced age continues to improve, so chronic degenerative problems such as tooth wear, tooth fracture, root caries and necrosis of the dental pulp are expected to affect a greater proportion of the population. Based on the National Dental Telephone Interview Survey 2002 (AIHW:DSRU 2006), older people received a filling at their last dental visit at a higher rate (52%) than any other age group (30%-50%, increasing with age).
The availability of residential age care places (under an increasing variety of schemes) has increased from 93 places per 100,000 Australian residents 70 years or older in the late 1990s, to nearly 110 such places in 2007, and the care dependency of the residents has increased over the same period (AIHW 2008). Thus, targeting the oral health of older people through residential care programs helps an increasingly larger proportion of Australia's population and a segment at particular risk of oral disease.
On March 1, 2009, the Nursing Home Oral and Dental Health Plan was announced. Two of the stated goals of the Plan are to:
• Establish a nationally consistent approach to dental assessments undertaken as part of the Aged Care Assessment Team (ACAT) process.
• Provide a specifically developed national training package for aged care workers

198
The Oral Health Assessment Toolkit is to be included in the proposed set of assessment tools, and the learnings from the Encouraging Best Practice in Residential Aged Care (EBPRAC) program will be incorporated into the training program. The Better Oral Health in Residential Care project is one of five EBPRAC projects which are currently underway which covers: Oral health assessments; Oral health care planning; Daily oral hygiene; and Dental referrals.
Indicator Source: ‘Australia's National Oral Health Plan 2004-2013’ (National Advisory Committee on Oral Health 2004)
Numerator: Residential care population 65 years or older with an oral health care plan
Denominator: Population aged 65 years or older in residential care
Indicator type: Process
Disaggregation: National: Remoteness of facility, Care needs of residents (see issues/comments below)
Facility/Organisation: Care needs of residents
Related Indicators: 23 - Malnutrition in care settings
Issues/Comments: MBS item 731 was considered as a possible source of numerator data for this indicator. This item can be utilised if a GP contributes to a multidisciplinary care plan, including oral health plans. However, the MBS item is not sufficiently specific for identifying oral health plans, as it can also be utilised for other multidisciplinary care planning in residential aged care. In addition, the MBS item would not identify oral health plans which are prepared by registered nurses and other health professionals.
As the Nursing Home Oral and Dental Health Plan has yet to be finalised and implemented, the effect on the processes and regulatory requirements associated with performing oral health assessments and preparing oral health plans is unknown.
The findings of the proposed review of the Aged Care Accreditation Standards, and any future recommendations relating to the assessment of residential aged care residents and facilities, specifically relating to the oral health of residents will need to be considered in any future operationalisation of this proposed indicator.
The Aged Care Funding Instrument (ACFI) database, which is held by the Department of Health and Ageing, contains data relating to the classification of care needs of residents as determined by Aged Care Assessment Teams. Residents are classified as having low, medium or high care needs in each of the following areas:
• Activities of daily living
• Behaviour
• Complex health care.
The proposed indicator could be expanded to consider the performance of oral health assessments as well as preparation of oral health plans and dental referrals.
Framework elements Health needs domain: Staying healthy
Quality Domain: Appropriate, effective, continuous
Service category: Residential aged care
Disease expenditure: Oral health
199
National Data Comments
Data currently not available
Data development required What constitutes an oral health plan would need to be clearly defined.
Data source To be determined
No international comparisons available
References
AIHW 2008. Australian Institute of Health and Welfare 2008. Residential Aged Care in Australia 2006-07 A Statistical Overview. Canberra: AIHW.
AIHW:DSRU 2001. Dental Statistics and Research Unit: Chalmers JM, Carter KD, Hodge CP, Fuss JM and Spencer AJ 2001. The Adelaide Dental Study of Nursing Homes: One-year Follow-up 1999. Canberra: AIHW.
AIHW:DSRU 2006. Dental Statistics and Research Unit 2006. Access to Dental Services among Australian Children and Adults. Canberra: AIHW.
DoHA 2007. Department of Health and Ageing 2007. Guidelines for the Aged Care GP Panels Initiative August 2007 - Chapter 8 Related Initiatives. <http://www.health.gov.au/internet/main/publishing.nsf/Content/aged-care-gp-toc~aged-care-gp-initiative-ch8>
McCarty CA, Lloyd-Smith CW, Lee SE, Livingston PM, Stanislavsky YLand Taylor HR 1998. Use of eye care services by people with diabetes: the Melbourne Visual Impairment Project. British Journal of Ophthalmology 82: 410-14.
NACOH 2004. National Advisory Committee on Oral Health 2004. Australia's National Oral Health Plan 2004-2013. Adelaide: NACOH.

200
Unplanned hospital re-admissions Indicator Number: 45
Description: Proportion of unplanned/unexpected hospital re-admissions within 28 days of discharge for selected surgical admissions.
Indicator status: Currently reportable – data development required to meet recommended specification
This indicator is to be reported under the National Healthcare Agreements.
Rationale (clinical/policy): Unplanned and unexpected re-admissions to a hospital may reflect less than optimal patient management and ineffective care pre-discharge, post discharge and/or during the transition between acute and community-based care (AIHW 2008). Good medical and/or surgical intervention, together with good discharge planning, will decrease the likelihood of unplanned hospital re-admissions.
While some unplanned hospital re-admissions may be explained by unexpected progression of an acute illness, others may be an indication of the ill person being discharged from hospital too soon or ineffective follow-up in the community after discharge.
Although some conditions require numerous admissions to enable the best level of care to be given, in most of these cases re-admission to hospital would be planned (DoH WA 1998).
Unplanned or unexpected hospital re-admission refers to:
• An unexpected admission for further treatment of the same condition for which the patient was previously hospitalised
• An unexpected admission for treatment of a condition related to one for which the patient was previously hospitalised
• An unexpected admission for a complication of the condition for which the patient was previously hospitalised (ACHS 2007).
Numerator: Unplanned and unexpected hospital readmissions within 28 days for selected surgical admissions
Denominator: Number of separations for selected surgical conditions (excluding deaths)
Indicator type: Outcome
Disaggregation: National: Remoteness of facility, Public hospital peer group, Public/private hospital sector, State/Territory, Type of surgical case (e.g. orthopaedic, cardiothoracic).
State/Territory: Remoteness of facility, Public hospital peer group, Public/private hospital sector, Health service region, Facility/organisation
Facility/Organisation: Type of surgical case
Related Indicators: 19 – Health care associated infections (HCAI) acquired in hospital 30 – Postoperative haemorrhage
32 – Unplanned return to operating theatre 33 – Unplanned re-admission to an intensive care unit 38 – Timely transmission of discharge summaries

201
Issues/Comments: Patients with progressive conditions (for example, advanced cancer and renal disease) due to the nature of their disease may be expected to return to hospital at some stage, even though the admission date is not planned. These groups of patients should not automatically be excluded on the basis of their condition as their re-admission may relate to complications arising from treatment during the previous admission. This emphasises the need for clinician input in determining those re-admissions that are both unplanned and unexpected.
Data development is required in order to make this a robust and consistent measure. Future work includes definitional work around how ‘unplanned re-admission’ is defined and recorded. Critical to this measure, a unique patient identifier, or other means of linking data between hospitals, is needed if this is to include re-admissions to another hospital.
Development work is also necessary to identify the surgical categories of most interest in reporting, and to consider whether selected medical and mental health conditions should also be included. For example, Queensland Health report re-admissions in their variable life-adjusted displays (VLADs) to monitor outcomes of care for: Acute myocardial infarction, Heart failure, Hip replacement, Knee replacement, Paediatric tonsillectomy, Depression and Schizophrenia (Duckett et al. 2007).
Framework elements Health needs domain: Getting Better
Quality Domain: Appropriate, effective, continuous, safe
Service category: Multiple Service Categories (Hospitals, primary care and community health services, specialised health services)
Area of expenditure: Hospitals, medical services, community health and other
National Data Comments
Data currently available (not national) ACHS currently collect data from hospitals participating in the ACHS program.
NHMD could be used for reporting if data development was undertaken.
Data development required Data linkage is required to identify patients that are discharged from one hospital and readmitted to another. Definitional and data development work is needed around identifying an ‘unplanned re-admission’ and determining which surgical (and other) admissions should be included. (See discussion in Issues/ comments above for further details)
Data source National Hospital Morbidity Database (NHMD)
Data collection arrangements Provided to the Australian Institute of Health and Welfare under the National Health Information Agreement
International comparisons available:
• UK: Healthcare Commission – Acute Care Balanced Scorecard (Emergency readmission following discharge (Adults))

202
• Canada: Canadian Institute for Health Information report – Health Care in Canada. Reported as per selected individual medical and surgical conditions, for example, asthma readmission and schizophrenia readmission.
• USA: Centres for Medicare and Medicade – Reporting Hospital Quality Data. Report as per selected individual medical and surgical conditions, for example, 30-day standardised readmission for patients with heart failure.
Presentation of available data
0
0.5
1
1.5
2
2.5
3
1998 1999 2000 2001 2002 2003 2004 2005 2006
Per 100 seperations
Note: The data as presented here is different to the proposed indicator in that this data only includes organisations that report data to the ACHS (average 321 organisations a year), whereas the proposed indicator includes total patients across all facilities. A few of the organisations represented here are based in New Zealand rather than Australia.
In addition, the surgical admission types included may differ from the types included when this proposed indicator is finalised, and the suggested disaggregations were not available.
(a) Reported as a mean rate over all organisations submitting data
Source: ACHS 2007
Unplanned hospital re-admissions, 2001–2006 (per 100 separations)
What these data show
• Reported rates of unplanned hospital re-admissions has gradually declined over the period 1998 to 2006
References
ACHS 2007. The Australian Council on Healthcare Standards 2007. Clinical Indicator users manual 2007. Sydney: ACHS.
AIHW 2008. Australian Institute of Health and Welfare 2008. A set of performance indicators across the health and aged care system. Canberra: AIHW.

203
DoHWA 1998. Department of Health Western Australia 1998. Annual Report 1997/98. Viewed 18 august 2008, <http://www.health.wa.gov.au/publications/documents/AnnualReports/AnnualReport_9798/quality.htm>
Duckett SJ, Coory M and Sketcher-Baker K 2007. Identifying variations in quality of care in Queensland hospitals. Medical Journal of Australia Vol 187, No 10 pp 571-575.

204
Inappropriate co-prescribing of medicines Indicator number: 46
Description: Proportion of patients identified with inappropriate combinations of prescribed medicines
Indicator status: Concept proposed for further research and development
Rationale (clinical/policy): The National Strategy for Quality Use of Medicines is one component of the National Medicines Policy, and has the stated goal to, ‘…make the best possible use of medicines to improve health outcomes for all Australians’ (DoHA 2002). The Quality Use of Medicines (QUM) can be defined broadly as including:
• Selecting medicine management options wisely
• Choosing suitable medicines if a medicine is considered necessary
• Using medicines safely and effectively.
The QUM defines ‘medicine’ as including: prescription medicines; over-the-counter medicines; vitamin and mineral supplements; herbal and natural therapies medicines. (DoHA 2002, NPS 17 September 2008)
Goldberg & Adena (2007) state that, ‘if a medicine is considered necessary, then QUM mandates selection of the most appropriate medicine should take into account factors such as the individual, the clinical condition, risks and benefits, dosage and length of treatment, any coexisting conditions and other therapies.’
The inappropriate co-prescribing of prescription medicines could potentially relate to a wide variety of co-morbidities and medicines including, for example, the co-prescribing of topical and systemic beta-blockers in patients with glaucoma. In addition, indicators of inappropriate co-prescribing could be developed to include secondary and tertiary health care sectors.
Numerator: To be determined
Denominator: To be determined
Indicator type: Outcome
Disaggregation: To be determined
Related Indicators: 11 – Quality of Community Pharmacy services
13 – People receiving a medication review
21 – Adverse drug events in hospitals
47 – Selected potentially preventable hospitalisations
Issues/Comments: It is recognised that the operationalisation of this concept indicator would require considerable development work, in consultation with expert groups, for example with regards defining what combinations of drugs are considered to represent inappropriate co-prescribing.
For example, Pharmaceutical Benefits Scheme (PBS) data could be used to monitor the occasion rate for dispensing of two or more drugs within the same class for the following classes: NSAIDs and COX-2-selective NSAIDs combined, ACE inhibitor and AT2RAs combined, antipsychotics, anti-osteoporotic (anti-resorptive only), statins.

205
However, while PBS data could be used to identify some instances of inappropriate co-prescribing, this does not apply to all patients. Similarly, the data development required to identify instances of inappropriate co-prescribing in the hospital setting would need to be determined.
In Australia, there are currently two indicators of inappropriate co-prescribing which have been operationalised:
1. Inappropriate co-prescribing with antidepressants.
The Department of Veterans’ Affairs (DVA) Medicines Advice and Therapeutics Education Services (MATES) program has identified the following examples of inappropriate co-prescribing:
– SSRI antidepressants co-prescribed with: Tramadol; HMG Co-A reductase inhibitors; beta-blockers; perhexiline; and antipsychotic drugs
– Tricyclic antidepressants (TCA) co-prescribed with: nitrates; anticholinergic drugs; selective alpha blockers
However, data for this indicator is currently only collected for veterans (DVA 2006).
2. Co-prescribing of ACE inhibitors, or angiotensin II-receptor antagonists, with diuretics and NSAIDs (including COX-2 selective NSAIDs).
The National Prescribing Service includes this in their Indicator of Quality Prescribing in Australian General Practice. However, this information is currently only for use as a quality measure within general practices.
Framework elements Health needs domain: Living with chronic conditions
Quality Domain: Safe, appropriate
Service category: Multiple service categories (Hospitals, Primary and community health, Specialised health services)
Area of expenditure: Medical services, Hospitals, Dental
National Data Comments
National data currently available PBS data is available for ambulatory patients
However, information on medicines provided to hospital patients is not held in the NHMD.
Data development required Linkage of Medicare data (to identify individuals) to PBS data.
Availability of hospital based pharmacy data would need to be determined. Denominator and source of denominator data needs to be determined and is likely to require substantial data development.
Data source PBS, Medicare, and others as appropriate depending on outcome of development activities suggested above.
Data collection arrangements Continuous collection of data from claims lodged with Medicare Australia by pharmacies, hospital authorities and approved medical practitioners
Data available continuously

206
No international comparisons available
References
DoHA 2002. Australian Government Department of Health and Ageing 2002. The National Strategy for Quality Use of Medicines. Accessed 17 September 2008
<http://www.health.gov.au/internet/main/publishing.nsf/Content/nmp-pdf-natstrateng-cnt.htm>
DVA 2006. Australian Government Department of Veterans’ Affairs 2006. Veteran's MATES. Veterans' Medicines Advice and Therapeutics Education Series: Therapeutic Brief 5 - Antidepressants: Three steps towards safer use. Canberra: DVA MATES.
Goldberg I & Adena MA 2007. Co-prescribing of topical and systemic beta-blockers in patients with glaucoma: a quality of medicine issue in Australian practice. Clinical and Experimental Ophthalmology 35:700-5.
NPS 2006. National Prescribing Service 2006. Indicators of Quality Prescribing in Australian General Practice. Sydney: NPS.
NPS 2008. National Prescribing Service 2008. Accessed 17 September 2008. About Quality Use of Medicines.
<http://www.nps.org.au/about_us/what_we_do/about_quality_use_of_medicines>

207
Selected potentially preventable hospitalisations Indicator number: 47
Description: Rates of admission to hospital for selected conditions which could potentially have been prevented through the provision of appropriate non-hospital health services
Indicator status: Currently reportable – as per recommended specification
This indicator is to be reported under the National Health Care Agreement
Rationale (clinical/policy): The rate of ‘potentially preventable hospitalisations’ (PPH) has been extensively used, both locally and internationally, as an indicator of the quality of non-hospital services. PPH represent conditions where hospitalisation is thought to have been avoidable if non-hospital care had been provided appropriately (Ansari et al. 2006, NHPC 2004). PPH rates measure the effectiveness, timeliness and adequacy of non-hospital care, including population health, primary care and outpatient services, in preventing hospitalisations for particular conditions (NHPC 2004).
The conditions which are included in the reporting of this indicator can be categorised into three main groups:
• Vaccine-preventable conditions. This includes conditions such as influenza, bacterial pneumonia, tetanus and measles, which could have been avoided through vaccination
• Potentially preventable acute conditions
• Potentially preventable chronic conditions.
It is not expected that PPH will be eliminated entirely. However, the variation in rates between geographic areas highlights the potential for strengthening the effectiveness and appropriateness of non-hospital care (DHS 2002).
A high rate of PPH could indicate an increase in the prevalence of these conditions in the population or poorer quality primary health care services. Alternatively, it may indicate an appropriate use of the hospital system to respond to greater need, for example increased prevalence of a particular condition (AIHW 2008). Variation may also reflect coding practices across states and territories.
It is not expected that the rate of PPH will ever be eliminated entirely as not all hospitalisations are avoidable. The variation between geographic areas, however, demonstrates considerable potential for strengthening the impact of non-hospital care (NHPC 2004).
Indicator Source: NHPC
Endorsement: AHMAC
Numerator: Number of separations including diagnosis codes for (see appendix below):
• Vaccine-preventable conditions (e.g. tetanus, measles, mumps, rubella)
• Potentially preventable acute conditions (e.g. ear, nose and throat infections, dehydration/gastroenteritis)

208
• Potentially preventable chronic conditions (e.g. diabetes, asthma, angina, hypertension, congestive heart failure and chronic obstructive pulmonary disease)
Denominator: Total population
Indicator type: Outcome
Disaggregation: National: Indigenous status, socioeconomic status, remoteness, Divisions of general practice, State/Territory, Specific conditions
State/Territory: Indigenous status, socioeconomic status, remoteness, Divisions of general practice, Specific conditions, Health service region
Related Indicators: 1 – Enhanced primary care services in general practice 3 – People with moderate to severe asthma who have a written asthma action plan
4 – Management of hypertension in general practice
7 – Annual cycle of care in general practice for people with diabetes
49 – End stage kidney disease in people with diabetes 50 – Lower-extremity amputation in people with diabetes 53 – Failure to diagnose
Issues/Comments: The exact specifications of the conditions/codes included in the definition of PPH should be reviewed periodically to ensure they reflect current needs and are standardised across Australia.
This review could include, for example, looking at expanding the range of chronic conditions considered to include potentially preventable hospitalisations for cancer and mental health.
Framework elements Health needs domain: Staying healthy
Quality Domain: Appropriate, effective, accessible
Service category: Multiple service categories (Primary care and community health services, Specialised health services, Residential aged care)
NHPA: Cardiovascular health, asthma, diabetes mellitus
Disease expenditure: Cardiovascular, respiratory, digestive, infections and parasitic, endocrine
Area of expenditure: Medical services, Community health and other, Other health practitioners
National Data Comments
National data currently available
No data development required
Data source National Hospital Morbidity Database (NHMD)
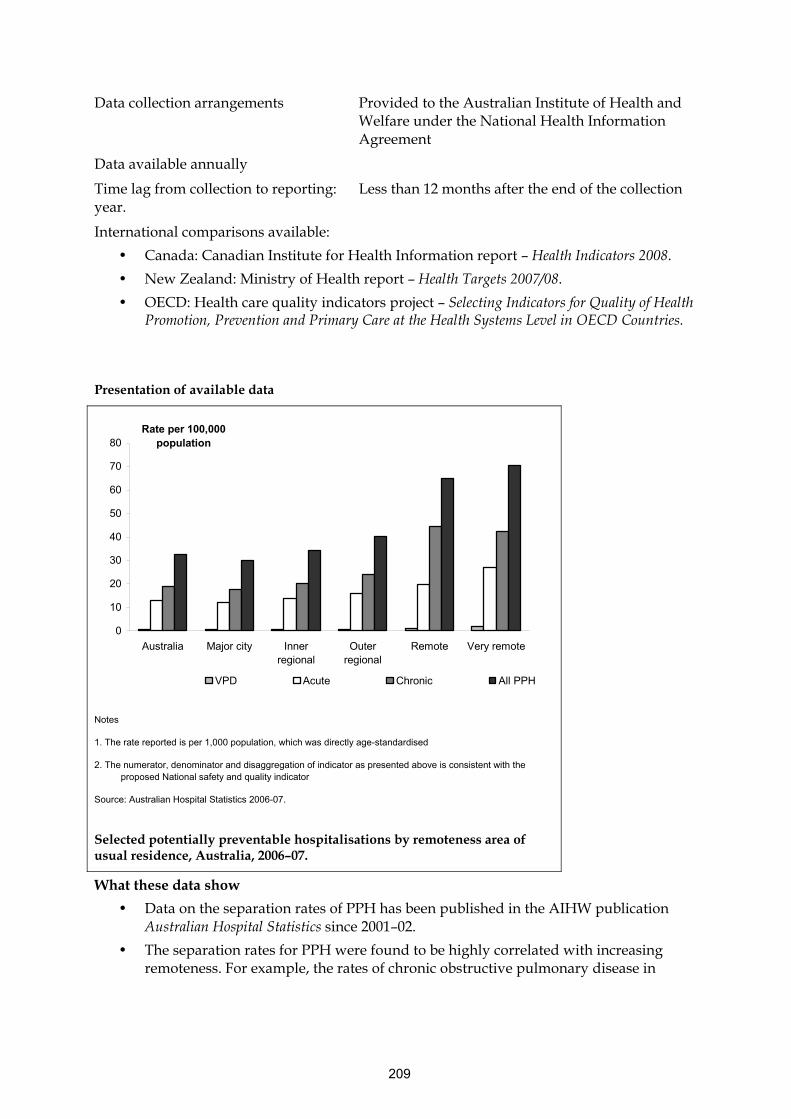
209
Data collection arrangements Provided to the Australian Institute of Health and Welfare under the National Health Information Agreement
Data available annually
Time lag from collection to reporting: Less than 12 months after the end of the collection year.
International comparisons available:
• Canada: Canadian Institute for Health Information report – Health Indicators 2008.
• New Zealand: Ministry of Health report – Health Targets 2007/08.
• OECD: Health care quality indicators project – Selecting Indicators for Quality of Health Promotion, Prevention and Primary Care at the Health Systems Level in OECD Countries.
Presentation of available data
0
10
20
30
40
50
60
70
80
Australia Major city Innerregional
Outerregional
Remote Very remote
Rate per 100,000 population
VPD Acute Chronic All PPH
Notes
1. The rate reported is per 1,000 population, which was directly age-standardised
2. The numerator, denominator and disaggregation of indicator as presented above is consistent with the proposed National safety and quality indicator
Source: Australian Hospital Statistics 2006-07.
Selected potentially preventable hospitalisations by remoteness area of usual residence, Australia, 2006–07.
What these data show
• Data on the separation rates of PPH has been published in the AIHW publication Australian Hospital Statistics since 2001–02.
• The separation rates for PPH were found to be highly correlated with increasing remoteness. For example, the rates of chronic obstructive pulmonary disease in

210
Major cities was 2.4 per 1,000 population, 2.7 for Inner regional, 3.3 for Outer regional, 4.9 for Remote and 6.1 for Very remote areas.
References
AIHW 2008. Australian Institute of Health and Welfare 2008. Australian hospital statistics 2006–07. Canberra: AIHW.
Ansari Z, Laditka JN and Laditka SB 2006. Access to Health Care and Hospitalisation for Ambulatory Care Sensitive Conditions. Medical Care Research and Review 63:719–41.
DHS 2002. Victorian Government Department of Human Services 2002. The Victorian Ambulatory Care Sensitive Conditions Study: opportunities for targeting public health and health services interventions. Melbourne: Rural and Regional Health and Aged Care Services Division.
NHPC 2004. National Health Performance Committee 2004. National report on health sector performance 2003. Canberra: AIHW.
Page A, Ambrose S, Glover J and Hetzel D 2007. Atlas of avoidable hospitalisations in Australia: ambulatory care-sensitive conditions. Adelaide: PHIDU, University of Adelaide.
Appendix – ICD-10-AM codes
Vaccine preventable conditions
Influenza and pneumonia - J10, J11, J13, J14, J15.3, J15.4, J15.7, J15.9, J16.8, J18.1, J18.8 in any diagnosis field, excludes cases with additional diagnosis of D57 (sickle-cell disorders) and people under 2 months
Other vaccine-preventable conditions - A35, A36, A37, A80, B05, B06, B16.1, B16.9, B18.0, B18.1, B26, G00.0, M01.4 in any diagnosis field
Chronic conditions
Asthma - J45, J46 as principal diagnosis only
Congestive cardiac failure - I50, I11.0, J81 as principal diagnosis only, exclude cases with the following procedure codes: 33172-00, 35304-00, 35305-00, 35310-02, 35310-00, 38281-11, 38281-07, 38278-01, 38278-00, 38281-02, 38281-01, 38281-00, 38256-00, 38278-03, 38284-00, 38284-02, 38521-09, 38270-01, 38456-19, 38456-15, 38456-12, 38456-11, 38456-10, 38456-07, 38456-01, 38470-00, 38475-00, 38480-02, 38480-01, 38480-00, 38488-06, 38488-04, 38489-04, 38488-02, 38489-03, 38487-00, 38489-02, 38488-00, 38489-00, 38490-00, 38493-00, 38497-04, 38497-03, 38497-02, 38497-01, 38497-00, 38500-00, 38503-00, 38505-00, 38521-04, 38606-00, 38612-00, 38615-00, 38653-00, 38700-02, 38700-00, 38739-00, 38742-02, 38742-00, 38745-00, 38751-02, 38751-00, 38757-02, 38757-01, 38757-00, 90204-00, 90205-00, 90219-00, 90224-00, 90214-00, 90214-02.
Diabetes complications - E10–E14.9 as principal diagnoses and E10–E14.9 as additional diagnoses where the principal diagnosis was: hypersmolarity (E87.0); acidosis (E87.2); transient ischaemic attack (G45); nerve disorders and neuropathies (G50–G64); cataracts and lens disorders (H25–H28); retinal disorders (H30–H36); glaucoma (H40–H42); myocardial infarction (I21–I22); other coronary heart diseases (I20, I23–I25); heart failure (I50); stroke and sequelae (I60–I64, I69.0–I69.4); peripheral vascular disease (I70–I74); gingivitis and

211
periodontal disease (K05); kidney diseases (N00–N29) [including end-stage renal disease (N17–N19)]; renal dialysis (Z49).
Chronic obstructive pulmonary disease - J20, J41, J42, J43, J44, J47 as principal diagnosis only, J20 only with additional diagnoses of J41, J42, J43,J44, J47.
Angina - I20, I24.0, I24.8, I24.9 as principal diagnosis only, exclude cases with procedure codes not in blocks [1820] to [2016]
Iron deficiency anaemia - D50.1, D50.8, D50.9 as principal diagnosis only
Hypertension - I10, I11.9 as principal diagnosis only, exclude cases with procedure codes according to the list of procedures excluded from the Congestive cardiac failure category above.
Nutritional deficiencies - E40, E41, E42, E43, E55.0, E64.3 as principal diagnosis only.
Rheumatic heart disease - I00 to I09 as principal diagnosis only. (Note: includes acute rheumatic fever)
Acute conditions
Dehydration and gastroenteritis - E86, K52.2, K52.8, K52.9 as principal diagnosis only.
Pyelonephritis - N10, N11, N12, N13.6, N39.0 as principal diagnosis only.
Perforated/bleeding ulcer - K25.0, K25.1, K25.2, K25.4, K25.5, K25.6, K26.0, K26.1, K26.2, K26.4, K26.5, K26.6, K27.0, K27.1, K27.2, K27.4, K27.5, K27.6, K28.0, K28.1, K28.2, K28.4, K28.5, K28.6 as principal diagnosis only.
Cellulitis - L03, L04, L08, L88, L98.0, L98.3 as principal diagnosis only, exclude cases with any procedure except those in blocks 1820 to 2016 or if procedure is 30216-02, 30676-00, 30223-02, 30064-00, 34527-01, 34527-00, 90661-00 and this is the only listed procedure
Pelvic inflammatory disease - N70, N73, N74 as principal diagnosis only.
Ear, nose and throat infections - H66, H67, J02, J03, J06, J31.2 as principal diagnosis only.
Dental conditions - K02, K03, K04, K05, K06, K08, K09.8, K09.9, K12, K13 as principal diagnosis only.
Appendicitis with generalised peritonitis - K35.0 in any diagnosis field
Convulsions and epilepsy - G40, G41, O15, R56 as principal diagnosis only.
Gangrene - R02 in any diagnosis field

212
End-stage kidney disease in people with diabetes
Indicator number: 48
Description: Persons with end-stage kidney disease with diabetic nephropathy as a causal factor
Indicator status: Currently reportable – as per recommended specification
Rationale (clinical/policy): Diabetes became a National Priority Area in 1996. In November 2005, the Australian Health Ministers’ Conference (AHMC) endorsed a national strategic policy approach to manage and improve chronic disease prevention and care in the Australian population. The proposed national approach comprises three complementary components: the National Chronic Disease Strategy, the National Service Improvement Frameworks and the Blueprint for Chronic Disease Surveillance. These provide an overarching framework for addressing the burden of chronic disease including diabetes, and for providing information to monitor progress (AIHW 2008c).
Poor management of diabetes increases the risk of a range of complications which are the major causes of associated morbidity and mortality in people with diabetes. The goal of diabetes management is for the diabetic patient to have a life that is as healthy and as normal as possible. Symptom control and longer term prevention can be achieved by maintaining normal blood glucose levels and by attention to lifestyle and its associated risk factors (such as diet and physical activity). (AIHW 2008a, AIHW 2008b, Greenfield et al. 2004)
Uncontrolled diabetes is the most frequent cause of end-stage kidney disease (ESKD) in Australia. In end-stage kidney disease, kidney function has deteriorated to the point where it is no longer sufficient to sustain life and, if interventions such as dialysis and renal transplant were not undertaken, this condition would be fatal within weeks (Greenfield et al. 2004).
Research has shown that the prevention and retardation of kidney disease in patients with diabetes is possible through adequate management, and that the incidence of kidney disease in patients with diabetes would seem to be a good measure of the quality of care for patients with this condition, lending the measure face validity (Greenfield et al. 2004).
Numerator: The number of new (incident) cases of diabetic patients with end-stage kidney disease
Denominator: Total population
Indicator type: Outcome
Disaggregation: National: Indigenous status, Socioeconomic status, Sex, Remoteness, State/Territory
Related Indicators: 1 – Enhanced primary care services in general practice
2 – General practices with a register and recall system for patients with chronic disease
7 – Annual cycle of care within general practice for people with diabetes 49 – Lower-extremity amputation in people with diabetes
Issues/Comments: It should be noted that the outcome of ESKD may be due to poor quality of diabetic care, but it can also result from individual behavioural choices which are outside of the influence of health care interventions.

213
A related indicator which could be considered would be to determine the rate of screening for early kidney disease in known diabetics. This information may be available through general practice information systems, including (but not limited to) those patients who have received an annual cycle of care for diabetes (which includes a measurement of urinary albumin excretion)
Framework elements Health needs domain: Living with chronic conditions
Quality Domain: Effective, continuous, accessible
Service category: Multiple service categories (Primary care and community health, Hospitals, Specialised health services)
NHPA: Diabetes mellitus
Burden of disease: Diabetes
Disease expenditure: Diabetes
Area of expenditure: Medical services, Hospitals
National Data Comments
National data currently available Data is available from The Australian and New Zealand Dialysis and Transplant Registry (ANZDATA)
No data development required
Data source Australia and New Zealand Dialysis and Transplant Registry (ANZDATA)
Data collection arrangements Data is collected by circulation of printed survey forms for each patient at six month intervals to all dialysis and transplant units in Australia and New Zealand.
Data available six monthly
Time lag from collection to reporting: Data is reported for the calendar year prior to publication year of the annual report
International comparisons available
• OECD: Health care quality indicators project – Selecting Indicators for Quality of Diabetes Care at the Health Systems Level in OECD Countries
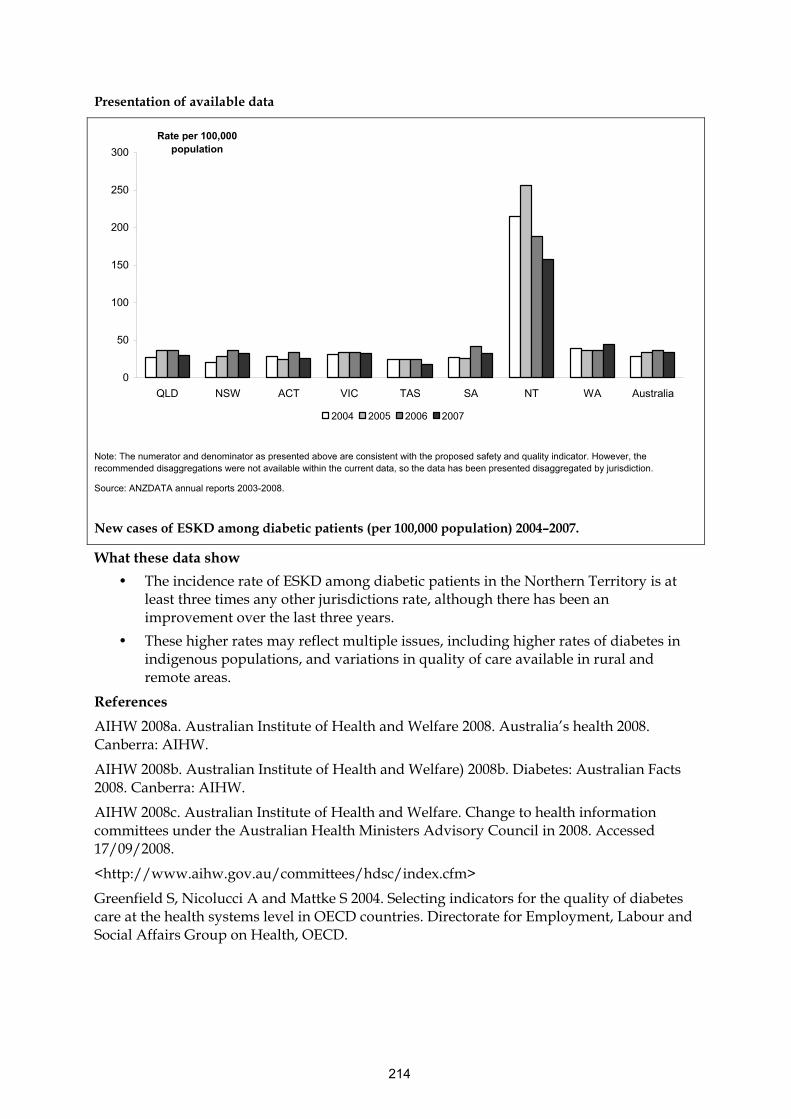
214
Presentation of available data
0
50
100
150
200
250
300
QLD NSW ACT VIC TAS SA NT WA Australia
Rate per 100,000 population
2004 2005 2006 2007
Note: The numerator and denominator as presented above are consistent with the proposed safety and quality indicator. However, the recommended disaggregations were not available within the current data, so the data has been presented disaggregated by jurisdiction.
Source: ANZDATA annual reports 2003-2008.
New cases of ESKD among diabetic patients (per 100,000 population) 2004–2007.
What these data show
• The incidence rate of ESKD among diabetic patients in the Northern Territory is at least three times any other jurisdictions rate, although there has been an improvement over the last three years.
• These higher rates may reflect multiple issues, including higher rates of diabetes in indigenous populations, and variations in quality of care available in rural and remote areas.
References
AIHW 2008a. Australian Institute of Health and Welfare 2008. Australia’s health 2008. Canberra: AIHW.
AIHW 2008b. Australian Institute of Health and Welfare) 2008b. Diabetes: Australian Facts 2008. Canberra: AIHW.
AIHW 2008c. Australian Institute of Health and Welfare. Change to health information committees under the Australian Health Ministers Advisory Council in 2008. Accessed 17/09/2008.
<http://www.aihw.gov.au/committees/hdsc/index.cfm>
Greenfield S, Nicolucci A and Mattke S 2004. Selecting indicators for the quality of diabetes care at the health systems level in OECD countries. Directorate for Employment, Labour and Social Affairs Group on Health, OECD.

215
Lower-extremity amputation in people with diabetes Indicator number: 49
Description: People with diabetes with major (above or below knee) lower-extremity amputations
Indicator status: Currently reportable
Rationale (clinical/policy): Diabetes became a National Priority Area in 1996. In November 2005, the Australian Health Ministers’ Conference endorsed a national strategic policy approach to manage and improve chronic disease prevention and care in the Australian population. The proposed national approach comprises three complementary components: the National Chronic Disease Strategy, the National Service Improvement Frameworks and the Blueprint for Chronic Disease Surveillance. These provide an overarching framework for addressing the burden of chronic disease including diabetes, and for providing information to monitor progress (AIHW 2008c, AIHW 2008d).
Poor management of diabetes increases the risk of a range of complications which are the major causes of morbidity and mortality in people with diabetes. The goal of diabetes management is for the diabetic patient to have a life that is as healthy and as normal as possible. Symptom control and longer term prevention can be achieved by maintaining normal blood glucose levels and by attention to lifestyle and its associated risk factors (such as diet and physical activity) (AIHW 2008a, AIHW 2008b, Greenfield et al. 2004)
Peripheral vascular disease and neuropathy due to uncontrolled diabetes puts the patient at greater risk of lower-extremity lesions, which can then lead to further complications such as infections (e.g. gangrene or osteomyelitis) that then lead to the need for amputations (AIHW 2008b).
It is proposed that this indicator will have a focus on major amputation, as minor amputations of the toes and feet may be done to prevent major amputations, and could conceivably be the result of improved system and patient surveillance that leads to earlier detection and treatment of foot lesions. Since major amputations result in large decreases in quality of life they may be considered to be a failure of care even if necessary when performed. Thus, major amputations may be more likely to be linked to antecedent poor quality of care (Greenfield et al. 2004).
Indicator Source: OECD
Numerator: The number of people with diabetes with a major (above or below knee) amputations in a time frame
Denominator: Total population (Population with diabetes mellitus if available – see issues/comments below).
Indicator type: Outcome
Disaggregation: National: Indigenous status, Socioeconomic status, Sex, Remoteness, State/Territory
Related Indicators: 1 - Enhanced primary care services in general practice 2 - General practices with a register and recall system for patients with chronic disease
216
7 - Annual cycle of care within general practice for people with diabetes
48 - End stage kidney disease in people with diabetes
Issues/Comments:
The actual number of individuals with diabetes mellitus in Australia is unknown and estimates are based on the results of self-reported survey data, such as the National Health Survey.
It should be noted that the outcome of amputation may be due to poor quality of diabetic care, but it can also result from individual behaviour choices which are outside of the influence of health care interventions.
Framework elements Health needs domain: Living with chronic conditions
Quality Domain: Effective, continuous, accessible
Service category: Multiple service categories (Primary care and community health, Hospitals, Specialised health services).
NHPA: Diabetes Mellitus
Burden of disease: Diabetes
Disease expenditure: Diabetes
Area of expenditure: Medical services, Hospitals
National Data Comments
National data currently available Data on hospital admissions for non-traumatic amputation with diabetes are available from the National Hospital Morbidity Database (NHMD).
Data development required No data development is required.
The denominator for the indicator is the total population. However, estimates of the population with diabetes could also be used, as available from population health surveys.
Data source National Hospital Morbidity Database (NHMD)
Data collection arrangements Provided to the Australian Institute of Health and Welfare under the National Health Information Agreement
Data available annually
Time lag from collection to reporting: Less than 12 months after the end of the collection year.
International comparisons available
• OECD: Health care quality indicators project – Selecting Indicators for Quality of Diabetes Care at the Health Systems Level in OECD Countries (lower-extremity amputation rate).
• USA: Agency for Healthcare Research and Quality report – Guide to Prevention Quality Indicators (lower-extremity amputation rate).

217
Presentation of available data
0
20
40
60
80
100
120
140
160
20–24 25–29 30–34 35–39 40–44 45–49 50–54 55–59 60–64 65–69 70–74 75–79 80–84 85+
Rate per 100,000 population
Males Females
Notes
1. The numerator and denominator as presented above are not consistent with the proposed safety and quality indicator as they include all lower limb amputations, not just major amputation. The recommended disaggregations were not available, and so the data has been presented disaggregated by sex and age.
Source: Diabetes: Australian Facts 2008.
Diabetes hospitalisations where a lower limb amputation was performed, by sex and age group, 2004–05 (per 100,000 population).
What these data show
• The rate of lower limb amputation in males is about double that of females for the age groups 45-49 and older, and shows a marked increase with age. This may reflect multiple contributing factors including the quality of care provided, diabetes prevalence rates, and differing rates of health care seeking behaviour and compliance with diabetes management measures between men and women.
References
AIHW 2008a. Australian Institute of Health and Welfare 2008. Australia’s health 2008. Canberra: AIHW.
AIHW 2008b. Australian Institute of Health and Welfare 2008. Diabetes: Australian Facts 2008. Canberra: AIHW.
AIHW 2008c. Australian Institute of Health and Welfare 2008. Change to health information committees under the Australian Health Ministers Advisory Council in 2008. Accessed 17/09/2008. <http://www.aihw.gov.au/committees/hdsc/index.cfm>

218
AIHW 2008d. Australian Institute of Health and Welfare 2008. National indicators for monitoring diabetes: report of the Diabetes Indicators Review Subcommittee of the National Diabetes Data Working Group. Canberra: AIHW.
Greenfield S, Nicolucci A & Mattke S 2004. Selecting indicators for the quality of diabetes care at the health systems level in OECD countries. Directorate for Employment, Labour and Social Affairs Group on Health, OECD
Appendix – ICD Codes
ICD-10-AM 6th edition procedure codes for lower limb amputation
44367-01 Disarticulation at knee
44367-02 Amputation below knee
44370-00 Amputation at hip
Disarticulation of hip
44373-00 Hindquarter amputation
Hemipelvectomy
44367-00 Amputation above knee
Amputation through thigh
ICD-10-AM 6th edition diagnosis codes for diabetes:
E10.xx Type 1 diabetes mellitus
E11.xx Type 2 diabetes mellitus
E13.xx Other specified diabetes with hyperosolarity
E14.xx Unspecified diabetes with hyperosolarity
219
Cancer survival Indicator number: 50
Description: Five-year relative survival rates for people diagnosed with cancer
Indicator status: Currently reportable – as per recommended specification
This indicator is to be reported under the National Healthcare Agreement
Rationale (clinical/policy): A National Health Priority Area (NHPA), cancer is a major cause of death in Australia and accounted for about 30 percent of all deaths in 2005 (AIHW 2008). Survival following a diagnosis of cancer is seen as an important measure of the effectiveness of health care interventions such as early detection through screening programs, diagnostic technologies and clinical treatments (AIHW:CA:AACR 2008, NHPC 2004).
While crude survival after diagnosis of cancer is a measure of the time between diagnosis and death, relative survival is a more meaningful measure. Relative survival is the ratio between what actually happens to a group of people with cancer and what would normally have happened to them in the absence of cancer. That is the observed survival divided by the expected survival, usually expressed as a proportion. For example, a five-year relative survival of 89 percent for women diagnosed with breast cancer in 1997 and who were aged 60–64 years at diagnosis means that a woman from that category had an 89 percent chance of surviving five or more years relative to all Australian females aged 60–64 years in 1997 (AIHW 2008, AIHW: CA:AACR 2008, NHPC 2004).
The use of the five-year survival rate might provide an indication of:
• The effectiveness of treatment
• The impact of the cancer treatment and whether long-term side-effects are associated with additional mortality
• The numbers of cancers for which ongoing monitoring rather than cancer treatment is clinically recommended. This might also be interpreted as a milestone indicating an arrest in the disease process or a slow development of the disease.
Cancer survival will vary by type of cancer. It could also be influenced by issues such as access to health care services, such as access to radiotherapy services.
Indicator Source: NHPC
Numerator: The observed 5-year survival of people diagnosed with cancer
Denominator: The expected 5-year survival of the entire Australian population matched for age, sex and calendar year
Indicator type: Outcome
Disaggregation: National: Sex, Cancer Type, Indigenous status, Remoteness, Socioeconomic status, State/Territory
Related Indicators: 8 – Cervical cancer screening rates
51 – Failure to diagnose
Issues/Comments: A trend showing increased relative survival should be interpreted with caution, as it might be due to a number of factors. These include (AIHW:CA:AACR 2008):
• Earlier detection through public education about screening programs, self-examination and recognition of symptoms

220
• Increased effectiveness of general practitioners in diagnosing and following suspicious signs and symptoms
• Improvements in appropriate referral
• More effective investigation and staging of disease
• More widespread availability of treatment
• Increasing subspecialisation of cancer treatment
• More effective treatment
• The effect of changing mortality patterns from other causes of death because all-cause mortality rates in the general population declined over the period from 1982 to 2006, which were likely to be accompanied by reduced levels of significant co-morbidity among cancer cases.
An intermediate measure which could be developed as an enhancement to this indicator would be to measure cancer survival every two years after diagnosis, by cancer type. This may make the indicator more responsive to clinical improvement.
Framework elements Health needs domain: Getting Better
Quality Domain: Effective, continuous, responsive, appropriate, accessible
Service category: Hospitals, Primary care and community health services
NHPA: Cancer control
Burden of disease: Cancer
Disease expenditure: Neoplasms
Area of expenditure: Hospitals, Medical services
National Data Comments
National data currently available
No data development required
Data source AIHW National Death Index and Australasian Association of Cancer Registries (AACR)
Data availability Currently produced about every three years, but could be done annually.
Because five-year survival is required, there is theoretically at least five years between incidence of cancer and measurement of deaths. Cancer survival modelling techniques enable this gap to be reduced, so the estimates for five- year survival for cancers incident in the period 1998 to 2004 rely on death data up to 2006.
International comparisons available
• USA: Agency for Healthcare Research and Quality - National Healthcare Quality Report.
• Canada: Canadian Institute for Health Information – Health System Performance Indicators.

221
• European Union: included in proposed indicator set for the European Community Health Indicators (ECHI) project (proposed indicator only).
Presentation of available data
0
10
20
30
40
50
60
70
80
90
100
1982-1986 1987-1991 1992-1997 1998-2004
Percent
All cancers Colorectal Melanoma Lung Prostate NHL
Note:
1.The numerator, denominator and disaggregation of indicator as presented above is consistent with the proposed safety and quality indicator
2. NHL stands for Non-Hodgkin’s Lymphoma
Source: Australia’s Health 2008.
Five year relative survival by cancer type, 1982–1986 to 1998–2004, Males (per cent)

222
0
10
20
30
40
50
60
70
80
90
100
1982-1986 1987-1991 1992-1997 1998-2004
All cancers Colorectal Melanoma Lung Breast Cervix NHL
Note:
1.The numerator, denominator and disaggregation of indicator as presented above is consistent with the proposed safety and quality indicator
2. NHL stands for Non-Hodgkin’s Lymphoma
Source: Australia’s Health 2008.
Five year relative survival by cancer type, 1982–1986 to 1997–2004, Females (per cent)
What these data show
• Among the selected cancer types shown, lung cancer had the lowest five-year survival for both males and females during 1998–2004 (10.7% and 14.0% respectively), and melanoma had the highest five year survival for both (89.7% and 94.1% respectively).
• The five-year survival rate for colorectal cancer increased from 49.7% to 62.4% for females and from 47.7% to 61.3% for males from 1982–1986 to 1998–2004.
• For males, five-year survival for prostate cancer increased from 57.4% in 1982–1986 to 85.3% in 1998–2004.
• For females, five-year survival for breast cancer increased from 71.8% in 1982–1986 to 87.8% in 1998–2004.
References
AIHW 2008. Australian Institute of Health and Welfare 2008. Australia's health 2008. Canberra: AIHW.
AIHW:CA:AACR 2008. AIHW Cancer Australia and Australasian Association of Cancer Registries 2008. Cancer survival and prevalence in Australia: cancers diagnosed from 1982 to 2004. Canberra: AIHW.
NHPC 2004. National Health Performance Committee 2004. National report on health sector performance indicators 2003. Canberra: AIHW.

223
Failure to diagnose Indicator number: 51
Description: To be determined
Indicator status: Concept proposed for further development
Rationale (clinical/policy): If there is a failure to diagnose, a delayed diagnosis, or an under- diagnosed condition by the doctor, the patient may not receive appropriate early treatment and ongoing management of a condition which may prevent a serious escalation of the condition. Failure to diagnose can have a significant impact on the outcomes of morbidity and mortality for some conditions, in particular cancer (Gandhi et al. 2006).
There is a paucity of information related to the failure to diagnose. For measurement of the extent to which this occurs, it would be necessary to identify a diagnosis that had been delayed (or missed and only diagnosed after death, for example), and to subsequently determine the length of time that had elapsed during which it would have been reasonable to have expected that a diagnosis would have been made. In a health system such as Australia’s, a delay in diagnosis could occur because of actions or inactions of a range of health care providers in primary care, specialist care, diagnostic, hospital or other settings.
The most common form of assessment of failure to diagnose (delayed diagnosis) has been chart peer-review. The Quality in Australian Health Care Study used chart peer-review and found that errors of omission (a failure of action such as a missed diagnosis, delayed evaluation, or failure to prescribe drug treatment) were identified in 52 percent of adverse events examined (Wilson et al. 1995, Weingart et al. 2000). The authors recognised that there are difficulties in detecting errors of omission retrospectively from medical record review (Weingart et al. 2000).
Other published work examining the prevalence of missed or delayed diagnosis have utilised methods such as comparing findings at autopsy with clinical diagnosis and examining the role of diagnosis in medical indemnity claims (Ghandhi et al. 2006, Weingart et al. 2000).
Numerator: To be determined
Denominator: To be determined
Indicator type: Process
Disaggregation: To be determined
Related Indicators: 47 – Selected potentially preventable hospitalisations 50 – Cancer survival
Issues/Comments: Further work would be required to define the boundaries of this indicator. It may be useful to focus the indicator on a specific condition or group of conditions, such as particular types of cancer, dementia, diabetes or non-traumatic fractures.
The challenges of identifying incidences of failure to diagnose, even through an intensive process such as medical record review has been noted above (Weingart et al. 2000).
Shared Electronic Health Records may facilitate collection of information for this indicator in the future. If detailed clinical information were available in the shared record, there may be potential for using the electronic information (with, for example, electronic decision-support tools based on best practice guidelines) to identify cases of delayed or missed diagnosis. It would be likely that such identified cases would need to be further investigated, but could
224
form the basis of statistical information for high-level monitoring. For local level reporting and investigation, health seeking behaviour of the patient would need to be taken into consideration in interpretation of data.
Framework elements Health needs domain: Getting better
Quality Domain: Appropriate, responsive, accessible
Service category: Multiple service categories (Primary care and community health, Hospitals, Specialised health services)
Area of expenditure: Medical services, Hospitals.
National Data Comments
Data currently not available
Data development required To be determined
Data source To be determined
No international comparisons available
References
Gandhi TK, Kachalia A, Thomas EJ, Puopolo AL, Yoon C, Brennan TA and Studdert DM 2006. Missed and Delayed Diagnoses in the Ambulatory Setting: A Study of Closed
Malpractice Claims. Annals of Internal Medicine Vol 145, pp 488-496
Weingart SN, Wilson RM, Gibberd RW and Harrision B 2000. Epidemiology of medical error. BMJ. 320. pp774-777.
Wilson R.M. Runciman W.B. Gibberd R.W. et al. 1995. The Quality in Australian Health Care Study. Medical Journal of Australia 163:458-71.
225
Potentially avoidable deaths Indicator number: 52
Description: Number of deaths associated with conditions which are considered amenable to health care interventions (that is, preventable through primary prevention activities, or treatable, through secondary and tertiary prevention activities)
Indicator status: Currently reportable – as per recommended specification
This indicator is to be reported under the National Healthcare Agreement
Rationale (clinical/policy): The concept of health care amenable mortality describes those causes of death which are potentially avoidable, at the present time, given our available knowledge about the effects of health care interventions (Page et al. 2006).
Health care amenable mortality can be further classified as:
• Primary – conditions which are amenable to individual behaviour modification, such as lifestyle modification (e.g. cessation of cigarette smoking), or population level interventions, such as public health programs (e.g. immunisation).
• Secondary – conditions which are amenable to early detection and intervention, such as cancer screening programs (e.g. cervical). These conditions are frequently managed in a primary health care setting.
• Tertiary – conditions which are amenable to current medical and/or surgical interventions. These conditions are frequently managed in a hospital setting.
(Tobias & Jackson 2001)
Recent Australian and international reporting of this indicator has divided healthcare amenable mortality into two categories only - preventable through primary prevention activities, or treatable, through secondary and tertiary prevention activities). It has been regarded as a high-level, system indicator that reflects a wide range of activities of the health system and other sectors of society.
Health care amenable mortality is a broad concept which is impacted by a complex interaction of the underlying economic and social environment, lifestyle factors, as well as the safety and quality of preventative and curative health care interventions (Nolte & McKee 2008).
Indicator source: Report by Page et al. Public Health Information Development Unit, University of Adelaide
Numerator: Number of avoidable deaths (under age 75) as defined by ICD-10-AM codes
Denominator: Population aged less than 75 years
Indicator type: Outcome
Disaggregation: National: Remoteness, Preventable/treatable conditions, Socioeconomic status, Indigenous status, State/Territory
Related Indicators: 34 – Hospital standardised mortality ratio
35 – Death in low mortality DRGs
47 – Selected potentially preventable hospitalisations

226
51 – Failure to diagnose
Issues/Comments: Recent Australian reporting of this indicator (Page et al. 2006) has focussed on the indicator as one particularly relevant to prevention activities. However, for use as a health care safety and quality indicator, it would benefit from a few revisions, to ensure that it reflected more clearly the division of health care into population health activities, and activities of clinical and related services, including hospitals. For that purpose, deaths due to adverse events in health care (for example) are included as ‘treatable’ and reflecting the safety and quality of the clinical health care system. In a prevention-focussed analysis, they could instead be categorised as ‘preventable’, despite not being a focus of population health primary prevention activities.
Previous reporting of health care amenable mortality has considered a number of conditions which are treatable and preventable. Further development would be required in order to provide an indicator with a focus on the safety and quality of healthcare (See Data development required below).
Framework elements Health needs domain: Getting Better
Quality Domain: Effective, Appropriate, Safe
Service category: Multiple service categories (Primary and community health services, Hospitals, Specialised health services)
Area of expenditure: Medical services, Community health and other
National Data Comments
National data currently available
Data development required Deaths for this indicator are defined according to ICD-10 codes. These may need to be reviewed for the purpose of operationalising this indicator with a focus on safety and quality.
Data source National Mortality Database
No international comparisons available

227
Presentation of available data
0.0
50.0
100.0
150.0
200.0
250.0
NSW VIC QLD SA WA TAS NT ACT Australia
Per 100,000
Capital city Other major urban centres Rest of state/territory Whole of state/territory
Note
1. The rate reported is per 100,000 and is directly age-standardised.
2. The numerator and denominator as presented above are consistent with the proposed safety and quality indicator.
3. For this work amenable causes were defined as those causes whose case fatality could be substantively reduced by currently available health care technologies.
Source: Page A, Tobias M, Glover J, Wright C, Hetzel D & Fisher E 2006. Australian and New Zealand Atlas of Avoidable Mortality. Adelaide: PHIDU, University of Adelaide.
Health care amenable mortality from all causes, by State and Territory, Australia, 1997-2001 (per 100,000)
What these data show
• Generally the rates of health care amenable mortality were higher for non-urban compared with urban areas.
• The non-urban rate for the NT was over twice the rate of any other area.
References
Nolte E & McKee CM 2008. Measuring the Health of Nations: Updating an Earlier Analysis. Health Affairs 27:58-71.
Page A, Tobias M, Glover J, Wright C, Hetzel D & Fisher E 2006. Australian and New Zealand Atlas of Avoidable Mortality. Adelaide: PHIDU, University of Adelaide.
Tobias M & Jackson G 2001. Avoidable mortality in New Zealand, 1981-97. Australian and New Zealand Journal of Public Health 25:12-20.

228
Patient experience
Indicator number: 53
Description: Patient evaluation of the quality of health care received
Indicator status: Concept proposed for further development
This indicator is to be reported under the National Healthcare Agreement
Rationale (clinical/policy): Internationally, the use of surveys to elicit patient feedback regarding their experience of the health care system is widespread, with information derived from these surveys being used as part of quality monitoring and improvement processes (Jenkinson et al. 2002, Pettersen et al. 2004).
Research by the Picker Institute Europe identified eight aspects of health care which were valued most highly by patients:
• Fast access to reliable health advice
• Effective treatment delivered by trusted professionals
• Involvement in decisions and respect for preferences
• Clear, comprehensible information and support for self-care
• Attention to physical and environmental needs
• Emotional support, empathy and respect
• Involvement of, and support for, family and carers
• Continuity of care and smooth transitions
(Coulter & Ellins 2006).
In Australia, there have been two areas of focus with jurisdictional surveys relating to patient experience:
• NSW Health Patient Survey (Hospital admitted patients and outpatients, and community)
• Victorian Patient Satisfaction Monitor (Hospital admitted patients only).
Work currently underway by the OECD is aimed at developing comparative reporting of responsiveness/patient experience, using instruments such as the Picker Institute tool.
The Commonwealth Fund in the United States has undertaken cross-national surveys of patient experience, drawing on the Picker Institute work.
Under the National Healthcare Agreement, nationally comparative information will be compiled that indicates levels of patient satisfaction around key aspects of care they received. For that purpose, it has been noted that the way health services are delivered is a key component of their quality.
Numerator: To be determined
Denominator: To be determined
Indicator type: Outcome
Disaggregation: To be determined
229
Related Indicators: 5 – Management of arthritis and musculoskeletal conditions
N.B. This indictor could be considered to be related to all other indicators in this set.
Issues/Comments: In order to report nationally on the quality of health care based on patient experience there would need to be a coordinated approach to collect comparable information across all jurisdictions.
The recent report by the NHHRC (2009) recommends the development of a nationally agreed consumer survey about people’s experiences of health care. They note that the measurement of the experience should be accompanied by action is taken as a result of consumer feedback. They suggest that consumer experience questionnaires should be supplemented by asking consumers about the outcomes of care they receive, noting that, for consumers, outcomes of care are measured in terms of whether they feel better, whether they experience less pain, whether they can regain their independence, and so on.”
Framework elements
Quality Domain: Responsive, effective, accessible
Service category: Multiple service categories (All).
Area of expenditure: Hospitals, Medical services, Community health and other, Other health practitioners, Dental services
National Data Comments
Data currently available (not national) Some data are currently available for NSW and Victoria as noted above.
Data development required A national survey (or set of national standard questions that are part of state surveys) is needed, so state and regional comparisons can be made, as can comparisons of the experience of patients of the public and private sectors.
The use of an international standard (e.g. the Picker Institute methodology) would allow for better international comparisons.
Data source To be determined
International comparisons available
• UK: Picker Institute

230
Presentation of available data
0.0 10.0 20.0 30.0 40.0 50.0 60.0 70.0 80.0 90.0 100.0
NSW average
Greater Sourthern AHS
Greater Western AHS
Hunter New England AHS
North Coast AHS
North Sydney/Central Coast AHS
Sout East Sydney/Illawarra AHS
Sydney South West AHS
Sydney West AHS
Overall care received Availability of Doctors Availability of Nurses
Notes
1. AHS is an abbreviation for Area Health Service
2. The results stated above represent the proportion of patients who rated their response as either Good, Very good or Excellent
3. The numerator and denominator and disaggregation as presented above are consistent with the proposed safety and quality indicator.
Patient experience of Overall care received , Availability of doctors and Availability of nurses, in Emergency Departments, by Area Health Service, New South Wales, 2007 (per cent).
What these data show
• The data show that across all Area Health Services patients rated the ‘availability of doctors’ less favourably than the ‘availability of nurses’ and the ‘overall care received’.
References
Coulter A and Ellins J 2006. Patient-focused interventions: A review of the literature. London: The Health Foundation and The Picker Institute Europe.
Jenkinson C, Coulter A and Bruster S 2002. The Picker Patient Experience Questionnaire: development and validation using data from in-patient surveys in five countries. International Journal for Quality in Health Care 14:353-8.
NHHRC 2009. National Health and Hospital Reform Commission 2009. A Healthier Future For All Australians – Interim Report December 2008. Canberra: Commonwealth of Australia.
Pettersen KI, Veenstra M, Guldvog B and Kolstad A 2004. The Patient Experience Questionnaire: development, validity and reliability. International Journal for Quality in Health Care 16:453-63.s
The Picker Institute Europe. Picker Institute Policy Position No 1: What do patients want from health care? Viewed 15 August 2008 <http://www.pickereurope.org/Filestore/Publications/Picker_Policy_1_what_do_patients_want.pdf>

231
Presence of appropriate incident monitoring arrangements Indicator Number: 54
Description: The proportion of facilities with incident monitoring systems, including sentinel events monitoring
Indicator status: Not currently reportable – indicator and/or data development required
Rationale (clinical/policy): Incident reporting can provide valuable insight into how and why adverse events occur so strategies and interventions can be devised to prevent similar occurrences (PSI 2008). Australian Health Ministers have agreed that all public hospitals should have incident monitoring arrangements, and they should report sentinel events. Sentinel events are defined as incidents in which unintended death or serious harm to a patient occurs (AIHW and ACSQHC 2007). The agreed national list of core sentinel events is:
• Procedures involving the wrong patient or body part
• Suicide of a patient in an in-patient unit
• Retained instruments or other material after surgery requiring re-operation or further surgical procedure
• Intravascular gas embolism resulting in death or neurological damage
• Haemolytic blood transfusion reaction resulting from ABO incompatibility
• Medication error leading to the death of a patient reasonably believed to be due to incorrect administration of drugs
• Maternal death or serious morbidity associated with labour or delivery
• Infant discharged to the wrong family
(AIHW and ACSQHC 2007).
States and territories have established sentinel event reporting systems for public hospitals from which the sentinel events for national reporting are derived. Reporting of the sentinel events is mandatory at the jurisdiction level. Most states and territories extend the mandatory reporting requirements for the sentinel events to other serious adverse events, identified by the severity of outcome and likelihood of recurrence. Where it is not mandatory to report at jurisdiction level, analysis and remedial action is taken at the hospital level (AIHW and ACSQHC 2007).
States and territories have also established incident reporting or monitoring arrangements for public hospitals and some other public sector facilities. Reporting or monitoring arrangements also exist in private hospitals and other facilities; the extent is unknown.
Numerator: Number of facilities with incident monitoring systems
Denominator: Total number of facilities
Indicator type: Structure
Disaggregation: National: Facility type, State/territory, Public hospital peer group, Public/private sector.
Related Indicators: 18 – Complications of transfusion

232
21 – Adverse drug events in hospitals
25 – Falls resulting in patient harm in care settings
26 – Complications of anaesthesia
30 – Postoperative haemorrhage
Issues/Comments: The types of facilities that will be included within the scope of this indicator need to be determined. The intention is that the indicator is broader than public hospitals (for which Ministers have required systems to be established for incident monitoring), and to include private hospitals and major types of non-hospital facilities, including residential aged care facilities.
There may need to be discussion as to what a ‘monitoring’ system is, that is, the extent to which it includes collection of incident information, analysis of the information, and the taking of actions in response to findings of analyses (both root cause analysis of selected incidents and other analysis of incident information).
Further development of this indicator may be dependent on the accreditation work currently being developed by the Australian Commission for Safety and Quality in Health Care. If a requirement to have appropriate incident monitoring systems in place becomes part of the accreditation process for all relevant facilities, this indicator will not be required.
Framework elements Quality Domain: Effective, safe
Service category: Multiple service categories (All)
Area of expenditure: Hospitals, Medical services, Community health and other, Other health practitioners, Dental services
National Data Comments
No Data currently available
Data development required Data development is required to define which facility types are within scope of this indicator, and then to establish reporting mechanisms for the existence of incident monitoring systems.
Data source To be determined
No international comparisons available
References
ACSQHC 2008. Australian Council for Safety and Quality in Health Care. Viewed 8 September 2008, <http://www.safetyandquality.org/internet/safety/publishing.nsf/Content/E2115B84DFEEAD48CA257483000D8463/$File/sentnlevnt31305.pdf>
AIHW and ACSQHC 2007. Australian Institute of Health and Welfare and Australian Commission on Safety and Quality in Health Care 2007. Sentinel events in Australian public hospitals 2004-05. Canberra: AIHW.
PSI 2008. Patient Safety International. Viewed 2 March 2009 <http://www.patientsafetyint.com/incident.aspx>
233
Accreditation of health care services Indicator number: 55
Description: The proportion of health care services that are accredited. This includes general practices, Aboriginal community controlled health organisations, hospitals and community pharmacies
Indicator status: Currently reportable – as per recommended specification
Rationale (clinical/policy): Accreditation is a systematic process and its purpose is to ensure that all health service providers in the health system provide the highest possible levels of safety and quality to consumers (ACSQHC 2008). Accreditation is recognised as having played an important role over the past three decades in improving safety and quality in the Australian health care system (ACSQHC 2003).
Accreditation in health care is the process whereby an external and independent body evaluates the degree of compliance by a health care organisation against previously determined standards and, if the organisation is found to be adequate, awards certification (Braithwaite et al. 2005). The accreditation process provides a system for an organisation to review their performance and improve in areas that are identified as deficit. In addition, accreditation has been used as a proxy indicator of the provision of quality health care services.
The ACSQHC has developed an ‘alternative’ model of safety and quality accreditation, the principles of which were endorsed by the Australian Health Ministers’ Conference in April 2008. Work is now proceeding on ‘phase one’ of the implementation of this model of accreditation, which will include:
• Development of a preliminary set of Australian Health Standards and exploration of options for their mandatory implementation
• Determining processes, costs and possible funding options to implementing this Alternative Model for Safety and Quality Accreditation
• A review and analysis of State and Territory private health facility licensing.
A review of overlaps and potential linkages between accreditation and the contractual obligations between States and Territory health services and health insurance funds, including opportunities to streamline safety and quality performance reporting in this domain, is planned (ACSQHC 2008)
Data are available for some facilities for this indicator. However, the types of facilities that should be included within the scope of this indicator in the longer term would need to be determined. The intention is that the indicator covers a wide range of health care providers, including public and private hospitals and major types of non-hospital facilities including general practices, Aboriginal community controlled health organisations, mental health services, dental services and community pharmacies. Residential aged care facilities could also be considered for inclusion. For some types of facilities, the indicator would draw on data relating to current accreditation arrangements. For others without accreditation arrangements or data relating to current arrangements, data would not currently be available.
Current accreditation arrangements and data can be summarised as follows.
General Practice Accreditation of general practice is a voluntary process that involves evaluating practices

234
against a set of national standards that have been developed by the Royal Australian College of General Practitioners (RACGP). General practices that are accredited have implemented, and been found to comply with, various criteria against the RACGP’s set of national standards. Practices may be accredited by one of two organisations that have been approved to undertake the accreditation assessment; Australian General Practice Accreditation Limited (AGPAL) and GPA Accreditation Plus (GPA) (SCRGSP 2009).
An increase in the proportion of practices that are accredited may indicate an improvement in the capacity of general practices to deliver high quality services. Importantly, however, general practices without accreditation may also deliver services of equally high quality. For a particular general practice, the decision to seek accreditation might be influenced by perceived costs and benefits unrelated to its quality standards. Accreditation does affect eligibility for some government programs, such as the Practice Incentive Program (PIP), so there are financial incentives for gaining accreditation (AIHW 2008, SCRGSP 2009).
Hospitals Accreditation of public hospitals is voluntary in all jurisdictions except Victoria, where it is now mandatory for all public hospitals (excluding those that provide only dental or mothercraft services). Public hospitals can achieve accreditation through the Australian Council on Healthcare Standards (ACHS) Evaluation and Quality Improvement Program (EQuIP), Business Excellence Australia (previously known as the Australian Quality Council), the Quality Improvement Council, and through certification as compliant with the International Organization for Standardization’s (ISO) 9000 quality family or other equivalent programs. Jurisdictions apply specific criteria to determine which accreditation programs are suitable. Quality programs require hospitals to demonstrate continual adherence to quality improvement standards to gain and retain accreditation. ‘Accreditation’ is reported as the ratio of accredited beds to all beds in public hospitals, because the number of beds indicates the level of hospital capacity or activity (SCRGSP 2009).
Accreditation of private hospitals is a voluntary process in all jurisdictions. Like public hospitals, private hospitals can achieve accreditation through ACHS EQuIP, ISO 9000 and Business Excellence Australia, but also through Benchmark Certification (ABS 2008).
Conclusions should not be drawn about the quality of care in those hospitals that do not have accreditation. The costs of preparing a hospital for accreditation are significant, so a low level of accreditation may reflect cost constraints rather than poor quality. Also, the cost of accreditation may not rise proportionally with hospital size. This would be consistent with larger hospitals being more active in seeking accreditation (because it is relatively less costly for them) (SCRGSP 2009).
Aboriginal community controlled health organisations The 2007–08 Budget measure ‘A Better Future for Indigenous Australians – Establishing Quality Health Standards’ (EQHS) provides a framework to support Aboriginal and Torres Strait Islander community controlled health organisations (ACCHO) services to become accredited under the appropriate Australian health care standards (DoHA 2009).
The form that the accreditation will take is dependent on the type of health service. For example, services providing general practice would pursue accreditation against the Royal Australian College of General Practitioner Standards. Other types of service delivery may be accredited through an alternative accreditation framework. For example, Quality Improvement Council (QIC) modules addressing Home Based Care services, Social and Emotional Wellbeing services, Substance Use services and others. (DoHA 2009)

235
ACCHO which obtain clinical or other service delivery accreditation will then be supported to work towards organisational accreditation, for example, through the QIC or International Standards Organisations (ISO) or the Australian Council on Healthcare Standards (ACHS), as appropriate to their organisation (DoHA 2009). Community Pharmacies Accreditation of community pharmacies is a voluntary process that involves evaluating pharmacies against a set of national standards that have been developed by the Pharmacy Guild’s Quality Care Pharmacy Program (QCPP). These standards cover the professional practice standards of the Pharmaceutical Society and the Standards for the Provision of Pharmacist Only and Pharmacy Medicines (PGoA).
Numerator: The number of:
1. General practices that are accredited
2. Aboriginal community controlled health organisations that are accredited
3. Hospitals that are accredited
4. Community pharmacies that are accredited
5. Other health care provider facilities that are accredited
Denominator: The number of:
1. All general practices
2. All Aboriginal community controlled health services
3. All hospitals
4. All community pharmacies
5. All other relevant health care provider facilities
Indicator type: Structure
Disaggregation: National: Remoteness, public hospital peer groups, public/private hospital sector, other facility/organisation type, State/Territory, Divisions of general practice, Type of facility/organisation
Related Indicators: 11 - Quality of Community Pharmacy Services
41 – Quality of palliative care
54 – Presence of appropriate incident monitoring arrangements
Issues/Comments: Interpretation of data relating to facilities needs to be undertaken with caution, as facilities can vary markedly in size. Where possible, it is better to compare on the basis of size of facility – for example, to report on the number of beds that are in accredited hospitals as a proportion of the number of beds in all hospitals. It should be noted that general practices without accreditation may also deliver services of equally high quality to accredited practices. For a particular general practice, the decision to seek accreditation might be influenced by perceived costs and benefits unrelated to its quality standards (AIHW 2008, SCRGSP 2008).
Similarly, conclusions should not be drawn about the quality of care in those hospitals that do not have accreditation. The costs of preparing a hospital for accreditation are significant, so a low level of accreditation may reflect cost constraints rather than poor quality. Also, the cost of accreditation may not rise proportionally with hospital size. This would be consistent

236
with larger hospitals being more active in seeking accreditation (because it is relatively less costly for them) (SCRGSP 2008).
Should mandatory accreditation of all health services be implemented, this proposed indicator would become redundant.
Framework elements Quality Domain: Effective, capable
Service category: Multiple service categories (All)
Area of expenditure: Hospitals, Medical services, Community health and other, Dental services, Other health practitioners
National Data Comments
National data currently available
Data development required Further work to clarify scope of the indicator and to source data on accreditation of facilities for which data are not currently available nationally
Data source General Practice: Department of Health and Ageing Hospitals: National public hospital establishments database (public hospitals), Private Health Establishments Collection (private hospitals)
Aboriginal community controlled health organisations: Department of Health and Ageing
Community Pharmacies: Pharmacy Guild’s Quality Care Pharmacy Program
Data collection arrangements Accreditation organisations
Data available annually
Time lag from collection to reporting: Latest reports available in each case are as follows:
General Practice: Current 2007
Hospitals: Public hospital 2006-07; Private hospital 2005-06
Aboriginal community controlled health organisations: 2005–06
Community Pharmacies: 2006
No international comparisons available

237
Presentation of available data
0.0
10.0
20.0
30.0
40.0
50.0
60.0
70.0
80.0
90.0
100.0
General practice Public hospitals Private hospitals ACCHO Communitypharmacy
Percent
Note
1. General practices accredited at June 2007.
2. Public and private hospitals accredited at June 2007.
3. Aboriginal community controlled health organisations (ACCHO) accredited in 2006.
4. Community pharmacies accredited in 2005.
5. The numerator and denominator as presented above are consistent with the proposed safety and quality indicator. However, the recommended disaggregations were not available and so national figures have been presented.
Sources:
1. General practice: Report on Government Services 2008.
2. Public and private hospitals: Australian hospital statistics 2006-07.
3. ACCHO: Aboriginal and Torres Strait Islander Health Performance Framework, 2006.
4. Community pharmacy: QCPP, <www.guild.org.au/qcpp/content.asp?id=123>
Accreditation rates by health care service category (per cent)
What these data show
• Highest rates of accreditation were for public hospitals and community pharmacies.
References
ABS 2008. Australian Bureau of Statistics 2008. Private Hospitals 2006-07. Canberra: ABS.
ACSQHC 2008. UPDATE: Review of National Safety and Quality Accreditation Standards May 2008. Accessed 02/10/2008. <http://www.safetyandquality.gov.au/internet/safety/publishing.nsf/Content/PriorityProgram-07>
238
ACSQHC 2003. Australian Council for Safety and Quality in Health Care. 2003. Standards Setting and Accreditation Systems in Health: Consultation Paper. Canberra: Commonwealth of Australia.
AHMAC 2006. Australian Health Ministers Advisory Council 2006. Aboriginal and Torres Strait Islander Health Performance Framework. Canberra: AHMAC.
AIHW 2008. Australian Institute of Health and Welfare 2008. Australia’s Health 2008. Canberra. AIHW. Braithwaite J, Healey J & Dwan K 2005. The Governance of Health Safety and Quality: a discussion paper. Safety and Quality Council.
DoHA 2009. Australian Government Department of Health and Ageing. Health Service Accreditation – Aboriginal and Torres Strait Islander Health. Accessed 09/03/2009.
<http://www.health.gov.au/internet/main/publishing.nsf/Content/healthservicesaccreditation>
NHPC 2004. National Health Performance Committee 2004. National report on health sector performance 2003. Canberra. AIHW.
SCRGSP 2009. Steering Committee for the Review of Government Service Provision 2009. Report on Government Services 2009. Canberra. Productivity Commission.

239
Appendix 2: Consultation Process
National Indicators Advisory Group The National Indicators Advisory Group (NIAG) was established in February 2008 to provide advice, information, expertise and critical thought, and to act as a sounding board regarding the project. Representation on NIAG broadly reflects the diverse range of stakeholders. NIAG is chaired by the Chief Executive of the Australian Commission on Safety and Quality in Health Care, and the following organisations/individuals are represented on NIAG:
Australian Commission on Safety and Quality in Health Care
Australian Council on Health Care Standards
Australian General Practice Network
Australian Health Insurance Association
Australian Institute of Health and Welfare
Australian Private Hospitals Association
Centre for Research Excellence in Patient Safety, Monash University
NSW Clinical Excellence Commission
Committee of Presidents of Medical Colleges
Consumers’ Health Forum
Department of Health and Ageing
Department of Veteran Affairs
Dr Chris Farmer
Inter Jurisdictional Committee of the Commission
National e-health and Information Principal Committee of AHMAC
National Health and Medical Research Council
National Mental Health Information Strategy Subcommittee of AHMAC
National Prescribing Service
Royal Australian College of General Practitioners

240
Key messages from stakeholder consultation The formal consultation process for the draft set of indicators was run between early November 2008 and February 2009, as discussed in section 2.1. This section presents a summary of the responses received and key messages, with further detail provided in the detailed tables/boxes later in the ‘Consultation Feedback – in detail’ section of this appendix.
Participation
There were around 250 invitations to individuals and/or organisations (Box A2.1) to provide feedback, which were initially sent out by either the AIHW or ACSQHC in early November 2008. In addition, there were over 30 requests from interested organisations and individuals to access the consultation papers and provide feedback. This additional interest mainly followed a series of presentations relating to the indicators project at a number of conferences and workshops in November and December 2008, as well as generation by word-of-mouth. In addition, feedback was requested internally within the AIHW, including from collaborating units, and through members of the NIAG.
In total, there were 57 feedback responses received (Box A2.2), about a 23 percent response rate when compared to the number who were invited. The scope of the individual responses varied considerably, ranging from comprehensive responses using the feedback form provided through to single page overviews.
There were 44 responses using the feedback form and, as expected, the number of indicators on which each respondent commented was governed by the respondent’s range of expertise. Few respondents commented on all of the 58 proposed indicators.
Examining traffic on the consultation website from November 2008 until February 2009 there were:
• 972 visits to the consultation website
• 547 visits to the Towards national indicators of safety and quality in health care: Discussion paper
• 318 visits to the discussion paper’s support project OECD patient safety indicators, Australian evaluation
• 273 visits to the paper’s support project Measuring and reporting mortality in hospital patients
• 329 visits to the support project: A focus on primary health care
Feedback responses
Coverage of framework areas, gaps and omissions
Overall the feedback responses indicated that the proposed indicator set provided appropriate coverage of the framework areas. There were 27 feedback responses received where at least one response was provided to the question – Does the proposed indicator set provide an appropriate coverage of the following areas? (Table A2.1).
The categories, Dimensions of quality and Major disease and injury groups contributing to the major areas of health expenditure, both had around 77 percent of responses rating the proposed indicator set as providing appropriate coverage of framework areas.

241
The category with the lowest number of responses indicating that coverage was appropriate (64%) was Major areas of health expenditure.
There were 19 feedback responses which provided an assessment of the coverage for all of the framework elements. Of these 11 respondents rated the coverage of the indicator set for all framework areas as appropriate, three indicated that none of the areas were appropriately covered, while the remainder provided a mixed response.
A number of respondents suggested improvements for coverage, including:
• Health care provided in the community setting
• Other allied health services
• Preventative measures undertaken in general practice.
Feedback relating to some of these issues was also provided by respondents when asked to comment on any gaps or omissions in the proposed indicator set. This feedback has resulted in a number of new indictors being added (see page 255).
There were 38 feedback responses which made comments relating to gaps or omissions. Except for the three areas noted above, there was no common theme to these responses, with most being restricted to the respondent’s area of expertise.
In response to this feedback regarding framework coverage and other gaps or omissions, five indicators were added to cover the following areas: blood/blood product transfusion, preventative care occurring in general practice, multidisciplinary care in sub-acute care and child health (see page 255).
Additional Comments
A number of responses commented on the costs associated with developing indicators, establishing new data collections and the burden of data collection and reporting by health care organisations. It is recognised that some additional resources would be needed to implement a national indicator set, but such costs are not within the scope of this project.
The indicators
There were 44 responses which used the feedback form for at least one of the proposed indicators. For each indicator, feedback was requested as follows:
1. Responding to the question, Should this indicator be included in the national safety and quality indicators set? Overall, respondents rated those indicators which were included in the draft proposed set positively. Aggregating all of the responses to the individual indicators, there were around 30% ‘strongly agree’, 35% ‘agree’, 23% ‘neutral’, 10% ‘disagree’ and 3% ‘strongly disagree’ (Table A2.2).
2. Identifying the purpose for which reporting of the indicator would be appropriate (Table A2.3). Aggregating all of the responses to the individual indicators there were around:
• 22% for Inform the general public about the safety and quality of the health system overall
• 19% for Inform discussion and decision-making about overall priorities and system-level strategies for safety and quality improvement
• 31% for Report on the safety and quality of aspects of specific health care services
• 28% for Provide information to the providers of the services that would directly inform their quality improvement activities

242
Conclusions
Overall the response to the Discussion paper and proposed indicators was positive. As expected, there were differing views about how to put the process into operation, about the coverage of the proposed indicators, about the proposed data sources to inform indicators, and so forth.
The feedback through the consultation process has provided the opportunity for the AIHW to further refine the national indicators work in preparing this final report. For example, following the feedback some of the proposed indicators have been removed from the national set and new ones have been added, as detailed below.
Overall, the majority of respondents recognised the importance of a national approach to safety and quality to drive improvement in the health system and of developing relevant indicators. Considerable support was expressed, in particular willingness by organisations to participate in any future development work.
Proposed indicators that were removed or revised and new indicators added As discussed previously, ‘clinical care’ was defined for this project as health care provided to patients. This meant that public health, environmental health and occupational health and safety activities were out of scope for this project.
The following dimensions of quality were considered to be in scope: appropriate, effective, continuous and responsive. Following consultation with NIAG and the Commission, access was excluded, reflecting a focus on the safety and quality of clinical care actually received rather than whether or not health services were accessible.
Since the following three indicators are seen as mostly related to the dimension of access, they were removed from the proposed set:
• Antenatal visit in the first trimester of pregnancy/before 20 weeks gestation
• Children with hearing loss
• Waiting times for radiotherapy
Three indicators originally included in the proposed set were removed because they were seen as open to numerous influences outside of clinical care, including socioeconomic status, diet, and access to health services:
• Low birth-weight infants
• Decayed, missing and filled teeth among primary school children
• Infant/child mortality
Seven indicators were removed following the formal consultation feedback process. The reasons for the removal of these indicators included: concerns about the validity of the indicator and whether it was an effective measure of an aspect of safety and quality, a limited or unclear evidence base, and a lack of agreement on what would be a ‘good’ level for the indicator and therefore what would be the desired direction of change over time:
• Thrombolysis for stroke
243
A common theme throughout the feedback was that, unlike thrombolysis for AMI, thrombolysis for stroke is still developing as a treatment, and there are a number of variables that affect the ability to give it within the therapeutic window, such as timely access to CAT scan facilities and to a scan’s interpretation by a stroke physician. As such, the usefulness of this indicator was questionable outside of large tertiary facilities.
• Knee and hip replacement revision within five years
Based on the feedback, it became clear that the number of revisions occurring within five years which were attributable to poor quality of surgical care would be impossible to measure. Respondents identified that there are multiple factors which can contribute to early revision, which involves a complex interaction between patient factors, the type of prostheses and the technical ability of the surgeon.
• Appropriate use of antibiotics for URTI
This indicator was generally supported through the feedback, however the usefulness of reporting this indicator was questionable as there was no agreement or evidence as to the ‘appropriate’ rate of prescribing for URTI.
• Appropriate prophylaxis for VTE
There was strong support for the two process and one outcome VTE indicators but to provide a more economical set, it was decided to only include one process and one outcome indicator. The particular process indicator was excluded for several reasons, such as definitional issues about what is clinically ‘appropriate’ prophylaxis; and difficulties in collecting data, such as the need to perform chart reviews to determine ‘appropriate’ prophylaxis.
• Management of congestive heart failure (CHF)
From the feedback received it became clear that this indicator, as presented, provided only a narrow view of the quality of care received by patients with CHF, specifically relating to medication management in hospital. As most care for CHF patients occurs in the primary care setting, and rehabilitation for patients in the community includes a much broader treatment regimen than medication management, the usefulness of this indicator is questionable.
• Post-operative respiratory failure
Feedback on this indicator raised concerns regarding the strength of the evidence linking quality of anaesthetic care to this outcome.
• Survival rate for out of hospital cardiac arrest following ambulance service intervention
Generally, the feedback responses received for this indicator expressed concerns that this outcome was only partly attributable to interventions by ambulance personnel, and could be significantly impacted by other factors. A more relevant measure was considered to be ambulance response times, however this is a measure of accessibility and thus beyond the scope of this indicator set.
It was decided to align the indicators in this safety and quality set with similar indicators that were endorsed by COAG for the NHCA in late 2008. As a result:
• Continuity of care – was changed to Timely transmission of discharge summaries
• Treatment of depression in primary care – was replaced by Mental health care plans in general practice

244
• Definitions of a number of other indicators were revised, for example Adverse drug events in hospitals
A number of ‘new’ indicators were added following the consultation feedback process. These include:
• Complications of transfusion
• Health care amenable mortality
• Malnutrition in hospitals and residential aged care facilities
• Immunisation rates for vaccines in the national schedule
• Cervical cancer screening rates
• Potentially preventable deaths
• Multi-disciplinary care plans in sub-acute care
• Developmental health checks in children
There were two health care service types where the proposed indicator was not supported by stakeholders and a suitable alternative indicator has yet to be identified, but a relevant indicator was still considered desirable:
• Dental
• Ambulance

245
Consultation Feedback – in detail
Box A2.1: Organisations invited to participate in feedback
Australian Dental Association - Tasmania
National Health & Medical Research Council
Society of Hospital Pharmacists of Australia
Department of Community Emergency Health and Paramedic Practice, Monash University
Australian Health Insurance Association John Fleming Centre for Advancement of Legal Research
Royal Australasian College of Surgeons Department of Health and Human Services, Tasmania
Clinical Excellence Commission, New South Wales
South Australia, Department of Health Commonwealth, Department of Veteran’s Affairs
Department of Health and Community Services, Northern Territory
Central Australian Aboriginal Congress Flinders University, Faculty of Health Sciences, School of Medicine
South Australian Dental Service
Therapeutic Goods Administration Royal Australian College of Physicians Office for Aboriginal and Torres Strait Islander Health
Primary Health Care Research, School of Medicine, University of Notre Dame
Department of Human Services, Victoria Australian Primary Care Collaboratives
Australian Dental Association - Queensland
Aged Care Association Australia – Western Australia
Aboriginal Health Council of South Australia
Australian General Practice Network Australian Cardiovascular Health and Rehabilitation Association
NHMRC Centre of Research Excellence in Patient Safety
Aged Care Association Australia – South Australia
Western Australia General Practice Network
Queensland Health
Women's Hospitals Australasia Aboriginal Health and Medical Research Council of New South Wales
Australian College of Rural and Remote Medicine
Aged Care Standards and Accreditation Agency
Palliative Care Australia Jean Hailes Foundation
National Aboriginal Community Controlled Health Organisation
Commonwealth Department of Health & Ageing
New South Wales Health
Australian Capital Territory Health Consumers Health Forum General Practice. School of Primary, Aboriginal and Rural Health Care. The University of Western Australia
Repatriation General Hospital, Adelaide Office for Aboriginal and Torres Strait Islander Health
Australian Psychological Society
Australian Dental Association - New South Wales
Australasian Rehabilitation Outcomes Centre
Primary Care Research Unit Department of General Practice. University of Melbourne
Australian Dental Association - Western Australia
Victorian Aboriginal Community Controlled Health Organisation
School of Pharmacy and Medical Sciences, University of South Australia
Centre for Allied Health Evidence Australian Orthopaedic Association Quality in Practice/Australian General Practice Accreditation
Royal Australian College of General Practitioners
Australian Medical Association UNSW Research Centre for Primary Health Care and Equity, School of Public Health and Community Medicine
Research Centre for Injury Studies Flinders University
Australian Council on Healthcare Standards
Victorian Quality Council
Australian Centre for Economic Research on Health.
Royal Australian and New Zealand College of Obstetricians and Gynaecologists
Western Australian Office of Safety and Quality
Primary Health Care Research and Information Service
New South Wales Therapeutic Advisory Group
Aboriginal Health Council of Western Australia
Academic Unit of General Practice & Community Health, ANU
Stroke Foundation Australian Health Policy Institute
Western Australia Therapeutics Advisory Group
ACT Division of General Practice Northern Territory Council on Safety and Quality in Health Care
Aged Care Association Australia, NSW National Centre for Classification in Health
St Vincent's Health, Victoria
General Practice Tasmania Aged & Community Care Victoria Victorian Therapeutics Advisory Group
Dental Health Services Victoria Australian Physiotherapy Association Palliative Care Outcomes Collaboration

246
Australian Public Health Association Australian Private Hospital Association General Practice Victoria
South Australian Safety and Quality Council
Mount Isa Centre for Rural and Remote Health, Faculty of Medicine, Health & Molecular Sciences, James Cook University
Aboriginal Medical Services Alliance Northern Territory
Australian College of Ambulance Professionals
Australian Dental Association - Victoria The Joanna Briggs Institute
National Institute of Clinical Studies Pharmacy Guild Department of General Practice, Monash University
Clinical Governance Unit, Bayside Health, Victoria
Australian Healthcare and Hospitals Association
NSW Health Greater Western Area Health Service
Flinders University, School of Medicine Mental Health and Drug & Alcohol Office NSW Health
Queensland Aboriginal and Islander Health Council
Faculty of Health Science & Medicine, Bond University
Princess Alexandria Hospital, Brisbane General Practice South Australia
National Joint replacement registry Southern Adelaide Health Service Western Australian Department of Health
National Perinatal Statistics Unit Clinical Council, ACT Wodonga Regional Health Service, Victoria
Tasmanian Association for Quality in Health Care
National Blood Authority Health Quality and Complaints Commission, Queensland
School of Public Health and Community Medicine, University of NSW
Patient Safety Centre, Centre for Healthcare Improvement, Queensland Health
Royal College of Pathologists Australia
Aged Care Queensland Diabetes Australia Aged Care Association Australia
Menzies Centre for Health Policy National Prescribing Service Australian Dental Association - Northern Territory
Australian Dental Association - South Australia
Cancer Australia Royal Australian & NZ College of Radiologists
Department of General Practice, University of Melbourne
Cardiac Society of Australia and New Zealand
Royal College of Nursing, Australia
The Council of Ambulance Authorities Australian College of Midwives The Australasian Society for Infectious Diseases
Australian and New Zealand College of Anaesthetists
Rural Doctors Association
Australian Diabetes Society
Royal Australian and New Zealand College of Ophthalmologists
Australian Rheumatology Association Royal College of Dental Surgeons
Royal Australian and New Zealand College of Psychiatrists
National Heart Foundation
Australian and New Zealand Intensive Care Society
Australasian College for Emergency Medicine
Australian and New Zealand Society for Geriatric Medicine
Australia and New Zealand Society of Palliative Medicine
Catholic Health Australia Department of Health, Western Australia

247
Box A2.2: Organisations which provided feedback responses
Surgical & Specialty Services Division
Flinders Medical Centre
Australasian College for Emergency Medicine
Royal District Nursing Service
Cardiac Society of Australia and New Zealand
Department of Health and Community Services, Northern Territory
Dieticians Association of Australia
National Stroke Foundation Australian General Practice Statistics and Classification Centre
National Prescribing Service
Royal Australian College of Physicians Mental Health Information Subcommittee
Australian Council on Healthcare Standards
Department of Health, Western Australia Queensland Health Quality in Practice/Australian General Practice Accreditation
NSW Therapeutic Advisory Group Cancer Institute, NSW Department of Human Services, Victoria
Australian General Practice Network Clinical Governance Unit, Alfred Health Australian Private Hospital Association
NHMRC Centre of Research Excellence in Patient Safety
National Perinatal Statistics Unit Mater Health Services Brisbane
South Australia, Department of Health National Health & Medical Research Council
The Council of Ambulance Authorities
Australasian Society of Clinical and Experimental Pharmacologists and Toxicologists
Australian and New Zealand Society of Palliative Medicine
Commonwealth Department of Health & Ageing
Australian and New Zealand College of Anaesthetists
Royal Australian and New Zealand College of Radiologists
Royal Australian and New Zealand College of Obstetricians and Gynaecologists
Royal College of Pathologists Australia
Royal Australian and New Zealand College of Psychiatrists
Health Care Quality and Complaints Commission Queensland
National Blood Authority
ACT Health
Australasian Rehabilitation Outcomes Centre
Australian Psychological Society
Australian Health Insurance Association
National Centre for Classification in Health
Victorian Quality Council Cancer Australia Australian Orthopaedic Association
Royal College of Nursing, Australia Australian College of Midwives Royal Australasian College of Surgeons
Women’s Hospitals Australasia
Health quality and complaints commission
Australian Rheumatology Association
Royal Australian College of General Practitioners

248
Table A2.1: Appropriateness of coverage of the proposed indicator set
Response given re whether coverage is appropriate (percent)
Category Number of responses Yes No
Dimensions of quality
22 77.3 22.7
Health care settings
26 65.4 34.6
National health priority areas
24 75.0 25.0
Burden of disease groups 21 66.7 33.3
Major areas of health expenditure
22 63.6 36.4
Major disease and injury groups contributing to the major areas of health expenditure
22 77.3 22.7

249
Table A2.2: Responses for individual indicators
Number responses given
Indicator Total number of responses
Strongly disagree Disagree Neutral Agree
Strongly agree
Indicator 1: Birth trauma - injury to neonate 14 0 1 5 4 4
Indicator 2: Low birth weight infants 13 1 3 5 1 3
Indicator 3: Decayed, missing and filled teeth among primary school children
11 0 1 4 3 3
Indicator 4: Oral health in residential aged care
11 0 0 5 4 2
Indicator 5: Eye testing for target population 11 0 0 6 0 5
Indicator 6: Failure to diagnose 19 1 5 2 7 4
Indicator 7: Potentially preventable hospitalisations
17
0 3 3 7 4
Indicator 8: Assessment for risk of venous thromboembolism
20 0 3 1 7 9
Indicator 9: Appropriate prophylaxis for venous thromboembolism
19 2 0 4 7 6
Indicator 10: Appropriate use of antibiotics in general practice for upper respiratory tract infections
13 0 1 3 5 4
Indicator 11: Survival from out-of-hospital cardiac arrest following ambulance service intervention
10 1 2 3 4 0
Indicator 12: Pain management in the Emergency Department
16 0 2 3 8 3
Indicator 13: Thrombolysis for Acute Myocardial Infarction
17 1 2 3 5 6
Indicator 14: Thrombolysis for Stroke 18 1 3 2 6 6
Indicator 15: Stoke patients treated in a stroke unit
15 0 0 3 6 6
Indicator 16: Management of Acute Myocardial Infarction
18 1 1 2 9 5
Indicator 17: Management of Chronic Heart Failure
17 0 1 1 11 4
Indicator 18: Mental health inpatients having seclusion
17 0 1 6 5 5
Indicator 19: Health Care Associated Infections (HCAI) acquired in hospital
19 1 0 3 6 9
Indicator 20: Staphylococcus aureus (including MRSA) bacteraemia in acute care hospitals
17 1 0 2 6 8
Indicator 21: Adverse drug events 21 2 3 4 6 6
Indicator 22: Pressure ulcers in care settings 18 0 0 3 5 10
Indicator 23: Falls resulting in patient harm (in a health or aged care setting)
15 0 0 3 6 6
Indicator 24: Intentional self-harm in hospitals 14 1 3 4 4 2
Indicator 25: Complications of anaesthesia 15 0 2 3 5 5
Indicator 26: Accidental puncture/laceration (technical difficulty with procedure)
13 1 2 7 2 1

250
Number responses given
Indicator Total number of responses
Strongly disagree Disagree Neutral Agree
Strongly agree
Indicator 27: Obstetric trauma - third and fourth degree perineal tears acquired during childbirth
14 1 0 4 5 4
Indicator 28: Postoperative respiratory failure 14 1 2 3 7 1
Indicator 29: Postoperative haemorrhage 14 1 0 5 6 2
Indicator 30: Postoperative pulmonary embolism (PE) or deep vein thrombosis (DVT)
19 0 3 3 5 8
Indicator 31: Unplanned return to operating theatre in same admission
14 0 2 2 6 4
Indicator 32: Unplanned re-admission to an Intensive Care Unit
13 0 2 1 7 3
Indicator 33: Unplanned hospital readmissions 17 0 3 2 7 5
Indicator 34: Failure to prevent a clinically important deterioration (Failure to rescue)
14 3 1 5 3 2
Indicator 35: Risk-adjusted In-hospital Mortality
17 0 3 4 3 7
Indicator 36: Death in low mortality DRGs 15 0 3 5 3 4
Indicator 37: Independent peer review of surgical deaths
15 0 2 4 4 5
Indicator 38: Presence of appropriate incident monitoring arrangements including sentinel events monitoring
17 0 3 3 4 7
Indicator 39: Knee and hip replacement revision within 5 years
17 1 1 4 9 2
Indicator 40: Cancer survival 13 1 2 3 5 2
Indicator 41: Continuity of care - discharge planning
23 0 1 3 9 10
Indicator 42: Post-discharge community care for mental health patients
17 0 2 3 6 6
Indicator 43: Functional gain achieved in rehabilitation
12 0 0 4 4 4
Indicator 44: Enhanced primary care services in general practice
13 2 0 4 4 3
Indicator 45: General practices with a register and recall system for patients with chronic disease
13 0 0 3 4 6
Indicator 46: People with asthma who have a written asthma action plan
17 0 2 3 9 3
Indicator 47: Management of hypertension in general practice
12 0 1 4 4 3
Indicator 48: Management of chronic pain in arthritis and musculoskeletal conditions
14 1 2 5 3 3
Indicator 49: Annual cycle of care within general practice for people with diabetes
13 0 1 2 4 6
Indicator 50: End stage kidney disease in people with diabetes
12 2 0 3 3 4
Indicator 51: Lower-extremity amputation in people with diabetes
12 1 2 4 5 0
Indicator 52: Treatment of depression in primary care
12 0 1 4 3 4
Indicator 53: Inappropriate co-prescribing of medicines
19 0 4 4 8 3
Indicator 54: People receiving a home medicine review
15 0 1 6 5 3
Indicator 55: Quality of Palliative Care 13 0 2 3 4 4

251
Number responses given
Indicator Total number of responses
Strongly disagree Disagree Neutral Agree
Strongly agree
Indicator 56: Quality of Community Pharmacy Services
11 0 0 5 5 1
Indicator 57: Accreditation of health care services
19 0 2 1 9 7
Indicator 58: Patient experience 17 0 1 1 6 9

252
Table A2.3: Response to what the purpose of the indicators should be
Number response given
Indicator
Inform the general public
about the safety and quality of the
health system overall
Inform discussion and decision-making
about overall priorities and system-level
strategies for safety and quality
improvement
Report on the safety and quality of aspects of specific health care
services
Provide information to the providers of the services
that would directly inform their quality improvement
activities
Indicator 1: Birth trauma - injury to neonate
6 3 8 8
Indicator 2: Low birth weight infants
3 1 3 3
Indicator 3: Decayed, missing and filled teeth among primary school children
5 4 4 2
Indicator 4: Oral health in residential aged care
5 3 5 6
Indicator 5: Eye testing for target population
5 4 4 3
Indicator 6: Failure to diagnose
9 5 9 4
Indicator 7: Potentially preventable hospitalisations
7 5 6 4
Indicator 8: Assessment for risk of venous thromboembolism
7 5 14 14
Indicator 9: Appropriate prophylaxis for venous thromboembolism
7 6 13 12
Indicator 10: Appropriate use of antibiotics in general practice for upper respiratory tract infections
3 5 8 4
Indicator 11: Survival from out-of-hospital cardiac arrest following ambulance service intervention
3 2 3 3
Indicator 12: Pain management in the Emergency Department
6 5 14 9
Indicator 13: Thrombolysis for Acute Myocardial Infarction
8 6 11 12
Indicator 14: Thrombolysis for Stroke
8 6 11 12
Indicator 15: Stoke patients treated in a stroke unit
8 8 8 10
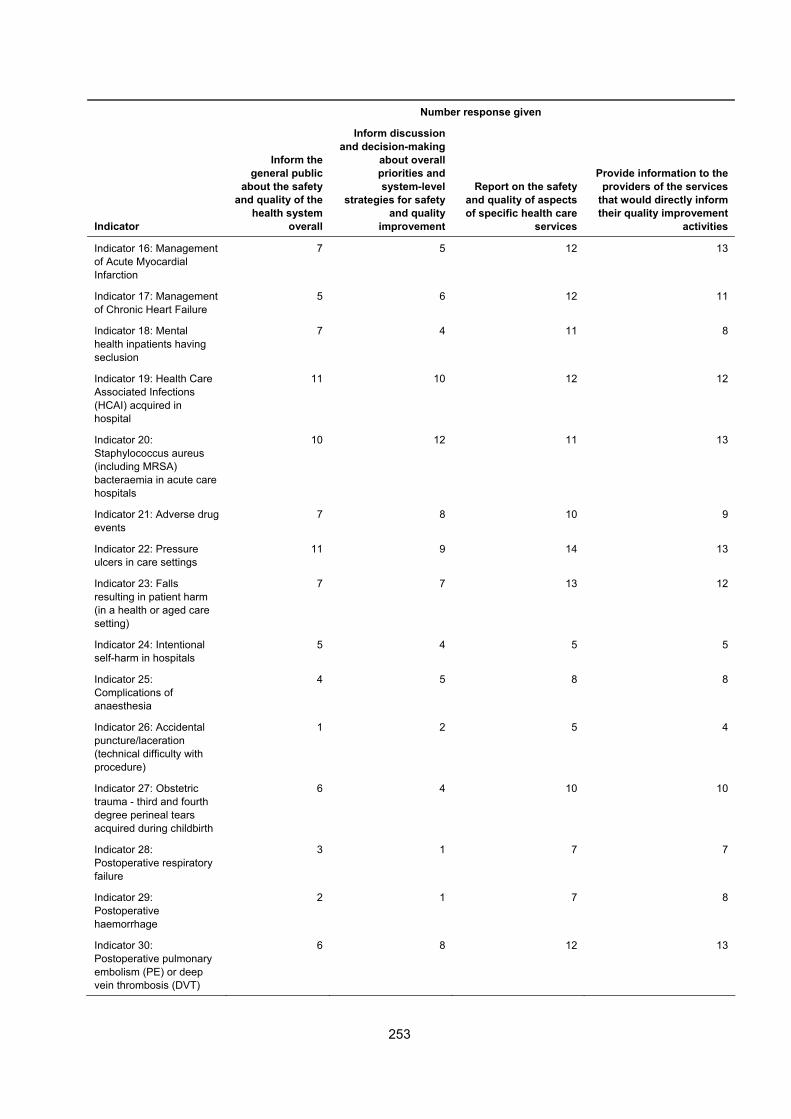
253
Number response given
Indicator
Inform the general public
about the safety and quality of the
health system overall
Inform discussion and decision-making
about overall priorities and system-level
strategies for safety and quality
improvement
Report on the safety and quality of aspects of specific health care
services
Provide information to the providers of the services
that would directly inform their quality improvement
activities
Indicator 16: Management of Acute Myocardial Infarction
7 5 12 13
Indicator 17: Management of Chronic Heart Failure
5 6 12 11
Indicator 18: Mental health inpatients having seclusion
7 4 11 8
Indicator 19: Health Care Associated Infections (HCAI) acquired in hospital
11 10 12 12
Indicator 20: Staphylococcus aureus (including MRSA) bacteraemia in acute care hospitals
10 12 11 13
Indicator 21: Adverse drug events
7 8 10 9
Indicator 22: Pressure ulcers in care settings
11 9 14 13
Indicator 23: Falls resulting in patient harm (in a health or aged care setting)
7 7 13 12
Indicator 24: Intentional self-harm in hospitals
5 4 5 5
Indicator 25: Complications of anaesthesia
4 5 8 8
Indicator 26: Accidental puncture/laceration (technical difficulty with procedure)
1 2 5 4
Indicator 27: Obstetric trauma - third and fourth degree perineal tears acquired during childbirth
6 4 10 10
Indicator 28: Postoperative respiratory failure
3 1 7 7
Indicator 29: Postoperative haemorrhage
2 1 7 8
Indicator 30: Postoperative pulmonary embolism (PE) or deep vein thrombosis (DVT)
6 8 12 13

254
Number response given
Indicator
Inform the general public
about the safety and quality of the
health system overall
Inform discussion and decision-making
about overall priorities and system-level
strategies for safety and quality
improvement
Report on the safety and quality of aspects of specific health care
services
Provide information to the providers of the services
that would directly inform their quality improvement
activities
Indicator 31: Unplanned return to operating theatre in same admission
4 5 10 9
Indicator 32: Unplanned re-admission to an Intensive Care Unit
5 3 10 9
Indicator 33: Unplanned hospital readmissions
7 6 12 12
Indicator 34: Failure to prevent a clinically important deterioration (Failure to rescue)
3 3 7 5
Indicator 35: Risk-adjusted In-hospital Mortality
7 8 11 9
Indicator 36: Death in low mortality DRGs
6 3 8 7
Indicator 37: Independent peer review of surgical deaths
5 3 9 7
Indicator 38: Presence of appropriate incident monitoring arrangements including sentinel events monitoring
9 9 10 8
Indicator 39: Knee and hip replacement revision within 5 years
6 6 9 8
Indicator 40: Cancer survival
5 6 4 4
Indicator 41: Continuity of care - discharge planning
13 10 15 16
Indicator 42: Post-discharge community care for mental health patients
9 7 9 8
Indicator 43: Functional gain achieved in rehabilitation
4 4 7 8
Indicator 44: Enhanced primary care services in general practice
7 2 7 3
Indicator 45: General practices with a register and recall system for patients with chronic disease
5 4 8 5

255
Number response given
Indicator
Inform the general public
about the safety and quality of the
health system overall
Inform discussion and decision-making
about overall priorities and system-level
strategies for safety and quality
improvement
Report on the safety and quality of aspects of specific health care
services
Provide information to the providers of the services
that would directly inform their quality improvement
activities
Indicator 46: People with asthma who have a written asthma action plan
4 4 9 6
Indicator 47: Management of hypertension in general practice
4 1 6 4
Indicator 48: Management of chronic pain in arthritis and musculoskeletal conditions
2 3 5 3
Indicator 49: Annual cycle of care within general practice for people with diabetes
6 3 7 3
Indicator 50: End stage kidney disease in people with diabetes
5 3 4 3
Indicator 51: Lower-extremity amputation in people with diabetes
4 3 2 2
Indicator 52: Treatment of depression in primary care
5 1 4 2
Indicator 53: Inappropriate co-prescribing of medicines
6 6 7 5
Indicator 54: People receiving a home medicine review
5 3 4 2
Indicator 55: Quality of Palliative Care
6 3 9 8
Indicator 56: Quality of Community Pharmacy Services
3 3 4 5
Indicator 57: Accreditation of health care services
7 12 7 8
Indicator 58: Patient experience
10 9 11 11
256
Appendix 3: Types of indicators and how they are used
This section briefly summarises the types of indicators that are relevant to assessing health care safety and quality and also discusses issues of presentation and interpretation.
Definition
An indicator is a key statistical measure selected to help describe (indicate) a situation concisely, track progress and performance, and act as a guide to decision making (AIHW 2008a). The former National Health Performance Committee used that is similar to this but more specifically about performance: it defined performance indicators as statistics or other units of information which reflect, directly or indirectly, the extent to which an anticipated outcome is achieved or the quality of processes leading to that outcome (NHPC 2001).
Outcome, process and structure indicators
Indicators can be described as three types—outcome, process or structure - as first proposed by Avedis Donabedian (1966). The national safety and quality indicators of safety and quality in health care recommended in this report include indicators of all three types.
Outcome indicators relate to recovery, restoration of functionality and survival of patients. Examples are rates of perinatal mortality, surgical mortality and cancer survival. Outcomes normally have unquestioned validity as a dimension of safety and quality, and outcome indicators tend to be concrete and consequently amenable to precise measurement.
However, such indicators can have limitations. They are not always direct measures of the safety and quality of health care provision in the same way as process measures are. For example, a desired outcome of a person suffering a serious heart attack might be survival but the reason that the person survives may be unrelated to the safety and quality of the health care received. For this reason, outcome measures are sometimes reported with an associated process measure.
Process indicators, on the other hand, aim to measure the extent of the application of ‘good’ health care. They are usually defined by reference to best practice guidelines or standards for specific health interventions. Examples include to the management of care for people with diabetes or asthma. Process indicators are usually more sensitive to differences in quality than are outcome measures and they can be easier to interpret. They may be preferred to outcome indicators where the link between process and outcome is clearly established (Mant 2001).
Structural indicators encompass such issues as the amount and adequacy of facilities and equipment, the qualifications of medical staff and their organisations as well as the administrative structure and programs. An example of such an indicator is one that measures the proportion of medical staff undertaking a specified procedure who are accredited in accordance with a national standard. Structure indicators are often readily formulated and easily measured. However, it is not always a simple matter to establish a clear relationship to achieving desired health outcomes.

257
Rates and counts
Indicators typically are expressed as a rate or a count, mostly as a rate. An example of a national rate for an outcome indicator would be the number of unplanned hospital readmissions in Australia, over a certain period after discharge, per 1000 initial admissions. This ‘per 1,000’ kind of approach makes rates useful for comparing populations or providers of different size, such as larger or smaller countries or hospitals.
In trying to compare the performance of different care providers on a fair and equal basis, it is also often desirable to adjust for other factors that can affect their results or processes. The most common adjustment is for the age structure of their patients. However, other adjustments may be attempted, with varying accuracy, such as for the background health of the patients. This is often referred to as ‘risk adjustment’.
Indicators can also be defined purely as a measure rather than as a rate, namely, the number of specific events occurring within a specified period. This can be appropriate when the ’target‘ value is zero regardless of the size of the denominator and regardless of other differences in ‘risk‘. An example is the incidence of Staphylococcus aureus (including MRSA) bacteraemia in acute care hospitals.
Comparisons over time, comparisons for population or provider subgroups, international comparisons, and comparisons against a target or standard
A key characteristic of indicators is the ability to ‘track progress and performance, and act as a guide to decision making’. Presenting indicators is generally only useful if comparisons can be included. For national reporting, these comparisons would generally be comparisons over time, comparisons by population or provider subgroups, international comparisons, and comparisons against a target or standard.
Comparisons against a target or standard will generally be a part of the indicator definition, and will reflect accepted best practice in an area. For example, an indicator may measure the number of activities completed within a specified timeframe that is based on industry guidelines, such as time to reperfusion for acute myocardial infarction.
Comparisons over time help to assess whether safety and quality of health care in Australia is getting better or not. In addition, comparisons for population or provider subgroups can help to assess apparent variations in performance, which may reflect patient factors, differences in health care practice, or both. Hence, an indicator may be presented as a comparison between males and females, age groups, Indigenous and non-Indigenous status, states and territories, degree of remoteness and so forth.
To illustrate, it may be of interest to know if 5-year cancer survival rates are better for men than for women (and vice-versa) and whether they are more favourable for patients in metropolitan areas as opposed to rural/remote areas. This may help illustrate a range of contributing factors including differing risk rates between men and women, differing levels of access to relevant health care services in rural/remote areas, and issues relating to the safety and quality of health care services provided to these patients. This type of analysis is also an important tool for assessing equity in the safety and quality of health care as discussed in section 2.2.
Another area of analysis is international comparisons, especially for health outcomes. For example, cancer survival rates can be readily measured and compared internationally. International comparisons can, however, be of limited value for process indicators in health care, because the processes can vary widely from country to country and so can the

258
specifications and collection of data. The analysis of OECD indicators of patient safety undertaken by the AIHW (see Appendix 5) highlighted the complexity of obtaining meaningful international comparisons.

259
Appendix 4: Alignment with the indicator framework
This Appendix provides information on the alignment of the indicators with the indicator framework. Summary of this information is provided in Section 3. The indicators have been grouped under the headings for service categories and assessed against the other elements of the framework.
The indicator framework is discussed in section 2.5. Eleven burden of disease and injury groups, each contributing less than 4 per cent have been excluded from Table 3.2. They are: digestive diseases; infections and parasitic diseases; acute respiratory infections; congenital anomalies; neonatal conditions; maternal conditions; nutritional deficiencies; non-malignant neoplasms; skin diseases; oral health conditions; and ill-defined conditions.
Table 3.3 excludes medications. Other smaller areas of health expenditure have also been excluded including aids and appliances, administration, research, public health, and patient transport services.
Eight minor disease expenditure categories, each contributing 4 per cent or less of total expenditure in 2004–05, have been excluded from Table 3.4. They are: endocrine, nutritional and metabolic; maternal conditions; infections and parasitic; diabetes; skin diseases; neonatal causes; congenital anomalies; and signs, symptoms, ill-defined conditions and other contact with the health system.

260
Table A4.1: Health care safety and quality indicators by National Health Priority Area
Art
hri
tis
and
m
usc
ulo
skel
etal
co
nd
itio
ns
Ast
hm
a
Can
cer
Co
ntr
ol
Car
dio
vas
cula
r h
ealt
h
Dia
bet
es
mel
litu
s
Inju
ry
pre
ven
tio
n a
nd
co
ntr
ol
Men
tal h
eal
th
Primary care and community health services 1 Enhanced primary care services in general practice
2 General practices with a register and recall system for patients with chronic disease
3 People with moderate to severe asthma who have a written asthma action plan 4 Management of hypertension in general practice 5 Management of arthritis and musculoskeletal conditions 6 Mental health care plans in general practice 7 Annual cycle of care for people with diabetes mellitus 8 Cervical cancer screening rates 9 Immunisation rates for vaccines in the national schedule
10 Eye testing for target groups 11 Quality of community pharmacy services 12 Developmental health checks in children 13 People receiving a medication review
Hospitals 14 Assessment for risk of venous thromboembolism in hospitals
15 Pain assessment in the emergency department 16 Reperfusion for acute myocardial infarction in hospitals 17 Stroke patients treated in a stroke unit
18 Complications of transfusion 19 Health care associated infections acquired in hospital
20 Staphylococcus aureus (including MRSA) bacteraemia in hospitals
21 Adverse drug events in hospitals 22 Intentional self-harm in hospitals 23 Malnutrition in care settings 24 Pressure ulcers in care settings 25 Falls resulting in patient harm in care settings 26 Complications of anaesthesia 27 Accidental puncture/laceration in hospitals
28 Obstetric trauma - third and fourth degree tears 29 Birth trauma – injury to neonate 30 Postoperative haemorrhage 31 Postoperative venous thromboembolism 32 Unplanned return to operating theatre
33 Unplanned re-admission to an intensive care unit
34 Hospital standardised mortality ratio (HSMR) 35 Death in low mortality DRGs 36 Independent peer review of surgical deaths 37 Discharge medication management for acute myocardial infarction 38 Timely transmission of discharge summaries
Specialised health services
39 Mental health admitted patients having seclusion 40 Post-discharge community care for mental health patients 41 Quality of palliative care 42 Functional gain achieved in rehabilitation 43 Multi-disciplinary care plans in sub-acute care (5) Management of arthritis and musculoskeletal conditions
Residential aged care 44 Oral health in residential aged care
(13) People receiving a medication review (23) Malnutrition in care settings (24) Pressure ulcers in care settings (25) Falls resulting in patient harm in care settings
Multiple service categories 45 Unplanned hospital re-admissions 46 Inappropriate co-prescribing of medicines 47 Selected potentially preventable hospitalisations 48 End stage kidney disease in people with diabetes 49 Lower-extremity amputation in people with diabetes 50 Cancer survival 51 Failure to diagnose 52 Potentially avoidable deaths
All service categories 53 Patient experience 54 Presence of appropriate incident monitoring arrangements 55 Accreditation of health care services

261
Table A4.2: Health care safety and quality indicators by burden of disease groups (YLD)
Men
tal d
iso
rder
s (2
4.2%
)
Neu
rolo
gic
al a
nd
se
nse
dis
ord
ers
(1
9.1%
)
Ch
ron
ic
resp
irat
ory
d
isea
ses
(8
.5%
)
Dia
bet
es (
8.2%
)
Car
dio
vas
cula
r d
isea
se
(7.7
%)
Mu
scu
los
kele
tal
dis
eas
es (
7.3
%)
Can
cer
(6.5
%)
Primary care and community health services 1 Enhanced primary care services in general practice
2 General practices with a register and recall system for patients with chronic disease
3 People with moderate to severe asthma who have a written asthma action plan 4 Management of hypertension in general practice 5 Management of arthritis and musculoskeletal conditions 6 Mental health care plans in general practice 7 Annual cycle of care for people with diabetes mellitus 8 Cervical cancer screening rates 9 Immunisation rates for vaccines in the national schedule
10 Eye testing for target groups 11 Quality of community pharmacy services 12 Developmental health checks in children 13 People receiving a medication review
Hospitals 14 Assessment for risk of venous thromboembolism in hospitals 15 Pain assessment in the emergency department 16 Reperfusion for acute myocardial infarction in hospitals 17 Stroke patients treated in a stroke unit 18 Complications of transfusion 19 Health care associated infections acquired in hospital 20 Staphylococcus aureus (including MRSA) bacteraemia in hospitals
21 Adverse drug events in hospitals 22 Intentional self-harm in hospitals 23 Malnutrition in care settings 24 Pressure ulcers in care settings 25 Falls resulting in patient harm in care settings 26 Complications of anaesthesia 27 Accidental puncture/laceration in hospitals 28 Obstetric trauma - third and fourth degree tears 29 Birth trauma – injury to neonate 30 Postoperative haemorrhage 31 Postoperative venous thromboembolism 32 Unplanned return to operating theatre
33 Unplanned re-admission to an intensive care unit 34 Hospital standardised mortality ratio (HSMR) 35 Death in low mortality DRGs 36 Independent peer review of surgical deaths 37 Discharge medication management for acute myocardial infarction 38 Timely transmission of discharge summaries
Specialised health services
39 Mental health admitted patients having seclusion 40 Post-discharge community care for mental health patients 41 Quality of palliative care 42 Functional gain achieved in rehabilitation 43 Multi-disciplinary care plans in sub-acute care (5) Management of arthritis and musculoskeletal conditions
Residential aged care 44 Oral health in residential aged care
(13) People receiving a medication review (23) Malnutrition in care settings (24) Pressure ulcers in care settings (25) Falls resulting in patient harm in care settings
Multiple service categories 45 Unplanned hospital re-admissions 46 Inappropriate co-prescribing of medicines 47 Selected potentially preventable hospitalisations 48 End stage kidney disease in people with diabetes 49 Lower-extremity amputation in people with diabetes 50 Cancer survival 51 Failure to diagnose 52 Potentially avoidable deaths
All service categories 53 Patient experience 54 Presence of appropriate incident monitoring arrangements 55 Accreditation of health care services

262
Table A4.3: Health care safety and quality indicators by major areas of health expenditure
Ho
spit
als
(46.
0%)
Med
ical
se
rvic
es
(19.
1%)
Den
tal s
ervi
ces
(6
.6%
)l
Co
mm
un
ity
hea
lth
an
d
oth
er (
5.0%
)
Oth
er h
ealt
h
pra
ctit
ion
ers
(3.8
%)
Primary care and community health services 1 Enhanced primary care services in general practice
2 General practices with a register and recall system for patients with chronic disease
3 People with moderate to severe asthma who have a written asthma action plan 4 Management of hypertension in general practice 5 Management of arthritis and musculoskeletal conditions 6 Mental health care plans in general practice 7 Annual cycle of care for people with diabetes mellitus 8 Cervical cancer screening rates 9 Immunisation rates for vaccines in the national schedule
10 Eye testing for target groups 11 Quality of community pharmacy services 12 Developmental health checks in children 13 People receiving a medication review
Hospitals 14 Assessment for risk of venous thromboembolism in hospitals
15 Pain assessment in the emergency department 16 Reperfusion for acute myocardial infarction in hospitals 17 Stroke patients treated in a stroke unit
18 Complications of transfusion 19 Health Care Associated Infections acquired in hospital
20 Staphylococcus aureus (including MRSA) bacteraemia in hospitals
21 Adverse drug events in hospitals 22 Intentional self-harm in hospitals 23 Malnutrition in care settings 24 Pressure ulcers in care settings 25 Falls resulting in patient harm in care settings 26 Complications of anaesthesia 27 Accidental puncture/laceration in hospitals 28 Obstetric trauma - third and fourth degree tears 29 Birth trauma – injury to neonate 30 Postoperative haemorrhage 31 Postoperative venous thromboembolism 32 Unplanned return to operating theatre
33 Unplanned re-admission to an intensive care unit
34 Hospital standardised mortality ratio (HSMR) 35 Death in low mortality DRGs 36 Independent peer review of surgical deaths 37 Discharge medication management for acute myocardial infarction 38 Timely transmission of discharge summaries
Specialised health services
39 Mental health admitted patients having seclusion 40 Post-discharge community care for mental health patients 41 Quality of palliative care 42 Functional gain achieved in rehabilitation 43 Multi-disciplinary care plans in sub-acute care (5) Management of arthritis and musculoskeletal conditions
Residential aged care 44 Oral health in residential aged care
(13) People receiving a medication review (23) Malnutrition in care settings (24) Pressure ulcers in care settings (25) Falls resulting in patient harm in care settings
Multiple service categories 45 Unplanned hospital re-admissions 46 Inappropriate co-prescribing of medicines 47 Selected potentially preventable hospitalisations 48 End stage kidney disease in people with diabetes 49 Lower-extremity amputation in people with diabetes 50 Cancer survival 51 Failure to diagnose 52 Potentially avoidable deaths
All service categories 53 Patient experience 54 Presence of appropriate incident monitoring arrangements 55 Accreditation of health care services

263
Table A4.4: Health care safety and quality indicators by major disease and injury group contributing to health expenditure
Car
dio
vas
cula
r (1
1.2%
)
Ora
l hea
lth
(1
0.1%
)
Men
tal
dis
ord
ers
(7.8
%)
Mu
scu
lo-
skel
etal
(7.
5%)
Neo
pla
sms
(7.2
%)
Inju
ries
(6.
5%)
Res
pir
ato
ry
(6.3
%)
Dig
esti
ve
syst
em (
5.9
%)
Ner
vou
s
syst
em (
5.2
%)
Gen
ito
uri
nar
y
(4.5
%)
Primary care and community health services 1 Enhanced primary care services in general practice
2 General practices with a register and recall system for patients with chronic disease
3 People with moderate to severe asthma who have a written asthma action plan 4 Management of hypertension in general practice 5 Management of arthritis and musculoskeletal conditions 6 Mental health care plans in general practice 7 Annual cycle of care for people with diabetes mellitus 8 Cervical cancer screening rates 9 Immunisation rates for vaccines in the national schedule
10 Eye testing for target groups 11 Quality of community pharmacy services 12 Developmental health checks in children 13 People receiving a medication review
Hospitals 14 Assessment for risk of venous thromboembolism in hospitals 15 Pain assessment in the emergency department 16 Reperfusion for acute myocardial infarction in hospitals 17 Stroke patients treated in a stroke unit 18 Complications of transfusion 19 Health care associated infections acquired in hospital 20 Staphylococcus aureus (including MRSA) bacteraemia in hospitals
21 Adverse drug events in hospitals 22 Intentional self-harm in hospitals 23 Malnutrition in care settings 24 Pressure ulcers in care settings 25 Falls resulting in patient harm in care settings 26 Complications of anaesthesia 27 Accidental puncture/laceration in hospitals 28 Obstetric trauma - third and fourth degree tears 29 Birth trauma – injury to neonate 30 Postoperative haemorrhage 31 Postoperative venous thromboembolism 32 Unplanned return to operating theatre
33 Unplanned re-admission to an intensive care unit 34 Hospital standardised mortality ratio (HSMR) 35 Death in low mortality DRGs 36 Independent peer review of surgical deaths 37 Discharge medication management for acute myocardial infarction 38 Timely transmission of discharge summaries
Specialised health services
39 Mental health inpatients having seclusion 40 Post-discharge community care for mental health patients 41 Quality of palliative care 42 Functional gain achieved in rehabilitation 43 Multi-disciplinary care plans in sub-acute care (5) Management of arthritis and musculoskeletal conditions
Residential aged care 44 Oral health in residential aged care
(13) People receiving a medication review (23) Malnutrition in care settings (24) Pressure ulcers in care settings (25) Falls resulting in patient harm in care settings
Multiple service categories 45 Unplanned hospital re-admissions 46 Inappropriate co-prescribing of medicines 47 Selected potentially preventable hospitalisations 48 End stage kidney disease in people with diabetes 49 Lower-extremity amputation in people with diabetes 50 Cancer survival 51 Failure to diagnose 52 Potentially avoidable deaths
All service categories 53 Patient experience 54 Presence of appropriate incident monitoring arrangements 55 Accreditation of health care services

264
Table A4.5: Health care safety and quality indicators by availability of international comparisons
OE
CD
N
ew Z
eala
nd
E
uro
pea
n
Un
ion
Un
ited
K
ing
do
m
Un
ited
Sta
tes
o
f A
mer
ica
Can
ada
Primary care and community health services 1 Enhanced primary care services in general practice
2 General practices with a register and recall system for patients with chronic disease
3 People with moderate to severe asthma who have a written asthma action plan 4 Management of hypertension in general practice 5 Management of arthritis and musculoskeletal conditions 6 Mental health care plans in general practice 7 Annual cycle of care for people with diabetes mellitus 8 Cervical cancer screening rates 9 Immunisation rates for vaccines in the national schedule
10 Eye testing for target groups 11 Quality of community pharmacy services 12 Developmental health checks in children 13 People receiving a medication review
Hospitals 14 Assessment for risk of venous thromboembolism in hospitals
15 Pain assessment in the emergency department 16 Reperfusion for acute myocardial infarction in hospitals 17 Stroke patients treated in a stroke unit
18 Complications of transfusion 19 Health care associated infections acquired in hospital
20 Staphylococcus aureus (including MRSA) bacteraemia in hospitals
21 Adverse drug events in hospitals 22 Intentional self-harm in hospitals 23 Malnutrition in care settings 24 Pressure ulcers in care settings 25 Falls resulting in patient harm in care settings 26 Complications of anaesthesia 27 Accidental puncture/laceration in hospitals 28 Obstetric trauma - third and fourth degree tears 29 Birth trauma – injury to neonate 30 Postoperative haemorrhage 31 Postoperative venous thromboembolism 32 Unplanned return to operating theatre
33 Unplanned re-admission to an intensive care unit
34 Hospital standardised mortality ratio (HSMR) 35 Death in low mortality DRGs 36 Independent peer review of surgical deaths 37 Discharge medication management for acute myocardial infarction 38 Timely transmission of discharge summaries
Specialised health services
39 Mental health inpatients having seclusion 40 Post-discharge community care for mental health patients 41 Quality of palliative care 42 Functional gain achieved in rehabilitation 43 Multi-disciplinary care plans in sub-acute care (5) Management of arthritis and musculoskeletal conditions
Residential aged care 44 Oral health in residential aged care
(13) People receiving a medication review (23) Malnutrition in care settings (24) Pressure ulcers in care settings (25) Falls resulting in patient harm in care settings
Multiple service categories 45 Unplanned hospital re-admissions 46 Inappropriate co-prescribing of medicines 47 Selected potentially preventable hospitalisations 48 End stage kidney disease in people with diabetes 49 Lower-extremity amputation in people with diabetes 50 Cancer survival 51 Failure to diagnose 52 Potentially avoidable deaths
All service categories 53 Patient experience 54 Presence of appropriate incident monitoring arrangements 55 Accreditation of health care services

265
Table A4.6: Health care safety and quality indicators by health needs domain
Sta
yin
g
hea
lth
y
Get
tin
g b
ette
r
Liv
ing
wit
h
chro
nic
co
nd
itio
ns
Co
pin
g w
ith
en
d o
f li
fe
Primary care and community health services 1 Enhanced primary care services in general practice
2 General practices with a register and recall system for patients with chronic disease
3 People with moderate to severe asthma who have a written asthma action plan 4 Management of hypertension in general practice 5 Management of arthritis and musculoskeletal conditions 6 Mental health care plans in general practice 7 Annual cycle of care for people with diabetes mellitus 8 Cervical cancer screening rates 9 Immunisation rates for vaccines in the national schedule
10 Eye testing for target groups 11 Quality of community pharmacy services 12 Developmental health checks in children 13 People receiving a medication review
Hospitals 14 Assessment for risk of venous thromboembolism in hospitals
15 Pain assessment in the emergency department 16 Reperfusion for acute myocardial infarction in hospitals 17 Stroke patients treated in a stroke unit
18 Complications of transfusion 19 Health Care Associated Infections acquired in hospital
20 Staphylococcus aureus (including MRSA) bacteraemia in hospitals
21 Adverse drug events in hospitals 22 Intentional self-harm in hospitals 23 Malnutrition in care settings 24 Pressure ulcers in care settings 25 Falls resulting in patient harm in care settings 26 Complications of anaesthesia 27 Accidental puncture/laceration in hospitals 28 Obstetric trauma - third and fourth degree tears 29 Birth trauma – injury to neonate 30 Postoperative haemorrhage 31 Postoperative venous thromboembolism 32 Unplanned return to operating theatre
33 Unplanned re-admission to an intensive care unit
34 Hospital standardised mortality ratio (HSMR) 35 Death in low mortality DRGs 36 Independent peer review of surgical deaths 37 Discharge medication management for acute myocardial infarction 38 Timely transmission of discharge summaries
Specialised health services
39 Mental health admitted patients having seclusion 40 Post-discharge community care for mental health patients 41 Quality of palliative care 42 Functional gain achieved in rehabilitation 43 Multi-disciplinary care plans in sub-acute care (5) Management of arthritis and musculoskeletal conditions
Residential aged care 44 Oral health in residential aged care
(13) People receiving a medication review (23) Malnutrition in care settings (24) Pressure ulcers in care settings (25) Falls resulting in patient harm in care settings
Multiple service categories 45 Unplanned hospital re-admissions 46 Inappropriate co-prescribing of medicines 47 Selected potentially preventable hospitalisations 48 End stage kidney disease in people with diabetes 49 Lower-extremity amputation in people with diabetes 50 Cancer survival 51 Failure to diagnose 52 Potentially avoidable deaths
All service categories 53 Patient experience 54 Presence of appropriate incident monitoring arrangements 55 Accreditation of health care services

266
Appendix 5: Support Projects
This chapter provides summaries of the three support projects that were undertaken in parallel with the National Indicators Project. The first was an analysis of OECD patient safety indicators to establish their suitability for national and international reporting using Australian data. The second study examined the feasibility of developing national indicators for in-hospital mortality which are calculated using data extracted from the NHMD. The third study provided further detail on the subset of the national indicators which relate to primary health care to inform the consultation process.
OECD patient safety indicators The AIHW has analysed 15 indicators of patient safety proposed by the Organisation for Economic Cooperation and Development (OECD) for international reporting (Drösler 1998). The OECD methodology was examined using Australian data and its suitability for national and international reporting on patient safety was assessed.
The OECD began the Health Care Quality Indicators project in 2001 to assist it to investigate differences in the quality of health care across countries. Patient safety was one of five priority areas, the others being cardiac care, diabetes mellitus, mental health and health promotion, prevention and primary care.
The OECD piloted 15 indicators of patient safety to be used for international comparison in several countries including Australia. The indicators and their assessed suitability for reporting at a national and international level are set out in Table A5.1 (on next page).
The evaluation covered the period from 2003–04 to 2005–06. It covered all 15 indicators except one (iatrogenic pneumothorax) which could not be evaluated because it could not be calculated using Australian data.
Three of the remaining 14 indicators (transfusion reaction, foreign body left in during procedure, and Obstetric trauma – caesarean section) were considered unsuitable for reporting within Australia because the rate of adverse events being measured were too small for the indicator to be useful in monitoring national trends. It was, nevertheless, recommended that these three indicators be retained for international comparisons.
As part of the assessment, values for the indicator were calculated for the public and private hospital sectors and between groupings of similar types of hospitals within the public hospital system (peer groups). For most indicators, these calculated values were different for the two sectors and for the peer groups – for some, markedly different. Typically, the rates were higher for the public hospital sector than for the private sector. Case mix complexity is likely to have contributed to these differences. Different patterns of length of stay in hospitals may also have been contributing factors for some indicators. Consequently, caution needs to be exercised in using these indicators for comparisons between sectors or between the peer groups of public hospitals.
A total of 4 of the 14 OECD patient safety indicators have been incorporated in the recommended national set of safety and quality indicators outlined in this report. These are:
• Birth trauma – injury to neonate
• Accidental puncture/ laceration (technical difficulty with procedure)

267
• Post operative pulmonary emobolism (PE) or deep vein thrombosis (DVT)
• Decubitus ulcer
Table A5.1: Patient safety indicators and applicability for national and international reporting
Indicator International Reporting National Reporting
Infection due to medical care Yes Yes
Decubitus ulcer Yes Yes
Complications of anaesthesia Yes Yes
Postoperative hip fracture Yes Yes
Postoperative pulmonary embolism or deep vein thrombosis Yes Yes
Postoperative sepsis Yes Yes
Technical difficulty with procedure Yes Yes
Postoperative respiratory failure Yes Yes
Iatrogenic pneumothorax No No
Transfusion reaction Yes No
Foreign body left in during procedure Yes No
Birth trauma – injury to neonate Yes Yes
Obstetric trauma – vaginal delivery with instrument Yes Yes
Obstetric trauma – vaginal delivery without instrument Yes Yes
Obstetric trauma – caesarean section Yes No
Measuring and reporting mortality The study examined the feasibility of developing national indicators for in-hospital mortality which are calculated using data extracted from the NHMD. It was designed to support the selection of national indicators.
The study had two components:
• a literature review focussing on methods for analysing and reporting in-hospital mortality
• a modelling project aimed at identifying national indicators of hospital mortality that could be implemented now, and in the future.
Literature review
The methods used to measure in-hospital mortality have been widely discussed in the literature. There is an emerging international consensus on a measure (the risk-adjusted Hospital Standardised Mortality Ratio, (HSMR)), on factors to be included in risk-adjustment models, on modelling methods, and on types of cases to exclude (for example, palliative care cases). The measures could be developed using administrative data. In-hospital mortality rates are now reported regularly and publicly in several countries or jurisdictions within countries (United Kingdom, The Netherlands, Canada, and Queensland, Australia). Three

268
main methods for presenting in-hospital mortality data are used: tables, caterpillar plots and funnel plots. Longitudinal analysis of in-hospital mortality is an emerging and powerful new theme in the literature.
Analysis
Data from the Australian NHMD were analysed. Cross-sectional analysis used one year of hospital separations data. A method used in Canada, England and the Netherlands was applied (called the Risk-Adjusted Canadian referred Mortality (RACM) model). Logistic regression modelling of in-hospital mortality, including principal diagnosis, age, sex, co-morbidity, length of stay, admission status and transfer status as covariates, allows the expected mortality to be derived. This is compared with observed deaths to calculate risk-adjusted HSMRs. This method was used for most of the analysis undertaken. Tests of model discrimination and explanatory power were performed. The hospital peer group classification developed by the AIHW was used to group hospitals for comparisons.
HSMR analysis was conducted on three groups of cases, which exemplify types of general purpose indicators of in–hospital mortality:
1. High-risk cases (less than 20% of cases including 80% of in-hospital deaths),
2. Lower risk cases (all other in-scope cases)
3. All cases and all in-hospital deaths.
Longitudinal analysis was done using three years of data. This was a two step process. The first was to calculate risk-adjusted HSMRs in a similar way to the cross sectional analysis. The second step was two-stage multi-level logistic regression.
Results
The overall results obtained are similar to those reported in the international literature. The model demonstrated good discrimination (the large size of the dataset contributes to this). Some differences in the strength of the model were apparent when applied to the three mortality groups (80%, 20% and 100%) with discriminatory power stronger for the 20% and 100% groups.
Single year analysis (2005–06)
The single year analysis resulted in the production of summary HSMRs and confidence intervals by peer group. Three methods of presentation findings are demonstrated in the report; HSMR ranked tables, funnel plots and caterpillar plots.
Longitudinal analysis (2004–05 to 2006–07)
Most of the variation in risk-adjusted HSMRs was between different hospitals, much less of it being between repeated measurements for the same hospital. The lack, on the whole, of large variation between measures of adjusted HSMR for the same hospital suggests that values are largely reflecting the phenomenon of interest, and are not dominated by ‘noise’ in the data. This is less true for peer groups of small hospitals.
The results presented for the longitudinal analysis demonstrate a modest decline in overall risk-adjusted mortality during the three year period. This is similar to the findings of a recent Dutch study using the same method. While replication of analysis and refinement of the method used should be undertaken before too much weight is placed on this finding, the possibility remains that it is a true decline. If so, perhaps an increased emphasis on hospital safety in recent years is beginning to have a demonstrable effect on in-hospital mortality.

269
Conclusions
Indicators of in-hospital mortality could be produced using NHMD data. Indicators based on the three mortality groups specified above were produced for different hospitals and hospital peer groups.
It is recommended that the indicators be used as screening tools. Variations in hospital mortality per se do not necessarily reflect differences in the levels of safety or quality. However, they could signal a potential problem for which further investigation is required.
The analysis could be extended to include deaths up to 30 days after discharge after discharge from hospital. To do this, data matching would be required between the NHMD and the National Death Index. It would also be necessary to undertake data linkage of inpatient data by person, which require data linkage of hospital separations. Currently, this is not available nationally but can be undertaken in some states. The lack of an institution identifier for many private hospitals prevented analysis of this sector.
Emerging data developments (national coding of conditions ‘present on admission’, and extension of health data linkage) and analytical innovations (for example, use of Bayesian regression, especially for data from small hospital) are likely to improve results.
Primary care This report was a supplement to the Towards National Indicators of Safety and Quality in Health Care discussion paper which provided further detail on the proposed national indicators relating to primary health care to inform consultation.
Chapter 2 provided a survey of indicators of safety and quality in primary health and the organisations involved, both locally and internationally. The coverage of the indicators across the safety and quality domains and primary health care settings was assessed.
In addition, brief discussion of current work relevant to safety and quality in primary health care in Australia was included, such as the Royal Australian College of General practitioners quality framework and accreditation standards.
Chapter 3 presented a review of Australian data sources which could potentially be used to report on the subset of indicators proposed in the discussion paper which related to primary health care.
Chapter 4 provided a more detailed discussion of the proposed primary care indicators, which was designed to augment rather than replace the indicator summaries included in the discussion paper. This included information on the use of the indicator (both locally and internationally), data sources and data quality, issues with the interpretation of the indicator and developments which could improve reporting for each indicator.
Chapter 5 provided examples of the different methods used to disaggregate and present indicators to provide information about specific population or provider groups.
Finally, Chapter 6 used readily available data for a selection of the primary health care safety and quality indicators to demonstrate how these can be reported.

270
Appendix 6: National Hospital Morbidity Database
The National Hospital Morbidity Database (NHMD) is a source of data for 18 of the indicators. This appendix provides overview information in relation to the accuracy of the NHMD data.
Structures and processes relating to the NHMD
The National Hospital Morbidity Database (NHMD) is an annual compilation of episode-level records from admitted patient morbidity data collection systems in Australian hospitals. Unit records of episodes of care are generated at the hospital level and the data are submitted to state hospital authorities. They include information on the characteristics of the patient and details of the hospital as well as comprehensive information relating to the health aspects of the episode of care, such as diagnoses, external causes of injury and poisoning and procedures.
The processes used to compile data for the NHMD can be summarised as follows:
• The data are supplied by hospitals to State health bodies, which aggregate the data and submit the data to the AIHW
• The National Minimum Data Set for Admitted Patient Care specifies the data to be supplied
• The data consist of details of the patient which are extracted from hospital records and information extracted from clinical records compiled by the doctors and other professional staff (for example, pathology staff)
• Clinical coding is the process used to generate the information from the clinical records in a pre-determined format
• Professionally trained clinical coders use the International Statistical Classification of Diseases and Related Health Problems, 10th edition, Australian Edition, which incorporates the Australian Coding Standards, to translate narrative descriptions of all significant diagnoses, external causes of injury and poisoning, and procedures
• The Classification is updated and published every 2 years by the National Centre for Classification in Health (NCCH).
The accuracy of clinical coding is a critical determinant of the accuracy of the data. There is a substantial investment in the training of clinical coders through Health Information Management undergraduate degrees at four universities and coding courses run by the Health Information Management Association of Australia and the Open Training and Education Network. Workshops are conducted by the states, the NCCH and individual hospitals.
Auditing of clinical coding is conducted by the states on hospital clinical records to test the quality of the data and provide feedback to coders (AIHW 2008c). Typically, such audits have a specific focus on the accuracy in coding of Diagnosis Related Groups (DRGs), which form part of a patient classification system relating the types of patient treated in a hospital to the resources required by the hospital to treat them. A nationally consistent audit of the quality and consistency of coded data has yet to be performed in Australia.

271
A potential weakness of the data capture arrangements relates to clinical records, which are the primary source for coding inpatient morbidity data. They include the discharge form, progress notes as well as all operation and anaesthetic reports and are supplemented with information on the outcomes of any diagnostic, pathology and imaging tests undertaken. Problems with coding arise when they are incomplete or are difficult to interpret.
Analyses of the quality of NHMD data
In recent years, the Australian Hospital Statistics (AHS) has included an appendix dealing with technical issues. It provides comments on and analyses of the quality of the ICD-10-AM coded data. One form of analysis is the average number of additional diagnoses coded for each episode of care.
Diagnoses additional to the principal diagnosis include co morbidities and complications of the patient that may contribute to longer lengths of stay, more intensive treatment or the use of greater resources. The number of additional diagnosis records for a patient relates to the person’s clinical condition and hence is not subject to administrative or technical limitations.
A study has assessed the variation among Australian states in the reporting and coding of additional diagnoses in public hospital data (Coory & Cornes 2005). It found variations amongst states and concluded that many patient records might have been documented or coded differently if the separation had occurred in another state (AIHW 2008c). Some state-specific coding standards exist to meet state reporting requirements. Such standards may be in addition to or instead of the relevant Australian Coding Standard, and may affect the comparability of ICD-10-AM coded data.
The methodology developed by the Coory and Cornes study has been used in the AHS to update the initial results obtained. The most recent results published in AHS (AIHW 2008c) confirm continuing variations between states but they are less than two years previously.
272
References
ACSQHC (Australian Commission on Safety and Quality in Health Care) 2007. Information strategy (September 2007). Viewed 31 August 2008,
<http://www.safetyandquality.org/internet/safety/publishing.nsf/Content/CommissionPubs#InformationStrategyPubAug2007>
ACSQHC (Australian Commission on Safety and Quality in Health Care) 2008. Windows into Safety and Quality in Health Care 2008. Sydney: ACSQHC
AHRQ (Agency for Healthcare Research and Quality) 2008. AHRQ quality indicators Patient safety indicators Technical specifications. Viewed 10 July 2008, <http://www.qualityindicators.ahrq.gov/downloads/psi/word/psi_technical_specs_v32.doc>
AIHW 2004. Australian Institute for Health and Welfare: Health Data Standards Committee 2004. National Health Data Dictionary, Version 12 Supplement. Canberra: AIHW.
AIHW 1997a. Australian Institute for Health and Welfare 1997. Australian hospital statistics 1993-95: an overview. Canberra: AIHW.
AIHW 1997b. Australian Institute for Health and Welfare 1997. Australian hospital statistics 1995-96. Canberra: AIHW.
AIHW 1998. Australian Institute for Health and Welfare 1998. Australian hospital statistics 1996-97. Canberra: AIHW.
AIHW 1999. Australian Institute for Health and Welfare 1999. Australian hospital statistics 1997-98. Canberra: AIHW.
AIHW 2000. Australian Institute for Health and Welfare 2000. Australian hospital statistics 1998-99. Canberra: AIHW.
AIHW 2001. Australian Institute for Health and Welfare 2001. Australian hospital statistics 1999-00. Canberra: AIHW.
AIHW 2002. Australian Institute for Health and Welfare 2002. Australian hospital statistics 2000-01. Canberra: AIHW.
AIHW 2003. Australian Institute for Health and Welfare 2003. Australian hospital statistics 2001-02. Canberra: AIHW.
AIHW 2004. Australian Institute for Health and Welfare 2004. Australian hospital statistics 2002-03. Canberra: AIHW.
AIHW 2005. Australian Institute for Health and Welfare 2005. Australian hospital statistics 2003-04. Canberra: AIHW.
AIHW 2006. Australian Institute for Health and Welfare 2006. Australian hospital statistics 2004-05. Canberra: AIHW.
AIHW 2007. Australian Institute for Health and Welfare 2007. Australian hospital statistics 2005-06. Canberra: AIHW.
AIHW 2008a. Australian Institute for Health and Welfare 2008. Australia’ Health 2008. Canberra: AIHW.

273
AIHW 2008b. Australian Institute for Health and Welfare 2008. A set of performance indicators across the health and aged care system. Canberra: AIHW.
AIHW 2008c. Australian Institute for Health and Welfare 2008. Australian hospital statistics 2006-07. Canberra: AIHW.
AIHW 2008d. Australian Institute for Health and Welfare 2008. Health expenditure Australia 2006-07. Canberra: AIHW.
AIHW 2009. Australian Institute for Health and Welfare 2008. Measuring and reporting mortality in hospital patients. Canberra: AIHW.
AIHW/ACSQHC 2007. Australian Institute of Health and Welfare and the Australian Commission on Safety and Quality in Health Care 2007. Sentinel events in Australian public hospitals 2004-05. Canberra: AIHW.
Australian Orthopaedic Association National Joint Replacement Registry 2007. Annual Report. Adelaide: Australian Orthopaedic Association.
Coory M and Cornes S 2005. Interstate comparisons of public hospital outputs using DRGs: Are they fair? Australian and New Zealand Journal of Public Health 29:143-8
Donabedian A 1966. Evaluating the Quality of Care. The Milbank Memorial Fund Quarterly, Vol. 44, No. 3, Pt. 2, 1966: 166-203.
Drösler S 1998. Facilitating cross-national comparisons of indicators for patient safety at the health-system level in the OECD countries. OECD Health Technical Papers No. 19. Paris: Organisation for Economic Co-operation and Development. Viewed 10 July 2008, <http://www.oecd.org/dataoecd/24/48/40401929.pdf>
Duckett SJ 2007. The Australian Health Care System. Melbourne: Oxford University Press.
Duckett SJ, Coory M & Sketcher-Baker K 2007. Identifying variations in quality of care in Queensland hospitals. Medical Journal of Australia 187:571-5.
Duckett SJ, Collins J, Kamp M & Walker K 2008. An improvement focus in public reporting: the Queensland approach. Medical Journal of Australia 189:616-7.
Fung CH, Lim YW, Mattke S, Damberg C & Shekell PG 2008. Systematic Review: The Evidence That Publishing Patient Care Performance Data Improves Quality of Care. Annals of Internal Medicine 148:111-23.
Hibbard JH, Stockard J & Tusler M 2003. Does Publicizing Hospital Performance Stimulate Quality Improvement Efforts? Health Affairs 22:84-94.
Institute of Medicine 2000. To err is human: building a safer health system. Washington, DC: National Academy Press.
Jarman B, Gault S, Alves B, Hider A, Dolan S, Cook A, Hurwitz B and Iezzoni LI 1999. Explaining differences in English hospital death rates using routinely collected data. British Medical Journal 318:1515-20.
Kelley E and Hurst J 2006. Health care quality indicators project conceptual framework paper. OECD Health Working Papers 23. Paris: Organisation for Economic Co-operation and Development.
Last JM 2007. A Dictionary of Public Health. Oxford University Press. Oxford.
Laws PJ, Abeywardana S, Walker J and Sullivan EA 2007. Australia’s mothers and babies 2005. Perinatal statistics series no. 20. Sydney: AIHW National Perinatal Statistics Unit.

274
Mant J 2001. Process versus outcome indicators in the assessment of quality of health care. International Journal for Quality in Health Care 2001: Volume 13, Number 6: 475-480.
Marshall M, Klazinga N, Leatherman S, Hardy C, Bergmann E, Pisco L. 2006. OECD Health Care Quality Indicator Project. The expert panel on primary care prevention and health promotion. International Journal for Quality in Health Care: 21-5.
Marshall MN, Shekelle PG, Leatherman S & Brook RH 2000. The Public Release of Performance Data. What Do We Expect to Gain? A Review of the Evidence. JAMA 283:1866-74.
Marshall MN, Shekell PG, Davies HTO & Smith PC 2003. Public Reporting On Quality In The United States And The United Kingdom. Health Affairs 22:134-48.
McKenzie K, Harding LF, Walker SM, Harrison JE, Enraght-Moony EL, Waller GS 2006. The quality of cause-of-injury data: where hospital records fall down. Australian and New Zealand Journal of Public Health 30:509-13.
NCCH (National Centre for Classification in Health) 2008. The international statistical classification of diseases and related health problems, tenth revision, Australian modification (ICD-10-AM), Australian Classification of Health Interventions (ACHI) and Australian Coding Standards (ACS), 6th edn. Sydney: University of Sydney.
NHPC (National Health Performance Committee) 2001. National health performance framework report: A report to the Australian Health Ministers’ Conference. Brisbane: Queensland Health.
Runciman B, Merry A and Walton M 2007. Safety and ethics in health care: a guide to getting it right. Burlington, VT: Ashgate.
Scott IA & Ward M 2006. Public reporting of hospital outcomes based on administrative data: risks and opportunities. Medical Journal of Australia 184:571-5.
South Australia Department of Health 2005. South Australian Incident Management System. <http://www.safetyandquality.sa.gov.au/Default.aspx?tabid=67>
Victorian Auditor-General 2008. Patient safety in public hospitals. PP No 100, Session 2006-08. Melbourne: Victorian Government Printer.
Werner RM & Asch DA 2005. The Unintended Consequences of Publicly Reporting Quality Information. JAMA 293:1239-44.

275
List of tables
Table 1.1: Health care safety and quality indicators by quality domain.............................................. ix Table 3.1 Health care safety and quality indicators .............................................................................. 15 Table 3.2: Distribution of indicators by dimensions of quality ............................................................ 18 Table 3.3: Distribution of indicators by National Health Priority Areas............................................. 18 Table 3.4: Distribution of indicators by major burden of disease groups ........................................... 19 Table 3.5: Distribution of indicators by major areas of health expenditure updated........................ 19 Table 3.6: Distribution of indicators by major disease and injury group contributing to
major areas of health expenditure .......................................................................................... 20 Table 3.7: Distribution of indicators by health needs domain.............................................................. 20 Table 3.8: Distribution of indicators by measurability category .......................................................... 22 Table 3.9: Data sources and indicator measurability category ............................................................. 23 Table 3.10: Distribution of indicators by availability of international comparisons............................ 24 Table 4.1 Health care safety and quality indicators by level of reporting ......................................... 27 Table 4.2 Health care safety and quality indicators measurability category and related
work ............................................................................................................................................ 34 Table A2.1: Appropriateness of coverage of the proposed indicator set ............................................. 248 Table A2.2: Responses for individual indicators ..................................................................................... 249 Table A2.3: Response to what the purpose of the indicators should be............................................... 252 Table A5.1: Patient safety indicators and applicability for national and international
reporting................................................................................................................................... 267

276
List of figures
Figure 1.1: How the national safety and quality indicator set relates to other indicator sets.....................5 Figure 2.1: Framework for health care safety and quality indicators ..........................................................10


![In search towards suitable biodiversity indicators€¦ · In search towards . suitable biodiversity indicators. original species of ecosystem. Species abundance. ... • N dep •[N+P]](https://img.pdfslide.us/doc/110x75/5fbf89df34674f292137979e/in-search-towards-suitable-biodiversity-indicators-in-search-towards-suitable.jpg)