Embed Size (px)
Citation preview
Towards Distributed Real-Time Physiological
Processing in Mobile Environments
James Meneghello
School of Information Technology,
Murdoch University,
Perth, Western Australia 6150
May 28, 2012
Contents
1 Introduction 6
1.1 Overview . . . . . . . . . . . . . . . . . . . . . . . . . . . . . 6
1.2 Physiological Analysis . . . . . . . . . . . . . . . . . . . . . . 8
1.3 Distributed Physiological Analysis . . . . . . . . . . . . . . . 11
1.4 Aims . . . . . . . . . . . . . . . . . . . . . . . . . . . . . . . . 13
1.5 Structure . . . . . . . . . . . . . . . . . . . . . . . . . . . . . 14
2 Background 16
2.1 Overview . . . . . . . . . . . . . . . . . . . . . . . . . . . . . 16
2.2 Biofeedback . . . . . . . . . . . . . . . . . . . . . . . . . . . . 17
2.3 Signal Processing, Storage and Compression . . . . . . . . . . 19
2.4 Physiological Sensors . . . . . . . . . . . . . . . . . . . . . . . 21
2.5 Physiological Monitoring in Practice . . . . . . . . . . . . . . 22
2.6 Distributed Physiological Monitoring . . . . . . . . . . . . . . 24
2.7 Distributed Processing . . . . . . . . . . . . . . . . . . . . . . 25
2.8 Distributed Physiological Processing . . . . . . . . . . . . . . 26
2.9 Ethics and Privacy . . . . . . . . . . . . . . . . . . . . . . . . 26
2.10 Summary . . . . . . . . . . . . . . . . . . . . . . . . . . . . . 28
3 Case Studies in Distributed Physiological Monitoring 29
1
CONTENTS 2
3.1 Overview . . . . . . . . . . . . . . . . . . . . . . . . . . . . . 29
3.2 Training Analysis . . . . . . . . . . . . . . . . . . . . . . . . . 30
3.3 Miner Safety . . . . . . . . . . . . . . . . . . . . . . . . . . . 31
3.4 Common Issues . . . . . . . . . . . . . . . . . . . . . . . . . . 32
3.5 Summary . . . . . . . . . . . . . . . . . . . . . . . . . . . . . 34
4 Design 37
4.1 Overview . . . . . . . . . . . . . . . . . . . . . . . . . . . . . 37
4.2 Requirements . . . . . . . . . . . . . . . . . . . . . . . . . . . 38
4.3 Architecture . . . . . . . . . . . . . . . . . . . . . . . . . . . . 39
4.4 Roles . . . . . . . . . . . . . . . . . . . . . . . . . . . . . . . . 43
4.5 System Interface . . . . . . . . . . . . . . . . . . . . . . . . . 45
4.5.1 Resources . . . . . . . . . . . . . . . . . . . . . . . . . 45
4.5.2 User Registration . . . . . . . . . . . . . . . . . . . . . 46
4.5.3 Stream Registration . . . . . . . . . . . . . . . . . . . 47
4.5.4 Data Collection . . . . . . . . . . . . . . . . . . . . . . 50
4.5.5 Simple Transformation . . . . . . . . . . . . . . . . . . 51
4.5.6 Complex Transformation Chains . . . . . . . . . . . . 52
4.6 Summary . . . . . . . . . . . . . . . . . . . . . . . . . . . . . 54
5 Implementation 56
5.1 Overview . . . . . . . . . . . . . . . . . . . . . . . . . . . . . 56
5.2 Implementation Details . . . . . . . . . . . . . . . . . . . . . 57
5.3 Role Applications . . . . . . . . . . . . . . . . . . . . . . . . . 58
5.3.1 Supervisor . . . . . . . . . . . . . . . . . . . . . . . . . 58
5.3.2 Manager . . . . . . . . . . . . . . . . . . . . . . . . . . 59
5.3.3 Monitor . . . . . . . . . . . . . . . . . . . . . . . . . . 59
5.3.4 Processor . . . . . . . . . . . . . . . . . . . . . . . . . 60
CONTENTS 3
5.4 Resource Allocation . . . . . . . . . . . . . . . . . . . . . . . 61
5.5 Transformation Distribution . . . . . . . . . . . . . . . . . . . 61
5.6 Data Compression . . . . . . . . . . . . . . . . . . . . . . . . 62
5.7 Configuration . . . . . . . . . . . . . . . . . . . . . . . . . . . 63
5.8 Summary . . . . . . . . . . . . . . . . . . . . . . . . . . . . . 69
6 Evaluation 71
6.1 Overview . . . . . . . . . . . . . . . . . . . . . . . . . . . . . 71
6.2 Experimental Evaluation . . . . . . . . . . . . . . . . . . . . . 72
6.2.1 Overview . . . . . . . . . . . . . . . . . . . . . . . . . 72
6.2.2 Experiment Setup . . . . . . . . . . . . . . . . . . . . 73
6.2.3 Responsiveness . . . . . . . . . . . . . . . . . . . . . . 76
6.2.4 Database Engines . . . . . . . . . . . . . . . . . . . . 79
6.2.5 Latency . . . . . . . . . . . . . . . . . . . . . . . . . . 83
6.2.6 Summary . . . . . . . . . . . . . . . . . . . . . . . . . 86
6.3 Requirements Evaluation . . . . . . . . . . . . . . . . . . . . 88
6.3.1 Overview . . . . . . . . . . . . . . . . . . . . . . . . . 88
6.3.2 Usability . . . . . . . . . . . . . . . . . . . . . . . . . 88
6.3.3 Configurability . . . . . . . . . . . . . . . . . . . . . . 89
6.3.4 Mobility . . . . . . . . . . . . . . . . . . . . . . . . . . 93
6.3.5 Compatibility . . . . . . . . . . . . . . . . . . . . . . . 94
6.3.6 Cross-platform . . . . . . . . . . . . . . . . . . . . . . 95
6.3.7 Extensible . . . . . . . . . . . . . . . . . . . . . . . . . 95
6.3.8 Scalable . . . . . . . . . . . . . . . . . . . . . . . . . . 96
6.3.9 Secure . . . . . . . . . . . . . . . . . . . . . . . . . . . 97
6.3.10 Summary . . . . . . . . . . . . . . . . . . . . . . . . . 98
6.4 Summary . . . . . . . . . . . . . . . . . . . . . . . . . . . . . 98
CONTENTS 4
7 Conclusion 100
7.1 Overview . . . . . . . . . . . . . . . . . . . . . . . . . . . . . 100
7.2 Overview of Dissertation . . . . . . . . . . . . . . . . . . . . . 100
7.3 Major Contributions . . . . . . . . . . . . . . . . . . . . . . . 102
7.4 Concluding Remarks . . . . . . . . . . . . . . . . . . . . . . . 103
Bibliography 105
Abstract
Physiological monitoring is the practice of using sensors to read, store, pro-
cess and interpret physiological data from organic beings, including biofeed-
back signals associated with heart, brain, muscle and other organ activity.
Physiological data retrieved from the body can be used for disease diagnose
and other activities, such as monitoring physical and mental stress levels of
participants in physical training exercises.
In addition to monitoring individuals, physiological data can be ag-
gregated to monitor groups. However, this kind of group-monitoring can
present difficulties in mobile environments, particularly concerning how to
process and transform the raw physiological data in real-time. Current tech-
niques involve the use of either fixed processing resources (such as worksta-
tions or servers) or the use of Cloud computing, which requires a stable,
uninterrupted mobile broadband communications network - neither of which
are common in remote mobile environments.
This dissertation proposes to improve existing methods of physiological
monitoring. This technique aims to monitor, analyse and report physiologi-
cal data in real-time by leveraging mobile devices as distributed processors.
The viability of this approach is evaluated by testing the implementation of
a system based on these principles in a number of real-world physiological
processing examples.
5
Chapter 1
Introduction
1.1 Overview
Physiological monitoring is the practice of using sensors to read, store, pro-
cess and interpret physiological data from organic beings, including biofeed-
back signals associated with heart, brain, muscle and other organ activity.
Physiological monitoring can provide a plethora of useful health, fitness and
other related data in real-time. Useful measures such as pulse, respiration
rate and blood oxygen levels have been successfully used to diagnose and
aid in the treatment of conditions such as sleep apnoea (Oliver & Flores-
Mangas, 2006), as well as assisting in the monitoring of cardiac systems
(Mendoza & Tran, 2002).
Initially, monitoring systems were largely confined to clinics and hospi-
tals due to size and low mobility, but advancements in mobile monitoring
systems (Lin et al., 2004; Lin et al., 2006; Dai & Zhang, 2006) have pro-
vided greater flexibility in usage environments. By utilising readily-available
sensor devices with low power requirements, long-term monitoring can en-
hance the quality of care for active patients, as well as providing numerous
6
CHAPTER 1. INTRODUCTION 7
advances to research associating physiological markers with mental states,
such as the measurement and analysis of stress levels (Jovanov et al., 2003a).
As well as monitoring individuals, it is possible to use distributed phys-
iological sensors to monitor groups. By analysing and aggregating physio-
logical data from the group, conclusions can be drawn regarding the state of
the entire group. Group monitoring has a range of possible usage scenarios,
such as monitoring the life-signs of miners in underground tunnels in or-
der to hasten awareness of emergency situations (Zephyr Technology, 2010),
or monitoring a population for symptoms of influenza to locate outbreaks
(Malone et al., 2009). Applications for this technique can also be found in
monitoring psychophysiological status of participants in training exercises
(Jovanov et al., 2003b), and determination of traffic flow within city areas
(Casari et al., 2009) for civic planning purposes.
Complex physiological monitoring of groups in real-time can already be
performed using fixed-location processing resources such as servers or cloud
platforms. However, a number of environments exist in which data trans-
mission to these resources is not viable. Poor or non-existent broadband
communications coverage in remote areas effectively nullifies any possibility
of using remote processing to perform requisite data transformations. In
addition, traditional processing resources (such as workstations or servers)
are not portable and require uninterrupted power supplies, which are gen-
erally not available in remote or highly mobile environments. In order to
provide an suitable source of processing resources for these environments,
existing mobile devices (such as smartphone, tablets or laptops) can be used
to process desired data transformations.
Unfortunately, while the processing ability of mobile CPUs has increased
dramatically over recent years, power drain and battery capacity remain
CHAPTER 1. INTRODUCTION 8
bottlenecks. In order to extend the useful monitoring lifetime of these mo-
bile devices, any data analysis required can be processed in a collaborative
fashion to balance resource drain across contributing devices - preventing
any single device from taking too much of the work and depleting itself.
Mobile devices have the additional advantage of not requiring an uninter-
rupted power source, allowing them to be used as processors while running
off battery power - and be charged using a portable generator or solar cells.
This dissertation proposes a system that aims to support the packag-
ing and distribution of real-time physiological processing across a diverse
selection of devices. The remainder of this chapter is structured as follows.
Section 1.2 provides an introduction to physiological analysis, its potential
uses and difficulties. Section 1.3 introduces the concept of distribution of
transformation processing, along with benefits and example usage. Sec-
tion 1.4 presents the overall aims of the dissertation and work presented
here. Finally, Section 1.5 describes the structure of the dissertation.
1.2 Physiological Analysis
Relatively simple sensors, such as pedometers or heart rate monitors, are
available to monitor various high-level physiological data points for use by
consumers, often integrating with exercise trackers or social networks. Be-
cause the data is generally collected in its final desired form, little transfor-
mation is required. For many users, simple data collection and transmission
provides a satisfactory view of the desired result. A runner casually logging
heart rate and position data for curiosity or exercise optimisation is unlikely
to require extremely accurate or complex data, for example.
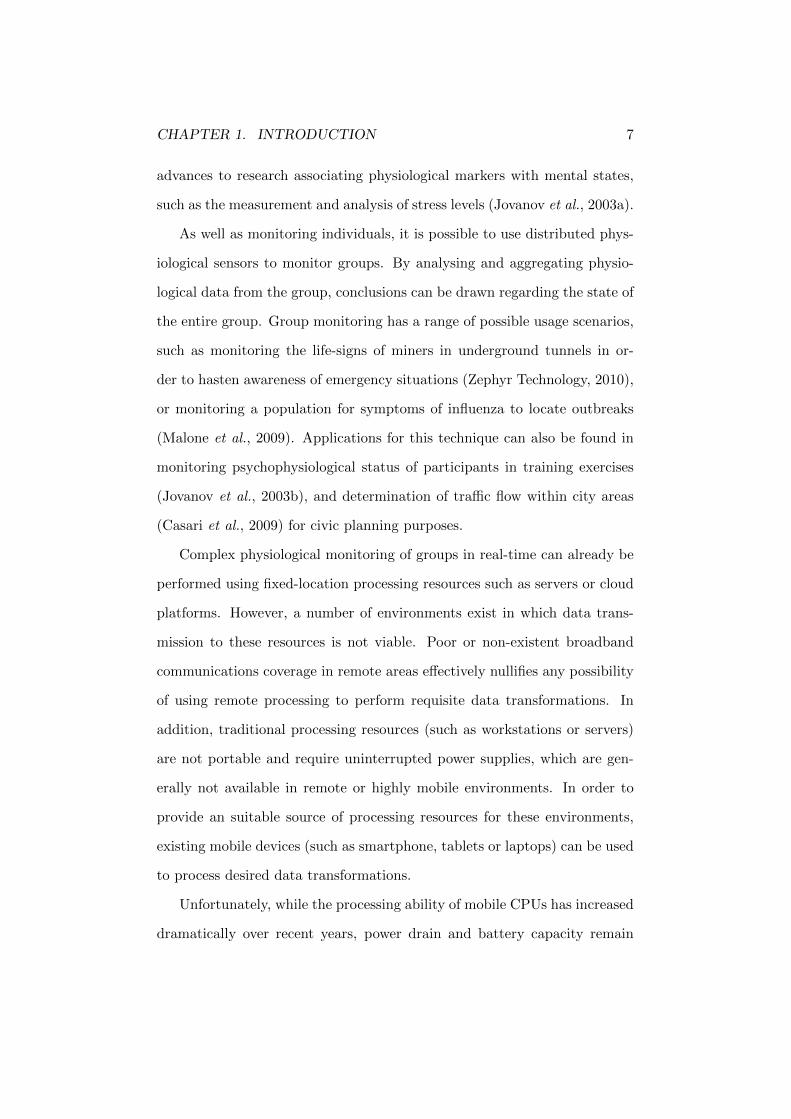
An example is illustrated in Figure 1.1, which represents a typical use
case for a casual consumer using basic physiological monitoring devices. A
CHAPTER 1. INTRODUCTION 9
Bluetooth-enabled heart rate monitor is worn during exercise, which trans-
mits pulse rate (HR) data to the user’s smartphone or logs it for later collec-
tion. This data is then transformed using a simple mathematical algorithm
into R-R interval. Both resulting variables can then be uploaded to activity
trackers or social media sites, allowing users to compare exercise habits or
encourage other activity (FitnessKeeper, 2012).
Figure 1.1: Simple transformation from Heart Rate to R-R Interval
Other applications, particularly involving cardiac-related monitoring (Men-
doza & Tran, 2002) or psychophysiological analysis (Jovanov et al., 2003a),
require more complex data transformations. A physiological transformation
is the process of taking raw physiological measurements and applying al-
gorithms that can extract other useful information, which is in turn used
for activities such as disease diagnosis (Oliver & Flores-Mangas, 2006) and
measuring physical and mental stress levels (Hoyt et al., 2002).
Transforming signal data such as electrocardiography or photoplethys-
mography into useful metrics can involve advanced signal processing algo-
rithms (Healey & Picard, 1998), which can require significant computing
time to complete. Additionally, even for routine transformations it can be
a multi-step process. To ensure result accuracy, data is often filtered and
normalised prior to signal processing, which further adds to computation
time.
CHAPTER 1. INTRODUCTION 10
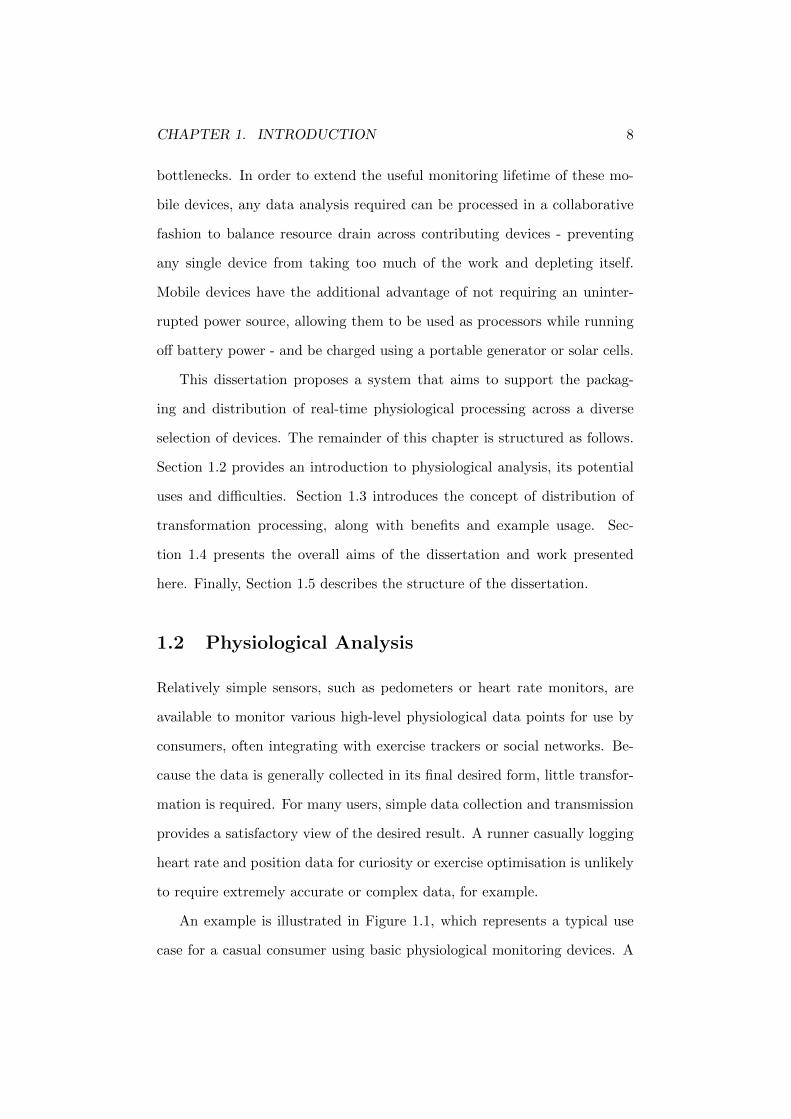
Figure 1.2: Simple transformation chain using an ECG signal
It is often possible to derive more than one result from a single data input.
Figure 1.2 illustrates the transformations that take place in deriving heart
rate (HR) and heart-rate variability (HRV) from electrocardiograph (ECG)
data, in a simplified fashion. This processing technique determines the time
between beats of the heart (R-R interval) from the ECG signal, which can
then be transformed further into HR and HRV data - useful metrics for
health professionals to analyse, particularly in diagnosis of cardiac disease
(Singer et al., 1988) and diabetic neuropathy (Pagani, 2000).
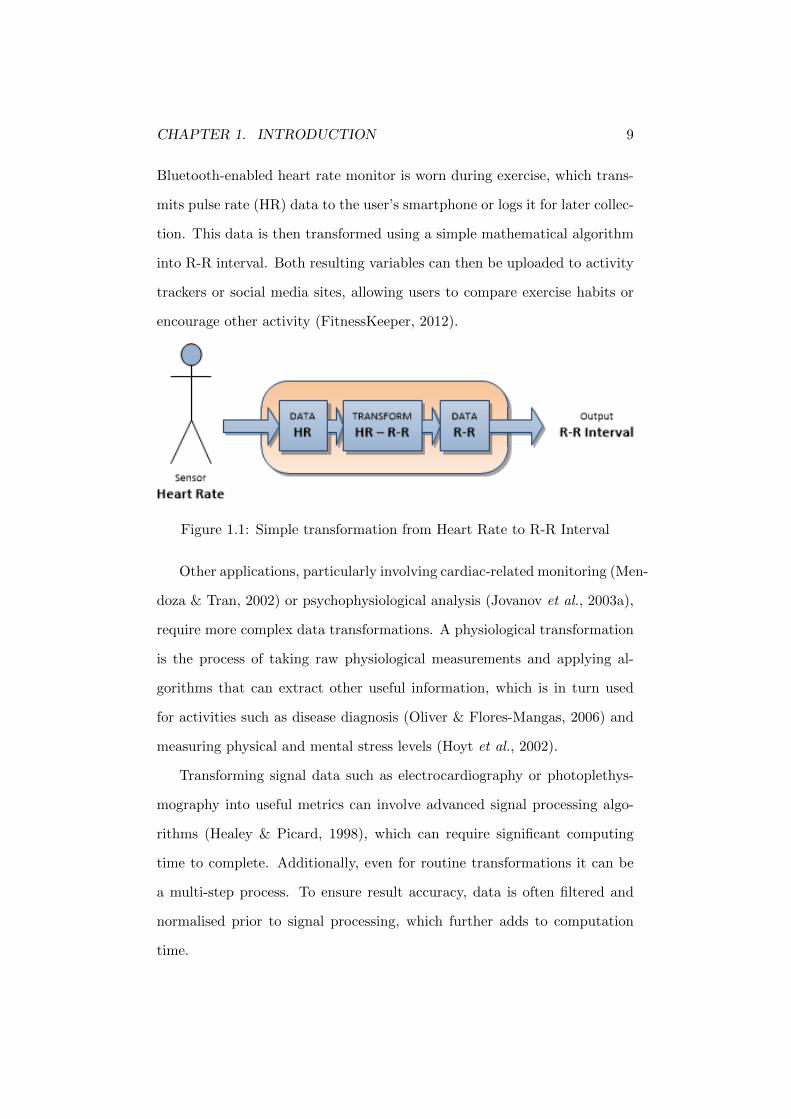
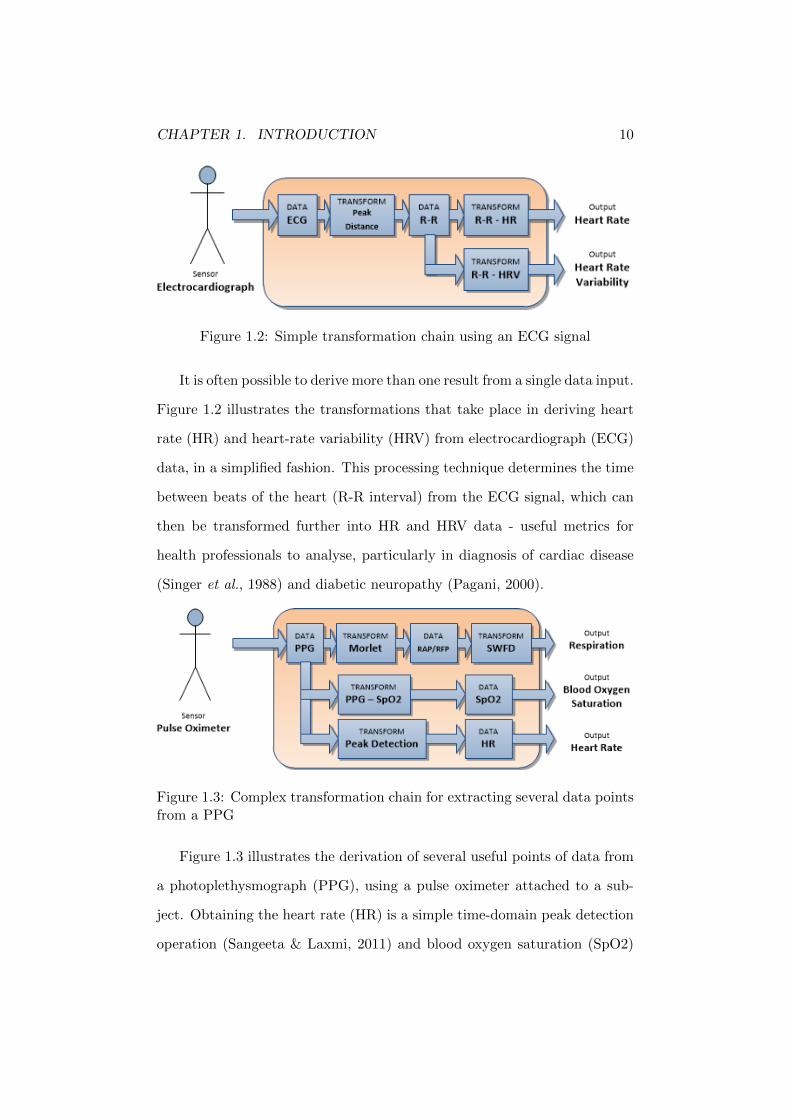
Figure 1.3: Complex transformation chain for extracting several data pointsfrom a PPG
Figure 1.3 illustrates the derivation of several useful points of data from
a photoplethysmograph (PPG), using a pulse oximeter attached to a sub-
ject. Obtaining the heart rate (HR) is a simple time-domain peak detection
operation (Sangeeta & Laxmi, 2011) and blood oxygen saturation (SpO2)
CHAPTER 1. INTRODUCTION 11
is a simple calibration function applied to the pulse oximeter’s output con-
nections. By comparison, determining respiratory rate from a PPG is a
computationally expensive process (Fleming & Tarassenko, 2007), requir-
ing multiple wavelet transforms (Addison & Watson, 2003). These types
of signal processing algorithms take significant processing time to complete
(depending on size of dataset), making it impractical to provide real-time
results without dedicated computational resources.
While a simple transformation (such as Figure 1.1) could be handled by
even a small embedded processor, continuous or concurrent complex trans-
formations require significant processing power to complete. Depending on
scenario and environment, it is not always realistic to carry static processing
resources, particularly if part of a highly-mobile group.
1.3 Distributed Physiological Analysis
Traditional physiological processing frameworks tend to be extremely lim-
ited in mobility, due to the use of static resources and fixed power supplies.
In order to improve the range of situations physiological monitoring can be
implemented in, one possible solution would be to shift to a more mobile
processing paradigm. This would allow for the deployment of distributed
physiological monitoring systems in a range of new environments, such as
remote military training exercises, mining safety rigs and even small-scale
experimental studies relying on real-time transformations of data for psy-
chophysiological analysis.
Mobile physiological processing could be realised by allowing nearby mo-
bile processing devices (such as smartphones, tablets or laptops) to operate
in a collaborative fashion and process any physiological transformation re-
quests by users. This technique should also scale well; if more computation
CHAPTER 1. INTRODUCTION 12
power is required to maintain transformational output, more devices can
simply be added to the cluster.
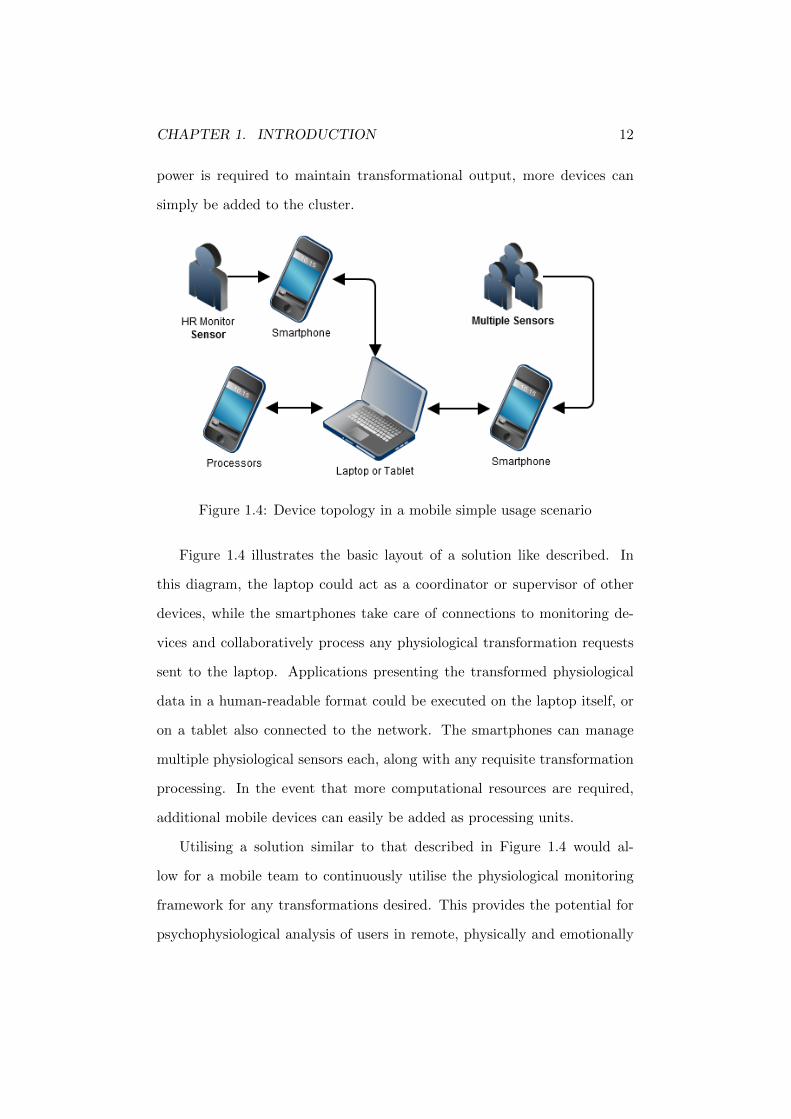
Figure 1.4: Device topology in a mobile simple usage scenario
Figure 1.4 illustrates the basic layout of a solution like described. In
this diagram, the laptop could act as a coordinator or supervisor of other
devices, while the smartphones take care of connections to monitoring de-
vices and collaboratively process any physiological transformation requests
sent to the laptop. Applications presenting the transformed physiological
data in a human-readable format could be executed on the laptop itself, or
on a tablet also connected to the network. The smartphones can manage
multiple physiological sensors each, along with any requisite transformation
processing. In the event that more computational resources are required,
additional mobile devices can easily be added as processing units.
Utilising a solution similar to that described in Figure 1.4 would al-
low for a mobile team to continuously utilise the physiological monitoring
framework for any transformations desired. This provides the potential for
psychophysiological analysis of users in remote, physically and emotionally
CHAPTER 1. INTRODUCTION 13
stressful situations - supplying trainers or controllers with useful analytical
data in real-time that they otherwise would not possess.
1.4 Aims
The primary aim of this dissertation is to provide improvements in the ap-
plication of physiological monitoring and analysis. This is achieved through
the discussion and fulfillment of several primary goals;
• Improving physiological monitoring and analysis by enabling more ac-
cessible processing in non-traditional environments
• Increasing the usefulness of physiological monitoring for health moni-
toring, by reducing reliance on stable wide-area communications net-
works
• Presenting new opportunities for the use of group physiological mon-
itoring, by abating the difficulty and time expenditure in setting up
complex series of sensors across individuals and groups
• Providing an open, generic platform that facilitates distributed physi-
ological monitoring and processing in a scalable fashion using sensors
attached to mobile devices
• Allowing for complex, flexible chains of physiological data transforma-
tions to be performed in a dynamic and easily-configurable fashion by
providing a standardised web interface
In order to evaluate the effectiveness of using mobile devices for pro-
cessing physiological transformations, a generic platform is designed and
implemented that enables data from any number of physiological sensors to
be used as input for dynamic data transformations. Rather than using dis-
crete processing resources, portable processing devices (such as smartphones
CHAPTER 1. INTRODUCTION 14
and tablets) are evaluated as an effective replacement in environments that
do not support stationary processing hardware.
A system to support the utilisation of mobile devices as processing re-
sources must consider a number of important issues, including:
• Scalability, to support any requisite numbers of input sensors and pro-
cessing devices
• Ease of configuration, supporting input streams from any type of sen-
sor device through standard communication mechanisms
• Portability, allowing the system to function in highly mobile environ-
ments
These aims represent a subset of system requirements, detailed further
in Chapter 4. In addition to evaluating the design and implementation of
the system based around these aims, the dissertation will also discuss the
suitability of using the system in a number of real-world scenarios.
1.5 Structure
The remainder of this paper is structured as follows. Chapter 2 provides
a background of physiological monitoring and distributed processing. It
also discusses previous studies completed related to distributed physiolog-
ical monitoring and inherent issues, and introduces concepts important to
distributed physiological processing. The state-of-the-art in physiological
monitoring equipment is examined, and methods of signal processing per-
formed on the data generated by these sensors are detailed.
Chapter 3 analyses two scenarios in which distributed physiological pro-
cessing on mobile devices would provide a significant improvement over exist-
CHAPTER 1. INTRODUCTION 15
ing monitoring techniques and platforms. Common issues between scenarios
are discussed and potential requirements are derived.
Chapter 4 aims to improve distributed physiological monitoring by estab-
lishing an open, generic platform design to ease monitoring and processing in
mobile environments. The platform is designed to manage user sensors and
data streams with as little configuration as possible, while providing a scal-
able method of transforming the resulting physiological data. It provides
a RESTful (Fielding, 2007) web interface utilising standard technologies
(XML (Bray et al., 1997)) that presents physiological data transformation
and analysis functionality to users. Processing is handled transparently in
a distributed fashion, allowing groups of mobile devices to collaboratively
process requests transformations with no requirement for static computing
resources (such as workstations or Cloud computing resources), but can
utilise either if desired.
Chapter 5 presents the implementation of the distributed physiological
monitoring and processing system. Important issues relating to the imple-
mentation are highlighted, including data compression, system configuration
and resource allocation. Specific implementation details for each role-based
application are also illustrated.
Chapter 6 determines the effectiveness of using a distributed physiolog-
ical processing framework on mobile devices by evaluating the platform in
real-world scenarios. The system’s suitability to initial aims and defined
requirements is discussed, and the system is tested for performance with a
subset of mobile devices, workstations and Cloud computing resources using
sample physiological data and chained transformations.
Finally, Chapter 7 concludes with a discussion of the system’s contribu-
tion to physiological monitoring, as well as directions for future work.
Chapter 2
Background
2.1 Overview
This chapter presents a review and analysis of current techniques and tech-
nology related to physiological monitoring and distributed physiological pro-
cessing. An overview of physiological analysis, the latest in physiological
sensors and the concept of biofeedback are also presented, as these three
subjects are highly relevant to physiological monitoring.
Distributed physiological processing is a relatively untouched subject.
Distributed physiological monitoring has been used in limited scenarios (Jo-
vanov et al., 2003b). General distributed processing has been in use for a
substantial period of time, including for signal processing (Lee & Oppen-
heim, 1998; Krupa et al., 2007) and data aggregation in wireless sensor
networks (Yao & Gehrke, 2003), but not yet as part of a physiological mon-
itoring and processing framework. Related studies, potential benefits and
disadvantages with distributed physiological processing are discussed in the
following sections.
The remainder of this chapter is structured as follows. Section 2.2 in-
16
CHAPTER 2. BACKGROUND 17
troduces the concept of biofeedback, the measurement of electrical signals
that run through our bodies to determine physiological state. Section 2.3
provides an overview of signal processing techniques, which can be used to
derive physiological data from biofeedback signals. Section 2.4 describes the
state of the art in physiological sensors, include improvements in portability
and communications access. Section 2.5 presents common uses for physiolog-
ical monitoring, as well as issues that affect its usage.. Section 2.6 presents
a review of physiological monitoring techniques used in a group context.
Section 2.7 reviews distributed processing techniques in both utilisation of
Cloud computing resources and resource allocation across networks of het-
erogeneous devices. Section 2.8 briefly discusses the drawbacks of traditional
physiological processing, and the benefits of distributing the work. Ethical
and privacy guidelines related to physiological monitoring are presented in
Section 2.9. Finally, Section 2.10 presents a summary of issues discussed in
this chapter.
2.2 Biofeedback
In addition to simple physiological measures such as pulse and blood pres-
sure, the human body can be monitored for electrical signals produced by
specific parts of the body. In a healthy human heart, the sinoatrial node
produces a bioelectric pulse designed to contract heart muscles and pro-
duce the standard human heart rate of 72 beats per minute (Malmivuo &
Plonsey, 1995). Electrical activity like this can be measured using surface
electrodes, with position of electrode determining the object being moni-
tored. This technique of monitoring the heart through collection of surface
electrical activity is called electrocardiography (Katz & Pick, 1956), and is
one of a number of electrical signals used in biofeedback and physiological
CHAPTER 2. BACKGROUND 18
monitoring.
There are many electrical signals that can be collected from the human
body for purposes of disease diagnosis and health analysis. Electrocardio-
graphs (ECGs) (Katz & Pick, 1956) are commonly used to assess and di-
agnose cardiac problems, but can also be analysed to produce other data
such as pulse and respiratory rate (Moody et al., 1985). Electroencephalo-
graphs (EEGs) are used to measure brain activity and can be used for a
wide variety of brain-related monitoring, such as diagnosis of epilepsy and
management of anaesthesia in coma patients (Niedermeyer & Silva, 2005).
Photoplethysmographs (Allen, 2007) are a signal produced most commonly
by pulse oximeters (Tremper & Barker, 1989), which measure blood oxygen
saturation and are used for cardiac-related analysis and respiration detec-
tion (Fleming & Tarassenko, 2007). There are numerous other biofeedback
signals that can be monitored (Buchthal, 1957; Geddes et al., 1962) from
the skin and muscles that other data can be derived from, such as general
mood (McCleary, 1950).
As illustrated in Figure 2.1, an electrocardiogram signal is made of sev-
eral components; a P wave, a QRS complex, a T wave and a U wave (not
shown). Each PQRST wave represents a single beat of the heart. The R-R
interval is the time period between R peaks in successive QRS complexes,
and represents the time between heartbeats, which can then be converted
to heart rate (HR) in beats per minute. Each of the biofeedback signals
listed previously must be processed and transformed in a similar manner
to produce useful metrics, such as R-R interval. These transformations are
classified as signal processing techniques, and vary in complexity.

CHAPTER 2. BACKGROUND 19
Figure 2.1: A breakdown of components in an Electrocardiograph
2.3 Signal Processing, Storage and Compression
Signal processing is used heavily in physiological analysis to convert recorded
electrical signals from the body into useful physiological data. Data is first
filtered to remove unwanted signal interference and transformed using either
generic signal processing algorithms (such as Discrete Fourier Transforms or
Wavelet Transforms) or specialised algorithms tailored to a particular signal
type. However, there are important issues to consider prior to processing -
especially desired signal resolution and storage.
Raw electrocardiogram data can generate significant amounts of output,
depending on the resolution of the signal, the number of channels monitored
and the sampling rate. Sample rates can vary significantly, as some desired
usages require substantially higher signal quality. General usage tends to
result in around 450kb - 30mb of data per hour (Horspool & Windels, 1994)
CHAPTER 2. BACKGROUND 20
for sampling frequencies of 125 (single-channel) and 500Hz (12-channel) re-
spectively. High-resolution ECGs can sample at even higher frequencies,
often operating around the 2-5kHz mark (Jane et al., 1990). While cur-
rent data storage and transmission mediums can generally handle such an
amount of data, increasing size of data transmissions results in higher power
expenditure. This is not an issue for monitoring equipment with fixed power
supplies, but should be considered when operating with mobile equipment
and limited power storage. Additionally, applications requiring extremely
high signal resolution may be inappropriate for use with mobile processing,
due to physical memory and bandwidth limitations.
In order to encourage smaller data packages, ECG and other signal data
can be compressed prior to transmission or storage. To provide the great-
est benefit, the signal should ideally be compressed prior to transmission,
requiring some level of processing ability on monitoring hardware. While
compression can be built into the monitoring hardware, a software-based
approach has the possibility of receiving upgrades in the event of new com-
pression techniques - albeit at the cost of requiring a generic processor.
Many compression algorithms have been designed specifically for phys-
iological signals. These often work in conjunction with traditional digital
data compression algorithms such as gzip (Deutsch, 1996), though the for-
mer are often tailored specifically to certain signals and provide a greater
compression ratio than traditional compression algorithms (Arnavut, 2001).
The primary goal of signal compression algorithms is to reduce data size by
as much as possible without losing significant resolution, and a large number
of algorithms have been developed for this purpose (Jalaleddine et al., 1990;
Nave & Cohen, 1993; Horspool & Windels, 1994; Antoniol & Tonella, 1997;
Chen & Itoh, 1998; Blanco-Velasco et al., 2004; Miaou & Chao, 2005).
CHAPTER 2. BACKGROUND 21
Physiological signal data can be generated by monitors in a range of
different formats, sizes and qualities. Efficiency of data compression and the
usefulness of data is often dependent on the monitoring hardware, which is
an important consideration when developing a monitoring system.
2.4 Physiological Sensors
Physiological monitoring systems have evolved considerably since their con-
ception. Substantial increases in hardware processing capability and storage
has driven the development of a new generation of health monitoring devices.
Size, portability, maintenance requirements and difficulty of use were some
of the factors that previously limited equipment to hospitals and clinics.
Almost all of these factors have been significantly improved upon, allowing
a greater portion of rehabilitation and long-term health monitoring to be
completed in home environments.
Electrocardiographs are particularly useful for the diagnosis and long-
term monitoring of various cardiac-related health conditions (Mendoza &
Tran, 2002). While still being used heavily in hospitals and clinics (Dai &
Zhang, 2006), a number of systems have been adapted for home use (Bai
et al., 1999; Ruggiero et al., 1999), allowing long-term monitoring to be
performed upon patients while they maintain normal activity (Korhonen
et al., 2003). These improvements significantly improve the quality of life
for patients (Ruggiero et al., 1999) and open up the possibility for new
applications of monitoring in more portable environments.
Improvements in wide-area and local communications have also con-
tributed to the accessibility of portable physiological monitoring equipment.
Sensors that require data to undergo extensive transformation and process-
ing to produce useful output are able to transmit collected data wirelessly
CHAPTER 2. BACKGROUND 22
(using Bluetooth or WiFi) to more capable servers (Yu & Cheng, 2005).
These servers can then analyse collected data and present results to doc-
tors, specialists and the user themselves. Sensors can also be attached di-
rectly to users’ mobile phones (Lee et al., 2006), enabling transmission of
physiological data over mobile networks.
By integrating short-range communications with basic mobile process-
ing hardware (such as mobile phones) and physiological sensors, monitoring
harnesses can be developed. These harnesses constantly monitor a user’s
physiological data, acting as what is commonly known as a Body Area Net-
work (Schmidt et al., 2002). BANs (or systems with similar architectures)
are used extensively for physiological monitoring, with many systems (Jo-
vanov et al., 2003b; Lin et al., 2006; Lee et al., 2006; Milenkovic et al., 2006;
Oliver & Flores-Mangas, 2006; Lee et al., 2009; Dhamdhere et al., 2010) de-
veloped to monitor the user’s body and either process or transmit collected
data for presentation to users and health professionals.
The development of these types of devices have the potential to change
health monitoring and rehabilitation into the future. By making monitoring
equipment more accessible and portable, patients who traditionally would
have to make regular hospital visits for check-ups can be monitored remotely.
This has the potential to both greatly improve responsiveness to emergencies
and substantially increase quality of life for patients by allowing them to
reside in their homes.
2.5 Physiological Monitoring in Practice
The collection of physiological data is used extensively for disease diagno-
sis and health monitoring. In the past, most of these uses were limited to
specialised equipment in hospitals and health care clinics due to expense
CHAPTER 2. BACKGROUND 23
or lack of portability. Advancements in certain types of monitoring equip-
ment (such as electrocardiogram monitors (Bai et al., 1999)) have allowed
for them to be used in different environments (e.g. mobile), and for pur-
poses beyond simple diagnosis and health monitoring procedures. Persistent
communications with these devices is made trivial, as most can utilise either
a mobile phone network (Oliver & Flores-Mangas, 2006) or home wireless
internet connection (Mendoza & Tran, 2002) that allows the devices to be
monitored remotely. Software updates can also be automatically deployed to
suit future purposes without requiring physical interaction by a technician.
As noted, physiological monitoring can be used for a number of purposes
and is not limited to health care. Athletes can be monitored in real-time for
performance and referee-assist services (Dhamdhere et al., 2010) by attach-
ing sensors monitoring heart rate and spatial position. Monitoring levels
of fatigue in drivers by using a neural network to analyse eye shape and
position (Rong-ben et al., 2003) can also assist in improving road safety.
Monitoring equipment is progressing to a point where it is more portable
than ever before (Chang et al., 2008), which allows its use in a wider range of
scenarios while being minimally invasive to the wearer. This is even the case
for purposes previously deemed intrusive, such as monitoring blood glucose
levels; now able to be tested through contact lenses (Parviz, 2009) rather
than a traditional lancet and strip mechanism.
There remains a number of problems with physiological monitoring on
mobile devices, particularly focused on power supply and consumption (Lin
et al., 2004). Performing transformations upon collected data in real-time is
a significant strain on resources, so any improvement in efficiency through
intelligent distributed processing is both desirable and achievable (Rong-ben
et al., 2003). Power consumption is also affected considerably by wireless
CHAPTER 2. BACKGROUND 24
transmission specifications, so devices with lower power consumption also
tend to have low transmission ranges (Jovanov et al., 2003b). In order to
save additional resources, it is possible to dynamically select the mode of
communications (Pering et al., 2006) between standard WiFi and Bluetooth,
with the latter consuming less power for transmission.
2.6 Distributed Physiological Monitoring
Previous studies involving physiological monitoring of groups have generally
been for very practical purposes. One such use has been distributed moni-
toring systems for automated care of patients within wards (Lin et al., 2006),
with a focus on customisation and reduced costs. Other studies have utilised
physiological monitors operating as a Body Area Network (Jovanov et al.,
2003b) to record stress in real-time over the duration of military assessment
and training.
Useful techniques have been designed to allow for the synchronisation
of real-time data sources (Jovanov et al., 2003a), as well as several tech-
niques providing means of routing (Dhamdhere et al., 2010; Chen, 2006)
and management of wireless sensor networks (Ren et al., 2005; Pandian
et al., 2008; Lee et al., 2009) that can be utilised. By combining these net-
work organisation techniques with our own methods for other components
of our theoretical networking stack, a complete solution can be developed.
The majority of problems associated with using distributed sensor net-
works in typical environments are inherent within all wireless sensor net-
works, and physiological monitoring networks are no exception. While solu-
tions have been proposed for issues such as sensor coverage (Cardei & Wu,
2006; Meguerdichian et al., 2001) and network routing (Akkaya & Younis,
2005), power consumption is an issue of particular importance in physiolog-
CHAPTER 2. BACKGROUND 25
ical monitoring (Milenkovic et al., 2006).
2.7 Distributed Processing
When performing extensive data transformations in a mobile environment,
access to processing resources is often scarce. To avoid the unwieldy scenario
of transporting powerful workstations to process collected data, a cluster of
heterogeneous mobile devices can instead be used to collaboratively process
work. In the event that further resources are needed, on-demand Cloud or
on-site resources can be utilised, at a price. However, task allocation across
such a varied group of devices brings its own challenges.
Optimal resource allocation for distributed computing is a difficult task,
with many algorithms developed to provide satisfactory solutions for various
cases (Topcuoglu et al., 2002). These algorithms are classified into a number
of groups (such as list-scheduling (Adam et al., 1974), clustering (Yang
& Gerasoulis, 1994), duplication-based (Ahmad & Kwok, 1994) or guided
random search methods) but are generally developed to distribute tasks
across a cluster of homogeneous processors. There are other algorithms
developed to operate over heterogeneous clusters (Topcuoglu et al., 2002;
Sih & Lee, 1993; El-Rewini & Lewis, 1990; Iverson et al., 1995), several of
which would be suitable for implementation into a distributed physiological
processing system.
A number of cloud services are available and have previously been used
to process data transformations, such as Amazon EC2 (Lee et al., 2010) and
S3 (Palankar et al., 2008). There has also been research into the benefits
of scheduling excess tasks to the cloud over local resources (de Assuncao
et al., 2009), which demonstrated a good ratio of performance to price in
high-intensity scenarios.
CHAPTER 2. BACKGROUND 26
2.8 Distributed Physiological Processing
Physiological monitoring and transformations can be a useful method of de-
riving data from subjects for a range of purposes, including measuring stress
and activity levels amongst others. However, there remains further opportu-
nities in group physiological monitoring - particularly in determining crowd
behaviour from physiological markers. In order to effectively transform the
collected data in real-time and aggregate it, significant processing power is
required - processing that is not necessarily always available or accessible,
due to broadband communications breakdowns or other reasons.
In order to alleviate the strain on external resources for this method
of analysis, the devices collecting and transmitting the physiological data
should be able to handle some or all of the processing occurring. While mo-
bile devices have previously been used for similar purposes (Chu & Humphrey,
2004), it is noted that such devices are often resource-limited: particularly
considering low battery capacities. For the system to cope with devices with
different levels of ability or power resources processing should be distributed
across all devices such that their weighted load provides a more efficient use
of group resources (Pinheiro et al., 2001). This would allow the system
to monitor groups for longer and with greater responsiveness than other-
wise possible, which is an important consideration in situations involving
health-critical monitoring subjects such as cardiac rehabilitation patients.
2.9 Ethics and Privacy
Due to the sensitive nature of data being collected in the process of physi-
ological monitoring (often highly personal health-related data), it is impor-
tant to consider associated privacy laws. A number of health-related privacy
CHAPTER 2. BACKGROUND 27
acts and laws exist to prevent the exposure (either intentional or acciden-
tal) of personal health data associated with clinical patients and research
subjects. In Australia, these mostly comprise of the Privacy Act 1988 and
amendments (AG, 2012), which details laws designed to protect the personal
information of individuals.
There are also a number of guidelines (OFPC, 2001) focused on the
use of individuals’ personal health information without consent. The list of
situations in which unauthorised use of health information is appropriate
is short - usually only if the research has a significant positive impact on
society. The Royal Australia College of General Practitioners offer a set of
generalised computer security guidelines (Practitioners, 2011) that outline a
number of risk categories and offer specific suggestions to improve security.
Beyond the Privacy Act, there are no official guidelines in Australia
related to the use of physiological monitoring - although the vast majority
of research-oriented scenarios would require consent and ethics approval.
Securing physiological monitoring systems often varies depending on the
scenario. A system monitoring physiological and physical location data of
soldiers in active combat will require significantly more complex security
than a user tracking their daily jog, for example. However, due attention
should always be paid to security when monitoring physiological data from
subjects, as such data is often highly personal and could adversely affect an
individual’s life.
While specific networking security techniques are outside the scope of
this dissertation, it is recommended that researchers participating in physi-
ological monitoring experiments always do their utmost to enforce security
protocols ensuring personal data is kept secure.
CHAPTER 2. BACKGROUND 28
2.10 Summary
This chapter introduced the concept of applying distributed processing tech-
niques to physiological monitoring networks in mobile environments. Sec-
tion 2.5 introduces current techniques for mobile monitoring devices, as well
as potential applications and issues. These techniques are expanded upon
in Section 2.6, which argues the value of physiological monitoring in a group
context. However, a more scalable processing framework would be beneficial
and allow for more detailed physiological analysis to occur in mobile environ-
ments. This requires the application of distributed processing techniques,
and relevant issues are reviewed in Section 2.7. Finally, Section 2.8 argued
for the potential benefits of distributed physiological processing, to be built
into a monitoring framework that could be used in mobile environments.
Chapter 3
Case Studies in Distributed
Physiological Monitoring
3.1 Overview
To ease definition of parameters that currently impede distributed physiolog-
ical monitoring, two scenarios have been designed that would normally cause
problems if group physiological monitoring were attempted. These scenarios
can cover a range of different potential applications, from safety monitoring
to general monitoring for the purposes of enhancing services. Defining the
problems involved with physiological monitoring in these scenarios clarifies
the benefit of potential solutions and would help provide suitable real-world
testing environments for a complete solution.
The following chapter is structured as follows. Both Sections 3.2 and 3.3
present potential usage scenarios for the system described in this disserta-
tion, focusing on different environments with similar challenges. Section 3.2
uses the example of a military training exercise in remote territory and
analysis of participants. Section 3.3 instead discusses a scenario involving
29
CHAPTER 3. CASE STUDIES 30
sensor rigs carried by miners in underground caverns. Section 3.4 highlights
common issues between scenarios and discusses potential solutions. Lastly,
Section 3.5 provides a summary of this chapter.
3.2 Training Analysis
Real-time physiological monitoring can provide a wealth of useful informa-
tion about the physical and mental health of those under observation. Exist-
ing techniques and systems can satisfy the needs of participants in traditional
monitoring environments, but often lack the necessary mobility to be used
in other situations or rely heavily on sustained access to mobile broadband
communications networks that may not be available.
One system has been designed to cater for similar uses in mobile envi-
ronments (Jovanov et al., 2003b), which helpfully describes an appropriate
usage scenario. As part of the Warfighter Physiological Status Monitor-
ing project (Hoyt et al., 2002), physiological sensors were embedded into
soldiers’ uniforms to monitor health and mental state in order to prevent
unnecessary casualties due to conditions such as heat stress and altitude
sickness, as well as improve the likelihood of survival of wounded soldiers.
By tracking physiological data of groups of soldiers, remote assistance
can be provided to assess casualties, as well as provide early notification
of potential medical emergencies. In addition, it can be used for evalua-
tion purposes - by establishing baseline heart-rate variability markers for
participants, stress levels during training in mobile environments can be as-
sessed (Hoyt et al., 2002). This provides the potential for early discovery of
stress-related problems in soldiers, which can have significant effects, both
while participating in battle (Solomon et al., 1986) and upon returning home
(Lapierre et al., 2007).
CHAPTER 3. CASE STUDIES 31
Similar principles can be applied to training exercises, allowing super-
visors to monitor the mental stress and well-being of soldiers undertaking
training in remote locations. Such locations can often be out of effective
broadband communications range, making the requisite processing of phys-
iological data difficult. While basic sensor data (such as heart rate) can
already be monitored in mobile environments as part of basic sensor func-
tionality, making available complex transformation processing could provide
supervisors with new ways to accurately measure trainee performance in
real-time.
3.3 Miner Safety
Distributed physiological processing can also be extremely useful for safety
monitoring in areas with intermittent or weak connections to headquarters
- particularly in labyrinthine mining tunnels and similar areas. Physio-
logical monitoring has already been used in mining scenarios, particularly
in rescue scenarios (Zephyr Technology, 2010), although the existing solu-
tions require a large amount of on-site infrastructure. While monitoring
devices and processing equipment would likely represent a significant cost
to a resources corporation, the potential for improved safety (and therefore
decreased fines/penalties) may justify the cost.
Miners equipped with monitoring devices and small processing units that
could be built into existing safety equipment. Changes in heart-rate vari-
ability (Hjortskov et al., 2004) and other indicators within a localised area
could indicate workers under serious mental stress, or a problem not visible
to other sensors. If no connection to headquarters is available, units would
collaboratively processes the workload and alert localised alarm units to in-
dicate a problem - even without connection to or interaction with superiors.
CHAPTER 3. CASE STUDIES 32
A monitoring system could also include other types of sensors looking for
issues with air quality or poisonous gasses, able to be entirely processed by
the mobile units. By collating data from these units, it would be possible to
locate areas with poor habitability and alert workers to avoid certain areas.
While mine workers are likely to be able to carry larger battery reserves
for processing than individuals in other scenarios, efficient distribution of
work processing would allow for more accurate monitoring, as more available
processing could cater for lower intervals between sensor readings.
Adaptation of the system for this scenario follows similar principles to
the other scenarios, as population density is reduced and connectivity be-
comes sparse. Equipment supporting higher processing ability and more
power resources is able to be integrated into safety harnesses and mining
equipment.
Due to the importance of maintaining connections in safety-conscious
situations such as mining, it is recommended that wireless relays are situated
throughout the mines to ensure controllers have connectivity at all times.
Unfortunately, bandwidth is not necessarily plentiful with such solutions,
so transformations should still be distributed amongst equipment available
on mining and safety rigs and only resulting data should be transmitted to
controllers.
3.4 Common Issues
A number of issues common to both scenarios become apparent upon consid-
eration of environmental factors. Physiological monitoring and processing
can be impeded significantly by issues such as poor wide-area communica-
tions, as is often the case in confined spaces such as mine shafts. Monitoring
in mobile situations is also a difficult proposition, since traditional process-
CHAPTER 3. CASE STUDIES 33
ing resources are generally not portable and require stable power supplies,
which are rarely available when moving. However, there are potential solu-
tions to both of these issues, involving moving to a distributed processing
system across mobile devices.
Available communications are an important part of most systems re-
quiring significant amounts of processing resources, as it allows the system
to offload excess tasks to more capable processing facilities, such as Cloud
computing. Environments which are naturally unsuitable to mobile broad-
band communications networks such as heavy forest, mountainous or hilly
terrain and areas suffering from heavy snowfall are difficult to operate these
kinds of systems in, as communications are often disrupted or completely
unavailable. Without the ability to offload some or all of the processing to
these external resources via those mobile networks, the system may have to
severely reduce functionality in order to remain even slightly useful - gen-
erally an undesirable scenario. This is particularly problematic situation
with physiological monitoring, as the real-time presentation of transformed
physiological data may have life-threatening consequences. To improve the
ability to perform physiological monitoring in these situations, fundamental
changes to the manner in which physiological processing is performed should
be considered.
Power supplies in mobile environments, such as a group of soldiers mov-
ing at speed through areas, are often limited to portable batteries due to size
and weight constraints. Traditional processing resources (such as worksta-
tions and servers) are often completely stationary and require a fixed power
supply, which excludes their use in mobile environments.
There are several potential solutions to the issues described in this sec-
tion. Moving away from the traditional fixed processing model towards a
CHAPTER 3. CASE STUDIES 34
more dynamic and mobile architecture would provide significant advantages
over existing solutions. Recent advances have introduced mobile devices (ie.
smartphones) that have processing capability approaching fixed resources
(Land & Vallejo, 2009). While individual mobile devices are still unlikely
to be able to process all desired transformations in real-time, a cluster of
devices working collaboratively to perform requisite data transformations
have the potential to be a solution to this issue.
These devices have the additional benefit of providing their own mobile
power source (typically through Lithium-Ion batteries) with the option of
charging through either a portable generator or solar cells. Additional bat-
teries could also be added to equipment packs without seriously impacting
total load weight, as most batteries suitable to mobile phones weigh con-
siderably less than uninterruptible power supplies (which serve the same
purpose, but for desktop machines).
With the commonplace availability of smartphones capable of being a
part of a solution to the issues described in this section, such a system
would be relatively easy to implement. No specialised equipment would be
required to implement such a system, even in environments not traditionally
suited to physiological monitoring. The benefits provided by using mobile
devices in a collaborative fashion have the potential to significantly improve
the accessibility of physiological monitoring, which is a stated aim of this
dissertation.
3.5 Summary
This chapter has detailed two scenarios that could benefit from improve-
ments to physiological monitoring techniques. Issues generally revolve around
a lack of mobility amongst processing resources and power supplies used in
CHAPTER 3. CASE STUDIES 35
traditional processing techniques, as well as a reliance on stable, available
mobile broadband communications networks.
Section 3.2 presents a scenario based around monitoring the heart-rate
variability of trainees participating in a training exercise, to determine men-
tal stress levels. The exercises could take place in regions that have poor mo-
bile broadband communications networks, including heavy forest or snowy
areas. Trainees are constantly mobile, presenting difficulties when using
traditional, fixed processing resources (such as workstations) that require
constant power supplies.
Section 3.3 describes a scenario involving a sensor rig carried by miners
in shafts, which are often confined spaces with poor or interrupted com-
munications. These sensor rigs could be used to determine miner mental
stress and work environment conditions, to provide early alerts in the event
of danger. While this situation is less mobile than the previous scenario,
poor communications still represent a serious complication when dealing
with traditional physiological processing mechanisms.
Section 3.4 presents a number of issues common to both scenarios. These
issues should be considered when developing more suitable techniques for
these environments, and include communications reliability, power supply,
available processing power and difficulty of implementation.
The common issues highlighted in this chapter between scenarios pro-
vides insight into some of the areas of physiological monitoring and process-
ing that could be improved. Shifting to a more mobile paradigm would abate
or entirely solve some of the issues. Mobile devices operate on portable power
supplies, removing the requirement for traditional processing resources to be
connected to fixed power supplies, and introducing the option of recharg-
ing mobile batteries through use of a portable generator or solar cells. The
CHAPTER 3. CASE STUDIES 36
devices are also less heavily reliant on the presence of reliable mobile broad-
band communications networks, as they should be able to process all requi-
site physiological transformations in a collaborative fashion, without having
to offload processing to fixed or Cloud computing resources. The devices
are also completely portable and can be used while mobile, allowing the use
of physiological monitoring and processing in a wider range of situations.
Finally, mobile devices are almost ubiquitous, making implementation ac-
cessible due to a lack of special hardware requirements.
Chapter 4
Design
4.1 Overview
The aim of this dissertation is to provide improvements to physiological
monitoring and processing techniques. In order to evaluate the viability of
these improvements in real situations, a platform upon which distributed
physiological monitoring and processing platform may be supported is de-
signed.
To provide a platform for distributed physiological monitoring and trans-
formation processing, careful consideration is required while designing an
architecture to suit potential usage environments, such as those described
in Chapter 3. A set of system requirements is described that attempts to
apply the aims discussed in Section 1.4 to any resulting implementation of
a physiological monitoring system. In order to ensure compatibility with
existing devices and interoperability with existing physiological monitoring
systems, standard interfaces are designed through which data access and
transformation requests may be made. Finally, specific roles within the sys-
tem are defined, with responsibilities allocated in such a way to provide a
37
CHAPTER 4. DESIGN 38
scalable architecture that is easily configurable in mobile environments.
The remainder of this chapter is structured as follows. Section 4.2 defines
a set of requirements that the system should fulfill to ensure suitability with
the intended environments. Section 4.3 presents an overview to the system’s
architecture and basic topology. Section 4.4 describes a predefined set of
roles that devices operating in the system can assume, with varying intended
purposes. Section 4.5 details the system interface, including possible actions
that can be taken by end-users, and provides XML examples of interaction
for specific tasks. Finally, Section 4.6 presents a summary of the chapter.
4.2 Requirements
In order to satisfy the aims introduced in Section 1.4 and improve physiologi-
cal monitoring in mobile environments, such as those proposed in Chapter 3,
any viable solution must meet a number of key requirements, which are as
follows.
R1 The system should facilitate the configuration, collection, transforma-
tion and presentation of physiological data across any number of input
sensors and processing devices
R2 The system should require minimal configuration and allow for the use
of any type of sensor
R3 The system should be fully mobile, and not require non-portable pro-
cessing hardware or equipment that requires an uninterrupted power
supply.
R4 The system should be able to interface with existing monitoring prod-
ucts for use as data streams.
CHAPTER 4. DESIGN 39
R5 The system should be compatible with a wide range of common oper-
ating systems, including mobile platforms.
R6 The system should handle any number of physiological sensors per mon-
itoring device..
R7 The system should scale easily, simply by adding more processing nodes.
R8 The system should prevent unauthorised access to highly personal phys-
iological data through standard authentication methods.
A system implemented with these requirements carefully considered should
provide a suitable platform for physiological monitoring and processing in
any scenario, but particularly for those outlined in Chapter 3.
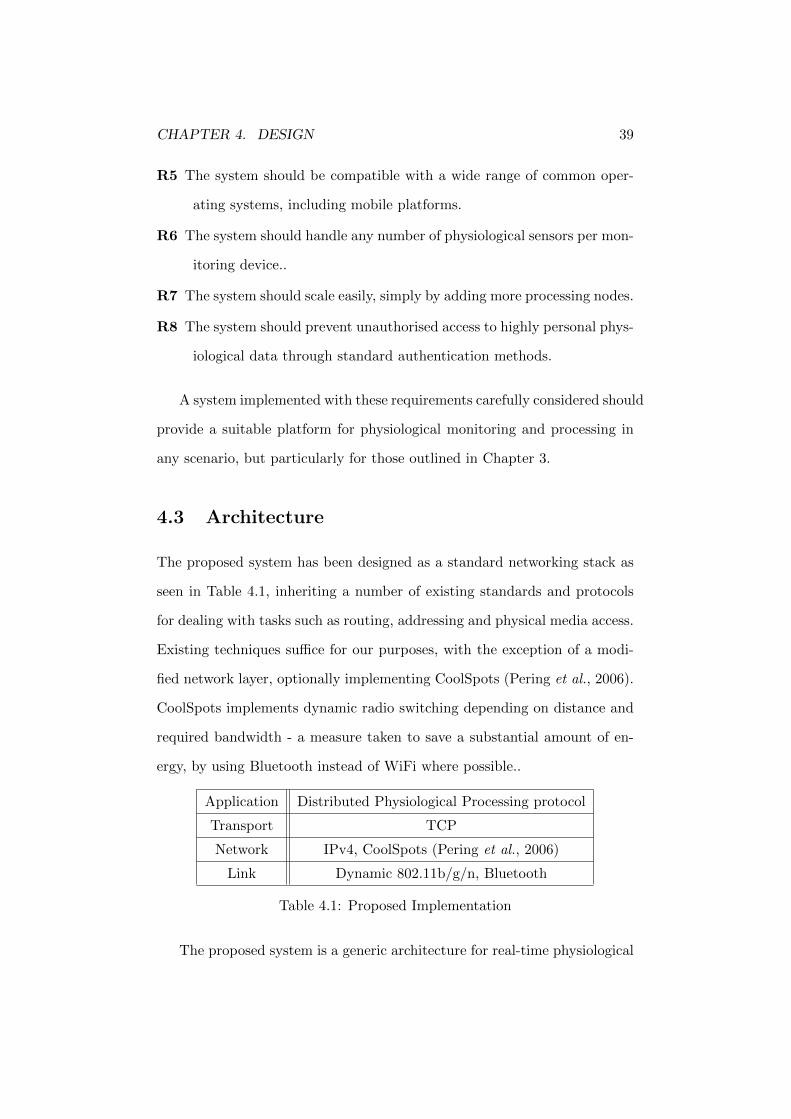
4.3 Architecture
The proposed system has been designed as a standard networking stack as
seen in Table 4.1, inheriting a number of existing standards and protocols
for dealing with tasks such as routing, addressing and physical media access.
Existing techniques suffice for our purposes, with the exception of a modi-
fied network layer, optionally implementing CoolSpots (Pering et al., 2006).
CoolSpots implements dynamic radio switching depending on distance and
required bandwidth - a measure taken to save a substantial amount of en-
ergy, by using Bluetooth instead of WiFi where possible..
Application Distributed Physiological Processing protocol
Transport TCP
Network IPv4, CoolSpots (Pering et al., 2006)
Link Dynamic 802.11b/g/n, Bluetooth
Table 4.1: Proposed Implementation
The proposed system is a generic architecture for real-time physiological
CHAPTER 4. DESIGN 40
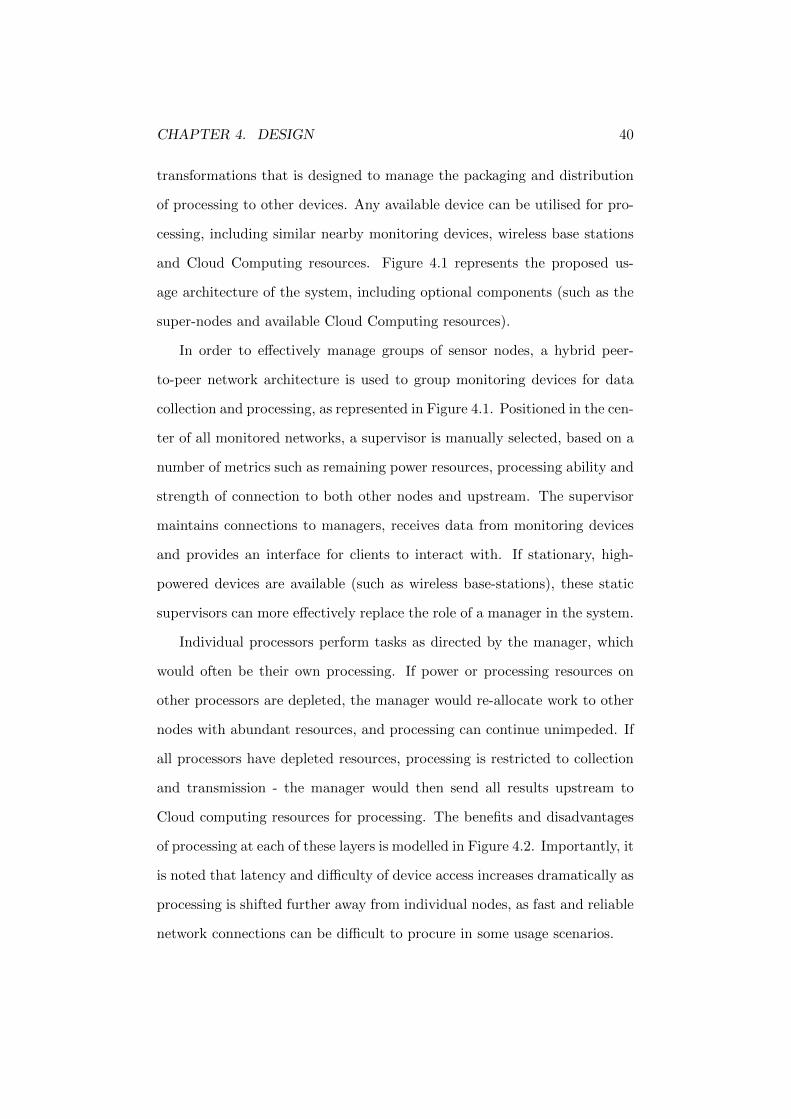
transformations that is designed to manage the packaging and distribution
of processing to other devices. Any available device can be utilised for pro-
cessing, including similar nearby monitoring devices, wireless base stations
and Cloud Computing resources. Figure 4.1 represents the proposed us-
age architecture of the system, including optional components (such as the
super-nodes and available Cloud Computing resources).
In order to effectively manage groups of sensor nodes, a hybrid peer-
to-peer network architecture is used to group monitoring devices for data
collection and processing, as represented in Figure 4.1. Positioned in the cen-
ter of all monitored networks, a supervisor is manually selected, based on a
number of metrics such as remaining power resources, processing ability and
strength of connection to both other nodes and upstream. The supervisor
maintains connections to managers, receives data from monitoring devices
and provides an interface for clients to interact with. If stationary, high-
powered devices are available (such as wireless base-stations), these static
supervisors can more effectively replace the role of a manager in the system.
Individual processors perform tasks as directed by the manager, which
would often be their own processing. If power or processing resources on
other processors are depleted, the manager would re-allocate work to other
nodes with abundant resources, and processing can continue unimpeded. If
all processors have depleted resources, processing is restricted to collection
and transmission - the manager would then send all results upstream to
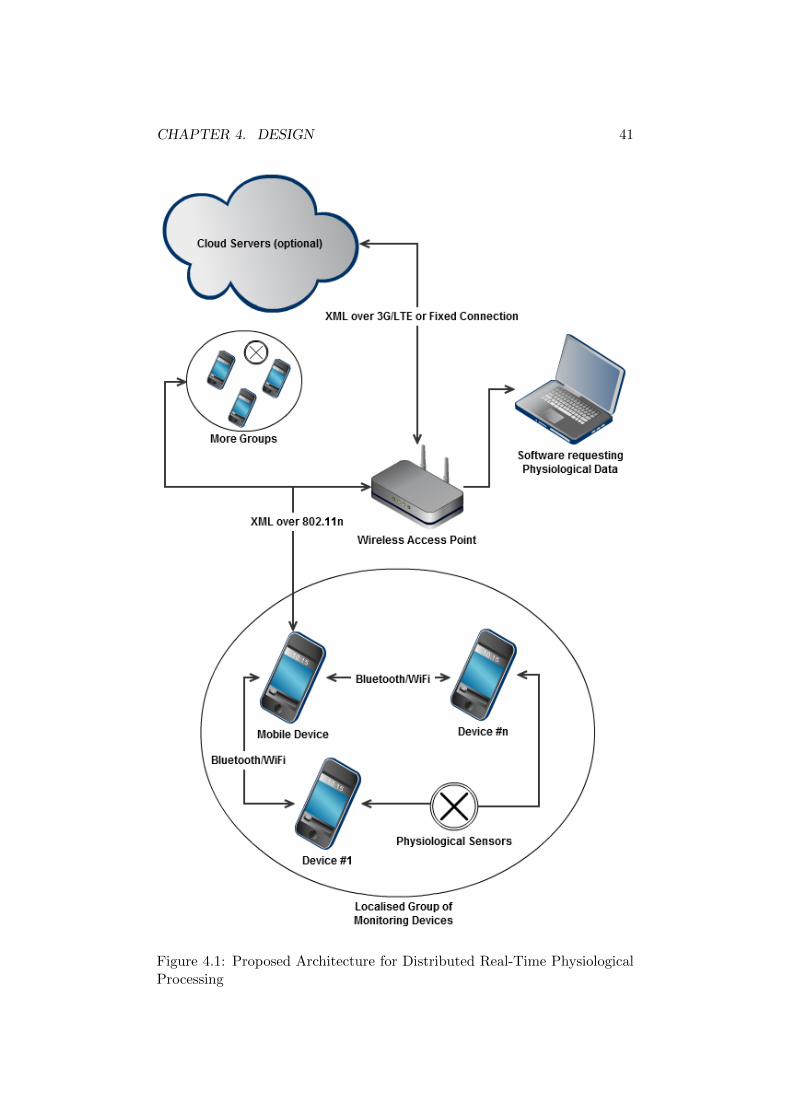
Cloud computing resources for processing. The benefits and disadvantages
of processing at each of these layers is modelled in Figure 4.2. Importantly, it
is noted that latency and difficulty of device access increases dramatically as
processing is shifted further away from individual nodes, as fast and reliable
network connections can be difficult to procure in some usage scenarios.
CHAPTER 4. DESIGN 41
Figure 4.1: Proposed Architecture for Distributed Real-Time PhysiologicalProcessing
CHAPTER 4. DESIGN 42
Figure 4.2: Benefits and Disadvantages of Processing Layers
To allow the manager to balance load evenly across the network, nodes
are also required to report their current state to the supervisor. This includes
details such as current load, remaining power resources, current processing
details and others. Because the stream registration system already exists
for data collection and transmission purposes between client and server, the
existing stream methods can be repurposed to report device state alongside
any sensor data.
The manager balances load and resources by monitoring the state of
clients, allowing it to distribute work to low-load devices with plentiful re-
sources. The supervisor also keeps aggregate state details, such as an average
power resource level of the group. In turn, the supervisor provides the man-
ager with supplementary data, allowing it to decide if the network is unable
to cope with current workload for a sustained period of time. In this event,
the manager would trigger offloading of workload to Cloud Computing re-
sources (if accessible).
The supervisor interface should be built upon RESTful (Fielding, 2007)
principles, allowing system function to be directly mapped to HTTP method
requests to particular resources. This mapping is described in detail in
CHAPTER 4. DESIGN 43
Section 4.5.1.
4.4 Roles
As mentioned in the previous section, the proposed system categorises re-
sources into four roles; processors, monitors, managers and supervisors. Any
resource can be used in any of these roles, though suggestions for optimal
selection are noted below, where each role is described in detail.
Supervisor
The supervisor is the overarching controller of the entire system. Its
primary role is as an interface to the system for all external entities,
including monitors, managers and clients. The supervisor hosts the
RESTful interface to the system, as well as collating all data received
from monitoring nodes, passing transformation requests to the man-
ager (along with required data streams) and tracks node state for load
balancing purposes. As the supervisor has to deal with a substantial
amount of incoming requests, it is recommended that a device with
good processing ability and network throughput is utilised in this role.
Manager
The manager only directly interacts with the supervisor and process-
ing nodes, and acts as a load balancer for all processing resources. It
retrieves node state from the supervisor and uses either utility func-
tions or a decision tree to determine where transformation tasks should
be sent for processing. For smaller networks, the manager can share
resources with the supervisor. However, due to the considerable work-
load assigned to the manager, a dedicated device is recommended for
CHAPTER 4. DESIGN 44
use in larger monitoring networks.
Monitor
A monitoring device has a single purpose; to receive raw sensor data
and package it in a form suitable for transmission to the supervisor.
The configuration of the monitor should be flexible enough to enable
it to interact with any sensor that could be attached to the device.
In most networks, these will be low-powered devices. If the device
is required to poll multiple sensors for data with high responsiveness,
the multi-threaded nature of this task will require substantially more
powerful hardware.
Processor
Processing resources are the workhorse of the network. The manager
distributes transformations to the processors to be completed in as
little time as possible, but the nature of the networks allows signifi-
cant scaling. In portable environments, even low-end smartphones can
act as capable processors. If heavy transformational work is required,
dedicated processing servers or even Cloud computing resources can
be utilised in this role.
Each role must be fulfilled in some manner for the network to function
properly, but in many instances a single device will fill many roles. As an
example, most processors will also be monitors in order to report their state
to the supervisor. In smaller networks, the supervisor and manager may
share resources. However, when monitoring large sensor networks each role
can be filled by appropriate resources to ensure optimal network reliability
CHAPTER 4. DESIGN 45
and responsive transformation processing.
4.5 System Interface
Using a RESTful interface provides an accessible and compatible connec-
tion interface to physiological data and transformations, supporting a broad
range of applications and existing sensor products. Presenting a standard-
ised interface to users assists in the integration of existing systems, as well
as the development of analysis suites. To ensure the interface is as acces-
sible as possible, XML-based communications can be utilised over HTTP
connections. Pre-defined XML schemas for communicating with the system
are described as examples below.
4.5.1 Resources
In keeping with RESTful interface principles, interaction with the system
is entirely made up of HTTP requests, taking advantage of a number of
standards-defined request methods. The system is composed of three data-
based resources; users, streams and transforms. Depending on the HTTP
method and variable access used (with specifics given in Section 4.5), various
functionality can be accessed. The function accessed by method and resource
is summarised below.
User
GET - Query: Retrieves user data, related streams
PUT - XML: Register a user
POST - None
OPTIONS - Query: Return a list of all registered users
CHAPTER 4. DESIGN 46
Stream
GET - Query: Retrieves stream-specific data
PUT - XML: Register a data stream
POST - XML: Submit data for a stream
OPTIONS - Query: Return a list of all registered streams
Transform
GET - Query: Execute a single transformation, streams as input only
PUT - XML: Register a transformation function, requires function be
added to manager libraries
POST - XML: Execute a chained transformation
OPTIONS - Query: Return a list of all available transformation functions
A number of these resources simply return a XML stream containing
the desired data, while those requiring complex XML requests to alter the
system are described in the following sections.
4.5.2 User Registration
To ease data access, any registered data stream must be directly assigned
to a registered user. This provides two advantages; users can easily identify
which sensor streams directly relate to them, and can provide authentication
for data access if required. A new user may register with the system by
sending an XML message as described in Listing 4.5.2 via HTTP PUT to
the user resource

CHAPTER 4. DESIGN 47
<UserRegistration>
<UserName>Fred Bob</UserName>
</UserRegistration>
Listing 4.5.1: XML User Registration Request
Upon request, the system generates a UUID (Universally Unique Iden-
tifier) that serves as the user’s authentication token, to be supplied with
all future requests. The system returns an XML message to the request-
ing client containing the authentication token, along with a unique user
identification number, to be used in stream registration and transformation
execution. The XML response is as detailed in Listing 4.5.2
<UserRegistration>
<UserID>1</UserID>
<AuthToken>09f9dade-78c7-11e1-bc15-080027003c78</AuthToken>
</UserRegistration>
Listing 4.5.2: XML User Registration Response
4.5.3 Stream Registration
After completing the registration sequence, users may register streams to
be processed by the system. A data stream may contain any data that
conforms to the format definition, which is supplied with the registration.
A successful stream registration should contain the following parameters:
• UserID - users registration ID
• AuthToken - user’s authentication token
• Name - name of the stream
• Description - description of the stream
• Format - expected data format definition
CHAPTER 4. DESIGN 48
In order to correctly store and process the stream, a data format defini-
tion should indicate the structure of the data being supplied. If a physical
device is obtaining data to be transmitted over the stream, the following
sensor details should be provided:
• Name - the name or model of the sensor
• Description - a description of the sensor
• Location - physical location of the sensor
• SampleRate - how often the sensor should be polled for data (per
minute)
While name and description are metadata for the sensor, location can
specify either a relative physical location (e.g. chest, wrist, etc.) or a static
GPS location. If a dynamic GPS location is required, a stream should be
registered containing the GPS itself as a sensor.
Using this format, users are able to specify any number of streams for
registration with the system. The streams can either send data from phys-
ical sensors or other data, such as system load or other device statistics.
An example of registration for two sensors, a heart-rate monitor and skin
conductance monitor, is illustrated in Listing 4.5.3.
CHAPTER 4. DESIGN 49
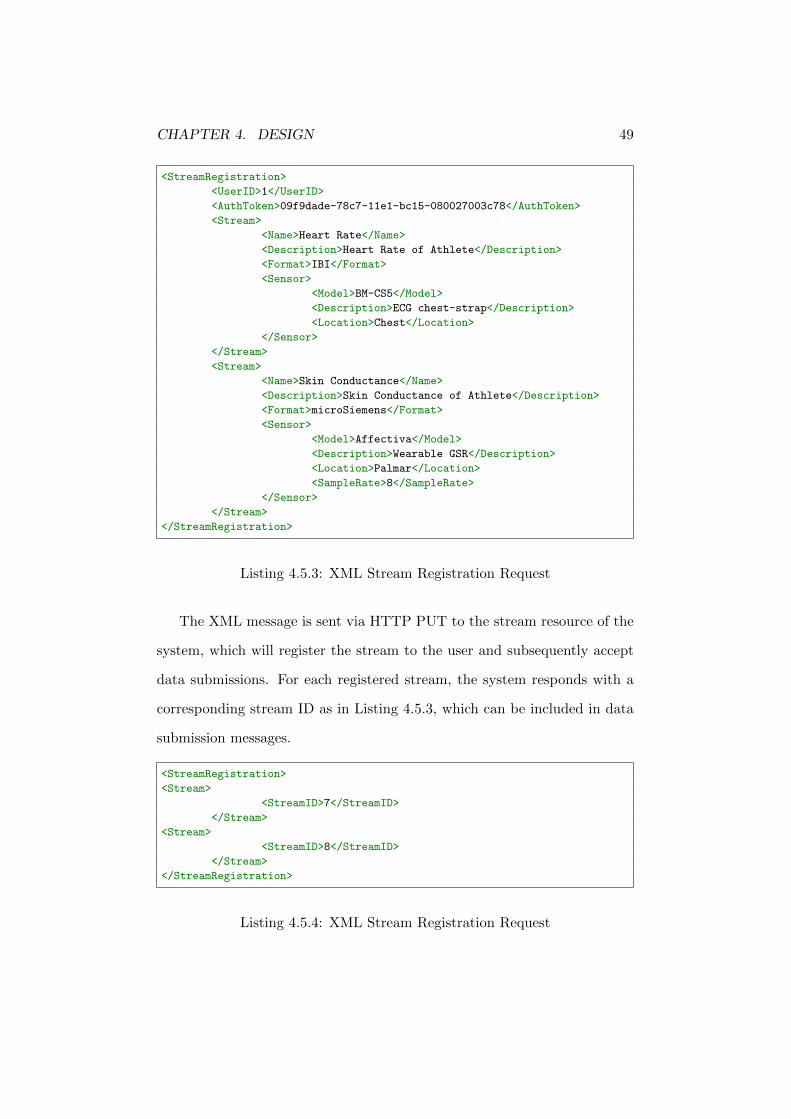
<StreamRegistration>
<UserID>1</UserID>
<AuthToken>09f9dade-78c7-11e1-bc15-080027003c78</AuthToken>
<Stream>
<Name>Heart Rate</Name>
<Description>Heart Rate of Athlete</Description>
<Format>IBI</Format>
<Sensor>
<Model>BM-CS5</Model>
<Description>ECG chest-strap</Description>
<Location>Chest</Location>
</Sensor>
</Stream>
<Stream>
<Name>Skin Conductance</Name>
<Description>Skin Conductance of Athlete</Description>
<Format>microSiemens</Format>
<Sensor>
<Model>Affectiva</Model>
<Description>Wearable GSR</Description>
<Location>Palmar</Location>
<SampleRate>8</SampleRate>
</Sensor>
</Stream>
</StreamRegistration>
Listing 4.5.3: XML Stream Registration Request
The XML message is sent via HTTP PUT to the stream resource of the
system, which will register the stream to the user and subsequently accept
data submissions. For each registered stream, the system responds with a
corresponding stream ID as in Listing 4.5.3, which can be included in data
submission messages.
<StreamRegistration>
<Stream>
<StreamID>7</StreamID>
</Stream>
<Stream>
<StreamID>8</StreamID>
</Stream>
</StreamRegistration>
Listing 4.5.4: XML Stream Registration Request
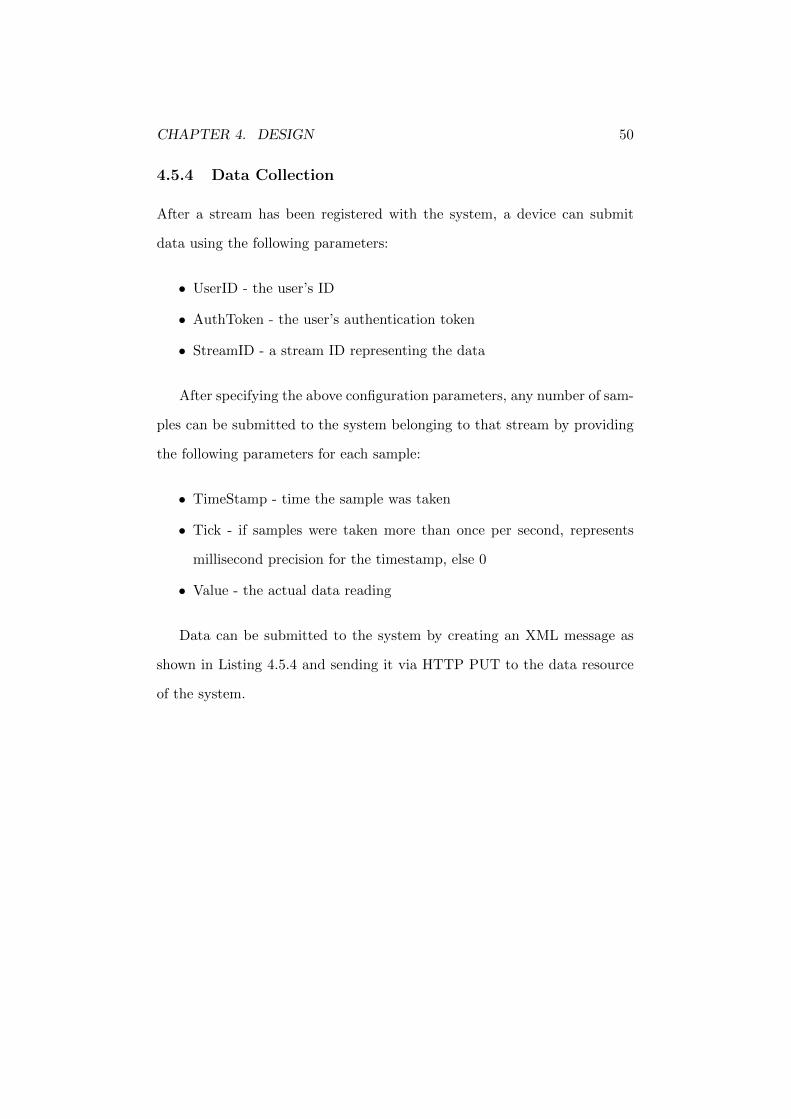
CHAPTER 4. DESIGN 50
4.5.4 Data Collection
After a stream has been registered with the system, a device can submit
data using the following parameters:
• UserID - the user’s ID
• AuthToken - the user’s authentication token
• StreamID - a stream ID representing the data
After specifying the above configuration parameters, any number of sam-
ples can be submitted to the system belonging to that stream by providing
the following parameters for each sample:
• TimeStamp - time the sample was taken
• Tick - if samples were taken more than once per second, represents
millisecond precision for the timestamp, else 0
• Value - the actual data reading
Data can be submitted to the system by creating an XML message as
shown in Listing 4.5.4 and sending it via HTTP PUT to the data resource
of the system.
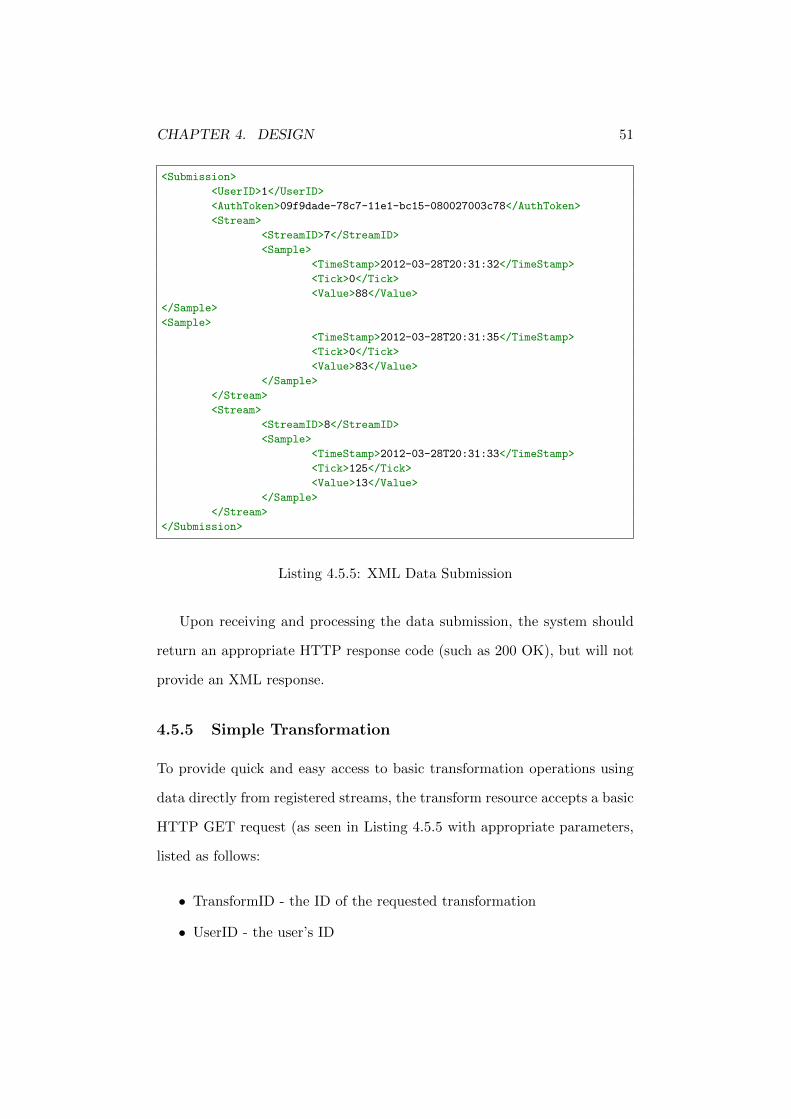
CHAPTER 4. DESIGN 51
<Submission>
<UserID>1</UserID>
<AuthToken>09f9dade-78c7-11e1-bc15-080027003c78</AuthToken>
<Stream>
<StreamID>7</StreamID>
<Sample>
<TimeStamp>2012-03-28T20:31:32</TimeStamp>
<Tick>0</Tick>
<Value>88</Value>
</Sample>
<Sample>
<TimeStamp>2012-03-28T20:31:35</TimeStamp>
<Tick>0</Tick>
<Value>83</Value>
</Sample>
</Stream>
<Stream>
<StreamID>8</StreamID>
<Sample>
<TimeStamp>2012-03-28T20:31:33</TimeStamp>
<Tick>125</Tick>
<Value>13</Value>
</Sample>
</Stream>
</Submission>
Listing 4.5.5: XML Data Submission
Upon receiving and processing the data submission, the system should
return an appropriate HTTP response code (such as 200 OK), but will not
provide an XML response.
4.5.5 Simple Transformation
To provide quick and easy access to basic transformation operations using
data directly from registered streams, the transform resource accepts a basic
HTTP GET request (as seen in Listing 4.5.5 with appropriate parameters,
listed as follows:
• TransformID - the ID of the requested transformation
• UserID - the user’s ID
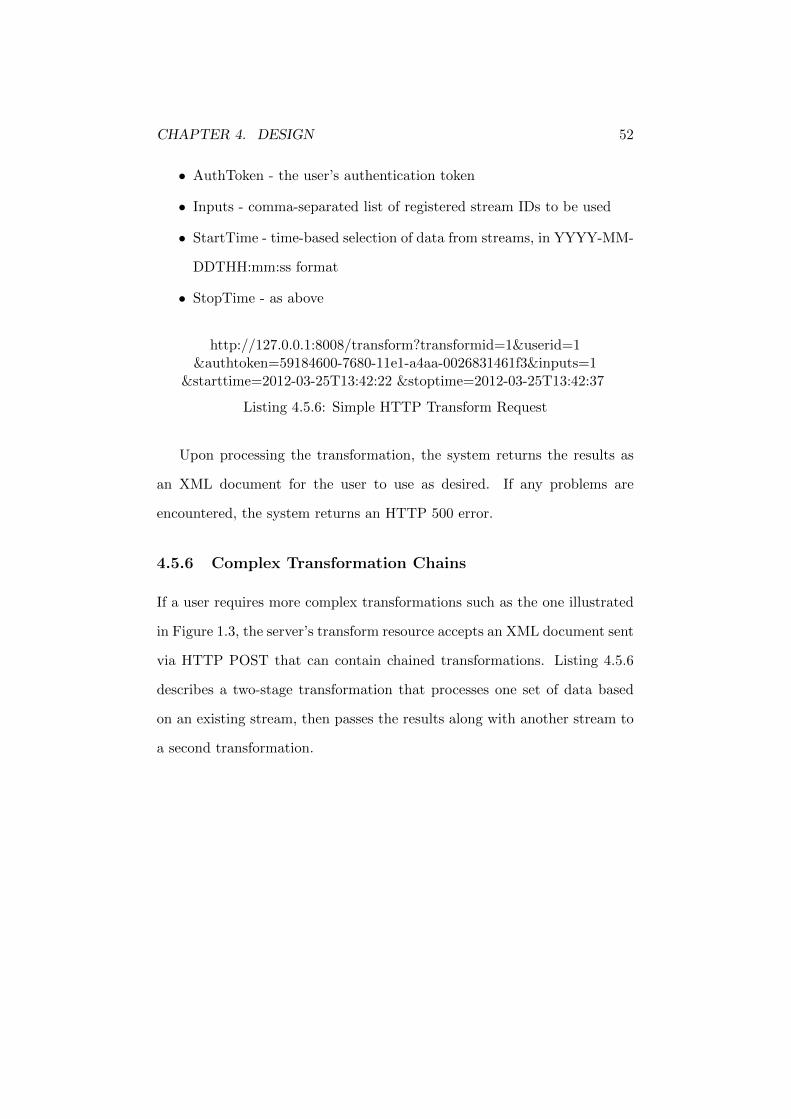
CHAPTER 4. DESIGN 52
• AuthToken - the user’s authentication token
• Inputs - comma-separated list of registered stream IDs to be used
• StartTime - time-based selection of data from streams, in YYYY-MM-
DDTHH:mm:ss format
• StopTime - as above
http://127.0.0.1:8008/transform?transformid=1&userid=1&authtoken=59184600-7680-11e1-a4aa-0026831461f3&inputs=1
&starttime=2012-03-25T13:42:22 &stoptime=2012-03-25T13:42:37
Listing 4.5.6: Simple HTTP Transform Request
Upon processing the transformation, the system returns the results as
an XML document for the user to use as desired. If any problems are
encountered, the system returns an HTTP 500 error.
4.5.6 Complex Transformation Chains
If a user requires more complex transformations such as the one illustrated
in Figure 1.3, the server’s transform resource accepts an XML document sent
via HTTP POST that can contain chained transformations. Listing 4.5.6
describes a two-stage transformation that processes one set of data based
on an existing stream, then passes the results along with another stream to
a second transformation.
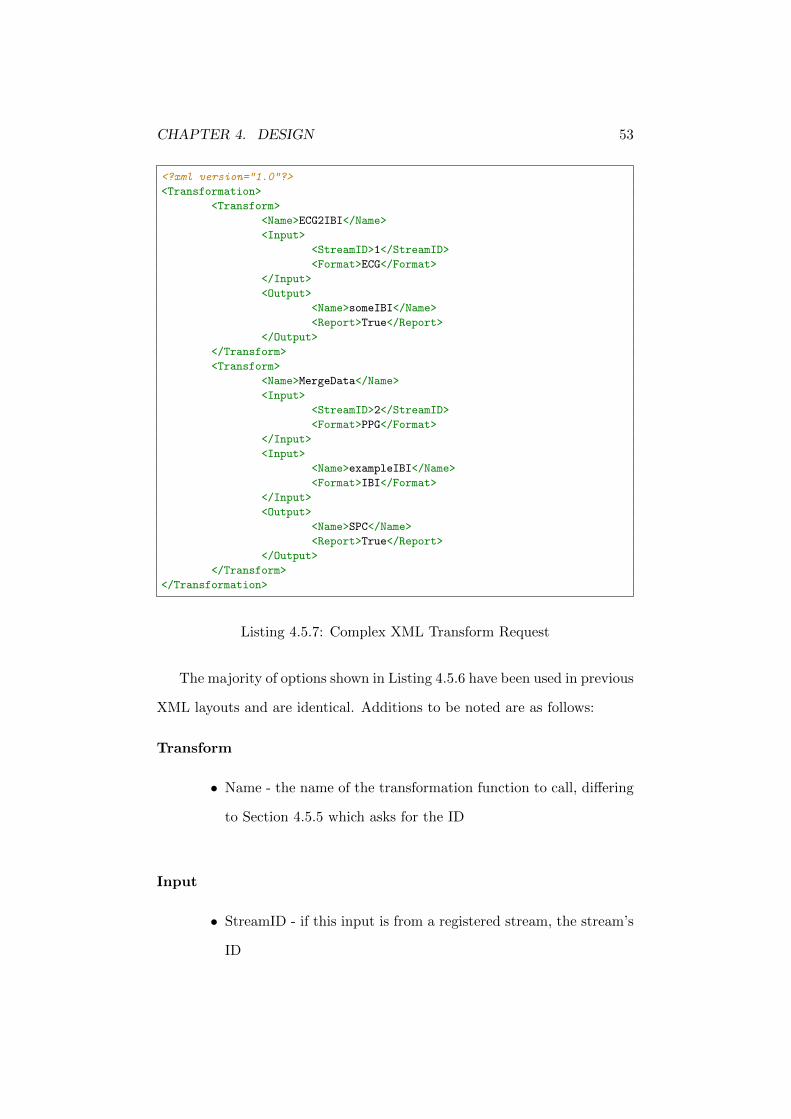
CHAPTER 4. DESIGN 53
<?xml version="1.0"?>
<Transformation>
<Transform>
<Name>ECG2IBI</Name>
<Input>
<StreamID>1</StreamID>
<Format>ECG</Format>
</Input>
<Output>
<Name>someIBI</Name>
<Report>True</Report>
</Output>
</Transform>
<Transform>
<Name>MergeData</Name>
<Input>
<StreamID>2</StreamID>
<Format>PPG</Format>
</Input>
<Input>
<Name>exampleIBI</Name>
<Format>IBI</Format>
</Input>
<Output>
<Name>SPC</Name>
<Report>True</Report>
</Output>
</Transform>
</Transformation>
Listing 4.5.7: Complex XML Transform Request
The majority of options shown in Listing 4.5.6 have been used in previous
XML layouts and are identical. Additions to be noted are as follows:
Transform
• Name - the name of the transformation function to call, differing
to Section 4.5.5 which asks for the ID
Input
• StreamID - if this input is from a registered stream, the stream’s
ID
CHAPTER 4. DESIGN 54
• Name - if this input is from a previously defined transformation,
the name of the previous transform’s output stream
Output
• Name - the name of the output stream, for use in following trans-
forms
• Report - boolean whether to include this stream’s output data in
the final results
Upon submission of a correctly-created XML document conforming to
the above structure, the supervisor will schedule work to be completed across
any available processing resources. Transformations may not necessarily be
completed on a single processor (as each part may be executed separately),
so complexity of transformation may determine how long the data will take
to return. Upon any failure, the system will return an HTTP 500 error and
any details of the problem (if available).
4.6 Summary
This chapter presented a number of system design considerations and spe-
cific data formats. System requirements have been formally listed in Sec-
tion 4.2, describing the overall aims of the system and its contribution to
physiological monitoring. The basic system architecture has been described
in Section 4.3, and the system roles were expanded upon in Section 4.4. The
system’s application programming interface was described with required in-
put parameters and expected output formats in Section 4.5.
CHAPTER 4. DESIGN 55
The design and interfaces in this chapter lay important foundations for
all implementations to build on. Implementations of the system are expected
to follow this interface, and custom devices designed to interact with the sys-
tem should also use the listed specifications. The functionality of subsystem
components are classified by role, which provides a structure to consider
when developing an appropriate network architecture for the system to run
upon.
The following chapter describes an implementation of the design outlined
in this chapter, building upon the principles and requirements described
and creating a concrete system for the purposes of evaluating the proposed
improvements to physiological monitoring.
Chapter 5
Implementation
5.1 Overview
The primary aim of this dissertation is to provide improvements to phys-
iological monitoring by developing techniques to monitor, transform and
present physiological data in mobile environments. Chapter 4 argued that
an implementation suited to these environments should implement a num-
ber of requirements related to these aims, listed in Section 4.2. To evaluate
the design with regards to these requirements, this chapter presents an im-
plementation that can be used for evaluation purposes. There are a number
of tasks involved with the implementation of the system proposed in this
paper, covering a range of areas from network architecture to task distribu-
tion and resource allocation. Each item represents a key component of the
system that has been developed as part of a functional implementation.
Section 5.2 provides specific implementation details of the system, in-
cluding compatible software platforms and interface details. Section 5.3
presents detailed implementation information for each role-based applica-
tion. Section 5.4 describes the basic process through which work is allo-
56
CHAPTER 5. IMPLEMENTATION 57
cated to processing resources, and highlights potential issues with resource
allocation. Section 5.5 illustrates the manner in which processing tasks are
distributed amongst processing resources.
Section 5.6 defines the process through which physiological data com-
pression can be implemented, if desired. Common issues with signal trans-
mission size are discussed, with available solutions included in this section.
Section 5.7 depicts the flexibility of configuration available with the system
by defining configuration file formats for the various role applications. Typ-
ical decisions made by users during deployment are discussed, and options
that are user-extensible are highlighted. Finally, Section 5.8 summarises the
chapter.
5.2 Implementation Details
To ensure ease of use and cross-platform compatibility, the framework is
developed as a series of applications, divided by role. The resulting software
should execute on any cloud platform (such as Amazon EC2 (Amazon Web
Services, 2006) or Google App Engine (Google, 2008b)), PC-compatible
system or Android (Google, 2008a) smart-phone, allowing a broad range of
devices to be deployed to support the operation of the system.
Connections to the physiological monitoring and processing system will
be made to servers through a RESTful (Fielding, 2007) web API, allowing
connections by any software that implements the correct interface. Moni-
toring devices also register users, streams and transmit data using this API,
which then serves data and transformation requests by external clients.
To provide an extensible platform with which to monitor and process
physiological data, each role within the system is easily configurable. The
applications that fit into the roles specified in design are as follows.
CHAPTER 5. IMPLEMENTATION 58
5.3 Role Applications
5.3.1 Supervisor
The supervisor is implemented as a standalone Python (Python Software
Foundation, 1990) script, with the majority of its functionality revolving
around the RESTful interface it presents to clients. It takes advantage
of the XML message syntax specified in Chapter 4 to serve user requests
and stores monitoring data using a database engine. For configurability
and accuracy’s sake, the Mako (Bayer, 2012) templating engine is used to
generate XML messages.
Data received from monitoring agents (as well as the supervisor’s own
internal metadata) can be stored using any storage engine supported by
SQLAlchemy (Bayer, 2008). SQLAlchemy provides a layer of abstraction
above the database, and allows users to easily change the storage engine
to suit. While the default SQLite (Hipp & KENNEDY, 2007) file-based
database engine can provide for lightweight scenarios and small tests, it
can run into concurrency issues with higher volumes of transactions. In
this instance, it is beneficial to switch to a more concurrent engine, such as
PostgreSQL (PostgreSQL, 1996) or MySQL (Oracle Corporation, 2012).
To provide a high-performance interface to clients, CherryPy (CherryPy,
2001) is used to serve user requests. This has the advantage of providing a
thread-pooled server, allowing more than one user request to be processed
concurrently - an important consideration, with the potential amount of
data being received.
The supervisor script has been tested and executes successfully on desk-
top PCs (using Python 2.6 and 2.7), all Cloud computing resources (us-
ing both Unix-like operating systems and Microsoft Windows) and several
CHAPTER 5. IMPLEMENTATION 59
mobile devices running the Android mobile operating system (using SL4A
(SL4A, 2010) with Python 2.6). It is recommended that Android devices
use the SQLite engine, while any supervisor using a PC (such as a laptop)
can use any other supported database management system.
5.3.2 Manager
Similarly to the supervisor, the manager script is written using Python,
CherryPy and the Mako templating engine. The majority of the manager’s
functionality resides around communications with the supervisor and distri-
bution of transformation processing to available processor nodes.
To distribute the transformation processing, ParallelPython (Vanovschi,
2005) has been utilised with modifications. Load balancing and task distri-
bution has been modified for the purposes of evaluation, and to distinguish
the difference in availability of local vs Cloud Computing resources.
The manager is not a particularly resource-heavy application; as such, it
is possible to execute it on a device already being used in another role. This is
only recommended for use in small-scale scenarios, and placing the manager
on the same device as the supervisor may result in impeded performance.
Like the supervisor, the manager script has been tested and executes
successfully on desktop PCs using Python 2.6 and 2.7, all Cloud Computing
resources using both Unix-like operating systems and Microsoft Windows
and several Android devices using SL4A with Python 2.6.
5.3.3 Monitor
The monitoring agent is written in Python, with the primary aim of config-
urability and extensibility. The default agent uses a simple configuration file
to initialise connections to servers, such as the supervisor, and to configure
CHAPTER 5. IMPLEMENTATION 60
outgoing data streams.
As the configuration file is a Python script itself, the monitor should be
able to port data from any monitoring device into a format appropriate for
transmission to the supervisor, including Bluetooth and serial connections,
assuming appropriate connectivity is available.
The monitor script itself is fully multi-threaded, providing the ability
to collect and transmit data from many sources at once. This allows the
monitor to transmit device state information along with physiological data,
providing the supervisor with useful data on battery and load levels. Data
collation and transmission rate is configurable, and monitor collection rate
is configurable on a per-device basis.
Monitoring devices themselves can be used as low-power transmitters,
or paired with the processing script to become mobile transformation pro-
cessors - particularly useful in mobile scenarios.
The monitor script has been tested and executes successfully on desktop
PCs using Python 2.6 and 2.7, all Cloud computing resources using both
Unix-like operating systems and Microsoft Windows and several Android
devices using SL4A with Python 2.6. Individual external monitoring device
configuration does need to be manually written, and any device-specific
monitoring, such as battery and processor load, may need to be modified to
suit the platform.
5.3.4 Processor
The processor is a relatively simple script used as part of the ParallelPython
(Vanovschi, 2005) distributed processing library, written in Python. As
such, it runs on similar platforms to all other scripts. This is beneficial,
as it means that any device we choose to use for testing can be used as a
CHAPTER 5. IMPLEMENTATION 61
processing agent, and initialising Cloud Computing resources for processing
is as simple as executing a single script.
5.4 Resource Allocation
Determining the quantity of work to allocate to a single node can be a
difficult task, as nodes are often reliant on more than a single resource. There
is a variety of models able to manage resource allocation, from auction-
based approaches (Gomoluch & Schroeder, 2003) to process scheduling in
high-performance computing (Lee et al., 2009). Techniques used within
these models can be adapted to provide resource allocation in the proposed
system, which similarly consists of a group of heterogeneous devices with
varying resources levels.
In order to balance workload across a group, individual nodes can re-
port their current state to the supervisor in an identical format to normal
physiological data. The node registers a stream containing a particular state
variable to the supervisor, which in turn passes the data to the manager,
which makes decisions about work allocation. By default, the system allo-
cates work to processors immediately after they become available, in order
to maintain a high level of responsiveness.
5.5 Transformation Distribution
Distribution of transformations is relatively simple, with requests being sent
in simple XML. Likewise, data to be processed by transformations can
be sent using XML or taken from existing supervisor storage. All post-
transformation data is available externally by sending specific requests in
XML format to the supervisor’s RESTful (Fielding, 2007) API.
CHAPTER 5. IMPLEMENTATION 62
In a normal usage scenario, a monitor should register with the user-
specified supervisor. After receiving authentication tokens, the monitor
should then register data-streams with the supervisor containing physio-
logical data, as well as device state. Any desired transformations should be
specified at this point to the supervisor, which will delegate the manager to
distribute work as appropriate amongst processors or other resources. All
transformed data is then sent upstream to the supervisor, though requests
for raw data may still be made via the XML interface. Finally, any ag-
gregated information required externally by the end-user may be requested
from the controller.
5.6 Data Compression
Certain physiological monitors can produce large volumes of data in short
time periods, particularly high-resolution electrocardiograph, photoplethys-
mograph and electroencephalograph monitors. The signal data produced by
these monitors with extremely high sample rates can occupy disk space run-
ning into the gigabytes, which is generally inappropriate for mobile devices
that typically average between 8-64gb of disk space. While many wearable
sensors provide data in digital form, this can still be an unrealistic amount
of data to store on mobile devices and transmit wirelessly.
Due to the configurable nature of the system, compression (as detailed
in Section 2.3) can occur as part of the normal interfacing process between
the sensor and Monitor. By default, no compression is performed - for the
majority of cases, the standard digital data stream suffices and can easily
be transmitted over wireless. However, the option for compression or other
techniques remains for cases that do require extra effort to operate on mobile
devices. Addition of compression to the Monitor requires minimal addition
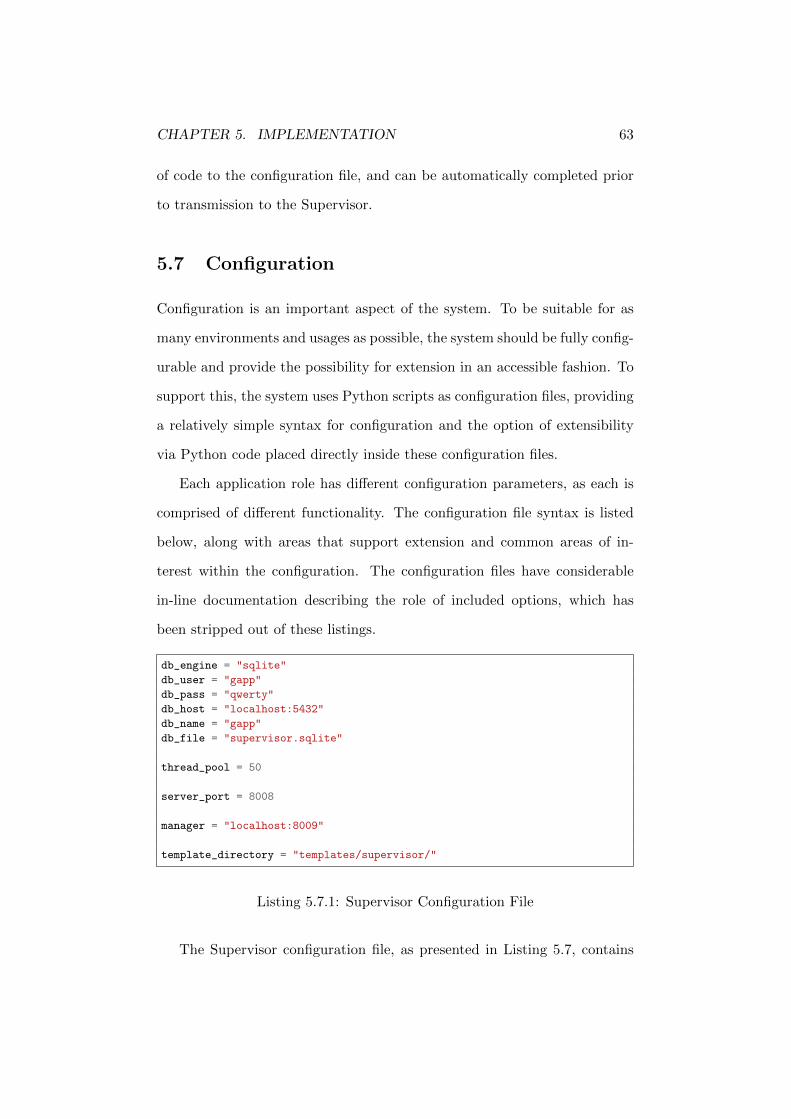
CHAPTER 5. IMPLEMENTATION 63
of code to the configuration file, and can be automatically completed prior
to transmission to the Supervisor.
5.7 Configuration
Configuration is an important aspect of the system. To be suitable for as
many environments and usages as possible, the system should be fully config-
urable and provide the possibility for extension in an accessible fashion. To
support this, the system uses Python scripts as configuration files, providing
a relatively simple syntax for configuration and the option of extensibility
via Python code placed directly inside these configuration files.
Each application role has different configuration parameters, as each is
comprised of different functionality. The configuration file syntax is listed
below, along with areas that support extension and common areas of in-
terest within the configuration. The configuration files have considerable
in-line documentation describing the role of included options, which has
been stripped out of these listings.
db_engine = "sqlite"
db_user = "gapp"
db_pass = "qwerty"
db_host = "localhost:5432"
db_name = "gapp"
db_file = "supervisor.sqlite"
thread_pool = 50
server_port = 8008
manager = "localhost:8009"
template_directory = "templates/supervisor/"
Listing 5.7.1: Supervisor Configuration File
The Supervisor configuration file, as presented in Listing 5.7, contains
CHAPTER 5. IMPLEMENTATION 64
considerably more configuration than the other roles. This is primarily due
to its intended functionality, as it has considerably more responsibility than
the other roles. This is reflected in the need to configure the location of other
servers and methods of data storage. The available configuration options are
listed below.
db engine The storage engine to be used by the Supervisor, any database
management system supported by SQLAlchemy (Bayer, 2008) ie. sqlite,
mysql, mssql, etc.
db user / db pass The username and password used to connect to the
database server, assuming it supports authentication
db host The network address of the database server - can be localhost (ie.
the current device), a local network address or an internet address
db name The name of the database stored in the database management
system to use for data storage and retrieval
db file The direct filepath of the database file - used primarily for SQLite,
which stores data directly into a file
thread pool The maximum number of threads allowed in the thread pool
for the web server. This is used by CherryPy to handle connections to
Monitors, the Manager and any clients accessing data. Setting this too
low can result in request choking (where incoming requests outnumber
completed requests, causing pauses in execution), but setting it too
high can result in other slowdowns
server port The port used to access the web interface. This value is used
by Monitors and clients requesting transformations - for a port of 8008,
the server’s accessible URL would be http://address:8008/
manager Address of the Manager. The supervisor uses this address to pass
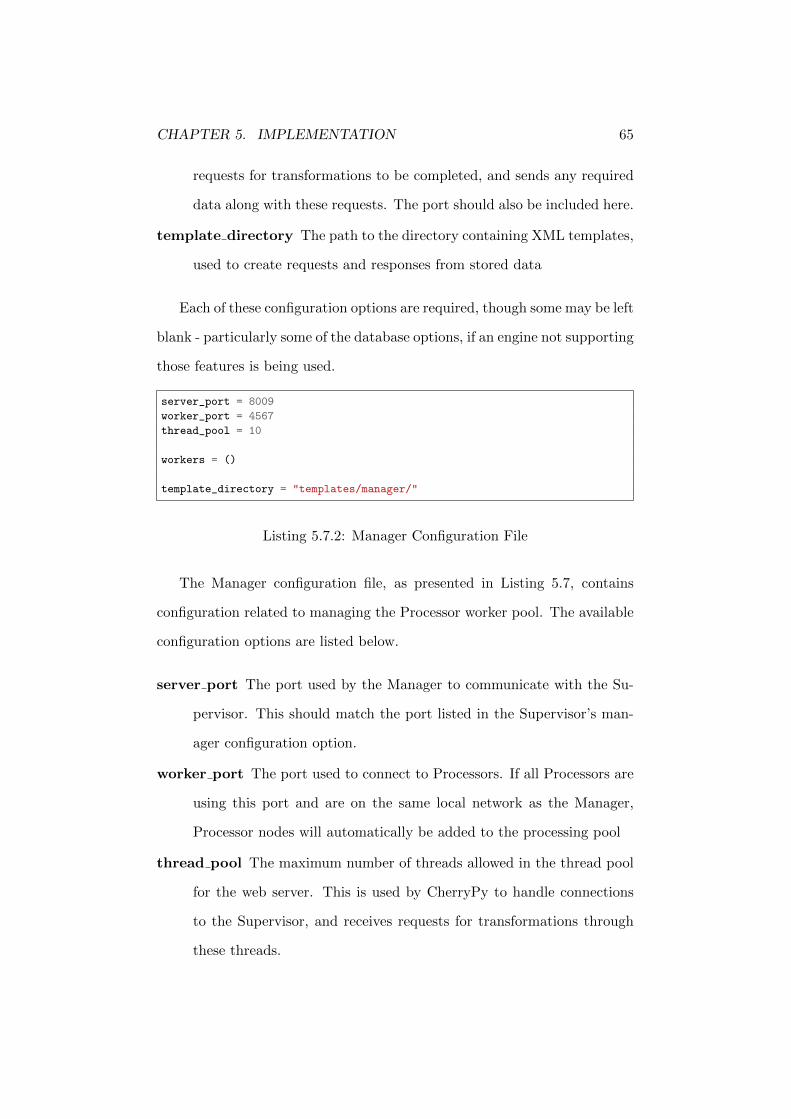
CHAPTER 5. IMPLEMENTATION 65
requests for transformations to be completed, and sends any required
data along with these requests. The port should also be included here.
template directory The path to the directory containing XML templates,
used to create requests and responses from stored data
Each of these configuration options are required, though some may be left
blank - particularly some of the database options, if an engine not supporting
those features is being used.
server_port = 8009
worker_port = 4567
thread_pool = 10
workers = ()
template_directory = "templates/manager/"
Listing 5.7.2: Manager Configuration File
The Manager configuration file, as presented in Listing 5.7, contains
configuration related to managing the Processor worker pool. The available
configuration options are listed below.
server port The port used by the Manager to communicate with the Su-
pervisor. This should match the port listed in the Supervisor’s man-
ager configuration option.
worker port The port used to connect to Processors. If all Processors are
using this port and are on the same local network as the Manager,
Processor nodes will automatically be added to the processing pool
thread pool The maximum number of threads allowed in the thread pool
for the web server. This is used by CherryPy to handle connections
to the Supervisor, and receives requests for transformations through
these threads.
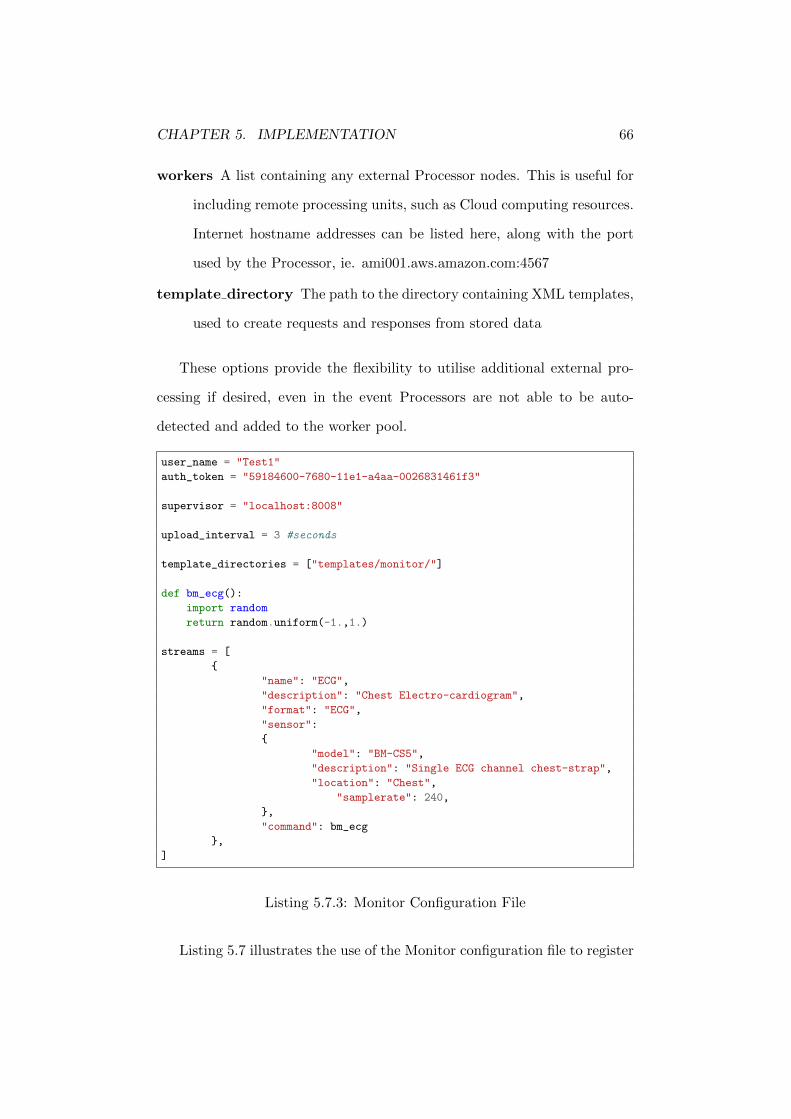
CHAPTER 5. IMPLEMENTATION 66
workers A list containing any external Processor nodes. This is useful for
including remote processing units, such as Cloud computing resources.
Internet hostname addresses can be listed here, along with the port
used by the Processor, ie. ami001.aws.amazon.com:4567
template directory The path to the directory containing XML templates,
used to create requests and responses from stored data
These options provide the flexibility to utilise additional external pro-
cessing if desired, even in the event Processors are not able to be auto-
detected and added to the worker pool.
user_name = "Test1"
auth_token = "59184600-7680-11e1-a4aa-0026831461f3"
supervisor = "localhost:8008"
upload_interval = 3 #seconds
template_directories = ["templates/monitor/"]
def bm_ecg():
import random
return random.uniform(-1.,1.)
streams = [
{
"name": "ECG",
"description": "Chest Electro-cardiogram",
"format": "ECG",
"sensor":
{
"model": "BM-CS5",
"description": "Single ECG channel chest-strap",
"location": "Chest",
"samplerate": 240,
},
"command": bm_ecg
},
]
Listing 5.7.3: Monitor Configuration File
Listing 5.7 illustrates the use of the Monitor configuration file to register
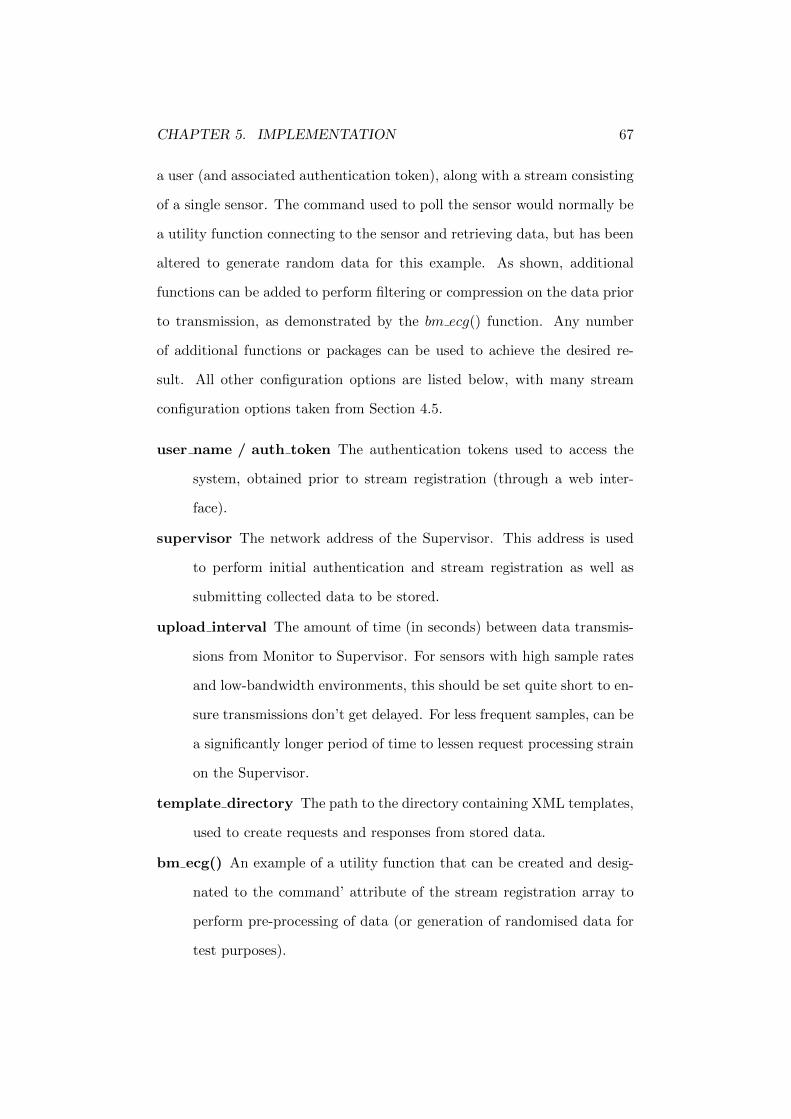
CHAPTER 5. IMPLEMENTATION 67
a user (and associated authentication token), along with a stream consisting
of a single sensor. The command used to poll the sensor would normally be
a utility function connecting to the sensor and retrieving data, but has been
altered to generate random data for this example. As shown, additional
functions can be added to perform filtering or compression on the data prior
to transmission, as demonstrated by the bm ecg() function. Any number
of additional functions or packages can be used to achieve the desired re-
sult. All other configuration options are listed below, with many stream
configuration options taken from Section 4.5.
user name / auth token The authentication tokens used to access the
system, obtained prior to stream registration (through a web inter-
face).
supervisor The network address of the Supervisor. This address is used
to perform initial authentication and stream registration as well as
submitting collected data to be stored.
upload interval The amount of time (in seconds) between data transmis-
sions from Monitor to Supervisor. For sensors with high sample rates
and low-bandwidth environments, this should be set quite short to en-
sure transmissions don’t get delayed. For less frequent samples, can be
a significantly longer period of time to lessen request processing strain
on the Supervisor.
template directory The path to the directory containing XML templates,
used to create requests and responses from stored data.
bm ecg() An example of a utility function that can be created and desig-
nated to the command’ attribute of the stream registration array to
perform pre-processing of data (or generation of randomised data for
test purposes).
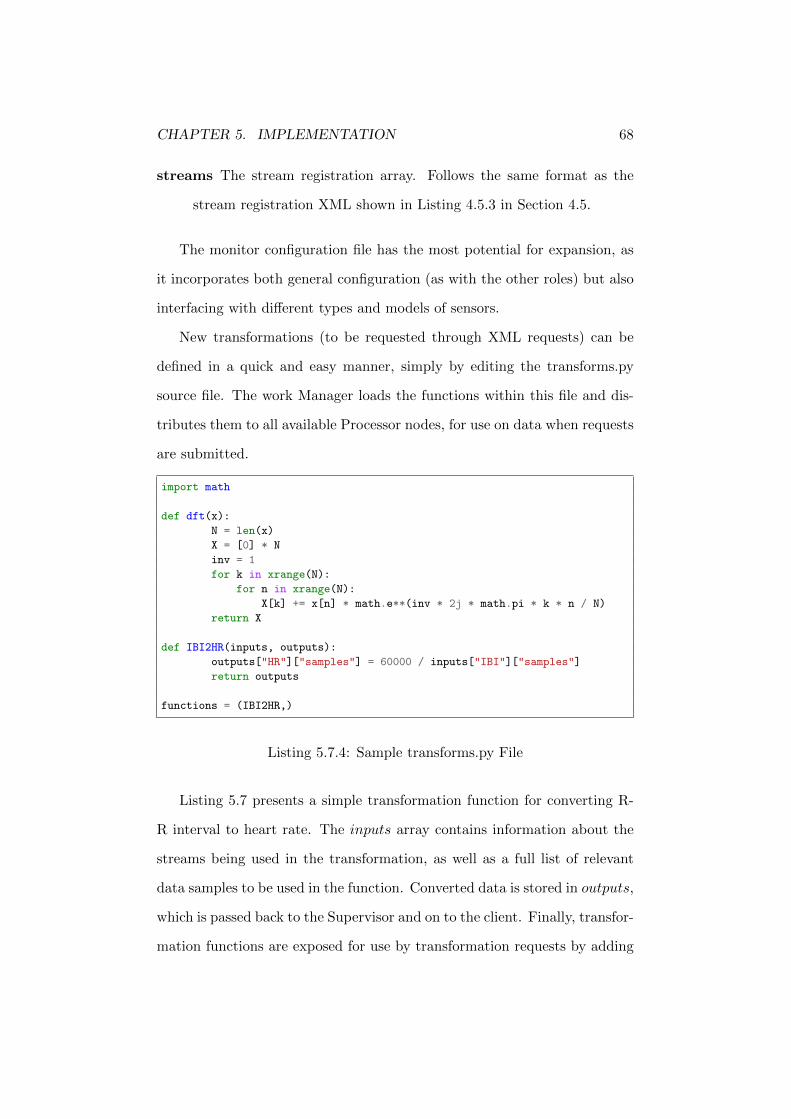
CHAPTER 5. IMPLEMENTATION 68
streams The stream registration array. Follows the same format as the
stream registration XML shown in Listing 4.5.3 in Section 4.5.
The monitor configuration file has the most potential for expansion, as
it incorporates both general configuration (as with the other roles) but also
interfacing with different types and models of sensors.
New transformations (to be requested through XML requests) can be
defined in a quick and easy manner, simply by editing the transforms.py
source file. The work Manager loads the functions within this file and dis-
tributes them to all available Processor nodes, for use on data when requests
are submitted.
import math
def dft(x):
N = len(x)
X = [0] * N
inv = 1
for k in xrange(N):
for n in xrange(N):
X[k] += x[n] * math.e**(inv * 2j * math.pi * k * n / N)
return X
def IBI2HR(inputs, outputs):
outputs["HR"]["samples"] = 60000 / inputs["IBI"]["samples"]
return outputs
functions = (IBI2HR,)
Listing 5.7.4: Sample transforms.py File
Listing 5.7 presents a simple transformation function for converting R-
R interval to heart rate. The inputs array contains information about the
streams being used in the transformation, as well as a full list of relevant
data samples to be used in the function. Converted data is stored in outputs,
which is passed back to the Supervisor and on to the client. Finally, transfor-
mation functions are exposed for use by transformation requests by adding
CHAPTER 5. IMPLEMENTATION 69
them to the functions list.
Other packages can be used within this file simply by importing them
as usual, and normal utility functions (such as the dft() example shown in
Listing 5.7) can be used as intermediate steps within transformation func-
tions.
5.8 Summary
This chapter presented an implementation of the platform designed in Chap-
ter 4, for use in evaluating the requirements listed in Section 4.2. Key im-
plementation details and decisions were presented in Section 5.2, and the
development of each Role-based application was described in Section 5.3.
Techniques for performing resource allocation were presented in Sec-
tion 5.4, and methods used for distributing physiological transformations
were highlighted in Section 5.5. Issues concerning physiological data com-
pression and storage were discussed in Section 5.6. System configuration
options were presented in detail in Section 5.7, as the majority of the flexi-
bility of the system is provided through configuration interfaces.
This chapter provided insight into an example implementation based
on requirements and interfaces described in Section 4.2. Each section ar-
gued for specific implementation options with due consideration given to the
initial aims of this dissertation, emphasising flexibility and mobility. The
implementation can be entirely run on common mobile devices, allowing the
system to be used in a wide range of environments, including those without
reliable connections to ubiquitous communications networks or fixed power
supplies.
The implementation described in this chapter provides a platform upon
which to evaluate the feasibility of the original aims of this dissertation.

CHAPTER 5. IMPLEMENTATION 70
The following chapter presents an evaluation of both the viability of the
original aims, as well as determining the adherence of this platform to the
requirements defined in Section 4.2.
Chapter 6
Evaluation
6.1 Overview
This chapter presents an evaluation of the distributed physiological mon-
itoring and processing system designed in Chapter 4 and implemented in
Chapter 5. Its aims are to show that the practice of distributing physio-
logical transformation processing across multiple mobile devices is a feasible
alternative to traditional processing models.
In order to evaluate contributions made by this dissertation to physi-
ological monitoring, several considerations must be made when analysing
the proposed system. The system has the potential to fulfill predetermined
requirements (previously listed in Section 4.2) so as to provide benefit to
intended usage environments as well as providing a generic platform upon
which any physiological monitoring and processing may be performed.
The remainder of this chapter is structured as follows. Section 6.2
presents an evaluation of the proposed system in a quantitative fashion, as-
sessing usability, responsiveness and scalability in a number of experiments.
Section 6.3 discusses system functionality and design in relation to the ini-
71
CHAPTER 6. EVALUATION 72
tial aims of this dissertation, as well as the system requirements outlined
in Section 4.2. Finally, Section 6.4 concludes with a summary of evaluation
results and implementation details.
6.2 Experimental Evaluation
6.2.1 Overview
This section uses the requirements defined in Section 4.2 as a basis for quan-
titatively evaluating the system implementation discussed in Chapter 5. The
suitability of the system in particular situations is evaluated, primarily using
performance (or system responsiveness) as a comparative metric. Latency
is also evaluated as an additional factor that can inhibit performance, based
on the architectural and physical location of processing resources.
Performance of the system is heavily related to the processing power of
the devices upon which it is implemented. Section 6.2.2 presents the list of
devices used to evaluate the system, including mobile devices, workstations
and Cloud computing resources.
Section 6.2.3 evaluates implementation performance across a series of dif-
ferent architectures, including multiple mobile devices, a mix of mobile/local
and mobile/Cloud. Implementation responsiveness is a good indicator of the
system’s ability to perform transformations in a timely fashion, providing
insight into performance during real-world scenarios.
Section 6.2.4 evaluates several database management systems for use
with the system. Scalability is an important component of the original
aims, and concurrency plays a large role in system performance. Database
engines have varying levels of concurrent responsiveness, so evaluation of
engines in certain scenarios can divulge bottlenecks in operation that would
CHAPTER 6. EVALUATION 73
not otherwise be apparent.
Section 6.2.5 evaluates the effect of latency on the system. As processing
resources can be located in physically distant areas from the system deploy-
ment, time spent on transmissions to and from processing resources can add
significant time to processing. Evaluating latency can highlight situations
in which mobile resources are even more desirable than Cloud computing
resources, due to additional communication time.
Finally, Section 6.2.6 summarises findings from this section.
6.2.2 Experiment Setup
For the purposes of evaluating the presented approaches to distributing phys-
iological transformations across a cluster of mobile devices, workstations and
Cloud computing resources, the following equipment is used.
Peer-level (Mobile)
• HTC One X (Smartphone)
– Processor: Quad-core 1.5ghz Tegra 3
– Battery Capacity: 1800 mAh
– Operating System: Android 4.0.3
– Notable Software: SL4A (SL4A, 2010), Python 2.6.2 (Python
Software Foundation, 1990)
• HTC Desire (Smartphone)
– Processor: Single-core 1ghz Snapdragon
– Battery Capacity: 1400 mAh
– Operating System: Android 4.0.5
– Notable Software: SL4A, Python 2.6.2
CHAPTER 6. EVALUATION 74
• Acer Iconia A500 (Tablet)
– Processor: Dual-core 1ghz Tegra 2
– Battery Capacity: 3260 mAh
– Operating System: Android 4.0.5
– Notable Software: SL4A, Python 2.6.2
Local Resources
• Workstation
– Processor: Quad-core 3.3ghz Intel i5-2500K
– Operating System: Microsoft Windows 8
– Notable Software: Python 2.7.3
Cloud Computing resources
• Amazon EC2
– Instance: High-CPU Medium
– Operating System: Amazon Linux AMI
– Notable Software: Python 2.7.3
To evaluate the effectiveness of the system in a typical usage scenario,
an appropriate amount of test data was generated to support the execu-
tion of three data transformations in a chain, as illustrated in Listing 6.2.2.
This transformation chain consists of three steps. It performs a Discrete
Fourier Transform upon a randomly-generated sample of data typical of
Electrocardiogram output, then takes resulting data and performs some ba-
sic arithmetic upon the output of approximate complexity to transforming
R-R interval to heart rate. It then combines results from the previous two
transformations to evaluate the processing and transmission of sizable data
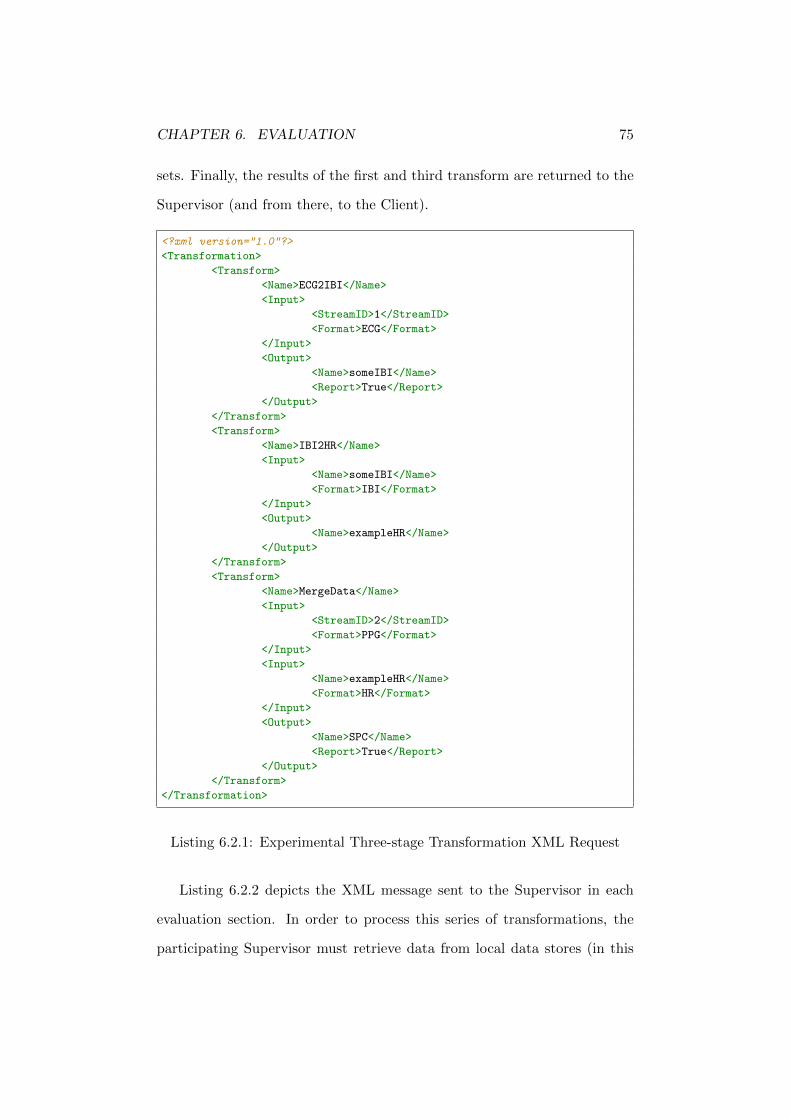
CHAPTER 6. EVALUATION 75
sets. Finally, the results of the first and third transform are returned to the
Supervisor (and from there, to the Client).
<?xml version="1.0"?>
<Transformation>
<Transform>
<Name>ECG2IBI</Name>
<Input>
<StreamID>1</StreamID>
<Format>ECG</Format>
</Input>
<Output>
<Name>someIBI</Name>
<Report>True</Report>
</Output>
</Transform>
<Transform>
<Name>IBI2HR</Name>
<Input>
<Name>someIBI</Name>
<Format>IBI</Format>
</Input>
<Output>
<Name>exampleHR</Name>
</Output>
</Transform>
<Transform>
<Name>MergeData</Name>
<Input>
<StreamID>2</StreamID>
<Format>PPG</Format>
</Input>
<Input>
<Name>exampleHR</Name>
<Format>HR</Format>
</Input>
<Output>
<Name>SPC</Name>
<Report>True</Report>
</Output>
</Transform>
</Transformation>
Listing 6.2.1: Experimental Three-stage Transformation XML Request
Listing 6.2.2 depicts the XML message sent to the Supervisor in each
evaluation section. In order to process this series of transformations, the
participating Supervisor must retrieve data from local data stores (in this
CHAPTER 6. EVALUATION 76
instance, SQLite) and transmit details of the transformation along with
data to the Manager, which distributes tasks among participating devices.
Factors that can affect the outcome include: latency to processing resources,
available processing and connection bandwidth can all play a significant part
in processing speed.
6.2.3 Responsiveness
For the system to be considered useful in a wide range of potential usage
environments, it must respond to user requests as quickly as possible, a
term referred to as responsiveness. System responsiveness can be a key
consideration when attempting to retrieve data related to health, as lack
of responsiveness can have disastrous effects. Additionally, responsiveness
provides a useful metric to compare transformation processing capability of
a single device (as traditionally used) as opposed to a cluster of devices,
such as this dissertation proposes.
This test compares the performance of the physiological monitoring and
processing system on a single device (HTC Desire) compared to multiple
(Desire, One X), as well as utilising locally-available resources (Worksta-
tion), which would not typically be available in mobile environments. The
transformations used in the evaluation are as described in Section 6.2.2.
Figure 6.1 illustrates the advantage of utilising additional mobile re-
sources for processing. For this graph, requests were ordered by response
time, providing an easy comparison of scalability across the different types
of processing resources. In the graph, request time depicts the total time
to complete a single request. Request time represents the total time to
completion for each transformation request, which has a number of steps:
1. Transmission of the transformation request from Client to Supervisor
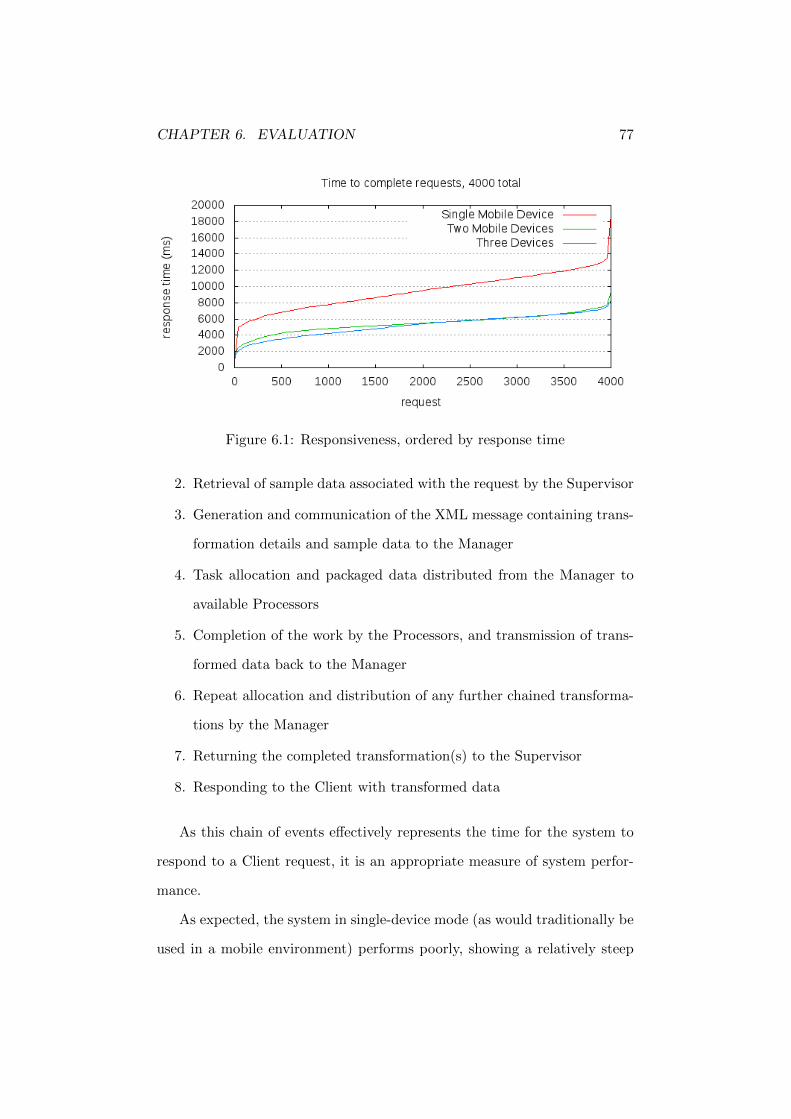
CHAPTER 6. EVALUATION 77
Figure 6.1: Responsiveness, ordered by response time
2. Retrieval of sample data associated with the request by the Supervisor
3. Generation and communication of the XML message containing trans-
formation details and sample data to the Manager
4. Task allocation and packaged data distributed from the Manager to
available Processors
5. Completion of the work by the Processors, and transmission of trans-
formed data back to the Manager
6. Repeat allocation and distribution of any further chained transforma-
tions by the Manager
7. Returning the completed transformation(s) to the Supervisor
8. Responding to the Client with transformed data
As this chain of events effectively represents the time for the system to
respond to a Client request, it is an appropriate measure of system perfor-
mance.
As expected, the system in single-device mode (as would traditionally be
used in a mobile environment) performs poorly, showing a relatively steep
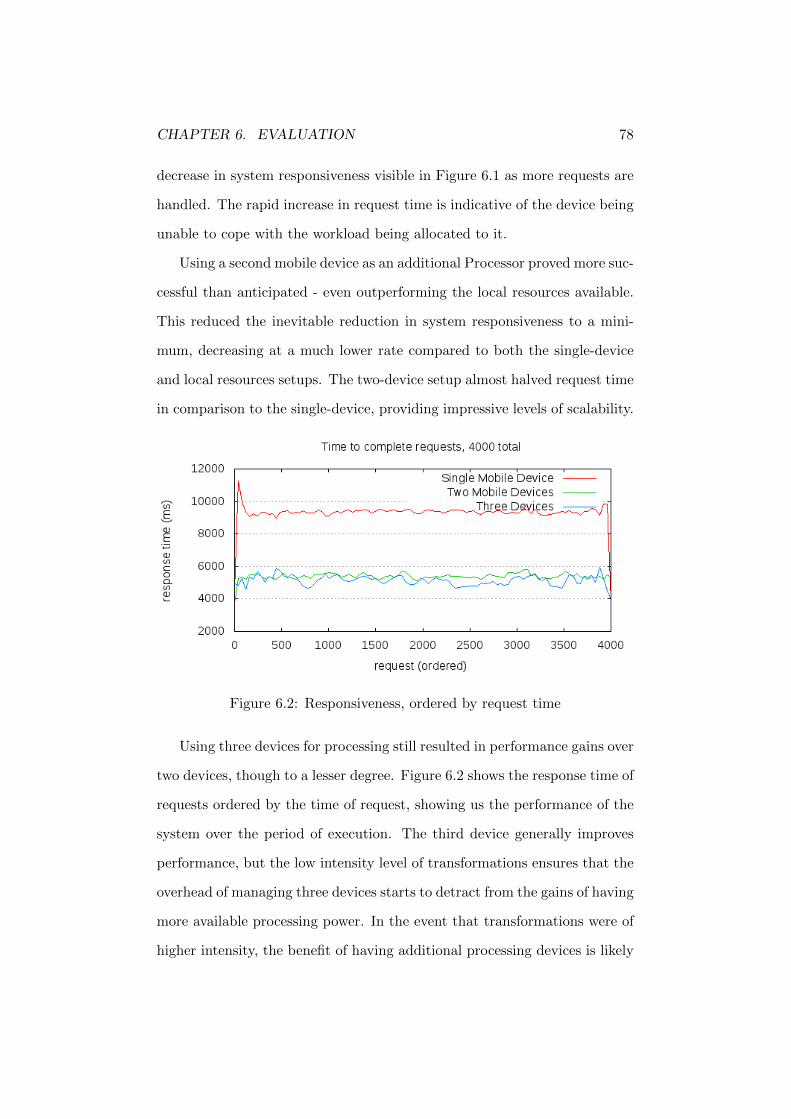
CHAPTER 6. EVALUATION 78
decrease in system responsiveness visible in Figure 6.1 as more requests are
handled. The rapid increase in request time is indicative of the device being
unable to cope with the workload being allocated to it.
Using a second mobile device as an additional Processor proved more suc-
cessful than anticipated - even outperforming the local resources available.
This reduced the inevitable reduction in system responsiveness to a mini-
mum, decreasing at a much lower rate compared to both the single-device
and local resources setups. The two-device setup almost halved request time
in comparison to the single-device, providing impressive levels of scalability.
Figure 6.2: Responsiveness, ordered by request time
Using three devices for processing still resulted in performance gains over
two devices, though to a lesser degree. Figure 6.2 shows the response time of
requests ordered by the time of request, showing us the performance of the
system over the period of execution. The third device generally improves
performance, but the low intensity level of transformations ensures that the
overhead of managing three devices starts to detract from the gains of having
more available processing power. In the event that transformations were of
higher intensity, the benefit of having additional processing devices is likely
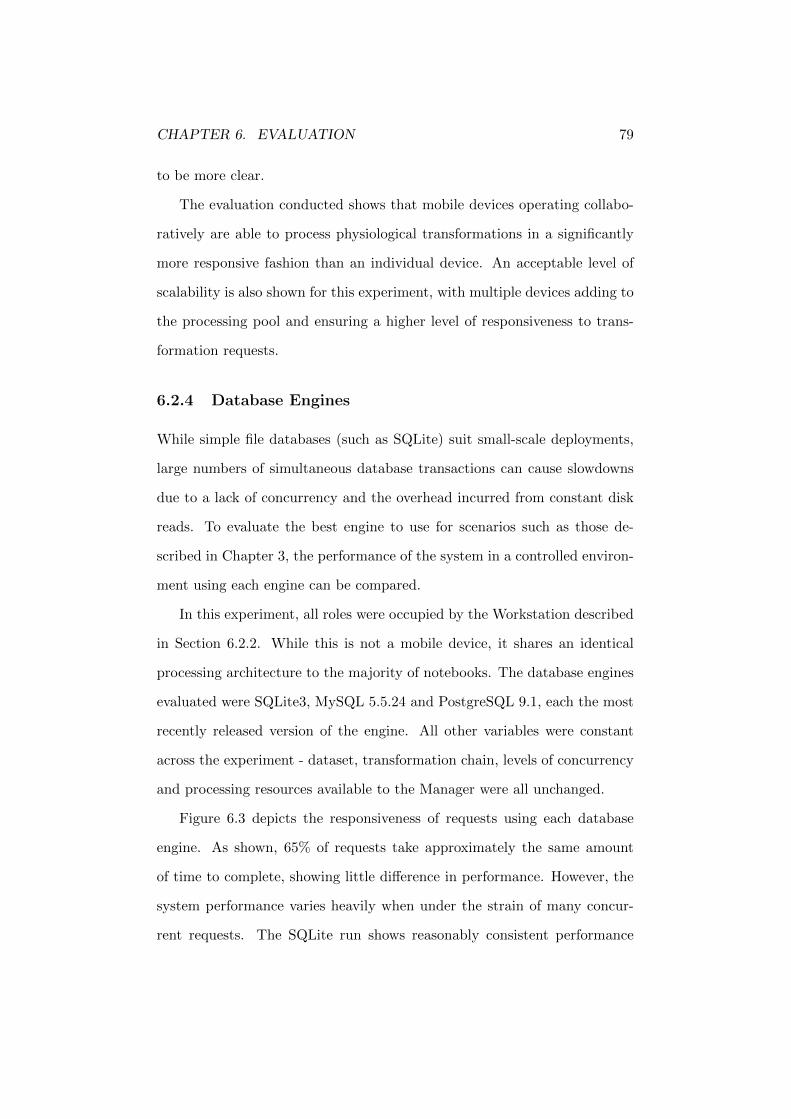
CHAPTER 6. EVALUATION 79
to be more clear.
The evaluation conducted shows that mobile devices operating collabo-
ratively are able to process physiological transformations in a significantly
more responsive fashion than an individual device. An acceptable level of
scalability is also shown for this experiment, with multiple devices adding to
the processing pool and ensuring a higher level of responsiveness to trans-
formation requests.
6.2.4 Database Engines
While simple file databases (such as SQLite) suit small-scale deployments,
large numbers of simultaneous database transactions can cause slowdowns
due to a lack of concurrency and the overhead incurred from constant disk
reads. To evaluate the best engine to use for scenarios such as those de-
scribed in Chapter 3, the performance of the system in a controlled environ-
ment using each engine can be compared.
In this experiment, all roles were occupied by the Workstation described
in Section 6.2.2. While this is not a mobile device, it shares an identical
processing architecture to the majority of notebooks. The database engines
evaluated were SQLite3, MySQL 5.5.24 and PostgreSQL 9.1, each the most
recently released version of the engine. All other variables were constant
across the experiment - dataset, transformation chain, levels of concurrency
and processing resources available to the Manager were all unchanged.
Figure 6.3 depicts the responsiveness of requests using each database
engine. As shown, 65% of requests take approximately the same amount
of time to complete, showing little difference in performance. However, the
system performance varies heavily when under the strain of many concur-
rent requests. The SQLite run shows reasonably consistent performance
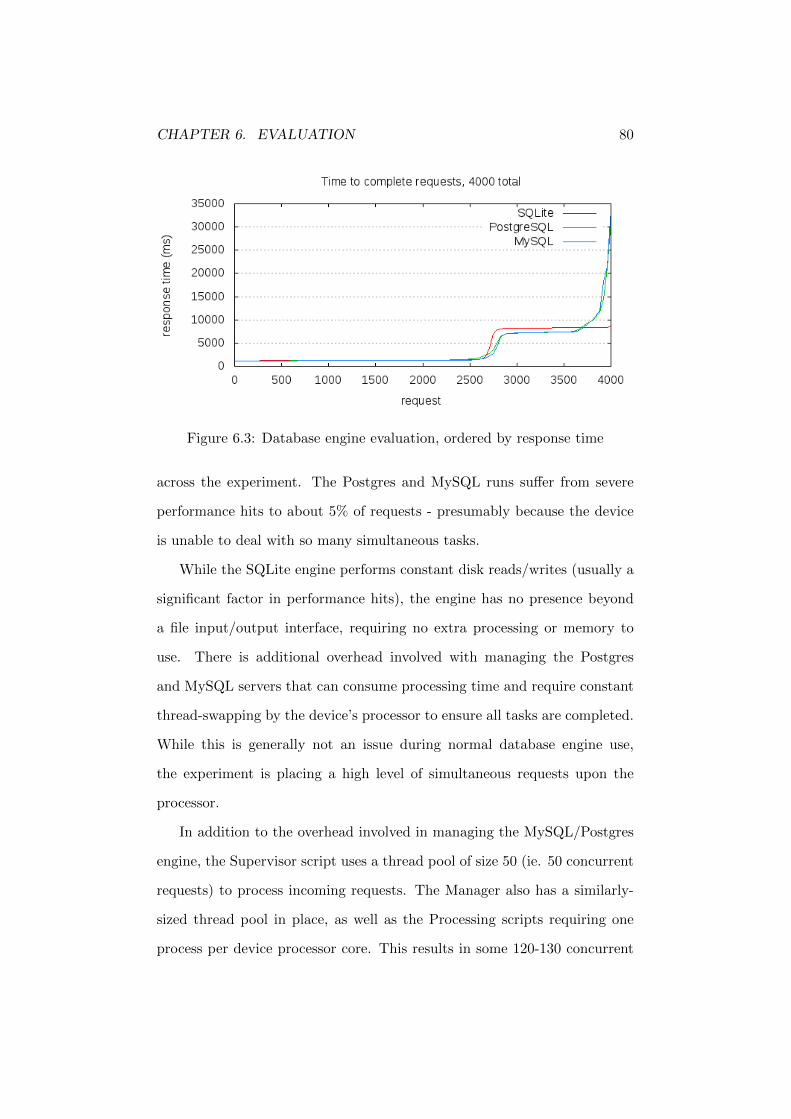
CHAPTER 6. EVALUATION 80
Figure 6.3: Database engine evaluation, ordered by response time
across the experiment. The Postgres and MySQL runs suffer from severe
performance hits to about 5% of requests - presumably because the device
is unable to deal with so many simultaneous tasks.
While the SQLite engine performs constant disk reads/writes (usually a
significant factor in performance hits), the engine has no presence beyond
a file input/output interface, requiring no extra processing or memory to
use. There is additional overhead involved with managing the Postgres
and MySQL servers that can consume processing time and require constant
thread-swapping by the device’s processor to ensure all tasks are completed.
While this is generally not an issue during normal database engine use,
the experiment is placing a high level of simultaneous requests upon the
processor.
In addition to the overhead involved in managing the MySQL/Postgres
engine, the Supervisor script uses a thread pool of size 50 (ie. 50 concurrent
requests) to process incoming requests. The Manager also has a similarly-
sized thread pool in place, as well as the Processing scripts requiring one
process per device processor core. This results in some 120-130 concurrent
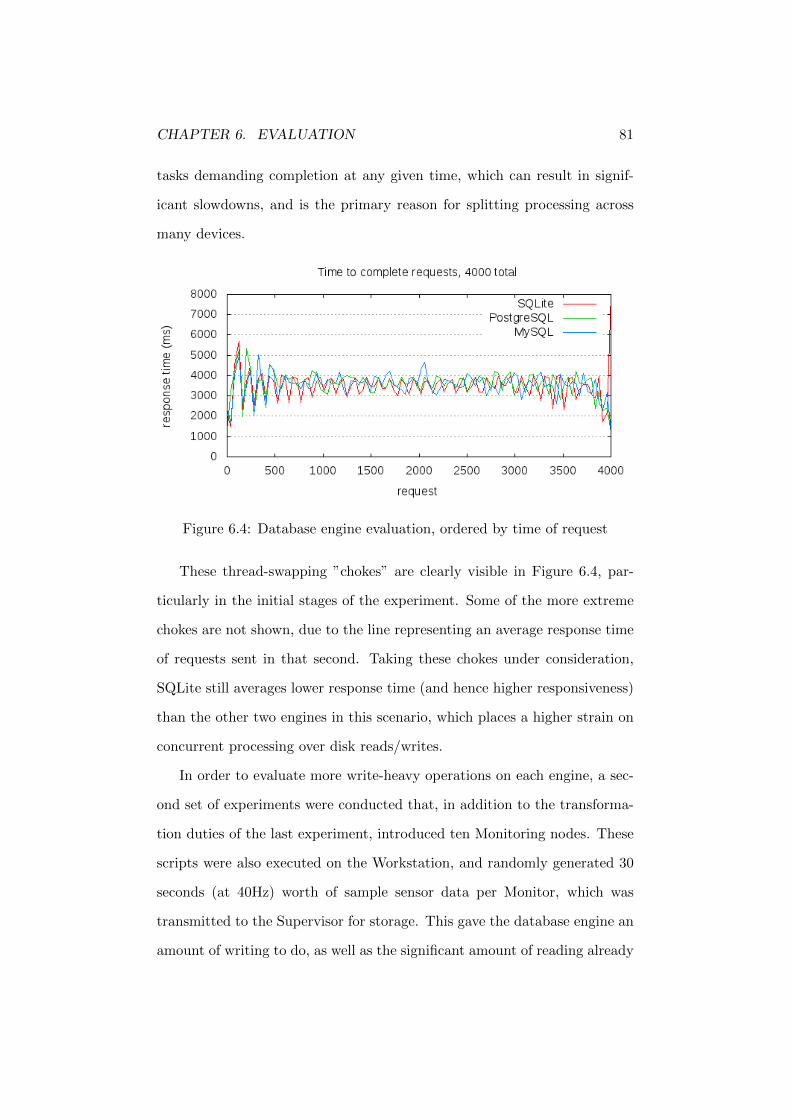
CHAPTER 6. EVALUATION 81
tasks demanding completion at any given time, which can result in signif-
icant slowdowns, and is the primary reason for splitting processing across
many devices.
Figure 6.4: Database engine evaluation, ordered by time of request
These thread-swapping ”chokes” are clearly visible in Figure 6.4, par-
ticularly in the initial stages of the experiment. Some of the more extreme
chokes are not shown, due to the line representing an average response time
of requests sent in that second. Taking these chokes under consideration,
SQLite still averages lower response time (and hence higher responsiveness)
than the other two engines in this scenario, which places a higher strain on
concurrent processing over disk reads/writes.
In order to evaluate more write-heavy operations on each engine, a sec-
ond set of experiments were conducted that, in addition to the transforma-
tion duties of the last experiment, introduced ten Monitoring nodes. These
scripts were also executed on the Workstation, and randomly generated 30
seconds (at 40Hz) worth of sample sensor data per Monitor, which was
transmitted to the Supervisor for storage. This gave the database engine an
amount of writing to do, as well as the significant amount of reading already
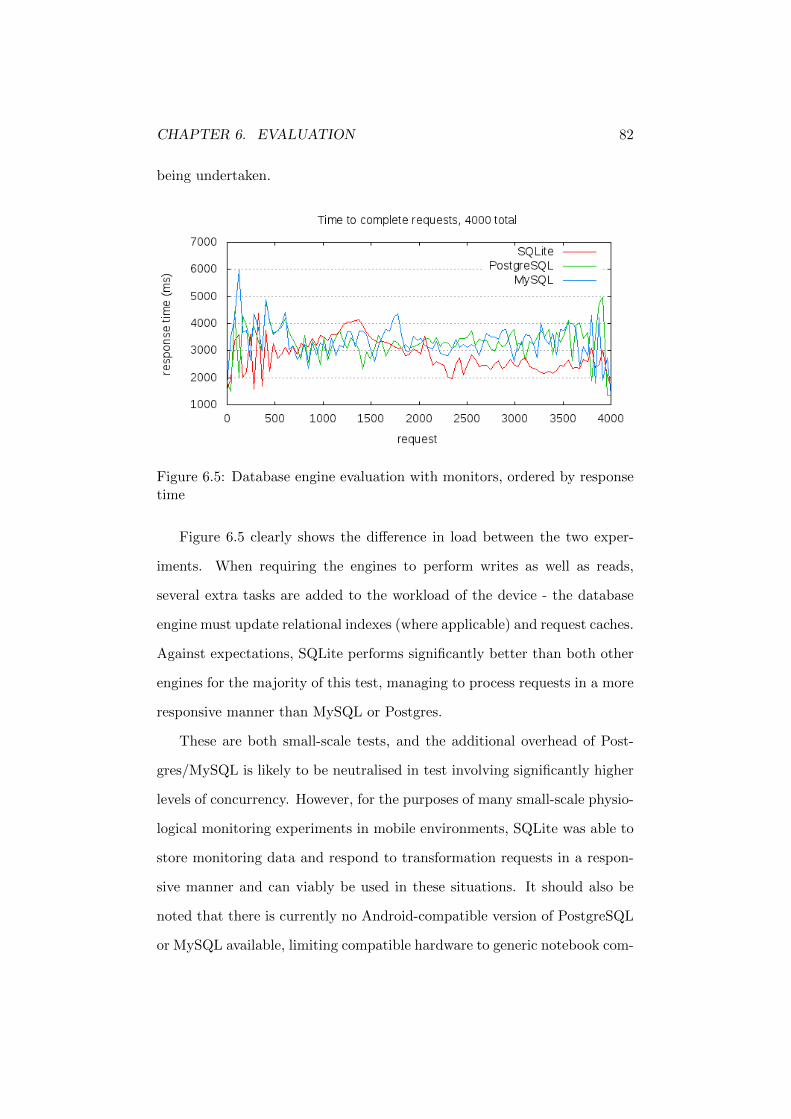
CHAPTER 6. EVALUATION 82
being undertaken.
Figure 6.5: Database engine evaluation with monitors, ordered by responsetime
Figure 6.5 clearly shows the difference in load between the two exper-
iments. When requiring the engines to perform writes as well as reads,
several extra tasks are added to the workload of the device - the database
engine must update relational indexes (where applicable) and request caches.
Against expectations, SQLite performs significantly better than both other
engines for the majority of this test, managing to process requests in a more
responsive manner than MySQL or Postgres.
These are both small-scale tests, and the additional overhead of Post-
gres/MySQL is likely to be neutralised in test involving significantly higher
levels of concurrency. However, for the purposes of many small-scale physio-
logical monitoring experiments in mobile environments, SQLite was able to
store monitoring data and respond to transformation requests in a respon-
sive manner and can viably be used in these situations. It should also be
noted that there is currently no Android-compatible version of PostgreSQL
or MySQL available, limiting compatible hardware to generic notebook com-
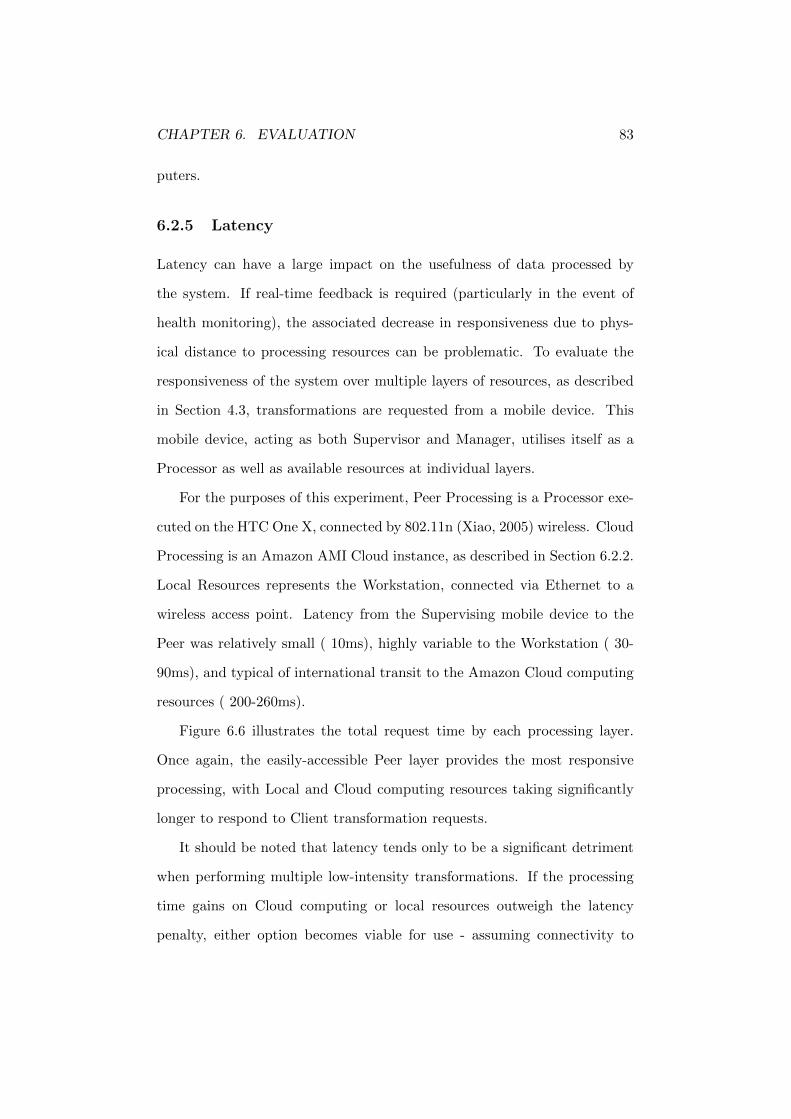
CHAPTER 6. EVALUATION 83
puters.
6.2.5 Latency
Latency can have a large impact on the usefulness of data processed by
the system. If real-time feedback is required (particularly in the event of
health monitoring), the associated decrease in responsiveness due to phys-
ical distance to processing resources can be problematic. To evaluate the
responsiveness of the system over multiple layers of resources, as described
in Section 4.3, transformations are requested from a mobile device. This
mobile device, acting as both Supervisor and Manager, utilises itself as a
Processor as well as available resources at individual layers.
For the purposes of this experiment, Peer Processing is a Processor exe-
cuted on the HTC One X, connected by 802.11n (Xiao, 2005) wireless. Cloud
Processing is an Amazon AMI Cloud instance, as described in Section 6.2.2.
Local Resources represents the Workstation, connected via Ethernet to a
wireless access point. Latency from the Supervising mobile device to the
Peer was relatively small ( 10ms), highly variable to the Workstation ( 30-
90ms), and typical of international transit to the Amazon Cloud computing
resources ( 200-260ms).
Figure 6.6 illustrates the total request time by each processing layer.
Once again, the easily-accessible Peer layer provides the most responsive
processing, with Local and Cloud computing resources taking significantly
longer to respond to Client transformation requests.
It should be noted that latency tends only to be a significant detriment
when performing multiple low-intensity transformations. If the processing
time gains on Cloud computing or local resources outweigh the latency
penalty, either option becomes viable for use - assuming connectivity to
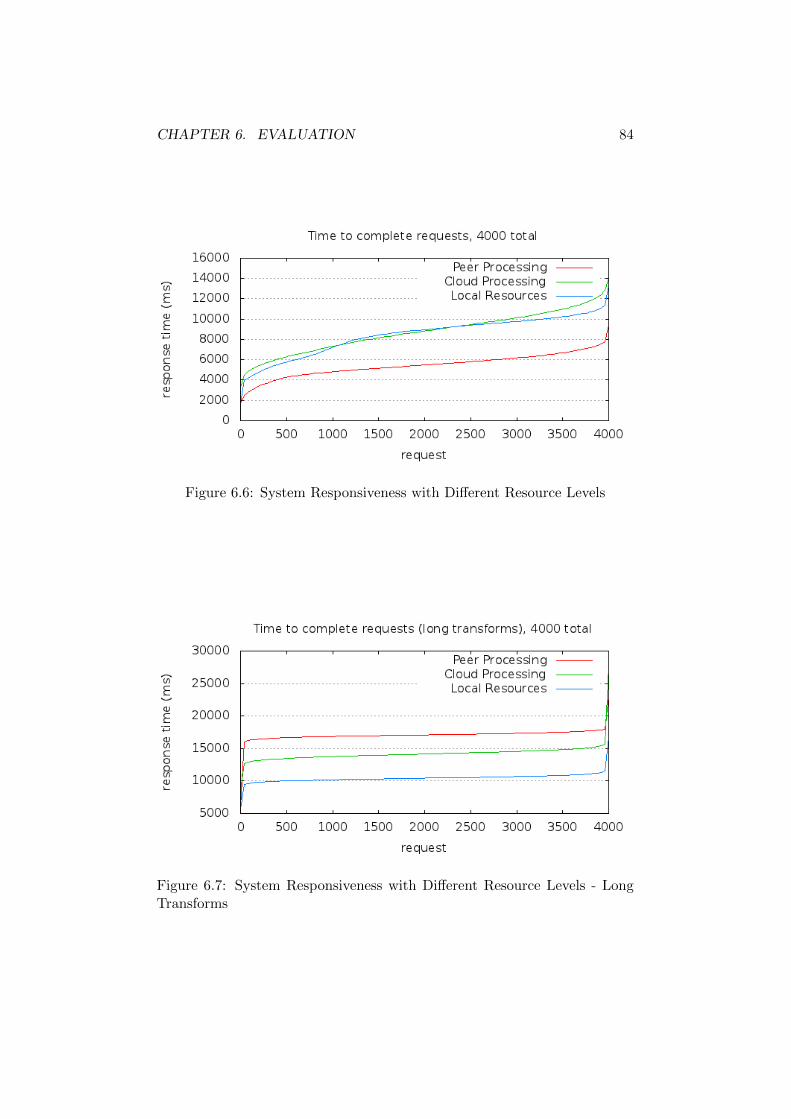
CHAPTER 6. EVALUATION 84
Figure 6.6: System Responsiveness with Different Resource Levels
Figure 6.7: System Responsiveness with Different Resource Levels - LongTransforms
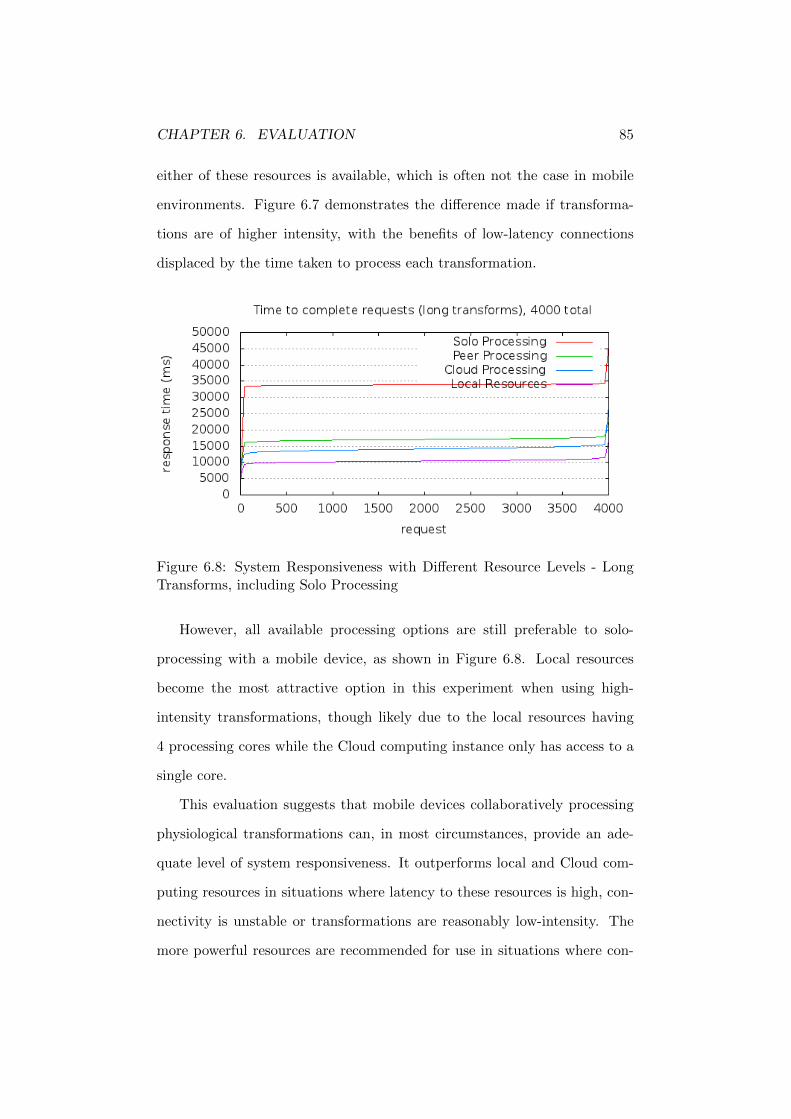
CHAPTER 6. EVALUATION 85
either of these resources is available, which is often not the case in mobile
environments. Figure 6.7 demonstrates the difference made if transforma-
tions are of higher intensity, with the benefits of low-latency connections
displaced by the time taken to process each transformation.
Figure 6.8: System Responsiveness with Different Resource Levels - LongTransforms, including Solo Processing
However, all available processing options are still preferable to solo-
processing with a mobile device, as shown in Figure 6.8. Local resources
become the most attractive option in this experiment when using high-
intensity transformations, though likely due to the local resources having
4 processing cores while the Cloud computing instance only has access to a
single core.
This evaluation suggests that mobile devices collaboratively processing
physiological transformations can, in most circumstances, provide an ade-
quate level of system responsiveness. It outperforms local and Cloud com-
puting resources in situations where latency to these resources is high, con-
nectivity is unstable or transformations are reasonably low-intensity. The
more powerful resources are recommended for use in situations where con-
CHAPTER 6. EVALUATION 86
nectivity is stable or transformations are high-intensity, and using these re-
sources has the additional benefit of reducing power consumption by the
monitoring devices. However, particularly low-intensity transformations
may consume less power to process on mobile devices than to transmit over
communications with high power consumption, such as 3G/4G (commonly
used mobile data networks).
6.2.6 Summary
This section has presented a quantitative evaluation of system performance
in a series of real-world example scenarios, using generated sample data and
realistic physiological transformation requests. These experiments evaluate
the performance of the system with regards to the system requirements listed
in Section 4.2.
Section 6.2.2 presented the environmental parameters used in the ex-
periments, including all hardware and software used. It also provided the
sample physiological transformation chain used in the following experiments,
defining a static set of experimental variables to ensure comparisons would
be valid.
Section 6.2.3 evaluated the performance of the system, by requesting
multiple concurrent transformations requests and recording the total time
each transformation took to complete. This experiment was to evaluate
the scalability of the system, and proved that the system is significantly
more responsive when using multiple processing devices over a single mobile
device. This provides a significant improvement over current techniques in
mobile environments, which are limited to either using a single device or
transmitting data for processing to external resources, which are not always
available and relies on a stable communications network.
CHAPTER 6. EVALUATION 87
Section 6.2.4 evaluated several different database engines for use with the
system, noting the total time it took for the system to respond to a transfor-
mation request. It showed that in hardware-restricted environments (such as
mobile environments), database engines considered to have higher levels of
concurrency (such as Postgres and MySQL) performed poorly in comparison
to SQLite, due to additional processing overhead associated with running
the database management system. This was the case even when supplying
the database engines with continuous data writes. This implies that for
most mobile environments, SQLite is an acceptable solution. In large-scale
deployments (thousands of monitoring devices), MySQL and Postgres are
likely still going to be preferable, due to the ability to scale those engines
over multiple devices, which SQLite cannot do.
Section 6.2.5 examined the effect of latency on transformation process-
ing, using three levels of processing resources (Peer, Local and Cloud, see
Section 4.3) and recording the time taken to process transformations. The
evaluation showed that for low-intensity transformations, Peer processing
was by far the preferred processing option, significantly outperforming both
Local and Cloud computing resources. However, when transformations re-
quired significantly more processing, Local and Cloud computing became
more attractive options due to their inherently higher processing capability.
This discounts the addition of more processing resources to the Peer level,
however, which would likely bring performance of the Peer processing cluster
to levels approaching that of Local and Cloud resources.
Overall, the system performed admirably in all tests and satisfied the
requirements specified in Section 4.2. The techniques implemented by the
system show the potential to provide significant improvements to current
physiological monitoring and processing practices in mobile environments.
CHAPTER 6. EVALUATION 88
This will allow advanced physiological transformations to be used in envi-
ronments that previously hindered its use, as there is less reliance on mobile
communications networks, fixed resources (and power supplies) and easier
implementation due to the ubiquity of mobile devices that the system can
run on.
6.3 Requirements Evaluation
6.3.1 Overview
This section presents an evaluation of the Distributed Physiological Moni-
toring and Processing System based on the requirements discussed in Sec-
tion 4.2. The requirements focus on the overall aims described in Section 1.4,
in order to provide a system that operates effectively in mobile environments.
Each requirement is discussed in relation to how the system meets it.
6.3.2 Usability
In order to be useful in for physiological monitoring in any environment, the
system must implement a basic set of functionality involving the collection,
transformation and presentation of physiological data (R1).
The system provides a configurable interface for connecting to physiolog-
ical monitors of any type, so long as an appropriate communications medium
between sensor and device exists. An example of configuration to connect a
sensor to the monitor is presented in Section 5.7. While this interface must
be manually configured for each model of sensor, the majority of monitoring
work is completed by core functionality of the monitor.
Due to the role-based architecture designed for the system and described
in Section 4.4, any number of monitoring and processing devices can be used
CHAPTER 6. EVALUATION 89
with the system. Along with the ability to configure any number of sensor
streams per monitoring device, this provides users with the opportunity to
use as many sensors as the accompanying processing devices can handle.
The RESTful interface provided by the system allows users to request
extremely dynamic physiological transformations to be performed upon col-
lected physiological data. Unlike hardware-based solutions, which are lim-
ited to the static transformation chain they were designed for, the XML-
based request format described in Section 4.5 allows for any combination of
physiological transforms desired by users. This also provides the opportu-
nity for cutting-edge analytical algorithms to be implemented into existing
implementations with a minimum of fuss.
Transformed (or raw) physiological data is returned to requesting users
in a standard format, allowing existing or custom software solutions to eas-
ily access and present the data in any appropriate format. This provides
the users with flexibility in their choice of presentation software, as well as
enabling access by other software platforms, such as web-based systems de-
signed to track user physiological data. Access to this data is authenticated,
preventing unauthorised access.
6.3.3 Configurability
As the system is designed to operate in a range of different environments,
the capability to configure system operation must be present and as sim-
ple as possible (R2). To this end, the system is configured with default
settings suitable for the majority of situations, with many configuration op-
tions only changing in special circumstances. The system configuration files
are Python scripts, allowing operators to modify or insert additional code
if required. This is particularly noticeable in the Monitor configuration file,
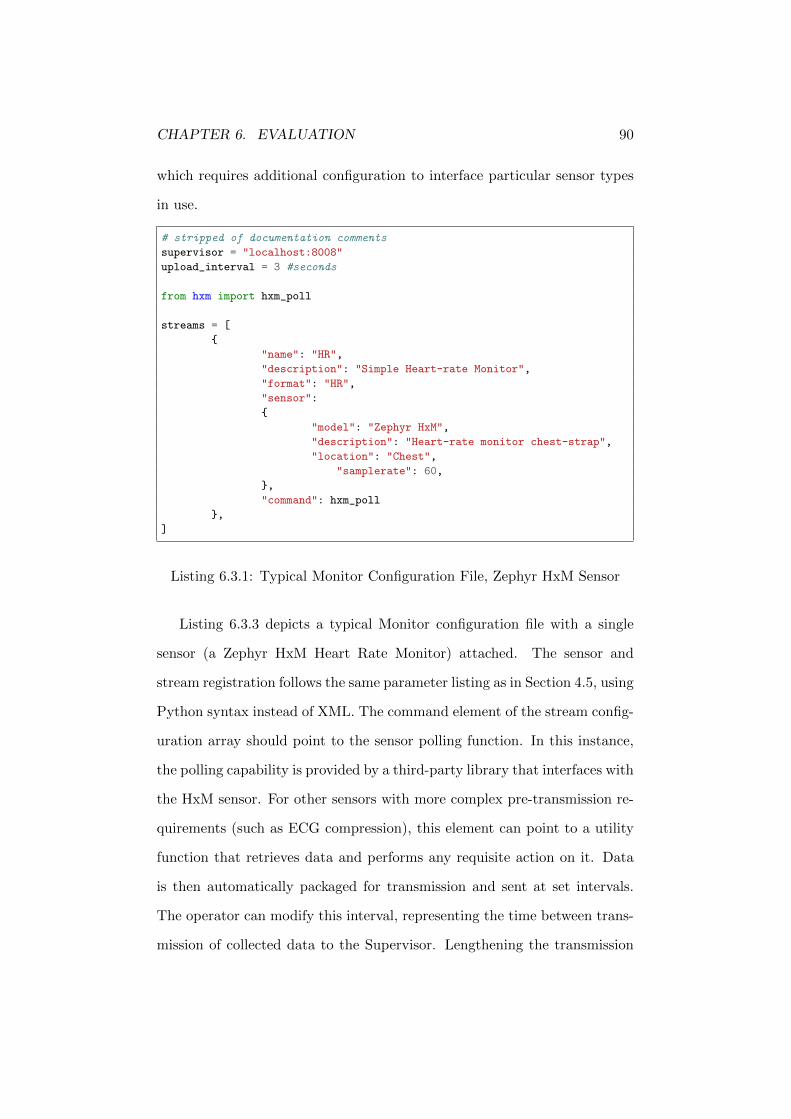
CHAPTER 6. EVALUATION 90
which requires additional configuration to interface particular sensor types
in use.
# stripped of documentation comments
supervisor = "localhost:8008"
upload_interval = 3 #seconds
from hxm import hxm_poll
streams = [
{
"name": "HR",
"description": "Simple Heart-rate Monitor",
"format": "HR",
"sensor":
{
"model": "Zephyr HxM",
"description": "Heart-rate monitor chest-strap",
"location": "Chest",
"samplerate": 60,
},
"command": hxm_poll
},
]
Listing 6.3.1: Typical Monitor Configuration File, Zephyr HxM Sensor
Listing 6.3.3 depicts a typical Monitor configuration file with a single
sensor (a Zephyr HxM Heart Rate Monitor) attached. The sensor and
stream registration follows the same parameter listing as in Section 4.5, using
Python syntax instead of XML. The command element of the stream config-
uration array should point to the sensor polling function. In this instance,
the polling capability is provided by a third-party library that interfaces with
the HxM sensor. For other sensors with more complex pre-transmission re-
quirements (such as ECG compression), this element can point to a utility
function that retrieves data and performs any requisite action on it. Data
is then automatically packaged for transmission and sent at set intervals.
The operator can modify this interval, representing the time between trans-
mission of collected data to the Supervisor. Lengthening the transmission
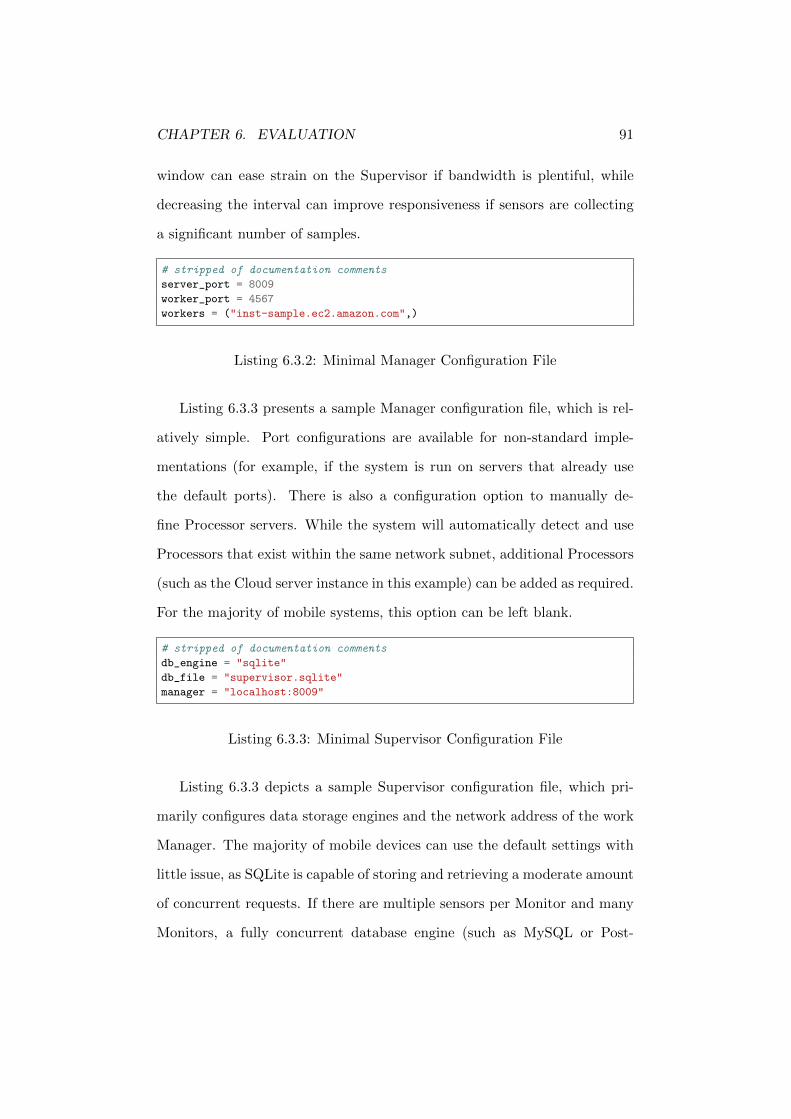
CHAPTER 6. EVALUATION 91
window can ease strain on the Supervisor if bandwidth is plentiful, while
decreasing the interval can improve responsiveness if sensors are collecting
a significant number of samples.
# stripped of documentation comments
server_port = 8009
worker_port = 4567
workers = ("inst-sample.ec2.amazon.com",)
Listing 6.3.2: Minimal Manager Configuration File
Listing 6.3.3 presents a sample Manager configuration file, which is rel-
atively simple. Port configurations are available for non-standard imple-
mentations (for example, if the system is run on servers that already use
the default ports). There is also a configuration option to manually de-
fine Processor servers. While the system will automatically detect and use
Processors that exist within the same network subnet, additional Processors
(such as the Cloud server instance in this example) can be added as required.
For the majority of mobile systems, this option can be left blank.
# stripped of documentation comments
db_engine = "sqlite"
db_file = "supervisor.sqlite"
manager = "localhost:8009"
Listing 6.3.3: Minimal Supervisor Configuration File
Listing 6.3.3 depicts a sample Supervisor configuration file, which pri-
marily configures data storage engines and the network address of the work
Manager. The majority of mobile devices can use the default settings with
little issue, as SQLite is capable of storing and retrieving a moderate amount
of concurrent requests. If there are multiple sensors per Monitor and many
Monitors, a fully concurrent database engine (such as MySQL or Post-
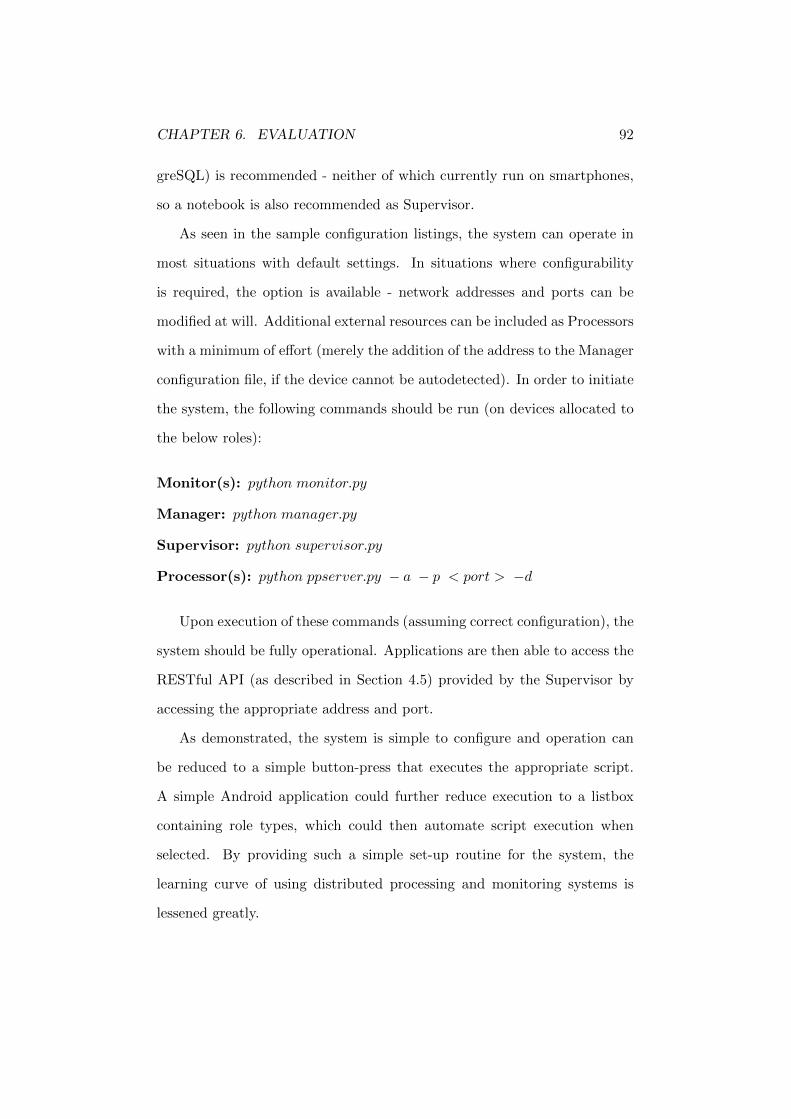
CHAPTER 6. EVALUATION 92
greSQL) is recommended - neither of which currently run on smartphones,
so a notebook is also recommended as Supervisor.
As seen in the sample configuration listings, the system can operate in
most situations with default settings. In situations where configurability
is required, the option is available - network addresses and ports can be
modified at will. Additional external resources can be included as Processors
with a minimum of effort (merely the addition of the address to the Manager
configuration file, if the device cannot be autodetected). In order to initiate
the system, the following commands should be run (on devices allocated to
the below roles):
Monitor(s): python monitor.py
Manager: python manager.py
Supervisor: python supervisor.py
Processor(s): python ppserver.py − a − p < port > −d
Upon execution of these commands (assuming correct configuration), the
system should be fully operational. Applications are then able to access the
RESTful API (as described in Section 4.5) provided by the Supervisor by
accessing the appropriate address and port.
As demonstrated, the system is simple to configure and operation can
be reduced to a simple button-press that executes the appropriate script.
A simple Android application could further reduce execution to a listbox
containing role types, which could then automate script execution when
selected. By providing such a simple set-up routine for the system, the
learning curve of using distributed processing and monitoring systems is
lessened greatly.
CHAPTER 6. EVALUATION 93
6.3.4 Mobility
One of the primary advantages of the system described in this dissertation
over existing solutions is its suitability to mobile environments. To satisfy
this goal, the system should work equally well in mobile environments with
no fixed power resources and no discrete processing resources, as well as
traditional environments with plentiful processing and ample transmission
bandwidth (R3).
The system satisfies this requirement primarily through implementation
of other requirements, such as cross-platform compatibility and scalability.
By providing the implementation as a set of distinct role-based applications
that run on the majority of common hardware platforms, the flexibility
needed to deploy such a system in unorthodox environments is present. The
system can be deployed across as many devices as needed, with additional
processing or monitoring nodes able to be added to the existing cluster with
a simple button-press or minor configuration alteration.
In addition, processing devices are not limited to requiring static power
supplies. By utilising existing, popular mobile devices, the system inherits
appropriate standards for power supplies. This ensures availability of sup-
porting hardware intended to enhance the useful lifetime of such devices,
such as extended batteries or solar chargers. Devices can also be quickly
charged using portable generators or fixed power supplies (if available).
The system also shares processing load across all available Processor
nodes, ensuring an even resource lifetime across devices. This avoids the
undesirable situation of having a single device handle too much allocated
work and deplete itself prematurely, potentially leaving a traditional system
useless.
CHAPTER 6. EVALUATION 94
6.3.5 Compatibility
The system supports compatibility with the majority of monitoring devices,
using existing communications standards and a flexible configuration sys-
tem for interaction with specific devices (R4). Some processing can also
be completed by the monitoring agent, allowing for high-bandwidth sig-
nal data (such as electrocardiogram or electroencephalogram signals) to be
compressed prior to submission to the Supervisor.
Due to the heterogeneity of monitoring devices (and their associated
data output formats), a system capable of utilising sensors for varying pur-
poses must either use existing standards or provide a flexible sensor con-
nection mechanism. Due to the highly commercial and individual nature of
physiological sensors, no real data format standard exists; while Bluetooth
or Infrared is often used as a communication medium, the resulting data
stream is often in a format recognisable only to software developed by the
hardware manufacturer. The protocols are often reverse-engineered for use
on other monitoring platforms (Caune, 2011), providing the possibility of
using a flexible data retrieval mechanism configured for particular devices.
Because the system’s configuration files are pure Python source files,
any requisite decoding or compression can be included into the Monitoring
agent as part of its normal functionality. This implies that the only limit
placed on compatibility is down to hardware compatibility, which can vary
amongst devices - most Android smartphones come with standard wireless,
Bluetooth and mini-USB (while newer phones also provide Near-field Com-
munications). In the event that the device does not support any of these
communications standards, a USB-accessible dongle is likely to exist.
CHAPTER 6. EVALUATION 95
6.3.6 Cross-platform
A key consideration in developing a system for use in a wide range of en-
vironments is cross-platform support for some (or all) parts of the system
(R5). This provides greater choice when selecting hardware for use in such
scenarios, allowing for more focus on other considerations (such as physical
toughness or battery life) over concerns like supported operating system.
To this end, the system is written purely in Python, requiring no cross-
compilation at all. Any device capable of operating the Python runtime
with multithreading should support the system - including the vast majority
of Unix-based systems, Microsoft Windows-based systems and Mac OSX
systems. There are also implementations of Python available for embedded
platforms (Various, 2012) that are optimised for minimal-size and memory
usage, though it is unlikely that the system will run on most of these devices
due to lack of multi-threading library support and memory limitations.
Certain optional supporting components of the system are as yet un-
able to be executed on alternative platforms. Proper relational database
management systems (such as MySQL and PostgreSQL) do not run on the
Android smartphone platform, forcing users to instead utilise SQLite - a
less concurrent data storage mechanism. However, using a laptop computer
as a Supervisor allows full use of these DBMS and may be a more sensible
option for large-scale monitoring while retaining mobility.
6.3.7 Extensible
Due to the nature of distributed physiological monitoring, it is desirable
for the system to support a large number of monitoring devices per partici-
pant (R6). In more complex monitoring examples, several sensors could be
attached to an individual; electrocardiographs, photoplethysmographs, po-
CHAPTER 6. EVALUATION 96
sitioning systems and others are all useful sensors that may be attached to a
single Monitor. In order to provide useful data, the system must be able to
manage data communication and aggregation with all sensors concurrently,
as well as packaging the data for submission to the Supervisor.
The system achieves this goal through use of multithreaded architecture
design. Each sensor is given a single dedicated thread on the Monitor pro-
cessor, allowing the sensors to be polled at individual rates in conjunction
with their listed sample rates. This allows for varying levels of resolution
for each sensor - while geographical position may only need to be registered
once every few minutes, electrocardiogram data often has sample rates of
significantly higher frequency (0.5-2kHz).
It is noted that the concurrency of the Monitor is limited to the number
of processing cores available and the frequency of requests. A device that is
constantly collating signal data in addition to handling several other sensors
may require a reduction in signal resolution in order for other data to be
collected in a timely fashion. Ultimately, if the device is unable to cope with
the required sample rate of certain sensors, devices containing a processor
with a higher core count may be required.
6.3.8 Scalable
One of the most important design considerations for a distributed processing
system is scalability (R7). By shifting the burden of processing off a single
device and distributing it over multiple devices, the intention is for the
system to become more responsive. This does not usually occur with perfect
results, since some overhead is required in the packaging and distribution of
the tasks to other devices. While the performance metrics of the system are
evaluated in Section 6.2, functional scalability implies solution of another
CHAPTER 6. EVALUATION 97
issue: ease of scalability.
The system allows users to easily scale the system through the addition
of new devices to the processing pool. This occurs through implementation
of one or more devices as Processors. For the majority of situations, this is as
simple as executing the Monitor Python script on the device - an action that
can be reduced to a simple button-press within a smartphone application,
or executing a batch file on a laptop or workstation. Even the addition of
Cloud computing resources was designed to be simple - merely requiring the
execution of the Processor script on the Cloud instance(s), and appending
the instance’s network address to the Manager configuration file.
By designing the system to be scaled as simply as possible, addition
of devices becomes . In the event of requiring more processing resources,
commonplace devices such as laptops or smartphones can have the script
and a Python interpreter copied onto them. This reduces time-to-use of
devices to a few minutes - less if a Python interpreter is already present on
the system. This fact, combined with easy configuration and addition of
devices, makes the system easily scalable.
6.3.9 Secure
Any system involved in the collection and transformation of personal physio-
logical data should provide data security at every possible step of the process
(R8). Due to the highly sensitive nature of such data, especially in combat
situations where intercepted position data could result in casualties, data
should be encrypted for transmission.
The system is able to accomplish this relatively easily. Due to the sys-
tem’s use of HTTP-based servers to handle communications from Monitor
to Supervisor and Supervisor to Client, all transmissions can be easily en-
CHAPTER 6. EVALUATION 98
crypted with a combination of HTTPS and SSL. Smartphones already con-
tain support for both standards using OpenSSL, as they are used heavily in
traditional web applications (particularly sensitive communications, such as
remote banking access).
Because the data stream between Manager and Processor is handled
by the Parallel Python module, modifications would have to be made to
support encryption of serialised Python arrays. Due to the modular nature
of Parallel Python, this is a relatively easy task - the only modification
required is encryption on both the read and write functions of the network
transfer class.
The proposed modifications to the Parallel Python classes are only neces-
sary if an attacker manages to breach normal wireless security mechanisms
that are generally in place. Including mobile security protocols such as
WPA2 on the wireless network would limit visibility of data transmissions
(both encrypted and unencrypted) to users that have appropriate authenti-
cation. Having multiple levels of encryption to protect data of this sensitivity
is still recommended, however - which this system supports.
6.3.10 Summary
This section has presented an evaluation of the system based on the re-
quirements in Section 4.2. It has argued that the system fully supports
each defined requirement, with care taken to ensure strict adherence to the
primary aims of the dissertation.
6.4 Summary
This chapter has presented an evaluation of the distributed physiological
monitoring and processing system described in Chapters 4 and 5. It con-
CHAPTER 6. EVALUATION 99
sisted of two main parts: a detailed evaluation of an implementation of the
system on an assortment of hardware (including mobile devices, worksta-
tions and Cloud computing resources), and an evaluation of how the system
satisfies the requirements described in Section 4.2.
The implementation of the system on a variety of hardware platforms
provided an opportunity to evaluate the system’s real-world potential in
solving issues commonly associated with physiological monitoring in certain
environment, described in Chapter 3. This evaluation focused on the scala-
bility of the system, and its viability when compared to using Local or Cloud
computing resources as processors instead of mobile devices.
Section 6.2 evaluated the system’s viability in real-world situations, in-
cluding the benefits it provides over traditional physiological processing tech-
niques. It showed the system had good levels of scalability and the physical
proximity of the processing devices to the system provided significant advan-
tages over external resources, due to latency overhead. It also determined
the best database engines for use with the system in mobile environments.
Section 6.3 argued that the system successfully met all the required cri-
teria for a generic physiological monitoring and processing framework on
mobile devices, as listed in Section 4.2. Each requirement was supported
through core functionality of the system, as well as the extensible interfaces
provided to connect to different sensor devices.
Chapter 7
Conclusion
7.1 Overview
This chapter presents the conclusions of the dissertation. Section 7.2 con-
tains an overview of the argument of the dissertation. Section 7.3 discusses
the major contributions presented in this dissertation. Finally, Section 7.4
presents some concluding remarks.
7.2 Overview of Dissertation
This dissertation has designed and evaluated a distributed physiological
monitoring and transformation system for use in mobile environments. Chap-
ter 1 introduced the practice of physiological monitoring, as well as the con-
cept of using physiological transformations to derive useful information from
collected data. The chapter describes issues with traditional physiological
monitoring techniques when applying them to mobile environments, and
argues that a model less reliant on communications networks and fixed pro-
cessing resources could be implemented in a wider range of environments.
In conclusion, it was argued that improves can be made to physiological
100
CHAPTER 7. CONCLUSION 101
monitoring by supporting these aims.
Chapter 2 presented a discussion of concepts important to physiological
monitoring, including general physiological background such as biofeedback,
the current state of monitoring devices, signal processing and how it relates
to physiological transformations and ethical considerations regarding moni-
toring of health data. Problems in existing monitoring techniques were also
identified, as well as a background on one possible solution to some of the
issues highlighted; distributed processing.
Chapter 3 described two case studies in which traditional physiological
monitoring techniques are not well-suited, and provide appropriate environ-
ments to consider when identifying specific issues with physiological moni-
toring. The chapter also identifies common issues between the case studies,
helping to narrow down problems with existing physiological monitoring
techniques. It concluded by arguing for a shift to a more mobile paradigm,
encouraging flexibility and lower reliance on external resources.
Chapter 4 presented a distributed physiological monitoring and transfor-
mation system designed to alleviate or eliminate some of the issues described
in previous chapters. A formal list of system requirements is presented, with
the goal of satisfying the aims introduced in Chapter 1. Application archi-
tecture and roles were described, and the application programming interface
was designed and documented.
Chapter 5 presented an implementation of the system described in Chap-
ter 4. Specific implementation details are discussed, including the method of
implementation for each role application. Implementation-specific decisions
such as resource allocation mechanisms were also presented, along with the
possibilities of data compression. Configuration mechanisms for the system
were also described in detail, as they directly determine interactivity with
CHAPTER 7. CONCLUSION 102
the wide range of physiological sensors available.
Chapter 6 presented an evaluation of the distributed physiological moni-
toring and transformation system. The first section of the chapter evaluated
the system through the execution of a number of experiments designed to
test the scalability and effect of latency upon the platform implementation
described in Chapter 5. The evaluation determined that the system is scal-
able and that collaborative mobile processing is a viable option in mobile
environments. The remainder of the chapter evaluates the implementation
considering the requirements listed in Section 4.2, and concluded that the
system satisfies all requirements.
7.3 Major Contributions
The Design of a Mobile Distributed Physiological Monitoring and
Processing Platform
A major contribution of this dissertation is the design of a distributed phys-
iological transformation processing platform that expands possible usage
environments to include those without stable communications networks or
fixed power supplies. This was achieved through the use of collaborative
processing on common mobile devices, and provides improvements to exist-
ing physiological processing techniques by increasing mobility. The platform
architecture and interface was described in Chapter 4, and the specific im-
plementation was discussed in Chapter 5.
Evaluation of the Viability of Mobile Physiological Processing
This dissertation has presented a comprehensive and detailed evaluation of
the platform, described in Chapter 6. This evaluation was used to demon-
strate the viability of using mobile devices to perform tasks traditionally
CHAPTER 7. CONCLUSION 103
completed by fixed processing resources, allowing physiological monitoring
in environments without access to communications networks and fixed power
supplies. The evaluation focused on whether the techniques used could scale
to effectively process physiological transformations under real-world condi-
tions.
7.4 Concluding Remarks
Physiological monitoring provides significant benefits in the areas of dis-
ease diagnosis, rehabilitation evaluation and assessing subjects for stress,
amongst other uses. Existing physiological monitoring techniques generally
monitor and store physiological data for later submission to centralised pro-
cessing servers that can perform physiological analysis and transformations
upon the collected data.
To enable real-time monitoring of physiological measures, devices rely
either on the presence of fixed processing resources or a reliable commu-
nications network that it can use to relay data to processing servers for
transformation. Several environments exist in which physiological monitor-
ing would be beneficial for health or evaluation reasons, but are unsuitable
for existing monitoring techniques. These environments tend to be mobile
environments, where fixed power supplies (and therefore fixed processing
resources) are unavailable, or where communications networks have little
penetration, such as highly remote or heavily forested areas.
In order to reduce reliance on these two environmental variables and
improve physiological monitoring by expanding the range of potential us-
age environments, a shift to a more mobile paradigm is recommended. By
encouraging the use of existing mobile devices as a collaborative processing
framework to perform physiological data transformations, both problems are
CHAPTER 7. CONCLUSION 104
alleviated. Smartphones contain their own portable power supplies, that can
be recharged periodically using a generator or photovoltaic cells. The de-
vices are also extremely portable, having been specifically designed for use
while mobile.
This dissertation presented an evaluation of the viability of using mobile
devices to collaboratively process physiological transformations, which de-
termined that such a technique is scalable and viable for use in real-world
situations. In several environments, distributed mobile processing actually
offers greater benefits than using traditional methods or Cloud Comput-
ing, as latency to local mobile devices is significantly lower than external
resources. This improves system responsiveness, which can be a key consid-
eration if the system is being used to monitor health signals. It is hoped
that the improvements brought to physiological monitoring are incorporated
into future implementations and allow the benefits of reliable monitoring to
be brought to a wider audience, including remote communities.
Bibliography
Adam, Thomas L., Chandy, K. M., & Dickson, J. R. 1974. A comparison of list schedules
for parallel processing systems. Commun. ACM, 17(12), 685–690.
Addison, P.S., & Watson, J.N. 2003 (Sept.). Secondary wavelet feature decoupling
(SWFD) and its use in detecting patient respiration from the photoplethysmogram.
Pages 2602 – 2605 Vol.3 of: Engineering in Medicine and Biology Society, 2003.
Proceedings of the 25th Annual International Conference of the IEEE, vol. 3.
AG. 2012 (May). Privacy Act 1988. http://www.comlaw.gov.au/Details/C2012C00414.
C2012C00414.
Ahmad, I., & Kwok, Yu-Kwong. 1994 (Aug.). A New Approach to Scheduling Parallel
Programs Using Task Duplication. Pages 47 –51 of: Parallel Processing, 1994. ICPP
1994. International Conference on, vol. 2.
Akkaya, Kemal, & Younis, Mohamed. 2005. A survey on routing protocols for wireless
sensor networks. Ad Hoc Networks, 3(3), 325–349.
Allen, John. 2007. Photoplethysmography and its application in clinical physiological
measurement. Physiological Measurement, 28(3), R1–R39.
Amazon Web Services. 2006 (Aug.). Amazon Elastic Compute Cloud (Amazon EC2).
http://aws.amazon.com/ec2/.
Antoniol, G., & Tonella, P. 1997. EEG data compression techniques. Biomedical Engi-
neering, IEEE Transactions on, 44(2), 105 –114.
Arnavut, Z. 2001. Lossless and near-lossless compression of ECG signals. Page 2146–2149
of: Engineering in Medicine and Biology Society, 2001. Proceedings of the 23rd An-
nual International Conference of the IEEE, vol. 3.
Bai, Jing, Zhang, Yonghong, Shen, Delin, Wen, Lingfeng, Ding, Chuxiong, Cui, Zijing,
Tian, Fenghua, Yu, Bo, Dai, Bing, & Zhang, Jupeng. 1999. A portable ECG and
105
REFERENCES 106
blood pressure telemonitoring system. IEEE Engineering in Medicine and Biology
Magazine, 18(4), 63–70.
Bayer, Michael. 2008 (Jan.). SQLAlchemy - The Database Toolkit for Python.
http://www.sqlalchemy.org/.
Bayer, Michael. 2012. Mako Templates. http://www.makotemplates.org/.
Blanco-Velasco, M., Cruz-Roldan, F., Godino-Llorente, J. I., & Barner, K. E. 2004.
ECG compression with retrieved quality guaranteed. Electronics Letters, 40(23),
1466–1467.
Bray, T., Paoli, J., Sperberg-McQueen, C. M, Maler, E., & Yergeau, F. 1997. Extensible
markup language (XML). World Wide Web Journal, 2(4), 27–66.
Buchthal, F. 1957. An introduction to electromyography. Gyldendal.
Cardei, M., & Wu, J. 2006. Energy-efficient coverage problems in wireless ad-hoc sensor
networks. Computer communications, 29(4), 413–420.
Casari, Paolo, Castellani, Angelo P., Cenedese, Angelo, Lora, Claudio, Rossi, Michele,
Schenato, Luca, & Zorzi, Michele. 2009. The “Wireless Sensor Networks for City-
Wide Ambient Intelligence (WISE-WAI)” Project. Sensors, 9(6), 4056–4082.
Caune, Peteris. 2011. HXM-T: display heart rate from Zephyr’s HXM. Haven’t decided
on title, Feb.
Chang, Wen-Yang, Fang, Te-Hua, & Lin, Yu-Cheng. 2008. Characterization and fabri-
cation of wireless flexible physiological monitor sensor. Sensors and Actuators A:
Physical, 143(2), 196–203.
Chen, J., & Itoh, S. 1998. A wavelet transform-based ECG compression method guaran-
teeing desired signal quality. Biomedical Engineering, IEEE Transactions on, 45(12),
1414–1419.
Chen, Y. Y. 2006. The development of wireless sensor network for ECG monitoring.
http://ir.lib.nctu.edu.tw/handle/987654321/33957.
CherryPy. 2001. CherryPy - A Minimalist Python Web Framework. http://cherrypy.org/.
Chu, D.C., & Humphrey, M. 2004 (Nov.). Mobile OGSI.NET: grid computing on mobile
devices. Pages 182 – 191 of: Grid Computing, 2004. Proceedings. Fifth IEEE/ACM
International Workshop on.
REFERENCES 107
Dai, Shaosheng, & Zhang, Yue. 2006. A Wireless Physiological Multi-parameter Mon-
itoring System Based on Mobile Communication Networks. Pages 473 –478 of:
Computer-Based Medical Systems, 2006. CBMS 2006. 19th IEEE International Sym-
posium on.
de Assuncao, Marcos Dias, di Costanzo, Alexandre, & Buyya, Rajkumar. 2009. Evalu-
ating the cost-benefit of using cloud computing to extend the capacity of clusters.
Page 141–150 of: Proceedings of the 18th ACM international symposium on High
performance distributed computing. HPDC ’09. New York, NY, USA: ACM.
Deutsch, L. P. 1996. GZIP file format specification version 4.3.
Dhamdhere, A., Chen, Hao, Kurusingal, A., Sivaraman, V., & Burdett, A. 2010. Experi-
ments with wireless sensor networks for real-time athlete monitoring. Pages 938–945
of: 2010 IEEE 35th Conference on Local Computer Networks (LCN). IEEE.
El-Rewini, Hesham, & Lewis, T.G. 1990. Scheduling parallel program tasks onto arbitrary
target machines. Journal of Parallel and Distributed Computing, 9(2), 138–153.
Fielding, R. 2007. A little REST and Relaxation. In: The International Conference on
Java Technology (JAZOON07), Zurich, Switzerland.
FitnessKeeper. 2012. RunKeeper. http://runkeeper.com/.
Fleming, S. G., & Tarassenko, L. 2007. A comparison of signal processing techniques for
the extraction of breathing rate from the photoplethysmogram. World Academy of
Science, Engineering and Technology.
Geddes, L. A., Hoff, H. E., Hickman, D. M., & Moore, A. G. 1962. The impedance
pneumography. Aerospace medicine, 33, 28.
Gomoluch, J., & Schroeder, M. 2003. Market-based resource allocation for grid computing:
A model and simulation. Page 211–218 of: Middleware Workshops.
Google. 2008a (Sept.). Android. http://www.android.com/.
Google. 2008b (Apr.). Google App Engine. https://developers.google.com/appengine/.
Healey, J., & Picard, R. 1998. Digital processing of affective signals. Page 3749–3752
of: Acoustics, Speech and Signal Processing, 1998. Proceedings of the 1998 IEEE
International Conference on, vol. 6.
Hipp, D. R, & KENNEDY, D. 2007. SQLite. Available fr om: http://www. sqlite. org.
REFERENCES 108
Hjortskov, Nis, Rissen, Dag, Blangsted, AnneKatrine, Fallentin, Nils, Lundberg, Ulf, &
Søgaard, Karen. 2004. The effect of mental stress on heart rate variability and blood
pressure during computer work. European Journal of Applied Physiology, 92(1),
84–89.
Horspool, R. N, & Windels, W. J. 1994. An LZ approach to ECG compression. Page
71–76 of: Computer-Based Medical Systems, 1994., Proceedings 1994 IEEE Seventh
Symposium on.
Hoyt, Reed W., Reifman, Jaques, Coster, Trinka S., & Buller, Mark J. 2002. Combat
medical informatics: present and future. Proceedings of the AMIA Symposium, 335–
339. PMID: 12463842 PMCID: PMC2244161.
Iverson, Michael A., Ozguner, Fusun, & Follen, Gregory J. 1995. Parallelizing Existing
Applications in a Distributed Heterogeneous Environment. Page 93–100 of: 4TH
HETEROGENEOUS COMPUTING WORKSHOP (HCW ’95.
Jalaleddine, S.M.S., Hutchens, C.G., Strattan, R.D., & Coberly, W.A. 1990. ECG data
compression techniques-a unified approach. Biomedical Engineering, IEEE Transac-
tions on, 37(4), 329 –343.
Jane, R., Laguna, P., Caminal, P., & Rix, H. 1990 (Sept.). Adaptive filtering of high-
resolution ECG signals. Pages 347 –350 of: Computers in Cardiology 1990, Proceed-
ings.
Jovanov, E., O’Donnell Lords, A., Raskovic, D., Cox, P. G, Adhami, R., & Andrasik, F.
2003a. Stress monitoring using a distributed wireless intelligent sensor system. IEEE
Engineering in Medicine and Biology Magazine, 22(3), 49– 55.
Jovanov, E., Raskovic, D., Lords, A. O, Cox, P., Adhami, R., & Andrasik, F. 2003b.
Synchronized physiological monitoring using a distributed wireless intelligent sensor
system. Pages 1368– 1371 Vol.2 of: Proceedings of the 25th Annual International
Conference of the IEEE Engineering in Medicine and Biology Society, 2003, vol. 2.
IEEE.
Katz, L. N., & Pick, A. 1956. Clinical electrocardiography. Lea & Febiger.
Korhonen, I., Parkka, J., & Van Gils, M. 2003. Health monitoring in the home of the
future. Engineering in Medicine and Biology Magazine, IEEE, 22(3), 66 – 73.
Krupa, J., Pavelka, A., Vysata, O., & Prochazka, A. 2007. Distributed Signal Processing.
In: Proceedings of the conference Technical Computing Prague.
REFERENCES 109
Land, A., & Vallejo, A. 2009. System on a Chip: Design and Implementation.
Lapierre, Coady B, Schwegler, Andria F, & LaBauve, Bill J. 2007. Posttraumatic stress
and depression symptoms in soldiers returning from combat operations in Iraq and
Afghanistan. Journal of Traumatic Stress, 20(6), 933–943.
Lee, K., Paton, N.W., Sakellariou, R., Deelman, E., Fernandes, A.A.A., & Mehta, G.
2009. Adaptive workflow processing and execution in pegasus. Concurrency and
Computation: Practice and Experience, 21(16), 1965–1981.
Lee, K., Murray, D., Hughes, D., & Joosen, W. 2010. Extending sensor networks into the
cloud using amazon web services. Page 1–7 of: Networked Embedded Systems for
Enterprise Applications (NESEA), 2010 IEEE International Conference on.
Lee, L., & Oppenheim, A. V. 1998. Distributed signal processing. Page 1749–1752 of:
Acoustics, Speech and Signal Processing, 1998. Proceedings of the 1998 IEEE Inter-
national Conference on, vol. 3.
Lee, Ren-Guey, Hsiao, Chun-Chieh, Chen, Chun-Chung, & Liu, Ming-Shiu. 2006. A
Mobile-Care System Integrated with Bluetooth Blood Pressure and Pulse Monitor,
and Cellular Phone. IEICE TRANSACTIONS on Information and Systems, E89-
D(5), 1702–1711.
Lin, Bor-Shing, Lin, Bor-Shyh, Chou, Nai-Kuan, Chong, Fok-Ching, & Chen, Sao-Jie.
2006. RTWPMS: A Real-Time Wireless Physiological Monitoring System. Informa-
tion Technology in Biomedicine, IEEE Transactions on, 10(4), 647 –656.
Lin, Yuan-Hsiang, Jan, I-Chien, Ko, P.C.-I., Chen, Yen-Yu, Wong, Jau-Min, & Jan,
Gwo-Jen. 2004. A wireless PDA-based physiological monitoring system for patient
transport. Information Technology in Biomedicine, IEEE Transactions on, 8(4), 439
–447.
Malmivuo, Jaakko, & Plonsey, Robert. 1995. Bioelectromagnetism: Principles and Appli-
cations of Bioelectric and Biomagnetic Fields. Oxford University Press.
Malone, John D., Brigantic, Robert, Muller, George A., Gadgil, Ashok, Delp, Woody,
McMahon, Benjamin H., Lee, Russell, Kulesz, Jim, & Mihelic, F. Matthew. 2009.
U.S. airport entry screening in response to pandemic influenza: Modeling and anal-
ysis. Travel Medicine and Infectious Disease, 7(4), 181–191.
McCleary, R. A. 1950. The nature of the galvanic skin response. Psychological Bulletin,
47(2), 97–117.
REFERENCES 110
Meguerdichian, S., Koushanfar, F., Potkonjak, M., & Srivastava, M. B. 2001. Coverage
problems in wireless ad-hoc sensor networks. Page 1380–1387 of: INFOCOM 2001.
Twentieth Annual Joint Conference of the IEEE Computer and Communications
Societies. Proceedings. IEEE, vol. 3.
Mendoza, G. G, & Tran, B. Q. 2002. In-home wireless monitoring of physiological data
for heart failure patients. Pages 1849– 1850 vol.3 of: Engineering in Medicine and
Biology, 2002. 24th Annual Conference and the Annual Fall Meeting of the Biomed-
ical Engineering Society EMBS/BMES Conference, 2002. Proceedings of the Second
Joint, vol. 3. IEEE.
Miaou, S. G., & Chao, S. N. 2005. Wavelet-based lossy-to-lossless ECG compression in a
unified vector quantization framework. Biomedical Engineering, IEEE Transactions
on, 52(3), 539–543.
Milenkovic, Aleksandar, Otto, Chris, & Jovanov, Emil. 2006. Wireless sensor networks
for personal health monitoring: Issues and an implementation. Computer Commu-
nications, 29(13–14), 2521–2533.
Moody, G. B, Mark, R. G, Zoccola, A., & Mantero, S. 1985. Derivation of respiratory
signals from multi-lead ECGs. Computers in Cardiology, 12, 113–116.
Nave, G., & Cohen, A. 1993. ECG compression using long-term prediction. Biomedical
Engineering, IEEE Transactions on, 40(9), 877–885.
Niedermeyer, Ernst, & Silva, F. H. Lopes Da. 2005. Electroencephalography: Basic Prin-
ciples, Clinical Applications, and Related Fields. Lippincott Williams & Wilkins.
OFPC. 2001. Privacy in the Private Health Sector. Nov.
Oliver, N., & Flores-Mangas, F. 2006. HealthGear: a real-time wearable system for
monitoring and analyzing physiological signals. Pages 4 pp.–64 of: International
Workshop on Wearable and Implantable Body Sensor Networks, 2006. BSN 2006.
IEEE.
Oracle Corporation. 2012. MySQL Database Management System.
http://www.mysql.com/.
Pagani, M. 2000. Heart rate variability and autonomic diabetic neuropathy. Diabetes,
nutrition & metabolism, 13(6), 341.
Palankar, Mayur R., Iamnitchi, Adriana, Ripeanu, Matei, & Garfinkel, Simson. 2008.
Amazon S3 for science grids: a viable solution? Page 55–64 of: Proceedings of the
REFERENCES 111
2008 international workshop on Data-aware distributed computing. DADC ’08. New
York, NY, USA: ACM.
Pandian, P. S., Safeer, K. P., Gupta, Pragati, Shakunthala, D. T., Sundersheshu, B. S., &
Padaki, V. C. 2008. Wireless Sensor Network for Wearable Physiological Monitoring.
Journal of Networks, 3(5).
Parviz, B. A. 2009. Augmented reality in a contact lens. IEEE spectrum, 9, 1–4.
Pering, Trevor, Agarwal, Yuvraj, Gupta, Rajesh, & Want, Roy. 2006. <i>CoolSpots</i>:
reducing the power consumption of wireless mobile devices with multiple radio in-
terfaces. Page 220–232 of: Proceedings of the 4th international conference on Mobile
systems, applications and services. MobiSys ’06. New York, NY, USA: ACM.
Pinheiro, E., Bianchini, R., Carrera, E. V, & Heath, T. 2001. Load balancing and un-
balancing for power and performance in cluster-based systems. Page 182–195 of:
Workshop on compilers and operating systems for low power, vol. 180.
PostgreSQL. 1996. PostgreSQL Database Management System.
http://www.postgresql.org/.
Practitioners, The Royal Australian College of General. 2011 (Oct.). RACGP | Com-
puter Security Guidelines. http://www.racgp.org.au/ehealth/csg. Computer Secu-
rity Guidelines.
Python Software Foundation. 1990. Python Programming Language.
http://www.python.org/.
Ren, Hongliang, Meng, M. Q.-H, & Chen, Xijun. 2005. Physiological information acqui-
sition through wireless biomedical sensor networks. In: 2005 IEEE International
Conference on Information Acquisition. IEEE.
Rong-ben, Wang, Ke-you, Guo, Shu-ming, Shi, & Jiang-wei, Chu. 2003. A monitoring
method of driver fatigue behavior based on machine vision. Pages 110– 113 of:
IEEE Intelligent Vehicles Symposium, 2003. Proceedings. IEEE.
Ruggiero, C., Sacile, R., & Giacomini, M. 1999. Home Telecare. Journal of Telemedicine
and Telecare, 5(1), 11–17.
Sangeeta, B., & Laxmi, S. 2011. A Real Time Analysis of PPG Signal for Measurement
of SpO2 and Pulse Rate. International Journal of Computer Applications, 36(11),
45–50.
REFERENCES 112
Schmidt, Robert, Norgall, Thomas, Morsdorf, Joachim, Bernhard, Josef, & von der Grun,
Thomas. 2002. Body Area Network BAN–a key infrastructure element for patient-
centered medical applications. Biomedizinische Technik. Biomedical engineering, 47
Suppl 1 Pt 1, 365–368. PMID: 12451866.
Sih, G.C., & Lee, E.A. 1993. A compile-time scheduling heuristic for interconnection-
constrained heterogeneous processor architectures. Parallel and Distributed Systems,
IEEE Transactions on, 4(2), 175 –187.
Singer, Donald H., Martin, Gary J., Magid, Norman, Weiss, Jerry S., Schaad, John W.,
Kehoe, Richard, Zheutlin, Terry, Fintel, Dan J., Hsieh, Ann-Ming, & Lesch, Michael.
1988. Low heart rate variability and sudden cardiac death. Journal of Electrocardi-
ology, 21(Jan.), S46–S55.
SL4A. 2010. Scripting Layer 4 Android. http://code.google.com/p/android-scripting/.
Solomon, Z., Mikulincer, M., & Hobfoll, S. E. 1986. Effects of social support and battle
intensity on loneliness and breakdown during combat. Journal of Personality and
Social Psychology; Journal of Personality and Social Psychology, 51(6), 1269.
Topcuoglu, H., Hariri, S., & Wu, Min-You. 2002. Performance-effective and low-complexity
task scheduling for heterogeneous computing. Parallel and Distributed Systems,
IEEE Transactions on, 13(3), 260 –274.
Tremper, K. K., & Barker, S. J. 1989. Pulse oximetry. Anesthesiology, 70(1), 98.
Vanovschi, Vitalii. 2005. Parallel Python. http://www.parallelpython.com/.
Various. 2012 (May). Python Wiki - Implementations.
http://wiki.python.org/moin/PythonImplementations.
Xiao, Y. 2005. IEEE 802.11 n: enhancements for higher throughput in wireless LANs.
Wireless Communications, IEEE, 12(6), 82–91.
Yang, Tao, & Gerasoulis, A. 1994. DSC: scheduling parallel tasks on an unbounded number
of processors. Parallel and Distributed Systems, IEEE Transactions on, 5(9), 951
–967.
Yao, Y., & Gehrke, J. 2003. Query processing in sensor networks.
Yu, Sung-Nien, & Cheng, Jen-Chieh. 2005 (Jan.). A Wireless Physiological Signal Moni-
toring System with Integrated Bluetooth and WiFi Technologies. Pages 2203 –2206
of: Engineering in Medicine and Biology Society, 2005. IEEE-EMBS 2005. 27th
Annual International Conference of the.

REFERENCES 113
Zephyr Technology. 2010. CASE STUDY: Zephyr Provides Physiological Monitoring
of Chilean Miners During San Jose Mine Rescue Operation. http://www.zephyr-
technology.com/resources/case-studies.