Embed Size (px)
Citation preview

LUND UNIVERSITY
PO Box 117221 00 Lund+46 46-222 00 00
Towards Better Urban Spaces in Harmony with Microclimate: Urban design andplanning regulations in hot dry Damascus, Syria
Yahia, Moohammed Wasim
Published: 2014-01-01
Link to publication
Citation for published version (APA):Yahia, M. W. (2014). Towards Better Urban Spaces in Harmony with Microclimate: Urban design and planningregulations in hot dry Damascus, Syria Lund University
General rightsCopyright and moral rights for the publications made accessible in the public portal are retained by the authorsand/or other copyright owners and it is a condition of accessing publications that users recognise and abide by thelegal requirements associated with these rights.
• Users may download and print one copy of any publication from the public portal for the purpose of privatestudy or research. • You may not further distribute the material or use it for any profit-making activity or commercial gain • You may freely distribute the URL identifying the publication in the public portal

Towards Better Urban Spaces in Harmony with Microclimate
Urban design and planning regulations in hot dry Damascus, Syria

Keywords
Architecture Arid zones Built environment Climate Climatic design
Damascus Hot dry regions Landscape elements Microclimate Planning regulations
Thermal comfort Thermal indices Urban climate Urban design Urban planning
© Moohammed Wasim Yahia Towards Better Urban Spaces in Harmony with Microclimate: Urban design and planning regulations in hot dry Damascus, Syria E-mail: [email protected] Facebook: Mhd Wasim Yahia Thesis 10 ISBN-10 9187866-39-0 ISBN-13 978-91-87866-39-5 ISSN 1652-7666
Cover Layout: E-husets Tryckeri Cover photo, figures, and tables by the author Printed in Sweden by E-husets Tryckeri, Lund, 2014
This Thesis can be orderd from Housing Development & Management Lund University Box 118 Telephone +46 46 222 05 05 SE-221 00 Lund Telefax +46 46 222 47 19 Sweden E-mail [email protected]
Homepage http://www.hdm.lth.se

Towards Better Urban Spaces in Harmony with
Microclimate Urban design and planning regulations
in hot dry Damascus, Syria


For Syria ….. forever. And more than ever.


“We need a generation of architects and designers who hold knowledge in their minds and love in their hearts”
M.W. Yahia


9
Table of Contents 1 Introduction 19 1.1 Background and problem definition 19 1.2 Aim, research questions and limitations 21 1.3 Structure of the thesis 22 2 The city of Damascus – the area studied 25
2.1 The city of Damascus 25 2.2 Urbanization in Damascus 27 2.3 City development and urban planning regulations in Damascus 29 2.4 Existing urban planning regulations in Damascus 31 2.5 Climate of Damascus 32 3 Literature review 35
3.1 Urban climate, climatic design and thermal comfort 35 3.2 Urban microclimate and outdoor thermal comfort in hot dry climates 37 3.3 Urban planning regulations and climate 43 4 Methodology 47
4.1 Research paradigm 47 4.2 Overall research strategy 49 4.3 Analysis of urban planning regulations 50 4.4 Microclimate fieldwork 53 4.5 Structured interviews 56 4.6 Thermal comfort analysis 57 4.7 Parametric study 58 4.8 Residential area design evaluation 61 5 Results and discussion 67
5.1 The effect of urban regulations on surface temperatures and thermal comfort 67 5.2 Micrometeorological measurements and calculated thermal comfort indices 69 5.3 Subjective thermal sensation 72 5.4 Relationship between thermal sensation votes and thermal indices 73 5.5 Thermal comfort limits and neutral temperatures 75 5.6 Thermal sensation and aesthetic qualities of the place 76 5.7 Landscape interventions in improving thermal comfort in Damascus 77

10
5.8 Thermal comfort evaluation for an urban design proposal 84 6 Conclusions and propositions 89
References 93 Appendix 1: Urban zones in Damascus 101 Appendix 2: Glossary of terms used in the thesis 103
Paper 1 107
Influence of urban planning regulations on the microclimate in a hot dry climate – The example of Damascus, Syria Paper 2 127
Evaluating the behaviour of different thermal indices by investigating various outdoor urban environments in the hot dry city of Damascus, Syria Paper 3 155
Urban microclimate and thermal comfort in outdoor spaces in hot dry Damascus Paper 4 165
The Influence of Environment on People’s Thermal Comfort in Outdoor Urban Spaces in Hot Dry Climates – The example of Damascus, Syria Paper 5 179 Microclimate in hot dry Damascus: The influence of the urban environment on human perception Paper 6 195 Landscape interventions in improving thermal comfort in the hot dry city of Damascus, Syria –The example of residential spaces with detached buildings

11
Acknowledgments In life, everyone has memories that he/she always wants to keep in mind. For me, the time I spent in Sweden to conduct this work was one of the most beautiful in my life, in addition to the nice, polite, and educated peo-ple that I met.
First of all, I would like to thank my tutor Dr. Erik Johansson who was for me a main resource to develop my research in the field of urban microcli-mate and thermal comfort. I also want to thank Mr. Johnny Åstrand, not only because he is a perfect director of HDM, but also because he was my main tutor and encouraged me to develop my work from architectural as well as academic perspectives.
Special thank goes to my supervisor Prof. Björn Karlsson who gave me very valuable advice in the beginning of the work.
I am also grateful to my colleagues at HDM (Laura Liuke, Maria Rasmus-sen, Ivette Arroyo and Fabricio Montaño) for providing a comfortable envi-ronment and for their support throughout the work, and special thanks to the senior administrator Lena Andersson who was ready to do everything I needed and offered everything I asked. Special thanks also to Laura Liuke for the excellent work in editing the English text.
Special thanks to Dr. Thorbjörn Laike, Department of Architecture and Built Environment, Lund University for his advice in the field of environ-mental psychology that helped me to develop my work.
I would like also to express my gratitude towards Mrs. Beata Sokołowska who helped me to learn some basic statistics and the SPSS software.
I would like to thank my parents, brothers, sisters, friends, and col-leagues for their support and for always believing in me.
The financial support provided by the Erasmus Mundus External Coop-eration Window Lot 3 and HDM, Lund University, Sweden is greatly appre-ciated and acknowledged.
Last, but certainly not least, the greatest thank goes to the one who is here and there, the one who lives in eyes and hearts, the one who is the first and the last.

12

13
List of papers and author’s contribution This thesis is based on six papers, which will be referred to in the text. The papers are appended at the end of the thesis. Paper 1 Yahia, M.W., & Johansson, E. (2013a). Influence of urban planning regula-tions on the microclimate in a hot dry climate: The example of Damascus, Syria. Journal of Housing and Built Environment, 28 (1), 51–65.
M. W. Yahia translated the documents of urban planning regulations
from Arabic into English and did investigations of different urban zones. He modeled the related zones with Auto-CAD and simulated microclimate with ENVI-met. In addition, he carried out and analyzed the results and was re-sponsible for all steps for being published in the journal of housing and built environment.
The co-author assisted with the review and critical discussions.
Paper 2 Yahia, M.W., & Johansson, E. (2013b). Evaluating the behaviour of different thermal indices by investigating various outdoor urban environments in the hot dry city of Damascus, Syria. International Journal of Biometeorolology, 57(4), 615–630.
M. W. Yahia conducted the micrometeorological measurements and
structured interviews in Damascus in summer and winter seasons. He also carried out the microclimate and thermal comfort investigations. Further-more, he conducted and analyzed the results and was responsible for all steps for being published in the international journal of Biometeorology.
The co-author assisted with the review and critical discussions.
Paper 3 Yahia, M.W., & Johansson, E. (2012). Urban microclimate and thermal com-fort in outdoor spaces in hot dry Damascus. The 8th International Confer-ence on Urban Climate (ICUC8), 6th-10th August 2012, UCD, Dublin, Ireland.
M. W. Yahia conducted the microclimate and thermal comfort analysis
and carried out the results including the statistical analysis by using SPSS software. In addition, all steps to present the written paper in the ICUC8 conference were done by the author.
The co-author assisted with the review and critical discussions.

14
Paper 4 Yahia, M.W., & Johansson, E. (2011). The influence of environment on
people’s thermal comfort in outdoor urban spaces in hot dry climates – The example of Damascus, Syria. Architecture and Sustainable Development, In: Bodart M and Evrard A (Eds.), Proceedings of the 27th international Passive and Low Energy Architecture (PLEA) Conference, Louvain-la-Neuve, 13th-15th July 2011, Vol. I, p. 589–594.
M. W. Yahia conducted the all analysis of the structured interviews and
carried out the results by using SPSS. In addition, all steps to present the paper in the PLEA conference were done by the author.
The co-author assisted with review and critical discussions. Paper 5 Yahia, M.W., & Johansson, E. (2013c). Microclimate in hot dry Damascus: The influence of the urban environment on human perception. Journal of Earth Science and Engineering, 8 (3), 554–561.
M. W. Yahia carried out the thermal comfort investigations. He also pro-duced and analyzed the results by using SPSS software. The author was al-so responsible for all steps for being published in the journal of Earth Science and Engineering.
The co-author assisted with the review and critical discussions.
Paper 6 Yahia, M.W., & Johansson, E. (2014). Landscape interventions in improving thermal comfort in the hot dry city of Damascus, Syria – The example of residential spaces with detached buildings. Landscape and Urban Plan-ning, (125), 1–16.
M. W. Yahia carried out investigations of different urban zones. He mod-eled the related zones by using Auto-CAD and simulated microclimate with ENVI-met as a parametric study. In addition, he conducted and analyzed the results and was responsible for all steps for being published in the jour-nal of landscape and urban planning.
The co-author assisted with the review and critical discussions.
Additional publications, not included in the thesis
Conference papers Yahia, M.W., & Johansson, E. (2012). Thermal perception and physical characteristics of urban spaces in Damascus, Syria. The 8th International Conference on Urban Climate (ICUC8), 6th-10th August 2012, UCD, Dublin, Ireland. Johansson, E., & Yahia, M.W. (2012). Improving outdoor thermal comfort in warm-humid Guayaquil, Ecuador through urban design. The 8th Interna-tional Conference on Urban Climate (ICUC8), 6th-10th August 2012, UCD, Dublin, Ireland.

15
Johansson, E., & Yahia, M.W. (2012). The problem of poor microclimate in urban areas in hot dry climates and analysis of existing urban planning regulations. The 4th International Conference on Municipal Management and Urban Development for Sustainability in Arab Cities, 7th-9th May 2012, Kuwait. Johansson, E., & Yahia, M.W. (2011). Subjective thermal comfort in urban spaces in the warm-humid city of Guayaquil, Ecuador. Architecture and Sus-tainable Development, In: Bodart M and Evrard A (Eds.), Proceedings of the 27th international Passive and Low Energy Architecture (PLEA) Conference, Louvain-la-Neuve, 13th-15th July 2011, Vol. I, p. 577–582. Johansson, E., & Yahia, M.W. (2010). Towards a climate-sensitive urban de-sign- the need to modify current planning regulations. In: Lehmann et al. (Eds.), Sustainable Architecture and Urban Development (SAUD 2010), Pro-ceedings of the 7nd International Conference of the Center for the Study of Architecture in the Arab Region, Amman, Jordan, 12th-14th July 2010, Vol. II, p. 293–306.
Licentiate thesis Yahia, M.W. (2012). Urban Microclimate and Thermal Comfort of Urban Spaces in Hot Dry Damascus: Influence of urban design and planning regu-lations. Division of Housing Development & Management, Dept. of Architec-ture and Built Environment, Lund University, Lund, Sweden.

16

17
Abbreviations ASHRAE ET* FAR H/W IRA
American Society of Heating, Refrigerating and Air-conditioning Engineers New Effective Temperature Floor Area Ratio The ratio of building height (H) to street width (W) Inhabited Rural Area (zone code)
MRT OD OUT_SET*
Mean Radiant Temperature Old Damascus (zone code) Outdoor Standard Effective Temperature
PET PMV PRA PT RH SVF Ta Tg UHI W Wd
Physiological Equivalent Temperature Predicted Mean Vote Planned Residential Area (zone code) Perceived Temperature Relative humidity Sky View Factor Air temperature Globe temperature Urban Heat Island Wind speed Wind direction

18

19
1 Introduction
1.1 Background and problem definition Over the last decades, there has been considerable interest in the topics of urban issues and city development. This attention to create better cities – cities that are more livable, sustainable and dynamic – can be noticed in many international scientific meetings and conferences such as the 2nd United Nations Conference on Human Settlements (UN-Habitat II, 1996) that discussed the Habitat Agenda. This agenda aimed to address two themes of equal importance: “Adequate shelter for all” and “Sustainable human settlements development in an urbanizing world”. The urban issues and city development were also discussed in later conferences such as World Urban Forum 6 (UN-Habitat, 2012) and conference of Sustainable Development and Planning (Wessex Institute of Technology, 2013). These events tried to highlight the problems related to urban development and planning that affect rural and urban areas in all regions of the world. In ad-dition to such events, much of the related literature and research have fo-cused on the topic of the city and sustainable development such as Harris (2000) and Ng (2010). Thus, many related themes such as shape of cities, urban regulations for better quality of life, productive cities, urban mobility, energy and environment have become very important to consider on the way towards the urban future (UN-Habitat, 2012).
The 20th century is related to the phenomenon of rapid urbanization (FIG, 2010). According to Jenkins et al. (2007), urbanization is the process by which a country’s population changes from primarily rural to urban and it is caused by the migration of people from the countryside to the city to search better jobs and living conditions. Based on United Nations projections, the urban population increased from 220 million in 1900 to 732 million in 1950 (29% of the world’s population). By 2007, half of the world’s population lived in urban areas, and by the middle of the 21st century all regions will be predominantly urban (UN-Habitat, 2010). In the regions defined as “devel-oping world”, population growth – which is defined as the annual net in-crement of the population when fertility, mortality, and migration are all taken into account – in the urban areas will be particularly rapid (Jenkins et al., 2007).
According to the population division of the United Nations in 2004, the rapid urbanization creates major challenges, and affects the international development agenda of creating sustainable urban environment. The rapid urbanization in developing countries has also become one of the important topics in urban planning and sustainable development. One of the reasons is that the rapid urbanization often leads to negative environmental im-pacts, including changing of the urban microclimate. Those particularly at risk include the elderly, low-income earners and residents in urban areas of high population densities with limited surrounding vegetation. Furthermore, the rapid urbanization with limited landscape elements negatively affects the human health due to the increased pollution (Harlan et al., 2006). The lack of landscape elements, in turn, has a negative impact on microclimate and thermal comfort for inhabitants. However, despite these and other problems caused by urbanization, urban areas have an importance for na-

Towards better Urban Spaces Moohammed Wasim Yahia
20
tional perspectives especially to encourage the investments and strengthen the economic growth (Tannerfeldt and Ljung, 2006).
Global warming is also a challenge for future urban development. Due to climate change, according to the worst scenario, the global air tempera-tures are expected to rise 4 °C by the year 2100 (IPCC, 2013). Moreover, ex-treme weather events will be more common in the future, and for example, heat waves will be stronger and last longer. This is a problem especially for cities in regions with warm and hot climates and the consequences include increased occurrence of heat stress and heat-related diseases. Further-more, human performance in both mental and physical tasks diminishes at uncomfortably high temperatures. In addition, deaths and illness caused by air pollution tend to increase during extremely warm weather (Harlan et al., 2006).
Cities in warm climates are especially vulnerable because – in addition to global warming – the urbanization process results in a corresponding in-crease of urban temperatures in comparison to its rural surroundings, the phenomenon called Urban Heat Island (UHI) (Oke, 1987; Arnfield, 2003).
Within cities in the developing countries, the urban poor are especially vulnerable to heat waves due to sub-standard housing, high population densities and lack of green areas (Harlan et al., 2006). A given building den-sity can result in different design patterns that affect urban microclimate in different ways. Parameters such as fraction of urban land covered by build-ings, distances between buildings and average height of buildings (Givoni, 1998) affect the urban microclimate in terms of solar radiation, solar reflec-tion, wind speed, wind direction, etc.
In order to reduce the negative climatic impacts in our cities, those in-volved in urban development, planning and design are encouraged to in-corporate climate knowledge into planning strategies and to create links between microclimate, thermal comfort, design, and urban planning regu-lations.
Urban microclimate and outdoor thermal comfort are generally given lit-tle importance in the urban design and planning processes (Eliasson, 2000; Johansson, 2006b). Some studies have dealt with the relationship between urban planning regulations and microclimates. In hot dry climates, many studies indicate that the existing planning regulations are not adapted to the climate. In the city of Fez, Johansson (2006b) found that the intention of the current regulations is to guarantee daylight for buildings. This may be rele-vant for the winter period when solar elevations are low and passive heat-ing of buildings is desired. However, during the long, warm summer, when there is a need for solar protection, this results in a very poor microclimate at street level. The worst conditions are found in areas designated for low-rise houses where plots are very large and plot coverage low. Al-Hemaidi (2001) and Eben Saleh (2001) reported that current urban design in Saudi Arabia has led to an undesirable microclimate around buildings. They ex-plained this with the prescription of an extremely dispersed urban design where the provision of shade is totally lacking. The current urban form is characterized by gridiron plans with wide streets where the detached, low-rise “villa” is the most common type of house.
Despite these and other studies – such as Ali-Toudert and Mayer (2006, 2007), Berkovic et al. (2012) and Shashua-Bar et al. (2011) – have been re-cently conducted in hot dry climates, there is still a need to conduct studies that investigate the urban design from microclimatic and thermal comfort perspectives in the Middle East.

Chapter 1 Introduction
21
This study thus concerns the city of Damascus in the Syrian Arab Repub-lic. Damascus is a city where the current urban form is characterized by gridiron plans with wide streets and lack of shade as well as a limited amount of green areas, which negatively affect the microclimate and ther-mal comfort. The study is one of the first in Syria in the field of microclimate and thermal comfort in outdoor urban spaces that investigates the relation-ship between urban design and microclimate and studies the impact of ur-ban planning regulations on microclimate.
This study is mainly focused on residential streets as a part of urban de-sign and how the urban planning regulations affect the street spaces as well as the spaces between buildings. The street is one of the important urban components of a city’s physical structure and it acts as the physical inter-face between urban and architectural scales. The form of the street can climatically affect both outdoor and indoor environments in terms of solar gain in summer and winter, building surfaces absorption and reflection of solar radiation, wind speed and direction and its implication for building passive cooling systems and urban ventilation. Consequently, the shape of the street influences the outdoor thermal comfort – which in turn affects human health and well-being – as well as the energy use of buildings in the urban areas. Therefore, designing streets is essential for climate-conscious urban design (Ali-Toudert, 2005).
The study analyzes and examines the urban planning regulations from a microcilmate point of view by using simulations. In addition, micrometeo-rological measurements and structured interviews in different urban envi-ronments are carried out. Furthermore, an urban design proposal is studied in order to give an example of how urban microclimate and thermal com-fort can be applied in the urban design process and how urban planning regulations in Damascus affect the outdoor urban spaces. The study high-lights the importance of microclimate and thermal comfort in the planning and design processes and it provides useful insights that can mitigate the negative aspects of urban design on microclimate and thermal comfort in Damascus.
1.2 Aim, research questions and limitations
Aim and research questions This research is an attempt to develop further understanding of the rela-tionship between microclimate, thermal comfort, urban design and outdoor space users in the hot dry city of Damascus. This is done by studying the impact of urban regulations on microclimate in different urban design pat-terns in Damascus. This study also aims to investigate the behaviour of dif-ferent thermal comfort indices and defines the thermal comfort limits for Damascus in the summer and winter seasons. In addition, understanding how to apply the knowledge of urban microclimate and thermal comfort in the urban design process is also a part of the aim.
In order to fulfill the aim of the study, the following questions will be an-swered:

Towards better Urban Spaces Moohammed Wasim Yahia
22
1 What is the thermal impact of current urban planning regulations on mi-croclimate in Damascus city, especially at street level?
2 What are the microclimatic variations and spatial differences in different outdoor urban spaces in Damascus?
3 How do people perceive the thermal environment in Damascus? 4 What are the thermal comfort limits for Damascus in the summer and
winter seasons? 5 How can the urban design in Damascus be adapted to the microclimate
and outdoor thermal comfort?
Limitations of the study The study is limited to the hot dry city of Damascus, Syria. The conclusions of this study cannot be generalized for all hot dry cities since there are con-siderable variations between different cities in term of size, planning princi-ples, proximity to the sea, topography, etc.
In the simulation part, the study is limited to how urban design affects the microclimate and thermal comfort in outdoor residential streets since streets are the common urban spaces in Damascus. In addition, only resi-dential urban zones in Damascus were studied. In order to address the thermal problems in Damascus, the first simulations were conducted only in July since this month is the hottest during the summer according to me-teorological data from the Kharabo station (see Figure 2.7). For comple-mentary simulations, the winter was also taken into account and the month January was studied since it is the coldest month (see Figure 2.7). In this study, both east–west (E–W) and north–south (N–S) street orientations were investigated.
The fieldwork (micrometeorological measurements and structured in-terviews) was limited to residential streets, public parks, and outdoor resi-dential spaces between buildings in modern Damascus as well as in the old part of Damascus. The fieldwork was mainly conducted in the afternoons during both work days and holidays. Furthermore, the fieldwork was only carried out during the hot summer and the cold winter. Thus, spring and autumn were not included in the study.
Regarding the urban design patterns, only the aspects of microclimate and thermal comfort will be highlighted while other aspects such as phi-losophical, social, aesthetical aspects are not included in the discussion.
1.3 Structure of the thesis The thesis consists of six chapters and six appended papers. The first chap-ter presents the research problem, aim, research question and limitations. Chapter 2 includes a brief description of Damascus (the area studied), ur-banization in Damascus, master plan and urban planning regulations. In addition, Chapter 2 contains information about the climate in Damascus. Chapter 3 is a review of literature on urban microclimate and thermal com-fort in hot dry regions as well as urban planning regulations and urban de-sign in cities with hot dry climates. Chapter 4 presents the research meth-ods, which have been used in the study. Chapter 5 includes results and dis-cussion of the simulations, micrometeorological measurements, structured interviews, thermal comfort limits for Damascus and the application of these limits in urban design. Chapter 6 contains conclusions and proposi-

Chapter 1 Introduction
23
tions for the consideration of microclimate and thermal comfort in design of urban spaces. Chapter 6 also includes identification and suggestions for future studies.
The following papers are appended at the end of the thesis:
Paper 1 Influence of urban planning regulations on the microclimate in a hot dry climate – The example of Damascus, Syria. Paper 2 Evaluating the behaviour of different thermal indices by investi- gating various outdoor urban environments in the hot dry city of Damascus, Syria. Paper 3 Urban microclimate and thermal comfort in outdoor spaces in hot dry Damascus. Paper 4 The influence of environment on people’s thermal comfort in outdoor urban spaces in hot dry climates – The example of Damascus, Syria. Paper 5 Microclimate in hot dry Damascus: The influence of urban envi- ronment on human perception. Paper 6 Landscape interventions in improving thermal comfort in the hot dry city of Damascus, Syria – The example of residential spaces with detached buildings.

Towards better Urban Spaces Moohammed Wasim Yahia
24

25
2 The city of Damascus – the area studied
2.1 The city of Damascus Damascus is the capital and largest city of Syrian Arab Republic. It is located in the southwest of the country (Elevation: 620 meters, Latitude: 33.5° N, Longitude: 36.5° E). Damascus is the oldest continuously inhabited city in the world and it used to be fully surrounded by an oasis (Al Ghouta) (see Figure 1 in paper 2). The Barada River waters the oasis and Al Fijeh Spring provides the city with drinking water. The Ghouta oasis has been decreas-ing in size due to the rapid expansion of housing and industry in the city and it has become almost dry. It has also become polluted due to the city traffic as well as unplanned industrial and economic activities.
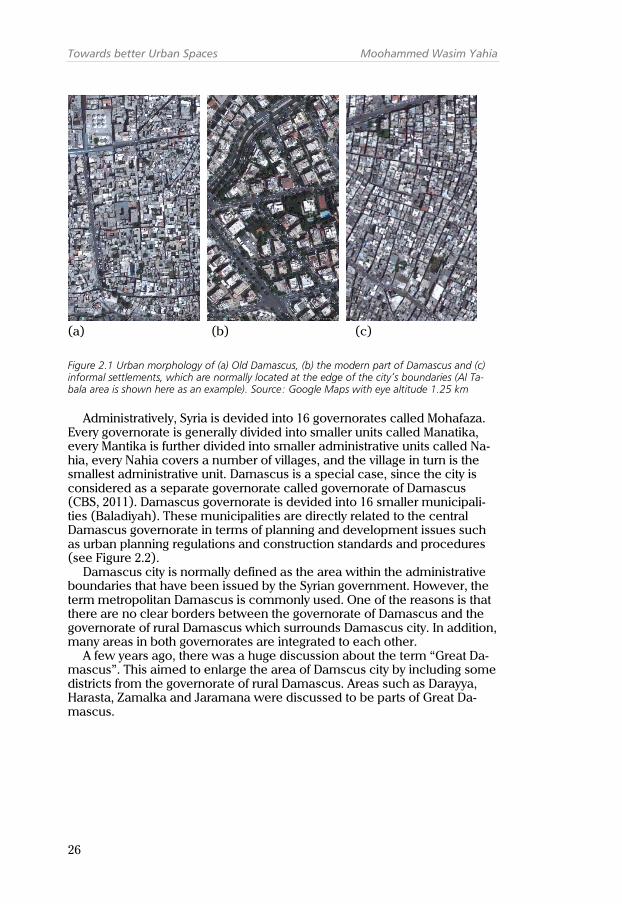
The formally planned Damascus has two main parts: Old Damascus and modern Damascus. Old Damascus has a regular planning in general, with streets oriented N–S and E–W (see Figure 2.1a). Most streets are narrow with deep canyons and projecting upper floors are common. The typical architectural style in Old Damascus has a simple expression from outside and rich decoration from inside with internal orientation to courtyards like in most vernacular architecture of old cities in the Islamic world (Behsh, 1993). This urban design came forth as a good response to the living condi-tions of both the natural and the social environment, based on age-old re-gional experience using local building materials and appropriate tech-niques of climate control (Bianca, 2000). Old Damascus’ buildings are made of local building materials such as stone, clay, wood, etc., whereas in the modern part of Damascus modern building materials, such as concrete, steel, glass, artificial or natural stone, etc., are used. As a consequence of the planning regulations, modern Damascus has mainly attached and de-tached buildings created according to detailed rules for spaces between buildings, setbacks, building heights, building footprints, projections, etc. Moreover, buildings are outwardly orientated (see Figure 2.1b).
In Damascus, there are also informal settlements, which are mainly lo-cated at the edge of the city’s boundaries. Areas such as Tabala and Dweila are examples of the informal settlements (see Figure 2.1c). Such sette-ments have attached buildings – with two, three and sometimes four stories – and deep canyons. Buildings have unfinished appearance and concrete, steel and glass construction materials are widely used in these areas. Build-ings are built based on conventional construction techniques without archi-tectural and engineering supervision. Therefore, they do not meet the offi-cial standards of the Damascus municipality in terms of regulations and construction procedures. However, the physical conditions of buildings are good since residents have managed to build dwellings that satisfy their ba-sic needs for living. They have also managed to achieve other needs such as ventilation and natural lighting (UN-Habitat, 2001).
Towards better Urban Spaces Moohammed Wasim Yahia
26
(a) (b) (c)
Figure 2.1 Urban morphology of (a) Old Damascus, (b) the modern part of Damascus and (c) informal settlements, which are normally located at the edge of the city’s boundaries (Al Ta-bala area is shown here as an example). Source: Google Maps with eye altitude 1.25 km
Administratively, Syria is devided into 16 governorates called Mohafaza. Every governorate is generally divided into smaller units called Manatika, every Mantika is further divided into smaller administrative units called Na-hia, every Nahia covers a number of villages, and the village in turn is the smallest administrative unit. Damascus is a special case, since the city is considered as a separate governorate called governorate of Damascus (CBS, 2011). Damascus governorate is devided into 16 smaller municipali-ties (Baladiyah). These municipalities are directly related to the central Damascus governorate in terms of planning and development issues such as urban planning regulations and construction standards and procedures (see Figure 2.2).
Damascus city is normally defined as the area within the administrative boundaries that have been issued by the Syrian government. However, the term metropolitan Damascus is commonly used. One of the reasons is that there are no clear borders between the governorate of Damascus and the governorate of rural Damascus which surrounds Damascus city. In addition, many areas in both governorates are integrated to each other.
A few years ago, there was a huge discussion about the term “Great Da-mascus”. This aimed to enlarge the area of Damscus city by including some districts from the governorate of rural Damascus. Areas such as Darayya, Harasta, Zamalka and Jaramana were discussed to be parts of Great Da-mascus.

Chapter 2 The city of Damascus
27
Figure 2.2 Simplified map of Damascus including the16 administrative municipalities in Damas-cus governorate. Source: Damascus municipality
2.2 Urbanization in Damascus Since 1970, Damascus – as the capital of Syria – has experienced great transformations in many aspects such as political, economical and social aspects. These transformations have led to a series of urban problems such as urban sprawl, informal settlements and unplanned districts. The result has created a larger city in size and population (see Figure 2.3 and Figure 2.6).
Between 1955 and 1980, the population of Damascus increased from 423,000 to 3 million. It is estimated at between four and five million (Library of Congress, 2005; Dorai, 2009; Wifstrand and Ria, 2009). According to the central bureau of statistics in Syria, the population of Damascus city in 2011 was 1.78 million whereas the population of rural Damascus was about 2.74 million (CBS, 2011) (Figure 2.4 shows the difference in size between Da-mascus and rural Damascus). Thus, the total population in urban and rural Damascus was about 4.5 million. Between 1981 and 1994, the total popula-tion of Damascus increased by 67% (UN-Habitat, 2001).
Most of the population increase has taken place in the informal settle-ments that are located at the edge of the city’s boundaries such as Al Taba-la settlement (see Figure 2.1). In 2001, it was estimated that 40% of the population in Damascus lived in informal settlements (UN-Habitat, 2001). In Damascus, there are about 50 documented informal settlements around the city, representing 27.5% of the total land area of Damascus. These 50 informal spots house more than 46.5% of Damascus population (Khdour and Kafa, 2009).

Towards better Urban Spaces Moohammed Wasim Yahia
28
Figure 2.3 Population growth in Damascus per annum, by district in Damascus 1981-2000. Source: El-Ibrahim (2001)
Figure 2.4 The difference in size between Damascus and rural Damascus governorates where the red zone is rural Damascus, which surrounds the city of Damascus. Source: Syrian ministry of tourism
The rapid urbanization in Damascus was also due to the rural–urban mi-gration in addition to the transformations mentioned above. Damascus has also been a place of refuge for stateless Kurds, as well as large numbers of Palestinian refugees, Iraqis, alongside with economic migrants from other Arab states, including Egypt and Yemen. In general, immigrants and refu-gees have settled in the outskirts of the city on publicly or privately owned agricultural land that has not included in urban development plans. This ac-tion has led to a rapid growth of informal settlements that are located even outside Damascus city center boundaries. These areas are characterized by high population densities that have rapidly increased over time (see Table 2.1) and display a variety of problems including environmental degradation, the spread of epidemics, rising crime and social unrest, loss of agricultural

Chapter 2 The city of Damascus
29
land, hazardous/chaotic building methods along with unemployment and low-income levels (UN-Habitat, 2001; Khdour and Kafa, 2009).
Table 2.1 Population densities in urban and rural Damascus in the years 1970, 1981, 1994 and 2004 (persons/km2). Source: CBS (2004)
Population density persons/km2 Year1970 Year 1981 Year 1994 Year 2004
Damascus City 7,090 10,593 11,813 13,152 Rural Damascus 37 51 93 125
2.3 City development and urban planning regulations in Damascus Over the centuries, Damascus has been growing out of its old boundaries. The main two directions for expansion were towards the south and north-west. The southern expansion was mainly because this direction was the main road of the holy hajj to Mecca. Under Islamic rule, Damascus became a major meeting point for caravans of pilgrims undertaking the holy hajj to Mecca. The historical development of Damascus during the Roman, Seljuq and Ayyubid, Mamluk and Ottoman ages is shown in Figure 2.5.
Figure 2.5 The historical development of Damas-cus during the Roman empire age (64 BC- 653 AD) and the Islamic Arab era especially the Seljuq and Ayyubid (1154-1260), Mamluk (1260-1516) and Ottoman ages (1516-1918). Source: Al-Qattan (2002)

Towards better Urban Spaces Moohammed Wasim Yahia
30
The approach to urban design changed radically during the French co-lonial period (1920–45). New areas were built with wide streets in a grid pattern and buildings were outwardly oriented (Al-Kodmany, 1999). The city growth from 1938 to 1994 is shown in Figure 2.6.
Figure 2.6 The cirty growth from 1938 to 1994 where the black hatch is the urbanization in 1938, bleu hatch is the urbanization in 1960 and the yellow hatch is the urbanization in 1994. Source: El- Ibrahim (2001)
During the 1950s, it was necessary to develop a master plan for Damas-cus. The first attempt was by an Austrian company in 1957 and the second one started in 1963 by the French architect Michel Ecochar. In 1968 Ecochar presented the new master plan for Damascus and a few years earlier he had developed new urban planning regulations for the city; these regula-tions determined the urban form in Damascus during a period of 20 years (1965–1985). Ecochar’s master plan and urban planning regulations have been the basis for all updated versions after 1985. This master plan mainly aimed to control and direct Damascus’s population growth, protect the Al Ghouta oasis from urban sprawl, ease traffic congestion and promote transport connections with neighbouring countries and towns (Wifstrand and Ria, 2009). On the other hand, Ecochard’s master plan could hardly have the tools to imagine the transportation or environmental issues that the city is facing today (Juvara, 2012). Municipal authorities have however never really ensured that Damascus’ expansion followed Ecochard’s master plan (Lababedi, 2009), and over decades, urban growth has spread over the Al Ghouta oasis exerting huge stress on water supplies (Lababedi, 2009; IRIN, 2006). Yet, there is no clear vision on the ground about how to build, what to build and where to build (Juvara, 2012).

Chapter 2 The city of Damascus
31
2.4 Existing urban planning regulations in Damascus In 1993, a special committee from the Syrian Syndicate of Engineers and Damascus Municipality was created in order to study, develop and com-plete the urban planning regulations for Damascus. The latest regulations were issued by Damascus Municipality in 1997 (Damascus Municipality, 1997) and they were ratified by the Syrian Ministry of Housing and Construc-tion in the same year. The urban planning regulations in Damascus are the essential documents for regulating urban development and construction issues in the city. Literally translated from Arabic, the name of this docu-ment is Construction Regulations for the City of Damascus (Damascus Mu-nicipality, 1997).
The first part of the existing regulations contains special conditions about administrative procedures concerning building permit, public roads and protection procedures during the construction process such as fire and safety protection. The second part contains rules regarding building heights, projections, partitions and barriers between the plots, ventilation and illu-mination shafts, residential and commercial units and components, com-mon facilities such as stairs and corridors, architectural elevations, roof forms as well as regulations for setbacks, and parking. The third part con-tains special regulations regarding maximum floor area ratio (FAR) which is calculated as the total floor area of the building divided by the total area of the plot. The third part also contains regulations about the basement con-struction in case of sloping plots, regulations for small apartments in the commercial areas, temporary building conditions, and fire protection. The fourth part which deals with urban zones for Damascus contains regula-tions on minimum plot sizes, minimum plot frontages, minimum setbacks, maximum building heights, maximum plot coverage (building footprints), maximum projections, etc (see Table 1 and Figure 2 in Paper1). In addition, these regulations determine the division of Damascus into urban land use zones. Damascus is divided into 14 zones of different land use including ag-ricultural, administrative, industrial, residential, and comercial activities. The urban zones that deal with residential areas – planned residential area (PRA) and inhabited rural area (IRA) – are described in Paper 1. Parts 5, 6 and 7 contain, respectively, general information about hospitals as well as electrical and mechanical installations. There are also two appendices, the first one is about urban planning regulations for Old Damascus, and the second is about heating systems and cold water generation for cooling.
In 2009, the municipal authorities commissioned a number of planning studies to create a new master plan and to update the urban regulations for Damascus. This attempt – which was driven by the Consultant Company Khatib & Alami – is still confidential and perhaps will never even be pub-lished (Juvara, 2012). The main aim of this new master plan was to provide strategic planning for urban and population growth, saving the identity of Damascus and redefining the structure of the city (Juvara, 2012).
These efforts to draft a new, comprehensive master plan seem to be ob-structed by a lack of coordination between different authorities such as the Ministry of Local Administration (MoLA) and the governorates of Damascus City and Rural Damascus (Hashimoto, 2009).

Towards better Urban Spaces Moohammed Wasim Yahia
32
2.5 Climate of Damascus Climatic data for temperature and relative humidity in Damascus are shown in Figure 2.7. Damascus has hot sunny summers and cold winters. Summer temperatures can exceed 40 °C during the day, but evenings are generally cool. The summer season lasts from May to September. The hottest month of the year is July, with an average high of 36 °C and low of 18 °C. The win-ter season lasts from December to February. The coldest month of the year is January, with an average low of 2.5 °C and high of 12 °C. In winter, tem-peratures can reach 0 °C during the night and snow fall is usual one or two times per year. Spring and autumn are the most comfortable periods, with an average of 22 °C during the day (see Figure 2.7).
Regarding global solar radiation, the yearly maximum average values of global solar radiation at 12:00 occur in June (1017 Wh/m2) and July (1020 Wh/m2) whereas the yearly minimum average values at 12:00 occur in De-cember (446 Wh/m2) and January (505 Wh/m2), (see Figure 2.8 for the months July and December).
The relative humidity typically ranges from 14% (in the afternoon in summer) to 96% (in the morning in winter). The average monthly relative humidity is shown in Figure 2.7).
Over the year, the typical wind speeds vary from 0 to 5 m/s (calm to fresh breeze) and the prevailing wind direction is most often from the south west. Rarely, the wind speed can exceed 10 m/s (strong breeze). The high-est average wind speeds of 5 m/s typically occur in July and the lowest av-erage wind speeds of 2 m/s (light breeze) typically occur around Novem-ber.
Rainfall mainly occurs in winter with a yearly average of 118 mm of pre-cipitation falling whereas during the driest months in June and July, the rain fall may be as low as 3 mm.
Figure 2.7 Climatic data for Damascus (average values of maximum temperatures, minmum temperatures and relative humidity for the period 1961–90). Source: Damascus airport mete-orological station

Chapter 2 The city of Damascus
33
Figure 2.8 Climatic data for Damascus (average values of global solar radiation of the months July and December for the period (1971– 1980). Source: Meteonorm 6.0 (meteonorm.com)

Towards better Urban Spaces Moohammed Wasim Yahia
34

35
3 Literature review This chapter contains a literature review of the central topics of this thesis. The first section lists a set of fundamental books in the topics of urban cli-mate, climatic design and thermal comfort whereas the second section re-views the literature that studies the microclimate and thermal comfort in hot dry regions. The third section discusses literature about urban planning regulations and climate, whereas the fourth section is conclusions.
3.1 Urban climate, climatic design and thermal comfort The first three fundamental books discuss climatic design and thermal comfort mainly for indoor climate and the issue of microclimate and out-door thermal comfort is less discussed. The last five books focus more on the urban level than on buildings.
In Design with climate – bioclimatic approach to architectural regional-ism, written by Victor Olgyay in 1963, the author endeavors to show the in-fluence of climate on building principles. It contains three main parts. The book discusses the climatic approach at building level, the interpretation of climate knowledge in architectural principles, and it also talks about the applications on planning level as well as on architectural level. The book has useful bioclimatic approaches, but it does not discuss the influence of urban planning on outdoor thermal comfort and how this can affect the ap-plications on planning and architectural levels in terms of thermal comfort.
The Manual of tropical housing and building – Part 1: climatic design was written by Koenigsberger et al. in 1974. It serves as a reference work for practitioners and as a guide for developers, architects, and designers. The book discusses the theory of climatic design and how practical solutions are derived from theoretical understanding. It contains a discussion about climate and comfort, principles of climatic design, means of thermal con-trol, light and lighting, noise and noise control, applications, and design aids. The book has very useful information about climate and thermal com-fort on building level, but it does not give close attention to the relationship between indoor thermal comfort and outdoor climate and how urban mi-croclimates can affect the building design.
In 1980, Martin Evans wrote the book Housing, climate and comfort. The book starts by guiding the reader in the use of meteorological data and by showing the relationship between climate and thermal comfort. The book thus provides useful advice on such matters as site selection and type of construction. It also discusses how individual solutions in design of particu-lar buildings can be applied together into a coherent overall scheme. The book discusses the relationship between outdoors and indoors, but the ap-plications of this book mainly focus on indoors rather than outdoor envi-ronment.
One of the essential sources – that discusses the nature of the atmos-phere near the ground – is the book Boundary layer climates, which was written by T. R. Oke (1987). This book discusses the atmospheric system and the topic of natural atmospheric environments and concentrates then
Towards better Urban Spaces Moohammed Wasim Yahia
36
on the effects upon the exchanges of energy, mass and momentum. The book discusses the topic of man-modified atmospheric environments and shows the consequences of human interference in otherwise natural cli-matic systems. Although the book investigates only partly the relationship between climate and urban areas (part three), it provides very useful in-sights for architects and urban designers to understand such relationships especially the climate modification by buildings (airflow around buildings), and climate modification by urban areas. However, the book presents the information from a climatologic point of view and not from an urban design or urban planning point of view.
In Climate considerations in building and urban design, written by Ba-ruch Givoni in 1998, the author discusses the relationship between building, design and the climate. The first part of this book is about building clima-tology, indoor climate and comfort, thermal performance of buildings, and passive buildings. The second part is about urban climatology. This part of the book discusses the impact of urban design and green areas on urban climate. The third part discusses the topic of building and urban design guidelines for the hot dry, hot humid and cold climates. Regarding the hot dry climate, the book discusses the characteristics of hot dry regions, com-fort and energy use in buildings, building materials, and urban design. Al-though the book widely discusses the relationship between urban design and climate, it does not discuss the topic of outdoor thermal comfort in de-tail. In addition, the issue of climate in the book mainly treats architectural design and focuses less on outdoor urban spaces.
An urban approach to climate-sensitive design is a book that was written by M. Rohinton Emmanuel in 2005. The book focuses on design strategies that can minimize the negative effect of urban microclimate in the tropics. It discusses the phenomenon of the Urban Heat Island (UHI) and mitigation strategies, thermal comfort in the urban tropics, and climate-conscious ur-ban design in the tropical urban outdoors. In addition, the book discusses the applications of urban design strategies and how to enhance the quality of urban environment in the tropics. The book develops the concept of shadow umbrella for radiation reduction in the outdoors during the day. This concept addresses two issues: the creation of shaded urban spaces that have direct bearing on outdoor thermal comfort, and determining the location for bodies of water such as fountains, lakes, and pools. The funda-mental step to achieve the shadow umbrella is to establish the shadow an-gles by studying the date of the year, the time of the day, the location, and the building and site orientation and dimensions. However, this book main-ly focuses on the warm humid tropics and does not take other climates, such as the hot dry climate, into account. Furthermore, the concept of sha-dow umbrella depends on a theoretical analysis and was not tested in prac-tice.
In Designing high-density cities for social & environmental sustainability, edited by Edward Ng in 2010, many experts from different disciplines were invited to share their experiences and opinions about the issue of how to design high density cities. The book focuses on the socio-environmental dimension of the high density cities. Among the discussed aspects, the book deals with climatic design as one of the important issues in designing the high density cities. In general, many studies in the book focus on Hong Kong as an example of subtropical climate. However, other case studies – such as Kassel, Frankfurt, Singapore, Indonesia and Thailand – are dis-cussed. The book has four main parts. The first part is about how to under-
Chapter 3 Literature review
37
stand the term high density and urban sustainability. The second part is about climate and high density design. The third part is about environmen-tal aspects of high density design whereas the fourth part is about high den-sity spaces and living. Regarding the climate part, the book discusses the following topics: urbanization and city climate especially the urban heat isl-and, urban climate in dense cities, urban climatic maps and planning, thermal comfort issues and implications in high density cities, human com-fort and the diversity of the urban environment, urban ventilation, and day-lighting design. Although the book highlights the importance of climatic de-sign and thermal comfort for high density cities and gives useful advice in urban design and planning, the subtropical climate and partly the cold cli-mate dominate and the hot dry climate is not deeply discussed.
Urban microclimate which was written by Evyatar et al. in 2011 is one of the first books that focus entirely on urban microclimate and outdoor ther-mal comfort. The book tries to bridge the gap between climatology re-search and applied urban design. This book also tries to provide architects and urban designers with an understanding of how the physical structure of the built environment at all scales affects microclimatic conditions in terms of the spaces between buildings. Moreover, it analyzes the interaction be-tween microclimate and each of the elements of the urban landscape. The book provides useful insights about the scale of urban climate, urban ener-gy balance, the urban heat island, urban airflow, human energy balance in an urban space, thermal preferences, and climate applications in urban planning and design. It also discusses the microclimate design strategies in urban space, the use of vegetation, linear space, and urban microclimate modeling. However, the book focuses more on urban microclimate than outdoor thermal comfort. For example, the subjective thermal sensation is not deeply discussed.
Concluding remarks The discussion of the listed books shows that the interest in urban micro-climate and thermal comfort has increased the latest decades. Most of the listed books discuss the climate and thermal comfort. However, the books of Olgyay, Koenigsberger, and Evans mainly focus on indoor climate and comfort and they deal with how to design buildings in different climates. They have limited information about microclimate and outdoor thermal comfort. Generally, the books of Oke, Emmanuel, Ng, Evyatar et al., and Givoni (to some extent) focus on the urban level rather than buildings. Spe-cifically, the books of Emmanuel (2005), Ng (2010) and Evyatar et al. (2011) deal with microclimates as well as thermal comfort at the urban level.
3.2 Urban microclimate and outdoor thermal comfort in hot dry climates Previous studies on urban microclimate and thermal comfort in outdoor urban spaces have focused on various climates. Several researchers have studied cold climates (e.g. Nikolopoulou et al., 2001; Thorsson et al., 2004; Eliasson et al., 2007; Katzschner and Thorsson, 2009; Kántor et al., 2012b). Some others have conducted research in warm humid climates (e.g. Em-manuel et al., 2007; Lin, 2009; Makaremi et al., 2012). Some others have studied subtropical climates (e.g. Spagnolo and de Dear, 2003; Chen and

Towards better Urban Spaces Moohammed Wasim Yahia
38
Ng, 2012; Lau and Ng, 2013). Others have studied temperate climates (e.g. Thorsson et al., 2007; Andrade et al., 2011). Some others have done studies in hot dry climates (e.g. Bourbia and Awbi, 2004; Ali-Toudert and Mayer, 2006; Johansson, 2006a; Pearlmutter et al., 2006 and 2007; Djenane et al., 2008; Al Jawabra and Nikolopoulou, 2009; Fahmy and Sharples, 2009; Sha-shua-Bar et al., 2011; Mahmoud, 2011; Berkovic et al., 2012 and Hedquist and Brazel, 2014). The reviewed literature below regards hot dry climates.
Bourbia and Awbi (2004a and 2004b) discuss the building cluster and shading in an urban canyon in the hot dry climate of the city El-Oued in Al-geria. It is a microclimate study which was carried out by conducting a measurement study of air and surface temperatures as well as a shading simulation study by using the Shadowpack PC code version 2 (Beckham 1980). The authors examined the influence of H/W ratio – i.e. the ratio of building height (H) to street width (W) – and sky view factor (SVF) of street design on microclimate and especially the air temperature and surface temperature. The study argues that there is a strong correlation between decreasing SVF and decreasing surface temperature but only weak correla-tion between decreasing SVF and decreasing air temperature. Regarding the simulation study, the authors conclude that a number of useful relation-ships can be developed between the geometry and the microclimate of ur-ban street canyons and these relationships are very helpful for professionals developing urban design guidelines for the street dimensions and orienta-tions. However, the study only examined the air temperature and surface temperature and no other climatic parameters were measured such as so-lar radiation, wind speed, and relative humidity. Consequently, thermal comfort was not included in the study, and neither were interviews nor questionnaires to assess people’s thermal sensation.
Ali-Toudert and Mayer (2006) conducted a simulation study on the ef-fects of aspect ratio (or height to width ratio, H/W) and orientation of urban street canyons on outdoor thermal comfort in the hot dry climate of Ghar-daia, Algeria. The study was carried out by using the ENVI-met simulation program. The results show contrasting patterns of thermal comfort between shallow and deep urban canyons as well as between various orientations studied. It also concludes that thermal comfort is very difficult to reach pas-sively in extremely hot and dry climates, but that improvement is possible; the air temperature slightly decreases when the aspect ratio increases, but the radiation fluxes expressed by the mean radiant temperature are by far more decisive. Thus in summer time, the thermal comfort improves when H/W ratio increases. However, the simulations were only run for a typical summer day and the winter time was not taken into account in the thermal comfort analysis.
Johansson (2006a) studied the influence of urban geometry on outdoor thermal comfort in the hot dry climate of Fez, Morocco. The study was based on measurements during summer and winter. The study compared a deep and shallow street canyon regarding microclimate and thermal com-fort. The study argued that in summer the deep canyon is fairly comfortable whereas the shallow is extremely uncomfortable. On the other hand, the winter results show the opposite. The study concluded that for the hot dry climate, the compact urban design with deep canyons is preferable but for the winter in Fez, the urban design should include some wider streets or open spaces in order to provide solar access. However, the study was only based on measurements and did not include a questionnaire study about the subjective thermal perceptions. Moreover, the Physiological Equivalent

Chapter 3 Literature review
39
Temperature index (PET) – see Chapter 4 – was the only calculated index to analyze the results and no other indices have been investigated in order to test the validity of these results.
Pearlmutter et al. (2007) constructed an open air scale model to quantify radiation on pedestrians and convective energy exchange in street canyons of varying geometry as well as surface-atmosphere energy exchange above the urban canopy. The results indicate that in a hot arid climate, the deep canyons which have north–south orientation can reduce overall pedestrian thermal discomfort, while in east–west oriented canyons the effect of street proportions (H/W ratio) is much less pronounced. However, this study does not represent the real urban canyons since it was conducted in an open air model and not in real city canyons, which normally have irregular building heights, different roof forms, and different materials in the façades such as concrete, glass, etc. The author calculated the Index of Thermal Stress (ITS) (Givoni, 1976). Using ITS makes the results difficult to compare with other studies since this index it is not commonly used.
Djenane et al. (2008) investigated the microclimatic behaviour of urban forms in the hot dry city of Béni-Isguen located in the M’zab Valley region, Algeria. The aim of the study was to approach the interaction between the climatic constraints and the solutions adapted in terms of land use and ur-ban morphology in the streets. The study was based on practical microcli-matic measurements during the summer. The study was conducted in four different morphological areas which varied between high and low urban density with H/W ratios between 1.6 and 9.7 and with plot coverage be-tween 10% and 87%. The authors demonstrate the importance of morpho-logical characteristics of the urban tissue in the hot dry climate. They also show that the thermal behaviour at the street level is related both to the so-lar exposure and the wind speed effect; i.e.high H/W ratio leads to lower air temperature and wind speed. Moreover, the streets’ overheating during the day is strongly affected by heat dissipation the previous night. However, the study was conducted only in the summer time and no measurements were conducted during the winter. The results were only based on air tempera-tures and wind speed and the study did not examine the effect of urban form on solar radiation, mean radiant temperature, or thermal comfort.
Al Jawabra and Nikolopoulou (2009) studied the outdoor thermal com-fort and the effect of socio-economic background and cultural differences in the hot dry climate of Marrakech in North Africa and Phoenix in North America. The authors aimed to develop better understanding of the com-plex relationship between microclimate and human behaviour in outdoor urban spaces in a hot arid climate. Microclimatic measurements and ques-tionnaire surveys were carried out on two sites in Marrakech and three in Phoenix. The authors argue that particularly in the summer the number of people and activities outdoors are influenced by the solar radiation. And people from different social backgrounds in hot arid climates have different approaches to the use of outdoor spaces. The study also concludes that the design is an important tool that can significantly improve microclimatic conditions in the specific climatic context. However, the study only calcu-lated the Predicted Mean Vote (PMV) index and did not investigate the be-haviour of other thermal indices.
Fahmy and Sharples (2009) investigated outdoor thermal comfort for dif-ferent urban forms in the hot dry city of Cairo. The study focused mainly on courtyards and urban canyons derived from urban planning regulations in Cairo. Numerical simulations were performed during one day (6 hours from

Towards better Urban Spaces Moohammed Wasim Yahia
40
11 to 16 local time) of the hot summer in Cairo (the day 26th of June was studied). Outdoor thermal comfort expressed as the PMV index was calcu-lated at nine spots representing different urban geometries and green struc-tures. The study showed examples of more acceptable thermal comfort conditions for some orientations and degrees of urban compactness due to the clustered form with vegetation and wind flow through canyons. How-ever, the simulations were not calibrated through micrometeorological measurements. In addition, the study does not represent the summer sea-son since only one day of the hot summer (26th of June) was investigated to study the maximum values of outdoor thermal comfort. Regarding the thermal comfort index, the results were based on PMV calculations which showed very high PMV values (PMV was between 3 and 7, mostly above the normal scale of PMV for outdoors where +3 equals hot and +4 equals very hot). The authors argued that such high PMV values were due to the simu-lation critical day of the hot dry summer of Cairo, and due to the overesti-mation of the global radiation in ENVI-met. No other thermal comfort indic-es – such as PET and OUT_SET* (see Section 4.4) – were investigated to compare with other studies.
Bourbia and Boucheriba (2010) assessed the impact of geometry on mi-croclimate in Constantine, Algeria during the summer time. A series of site measurements (air and surface temperatures) were conducted on seven sites for which the H/W ratios varied between 1 and 4.8 and the sky view factor between 0.076 and 0.58. The measurements were performed during the month of July 2007 which represents the hottest period. These mea-surements were carried out simultaneously over a two weeks period. Dur-ing the night, the study indicated an air temperature difference of about 3–6 °C between the urban areas and their surrounding rural environments. The authors argued that this difference in temperature is mainly due to the sur-face materials, which contain a high percentage of nonreflective surfaces (low albedo), water resistant surfaces and nonexistence of vegetation. These surfaces tend to have high heat capacities, and are therefore efficient at absorbing and reradiating the sun energy after the sunset. The authors reported that the larger the sky view factor, the higher the air temperatures during the night. Moreover, the higher the H/W ratio, the lower the recorded air and surface temperatures. Although this study illustrated the impact of UHI in urban environment, the study was only conducted during one sea-son (summer time). Furthermore, the study did not calculate the mean ra-diant temperatures and did not use any thermal index to assess the outdoor thermal environment.
Shashua-Bar et al. (2011) studied the influence of trees and grass on hu-man thermal stress in a hot arid climate. The Index of Thermal Stress (ITS) was calculated in order to evaluate thermal comfort in the different spaces. The efficiency of water use in providing improved comfort was gauged for each of the vegetative landscaping treatments by comparing the total eva-potranspiration with the reduction in thermal stress. The study found that with shading, either by trees or mesh, discomfort was reduced when the shading was placed above paving. When combined with grass, both shad-ing mechanisms yielded comfortable conditions at all hours. The study ar-gued that the effect of trees was more pronounced than that of the mesh. However, the study was only conducted during the summer time (August) and did not take into account the influence of vegetation on human thermal comfort in winter. Furthermore, the authors used ITS to assess the thermal

Chapter 3 Literature review
41
stress. Thus, it is hard to compare the results with other studies because this index is not widely used.
Mahmoud (2011) investigated people’s thermal comfort in an urban park in the hot arid city Cairo, Egypt, during the summer and winter seasons us-ing field measurements and questionnaires. PET index – see Chapter 4 – was calculated in each measurement spot (nine spots in the park were studied). The study argues that differences in the PET index among these spots are due to different sky view factors (SVF) as well as wind speed. It also reveals an alteration in human comfort sensation between different landscape zones. The study found that the comfort range of PET for the ur-ban parks in Cairo is 22–30 °C in summer and 21–29 °C in winter. However, this study was only based on calculating the PET index which does not take clothing and activities into account as variables (see Chapter 4). Since PET is independent of clothing and activity, it is not an absolute measure of thermal strain or comfort but it is a tool to assess the thermal environment (Höppe, 2000). In addition, this study was only conducted in an urban park and not in all types of urban spaces in Cairo. Therefore, the thermal comfort range which was found in the study is valid only for urban parks and it is difficult to generalize the results for other types of urban spaces in Cairo.
Berkovic et al. (2012) studied thermal comfort in courtyards in a hot dry climate. The study focused on three different courtyards surrounded by a 9 m high and 12 m wide building. The study was conducted for the hours 11- 17 local time and only the month of June was investigated. The study was based on simulations and ENVI-met was used as a tool for investigation. The thermal comfort in courtyards – at pedestrian level 2 m above ground level – was evaluated by calculating the modified PMV index, i.e. the scale of PMV which is between –4 (very cold) and +4 (very hot) for outdoors (Jendritzky and Nübler, 1981). The results showed that the thermal comfort during the hot summer mainly depended on solar radiation. Thus, shading in hot dry climates has the major role in improving the thermal comfort, while the contribution of wind under all configurations studied is limited and much smaller than the shade contribution. On the other hand, the amount of shade is mainly affected by the courtyard orientation, and ex-tended east–west rectangular courtyards received less shade. They were therefore the most stressful. The authors also argue that the thermal com-fort is significantly improved by adding trees and/or galleries to the closed courtyard. However, the study mainly focused on courtyards and other ur-ban morphologies such as canyons and detached buildings were not in-cluded in the study. In addition, the study was mainly based on simulations and neither meteorological measurements nor questionnaires or structured inteviews – which investigate the actual thermal sensation for people – were conducted. Moreover, only the summer season was studied and other seasons such as the winter were not taken into account. Furthermore, the investigation of thermal comfort was based on the PMV index and no other indices such as PET and OUT_SET* were investigated.
Hedquist and Brazel (2014) investigated the seasonal variability of tem-peratures and outdoor thermal comfort in the hot arid climate of Phoenix, Arizona. The study was based on simulations using ENVI-met and three dif-ferent urban morphologies within an area of 14 km × 6 km were studied. The four seasons in the years 2007 and 2008 were investigated (24 hours of simulations for one day of every season). The selection of the seasonal pe-riods was based on the days which had low wind speeds (an average of < 2 m/s) and clear skies. This was mainly to match the 24 hours of field mea-

Towards better Urban Spaces Moohammed Wasim Yahia
42
surements in 2008. The authors argue that selecting the days with such sta-ble weather conditions allows for a good comparison between the sites when analyzing the UHI magnitude and temperature differences. The PMV thermal comfort index was calculated and presented as thermal comfort maps at 14:00 and 22:00 local time. The authors showed the effect of shade on the air and surface temperatures in the early afternoon in all seasons. The results illustrate that the areas in downtown – with high building densi-ties and narrow street canyons – are more comfortable during the early part of the day (cool island) and they are less comfortable than the surrounding areas from the mid afternoon until the evenings (heat island). On the other hand, the agricultural open fields outside the downtown are uncomfortable during the daytime and more comfortable in the evenings. The authors ar-gued that increasing the shade by adding vegetation and permeable surfac-es will positively affect the outdoor thermal comfort. In winter, the results showed that in areas with high building densities and deep canyons, the thermal situation was slightly less comfortable than the open landsapces. The authors thus argue that the adaptation through choosing suitable cloth-ing in winter makes it possible to increase the level of thermal comfort out-doors. However, the investigation of outdoor thermal comfort was mainly based on the PMV index and no other indices such as PET and OUT_SET* were investigated. Athough the authors argue that the use of vegetation has a large potential for reducing thermal stress and increasing the level of thermal comfort in the outdoors, the study did not show examples of the effect of vegetation and landscape elements such as shading devices to be used for thermal comfort purposes.
Concluding remarks The review shows that the microclimate and thermal comfort in hot dry re-gions have been studied in different ways and have provided useful insights to the field. However, several of these studies investigated microclimate and thermal comfort only during the summer time (e.g. Djenane et al., 2008; Fahmy and Sharples, 2009; Bourbia and Boucheriba, 2010; Berkovic et al., 2012). Some studies on thermal comfort were based only on field measurements and no questionnaires or structured interviews – about the actual thermal sensation of people – were done (e.g. Johansson, 2006a; Pearlmutter et al., 2007). Most studies used only one thermal index (e.g. Al Jawabra and Nikolopoulou, 2009; Pearlmutter et al., 2007; Shashua-Bar et al., 2011; Berkovic et al., 2012; Hedquist and Brazel, 2014). Others have in-vestigated microclimate and thermal comfort in only one type of urban en-vironment, e.g. an urban park (e.g. Mahmoud, 2011). Some others con-ducted pure simulation studies (e.g. Ali-Toudert and Mayer, 2006; Fahmy and Sharples, 2009; Berkovic et al., 2012). Hence, there is no study in the hot dry climate that investigates microclimate and thermal comfort based on field measurements and thermal comfort survey, i.e. through question-naires or structured interviews, during both the summer and winter seasons for different types of urban design and that calculates different thermal in-dices in order to compare with other studies. In addition, there are only a few studies (e.g. Ali-Toudert, 2005; Fahmy and Sharples, 2009), which deal with the relationship between urban design and outdoor thermal comfort. Thus, this review shows that there is still a need for in-depth research in the field of microclimate and thermal comfort in hot dry regions.
Chapter 3 Literature review
43
3.3 Urban planning regulations and climate Salehi (2007) claims that “composing urban codes and regulations is a means of achieving the goals of sustainable development and ensure the formation of sustainable residency”. Yet, there are no in-depth studies about urban planning regulations and microclimate. A few studies in differ-ent climates have however highlighted the importance of these regulations for the city development.
Al Hemaidi (2001) studied the urban fabric in Riyadh, Saudi Arabia from cultural and climatic perspectives in connection with the current urban planning regulations that have been imported to the country. The author reported that these regulations relate neither to the traditional built environ-ment and culture nor to the local microclimate in Riyadh city. Cultural and climatic problems have emerged because of these urban regulations. In or-der to establish the future urban planning regulations in harmony with cli-mate and culture, the author claimed that the dwellings’ inward orientation, courtyards, and the high parapets are examples for planning principles de-rived from the culture. The narrow streets, buildings without setbacks, building materials such as clay and stone and light colors are also planning principles and guidelines that respond to the local climate in traditional built environment of Riyadh, Saudi Arabia. But, the study mainly dealt with theoretical concepts based on a qualitative analysis about the climatic ef-fect, and the assumptions were not proved by measurements. On the other hand, the study focused on the negative aspects of the imported urban reg-ulations. However, it did not give examples of how we could improve the thermal environment in the existing areas that were constructed according to the imported urban regulations.
Baker et al. (2002) discussed the mitigation of the urban heat island in the hot dry climate of Phoenix, Arizona. The authors highlighted the impor-tance of the urban planning and design policy to be redesigned in order to mitigate the urban warming. In addition, the study suggested a set of rec-ommendations derived from the City of Phoenix General Plan’s Goal 7, i.e. the strategies, policies and recommendations, which have been developed to explore and mitigate the urban heat island in Phoenix. The study pro-vided recommendations about encouraging the planting of mature trees. However, these recommendations may not be easy to achieve in other hot dry climates due to the lack of water for irrigation.The study suggested only recommendations about mitigating the heat and solar radiation but it did not take into account other climatic parameters that affect thermal comfort and the human body such as wind speed and Mean Radiant Temperature (MRT).
Grazziotin et al. (2004) developed the CityZoom 3D simulation program as a tool for evaluating the impact of urban regulations. It helps to generate large sets of buildings in different urban scenarios by applying urban regula-tions on the plot geometry according to input parameters that determine the building characteristics such as the number of floors, setbacks, plot coverage, building height, etc. It also addresses environmental comfort is-sues such as sunshine access and shading visualization. However, this tool is limited only for the visualization of urban regulations and not for a deep microclimatic analysis regarding thermal comfort, mean radiant tempera-ture, and wind speed and direction.

Towards better Urban Spaces Moohammed Wasim Yahia
44
Kakon et al. (2010) investigated the effect of building height on outdoor thermal comfort in the tropical climate of Dhaka, Bangladesh. The authors focused on the building height as an important parameter in urban design and planning regulations in the city development. Thermal comfort was as-sessed by Temperature-Humidity-Index (THI) which uses air Temperature (Ta) and Relative Humidity (RH). The study showed that the air tempera-ture decreased to some extent in the canyon by increasing building height. Results showed that in the case of an existing canyon with an average building height of 4-5 stories and H/W ratio of 0.47, the thermal situation was less comfortable than the case of a proposed canyon with increased building height to 8-10 stories and H/W ratio of 0.86. For the proposed can-yon, the authors found that the increased building height provided compa-ratively more comfortable conditions than the existing case during day time (the temperature dropped from 35 °C to 34 °C). The study concluded that the policy to increase the building height could provide a better thermal microclimate in cities. The conclusions of the study were depending on both measurements and simulations. However, the measurements were only conducted during one summer day and no winter measurements were conducted. In addition, the study was only performed in one specific area in the city of Dhaka and did not study other types of urban morpholo-gy. Although the study showed that the level of comfort was improved by increasing the building height, no questionnaires or interviews were ap-plied to investigate the effect of the existing buildings height on people’s subjective outdoor thermal comfort.
Concluding remarks The studies reviewed show that the effects of urban planning regulations on microclimate have received little attention. Only a few studies have consid-ered the importance of climatic aspects in urban planning regulations. Thus, further studies are needed to highlight the effect of urban planning regulations on microclimate. Such studies can be based on microclimate simulations and/or micrometeorological measurements and thermal com-fort survey (questionnaires or structured interviews).
3.4 Conclusions This chapter reviewed literature on urban microclimate and outdoor ther-mal comfort in hot dry climates. It also discussed literature on the influence of urban planning regulations on the thermal environment. The main con-clusions from this chapter are:
1 The number of studies on microclimate and thermal comfort in hot dry regions has increased in recent years. However, there are still few stud-ies including the winter season and most of the hot dry studies are mainly based on measurements and/or simulations. Thus, there is a need to conduct further research, which examines the relationship be-tween urban design and subjective thermal comfort taking the summer and winter seasons into account. Such studies can be based on micro-meteorological measurements, outdoor thermal comfort surveys and microclimate simulations.

Chapter 3 Literature review
45
2 There is a lack of research on the relationship between microclimate and urban planning regulations. Thus, there is a need to investigate the impact of urban planning regulations on microclimate and thermal com-fort. Such investigations will allow planners, architects and decsion makers to update the planning regulations taking microclimate and thermal comfort into account and reduce the negative impact of these regulations on the thermal environment.
This thesis therefore aims at developing better understanding of the rela-tionship between microclimate and urban design in the hot dry city of Da-mascus. The study is based on the analysis of planning regulations regard-ing aspect ratio, setbacks, plot coverage, etc. Moreover, it takes the urban design of the most types of neighbourhoods into account. In order to assess the thermal environment in outdoor urban spaces in the hot dry climate, the study is based on both micrometeorological measurements and struc-tured interviews – to investigate the actual thermal sensation of the space users – during the summer and winter seasons. In addition, it investigates different thermal comfort indices; some of them take clothing and activity into account. Furthermore, since the outdoor space is part of urban life, this study examines the influence of urban spaces on people’s thermal percep-tion. The study highlights the importance of good microclimate and thermal comfort in the planning and design process and it provides useful insights on how to create a climate-sensitive urban design in Damascus.

Towards better Urban Spaces Moohammed Wasim Yahia
46

47
4 Methodology This study is multidisciplinary in character. It focuses on the fields of urban microclimate, thermal comfort, urban design and planning. In addition, this study touches the fields of landscape design, architecture design, urban climatology, and environmental psychology. It aims is at developing further understanding of the relationship between microclimate, thermal comfort, urban design and outdoor space users in the hot dry city of Damascus.
Based on the design of the research questions (see section 1.2), this study is mostly quantitative, since it is mainly based on simulations, mea-surements and structured interviews. Also, most of similar research in the field of microclimate and thermal comfort has been totally based on quan-titative approaches and experimental methods. Studies such as Johansson (2006a), Bourbia and Boucheriba (2010), Hedquist and Brazel (2014) are examples of experimental research. The overall design in this study can be identified as experimental.
The aim of experimental research – according to Groat and Wang (2002) – “is to achieve comparability among the units in every treatment group”. One of the major strengths of experimental research is that, such research is a credible device to determine the causality, as mentioned in the follow-ing quotation of Moore and McCabe (1993): “The best method – indeed the only fully compelling method – of establishing causation is to conduct a carefully designed experiment in which the effects of possible lurking va-riables are controlled. To experiment means to actively change (x) and ob-serve the response (y)”. In addition, the methodological preference for the experimental research is where results can be measured and quantified. The research assessment criteria are internal and external validity, reliabili-ty and objectivity (Groat and Wang, 2002). A small part of this study, related to the analysis of the urban planning regulations in Damascus, is based on a qualitative approach.
4.1 Research paradigm The overall design in this study can be identified as experimental. Experi-mental research design is considered by positivist researchers because it is a way to represent a high standard of research (Groat and Wang, 2002). Thus, this research applies the postpositivism as a model of scientific in-quiry (Robson, 2002). Postpositivism argues that the key approaches of the scientific methods are the experiments, which is an attempt to discern natural laws through direct manipulation and observation. It believes that the aim of the science is to hold steadily to the aim of getting it right about reality, even though that aim can be never achieved (Hacking, 1983; Creswell, 2013). Postpositivists presume that the objectivity in research is a legitimate aim, which maybe imperfectly realized (Groat and Wang, 2002).
According to Groat and Wang (2002), postpositivism is the traditional scientific paradigm that assumes an objective reality existing independently of the observer. Knowledge should be obtained through ‘dispassionate’ and ‘objective’ observations, in the way that the researcher interferes as little as possible with the studied subject.

Towards better Urban Spaces Moohammed Wasim Yahia
48
At higher level, the underlying philosophy of research is Epistemology (Encyclopaedia Britannica Online, 2007) which is defined as the philosophy of knowledge or how we come to know the reality. Its methodology identi-fies the particular practices used to achieve knowledge of it, and therefore qualitative and quantitative approaches can be applied to obtain knowle-dage (Creswell, 1994). The definition of knowledge – in this context – is a matter of ongoing debate among philosophers in the field of epistemology. The classical definition specifies that a statement must meet three criteria in order to be considered knowledge: it must be justified, true, and be-lieved (Cornford, 2003).

Chapter 4 Methodology
49
4.2 Overall research strategy In order to achieve the aim of the study, qualitative and quantitative ap-proaches were applied and in addition, a set of methods were used and combined. The overall research strategy is shown in Table 4.1.
Table 4.1 The overall research strategy showing the scientific approaches, applied methods and research tools (techniques)
Phase Mission Scientific approach Method Tools
1 Analysis of ur-ban planning regulations
Qualitative and quantitative
Archival analysis1, modelling and simulation
Auto-CAD and ENVI-met
2 Microclimate fieldwork (measurements and structured interviews)
Quantitative Measurements Meteorologi-cal equipment and structured interview forms
3 Thermal com-fort analysis
Quantitative Quantitative data analysis (Probit analysis)
SPSS and Excel
4 Analysis of structured inter-views
Quantitative Quantitative data analysis
SPSS
5 Exploring the effect of vegeta-tion and land-scape elements on thermal comfort
Quantitative Parametric2 (Mod-elling and simula-tion)
ENVI-met
6 Evaluating an urban design proposal
Quantitative Modelling and simulation
ENVI-met
1 Archival analysis is a type of primary research which involves seeking out and extracting evi-dence from original archival records. These records may be held either in institutional archive repositories, or in the custody of the organisation (whether a government body, business, fam-ily, or other agency) that originally generated or accumulated them, or in that of a successor body (Yin, 2003)
2 In this context, the term “parametric” is used to study the effect of changing one parameter on other parameters of the studied model (Johansson, 2006b)
The first phase of the study dealt with the analysis of urban planning regulations. In order to define the research problem, an analysis of existing urban regulations was conducted. This phase included a qualitative analy-

Towards better Urban Spaces Moohammed Wasim Yahia
50
sis, and a simulation study that focused on the three main residential urban zones of Damascus.
The aim of the second phase was to conduct fieldworks (measurements and structured interviews). Two fieldworks in the summer and winter were conducted in six different locations in Damascus. The micrometeorological measurements aimed to study the real situation concerning microclimate, urban design and outdoor thermal comfort whereas the structured inter-views were simultaneously carried out during the field measurements in order to investigate people’s actual thermal sensation and how they perce-ive the built environment in Damascus.
After finishing the fieldworks, the third phase was conducted to analyze the results derived from the fieldworks in order to investigate the thermal environment in Damascus. The aim was also to study the outdoor thermal comfort by investigating the behavior of different thermal comfort indices.
Phase four on the other hand aimed to analyze the structured interviews. Quantitative analysis using SPSS 18 (Statistical Package for the Social Sciences Software for Windows) was conducted to investigate people’s ac-tual thermal sensation and how they perceive the thermal environment in different locations.
Phase five was carried out as a parametric study. Modeling and simula-tions were conducted for the summer and winter in order to study how to improve the outdoor thermal comfort in Damascus by investigating differ-ent urban design scenarios and using different landscape elements in dif-ferent hours of the day.
Finally, phase six aimed to evaluate an urban design proposal from a thermal comfort point of view. This phase focused on how the urban design in Damascus could be adapted to the microclimate and outdoor thermal comfort. This was investigated through a simulation study where the ther-mal comfort limits of phase three were applied.
4.3 Analysis of urban planning regulations
Selection of the urban zones studied According to the existing urban planning regulations, Damascus is divided into 14 zones of different land use including agricultural, administrative, in-dustrial, residential, and commercial activities (see Appendix 1). The analy-sis part of this study contains the following steps:
After translation of the documents of urban planning regulations from Arabic into English by the author, three main residential urban zones of these fourteen were selected for analysis. These three zones were: • PRA: The zone of Planned Residential Area that is exemplified by the sub
zone of palaces area in modern Damascus (see Table 1 in Paper 1). This zone contains only detached buildings (Figure 4.1). The reason for choos-ing the palaces area sub zone is that it contains the biggest plot size (>1500 m2), lowest plot coverage (20%), lowest maximum buildings height (10 m), and widest setbacks dimensions (10 m) (see Table 1 in Paper 1). The location of PRA zone is shown in Figure 4.3 where PRA zone is found in the city center as well as Damascus municipality area.
• IRA: The zone of Inhabited Rural Area that is exemplified by the sub zone of new planning area in modern Damascus. Also this zone contains only detached buildings (Figure 4.1). The idea of choosing the sub zone of

Chapter 4 Methodology
51
new planning area is that it contains the biggest plot size (>600 m2), and highest maximum buildings height (15 m). It also contains clear setback dimensions (see Table 1 in Paper 1). The location of IRA zone is shown in Figure 4.3 where IRA zone is mainly found in the suburbs of Damascus.
• OD: The zone of Old Damascus. This zone contains only attached build-ings (Figure 4.1). Old Damascus was built in different periods in the past and it has special regulations regarding restoration and rehabilitation. The location of OD zone is shown in Figure 4.3.
The three zones were mainly chosen in order to test the impact of vari-ous aspect ratios – i.e. height to width ratios (H/W) – on the microclimate. The palaces area of the PRA zone has the lowest H/W ratio (0.31) and Old Damascus (OD) zone has the highest H/W ratio (2.95). The new planning area of the IRA zone has a H/W ratio of 0.83. The chosen zones include two extremes in the city of Damascus where the palaces area of the PRA zone is the most dispersed (lowest density) and old Damascus is the most compact (highest density). The residential area of the IRA zone is somewhere in be-tween. The PRA (Palaces area), IRA (New planning area) and OD zones are clearly different concerning the distance between buildings, building heights, H/W ratios, and building footprint.
The idea of choosing two urban zones from modern Damascus together with Old Damascus is to compare different urban patterns in terms of mi-croclimate and thermal comfort. This comparison could help to develop the future urban planning regulations for the modern part of Damascus.
The analysis part also includes a comparison between these three urban zones regarding the type of use, plot size, maximum plot coverage and number of floors, maximum height, and setbacks (Table 1 in Paper 1). The zones represent the common residential areas in Damascus. Although many residential buildings in these zones were created in different periods of modern Damascus’ development, the existing urban planning regula-tions (1997) have generally considered the same regulations that have been applied in previous regulations.
Drawings as architectural plans, sections, and perspective model were made by AutoCAD in order to show the spaces around buildings, building heights, and H/W ratios (Figure 4.2).

Towards better Urban Spaces Moohammed Wasim Yahia
52
Figure 4.1 Perspective models and plans of the studied palaces area sub zone derived from PRA urban zone (Planned Residential Area), the studied New planning area sub zone derived from IRA urban zone (Inhabited Rural Area) and OD (Old Damascus) urban zone including the 2 m high wall that surrounds the plots for PRA and IRA. The ground surface temperature and the thermal comfort were studied at the right side of the street (R), at the middle of the street (M), and at the left side of the street (L)
Figure 4.2 Typical sections and H/W ratios for PRA zone (palaces area), IRA zone (New plan-ning area), and OD zone with rows of trees on the pavements for IRA and PRA zones

Chapter 4 Methodology
53
Simulations In order to compare the thermal conditions in the three selected zones, a simulation study was conducted. The simulation study was carried out only at street level since in Damascus the street is the most common public space; this is the main place where people can stroll and pass by for differ-ent reasons such as going to work and shopping as well as for recreational purposes.
A simulation study such as this one has the advantage that an unlimited number of points from the model can be analyzed, whereas in a measure-ment study, only the results derived from the measured spots are reliable.
Microclimate simulations The microclimate at street level was simulated with ENVI-met (Bruse, 2009) (see section 4.7). The input data for the simulation model contained the physical properties of the studied urban areas (buildings, soil and vegeta-tion) and limited geographical and meteorological data. The input data used in this study is shown in Paper 1 and includes meteorological data from the station Kharabo near Damascus.
The study was carried out on the 21st of July (see section 4.7). The simu-lated period lasted from 7:00 in the morning until 16:00 in the afternoon in order to include the maximum air and surface temperatures, which nor-mally occur at 14:00. In this study, both east–west and north–south street orientations were investigated. In modern Damascus, the street width was 12 m since this width is the most common one. On the other hand, the width of the studied street in Old Damascus was 3.8 m and it was derived from an existing street. See Figure 4.2c.
Both surface temperature and thermal comfort were studied in the simu-lations with ENVI-met. The reason of choosing the surface temperature as an indicator is that the surface temperature is easier for architects and de-signers to understand than the other indicators such as thermal indices.
Assessment of thermal comfort for simulation models In this study, thermal comfort was estimated by calculating the Physio-logical Equivalent Temperature (PET) index (Höppe, 1999) (see section 4.4). For the three studied zones, the PET index was calculated at pedes-trian level (1.1 m height) for three points of the street: both pavements and the middle of the street. The positions of the studied points for which the surface temperature and PET have been calculated are shown in Figure 4.1 for the PRA and IRA zones. In the case of old Damascus, the studied points are located in the deep urban canyon near the building facades and in the middle of the street.
This simulation study – at this step – dealt with two cases; the first is the model which was built according to urban planning regulations. The second case is the model with rows of trees on the pavements in both PRA and IRA zones. The position of the trees is shown in Figure 4.2.
4.4 Microclimate fieldwork In order to find out the characteristics of urban microclimate and thermal comfort in Damascus, both micrometeorological measurements and struc-tured interviews – to investigate the actual thermal sensation of the space

Towards better Urban Spaces Moohammed Wasim Yahia
54
users – were performed during the summer of 2009 and the winter of 2010 in Damascus City, Syria. The combination of measurements and structured interviews allowed the assessment of different thermal environments and to simultaneously determine the user’s thermal perception. Moreover, the behaviour of different thermal indices could be investigated.
Selection of measurement locations and time period Outdoor thermal comfort is of importance both for residential areas and parks in Damascus. The locations selected were divided into three catego-ries: two types of residential areas and parks.The reason to choose these three categories was to compare different urban environments in Damas-cus and different urban morphologies (attached and detached geometries) were taken into account. In addition, vegetation and landscape elements were considered especially in the parks to investigate the effects on micro-climate and thermal comfort. Furthermore, these three categories repre-sent the most common urban environment in the city of Damascus. Investi-gating the common urban environments allowed also the collection of in-formation on how people perceive different environments from a thermal comfort point of view as well as on the physical quality of the built envi-ronment.
The first category – residential areas in modern Damascus – contained three measurement locations: Al Gassany area which was built in the 1950s (point 1 in Figure 4.3), the New Dummar area which started to be built in the 1980s (point 2) and the Barzza area which was built in the end of the 1970s (point 3). The second category – Old Damascus – contained a deep canyon: Al Qaymarieh Street (point 6). The third category – parks in modern Damascus – contained two locations: Al Tigara Park (point 4), and Al Mazza Park, (point 5). The measurement sites are also shown in Figure 4.4.
Figure 4.3 Locations of the measurement sites on a simplified map of the city of Damascus, which is located between the Kassioun mountain chain in the North West and an oasis in the south. See Figure 4.4 for description of the sites

Chapter 4 Methodology
55
Figure 4.4 Measurement sites in the city of Damascus, where (a) is Al Tigara park, (b) is Al Gassany area, (c) is New Dummar area, (d) is Barzza area, (e) is Al Mazza park, and (f) is Old Damascus

Towards better Urban Spaces Moohammed Wasim Yahia
56
Both time-period and orientation were considered when carrying out micrometeorological measurements. The investigation was carried out dur-ing the most extreme weather conditions; the study was conducted during August and September 2009 for the summer, and during January and Feb-ruary 2010 for the winter. Northwest–southeast (NW–SE), northeast–southwest (NE–SW), and east–west (E–W) street orientations were in-cluded in the measurements as well as open spaces in parks. In these six locations, the measurement fieldwork was scheduled mainly during the three hours starting from around noon, since this time is the hottest time of the day. However, in order to extend the study of thermal comfort and to get a greater variety in microclimatic conditions, measurements were also carried out in the morning – in the Barzza area (8:00–11:30) – and in the evening in old Damascus (15:30–18:30) (See Paper 2). It should be noted that the measurements were carried out on different days at the studied sites. The official climatic data in Damascus during the measurements and time-periods are shown in Paper 2.
The measurement equipment was placed at the points where people could be expected to sit or walk either under the sun or in shade. Air tem-perature (Ta), globe temperature (Tg), relative humidity (RH), wind speed (W) and wind direction (Wd) were measured. The characteristics of the thermal environment in all studied locations were studied (see Papers 2 and 3). However, three areas – Al Gassany area, Old Damascus, and Al Mazza park – which represent the three studied categories of urban envi-ronments in Damascus were studied more in detail. The urban characteris-tics of these three areas are shown in Paper 2.
Outdoor thermal comfort and thermal indices Thermal comfort has been defined in various ways in the literature. In ASH-RAE (1997), thermal comfort is defined as the condition of mind that ex-presses satisfaction with the thermal environment. A great number of in-dices, which try to predict the state of thermal comfort, mainly for indoor applications but also for outdoors, have been developed. The Predicted Mean Vote (PMV), the Standard Effective Temperature (SET*) and the New Effective Temperature (ET*) were all developed for indoor condtions (McIntyre, 1980). In addition, many indices have been primarily designed for outdoor applications, e.g., the Perceived Temperature (PT), which is based on the comfort equation of Fanger (Jendritzky et al., 2000), OUT_SET*, which is an adaptation of SET* for outdoor use (Pickup and de Dear, 2000), and the Physiological Equivalent Temperature (PET) (Höppe, 1999). In this study, PET, OUT_SET*, ET*, and PMV have been used to as-sess and evaluate the outdoor thermal environment in Damascus. Howev-er, PET and OUT_SET* were used for further investigations. The RayMan PC model (Matzarakis, Rutz, & Mayer, 2007) was used to calculate PET, whe-reas the ASHRAE Thermal Comfort Program (Fountain and Huizenga, 1994) was used to calculate the OUT_SET*, ET*, and PMV indices. More details about thermal comfort have been shown in Papers 1 and 2.
4.5 Structured interviews A structured interview survey was performed simultaneously with the micrometeorological measurements in each location in order to estimate
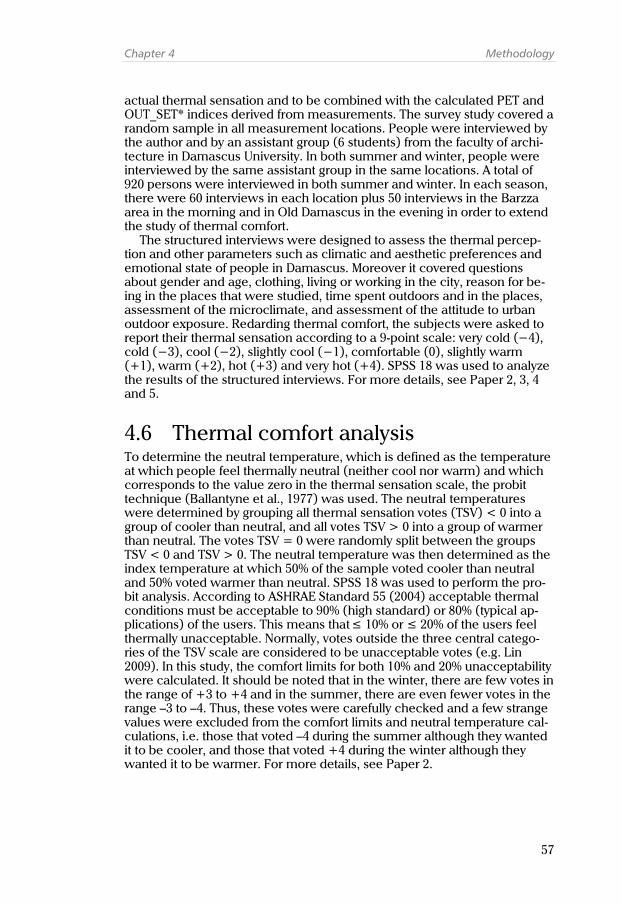
Chapter 4 Methodology
57
actual thermal sensation and to be combined with the calculated PET and OUT_SET* indices derived from measurements. The survey study covered a random sample in all measurement locations. People were interviewed by the author and by an assistant group (6 students) from the faculty of archi-tecture in Damascus University. In both summer and winter, people were interviewed by the same assistant group in the same locations. A total of 920 persons were interviewed in both summer and winter. In each season, there were 60 interviews in each location plus 50 interviews in the Barzza area in the morning and in Old Damascus in the evening in order to extend the study of thermal comfort.
The structured interviews were designed to assess the thermal percep-tion and other parameters such as climatic and aesthetic preferences and emotional state of people in Damascus. Moreover it covered questions about gender and age, clothing, living or working in the city, reason for be-ing in the places that were studied, time spent outdoors and in the places, assessment of the microclimate, and assessment of the attitude to urban outdoor exposure. Redarding thermal comfort, the subjects were asked to report their thermal sensation according to a 9-point scale: very cold (−4), cold (−3), cool (−2), slightly cool (−1), comfortable (0), slightly warm (+1), warm (+2), hot (+3) and very hot (+4). SPSS 18 was used to analyze the results of the structured interviews. For more details, see Paper 2, 3, 4 and 5.
4.6 Thermal comfort analysis To determine the neutral temperature, which is defined as the temperature at which people feel thermally neutral (neither cool nor warm) and which corresponds to the value zero in the thermal sensation scale, the probit technique (Ballantyne et al., 1977) was used. The neutral temperatures were determined by grouping all thermal sensation votes (TSV) < 0 into a group of cooler than neutral, and all votes TSV > 0 into a group of warmer than neutral. The votes TSV = 0 were randomly split between the groups TSV < 0 and TSV > 0. The neutral temperature was then determined as the index temperature at which 50% of the sample voted cooler than neutral and 50% voted warmer than neutral. SPSS 18 was used to perform the pro-bit analysis. According to ASHRAE Standard 55 (2004) acceptable thermal conditions must be acceptable to 90% (high standard) or 80% (typical ap-plications) of the users. This means that ≤ 10% or ≤ 20% of the users feel thermally unacceptable. Normally, votes outside the three central catego-ries of the TSV scale are considered to be unacceptable votes (e.g. Lin 2009). In this study, the comfort limits for both 10% and 20% unacceptability were calculated. It should be noted that in the winter, there are few votes in the range of +3 to +4 and in the summer, there are even fewer votes in the range –3 to –4. Thus, these votes were carefully checked and a few strange values were excluded from the comfort limits and neutral temperature cal-culations, i.e. those that voted –4 during the summer although they wanted it to be cooler, and those that voted +4 during the winter although they wanted it to be warmer. For more details, see Paper 2.

Towards better Urban Spaces Moohammed Wasim Yahia
58
4.7 Parametric study The aim of this phase was to explore how vegetation and landscape ele-ments affect the outdoor thermal comfort for detached buildings in hot dry Damascus by investigating different urban design scenarios. The study used two different thermal indices (PET and OUT_SET*).
Two different street orientations (E–W and N–S) in summer and winter were examined using microclimatic simulations with ENVI-met 3.1 and the simulations were followed by analysis of thermal comfort maps for the stu-died cases. ENVI-met uses a three-dimensional computational fluid dynam-ics and energy balance model. The model has a high spatial and temporal resolution enabling a detailed study of how the microclimate varies within the studied space over time. The model gives a large amount of output data including the necessary variables enabling the calculation of thermal com-fort indices.
The urban zone IRA (New Planning Area) – from the existing urban plan-ning regulations – was selected for simulations becasue this is the most common urban residential zone for new development in Damascus and it is thermally uncomfortable (see Paper 1).
In the summer case, the 21st of July was chosen as a representative day for the summer. This day is more or less in the middle of the three hottest months in Damascus (June, July and August). In winter, the day 15th of Jan-uary was studied to represent the winter season because it is in the middle of the three coldest moths in Damascus (December, January and Febru-ary). The simulated period lasted from 5:00 local time (LT) in the morning until 16:00 LT in the afternoon in order to include the maximum air temper-ature, which normally occurs at 14:00. In addition, the study focused on 12:00 and 16:00 because at 12:00, residential streets are full of students who return back home from schools and at 16:00, the streets and urban spaces are full of employees who return back home from work. The street width was fixed to 12 m since this width is the most common in residential areas in modern Damascus and this was divided into 9 m of vehicle route and 1.5 m for each pavement.
This parametric study consisted of a base case and three additional cas-es. The base case had the following characteristics: plot size 600 m2 (20 m x 30 m), plot frontage 20 m, plot coverage 40%, maximum building height 15 m, and frontal, rear and side setbacks of 3 m, 4 m, and 5 m respectively (Figure 4.5a). For the three cases, only one parameter was changed at a time in order to determine the relative influence of each. The effect of the design parameters – such as H/W ratio, street orientation, spacing between buildings, vegetation and shading devices – on thermal comfort were stu-died. The characteristics of the three cases in addition to the base case are shown in Figure 4.5. The studied parameters have been divided into three main categories: - Urban morphology: a new extension – with a height of 7 m – was added to the original building (base case) in the front block side. This affects the frontal and the side setbacks as well as the H/W ratio (see Figure 4.5b). - Vegetation: a continuous row of street trees were added along the pave-ments (see Figure 4.5c). - Vegetation and shading devices: a mixture of horizontal shading devices – over the plot walls as well as the pavement – and street trees were added (see Figure 4.5d).

Chapter 4 Methodology
59
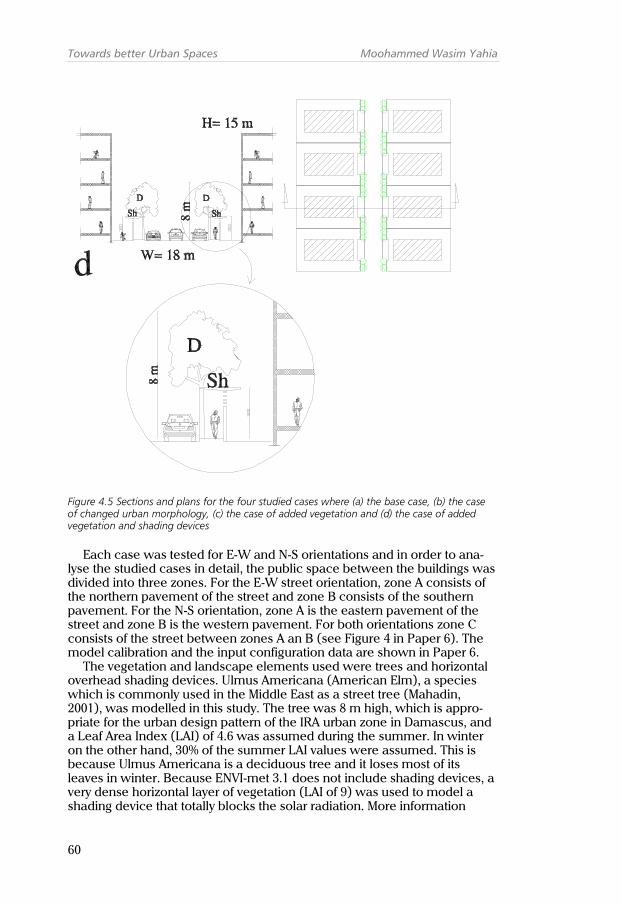
Towards better Urban Spaces Moohammed Wasim Yahia
60
Figure 4.5 Sections and plans for the four studied cases where (a) the base case, (b) the case of changed urban morphology, (c) the case of added vegetation and (d) the case of added vegetation and shading devices
Each case was tested for E-W and N-S orientations and in order to ana-lyse the studied cases in detail, the public space between the buildings was divided into three zones. For the E-W street orientation, zone A consists of the northern pavement of the street and zone B consists of the southern pavement. For the N-S orientation, zone A is the eastern pavement of the street and zone B is the western pavement. For both orientations zone C consists of the street between zones A an B (see Figure 4 in Paper 6). The model calibration and the input configuration data are shown in Paper 6.
The vegetation and landscape elements used were trees and horizontal overhead shading devices. Ulmus Americana (American Elm), a species which is commonly used in the Middle East as a street tree (Mahadin, 2001), was modelled in this study. The tree was 8 m high, which is appro-priate for the urban design pattern of the IRA urban zone in Damascus, and a Leaf Area Index (LAI) of 4.6 was assumed during the summer. In winter on the other hand, 30% of the summer LAI values were assumed. This is because Ulmus Americana is a deciduous tree and it loses most of its leaves in winter. Because ENVI-met 3.1 does not include shading devices, a very dense horizontal layer of vegetation (LAI of 9) was used to model a shading device that totally blocks the solar radiation. More information

Chapter 4 Methodology
61
about the modeling of vegetation and landscape elements are shown in Paper 6.
4.8 Residential area design evaluation An urban design proposal was developed. A simulation study was con-ducted to investigate whether or not the proposal fulfilled the thermal com-fort limits determined in Paper 2. This proposal creates the first step to modify the existing urban planning regulations taking the microclimate and thermal comfort into account for future development in Damascus.
Residential area typology The urban design proposal was based on the existing IRA urban zone in Damascus. Several parameters were modified especially building heights, setbacks and plot coverages. The maximum height was increased from 15 m to 22 m. The maximum plot coverage was increased from 40% to 71% and 73%. The setback dimensions were also modified especially for the side and rear setbacks (see Table 4.2). In order to make flexibility in design, two design patterns. called P1-IRA and P2-IRA were applied. The modified parameters and urban regulations for P1- IRA and P2-IRA compared to the IRA urban zone are shown in Table 4.2 and Figure 4.6.
Figure 4.6 The detailed plans and dimensions for the existing IRA urban zone and for the pro-posed urban zones (P1-IRA and P2-IRA)

Towards better Urban Spaces Moohammed Wasim Yahia
62
Table 4.2 The modified parameters for proposed P1-IRA and P2-IRA zones compared to the existing urban zone IRA
Parameter IRA zone P1-IRA P2-IRA Plot size (m) 600 600 600
Max. plot coverage in ground floor (%)
40 71 73
Max. number of floor 4+ b1 5+roof floor+b 5+roof floor+b
Max. height (m) 15 H12=18 H23=22 H1=18 H2=22
Min. plot frontage (m) 20 20 20
Min. frontal setback (m) 3 Varies from 0 to 3 Varies from 0 to 3
Min. side setback (m) 5 Varies from 0 to 5 Varies from 0 to 5
Min. rear setback (m) 4 Varies from 0 to 4 Varies from 0 to 3
1b = basement 2H1= the maximum height at the frontal elevation (see Fig. 4.8b) 3H2= the maximum height of the roof (see Fig. 4.8b)
The proposal consists of two urban residential streets patterns (Figure 4.7). The first is used by pedestrians and vehicles and can have small commercial facilities such as shops, mini markets and restaurants, coffee shops, etc. It also contains parking lots and pavements. A two-way street (6 m) – that allows vehicles to travel in both directions – was appiled. The pavement width varies from 3 to 7.30 m in order to provide enough space to have an easy walk and short rest. The total distance – including vehicle routes, pavements and parking lots – is 20 m (Figure 4.8).
Figure 4.7 The site plan of the whole studied area including the shade on 21st of July at 13:00 local time

Chapter 4 Methodology
63
(a) (b)
(c)
Figure 4.8 The pedestrians and vehicles street where (a) the site plan including the shade on 21st of July at 13:00 local time, (b) a vertical section including P1-IRA and P2-IRA proposed urban zones and (c) perspective view for the street

Towards better Urban Spaces Moohammed Wasim Yahia
64
(a) (b)
(c)
Figure 4.9 The pedestrians and biking street where (a) the site plan including the shade on 21st of July at 13:00 local time, (b) a vertical section including P1-IRA and P2-IRA proposed urban zones and (c) perspective view for the street

Chapter 4 Methodology
65
The second street pattern is mainly used by pedestrians for walking and biking and it can have some activities such as small coffee shops to en-courage people to spend time outdoors and to make the space more liva-ble. In addition, it has a 3 m space width as a biking route. The total dis-tance of this pedestrian space – including pavements and the biking street – is 18 m (see Figure 4.9).
Evaluation procedure The urban design proposal was modelled and simulated by using ENVI-met. The study used OUT_SET* thermal comfort index. Since the E–W street orientation is more stressful than N–S orientation (see Paper 6), only E–W was examined for the thermal comfort study. The study was con-ducted for the summer and winter. In summer, the study was carried out on the 21st of July whereas in winter, the day 15th of January was studied to represent the winter season. The simulated period lasted from 5:00 local time (LT) in the morning until 16:00 LT in the afternoon. Only the results at 14:00 – the hottest vhour of the day – will be discussed. The vegetation and landscape elements used were trees, horizontal overhead and vertical shading devices. Ulmus Americana (American Elm) (Mahadin, 2001), was modelled in this study (see paper 6). In winter, 30% of the summer LAI val-ues was assumed. This is because Ulmus Americana is a deciduous tree and it loses most of its leaves in winter. A very dense horizontal layer of vegetation was used to model a shading device that totally blocks the solar radiation as described in Paper 6.
Regarding the vertical shading devices, very dense grapevines (3 m high and LAI of 9) – which are commonly used in Damascus – were applied for this investigation. The model calibration and the input configuration data are similar to what was used in the parametric study and they are shown in Paper 6.

Towards better Urban Spaces Moohammed Wasim Yahia
66

67
5 Results and discussion This chapter highlights the most important results of the study. It includes results and discussion of the simulations, micrometeorological measure-ments, structured interviews, thermal comfort limits for Damascus as well as the applications of these limits in urban design. The first section of this chapter discusses the results of the effect of urban regulations on surface temperatures and thermal comfort in summer. The second section shows the results of the micrometeorological measurements during the summer and winter seasons, and the third section presents the results of the struc-tured interviews. The fourth section is about the relationship between ac-tual thermal sensation and thermal indices. The fifth section presents the calculation of thermal comfort limits and neutral temperatures for summer and winter seasons. The sixth section shows the results of the relationship between thermal perception and aesthetical qualities of urban design whereas the seventh section is about the parametric study for different ur-ban design scenarios and discusses the landscape interventions in improv-ing the outdoor thermal comfort in Damascus. Finally, an application of mi-croclimate and thermal comfort in urban design for Damascus is discussed in section eight.
5.1 The effect of urban regulations on sur- face temperatures and thermal comfort
Influence of H/W ratio and orientation on surface temperatures and PET The surface temperatures in all three studied zones between 07:00 and 16:00 in July at the three points (L, R and M) are shown in Paper 1. For the PRA and IRA zones that consist of detached buildings in modern Damascus, the influence of street orientation on surface temperatures is not decisive. On the other hand, for both E–W and N–S orientation, the surface tempera-tures of the two zones in modern Damascus are considerably higher than those of Old Damascus because in the latter case the street has a much higher height-to-width (H/W) ratio. The street in Old Damascus is in shade during all hours of the simulation except at around noon for the N–S case as well as at around 10:00 and around 15:00 for the E–W case since the azi-muth is nearly parallel to the street orientation for these hours. Surface temperatures in Old Damascus are normally the same in all points and rarely above 35 °C whereas in modern Damascus they can reach as high as 48 °C.
Table 5.1 shows the influence of the H/W ratio on the physiological equivalent temperature (PET) index at 14:00 in the PRA, IRA and OD zones. For the PRA and IRA zones, where buildings are detached, with H/W ratios of 0.31 and 0.83 respectively, the maximum PET reaches 51.7 °C and 50.7 °C respectively. On the other hand, in Old Damascus where buildings are at-tached with a higher H/W ratio of 2.95, the maximum PET value reaches only 33.2 °C. The results show that the H/W ratio has a large impact on out-

Towards better Urban Spaces Moohammed Wasim Yahia
68
door thermal comfort and that the PET tends to decrease with increasing H/W, especially when buildings are attached. The main reason for the lower PET in the OD zone is the reduction of radiation fluxes due to in-creased shading which results in a lower mean radiant temperature. Table 5.1 also shows only a small influence of orientation and aspect ratio on PET in modern Damascus. Consequently, in urban environments that have de-tached buildings, the influence of street orientation and aspect ratio on outdoor thermal comfort is less decisive. Other studies for urban canyons (Ali-Toudert and Mayer, 2006; Johansson, 2006b) have shown that in gen-eral N–S streets tend to be more comfortable than E–W streets. This is be-cause the N–S street is exposed to solar radiation during a shorter period than the E–W street.
Table 5.1 Influence of H/W ratio on PET values in the PRA, IRA, and OD urban zones for east–west (E–W) and for north–south (N–S) street orientations (maximum daily values at 14:00 in July). The thermal comfort was studied at the right side of the street (point R), at the middle of the street (point M) and at the left side of the street (point L.). See Figure 4.1
Zone PET °C (E–W) PET °C (N–S)
L R M L R M
PRA Zone H/W= 0.30 49.9 51.7 49.4 45 52.1 48.8
IRA Zone H/W= 0.83 50.7 50.4 48.5 50 50.7 48.4
OD Zone H/W= 2.95 33.2 33.2 33.2 33.2 33.2 33.3
Influence of vegetation on PET Table 5.2 illustrates the effect of street trees on thermal comfort expressed as the maximum daily PET value in both the PRA and IRA zones. The result reveals that there is a great influence of vegetation on PET since when rows of trees are added on the pavement, PET values are lowered by about 17 °C for the PRA and by about 16 °C for the IRA zone due to the shading of the pedestrian pavement. Consequently, in urban environments that have low aspect ratios as well as detached buildings, the influence of vegetation on outdoor thermal comfort is significant. Similar results were indicated in other studies and they found that the direct solar radiation under a tree canopy strongly decreases (e.g. Ali-Toudert and Mayer, 2007; Ochoa et al., 2009).
It can be concluded that existing urban regulations in Damascus lead to a poor microclimate. The difference in thermal conditions is not very big between PRA and IRA zones since buildings are detached, but there is a huge difference compared to OD (attached buildings with high H/W ratio). This agrees with other studies on urban regulations in hot dry regions (Bak-er et al. 2002; Johannson and Yahia, 2010).

Chapter 5 Results and discussion
69
Table 5.2 Iinfluence of street trees on PET values in the PRA and IRA urban zones (maximum daily values in July at 14:00)
The study shows that the outdoor thermal comfort in existing urban ar-eas in modern Damascus could be improved by introducing vegetation and landscaping in the urban design process. The use of vegetation would also have a positive influence on air quality as well as the quality of life. It is therefore important to create a link between urban landscaping and urban planning regulations and this link could be as a set of guidelines for street design.
5.2 Micrometeorological measurements and calculated thermal comfort indices Summer and winter micrometeorological measurements were carried out in three different areas of Damascus: outdoor spaces in residential areas of modern Damascus, outdoor space in a deep canyon in Old Damascus and public parks in modern Damascus. The division into these three categories allowed gaining insight into the effects of urban design on traditional, mod-ern and natural outdoor settings. In addition, such measurements allowed investigating the behaviour of different thermal comfort indices (PET, OUT_SET*, ET*, and PMV) in the hot dry climate of Damascus (see Chapter 4). It is should be noted that the measurements were carried out on differ-ent days (see Table 1 in Paper 2).
Microclimatic variations Figure 5.1 shows the spatial variations of the mean radiant temperature (MRT) for Al Gassany area, Old Damascus, and Al Mazza park as examples representing the outdoor urban environment in Damascus. It can be seen that in the summer MRT was higher in Al Mazza park than in Al Gassany area. The values in Old Damascus were considerably lower than in the two other places. The instability of MRT in Al Gassany area was due to the posi-tioning of the measurement equipment, which was mounted beside a pe-destrian path under a row of small trees where the globe thermometer dur-ing the measurement period was alternately in shade. In winter, there were major differences between the studied areas in terms of MRT. This is mainly because the weather was changing from one day to another during the measurement period (see Table 2 in Paper 2), and sometimes the change, of e.g clouds/solar exposure, even occurred during the measure-ments. As in summer, MRT is however very stable in Old Damascus. The variations of measured Ta, RH, W, and MRT in summer and winter for all locations are shown in Paper 2.
PET °C without vegetation PET °C with vegetation
PRA Zone H/W= 0.30 52.1 35.3
IRA Zone H/W= 0.83 50.7 34.3

Towards better Urban Spaces Moohammed Wasim Yahia
70
Figure 5.1 Mean radiant temperature (MRT) variations in Al Gassany area, Old Damascus, and Al Mazza park during (a) summer and (b) winter where the measurements were carried out on different days (see Table 1 in Paper 2)
Characteristics of different thermal indices Table 5.3 shows the calculated PET, OUT_SET*, ET*, and PMV for all stud-ied locations. For all indices, the results reveal that in the summer Old Da-mascus is less stressful than the outdoor urban spaces in modern Damas-cus, whereas in winter, Old Damascus is colder than the other areas due to the lack of solar exposure as a result of the high building density. In sum-mer, Al Gassany area and Al Tigara park, where there was some shade from trees, were less thermally stressful than the other sites in modern Da-mascus where the measurement spot was exposed to sunshine all the time.
Table 5.3 shows that the average values of the PET index are higher in summer and lower in winter than the average values of both the OUT_SET* and ET* indices. ET*, in turn, has higher values in summer and lower in winter than OUT_SET*. One of the reasons why PET and ET* have more ex-treme values is that they do not take clothing and activity into account as input variables. Another reason why OUT_SET* is slightly lower than ET* in the summer may be because the effect of wind speed is included in the calculation of OUT_SET* and not in ET*. For the PMV index, the calculated values in winter are within the range from –3 (very cold) to +3 (very hot)

Chapter 5 Results and discussion
71
except in Old Damascus in the evening. Only Al Gassany area was comfort-able, i.e. within the comfort range of the index of –0.5 to +0.5 but this was mainly because the particular afternoon was exceptionally warm. In sum-mer the values were in general well above the defined range of PMV and reached as high as +8 in the Barzza area. Only the values of Old Damascus, both during the day and in the evening, were within the defined scale of PMV.
Table 5.3 Average values in summer and winter in all locations for the physiological equivalent temperature (PET), the outdoor standard effective temperature (OUT_SET*), the new effective temperature (ET*), and the predicted mean vote (PMV) where (W) is winter and (S) is summer
Avg PET °C Avg OUT_SET* °C Avg ET* °C Avg PMV
S W S W S W S W
Al Gassany area 46.1 23.2 36.0 27.6 36.7 23.9 5.5 0.2
Dummar area 53.3 7.2 38.4 15.6 38.4 10.6 6.5 –2.8
Barzza area 54.0 7.8 38.2 15.8 39.3 11.2 8.0 –2.5
Al Tigarra park 42.7 17.2 34.6 21.3 36.1 19.9 4.8 –1.6
Al Mazza park 53.2 11.1 37.9 19.4 39.1 15.2 7.7 –2.1
Old Damascus 35.3 6.7 32.3 14.4 31.9 8.6 2.9 –2.2
Barzza area (morning) 46.1 17.1 36.2 23.5 36.9 19.3 5.7 –1.1
Old Damascus (eve-ning)
26.3 2.0 25.7 9.9 25.5 5.5 0.5 –3.9
All locations 44.6 11.6 34.9 18.4 35.5 14.3 5.2 –2.0
In summer, the results show that streets and parks in modern Damascus are more thermally stressful than the streets in Old Damascus. This reflects the strong influence of the urban geometry on the microclimate within built environments. Old Damascus has deep street canyons with high aspect ra-tios, which create a more comfortable microclimate since direct solar ra-diation and the mean radiant temperature decrease with the increase of the aspect ratio. This agrees well with other studies such as Ali-Toudert and Mayer (2006) who found that the air temperatures decrease slightly with the increase of the aspect ratio, but the reduction of the radiation fluxes ex-pressed by MRT are far more decisive. In contrast, the outdoor spaces in modern Damascus have a low aspect ratio and consequently these spaces are more exposed to solar radiation, which has a negative impact on out-door thermal comfort. Moreover, few places in the studied areas of modern Damascus have been designed to protect against solar radiation, especially in the Barzza and New Dummar areas. However, in the parks and in Al Gas-sany area less stressful environments can be found due to the existence of shading trees. In winter, it was more difficult to compare the microclimatic qualities between the areas since the weather conditions varied from day to day during the fieldwork. Old Damascus was the coldest area and that is because of the cold weather on the measurement day as well as the deep canyon, which prevents the direct solar radiation to reach the ground. In contrast, Al Gassany area was most comfortable, and that is because of the warm weather on the measurement day as well as the fact that the urban geometry in Al Gassany area allows the solar beam to reach the ground.

Towards better Urban Spaces Moohammed Wasim Yahia
72
In this study, all the studied indices had basically the same tendency in assessing the outdoor physical urban environment in the hot dry climate of Damascus. The study of Spagnolo and de Dear (2003) found that many of the thermal comfort indices they tested were statistically better to predict the outdoor thermal comfort in summer than in winter due to the skewed nature of the winter sample in their study. In this study, no significant differ-ence could be found between summer and winter predictions (see Paper 2).The results however illustrate that the OUT_SET* index has better corre-lation with TSV and thermal unacceptability than the PET index and this may be due to the role of clothing and activity which are included in OUT_SET* as variables (i.e. not given a constant value).
5.3 Subjective thermal sensation Figure 5.2 illustrates the clear differences between people’s subjective thermal sensation in summer and winter for all studied locations together. The result shows that the people’s thermal sensation in summer is between cool and very hot, whereas in winter it is between very cold and hot. The highest percentage of people feels comfortable in the winter time, whereas they feel hot in the summer time. The reason why the distribution of the comfort votes was widely spread in both summer and winter is due to the varying weather conditions between the measurement days (especially in winter) but also due to individual differences of people’s thermal sensation. A similar difference in distribution between seasons was found in Sydney, Australia, by Spagnolo and de Dear (2003).
Figure 5.2 Frequencies for people's thermal perception in the summer and winter seasons
Behavioural adjustments – the role of clothing Figure 5.3 shows the relationship between clothing and the thermal sensa-tion votes in summer and winter as one sample. The distribution of clothing values is between 0.4 and 2.5 clo. This range represents people’s average

Chapter 5 Results and discussion
73
clothing values during the summer and winter seasons. Fig. 5.3 also illus-trates that when people vote within the cold side of the thermal comfort scale, they generally tend to wear heavy clothing, whereas when they vote within the warm side of the thermal comfort scale, they tend to wear light clothing. The result confirms that people’s consideration of their thermal comfort guides their choice of clothes.
Figure 5.3 Relationship between clothing and the thermal sensation votes in summer and win-ter
As expected, this study found that the insulation value of people’s cloth-ing tend to decrease with increasing temperatures. The summer (hot sea-son) values in this study are similar to those found by Lin (2009) in Taiwan (around 0.6 clo) (see Table 7 in Paper 2). The winter (cool season) values are however much higher in Damascus due to much colder winters. The study reveals that in the case of Damascus, the choice of clothing is to some extent also linked to cultural aspects; in the winter, high clothing val-ues (about 2 clo) occur also at the sensation “slightly cool” (–1) (Figure 5.3). These clothing values are represented by the values far above the re-gression curve. Thus in the winter, some people adjust their clothing ac-cording to the weather, whereas others use heavy clothing although it is slightly cold. Hence, the dress code of some of the people of Damascus seems to depend on cultural traditions rather than climate whereas most people choose their clothing according to the weather conditions.
5.4 Relationship between thermal sensation votes and thermal indices When comparing the relationship between the thermal sensation votes (TSV) and the calculated indices (PET and OUT_SET*) it was found that the original thermal sensation scales of these indices do not correspond to people’s actual thermal sensation in Damascus. Figure 5.4 shows the rela-tionship between TSV and the index temperatures for PET and OUT_SET* for each 1 °C index temperature (the samples were divided into bins for each 1 °C index temperature for the both indices). Although Figure 5.4

Towards better Urban Spaces Moohammed Wasim Yahia
74
shows a spread (especially for PET), dividing the samples into bins does not show the real spread since it only shows the average value for every studied bin. The individual spread reflects the variations in people’s thermal sensa-tion, which supposedly is due to differences in thermal history, emotional state, etc., as well as individual thermal preferences. For the PET index, the variations are also caused by differences in activity and clothing. The re-gression lines for all the tested indices for both seasons are as follows:
PET Summer TSV=0.060×PET – 0.941 (R2=0.42) (3) Winter TSV=0.114×PET – 2.755 (R2=0.60) (4)
OUT_SET* Summer TSV=0.134 ×OUT_SET –3.208 (R2=0.87) (5) Winter TSV=0.082×OUT_SET –2.928 (R2=0.66) (6)
Figure 5.4 Correlation between the mean thermal sensation votes (TSV) and a the PET index and b the OUT_SET* index in summer and winter
The slopes of the regression lines indicate the sensitivity to changes of the index values. In summer for PET, the slope is 0.060 corresponding to 16.6 °C PET per TSV unit, whereas in winter, the slope is 0.114 correspond-ing to 8.8 °C PET per TSV unit. This shows that people’s thermal sensation is more sensitive to the variations of PET in winter than in summer. A similar tendency was found by Lin (2009) in Taiwan. In the case of OUT_SET*, the slope for the summer is 0.134 which corresponds to 7.5 °C, whereas in win-ter, the slope is 0.082 and it corresponds to 12.2 °C per thermal sensation unit. This means that the people’s thermal sensation is more sensitive to the variations of OUT_SET* in summer than in winter. A similar tendency was found by Lin et al. in Taiwan (2011).
The results show that the OUT_SET* index – especially in summer – has better correlation with TSV than the PET index (R2 for OUT_SET* is about 0.7 in winter and 0.9 in summer, whereas R2 for PET is about 0.6 in winter and 0.4 in summer). This is because PET does not take clothing and activity into account as input data (Höppe, 1999). Thus, the use of OUT_SET* is more suitable than PET. But on the other hand, the choice of thermal com-fort index depends on the aim of the study. Among the tested indices, ET* does not take variations in wind speed into account and is thus less suitable for this reason. If the aim of the study is only to assess and evaluate the

Chapter 5 Results and discussion
75
physical environment independently from the people’s sensations, e.g., if the aim is to compare the thermal comfort of different design proposals through simulations, the urban designer or researcher can use any of the other indices tested in this study. If on the other hand, the aim is to assess the thermal environment taking into account people’s thermal sensation, one can use an index that takes clothing and activity into account such as OUT_SET* or PMV. The use of these indices however requires knowledge – or at least an estimate – about people’s clothing and activity. The fact that OUT_SET* is expressed in °C makes it easier to interpret than PMV. The PMV index is also restricted to moderate environments near neutrality (Spagnolo and de Dear, 2003).
5.5 Thermal comfort limits and neutral temperatures Figure 8 in Paper 2 shows the percentage of unacceptability in summer and winter for each 1 °C index temperature of the PET and OUT_SET* indices. From this graph, the upper and lower limits of the comfort range for differ-ent percentages of unacceptability can be determined. However, to obtain a comfort range with both the lower and upper limit, measurements during all seasons including spring and/or autumn would have been required, es-pecially in a hot dry climate where there is a considerable difference be-tween summer and winter. Since the field measurements in this study were only conducted during the extreme weather conditions of summer and winter respectively – and mainly during three hours of the afternoon – it was not possible to define one comfort range for the whole year which is accepted by 80% or 90% of the people. Instead, summer and winter sea-sons were split up into two different groups and the upper and lower com-fort limits for the summer and winter could be determined.
Table 5.4 shows the upper and lower limits of thermal comfort range for 80% and 90% acceptability for PET and OUT_SET* during summer and win-ter in Damascus. These limits are useful for architects and urban designers because they are valid for the most extreme weather conditions. The limits of 80% of acceptability will be applied in this study for further analysis since a wider comfort range is more appropriate outdoors due to the large cli-mate variability (Spagnolo and de Dear, 2003).
Table 5.4 Neutral temperatures and upper limits in summer and lower limits in winter of the comfort range at 80 % and 90 % acceptability for PET and OUT_SET* in Damascus
Index Neutral temperatures °C Comfort range limits °C
Winter Summer Acceptability (%)
Lower limit Winter
Upper limit Summer
PET 23.4 15.8 90 22.8 28.5
80 21.0 31.3
OUT_SET* 35.1 23.1 90 28.9 29.1
80 27.6 31.3

Towards better Urban Spaces Moohammed Wasim Yahia
76
Table 5.4 also illustrates that the neutral temperatures in summer for both PET and OUT_SET* are considerably lower than in winter. This may seem surprising since one would expect the local population to be adapted to the weather conditions in each season. However, the results agree with those of Spagnolo and de Dear (2003). They explained the phenomenon by applying the concept of alliesthesia which is a psychological mechanism explaining the differences in sensation between seasons, i.e. if people feel warm then anything which makes them feel colder will be pleasant and vice versa. Conversely, the results disagree with the results for Taiwan (Lin, 2009) and Cairo (Mahmoud, 2011) where the authors found slightly higher neutral temperatures in summer than in winter (see Table 8 in Paper 2).
This study has defined different thermal comfort limits for the summer and winter, whereas other studies such as Lin (2009) defined only one comfort range for the whole year. The reason to study the seasons sepa-rately is that it is believed that people adapt themselves differently to each season physiologically and psychologically (Mahmoud, 2011). Thus, the lower limit for PET in winter (21 °C) and the upper limit in summer (31 °C) are fairly close to the limits found by Mahmoud (2011) in an urban park in Cairo (22 °C and 29 °C, respectively). One explanation of this difference may be that the study of Cairo was only conducted in a park whereas this study was conducted in different urban environments. In fact, this study found that the parks in summer are less stressful than the built up environ-ments in the city (see Table 5.3).
For OUT_SET*, the winter neutral temperature in Damascus is higher than the summer one and the difference between the summer and winter neutral temperatures is 12 °C. This agrees well with the results in subtropi-cal Sydney (Spagnolo and de Dear 2003) where the difference was also around 12 °C. Moreover, the summer neutral temperatures in Damascus (23.1 °C) and in Sydney (23.3 °C) were almost equal. However, Lin et al. (2011) found higher neutral OUT_SET* in the hot season (29.3 °C) than in the cool season (28 °C).
5.6 Thermal sensation and aesthetic qualities of the place Figure 5.5a shows the percentage frequencies for the aesthetic quality of the places (beauty, ugliness). The results show that the majority of the peo-ple, 72% and 82% in summer and winter respectively, experience the same places as beautiful, whereas only 18% and 13% in summer and winter re-spectively experience the places as neutral, and 10% and 5% in summer and winter respectively experience the places as ugly (Chi-square = 10.52, P=.005, df = 2). Figure 5.5b illustrates the percentage frequencies of the pleasantness and unpleasantness in the place. The result shows that the majority of the people, 68% and 78% in summer and winter respectively, experience the same places as pleasant whereas, only 19% and 16% in summer and winter respectively experience the places as neutral, and 13% and 6% in summer and winter respectively experience the places as un-pleasant (Chi-square = 11.14, P=.004, df = 2).
Chapter 5 Results and discussion
77
The results show that the people experience the same places in the win-ter season more beautiful and pleasant than in the summer season. This indicates that people's perception of beauty and pleasantness is influenced by the weather and climate. Similar results were found in other studies in different climates (e.g. Knez & Thorsson, 2006). More results about thermal sensation and aesthetic quality of urban design are shown in Papers 4 and 5.
(a) (b)
Figure 5.5 People's perception of (a) beauty and (b) pleasantness in summer and winter
5.7 Landscape interventions in improving thermal comfort in Damascus The aim of this phase is to investigate how to improve the outdoor thermal comfort in Damscus during the summer and winter by studying different urban design scenarios and using different landscape elements in different hours of the day. Since PET can be used to compare the thermal comfort of different design proposals through simulations (see section 5.4), the ther-mal investigation was based on PET as an indicator whereas later on, PET and OUT_SET* were applied to investigate the use of different landscape elements in urban design.
The effect of urban design on thermal comfort Figure 5.6 shows the PET index results at 14:00 for the E–W street orienta-tion of the four studied cases including the base case. The figure illustrates that the urban space – pavements and the street – in the base case (Figure 5.6a) is very stressful (PET is between 51 and 58 °C). When the urban mor-phology is changed (Figure 4.5b), the thermal comfort is improved for the southern pavement where PET is about 36 °C (Figure 5.6b) because of the tall wall (7 m) that provides shade. In the case of trees on the pavements, thermal comfort is improved considerably both on the pavements and in the street space where PET is between 35 and 50 °C (Figure 5.6c). In the case of using shading devices together with trees on the pavements, ther-mal comfort is improved even more than the case of using only trees, and

Towards better Urban Spaces Moohammed Wasim Yahia
78
the PET varies between 32 °C under shade and 48 °C in the middle of the street (Figure 5.6d). In addition, more shaded spaces are provided over the pavements for pedestrians needs. The results indicate that the last case (Figure 5.6d) is clearly better than the other cases regarding outdoor ther-mal comfort. In addition, it is shown that the idea of using a mixture of shading devices and trees is a good strategy to have less stressful urban spaces.
Figure 5.6 Calculated PET at 14:00 for the E–W street orientation for the cases (a) base case, (b) urban morphology, (c) vegetation and (d) vegetation and shading devices
The effect of street orientation and seasonal differences on thermal comfort PET and OUT_SET* in summer Figure 5.7 shows the PET results of different street orientations for the case street trees and shading devices (best case) compared to the base case at 14:00 during the summer time. For the base case, the results show that a N–S orientation is less stressful than E-W mainly for the west pavement (Fig-ure 5.7b) due to the shade created by the buildings. By using street trees and shading devices, both orientations are more comfortable than the base case although N–S is a bit more stressful than E–W, especially in the spaces between buildings where the E–W orientation provides plenty of shade due to the self shading. On the other hand, the street space – in both orienta-tions – is less stressful when trees and shading devices are used over the pavements and this is because they help to prevent the solar radiation to heat up the street when solar elevation angles are high.

Chapter 5 Results and discussion
79
Figure 5.7 The PET results of different street orientations at 14:00 during the summer time, where: (a) base case E–W, (b) base case N–S, (c) vegetation and shading devices E–W and (d) vegetation and shading devices N–S
Figure 5.8 illustrates the OUT_SET* results of different street orientations for the case street trees and shading devices (best case) compared to the base case at 14:00 during the summer time. The result shows that OUT_SET* has the same tendency as PET (Figure 5.7) regarding the ther-mal comfort although OUT_SET* values – for both orientations – are lower than PET values. The maximum PET value in the base case for both orienta-tions (Fig. 5.7a,b) is about 58 °C, whereas it is about 41 °C for OUT_SET* (Fig. 5.8a,b). In the case of trees and shading devices, the maximum PET value for both orientations (Fig. 6a,b) is about 49 °C, whereas for OUT_SET* (Fig. 7a,b), it is about 36 °C. Although PET and OUT_SET* indices have dif-ferent thermal comfort scales, Figures 5.7 and 5.8 show that thermal com-fort at some spots was achieved for the both indices – especially over the pavements and in the spaces between buildings.

Towards better Urban Spaces Moohammed Wasim Yahia
80
Figure 5.8 The OUT_SET* results of different street orientations at 14:00 during the summer time, where: (a) base case E–W, (b) base case N–S, (c) vegetation and shading devices E–W and (d) vegetation and shading devices N–S
This study deals with detached buildings, which reflect the urban plan-ning regulations in Damascus. For the street space and the pavement in summer at 14:00, the simulations show that the N–S street orientation of the base case is less stressful than E–W for both PET and OUT_SET* (Figures 5.7 and 5.8). This agrees with other studies of urban canyons which report that a N–S orientation is more comfortable than E–W (Ali- Toudert and Mayer, 2006; Johansson, 2006a). In contrary, E–W orientation is more com-fortable than N–S in the case of the spaces between buildings (the side set-backs). This can be explained by the influence of the self-shading effect. When trees and shading devices are added, the thermal comfort for both PET and OUT_SET* is improved for both orientations. This agrees with other studies, which report that the direct radiation under the tree canopy significantly decreases (Ochoa et al., 2009; Ali- Toudert and Mayer, 2007). Conversely, the study also shows that for the best case (street trees and shading devices) the E–W orientation is slightly less stressful than N–S at street level (Figures 5.7 and 5.8). Thus, when proper horizontal shading is provided the street orientation is less important. For streets with detached buildings in Damascus, there is only a weak influence of street orientation and aspect ratio but a strong influence of vegetation on surface tempera-tures and outdoor thermal comfort (Paper 1). In addition, the lateral spaces between buildings (as a result of the side setbacks) are more comfortable for the E–W orientation than for the N–S due to the self shading created by the buildings (Figures 5.7 and 5.8). Thus, this study shows that the effect of street orientation on outdoor thermal comfort for detached buildings does

Chapter 5 Results and discussion
81
not only affect the street space, but also affects the spaces between build-ings. Consequently, in order to improve the thermal environment of de-tached urban morphologies, all spaces – including the streets and the spaces between buildings – must be taken into account in the urban and landscape design processes.
PET and OUT_SET* in winter In winter, the effect of street orientation and urban design on thermal com-fort is quite different from the summer time. Figure 5.9 and Figure 5.10 show the PET and OUT_SET* results respectively for different street orienta-tions for the case street trees and shading devices (best case) compared to the base case at 14:00. The results illustrate that the main difference be-tween E–W and N–S orientations for both PET and OUT_SET* is that there is no significant difference in maximum temperature values in the base case and the case where trees and shading devices are added. The maximum PET value of the base case for E–W (Figure 5.9a) is about 16 °C, whereas it is about 17 °C for N–S (Figure 5.9b). When trees and shading devices are added, the maximum PET value for E–W and N–S (Figures 5.9c and 5.9d) is about the same (15 °C). On the other hand, the maximum OUT_SET* value in the base case for E–W (Figure 5.10a) is about 23 °C, whereas it is about 24 °C for N–S (Figure 5.10b). When trees and shading devices are added, the maximum OUT_SET* value for E–W and N–S (Figures 5.10c and 5.10d) is similar (22 °C).
Figure 5.9 The PET results of different street orientations at 14:00 during the winter time where: (a) base case E–W, (b) base case N–S, (c) vegetation and shading devices E–W and (d) vegetation and shading devices N–S

Towards better Urban Spaces Moohammed Wasim Yahia
82
Figure 5.10 The OUT_SET* results of different street orientations at 14:00 during the winter time where: (a) base case E–W, (b) base case N–S, (c) vegetation and shading devices E–W and (d) vegetation and shading devices N–S
In winter, the N–S orientation is more comfortable in the early afternoon than E-W for the base case, at least the eastern pavement (Figure 5.9b and Figure 5.10b). For the E–W orientation, the building geometry affects the radiation and creates a shade which partly covers the northern pavement (Figure 5.9a and Figure 5.10a). The best case follows the same pattern al-though there is much more shade than in the base case due to the trees and the shading devices. The great improvement in summer for the best case thus implies slightly worsened conditions during winter. This agrees well with other studies in hot dry climate (Hedquist and Brazel, 2014) which reported that the high building density and narrow canyons are less com-fortable than more open landscape during the cold days.
Spatial and temporal variations of thermal comfort Figure 5.11 and Figure 5.12 show the PET and OUT_SET* values for the en-tire area of zones A, B and C (see Figure 4 in Paper 6) for the base and best cases for the summer, which is the most problematic season. For both in-dices, there is a considerable thermal comfort improvement when street trees and shading devices are used. For PET, Figure 5.11b shows that minimum and maximum values – for the case of trees and shading devices – are 30.2 °C and 49.4 °C respectively, whereas for the base case, the mini-mum and maximum values are 35.1 °C and 57.5 °C respectively (Figure 5.11a). The most decisive improvement occurs at 14:00 and 16:00 for the E–

Chapter 5 Results and discussion
83
W orientation and the difference between the average PET values of the base and best cases is 10.5 °C at 12:00 and 14:00. The average values of PET are clearly above the upper limit of thermal comfort. However, the mini-mum values are slightly below or above this limit, which shows that com-fortable spots exist in the street space.
For OUT_SET*, the tendency is the same as for PET, (Figure 5.12). How-ever, the values of OUT_SET* are closer to the thermal comfort limits and the difference between minimum and maximum values is, in general, lower. Figure 5.12b shows that minimum and maximum values for the best case are 27.9 °C and 36.3 °C respectively, whereas the minimum and maximum values for the base case are 30.1 °C and 40.6 °C respectively (Figure 5.12a). The most decisive improvement occurs also at 14:00 and 16:00 for the E–W orientation and the difference between the average OUT_SET* values of the base and best cases is 4.2 °C at 12:00 and 4.4 °C at 14:00. The average values of OUT_SET* are, with a few exceptions, a few °C above the upper limit of thermal comfort. However, all minimum values are clearly below this limit, which shows that comfortable spots exist in the street space for all studied hours.
Figure 5.11 The minimum, maximum and average values of PET for different street orienta-tions in all studied zones A, B and C (Figure 4 in Paper 6) at 12:00, 14:00 and 16:00 during the summer time where (a) the base case, (b) the best case (street trees and shading devices) and the horizontal dotted line is the upper comfort limit in summer for PET

Towards better Urban Spaces Moohammed Wasim Yahia
84
Figure 5.12 The minimum, maximum and average values of OUT_SET* for different street ori-entations in all studied zones A, B and C (Figure 4 in Paper 6) at 12:00, 14:00 and 16:00 dur-ing the summer time where (a) the base case, (b) the best case (street trees and shading de-vices) and the horizontal dotted line is the upper comfort limit in summer for OUT_SET*
This study confirms that there are many spots within the pedestrian zones where comfort limits are reached (see Figures 5.7c, d and 5.8c, d). It is thus possible to achieve thermal comfort for both E–W and N–S street orientations during the warmest hours (at 12:00, 14:00 and 16:00 LT) in summer time which is the most problematic season, (see Figure 14 in Pa-per 6).
5.8 Thermal comfort evaluation for an urban design proposal Figure 5.13 illustrates the OUT_SET* results of the E–W street orientation for the studied urban design at 14:00 during the summer and winter seasons. Figure 5.13a shows that in summer, the southern side of the pedestrian and vehicle street (see Figure 4.8) is totally under shade and the values of OUT_SET* vary between 31 °C and 32.4 °C. The northern side of this street is partly under shade at 14:00 and the values of OUT_SET* – at the shaded

Chapter 5 Results and discussion
85
spces – vary between 31.2 °C and 32.5. Since the thermal comfort was cal-culated at pedestrian level (1.1 m height), the shaded spaces near buildings are mainly due to the projections over the level 1.1 m. Such projections prevent the solar radiation to reach the ground especially during the sum-mer midday when the sun angle (elevation angle) is high. It should also be noted that the spaces under the horizontal parking shading devices as well as the spaces on the northern side of the vertical grapevines are shaded and the OUT_SET* values are between 31.4 °C and 32 °C. However, the ef-fect of horizontal shading devices on thermal comfort seems to be more efficient than vertical devices (Figure 5.13a). Regarding the outdoor thermal comfort limits, the results show that it is possible to reach the upper limit (31.3 °C for OUT_SET*) (see Paper 2) during the warmest hour in the sum-mer. This agrees well with what was found in Paper 6. Regarding the pe-destrian and biking street, the results show the same tendency and the same shading patterns. However, due to the different urban design ele-ments (see Figure 4.9) – such as trees, booths, benches with both vertical and horizontal shading devices – that are placed in the street spaces, the thermal comfort at the middle of this street space is slightly better than the space in the middle of the pedestrian and vehicle street.

Towards better Urban Spaces Moohammed Wasim Yahia
86
SET
31.00 C
32.00 C
33.00 C
34.00 C
35.00 C
36.00 C
37.00 C
38.00 C
39.00 C
40.00 C
SET
16.00 C
17.00 C
18.00 C
19.00 C
20.00 C
21.00 C
22.00 C
23.00 C
24.00 C
25.00 C
(a) (b)
Figure 5.13 OUT_SET* results of the E–W street orientation for the studied urban design at 14:00 during (a) summer and (b) winter seasons
0 10 20 30 40 50 60 70 80 90 100 110 120 130 140
9
19
29
39
49
59
69
79
89
99
109
119
129
139
149

Chapter 5 Results and discussion
87
As expected, Figure 5.13b shows that in the winter time the urban mor-phology affects the radiation and creates a shade which almost covers the northern pavements for both street patterns. In addition, the low sun angle (elevation angle) in winter worsened the situation. Moreover, the urban de-sign elements – such as trees, shading devices (vertical and horizontal) – play a negative role in decreasing the level of thermal comfort. This result confirms the results of the parametric study (Paper 6) – that the great im-provement in summer may imply slightly worsened conditions during win-ter. Again, this agrees well with other studies in hot dry climate such as Hedquist and Brazel (2014) who reported that the high building density and narrow canyons are less comfortable than more open landscape during the cold days.
The obvious way to improve the level of outdoor thermal comfort in win-ter is the adaptation through clothing (Hedquist and Brazel, 2014). Regard-ing the urban design, the lack of thermal comfort during winter is mainly due to high H/W ratios and urban design elements such as landscape ele-ments and shading devices (see Paper 6). For existing urban developments, it is not possible to remove buildings in order to improve the thermal com-fort. However, the roof parapet can be redesigned to allow more solar ra-diation in winter to pass through and prevent – in turn – the radiation during the summer time. This can be done by using openings in the parapet. In winter, these openings will be opened and more solar radiation will pass through whereas in summer, the openings can be closed by grapevines or by other materials such as tissues, fabric or tarpaulin. In Damascus, if there is any equipment on the roof such as heating equipment, cooling equip-ment or water tanks, it is then recommended to hide such equipment be-hind a wall. Thus, the height of the parapet can exceed 3 m. To choose the right type of vegetation is also important; using non-evergreen trees can help the solar radiation to reach the ground. In addition, using flexible shad-ing devices – that can be regulated in summer and winter – can provide a good strategy to have more radiation and heat up the area during the winter season.
For new urban residential areas in Damascus, some plots in the streets could be transformed into small public spaces. This can be an efficient so-lution to have more solar radiation during the winter although these spaces need protection against the solar radiation during the summer. The plots most suitable to be transformed into public spaces are the ones located on the southern side of the street. This is mainly an action to allow the winter solar radiation to reach the northern side of the street. Creating better pub-lic spaces can also enhance social contacts and improve the quality of life.

Towards better Urban Spaces Moohammed Wasim Yahia
88

89
6 Conclusions and propositions This Chapter shows how this research contributes to knowledge in the field of urban microclimate and thermal comfort. Moreover, it includes conclu-sions and propositions based on the results and discussion presented in this study. In addition, suggestions for future studies are presented.
Based on the results and discussion, a set of fundamental contributions to the field of microclimte and outdoor thermal comfort in hot dry regions are high-lighted. In general, the overall contribution is empirical. However, theoretical knowledge was also developed. The contribution to knowledge can be summarized as the following:
1 Evidence of the need for updating the urban planning regulations in Damascus according to microclimate and thermal comfort needs.
2 Empirical validation of the need of shade as opposed to existing urban planning regulations in Damascus.
3 Empirical definition of the summer and winter thermal comfort limits for hot dry Damascus.
4 Empirical validation of the urban design application based on the thermal comfort limits defined for hot dry Damascus.
5 Theoretical contribution to climate-conscious urban design in Da-mascus (the importance of using flexible urban design and land-scape elements).
6.1 Urban planning regulations and urban design This study analyzed the urban planning regulations in Damascus from a climatic perspective. The simulations revealed the shortcomings of the cur-rent planning regulations as regards the outdoor thermal comfort at street level in the summer time. The regulations for modern Damascus prescribe wide streets and pavements, large setbacks and relatively low building heights. This leads to a dispersed urban form where a large part of the buildings and streets are exposed to solar radiation. The existing planning regulations in Damascus have no requirements for shading for pedestrians, e.g. shading devices, arcades and projecting upper floors or shading trees. Apart from leading to poor microclimatic conditions in the summer, the land use in the modern part of Damascus is highly inefficient, with a dis-proportionately large amount of ground occupied by streets, pavements and yards. In the case of urban canyons, the study confirmed that the as-pect ratio, street orientation, and vegetation were very important in street design. On the other hand, in urban environments consisting of detached buildings as in modern Damascus, the influence of street orientation and aspect ratio on surface temperatures and outdoor thermal comfort was less

Towards better Urban Spaces Moohammed Wasim Yahia
90
important. Meanwhile, the use of vegetation proved to reduce surface tem-peratures and improve the outdoor thermal comfort substantially.
When planning future urban residential areas in Damascus, it is therefore important to update the existing urban planning regulations according to the climatic requirements. This can be done by reducing front and side set-backs or to have none at all, planning narrower streets, increase the maxi-mum number of floors permitted, and allowing projections of upper floors. Moreover, architectural design elements, which provide shade for pedest-rians at street level such as balconies and arcades, could be more used. Outdoor thermal comfort in existing urban areas in modern Damascus could also be improved by introducing vegetation and landscaping in the urban design. It is therefore important to create a link between landscape design and urban planning regulations. Such a link could be as a set of guidelines for street design and plant selection, i.e. choosing the right type of vegetation and using non-evergreen trees that can help the solar radia-tion to reach the ground in winter season. For future urban residential areas, this study also proposes that some plots in the streets could be trans-formed into small public spaces. This can be an efficient solution to have more solar radiation during the winter although these spaces need protec-tion against the solar radiation during the summer. The plots most suitable to be transformed into public spaces are the ones located on the southern side of the street. This is mainly an action to allow the winter solar radiation to reach the northern side of the street.
Regarding the existing urban spaces in modern Damascus, this study highlighted the importance of a climate-conscious urban design and design flexibility. The study argued that the lack of thermal comfort during winter was mainly due to shade, despite the high H/W ratios and because of land-scape elements. For existing urban developments, it is not possible to re-move buildings in order to improve the thermal comfort. However, the roof parapet can be redesigned to allow more solar radiation in winter to pass through and prevent – in turn – the radiation during the summer time. This can be done by using openings in the parapet. In winter, these openings will be kept open and more solar radiation will pass through whereas in summer, the openings can be closed by grapevines or by other materials such as tissues, fabric or tarpaulin. In Damascus, if there is any equipment on the roof such as heating equipment, cooling equipment or water tanks, it is then recommended to hide such equipment behind this parapet. Thus, the height of the parapet can exceed 3 m. To choose the right type of vege-tation is also important; using non-evergreen trees can help the solar radia-tion to reach the ground. In addition, using flexible shading devices – that can be regulated to give shade in summer and allow solar access in winter – will be a good strategy to have more radiation and heat up the area during the winter season.
6.2 Microclimate and outdoor thermal comfort limits This study assessed the microclimate of the outdoor urban environment and investigated the relationship between different thermal comfort indices and people’s actual thermal sensation in the hot dry city of Damascus. It is concluded that the thermal conditions of different outdoor environments

Chapter 6 Conclusions and propositions
91
varied considerably, mainly as a function of solar access. In general, areas that provide shade – either by buildings, such as Old Damascus, or vegeta-tion – were more comfortable in summer than in winter. Conversely, street canyons and parks in modern Damascus, which were open to solar access, were more comfortable in winter than in summer. Furthermore, this study defined the summer and winter thermal comfort limits for PET and OUT_SET* in hot dry Damascus. The study found that these thermal com-fort limits were much higher than for temperate climates and slightly differ-ent from other cities in hot dry or similar climates. Defining the thermal comfort limits is important information for urban designers aiming at a cli-mate-conscious urban design. The study also showed the influence of cul-ture and clothing traditions. While most people chose the clothing accord-ing to the climate, some people in Damascus were influenced by their cul-tural traditions when they chose how to dress and thus used heavy clothing in spite of the hot climate.
The study proposes that the thermal sensation of people can be im-proved by enhancing the urban design in Damascus city as well as by add-ing trees or shading devices in order to provide shade for people who pass by and linger on streets and public places. It is thus important to consider microclimate and thermal comfort in the urban design process. This can be done by providing a basic knowledge for architects, designers, and plan-ners about the importance of microclimate and thermal comfort and how to create better urban spaces in harmony with the microclimate. Based on this knowledge, summer and winter thermal comfort limits can be used as a goal to design better urban spaces.
The conclusions of this study cannot be generalized for all hot dry cities since there are considerable variations between different cities in terms of size, planning principles, proximity to the sea, topography, etc. However, due to the similarity of climate classification, urban morphologies and ur-ban regulations, the results of this study can be applied for different cities in Syria such as Homs, Hama, Daraa, etc. In addition, the propositions of this study can be useful to consider in other hot dry cities such as cities in the Middle East, North Africa and United States in order to create a future data-base on how to develop the outdoor thermal comfort and urban design in the hot dry built environments.
6.3 Future studies Further studies in the field of microclimate and thermal comfort are needed in hot dry regions particularly since this and other studies have shown that the actual thermal sensation is not only affected by microclimatic parame-ters (air temperature, mean radiant temperature, relative humidity, and wind speed) and personal parameters such as people’s activities and cloth-ing. Thus, more studies about the relationship between the actual thermal sensation and other parameters – such as gender, age, thermal history, and people’s emotional states – are needed. The thermal comfort and accept-ability limits are also needed to be defined in other hot dry cities. Such lim-its are important to be able to develop the urban spaces in the city in har-mony with microclimate. Additionally, it is important to update the existing urban planning regulations in every city according to the climatic require-ments. Thus, further studies to analyze the existing regulations from a cli-matic point of view are needed.

Towards better Urban Spaces Moohammed Wasim Yahia
92
For the hot dry city of Damascus, defining the thermal sensation scale from very cold to very hot as well as the comfort zone including summer, winter, autumn and spring is needed. In addition, in-depth studies about people’s clothing and activities – including both summer and winter sea-sons – ought to be done in order to create a database to be used for im-proving the quality of the urban spaces. Furthermore, investigating how to create better urban design in Damascus taking into account the role of cul-ture, thermal sensation and physical behaviour is also an example of what can be done. In the long-term perspective, further studies on urban climate in Damascus could be carried out such as creating climate maps for Da-mascus. Such maps will be helpful for planners and architects to see which areas are more comfortable than others so as to determine where to build new urban areas in the city.

93
References Ali-Toudert, F.
2005 Dependence of outdoor ther-mal comfort on street design in hot and dry climate. Ph.D Dis-sertation, Universität. Freiburg.
Ali-Toudert, F. and H. Mayer
2006 “Numerical study on the effects of aspect ratio and solar orien-tation on outdoor thermal com-fort in hot and dry climate”, Building and Environment 41: 94–108.
2007 “Effects of asymmetry, galler-ies, overhanging facades and vegetation on thermal comfort in urban street canyons”, Solar Energy 81: 742–754.
Al-Hemaidi, W.K.
2001 “The metamorphosis of the ur-ban fabric in an Arab-Muslim city: Riyadh, Saudi Arabia”, Journal of Housing and the Built Environment 16: 179–201.
Al Jawabra, F. and M. Nikolopoulou
2009 “Outdoor Thermal Comfort in the Hot Arid Climate, the effect of socio-economic background and cultural differences”, 26th Conference on Passive and Low Energy Architecture PLEA, Quebec City.
Al-Kodmany, K.
1999 “Residential Visual Privacy: Traditional and Modern Archi-tecture and Urban Design”, Journal of Urban Design 04: 283–312.
Al-Qattan, N.
2002 “Litigants and Neighbours: The Communal Topography of Ot-toman Damascus”, Compara-tive Studies in Society and His-tory 44 (3): 511–533.
Andrade, H., Alcoforado, M. J., and S., Oliveira
2011 “Perception of temperature and wind by users of public outdoor spaces: relationships with weather parameters and personal characteristics”, Inter-national Journal of Biometeo-rology 55: 665–680.
Arnfield, A.J
2003 “Two decades of urban climate research: a review of turbu-lence, exchanges of energy and water, and the urban heat is-land”, International Journal of Climatology 23: 1–26.
ASHRAE
1997 1997 ASHRAE Hand book: Fun da men tals (SI Edition), Ata-lanta: American Society of Heating, Refrigerating and Air-Conditioning Engineers.
ASHRAE Standard 55
2004 Thermal environmental condi-tions for human occupancy: American Society of Heating, Refrigerating and Air- Condi-tioning Engineers.
Baker, L.A., Brazel, A.J., Selover, N., Martin, C., McIntyre, N., Steiner, F.R., Nelson A and L. Musacchio
2002 “Urbanization and warming of Phoenix (Arizona, USA): im-pacts, feedbacks and miti-gation”, Urban Ecosystems 6: 183–203.
Ballantyne, E. R., Hill, R. K. and J.W. Spencer
1977 “Probit Analysis of Thermal Sensation Assessments”, Inter-national Journal of Bio-meteorology 21: 29–43.

Towards better Urban Spaces Moohammed Wasim Yahia
94
Beckham, R.J.
1980 Shadowpack PC version 2. Is-pra, Joint Research CentraI-21020.
Behsh, M.B.
1993 Urban Towards housing in harmony with place – Con-stancy and change in the tradi-tional Syrian house from the standpoint of environmental adaptiono.PhD Thesis, Housing Development and Mana-gement, Lund University, Swe-den.
Berkovic, S., Yezioro, A. and A. Bitan
2012 “Study of thermal comfort in courtyards in a hot arid cli-mate”, Solar Energy 86: 1173–1186.
Bianca, S.
2000 Urban Form in the Arab World: Past and Present. London: Thames & Hudson.
Bourbia, F. and H.B. Awbi
2004a “Building cluster and shading in urban canyon for hot dry climate. Part 1: Air and surface temperatura measurements”, Renewable Energy 29: 249–262.
2004b “Building cluster and shading in urban canyon for hot dry climate. Part 2: Shading simu-lations”, Renewable Energy 29: 291–301.
Bourbia, F. and F. Boucheriba
2010 “Impact of street design on ur-ban microclimate for semi arid climate (Constantine)”, Re-newable Energy 35: 343–347.
Bruse, M.
2009 ENVI-met website. http://www.envi-met.com
CBS
2004 Statistical Abstract for the year 2004, Chapter 2 : Population & Demographic Indicators. Cen-tral Bureau of Statistics in Syria (CBC). Syrian government:
CBS. website: http://www.cbssyr.sy.
2011 Statistical Abstract for the year 2011, Chapter 1: Physical Fea-ture. Central Bureau of Statis-tics in Syria (CBC). Syrian gov-ernment: CBS. website: http://www.cbssyr.sy.
Chen, L., and E. Ng
2012 “Simulation of the effect of downtown greenery on thermal comfort in subtropical climate using PET index: a case study in Hong Kong”, Architectural Science Review, 56 (4): 297–305.
Creswell, J.W.
1994 Research Design: Qualitative, Quantitative Approaches. Thousand Oaks: Sage publica-tions.
2013 Research Design: Qualitative, Quantitative, and Mixed Methods Approaches. 4th ed. Thousand Oaks: Sage publications.
Cornford, F.M.
2003 Plato's theory of knowledge: The theaetetus and the sophist. New York: Dover Publications.
Damascus Municipality
1997 Construction regulations for the city of Damascus. Damascus: Damascus Municipality. (In Arabic).
Djenane, M., Farhi, A., Benzerzour, M. and M. Musy
2008 “Microclimatic behaviour of urban forms in hot dry regions, towards a definition of adapted indicators”, 25th International Conference on Passive and Low Energy Architecture PLEA, Dublin.
Dorai, M.K.
2009 L'exil irakien à Damas. Modes d'insertion urbaine et recon-figuration des réseaux migrtoires, “Irakian exile in Damascus. Mode of urban inte-

References
95
gration and reconfiguration of migration networks” Echogeo, 8 (non paginé), website: http://halshs.archives-ouvertes.fr/halshs-00372155/fr/
Eben Saleh, M.A.
2001 “The evolution of planning and urban theory from the perspec-tive of vernacular design: MOMRA initiatives in improving Saudi Arabian neighbour-hoods”, Land Use Policy 18: 179–190.
Eliasson, I.
2000 “The use of climate knowledge in urban planning”, Landscape and Urban Planning 48: 31–44.
Eliasson, I., Knez, I., Westerberg, U., Thorsson, S and F. Lindberg
2007 “Climate and behaviour in a Nordic city”, Landscape and urban planning 80: 72–84.
El-Ibrahim, K.
2001 Spontaneous Settlements around the City of Damascus, Damascus: University of Da-mascus.
Emmanuel, R.
2005 An urban approach to climate-sesitive design: strategies for the tropics. London: Spon Press.
Emmanuel, R., Rosenlund, H. and E. Johansson
2007 “Urban shading – a design op-tion for the tropics? A study in Colombo, Sri Lanka”, Interna-tional Journal of Climatology 27: 1995–2004.
Encyclopaedia Britannica Online
2007 http://www.britannica.com/
Evans, J.M.
1980 Housing, Climate and Comfort. London: The Architectural Press.
Evyatar, E., Pearlmutter, D. and T. Williamson
2011 Urban Microclimate. London, Washington DC: Earthscan.
Fahmy, M., and S. Sharples
2009 “On the development of an ur-ban passive thermal comfort system in Cairo, Egypt”, Build-ing and Environment, 44, 1907–1916.
FIG
2010 Rapid Urbanization and Mega Cities: The Need for Spatial In-formation Management. Re-search study by the Interna-tional Federation of Surveyors (FIG). FIG, Copenhagen. web-site. http://www.fig.net
Fountain, M. E. and C. Huizenga
1994 Using the ASHRAE thermal comfort tool. An ASHRAE Spe-cial Publication, ASHRAE, At-lanta.
Givoni, B.
1976 Man, Climate and Architecture. New York: Van Nostrand Rein-hold.
1998 Climate considerations in build-ing and urban design. New York: Van Nostrand Reinhold.
Grazziotin, P.C., B. Turkienicz, L. Sclovsky. and C.M.D.S. Freitas
2004 “City-Zoom: a tool for the visu-alization of the impact of urban regulations”, Proceedings of the 8th Iberoamerican Con-gress of Digital Graphics 216–220.
Groat, L., and D. Wang
2002 Architectural Research Meth-ods. New York: John Wiley & Sons.
Hacking, I.
1983 Representing and Intervening: Introductory Topics in the Phi-losophy of Natural Science. Cambridge: Cambridge Univer-sity Press.

Towards better Urban Spaces Moohammed Wasim Yahia
96
Harlan, S.L., Brazel, A.J., Prashad, L., Stefanov, W.L. and L. Larsen
2006 “Neighborhood microclimates and vulnerability to heat stress”, Social Science & Medi-cine 63(11):2847–2863.
Harris, J.M.
2000 Basic Principles of Sustainable Development. The Global De-velopment and Environment Institute (GDAE), working pa-per 00-04. https://notendur.hi.is/bdavids/UAU101/Readings/Harris_2000_Sustainable_development.pdf
Hashimoto, T.
2009 Strategy and Frameworks for the Damascus City Urbaniza-tion To Guide the City Master Plan Revision, The Project for Urban Planning and Develop-ment in Damascus Metropoli-tan Area in the Syrian Arab Re-public, DMA-UPD Discussion Paper Series No. 2.
Hedquist, B.C. and A.J. Brazel
2014 “The Seasonal variability of temperatures and outdoor hu-man comfort in Phoenix, Ari-zona, USA”, Building and Envi-ronment 72: 377–388.
Höppe, P.
1999 “The physiological equivalent temperature – a universal index for the biometeorological as-sessment of the thermal envi-ronment”, International Journal of Biometeorology 43: 71–75.
Höppe, P.
2000 “The Physiological Equivalent Temperature (PET): An Exam-ple of a State -of-the-Art Out-door Thermal Comfort Index”, presented at internet workshop on Windchill.
IPCC
2013 Climate Change 2013: The Physical Science Basis. Work-ing Group and Contribution to
the fifth assessment report of the Intergovernmental Panel on Climate Change (IPCC), Sum-mary for Policymakers. Switzer-land: IPCC Press. website: http://www.climatechange2013.org.
IRIN 2006 Syria: Massive Investment Nee-
ded If Damascus To Avert Wa-ter Crisis’, Humanitarian news and analysis (IRIN), a service of the UN Office for the Coordina-tion of Humanitarian Affairs, website: http://www.irinnews.org/report.
aspx?reportid=61878.
Jendritzky, G. and W. Nübler
1981 “A model analysing the urban thermal environment in physio-logically significant terms”, Journal of Meteorology and Atmospheric Physics 29: 313–326.
Jendritzky, G., Staiger, H., Bucher, K., Graetz, A., and G. Laschewski
2000 “The perceived temperature: The method of the Deutscher Wetterdienst for the Assess-ment of Cold Stress and Heat load for the Human Body”, Pre-sented at Internet Workshop on Windchill.
Jenkins, P., Smith, H., and P. Wang
2007 Planning and housing in the rapidly urbanising world. Lon-don, New York: Routledge.
Johansson, E.
2006a“Influence of urban geometry on outdoor thermal comfort in a hot dry climate: A study in Fez, Morocco”, Building and Environment 41: 1326–1338.
2006b Urban design and outdoor thermal comfort in warm cli-mates – studies in Fez and Co-lombo. PhD Thesis, Housing Development and Mana-

References
97
gement, Lund University, Swe-den.
Johansson, E. and M.W. Yahia
2010 “Towards a Climate- Sensitive Urban Design: The Need to Modify Current Planning Regu-lations”, 7th International Con-ference of the Centre for the Study of Architecture in Arab Region, Amman, Vol. 2: 293–306.
Juvara, M.
2012 “Urban Design-based Zoning to Guide Fast Growth”, 48th iso-carp congress 2012 on fast for-ward: planning in a (hyper) dy-namic urban context, Perm, Russia.
Katzschner, L. and S. Thorsson
2009 “Microclimatic Investigations as Tool for Urban Design”, 7th In-ternational Conference on Ur-ban Climate (ICUC7), Yoko-hama, Japan.
Kakon, A.N., Nobuo, M., Kojima, S., and T. Yoko
2010 “Assessment of Thermal Com-fort in Respect to Building Height in a High-Density City in the Tropics”, American J. of En-gineering and Applied Sciences 3 (3): 545–551.
Khadour, y. and M. Kafa
2009 “Discussion of Random and Informal Settlements in Da-mascus”, Journal of Geo-spatial Information Science 12(4): 289–295.
Knez, I. and S. Thorsson
2006 “Influences of culture and envi-ronmental attitude on thermal, emotional and perceptu-alevaluations of a public square”, International Journal of Biometeorology 50: 258–268.
Koenigsberger, O.H., T.G Ingersoll, A. Mayhew., and S.V. Szokolay
1974 Manual of Tropical Housing and Building. Part 1: Climatic Design. London: Longman.
Lababedi, Z.
2009 The Urban Development of Damascus: A Study of its past, present and future. MSc Disser-tation, University College Lon-don, UK.
Lau, K.L., and E. Ng
2013 “An Investigation of Urbaniza-tion Effect on Urban and Rural Hong Kong using a 40-year Ex-tended Temperature Record”, Landscape and Urban Planning 114: 42–52.
Library of Congress
2005 Country Profile: Syria (up-dated), Congressional Re-search Service Federal Re-search Division, Library of Con-gress, Web site: http://lcweb2.loc.gov/frd/cs/profiles/Syria.pdf
Lin, T.P.
2009 “Thermal perception, adaption and attendance in a public square in hot and humid re-gions”, Building and Environ-ment 44: 2017–2026.
Lin, T.P., de Dear, R., and Hwang, R.L.
2011 “Effect of thermal adaptation on seasonal outdoor thermal comfort”. Internayional Journal of Climatology 31: 302–312.
Mahadin, K.O.
2001 Landscape plants for Jordan and the Middle East. Jordan: M.K. associates.
Mahmoud, A.H.A.
2011 “Analysis of the microclimatic and human comfort conditions in an urban park in hot and arid regions”, Building and Envi-ronment 46: 2641–2656.
Towards better Urban Spaces Moohammed Wasim Yahia
98
Makaremi, N., Salleh, E., Jaafar, M.Z., Hosein, A., and G. Hoseini
2012 “Thermal comfort conditions of shaded outdoor spaces in hot and humid climate of Malay-sia”, Building and Environment 48: 7–14.
Matzarakis, A., Rutz, F., and Mayer, H.
2007 “Modelling radiation fluxes in simple and complex environ-ments – application of the RayMan model”, International Journal of Biometeorology 51:323–334.
McIntyre, D.A.
1980 Indoor Climate. London: Ap-plied Science Publishers.
Meteonorm 6.0
2013 A comprehensive meteorologi-cal reference, Website Me-teonorm.com
Moore, D.S., and G.P. McCabe
1993 Introduction to the Practice of Statistics. New York: Freeman and Co.
Nikolopoulou, M., Baker, N., and K. Steemers
2001 “Thermal comfort in outdoor urban spaces: understanding the human parameter”, Solar Energy 70: 227–235.
Ng, E.
2010 Designing high-density cities for social and environmental sus-tainability. (Ed). London, New York: Earthscan.
Ochoa, J.M. and R. Serra
2009 “Vegetation influences on the human thermal comfort in out-door spaces”, Retrieved June 10, 2010, from School of Archi-tecture of Barcelona, Dept. Constructions Arquitectòniques I & Dept. Física Aplicada, Web site: http://www.fa.upc.es/personals/jroset/lyonvege.html
Oke, T.R.
1987 Boundary Layer Climates. 2nd edition. London, New York: Routledge.
Olgyay, V.
1963 Design with climate-bioclimatic approach to architectural re-gionalism. New Jersey: Prince-ton.
Pearlmutter, D., Berliner, P., and E. Shaviv
2006 “Physical modelling of pedes-trian energy exchange within the urban canopy”, Building and Environment 41: 783–795.
2007 “Integrated modelling of pe-destrian energy exchange and thermal comfort in urban street canyons”, Building and Envi-ronment 42: 2396–2409.
Pickup, J., and R.J. de Dear
2000 “An outdoor thermal comfort index (OUT_SET*) – Part I – The model and its assump-tions”, In: de Dear, R.J. et al. (eds.), Biometeorology and Ur-ban Climatology at the Turn of the Millennium. Sydney: World Meteorological Organization, p. 279–283.
Robson, C.
2002 Real World Research. 2nd ed. Oxford: Blackwell.
Salehi, E.
2007 “Specification of urban regu-lation in a sustainable city”, The International Journal of Sus-tainable Development and Planning 3: Paper DOI: 10.2495/SDP070161.
Shashua-Bar, L., Erell, E., and D. Pearlmutter
2011 “The influence of trees and grass on outdoor thermal com-fort in a hot-arid environment”, International Journal of Clima-tology 31: 1498–1506.

References
99
Spagnolo, J., and R. de Dear
2003 “A field study of the thermal comfort in outdoor and semi-outdoor environments in sub-tropical Sydney Australia”, Building and Environment 38: 721–738.
Tannerfeldt, G., and P. Ljung
2006 More urban, less poor. London: Earthscan.
Thorsson, S., Lindqvist, M., and S. Lindqvist
2004 “Behaviour in an urban park in Göteborg, Sweden”, Inter-national Journal of Biometeo-rology 48: 149–156.
Thorsson, S., Honjo, T., Lindberg, F., Eliasson, I., and E.M. Lim
2007 “Thermal comfort and outdoor activity in Japanese urban pub-lic places”, Environment and Behaviour 39: 660–684.
UN-Habitat
1996 United Nations Conference on Human Settlements (Habitat II). Istanbul, Turkey, 3–14 June.
2001 Implementing the habitat agenda: Urban Management Programme – City Consultation Case Studies, UNCHS, Nairobi.
2004 Urban indicators guidlines: monitoring the Habitat Agenda and the Millennium Develop-ment Goals, UNDP, Nairobi.
2010 World Urban Forum 5 (WUF5), Rio de Janeiro, Brazil, 22–26 March. website: http://unhabitat.org.
2012 World Urban Forum 6 (WUF6), Naples, Italy, 1–7 September. website: http://unhabitat.org.
Wessex Institute of Technology, UK
2011 Fifth International Conference on Sustainable Development and Planning, 12–14 July, New Forest, UK.
http://www.wessex.ac.uk/11-conferences/sdp-2011.html
Wifstrand, E. and J. Ria
2009 Mezzeh, Damascus: Modern Damascus.
Yin, R.K.
2003 Case study research: Design and methods. 3rd ed. London: Sage publications.

Towards better Urban Spaces Moohammed Wasim Yahia
100

101
Appendix 1
Damascus urban zones1 1 Source: Damascus urban planning regulations, Damascus municipality (translated into English by the author) Zone code
Land use Description
AG–A Agricultural activity (A) Only for agricultural activities – no residential buildings. It is located out of Damascus administrational limits and it is a part of the oasis (the Ghouta region) which surrounds Damascus.
AG–B Area of protection with agricultural activity (B)
Only maintenance of existing buildings. It is located in the Kas-sioun mountain and also located on the area which surrounds urban areas to the east and to the south of the city.
AG–C Agricultural area in the city itself (C)
Only maintenance of existing buildings.
G–D Green area (D) Public gardens and parks.
A Administrative area Only for constructing governmental buildings.
IRA Inhabited rural areas A residential area according to its own detailed plan. This zone contains seven villages which were in the past out of Damascus and mainly on the city’s urban fringe but now they have be-come a part of Damascus. Mixed between residential use and commercial use. Commercial purposes should be only in the ground floor. It contains four sub-zones: 1–Old town area, 2–Old town area’s expansion, 3–Modern residential areas, 4–New planning areas.
I Industrial area Only for industrial activities – no residential buildings.
PRA Planned residential area It is a purely residential zone and it contains four sub-zones: Palaces area, 1st class modern residential area, 2nd class mod-ern residential area, 3rd class modern residential area.
OQA Old quarters area Residential area according to its own detailed plan in the Old quarters areas.
AUP Areas under planning process
Residential area according to its own detailed plan after finish-ing its planning purposes.
REA Residential area for future expansionism
Residential area according to its own detailed plan after finish-ing its planning purposes.
R–K Residential area (K) Mixed between residential use and commercial use. Commercial purposes should be only in the ground floor.
R–L Residential area (L) Mixed between residential use and commercial use, but not in the same storey. (Hotels, restaurants, commercial offices, etc).
OD Old Damascus Only for restoration and rehabilitation works. Mixed use (residential and commercial) according to its own regulation system.

Towards better Urban Spaces Moohammed Wasim Yahia
102

103
Appendix 2
Glossary of terms used in the thesis
Albedo Reflectivity.
Aspect ratio A geometric shape and the ratio be-tween its sizes in different dimen-sions. It is simply the ratio between the height and width of a street sec-tion, i.e. the same as height-to-width ratio.
Density (building) Concentration (amount) of buildings in a given geographic area.
Density (residential) No. of persons per unit of land (or no. of housing units per unit of land).
Floor area ratio (FAR) The ratio between the total gross area of all the floors of a building and the plot area.
Global radiation The sum of direct and diffuse solar radiation.
Globe thermometer A thermometer enclosed in a black or grey painted globe used to meas-ure the mean radiant temperature.
Land-use The activity land is used for.
Leaf Area Density (LAD) The total one-sided leaf area (m2) per unit layer volume (m3) in each horizontal layer of the tree.
Leaf Area Index (LAI) The total one-sided leaf surface area (m2) per unit ground area (m2). It can be considered simply as the ra-tio of leaves to ground covered.
Long-wave radiation “Low temperature” radiation, e.g. heat radiation from building sur-faces.

Towards better Urban Spaces Moohammed Wasim Yahia
104
Master plan Document describing, in words and with maps, an overall development concept including both present land-uses as well as future land de-velopment.
Mean radiant temperature (MRT) The temperature of an imaginary enclosure with which the human body would exchange the same ra-diation as with the actual environ-ment.
Outdoor thermal comfort The condition of mind that ex-presses satisfaction with the outdoor thermal environment.
Standard effective temperature in-dex for outdoors (OUT_SET*)
An adaptation of the well-established indoor thermal index of the new standard effective tempera-ture (SET*) to the outdoors. SET* is based on the two-node model, where the new effective tempera-ture (ET*) is the temperature of a standard environment (relative hu-midity = 50%, air temperature = mean radiant temperature and wind speed <0.15 m/s) in which a subject would experience the same skin wittedness and mean skin tempera-ture as in the actual environment. Clothing and activity are variables that affect the SET*.
Physiologically equivalent tempera-ture (PET)
The air temperature in a typical in-door setting at which the heat bal-ance of the human body is main-tained with core and skin tempera-tures equal to those of the actual environment (vapour pressure = 12 hPa, air temperature = mean radi-ant temperature, wind speed = 0.1 m/s, clothing = 0.9 clo and activity = 80 W)
Plot coverage The amount of a plot covered by buildings.
Setback A required distance from the plot border to the building occupying the plot.

Appendix 2
105
Short-wave radiation “High temperature” radiation emit-
ted by the sun.
Sky view factor (SVF) The portion of the sky that can be seen from a point on a surface.
Solar altitude (elevation) The vertical angle between the sun’s position and the horizon.
Solar azimuth The horizontal angle of the sun in relation to north.
Urban street canyon The space delimited by the street and the façades of the buildings along the street.
Urban design Part of urban planning that focuses on the design of places, i.e. build-ings and the three-dimensional space between them. It is often de-fined as an intermediate scale be-tween architecture and urban plan-ning.
Urban fabric The physical aspect of urbanism, emphasizing building types, thor-oughfares, open space, frontages, and streetscapes but excluding envi-ronmental, functional, economic and socio-cultural aspects.
Urban growth The increase in urban population.
Urbanization The growth of the proportion of ur-ban population in a country.
Urban heat island
Urban areas being warmer than the surrounding rural areas. Primarily a nocturnal phenomenon.
Urban sprawl Horizontal growth of a city through low-density developments.
Vapour pressure The partial pressure of the air due to water vapour.

Towards better Urban Spaces Moohammed Wasim Yahia
106

107
Paper 1
Originally published in Journal of Housing and Built Environment

Towards better Urban Spaces Moohammed Wasim Yahia
108

Paper 1
109
Influence of urban planning regulations on the microcli-mate in a hot dry climate – The example of Damascus, Syria Moohammed Wasim Yahia, Erik Johansson. Housing Development & Management, Lund University, Sweden.
Abstract Urban planning regulations influence not only the urban form; they also have a great impact on the microclimate in urban areas. This paper deals with the relationship between the urban planning regulations and micro-climate in the hot dry city of Damascus. The main purpose is to highlight the shortcomings of the existing urban planning regulations. The microcli-matic parameters necessary for the thermal comfort assessment of pedes-trians were determined through simulations with the software ENVI-met. It is shown that the street design – as regards aspect ratio, orientation and the presence of street trees – has a great influence on ground surface tempera-tures and thermal comfort. Moreover, the type of buildings – whether de-tached or attached (street canyons) – has an impact. For deep canyons, there is an interactive relationship between aspect ratio, orientation and vegetation. However, for streets with detached buildings, there is only a weak influence of street orientation and aspect ratio but a strong influence of vegetation on surface temperatures and outdoor thermal comfort. The study shows the importance of modifying the planning regulations in Da-mascus for new areas to be constructed by allowing smaller setbacks, nar-rower streets, higher buildings, etc.
Keywords: Aspect ratio; Damascus; Hot dry climate; Microclimate; Planning regulations; Street design; Thermal comfort; Vegetation
1 Introduction The fact that cities are warmer than its surrounding open, rural areas, espe-cially during night time – the urban heat island effect (Oke, 1987; Voogt, 2004) – affects human comfort and energy use in buildings. Within the ur-ban canopy layer, however, the microclimate may vary considerably as a function of the urban design (Givoni, 1998; Ali-Toudert et al., 2005; Johans-son, 2006a). Urban microclimate depends both on the type of city in terms

Towards better Urban Spaces Moohammed Wasim Yahia
110
of size, geographical location, population size and density and land use as well as street design features such as height of buildings, street widths and orientation, subdivision of the building lots, etc. In fact, the urban design of each neighbourhood in a city creates its own particular local climate (Givoni, 1998).
Previous studies of urban microclimate have focused mainly on the im-pact of the physical environment on climatic parameters (air temperature, relative humidity, radiation, and wind speed) in different climates such as warm humid (e.g. Johansson and Emmanuel, 2006), cold (e.g. Thorsson et al., 2004), and hot dry (e.g. Yahia and Johansson, 2011). Generally, most of the studies in hot dry climates provided new insights to improve the out-door thermal environment. Several studies have focused on microclimate and outdoor thermal comfort in street canyons based on either simulations (e.g. Ali-Toudert and Mayer, 2006; Emmanuel et al., 2007) or measurements (e.g. Ali-Toudert et al., 2005; Johansson, 2006a; Ali-Toudert and Mayer, 2007a). Others have studied the pedestrian energy exchange depending on a physical open air scale model in urban street canyons as well as urban canopy (Pearlmutter et al., 2006; Pearlmutter et al., 2007). Some others have focused on the influence of trees and grass on outdoor thermal com-fort and have studied the cooling efficiency of urban landscape strategies considering the efficiency of water use (e.g. Shashua-Bar et al., 2009; Shashua-Bar et al., 2010).
Urban microclimate and outdoor thermal comfort are generally given lit-tle importance in the urban design and planning processes (Eliasson, 2000; Johansson, 2006b). Moreover, few studies have dealt with the relationship between urban planning regulations and the local microclimate. Several studies however indicate that the existing planning regulations in hot dry climates are not adapted to the climate. In the city of Fez, Johansson (2006b) found that the intention of the current regulations is to guarantee daylight for buildings. This may be relevant for the winter period when solar elevations are low and passive heating of buildings is desired. However, during the long, warm summer, when there is a need for solar protection, this results in a very poor microclimate at street level. The worst conditions are found in areas designated for low-rise houses where plots are very large and plot coverage low. The current urban design in the modern parts of Fez stands in stark contrast to the old city where narrow alleyways and pro-jected upper floors create adequate shade at pedestrian level.
Al-Hemaidi (2001) and Eben Saleh (2001) reported that current urban design in Saudi Arabia has led to an undesirable microclimate around buildings. They explained this with the prescription of an extremely dis-persed urban design where the provision of shade is totally lacking. The current urban form is characterized by gridiron plans with wide streets where the detached, low rise “villa” is the most common type of house. Baker et al. (2002) reported from a similar experience in hot dry Phoenix, in Arizona (USA), wide streets dispersed low-rise buildings and oversized parking lots have contributed to urban warming. Bouchair and Dupagne (2003) found a similar situation in the Mzab valley, Algeria, where contem-porary urban design lacks the microclimatic qualities of the traditional cities in the region.
The urban form is strongly influenced by urban planning regulations, such as zoning ordinances, which governs spaces between buildings, build-ing heights, building footprints, etc. Consequently, urban planning regula-

Paper 1
111
tions have a great impact on the microclimate in urban areas (Johansson and Yahia, 2010).
The street is one of the important urban components of a city’s physical structure and it acts as the physical interface between urban and architec-tural scales. The form of the street can climatically affect both outdoor and indoor environments in terms of solar gain in summer and winter, building surfaces absorption and reflection of solar radiation, wind speed and direc-tion and its implication for building passive cooling systems and urban ven-tilation. Consequently, the shape of the street influences the outdoor ther-mal comfort – which affects people’s human health and well-being – as well as the energy use of buildings in the urban areas. Therefore, designing streets is essential for an environmental urban design (Ali-Toudert, 2005).
This paper deals with the relationship between the urban planning regu-lations and microclimate in the hot dry city of Damascus in Syria. The main purpose is to highlight the shortcomings of the existing urban planning regulations. This is done by assessing the thermal comfort for pedestrians as well as surface temperatures in different thermal environments within residential streets in Damascus. Whereas most previous studies have fo-cused on street canyons (e.g. Ali-Toudert and Mayer, 2006; Perlmutter et al., 2006). This study focuses on the residential streets that have both detached and attached buildings (canyons). These two different cases represent the common outdoor urban space patterns in Damascus’ built environment. This paper provides new insights to the design of residential streets and to the improvement of the existing urban regulations in Damascus from a cli-matic perspective.
The city of Damascus Damascus which is located in the south west of the Syrian Arab Republic is the capital and largest city of Syria. It is the oldest continuously inhabited city in the world and it used to be fully surrounded by an oasis (Al Ghouta). The oasis is watered by the Barada River and Al Fijeh Spring provides the city with drinking water.
Damascus has two parts: Old Damascus and modern Damascus. Old Damascus has a regular planning in general, with streets oriented N–S and E–W. Most streets are narrow with deep canyons and projecting upper floors are common. See Figure 1a. The typical architectural style in Old Damascus is simple from outside and rich from inside with internal orienta-tion to courtyards like in most vernacular architecture of old cities in the Is-lamic world. This urban design came forth as a perfect response to the liv-ing conditions of both the natural and the social environment, based on age-old regional experience using local building materials and appropriate techniques of climate control (Bianca, 2000). Old Damascus’ buildings are made of local construction materials such as stone, clay, wood, etc, see Figure 1a, whereas in the modern part of Damascus, modern construction materials such as concrete, steel, glass, artificial or natural stone, etc. are used. In addition, as a consequence of the planning regulations, modern Damascus has mainly detached buildings created according to detailed rules for spaces between buildings, setbacks, building heights, building footprints, projections, etc. Moreover, buildings are outwardly orientated. See Figure 1b.

Towards better Urban Spaces Moohammed Wasim Yahia
112
Figure 1 (a) Typical style for streets in Old Damascus. Projected upper floors increase shade at street level. (b) Typical streets and buildings in the modern part of Damascus.
Climate in Damascus Damascus has sunny summers (June to August) and fairly cold winters (December to February). Snowfall is common in winter on the mountains surrounding the city. Summer temperatures can reach in excess of 35°C during the day, but evenings are generally cool. In winter, minimum tem-peratures can reach 0°C. Spring and autumn have the most comfortable climate with average temperatures in the range of 16 to 20°C.
2 Urban planning regulations in Damascus The urban planning regulations in Damascus are the essential documents for regulating urban and buildings issues in the city. Literally, the name of this document translated from Arabic is building regulations for the city of Damascus (Damascus Municipality, 1997)
The approach to urban design changed radically during the French colo-nial period (1920–45). New areas were built with wide streets in a grid pat-tern and buildings were outwardly oriented (Al-Kodmany, 1999). During the 1950s, it was necessary to develop a new master plan for Damascus. The first attempt was by an Austrian company in 1957 and the second one started in 1963 by the French architect Michel Ecochar. In 1968 Ecochar presented the new master plan for Damascus and a few years earlier he

Paper 1
113
had developed new urban planning regulations for the city; these regula-tions determined urban form in Damascus during a period of 20 years (1965–1985). Ecochar’s master plan and urban planning regulations are es-sential documents which have been the basis for all updated versions after 1985.
In 1993, a special committee – from the Syrian Engineers Association and Damascus Municipality – was created in order to study, develop and com-plete the urban planning regulations for Damascus. The latest urban plan-ning regulations were issued by Damascus Municipality in 1997 and were ratified by the Syrian Ministry of Housing and Construction in the same year.
The first part of the urban planning regulations contains special condi-tions about administrational procedures concerning building permit, public roads and protection procedures during the construction process such as fire and safety protection.
The second part contains rules concerning building heights, projections, partitions and barriers between the plots, ventilation and illumination shafts, residential and commercial units and components, common facili-ties such as stairs and corridors, architectural elevations, roof forms as well as general regulations about street width, setbacks, and parking.
The third part contains regulations regarding maximum floor area ratio (FAR) which is calculated as the total floor area of the building divided by the total area of the plot. The third part also contains regulations about the basement construction in case of sloping plots, regulations for small apart-ments in the commercial areas, temporary building conditions, and fire pro-tection.
The fourth part which deals with urban zones for Damascus contains specific regulations on minimum plot sizes, minimum plot frontages, mini-mum setbacks, maximum building heights, maximum plot coverage (build-ing footprints), maximum projections, etc (see Table 1 and Figure 2). In ad-dition, these regulations determine the division of Damascus into urban land use zones. Damascus is divided into 14 zones of different land use in-cluding agricultural, administrative, industrial, residential, and commercial activities. The urban zones which deal with residential areas – planned residential area (PRA) and for the zone of Inhabited rural area (IRA) – are described in Table 1.
Parts 5, 6 and 7 contain, respectively, general information about hospitals as well as electrical and mechanical installations. There are also two ap-pendices, the first one is about urban planning regulations for Old Damas-cus, and the second is about heating systems and cold water generation for cooling.

Towards better Urban Spaces Moohammed Wasim Yahia
114
Table 1 Urban planning regulations pertaining to urban form in the city of Damascus for the zone of planned residential area (PRA) and for the zone of Inhabited rural area (IRA)*. Source: Damascus urban planning regulations (Damascus Municipality, 1997).
Zone code
Type of area
Type of use
Plot size (m2)
Max. Plot coverage** (%)
Max. no. of floors**
Max. H (m)
Min. plot frontage (m)
Min. setbacks (m) Front rear side
PRA Palaces
area
Residential >1500 20% no limit 10 — 10 10 10
PRA 1st class
modern residential
area
Residential > 600 33.3%
See Figure 2
3+B 14 — 5 5 5
PRA 2ed class
modern residential
area
Residential > 400 50% 3+B 14 — 3 3 3
PRA 3rd class
modern residential
area
Residential > 200 66.6% 3+B 12 — — — —
IRA Inhabited
rural area (Old town
area)
Residential,
commercial
> 125 = 5X+
2/3.X (Y–5). see Figure 2
4+B 14.25 > 8 — — —
IRA Inhabited
rural area (Old town
area ex-pansion)
Residential,
commercial
> 150 = 5X+
2/3.X (Y–5). see Figure 2
4+B 14.25 > 9 — — —
IRA Inhabited rural area
(Modern residential
area)
Residential, commercial
> 300 50% 4+B 14.25 > 14 3 7 —
IRA Inhabited
rural area (New
planning area)
Residential,
commercial
> 600 40% 4+B 15 > 20 3 4 5
B= Basement; H = Building height.
*This zone consists of neighborhoods situated outside the core of Damascus and surrounded by green areas. ** The maximum FAR (Floor Area Ratio) can be calculated by multiplying the maximum plot coverage with the maximum number of floors.

Paper 1
115
Figure 2 Two examples of setbacks, plot coverage and plot frontage. (a) Front, side and rear setbacks for zone PRA (1st class modern residential area). (b) The formula to calculate the maximum plot coverage and front setback for IRA zone where X = the plot frontage and Y = the dimension of the side of the plot.
3 Methodology
Selection and characteristics of the studied zones This study focuses on the three land use zones that represent the main residential urban zones in Damascus (See Table 1):
1 The zone of Planned residential areas (PRA) exemplified by the sub zone palaces area in modern Damascus. This zone contains only detached buildings (Figure 3a).
2 The zone of Inhabited rural area (IRA) exemplified by the sub zone new planning area in modern Damascus. This zone also contains only detached buildings (Figure 3b).
3 The zone of Old Damascus (OD). This zone contains only attached buildings (Figure 3c).

Towards better Urban Spaces Moohammed Wasim Yahia
116
Figure 3 Perspective models of the studied zones for (a) PRA (Palaces area), (b) IRA (New plan-ning area) and (c) OD (Old Damascus) including the 2 m high wall which surrounds the plots. The ground surface temperature and the thermal comfort were studied at the right side of the street (point R), at the middle of the street (point M) and at the left side of the street (point L.)
For modern Damascus, the models have been created according to ur-ban planning regulations, whereas in Old Damascus, the dimensions for the model were derived from existing street.
The study was carried out only at street level since the street in Damas-cus is the most common public space; this is the main place where people everyday stroll and pass by for different reasons such as going to work and shopping as well as for recreational purposes.
The three zones were mainly chosen in order to test the impact of vari-ous aspect ratios, i.e. height-to-width ratios (H/W) on the microclimate. The palaces area of the PRA zone has the lowest H/W ratio (0.31) and the new planning area of the IRA zone has a H/W ratio of 0.83, whereas Old Damas-cus (OD) zone has the highest H/W ratio (2.95). The chosen zones include two extremes in the city of Damascus where the palaces area of the PRA zone is the most dispersed (lowest density) and Old Damascus is the most compact (highest density). The residential area of the IRA zone is some-where in between. The PRA (Palaces area), IRA (New planning area) and OD zones are clearly different concerning the distance between buildings, building heights, H/W ratio, and building footprint (See Figure 3 and Table 1).
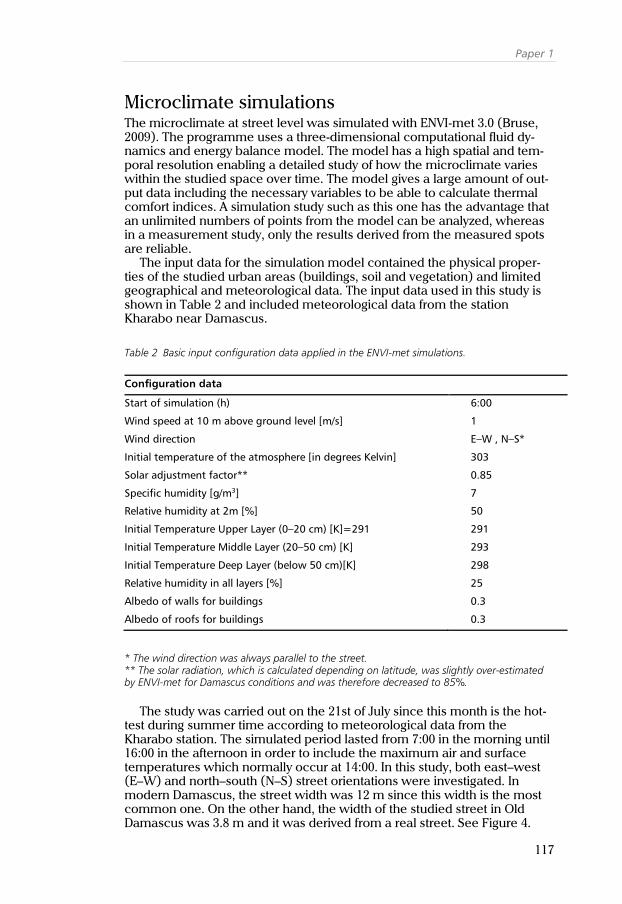
Paper 1
117
Microclimate simulations The microclimate at street level was simulated with ENVI-met 3.0 (Bruse, 2009). The programme uses a three-dimensional computational fluid dy-namics and energy balance model. The model has a high spatial and tem-poral resolution enabling a detailed study of how the microclimate varies within the studied space over time. The model gives a large amount of out-put data including the necessary variables to be able to calculate thermal comfort indices. A simulation study such as this one has the advantage that an unlimited numbers of points from the model can be analyzed, whereas in a measurement study, only the results derived from the measured spots are reliable.
The input data for the simulation model contained the physical proper-ties of the studied urban areas (buildings, soil and vegetation) and limited geographical and meteorological data. The input data used in this study is shown in Table 2 and included meteorological data from the station Kharabo near Damascus.
Table 2 Basic input configuration data applied in the ENVI-met simulations.
Configuration data
Start of simulation (h) 6:00
Wind speed at 10 m above ground level [m/s] 1
Wind direction E–W , N–S*
Initial temperature of the atmosphere [in degrees Kelvin] 303
Solar adjustment factor** 0.85
Specific humidity [g/m3] 7
Relative humidity at 2m [%] 50
Initial Temperature Upper Layer (0–20 cm) [K]=291 291
Initial Temperature Middle Layer (20–50 cm) [K] 293
Initial Temperature Deep Layer (below 50 cm)[K] 298
Relative humidity in all layers [%] 25
Albedo of walls for buildings 0.3
Albedo of roofs for buildings 0.3
* The wind direction was always parallel to the street. ** The solar radiation, which is calculated depending on latitude, was slightly over-estimated by ENVI-met for Damascus conditions and was therefore decreased to 85%.
The study was carried out on the 21st of July since this month is the hot-test during summer time according to meteorological data from the Kharabo station. The simulated period lasted from 7:00 in the morning until 16:00 in the afternoon in order to include the maximum air and surface temperatures which normally occur at 14:00. In this study, both east–west (E–W) and north–south (N–S) street orientations were investigated. In modern Damascus, the street width was 12 m since this width is the most common one. On the other hand, the width of the studied street in Old Damascus was 3.8 m and it was derived from a real street. See Figure 4.

Towards better Urban Spaces Moohammed Wasim Yahia
118
In the ENVI-met simulation program (version 3), the walls of the build-ings have no thermal mass. Therefore, the surface temperatures calculated by ENVI-met will be overestimated, especially in Old Damascus where the walls on the ground floor have high thermal mass. Another shortcoming with ENVI-met is that the effect of motor traffic is not considered. However, since the study focused on residential streets and not on the centre of Da-mascus, the impact of motor traffic is likely to be negligible.
Assessment of thermal comfort Thermal comfort is defined as the condition of mind, which expresses satis-faction with the thermal environment (Plumley, 1975). There are four envi-ronmental variables affecting the thermal comfort of the human body: air temperature, mean radiant temperature, air humidity and air speed. Addi-tionally, several personal variables influence thermal comfort: clothing, the level of activity, height, weight, age, and gender. However, of these, cloth-ing and the level of activity have the largest impact on thermal comfort (Givoni, 1998).
The mean radiant temperature (MRT) is defined for the real environment in practice (actual non-uniform enclosure) as “the uniform temperature of an imaginary enclosure in which radiant heat transfer from the human body equals the radiant heat transfer in the actual non-uniform enclosure” (ASH-RAE, 1997). In the outdoor environment, it is complicated to determine MRT because the body exchanges radiation with various sources. The human body receives direct, diffuse and reflected solar radiation. Moreover, the body exchanges thermal (long-wave) radiation with the sky, with urban sur-faces and with objects such as trees. The magnitude of the radiation from the different sources varies greatly in space and time. The MRT is calculated by ENVI-met for a standing person taking all radiation aspects mentioned above into account (Ali-Toudert and Mayer, 2006).
The most commonly used thermal comfort indices are based on the heat balance of the human body, e.g. the predicted mean vote (PMV), the new effective temperature (ET*), the standard effective temperature (SET*), and the physiologically equivalent temperature (PET). These indices have in common that they take into account all environmental variables influencing thermal comfort (Ali-Toudert, 2005).
In this study, thermal comfort was estimated by calculating the PET in-dex (Höppe, 1999). PET, which is expressed in °C, is based on the human energy balance model MEMI and includes the physiological thermoregula-tory processes of human beings in order to adjust to a climatic situation outdoors (Ali-Toudert and Mayer, 2006). The thermal comfort zone for the PET index was originally defined as 18–23°C. This range applies to Euro-pean climatic conditions (Germany). A recent study in the warm humid climate of Taipeh, Taiwan, found a PET summer comfort zone for Taiwan as being 21.3–28.5°C which is considerably higher than Western/middle European scale (Ping Lin, 2009). Although PET has not been calibrated for Damascus, the index makes it possible to compare different urban designs.
The PET index was calculated with RayMan (Matzarakis, 2000) using in-put data from the ENVI-met simulations (MRT, air temperature and RH) and from the meteorological station in Kharabo (wind speed).
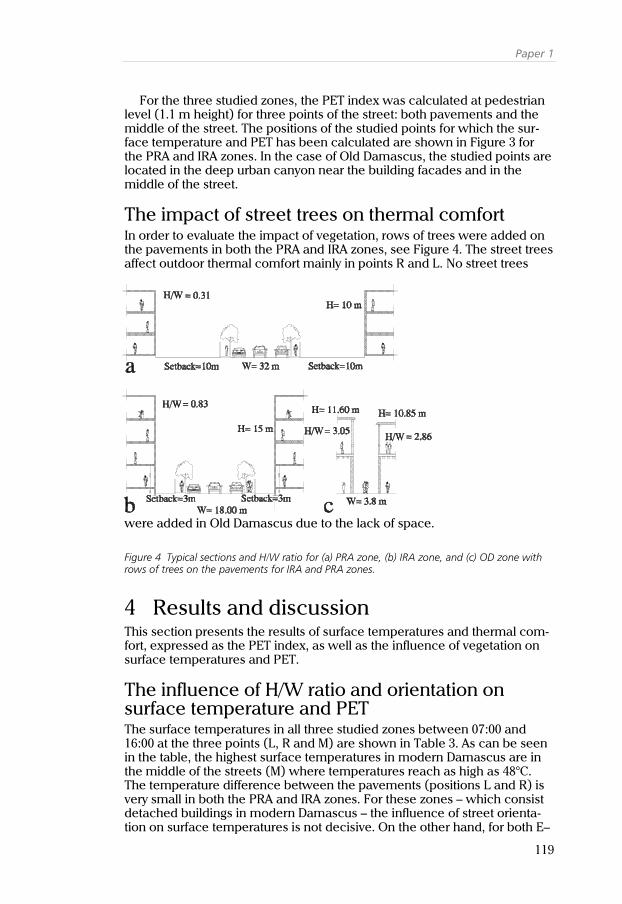
Paper 1
119
For the three studied zones, the PET index was calculated at pedestrian level (1.1 m height) for three points of the street: both pavements and the middle of the street. The positions of the studied points for which the sur-face temperature and PET has been calculated are shown in Figure 3 for the PRA and IRA zones. In the case of Old Damascus, the studied points are located in the deep urban canyon near the building facades and in the middle of the street.
The impact of street trees on thermal comfort In order to evaluate the impact of vegetation, rows of trees were added on the pavements in both the PRA and IRA zones, see Figure 4. The street trees affect outdoor thermal comfort mainly in points R and L. No street trees
were added in Old Damascus due to the lack of space.
Figure 4 Typical sections and H/W ratio for (a) PRA zone, (b) IRA zone, and (c) OD zone with rows of trees on the pavements for IRA and PRA zones.
4 Results and discussion This section presents the results of surface temperatures and thermal com-fort, expressed as the PET index, as well as the influence of vegetation on surface temperatures and PET.
The influence of H/W ratio and orientation on surface temperature and PET The surface temperatures in all three studied zones between 07:00 and 16:00 at the three points (L, R and M) are shown in Table 3. As can be seen in the table, the highest surface temperatures in modern Damascus are in the middle of the streets (M) where temperatures reach as high as 48°C. The temperature difference between the pavements (positions L and R) is very small in both the PRA and IRA zones. For these zones – which consist detached buildings in modern Damascus – the influence of street orienta-tion on surface temperatures is not decisive. On the other hand, for both E–

Towards better Urban Spaces Moohammed Wasim Yahia
120
W and N–S orientation, the surface temperatures of the two zones in mod-ern Damascus are considerably higher than those of Old Damascus be-cause in the latter case the street has a much higher H/W ratio. The street in Old Damascus is in shade during all hours of the simulation except at around noon for the N–S case as well as at around10:00 and around15:00 for the E–W case since the azimuth is nearly parallel to the street orienta-tion for these hours. Surface temperatures in Old Damascus are normally similar in all points and rarely above 35°C.
Table 3 Surface temperatures in all three studied zones, for (a) E–W and (b) N–S orientations, between 07:00 and 16:00 at the three points (L, R and M). L = left pavement, R = right pavement and M = middle of the street.
Time PRA IRA OD
L R M L R M L R M
07:00 23.9 21.9 24.9 23.2 22.2 24.9 25.3 21.6 21.0
08:00 30.6 24.6 33.8 30.4 24.7 33.8 32.7 31.5 27.5
09:00 35.7 27.0 38.9 35.2 26.9 38.9 36.7 31.6 28.5
10:00 39.5 33.7 42.9 38.7 28.6 42.9 40.0 32.0 30.3
11:00 42.3 39.8 45.7 41.2 35.4 45.7 35.1 32.8 32.0
12:00 44.2 42.7 47.3 43.0 41.3 47.3 35.1 33.7 33.5
13:00 45.4 44.4 48.0 38.3 43.6 48.0 35.3 34.5 34.7
14:00 40.3 45.0 47.5 36.5 44.4 47.5 35.6 35.1 35.7
15:00 38.2 44.3 45.7 35.9 43.8 45.7 40.6 38.9 37.2
16:00 37.0 42.7 42.9 35.2 42.0 42.9 37.8 39.5 40.1
(a)
Time PRA IRA OD
L R M L R M L R M
07:00 25.0 24.3 27.8 25.7 22.8 28.0 20.9 21.0 21.0
08:00 30.8 30.5 34.7 30.9 30.2 33.6 23.4 23.6 23.6
09:00 35.7 35.5 40.0 35.5 35.2 38.3 25.8 26.1 26.0
10:00 39.3 39.3 43.7 38.8 38.9 41.8 28.0 28.4 28.3
11:00 41.9 42.1 46.3 41.2 41.5 44.2 30.1 30.5 30.4
12:00 43.8 44.1 47.9 42.8 43.3 45.7 38.1 38.4 39.0
13:00 44.9 45.2 48.6 43.5 44.2 46.4 34.6 34.8 35.7
14:00 45.1 45.4 48.2 43.5 44.2 46.0 35.0 35.2 35.6
15:00 44.2 44.5 46.6 42.6 43.2 44.6 35.3 35.5 35.7
16:00 42.3 42.6 43.9 40.9 41.4 42.1 35.4 35.5 35.6
(b)
Table 4 shows the influence of H/W ratio on the PET index at 14:00 in the PRA, IRA and OD zones. At this hour, PET reaches its maximum value. The table illustrates the high PET values in both PRA and IRA zones in modern Damascus (PET around 50°C). These values are far above the thermal com-

Paper 1
121
fort zones mentioned in Section 3.3. On the other hand, PET in Old Damas-cus zone (OD) is around 33°C. However, within each studied zone there is no decisive difference in PET value between the studied points R, L, and M. The main reason is that in zones PRA and IRA, both for E–W and N–S orien-tation, all points are exposed to solar radiation, whereas in the OD zone, all points are in shade. Furthermore, for the PRA and IRA zones with H/W equal to 0.31 and 0.83 respectively, the maximum PET reaches the value of 51.7°C and 50.7°C respectively. On the other hand, in Old Damascus with a higher H/W ratio equal to 2.95, the maximum PET value reaches only 33.2°C. The results show that the H/W ratio has a large impact on outdoor thermal comfort and that the PET tends to decrease with increasing H/W. The small difference in PET values between the PRA and IRA zones is ex-plained by the small difference in the aspect ratio as discussed for the sur-face temperatures above. The main reason for the lower PET in the OD zone is the reduction of radiation fluxes due to increased shading which results in a lower mean radiant temperature. The results agree well with other studies in hot dry climates which found that outdoor thermal comfort is affected by H/W ratio variation (Ali-Toudert and Mayer, 2006; Johansson, 2006a). Table 4 also shows only a small influence of orientation on PET in modern Damascus. This is because this study deals with detached build-ings and not canyons. Consequently, in urban environments that have de-tached buildings, the influence of street orientation and aspect ratio on outdoor thermal comfort is not decisive. Other studies for urban canyons (Ali-Toudert and Mayer, 2006; Johansson, 2006b) have shown that in gen-eral N–S streets tend to be more comfortable than E–W streets. This is be-cause a N–S street is exposed to solar radiation during a shorter period than an E–W street. The simulated PETs in modern and Old Damascus are simi-lar to measured values in other hot dry cities (Ali-Toudert et al., 2005; Jo-hansson, 2006a).
Table 4 The influence of H/W ratio on PET values in PRA, IRA, and OD urban zones for east–west (E–W) and for north–south (N–S) street orientations (maximum daily values at 14:00).
Zone PET°C (E–W) PET°C (N–S)
L R M L R M
PRA Zone H/W= 0.30 49.9 51.7 49.4 45 52.1 48.8
IRA Zone H/W= 0.83 50.7 50.4 48.5 50 50.7 48.4
OD Zone H/W= 2.95 33.2 33.2 33.2 33.2 33.2 33.3
The influence of vegetation on surface temperature and PET The hourly variations of the surface temperatures in the PRA and IRA zones at the left pavement (point L) with and without rows of trees along the pavements for E–W and N–S orientations are shown in Figure 5. The figure shows that the surface temperatures below the trees are considerably lower than for an exposed surface in both E–W and N–S street orientations.

Towards better Urban Spaces Moohammed Wasim Yahia
122
(a)
(b)
Figure 5 Hourly variations of the surface temperatures in the PRA and IRA zones with and without rows of trees along the pavements for (a) E–W and (b) N–S orientations.
Table 5 illustrates the effect of street trees on thermal comfort expressed as the maximum daily PET value in both the PRA and IRA zones. The result reveals that there is a great influence of vegetation on PET since when rows of trees are added on the pavement, PET values are lowered by about 17°C for the PRA and by about 16°C for the IRA zone due to the shading of the pedestrian pavement. Consequently, in urban environments that have low aspect ratios as well as detached buildings, the influence of vegetation on outdoor thermal comfort is crucial. This result agrees well with other stud-ies which found that the direct solar radiation under a tree canopy strongly decreases (Ochoa et al., 2009; Ali-Toudert and Mayer, 2007b).

Paper 1
123
Table 5 The influence of street trees on PET values in PRA and IRA urban zones (maximum daily values at 14:00).
PET without vegetation PET with vegetation
PRA Zone H/W= 0.30 52.1°C 35.3°C
IRA Zone H/W= 0.83 50.7°C 34.3°C
5 Conclusions The results reveal the shortcomings of the current planning regulations in Damascus city as regards the outdoor thermal comfort at street level. The regulations for modern Damascus prescribe wide streets and pavements, large setbacks and relatively low building heights. This leads to a dispersed urban form where a large part of the buildings and streets are exposed to solar radiation.
The existing planning regulations in Damascus have no requirements for shading of pedestrians, e.g. shading devices, arcades and projecting upper floors or shading trees. Apart from leading to poor microclimatic conditions in the summer, land-use in the modern part of Damascus is highly ineffi-cient, with a disproportionately large amount of ground occupied by streets, pavements and front yards.
In order to increase shade at street level in future urban areas in Damas-cus it is important to modify the current planning regulations. This can be done by reducing front setbacks or to have none at all, planning narrower streets, increase the permissive maximum number of floors, and allowing projections of upper floors. Moreover, architectural elements, which pro-vide shade for pedestrians at street level such as balconies and horizontal shading devices, should be encouraged in the urban planning regulations.
In the case of urban canyons (attached buildings), one conclusion of this and other studies (e.g. Ali-Toudert and Mayer, 2007b) is that it is very impor-tant to consider the interactive relationship between aspect ratio, street ori-entation, and vegetation when designing streets. On the other hand in ur-ban environments that have detached buildings, the influence of street ori-entation and aspect ratio on surface temperatures and outdoor thermal comfort is less important, whereas the use of vegetation may reduce sur-face temperatures and improve the outdoor thermal comfort substantially.
Consequently, the outdoor thermal comfort in existing urban areas in modern Damascus – which were constructed according to the current ur-ban planning regulations – could be improved by introducing vegetation and landscaping in the urban design process. The use of vegetation would also have a positive influence on air quality as well as the quality of life. It is therefore important to create a link between urban landscaping and urban planning regulations and this link could be as a set of guidelines for street design.
This study is limited only to a numerical simulation study of summer conditions. However, the study is part of larger project about climate-sensitive urban design in the city of Damascus, and microclimatic meas-urements will be carried out in order to calibrate the results of this study. More investigations, including both the summer and winter seasons, will be performed within the framework of the project including field studies about the influence of microclimate on outdoor thermal comfort, guidelines for a

Towards better Urban Spaces Moohammed Wasim Yahia
124
climate-sensitive urban design and suggestions for improvement of the ur-ban planning regulations in the city of Damascus.
References Al-Hemaidi, W.K. (2001).The metamorphosis of the urban fabric in an Arab-Muslim
city: Riyadh, Saudi Arabia. Journal of Housing and the Built Environment, 16, 179–201.
Al-Kodmany, K. (1999). Residential Visual Privacy: Traditional and Modern Architec-ture and Urban Design. Journal of Urban Design, 04, 283–312.
Ali-Toudert, F. (2005). Dependence of outdoor thermal comfort on street design in hot and dry climate. Ph.D Dissertation, Universität Freiburg.
Ali-Toudert, F., Djenane, M., Bensalem, R. & Mayer, H. (2005). Outdoor thermal com-fort in the old desert city of Beni-Isguen, Algeria. Climate Research, 28, 243–256.
Ali-Toudert, F. & Mayer, H. (2006). Numerical study on the effects of aspect ratio and solar orientation on outdoor thermal comfort in hot and dry climate. Building and Environment, 41, 94–108.
Ali-Toudert, F. & Mayer, H. (2007a). Thermal comfort in an east–west oriented street canyon in Freiburg (Germany) under hot summer conditions. Theoretical and Applied Climatology, 87, 223–37.
Ali-Toudert, F. & Mayer, H. (2007b). Effects of asymmetry, galleries, overhanging fa-cades and vegetation on thermal comfort in urban street canyons. Solar Ener-gy, 81, 742–754.
ASHRAE (1997). ASHRAE Handbook: Fundamentals. (Atlanta: American Society of Heating, Refrigerating and Air Conditioning Engineers).
Baker, L.A., Brazel, A.J., Selover, N., Martin, C., McIntyre, N., Steiner, F.R., Nelson A. & Musacchio, L. (2002). Urbanization and warming of Phoenix (Arizona, USA): impacts, feedbacks and mitigation, Urban Ecosystems, 6, 183–203.
Bianca, S. (2000). Urban Form in the Arab World: Past and present. (London: Tha-mes & Hudson).
Bouchair, A. & Dupagne, A. (2003). Building traditions of Mzab facing the challenges of re-shaping of its built form and society. Building and Environment, 38, 1345–1364.
Bruse, M., (2009). ENVI-met. http://www.envi-met.com.
Damascus Municipality (1997). Building regulations for the city of Damascus. (Da-mascus: Damascus Municipality). (In Arabic).
Eben Saleh, M.A. (2001). The evolution of planning and urban theory from the pers-pective of vernacular design: MOMRA initiatives in improving Saudi Arabian neighbourhoods. Land Use Policy, 18, 179–190.
Eliasson, I. (2000). The use of climate knowledge in urban planning. Landscape and Urban Planning. 48, 31–44.
Emmanuel, R., Rosenlund, H. & Johansson, E. (2007). Urban shading – a design op-tion for the tropics? A study in Colombo, Sri Lanka. International Journal of Climatology, 27, 1995–2004.
Givoni, B. (1998). Climate considerations in buildings and urban design. (New York: Van Nostrand Reinhold).

Paper 1
125
Höppe, P. (1999). The physiological equivalent temperature – a universal index for the biometeorological assessment of the thermal environment. Int. J. Bio-meteorology, 43, 71–75.
Johansson, E. (2006a). Influence of urban geometry on outdoor thermal comfort in a hot dry climate: A study in Fez, Morocco. Building and Environment, 41, 1326–1338.
Johansson, E. (2006b) Urban design and outdoor thermal comfort in warm climates – studies in Fez and Colombo. Dissertation, Lund University.
Johansson, E. & Emmanuel, R. (2006). The influence of urban design on outdoor thermal comfort in the hot, humid city of Colombo, Sri Lanka. Int. J. Bio-meteorology, 51, 119–133.
Johansson, E. & Yahia, M.W. (2010, July). Towards a Climate – Sensitive Urban De-sign: The Need to Modify Current Planning Regulations (Paper presented at the 7th International Conference of the Centre for the Study of Architecture in Arab Region, Amman).
Matzarakis, A. (2010). RayMan. http://www.urbanclimate.net/rayman/.
Ochoa, J.M. & Serra, R. (2009). Vegetation influences on the human thermal comfort in outdoor spaces. Retrieved June 10, 2010, from School of Architecture of Bar-celona, Dept. Constructions Arquitectòniques I & Dept. Física Aplicada, Web site: http://www-fa.upc.es/personals/jroset/lyonvege.html.
Oke, T.R. (1987). Boundary Layer Climates. (London, New York: Routledge).
Pearlmutter, D., Berliner, P. & Shaviv, E. (2006). Physical modelling of pedestrian energy exchange within the urban canopy. Journal of Building and Environ-ment, 41, 783–795.
Pearlmutter, D., Berliner, P. & Shaviv, E. (2007). Integrated modelling of pedestrian energy exchange and thermal comfort in urban street canyons. Journal of Building and Environment, 42, 2396–2409.
Ping Lin, T. (2009). Thermal perception, adaption and attendance in a public square in hot and humid regions. Journal of Building and Environment, 44, 2017–2026.
Plumley, H. J. (1975, August). Design of outdoor urban spaces for thermal comfort. (Paper presented at the conference on Metropolitan Physical Environment, Sy-racuse).
Shashua-Bar, L., Erell, E. & Pearlmutter, D. (2009). The cooling efficiency of urban landscape strategies in a hot dry climate. Landscape and Urban Planning 92(3–4), 179–186.
Shashua-Bar, L., Erell, E. & Pearlmutter, D. (2011). The influence of trees and grass on outdoor thermal comfort in a hot-arid environment. International Journal of Climatology, 31, 1498–1506.
Thorsson, S. & Lindqvist, M. (2004). Thermal bioclimatic conditions and patterns of behaviour in an urban park in Göteborg, Sweden. Int. J. Biometeorology, 48, 149–156.
Voogt, J.A. (2004). Urban Heat Island: Hotter Cities. Retrieved June 16, 2010, from http://www.actionbioscience.org/environment/voogt.html.
Yahia, M.W. & Johansson, E. (2011, July). The influence of environment on people’s thermal comfort in outdoor urban spaces in hot dry climates – The example of Damascus, Syria (Paper presented at 27th International conference on Passive and Low Energy Architecture, Louvain-la-Neuve).

Towards better Urban Spaces Moohammed Wasim Yahia
126

127
Originally published in International Journal of Biometeorology
Paper 2

Towards better Urban Spaces Moohammed Wasim Yahia
128

Paper 2
129
Evaluating the behaviour of different thermal indices by investigating various outdoor urban environments in the hot dry city of Damascus, Syria Moohammed Wasim Yahia, Erik Johansson. Housing Development & Management, Lund University, Sweden.
Abstract In urban development, the consideration of urban microclimate and ther-mal comfort is absolutely needed, and a set of guidelines for every type of climate must be elaborated. However, to develop guidelines, the thermal comfort range needs to be defined. The aim of this study was to evaluate the behaviour of different thermal indices by investigating different thermal environments in Damascus during summer and winter. Another aim was to define the lower and upper limits of the thermal comfort range for some of these indices. The study was based on comprehensive micrometeorologi-cal measurements combined with questionnaires. It was found that the thermal conditions of different outdoor environments vary considerably. In general, Old Damascus, with its deep canyons, is more comfortable in summer than modern Damascus where there is a lack of shade. Con-versely, residential areas and parks in modern Damascus are more com-fortable in winter due to more solar access. The neutral temperatures of both the physiologically equivalent temperature (PET) and the outdoor standard effective temperature (OUT_SET*) were found to be lower in summer than in winter. At 80% acceptability, the study defined the lower comfort limit in winter to 21.0 °C and the upper limit in summer to 31.3 °C for PET. For OUT_SET*, the corresponding lower and upper limits were 27.6 °C and 31.3 °C respectively. OUT_SET* showed a better correlation with the thermal sensation votes than PET. The study also highlighted the influence of culture and traditions on people’s clothing as well as the influence of air conditioning on physical adaptation.
Keywords: Damascus; Microclimate; Thermal comfort; Thermal indices; Thermal sensation; Urban design

Towards better Urban Spaces Moohammed Wasim Yahia
130
Introduction Due to the complexity of urban microclimates and thus of determining thermal comfort in outdoor urban spaces, it is very necessary to deepen our knowledge about these issues. Such knowledge can help us to create use-ful and realistic guidelines for the urban planning and design processes. It is absolutely needed to improve the physical and climatic aspects of urban spaces, to make it possible to animate underused parts of a city, and to en-hance the quality of life by achieving a level of harmony between the mi-croclimate and urban spaces.
Many previous studies have focused on thermal comfort in outdoor ur-ban spaces and behaviour in public spaces. Some studies examined behav-iour, use of place and spatial variation (e.g. Nikolopoulou et al. 2001; Zacha-rias et al. 2001). Others have focused on thermal conditions and patterns of different behaviour in urban parks (e.g. Thorsson et al. 2004). Still others have focused on cultural and climatic characteristics which influence the usage of outdoor urban spaces (e.g. Knez and Thorsson 2006).While these studies have provided extremely useful insights for urban designers, to put these insights into practice, reliable and relevant methods are needed for gathering information about the urban microclimate and how it is affected by the existing urban design.
The outdoor thermal sensation range is wider than that indoors, span-ning from thermal comfort to a stressful environment (Spagnolo and de Dear 2003; Emmanuel 2005). Moreover, outdoor conditions show large temporal and spatial variations, and the thermal balance of the body is sel-dom in steady state, as it is in controlled indoor environments. This situa-tion is especially true for hot dry climates such as that in Damascus where the large temperature variation between summer and winter as well as night and day makes adaption to the climate difficult.
Several studies related to microclimate and outdoor thermal comfort have been conducted in the hot dry climate, and most of these have pro-vided new insights to improve the outdoor thermal environment. Quite a few studies have focused on microclimate and thermal comfort in street canyons based on simulations (e.g. Ali-Toudert and Mayer 2006; Fahmy et al. 2010), measurements (e.g. Ali-Toudert et al. 2005; Johansson 2006; Bourbia and Boucheriba 2010; Shashua-Bar et al. 2011) and a physical open air scale model (e.g. Pearlmutter et al. 2007). There are, on the other hand, very few studies on subjective thermal sensation in hot dry climates. Al Jawabra and Nikolopoulou (2009) studied the outdoor thermal com¬fort and the effect of socio-economic background and cultural differences in the hot dry climate of Marrakech in North Africa and Phoenix in North America. The authors aimed to develop better understanding of the com-plex relationship between microclimate and human behaviour in outdoor urban spaces in a hot arid climate. Micrometeorological measurements and questionnaire surveys were carried out in two sites in Marrakech and three in Phoenix. The authors argued that, particularly in the summer, the num-ber of people and activities outdoors are influenced by the solar radiation. And people from different social backgrounds in hot arid climates have dif-ferent approaches to the use of outdoor spaces. The study also concluded that the design is an important tool that can significantly improve microcli-matic conditions in the specific climatic context. However, the study only calculated the Predicted Mean Vote (PMV) index and did not investigate the behaviour of other thermal indices. In addition, the study did not calculate

Paper 2
131
the thermal comfort limits and neutral temperatures. Mahmoud (2011) in-vestigated the microclimate and thermal sensation in an urban park in Cairo, Egypt during the hot and the cold seasons. The study was based on field measurements and a questionnaire survey. By using the physiologi-cally equivalent temperature (PET) index, the study showed an alteration in human comfort sensation between different landscape zones and it argued that most of the landscape zones in the study are thermally comfortable within a range of 22–30 °C PET in the hot month studied (June) and within 21–29 °C PET in the cold month studied (December). However, this study included only one thermal comfort index and did not include built-up areas. Moreover, the study was not conducted during the hottest and coldest months. In addition, the study did not reflect the people’s thermal adapta-tion during the hot and cold seasons. There is thus a need for further stud-ies in hot dry climates that take the extreme summer and winter seasons into account in different urban design patterns.
This study therefore focuses on the hottest summer and coldest winter conditions in the hot dry city of Damascus, Syria. The main aim of this study is to evaluate the behaviour of different thermal comfort indices by investi-gating different thermal environments and assessing people’s thermal sen-sation in Damascus during the summer and winter seasons. This includes finding the lower and upper limits of the thermal comfort range as well as the neutral temperatures for some of these indices in the climate of Da-mascus. Such thermal comfort limits will help architects and urban design-ers to create design proposals according to the climatic needs. In addition, the novelty of this study is to examine the effect of air conditioning devices on people’s outdoor thermal acceptability. This study also intends to inves-tigate behavioural adaptation to the local climate conditions. The study is based on comprehensive micrometeorological measurements combined with a questionnaire survey during summer and winter. This study is one of few studies which deal with microclimate and subjective thermal comfort in the Middle East and the first of its kind in Damascus.
The city of Damascus Damascus city is located in the south-west of the Syrian Arab Republic in the Middle East (Elevation: 620 meters, Latitude: 33.5° N, Longitude: 36.5° E), see Fig. 1a. The city has two main parts:
1- The old part: It has a regular planning in general, with streets oriented N–S and E–W. Most streets are narrow in the form of deep canyons. The typical style of architecture in Old Damascus is simple from outside and rich with decoration and furnishings from inside, with inward orientation to the courtyards.
2- The modern part: The approach to urban design changed radically during the French colonial period (1920–45). New areas were built up with wide streets in a grid pattern and buildings were outwardly oriented (Al-Kodmany 1999). Damascus is surrounded by an oasis – the Ghouta region – watered by the Barada River that used to provide the city with drinking wa-ter.

Towards better Urban Spaces Moohammed Wasim Yahia
132
Materials and methods A combination of measurements and structured interviews was used for assessing different thermal environments to simultaneously determine us-ers’ thermal sensation through investigating different thermal indices.
Climate in Damascus Climatic data for temperature and relative humidity in Damascus is shown in Fig. 2. Damascus has hot sunny summers and mild winters. Summer temperatures can exceed 35 °C during the day, but evenings are generally cool. Spring and autumn are most comfortable with average temperatures in the range of 16 to 20 °C. Winters are fairly cold and the temperatures can reach 0 °C at night. (a) (b)
Fig. 1 a Location of Damascus in Syria, and b location of the measurement sites on a simplified map of the city of Damascus which is located between the Kassioun mountain chain in the northwest and an oasis in the south (see Fig. 3 for description of the sites)

Paper 2
133
Fig. 2 Temperature and relative humidity in Damascus (average values for the period 1961–1990). Source: Damascus airport meteorological station
Selection of measurement locations and time-periods The locations selected were divided into three categories: two types of residential areas and parks. These three categories represent the most common environments in Damascus. The first category – residential areas in modern Damascus – contained three measurement locations: Al Gas-sany area (circle 1 in Fig. 1b), the New Dummar area (circle 2 in Fig. 1b) and the Barzza area (circle 3 in Fig. 1b). The second category – Old Damas-cus – contained a deep canyon: Al Qaymarieh Street (circle 6 in Fig. 1b). The third category – parks in modern Damascus – contained two locations: Al Tigara Park (circle 4 in Fig. 1b), and Al Mazza Park (circle 5 in Fig. 1b). The measurement sites are also shown in Fig. 3.
The investigation was carried out during the hottest and coldest seasons; during August and September 2009 for the summer, and during January and February 2010 for the winter. Northwest–southeast (NW–SE), northeast–southwest (NE–SW), and east–west (E–W) street orientations were in-cluded in the measurements as well as open spaces in parks. In all six loca-tions, the fieldwork was scheduled mainly during the three hours starting from around noon since this time is the hottest time of the day. However, in order to extend the study of thermal comfort – to get a greater variety in mi-croclimatic conditions – measurements were also carried out in the morn-ing in the Barzza area and in the evening in old Damascus. See Table 1.

Towards better Urban Spaces Moohammed Wasim Yahia
134
Fig. 3 a–f Measurement sites in the city of Damascus. a Al Tigara park, b Al Gassany area, c New Dummar area, d Barzza area, e Al Mazza park, f Old Damascus

Paper 2
135
Table 1 Orientation and land use of the measurement locations as well as date, and time of measurements
The official climatic data in Damascus during the measurement periods
are shown in Table 2. It can be seen that the measurement days during summer were all similar to a normal day in August (see Fig. 2) whereas in winter, the weather varied considerably.
Table 2 Official climatic data for the period of the fieldwork in summer and winter seasons (air temperature, relative humidity, and wind speed). Source: Damascus airport meteorological station
Date Max. air temp. (°C)
Min. air temp. (°C)
Rel. humidity (Average) (%)
Wind speed (Average) (m/s)
12-Auga 37.0 17.3 33 3.2 13-Auga 37.4 18.0 33 4.1 15-Auga 38.2 19.8 38 4.4 17-Auga 39.4 20.0 31 5.4 18-Auga 39.6 19.0 37 5.4 19-Auga 37.8 20.0 40 5.1 10-Janb 20.2 2.00 47 1.5 17-Janb 19.7 7.00 54 4.0 24-Janb 14.0 4.80 84 6.4 31-Janb 19.5 5.60 67 4.0 05-Febb 9.50 0.00 45 4.7 06-Febb 9.80 –5.0 53 1.2
Category Location’s name
Orientation Land use Date of measure-ments
Time of meas-urements
Modern Da-
mascus
Al Gassany
NW– SE Residential road 13 August 2009
10 January 2010
13:00 to 15:00
12:15 to 15:25
New Dummar
----- Residential space 15 August 2009
24 January 2010
12:40 to 14:40
12:35 to 14:30
Barzza NE– SW Residential and
commercial space
18 August 2009
26 September 2009
31 January 2010
06 February 2010
13:20 to 15:00
08:50 to 11:35
11:55 to 14:35
08:00 to 11:11
Old Damascus Al Qaymarieh
street
E–W Residential, commer-
cial and recreational
road
19 August 2009
30 September 2009
06 February 2010
05 February 2010
12:30 to 14:20
15:30 to18:15
12:10 to 15:10
16:30 to 18:30
Public parks Al Tigara Park ----- Recreational space 12 August 2009
17 January 2010
13:00 to 14:40
11:45 to 15:05
Al Mazza Park ----- Recreational space 17 August 2009
05 February 2010
12:50 to 15:00
11:50 to 15:10

Towards better Urban Spaces Moohammed Wasim Yahia
136
a Measurement days during the summer time (August 2009) for the six studied locations. b Measurement days during the winter time (January and February 2010) for the six studied locations.
Micrometeorological measurements The measurement equipment was placed at the points where people could be expected to sit or walk. Air temperature (Ta), globe temperature (Tg), relative humidity (RH), wind speed (W) and wind direction (Wd) were measured. The measured microclimatic variables, measurement instru-ments, and their accuracy are presented in Table 3. The measurements in Al Gassany area, the Barzza area, and Al Mazza park where mainly con-ducted under the sunshine, whereas in Al Tigara park and Al Gassany area, the measurements were conducted partly in shade. Furthermore, the measurements in Old Damascus were completely in shade due to the high aspect ratio. Three areas - Al Gassany area, Old Damascus, and Al Mazza park - which represent the three studied categories of urban environments in Damascus were studied more in detail. Fig. 4 shows the urban character-istics of these three areas.
Fig. 4 Urban characteristics and measurement spots in (a) Al Gassany area, (b) Old Damascus and (c) Al Mazza park

Paper 2
137
Table 3 Measured variables, instruments, and accuracy of the instruments.Ta Air temperature, Tg globe temperature, RH relative humidity, W wind speed, Wd wind direction
a Ta = air temperature, Tg = globe temperature, RH = relative humidity, W = wind speed, Wd = wind direction.
For all measurements except wind, the height of the equipment was 1.1 m, which corresponds to the average height of the centre of gravity for adults (Mayer and Höppe 1987). The wind speed was measured at the height of 2 m, but it was later extrapolated down to 1.1 m using the follow-ing formula:
(1)
Where W1.1 = wind speed at the height of 1.1 m, and W2.0 = wind speed
at the height of 2 m. The Mean Radiant Temperature (MRT) – which considers both short-
wave and long-wave radiation and represents the weighted average tem-perature of an imaginary enclosure that gives the same radiation as the complex urban environment – has the strongest influence on thermo-physiological significant indices such as the Physiological Equivalent Tem-perature (PET) and the Predicted Mean Vote (PMV) (Matzarakis et al. 2007). In this study, MRT was derived from the globe temperature and the wind speed using the following formula (Thorsson et al. 2007):
(2)
Where Tg = the globe temperature (°C), W = the air velocity (m s−1), Ta = the air temperature (°C), D = the globe diameter = 40 mm, ε = the globe emissivity = 0.97.
The globe thermometer consisted of a flat grey painted table tennis ball. It should be noted that the MRT calculated in this way is very sensitive to variations in wind speed. E.g. an increase in the wind speed will mean that the globe cools down and Tg decreases, but as this cooling will not be in-stantaneous due to the thermal inertia of the globe, MRT will be overesti-mated. Similarly a sudden decrease in wind speed will lead to an underes-timated MRT. To reduce the sensitivity to wind speed variations, 10 minute averages of wind speed were used in the calculations of the MRT.
Calculation of outdoor thermal comfort indices A great number of indices, which try to predict the state of thermal comfort, mainly for indoor applications but also for outdoors, have been developed.
Variablea Instrument Accuracy
Ta Rotronic Hydroclip S3 ±0.3%°C
Tg Pt100 in a grey plastic ball ±0.3°C at 0°C
RH Rotronic Hydroclip S3 ±1.5% RH
W, Wd Gill WindSonic anemometer ±2%@12m/s

Towards better Urban Spaces Moohammed Wasim Yahia
138
The Predicted Mean Vote (PMV), the Standard Effective Temperature (SET*) and the New Effective Temperature (ET*) were all developed for indoors (McIntyre 1980). In addition, many indices have been primarily de-signed for outdoor applications, e.g., the Perceived Temperature (PT), which is based on the comfort equation of Fanger (Jendritzky et al. 2000), OUT_SET*, which is an adaptation of SET* for outdoor use (Pickup and de Dear 2000), and the Physiological Equivalent Temperature (PET) (Höppe 1999). In this study, PET, OUT_SET*, ET*, and PMV have been used to as-sess and evaluate the outdoor thermal environment in Damascus, whereas only PET and OUT_SET* were used for further analysis of thermal comfort limits. The RayMan PC application (Matzarakis et al. 2007) was used to cal-culate PET, whereas the ASHRAE Thermal Comfort Program (Fountain and Huizenga 1994) was used to calculate the OUT_SET*, ET*, and PMV indices.
Structured interviews A questionnaire survey was performed at the same time as the measure-ments in each location in order to compare the actual thermal sensation with the calculated thermal indices derived from the micrometeorological measurements. A structured interview form was designed to assess the people’s thermal sensation and other parameters such as gender and age, clothing, reason for being in the places, time spent outdoors, thermal pref-erence, assessment of the microclimate, aesthetic qualities of the place, emotional state, and assessing the attitude to urban outdoor exposure. However, this paper discusses mainly the results about thermal comfort sensation, activity and clothing. The structured interview forms were not answered by people individually but by support from an assistant group be-longing to Damascus University. Each interview took an average of 5 min to complete. A total of 920 people in both summer and winter were inter-viewed by a random selection. In each season, there were 60 interviews in each location plus 50 interviews in the Barzza area in the morning and in Old Damascus in the evening. The majority of the interviewees were be-tween 20 and 65 years of age. Of the total sample 76% were male and 24% female. This percentage, which was similar in all areas in both seasons, re-flects the fact that fewer women than men are present in public space for cultural reasons. The subjects were asked to report their thermal sensation according to a 9-point scale: very cold (–4), cold (–3), cool (–2), slightly cool (–1), comfortable (0), slightly warm (+1), warm (+2), hot (+3) and very hot (+4).
Assessment of neutral temperatures and thermal comfort range To determine the neutral temperature, which is defined as the temperature at which people feel thermally neutral (neither cool nor warm) and which corresponds to the value zero in the thermal sensation scale, probit tech-nique (Ballantyne et al. 1977) was used. The neutral temperatures were de-termined by grouping all thermal sensation votes (TSV) < 0 into a group of cooler than neutral, and all votes TSV > 0 into a group of warmer than neu-tral. The votes TSV = 0 were randomly split between the groups TSV < 0 and TSV > 0. The neutral temperature was then determined as the index temperature at which 50% of the sample voted cooler than neutral and 50% voted warmer than neutral. SPSS 18 (Statistical Package for the Social Sci-

Paper 2
139
ences Software for Windows) was used to perform the probit analysis. Ac-cording to ASHRAE Standard 55 (2004) acceptable thermal conditions must be acceptable to 90% (high standard) or 80% (typical applications) of the users. This means that ≤ 10% or ≤ 20% of the users feel thermally unac-ceptable. Normally votes outside the three central categories of the TSV scale are considered to be unacceptable votes (e.g. Lin 2009). In this study, the comfort limits for both 10% and 20% unacceptability were calculated. It should be noted that in the winter there are few votes in the range of +3 to +4 and in the summer there are even fewer votes in the range –3 to –4. Thus, these votes were carefully checked and a few strange values were excluded from the comfort limits and neutral temperature calculations, i.e. those that voted –4 during the summer although they wanted it to be cooler, and those that voted +4 during the winter although they wanted it to be warmer.
Results
Microclimatic variations Table 4 shows the variations of measured Ta, RH, W, and MRT in summer and winter for all locations. Table 4 illustrates the considerable differences between the seasons. However, the average values of wind speed were nearly the same (0.7 m/s in the summer and 0.8 m/s in the winter). The re-sults also show the microclimatic differences between the old and the modern part of Damascus, especially in summer, due to completely differ-ent urban design features in terms of aspect ratios, building materials, and building geometries (Figs. 3 and 4). The reason why the average values of MRT in Al Gassany area and Al Tigara park in the summer were lower than the values in other locations in modern Damascus was due to the shade from trees that affected the measurements. For both seasons, it was no-ticed that high values of MRT are not necessarily correlated with high values of Ta.

Towards better Urban Spaces Moohammed Wasim Yahia
140
Table 4 Average values of measured air temperature (Ta), relative humidity (RH), wind speed (W), and mean radiant temperature (MRT) in summer and winter in all locations. The meas-urements were taken on different days in the afternoon, unless otherwise stated.
Location Avg Ta (°C) Avg RH (%) Avg W (m/s) Avg MRT (°C)
Summer Winter Summer Winter Summer Winter Summer Winter
Al Gassany area 34.0 19.5 20.2 30.5 0.7 0.6 59.4 34.2
Dummar area 36.3 9.7 18.9 74.2 0.7 0.8 69.8 11.7
Barzza area 36.9 9.8 18.1 73.3 0.9 0.8 71.4 13.4
Al Tigara park 30.8 15.4 31.6 46.7 0.9 0.8 58.3 28.5
Al Mazza park 37.0 6.7 18.1 42.4 1.0 1.4 70.6 36.2
Old Damascus 34.4 8.3 24.3 35.1 0.4 0.3 36.5 9.3
Barzza area
(morning)
31.1 8.0 20.5 35.8 0.5 0.4 61.6 35.2
Old Damascus
(evening)
26.9 5.6 23.2 40.7 0.4 0.8 27.4 5.4
All locations Avg 33.4 10.4 21.8 47.3 0.7 0.8 56.9 21.7
Fig. 5 shows the spatial variations of MRT for Al Gassany area, Old Da-
mascus, and Al Mazza park as examples representing the outdoor urban environment in Damascus. It can be seen that for the summer MRT was higher in Al Mazza park than in Al Gassany area. The values in Old Damas-cus were considerably lower than in the two other places. The instability of MRT in Al Gassany area was due to the positioning of the measurements equipment, which was mounted beside a pedestrian path under a row of small trees where the globe thermometer during the measurement period was alternately in shade. In winter, there were major differences between the studied areas in terms of MRT. This is mainly because the weather was changing from one day to another during the measurement period (Table 2) and sometimes the change, of e.g clouds/solar exposure, even occurred during the measurements. As in summer MRT is however very stable in Old Damascus.

Paper 2
141
Fig. 5 Mean radiant temperature (MRT) variations in Al Gassany area, Old Damascus, and Al Mazza park during a summer and b winter
Characteristics of different thermal indices Table 5 shows the calculated PET, OUT_SET*, ET*, and PMV for all studied locations. For all indices, the results reveal that in the summer Old Damas-cus is less stressful than the outdoor urban spaces in modern Damascus, whereas in winter, Old Damascus is colder than the other areas due to the lack of solar exposure as a result of the high building density. In summer, Al Gassany area and Al Tigara park, where there was some shade from trees, were less stressful than the other sites in modern Damascus where the measurement spot was exposed to sunshine all the time.
Table 5 shows that the average values of the PET index are higher in summer and lower in winter than the average values of both the OUT_SET* and ET* indices. ET*, in turn, has higher values in summer and lower in winter than OUT_SET*. One of the reasons why PET and ET* have more ex-treme values is that they do not take clothing and activity into account as input variables. Another reason why OUT_SET* is slightly lower than ET* in the summer may be because the effect of wind speed is included in the

Towards better Urban Spaces Moohammed Wasim Yahia
142
calculation of OUT_SET* and not in ET*. For the PMV index, the calculated values in winter are within the range from -3 (very cold) to +3 (very hot) except in Old Damascus in the evening. Only Al Gassany area was comfort-able, i.e. within the comfort range of the index of -0.5 to +0.5 but this was mainly because the particular afternoon was exceptionally warm. In sum-mer the values were in general well above the defined range of PMV and reached as high as 8 in the Barzza area. Only the values of Old Damascus, both during the day and in the evening, were within the defined scale of PMV.
Table 5 Average calculated values in summer and winter in all locations for the physiological equivalent temperature (PET), the outdoor standard effective temperature (OUT_SET*), the new effective temperature (ET*), and the predicted mean vote (PMV). The values are from dif-ferent days in the afternoon, unless otherwise stated.
Avg PET °C Avg OUT_SET* °C
Avg ET* °C Avg PMV
Summer Winter Summer Winter Summer Winter Summer Winter
Al Gassany area 46.1 23.2 36.0 27.6 36.7 23.9 5.5 0.2
Dummar area 53.3 7.2 38.4 15.6 38.4 10.6 6.5 -2.8
Barzza area 54.0 7.8 38.2 15.8 39.3 11.2 8.0 -2.5
Al Tigara park 42.7 17.2 34.6 21.3 36.1 19.9 4.8 -1.6
Al Mazza park 53.2 11.1 37.9 19.4 39.1 15.2 7.7 -2.1
Old Damascus 35.3 6.7 32.3 14.4 31.9 8.6 2.9 -2.2
Barzza area (morning)
46.1 17.1 36.2 23.5 36.9 19.3 5.7 -1.1
Old Damascus (evening)
26.3 2.0 25.7 9.9 25.5 5.5 0.5 -3.9
All locations Avg 44.6 11.6 34.9 18.4 35.5 14.3 5.2 -2.0
Subjective thermal sensation Fig. 6 illustrates the clear differences between people’s subjective thermal sensation in summer and winter for all studied locations together. The re-sult shows that the people’s thermal sensation in summer is between cool and very hot, whereas in winter it is between very cold and hot. The highest percentage of people feels comfortable in the winter time, whereas they feel hot in the summer time. The reason why the distribution of the comfort votes was widely spread in both summer and winter is due to the varying weather conditions between the measurement days (especially in winter) but also due to individual differences of people’s thermal sensation. A simi-lar difference in distribution between seasons was found in Sydney, Austra-lia, by Spagnolo and de Dear (2003).

Paper 2
143
Fig. 6 Percentage frequencies for people's thermal sensation in the summer and winter sea-sons.
Relationship between thermal sensation votes and thermal indices When comparing the relationship between TSV and the calculated indices (PET and OUT_SET*) it was found that the original thermal sensation scales of these indices often do not correspond to people’s actual thermal sensa-tion in Damascus. Fig. 7 shows the relationship between TSV and the index temperatures for PET and OUT_SET* for each 1 °C index temperature. For both indices, the results show in general a wide spread of votes. This re-flects the variations in people’s thermal sensation which supposedly is due to differences in thermal history, emotional state, etc as well as individual thermal preferences. The variations are also caused by differences in activ-ity and clothing. The regression lines for all the tested indices for both sea-sons are as follows:
PET Summer TSV=0.060×PET – 0.941 (R2=0.42) (3) Winter TSV=0.114×PET – 2.755 (R2=0.60) (4) OUT_SET* Summer TSV=0.134 ×OUT_SET –3.208 (R2=0.87) (5) Winter TSV=0.082×OUT_SET –2.928 (R2=0.66) (6)

Towards better Urban Spaces Moohammed Wasim Yahia
144
Fig. 7 Correlation between the mean thermal sensation votes (TSV) and a the PET index and b the OUT_SET* index in summer and winter
The slopes of the regression lines indicate the sensitivity to changes of the index values. In summer for PET, the slope is 0.060 corresponding to 16.6 °C PET per actual thermal sensation unit, whereas in winter, the slope is 0.114 corresponding to 8.8 °C PET per actual thermal sensation unit. This shows that people’s thermal sensation is more sensitive to the variations of PET in winter than in summer. A similar tendency was found by Lin (2009) in Taiwan. In the case of the OUT_SET*, the slope for the summer is 0.134 which corresponds to 7.5 °C, whereas in winter, the slope is 0.082 and it corresponds to 12.2 °C per thermal sensation unit. This means that the peo-ple’s thermal sensation is more sensitive to the variations of OUT_SET* in summer than in winter. A similar tendency was found by Lin et al. in Tai-wan (2011).
The results show that the OUT_SET* index – especially in summer – has better correlation with TSV than the PET index (R2 for OUT_SET* is about 0.7 in winter and 0.9 in summer, whereas R2 for PET is about 0.6 in winter and 0.4 in summer). This is because PET does not take clothing and activity into account as input data (Höppe 1999).
Thermal comfort limits and neutral temperatures Fig. 8 shows the percentage of unacceptability in summer and winter for each 1 °C index temperature of the PET and OUT_SET* indices. From the graphs in Fig. 8, the upper and lower limits of the comfort range for differ-ent percentages of unacceptability can be determined. However, to obtain a comfort range with both the lower and upper limit, measurements during all seasons including spring and/or autumn would have been required, es-pecially in a hot dry climate where there is a considerable difference be-tween summer and winter. Since in this study the field measurements were only conducted during the extreme weather conditions of summer and winter respectively – and mainly during three hours of the afternoon – it was not possible to define one comfort range for the whole year which is accepted by 80% or 90% of the people. Instead, summer and winter sea-sons were split up into two different groups and the upper and lower com-

Paper 2
145
fort limits for the summer and winter could be determined. These limits will be useful to architects and urban designers because they are valid for the most extreme weather conditions.
Fig. 8 Level of thermal unacceptability for a PET during winter, b PET during summer, c OUT_SET* during winter and d OUT_SET* during summer
The results illustrate that the OUT_SET* index has better correlation with people’s thermal unacceptability than the PET index (R2 for OUT_SET* is about 0.9 for both winter and summer, whereas R2 for PET is about 0.6 in winter and 0.8 in summer). This can be explained by the influence of cloth-ing and activity on people’s thermal comfort.
Table 6 shows the upper and lower limits of thermal comfort range for 80% and 90% acceptability for PET and OUT_SET* during summer and win-ter in Damascus. 80% of acceptability will be applied in this study for further analysis since a wider comfort range is more appropriate outdoors due to the large climate variability (Spagnolo and de Dear 2003). Table 6 also illus-trates that the neutral temperatures in summer for both PET and OUT_SET* are considerably lower than in winter.

Towards better Urban Spaces Moohammed Wasim Yahia
146
Table 6 Neutral temperatures and upper limits in summer and lower limits in winter of the comfort range at 80 % and 90 % acceptability for PET and OUT_SET* in Damascus
Index Neutral temperatures (°C)
Comfort range limits (°C)
Winter Summer Acceptability (%) Lower limit Winter Upper limit Summer
PET 23.4 15.8 90 22.8 28.5
80 21.0 31.3
OUT_SET* 35.1 23.1 90 28.9 29.1
80 27.6 31.3
Behavioural adjustments – the role of clothing Table 7 shows the reported average values of activity level and clothing in-sulation in all studied areas during summer and winter. In general, very small differences were found between areas and seasons in terms of peo-ple’s physical activity and the reason is that during the fieldwork the people were mainly standing, walking slowly, or sitting. These actions represent the typical daily behaviour of the people in Damascus city in the outdoor urban environment both in summer and winter. On the other hand, the clothing values in summer time were significantly lower than the values in the winter due to the weather differences between these two seasons (see Table 7). The clothing levels were however similar within each season ex-cept during the measurements in Al Tigara Park on 17 January, which was a warm winter day (see Table 2); on this day the clothing value was clearly lower than the other winter values.
Table 7 Reported average values of activity and clothing in all studied areas during the meas-urement periods for the summer and winter seasons
Fig. 9 shows the relationship between the average clothing value and the
thermal comfort indices (PET and OUT_SET*) for each 1 °C index tempera-ture. For both indices, the results show that when the index values in-crease, the clothing values decrease. This result is evidence of adaptation
Location name
Activity (average) met summer winter
Clothing (average) clo summer winter
Al Gassany area 1.6 1.6 0.56 0.96 Dummar area 1.7 1.5 0.57 1.00
Barzza area 1.4 1.6 0.56 0.99
Al Tigara Park 1.4 1.4 0.57 0.85 Al Mazza Park 1.4 1.6 0.58 1.02 Old Damascus 1.8 1.7 0.57 1.01
Barzza area (morning) 1.4 1.6 0.54 0.94
Old Damascus (evening) 1.6 1.5 0.59 1.00
All locations Avg 1.5 1.6 0.57 0.97

Paper 2
147
to the weather and shows that climate conditions affect people’s clothing. For these two indices, the results indicate that the distribution of clothing values is more widely spread in winter than summer. However, the varia-tion of clothing values for PET – between 0.5 and 1.7 clo – is smaller than OUT_SET* – between 0.6 and 2.4 clo – and this is because OUT_SET* takes clothing into account as input data. Thus, OUT_SET* is more sensitive to the clothing than PET.
Fig. 9 Relationship between clothing and (a) the PET index and (b) the OUT_SET* index for summer and winter together
Fig. 10 shows the relationship between clothing and the thermal sensa-tion votes in summer and winter as one sample. Regardless the thermal in-dex, Fig. 10 shows that the distribution of clothing values – in relation to the thermal sensation votes – is between 0.4 and 2.5 clo. This range represents people’s average clothing values during the summer and winter seasons. Fig. 10 also illustrates that when people vote within the cold side of the thermal comfort scale, they generally tend to wear heavy clothing, whereas when they vote within the warm side of the thermal comfort scale, they tend to wear light clothing. The result confirms the effect of thermal com-fort on clothing.
Fig. 10 Relationship between clothing and the thermal sensation votes in summer and winter

Towards better Urban Spaces Moohammed Wasim Yahia
148
Physiological adaptations – the effect of air conditioning In hot dry Damascus, using indoor air conditioning devices in summer is very common so as to provide for better thermal conditions. In order to in-vestigate the effect of air conditioning on people’s thermal sensation out-doors, a comparison between thermal comfort limits for people who have and those who do not have air conditioning devices – both at home and at work – has been conducted. Fig. 11 shows the relationship between the level of acceptability and the indices OUT_SET* and PET for each 1 °C index temperature. It is shown that at 80% of acceptability, the lower and upper limits of the comfort zone for people who do not have air conditioning de-vices (25.5 °C and 32 °C respectively) are wider than the limits for those who have air conditioning devices (29 °C and 30.5 °C respectively). In the summer, the results illustrate that the people who do not have air condi-tioning devices have more ability to accept higher temperatures than those who have air conditioning devices, whereas in winter, they are more able to accept lower temperatures than those who have air conditioning de-vices. This is evidence of physiological adaptation to the outdoor environ-ment in Damascus city. The results agree well with the physiological adap-tation found in naturally ventilated offices in Thailand when compared with offices with air conditioning (Busch 1992).
Fig. 11 Relationship between the level of acceptability and OUT_SET* for those who have and those who have not air conditioning for (a) winter and (b) summer
Discussion
Effect of urban geometry on microclimates In summer, streets and parks in modern Damascus are more thermally stressful than the streets in Old Damascus. This reflects the strong influence of the urban geometry on the microclimate within built environments. Old Damascus has deep street canyons with high aspect ratios, which create a more comfortable microclimate since direct solar radiation and the mean radiant temperature decrease with the increase of the aspect ratio (Ali-Toudert and Mayer 2006). In contrast, the outdoor spaces in modern Da-

Paper 2
149
mascus have a low aspect ratio and consequently these spaces are more exposed to solar radiation, which has a negative impact on outdoor thermal comfort. Moreover, few places in the studied areas of modern Damascus have been designed to protect against solar radiation, especially in the Barzza and New Dummar areas. However, in the parks and in Al Gassany area less stressful environments can be found due to the existence of shad-ing trees.
In winter, it was more difficult to compare the microclimatic qualities be-tween the areas since the weather conditions varied from day to day during the field work. Old Damascus was the coldest area and that is because of the cold weather on the measurement day as well as the deep canyon, which prevents the direct solar radiation to reach the ground. In contrast, Al Gassany area was most comfortable, and that is because of the warm weather on the measurement day as well as the fact that the urban geome-try in Al Gassany area allows the solar beam to reach the ground.
Thermal comfort zones and neutral temperatures In this study, all the studied indices had basically the same tendency in as-sessing the outdoor physical urban environment in the hot dry climate of Damascus. The study of Spagnolo and de Dear (2003) found that many of the thermal comfort indices they tested were statistically better to predict the outdoor thermal comfort in summer than in winter due to the skewed nature of the winter sample in their study. In this study no significant differ-ence could be found between summer and winter predictions which may be because both the summer and winter samples were skewed and this may have affected the neutral temperatures. However, the results illustrate that the OUT_SET* index has better correlation with TSV and thermal unac-ceptability than the PET index and this may be due to the role of clothing and activity which are included in OUT_SET*.
In Table 8 the calculated thermal comfort ranges and neutral tempera-tures of PET from this study in Damascus are compared with other studies.
Table 8 Comparison of neutral temperatures and comfort ranges of the PET index in different climates.
Climate Neutral tempera-ture° C
Comfort range °C Author
Winter Summer Winter Summer
Western/ middle Europe
n/a n/a 18–23a (Matzarakis and Mayer 1996)
Subtropical (Tai-wan)
23.7 b 25.6b 26–30c (Lin 2009; Lin and Matzarakis 2008)
Subtropical (Sydney) 28.8 22.9 n/a n/a (Spagnolo and de Dear 2003)
Hot arid, urban parks (Cairo)
26.5d 27.4d 22–30 21–29 (Mahmoud 2011)
Hot dry (Damascus) 23.4 15.8 21–n/a n/a–31 This study
Towards better Urban Spaces Moohammed Wasim Yahia
150
a Theoretical comfort scale for all seasons b Neutral temperatures in Taiwan were calculated by Lin (2009). The summer, spring and fall in Taiwan are defined as the hot season whereas the winter is called cool season (Lin 2009). c One comfort range for the hot and cool seasons together (Lin and Matzarakis 2008) d Neutral temperatures were calculated as the average values of the neutral temperatures in nine measurement locations in an urban park in Cairo.
It may seem surprising that the neutral temperature for Damascus in the summer is lower than in the winter (Table 8) since one would expect the local population to be adapted to the weather conditions in each season. However, the results agree with those of Spagnolo and de Dear (2003). They explained the phenomenon by applying the concept of alliesthesia which is a psychological mechanism explaining the differences in sensa-tion between seasons, i.e. if people feel warm then anything which makes them feel colder will be pleasant and vice versa. Conversely, the results disagree with the results for Taiwan (Lin 2009) and Cairo (Mahmoud 2011) where the authors found slightly higher neutral temperatures in summer than in winter (see Table 8).
This study has defined different thermal comfort limits for the summer and winter, whereas the other studies defined only one comfort range for the whole year. The reason to study the seasons separately is that people have adapted themselves differently to each season physiologically and psychologically (Mahmoud 2011). Thus, the lower limit for PET in winter (21 °C) is fairly close to the urban park in Cairo (22 °C), and the upper limit in summer (31 °C) is close to the one in the urban park of Cairo (29 °C). The explanation of this difference may be that the study of Cairo was only con-ducted in a park whereas this study was conducted in different urban envi-ronments. In addition, this study found that the parks in summer are less stressful than the built-up environments in the city (see Table 5).
In Table 9 the calculated thermal comfort ranges and neutral tempera-tures of OUT_SET* are compared with other studies. The winter neutral temperature in Damascus is higher than the summer one and the differ-ence between the summer and winter neutral temperatures is 12 °C. This agrees well with the results in subtropical Sydney (Spagnolo and de Dear 2003) where the difference was also around 12 °C. Moreover, the summer neutral temperatures in Damascus (23.1 °C) and in Sydney (23.3 °C) were almost equal. However, Lin et al. (2011) found higher neutral OUT_SET* in the hot season (29.3 °C) than in the cool season (28 °C) and the difference between these two is only 1.3 °C.

Paper 2
151
Table 9 Comparison of neutral temperatures and comfort ranges of the OUT_SET* index in different climates
Climate Neutral tempera-ture °C
Comfort range °C Author
Winter Summer Winter Summer
Subtropical (Tai-wan)
28 29.3 n/a n/a (Lin et al. 2011)
Subtropical (Syd-ney)
33.3 23.3 n/a n/a (Spagnolo and de Dear 2003)
Hot dry (Damas-cus)
35.1 23.1 27.7–n/a n/a–31 This study
Clothing and cultural traditions Many studies have investigated the relationship between clothing and thermal comfort. Andrade et al (2011) concluded in their study in Lisbon that the clothing values varied between 0.24 and 1.75 mainly as a result of seasonal and daily variations in air temperature and wind conditions. Simi-larly, the studies of Nikolopolou and Lykoudis (2006) in different countries in Europe and Lin (2009) in Taiwan found a strong relationship between average air temperatures and clothing. Lin (2009) also found a strong rela-tionship between the PET and clothing values and concluded that changing clothing is one of the individual ways of thermal adaptation. As expected, this study found that the insulation value of people’s clothing tend to de-crease with increasing temperatures. The summer (hot season) values in this study are similar to those of Taiwan – around 0.6 clo (Table 7). The win-ter (cool season) values are however much higher in Damascus due to much colder winters. The study reveals that in the case of Damascus, the choice of clothing is to some extent also linked to cultural aspects; in the winter, high clothing values (about 2 clo) occur also at the sensation “slightly cool” (–1) (Fig. 10) . These clothing values are represented by the values far above the regression curve. Thus in the winter, some people ad-just their clothing according to the weather, whereas others use heavy clothing although it is slightly cold. Hence, the dress code of some of the people of Damascus seems to depend on cultural traditions rather than climate whereas most people choose their clothing according to the weather conditions when they feel thermally uncomfortable.
Thermal comfort limits for urban design in Damascus The results of this study give valuable information of which comfort limits urban designers in Damascus should aim at. The primary aim could be of course to identify the thermal comfort zone. However, due to the lack of data for spring and autumn in addition to the considerable difference be-tween summer and winter, the lower and upper limits of the comfort zone for each of these seasons would be enough for architects and planners to apply. In addition, applying the lower and upper limits of the winter and summer comfort zones respectively in urban design will lead to more suit-able proposals regarding microclimate because the comfort requirements

Towards better Urban Spaces Moohammed Wasim Yahia
152
for the most extreme weather conditions will be achieved and these limits in turn will be valid for the entire year.
This study illustrates that the OUT_SET* index has better correlation with TSV and thermal unacceptability than the PET index and this is due to the role of clothing and activity that OUT_SET* takes into account as input data. Thus, the use of OUT_SET* is more suitable than PET. But on the other hand, the choice of thermal comfort index depends on the aim of the study. Among the tested indices, ET* does not take variations in wind speed into account and is thus less suitable for this reason. If the aim of the study is only to assess and evaluate the physical environment independently from the people’s sensations, e.g., if the aim is to compare the thermal comfort of different design proposals through simulations, the urban designer or re-searcher can use any of other indices tested in this study. If on the other hand, the aim is to assess the thermal environment taking into account people’s thermal sensation, one can use an index that takes clothing and activity into account such as OUT_SET* or PMV. The use of these indices however requires knowledge – or at least an estimate – about people’s clothing and activity. The fact that OUT_SET* is expressed in °C makes it easier to interpret than PMV. The PMV index is also restricted to moderate environments near neutrality (Spagnolo and de Dear 2003).
Conclusions This study assessed the microclimate of the outdoor urban environment and investigated the relationship between different thermal comfort indices and people’s actual thermal sensation in the hot dry city of Damascus. Thermal conditions of different outdoor environments vary considerably, mainly as a function of solar access. It was concluded that the urban design in Damascus needs to include well shaded spaces for pedestrians – e.g. by using high building density or vegetation – to protect pedestrians in summer as well as open spaces to provide solar access in winter.
Furthermore, this study defined the upper summer and lower winter comfort limits for PET and OUT_SET* in hot dry Damascus. This is impor-tant information for urban designers aiming for a climate-conscious urban design. The study also showed the influence of culture and traditions on clothing. While most people choose the clothing according to the climate, some people in Damascus are influenced by their cultural traditions when they choose clothes to wear.
This study highlighted the importance of a climate-conscious urban de-sign and design flexibility. It is important to consider microclimate and thermal comfort in the urban design process and requirements for a cli-mate-conscious urban design should preferably be included in the planning regulations for cities such as Damascus. In addition, existing urban envi-ronments in Damascus could be modified in order to provide a better out-door thermal environment. Such studies could enhance the thermal com-fort and suggest improvements of the existing urban planning regulations.
Further studies are needed since this and other studies have shown that the actual thermal sensation is not only affected by microclimatic parame-ters (air temperature, solar radiation, relative humidity, and wind speed) and personal parameters (people’s activity and clothing). Future studies should look into other parameters such as the aesthetic qualities of the place, as well as psychological factors such as thermal history, emotional

Paper 2
153
state, and attitude towards urban outdoor exposure. Furthermore, meas-urements and thermals sensation questionnaires that cover all seasons are needed in order to define the annual comfort zone for Damascus.
Acknowledgements This research was funded by the Erasmus Mundus External Cooperation Window and Lund University, Sweden. The authors are most grateful to those students of the Architecture faculty at Damascus University who as-sisted in the questionnaire survey.
References Ali-Toudert F, Mayer H (2006) Numerical study on the effects of aspect ratio and so-
lar orientation on outdoor thermal comfort in hot and dry climate. Build Envi-ron 41: 94–108.
Ali-Toudert F, Djenane M, Bensalem R, Mayer H (2005) Outdoor thermal comfort in the old desert city of Beni-Isguen, Algeria. Climate Research 28: 243–256.
Al Jawabra F, Nikolopoulou M (2009) Influence of hot arid climate on the use of out-door urban spaces and thermal comfort: Do cultural and social backgrounds matter?. Intelligent Buildings International, 2 (3): 198–207.
Al-Kodmany K (1999) Privacy: Traditional and Modern Architecture and Urban De-sign. Urban Design 4: 283–312.
Andrade H, Alcoforado M J, Oliveira S (2011) Perception of temperature and wind by users of public outdoor spaces: relationships with weather parameters and personal characteristics. Int J Biometeorol 55: 665–680.
ASHRAE Standard 55 (2004). Thermal environmental conditions for human occu-pancy.American Society of Heating, Refrigerating and Air-Conditioning Engi-neers, Inc., Atlanta.
Ballantyne E R, Hill R K, Spencer J W (1977) Probit Analysis of Thermal Sensation Assessments. Int J Biometeorol 21: 29–43.
Bourbia F, Boucheriba F (2010) Impact of street design on urban microclimate for semi arid climate (Constantine).Renewable Energy 35: 343–347.
Busch J F (1992) A tale of two populations: thermal comfort in air- conditioned and naturally ventilated offices in Thailand. Energy and Buildings 18:235–249.
Emmanuel R (2005) An urban approach to climate- sensitive design: strategies for the tropics. Spon Press, London.
Fahmy H, Sharples S, Yahia M (2010) LAI based trees selection for mid latitude urban developments: a microclimatic study in Cairo, Egypt. Build Environ 45: 345–357
Fountain M E, Huizenga C (1994) Using the ASHRAE thermal comfort tool. An ASH-RAE Special Publication, ASHRAE, Atlanta.
Höppe P (1999) The Physiological Equivalent Temperature – a universal index for the assessment of the thermal environment. Int J Biometeorol 43: 71–75.
Jendritzky G, Staiger H, Bucher K, Graetz A, Laschewski G. (2000) The perceived temperature: The method of the Deutscher Wetterdienst for the Assessment of Cold Stress and Heat load for the Human Body, Presented at Internet Work-shop on Windchill.

Towards better Urban Spaces Moohammed Wasim Yahia
154
Johansson E (2006) Influence of urban geometry on outdoor thermal comfort in a hot dry climate: A study in Fez, Morocco. Build Environ 41: 1326–1338.
Knez I, Thorsson S (2006) Influences of culture and environmental attitude on ther-mal, emotional and perceptualevaluations of a public square. Int J Biometeo-rol 50: 258–268.
Lin TP, de Dear R, Hwang R L (2011) Effect of thermal adaptation on seasonal out-door thermal comfort. Int. J. Climatol 31: 302–312.
Lin TP (2009) Thermal perception, adaption and attendance in a public square in hot and humid regions. Build Environ 44: 2017–2026.
Lin TP, Matzarakis A (2008) Tourism climate and thermal comfort in Sun Moon Lake, Taiwan. Int J Biometeorol 52(4): 281–290.
Mahmoud A H A (2011) Analysis of the microclimatic and human comfort conditions in an urban park in hot and arid regions. Build Environ 46: 2641–2656.
Matzarakis A, Rutz F, Mayer H (2007) Modelling radiation fluxes in simple and com-plex environments – application of the RayMan model. Int J Biometeorol 51: 323–334.
Matzarakis A, Mayer H (1996) Another Kind of Environmental Stress: Thermal Stress. WHO Colloborating Centre for Air Quality Management and Air Pollution Con-trol. NEWSLETTERS18: 7–10.
Mayer H, Höppe P (1987) Thermal comfort of man in different urban environments. Theoretical and Applied Climatology 38: 43–49.
McIntyre D A (1980) Indoor Climate. Applied Science Publishers, London.
Nikolopoulou M, Lykoudis S (2006) Thermal comfort in outdoor urban spaces: analy-sis across different European countries. Build Environ 43: 1185–1196.
Nikolopoulou M, Baker N, Steemers K (2001) Thermal comfort in outdoor urban spaces: understanding the human parameter. Solar Energy 70: 227–35.
Pearlmutter D, Berliner P, Shaviv E (2007) Integrated modelling of pedestrian energy exchange and thermal comfort in urban street canyons. Build Environ 42: 2396–2409.
Pickup J, de Dear R (2000) An outdoor thermal comfort index (OUT_SET*) - Part I- The model and its assumptions. In: de Dear R et al (ed) Biometeorology and Urban Climatology at the Turn of the Millennium. World Meteorological Or-ganization, Sydney, pp 279–283.
Shashua-Bar L, Erell E, Pearlmutter D (2011) The influence of trees and grass on out-door thermal comfort in a hot-arid environment. International Journal of Cli-matology 31: 1498–1506.
Spagnolo J, de Dear R (2003) A field study of the thermal comfort in outdoor and semi-outdoor environments in subtropical Sydney Australia. Build Environ 38: 721–738.
Thorsson S, Lindberg F, Eliasson I, Holmer B (2007) Different methods for estimating the mean radiant temperature in an outdoor urban setting. Int. J. Climatol 27: 1983–1993.
Thorsson S, Lindqvist M, Lindqvist S (2004) Thermal bioclimatic conditions and pat-terns of behavior in an urban park in Göteborg, Sweden. Int J Biometeorol 48: 149–156.
Zacharias J, Stathopoulos T, Hanqing W (2001) Microclimate and downtown open space activity. Environment and Behavior 33: 296–315.

155
Originally presented at the 8th International Conference on Urban Climate (ICUC8), 6th-10th August, 2012, Dublin, Ireland
Paper 3

Towards better Urban Spaces Moohammed Wasim Yahia
156

Paper 3
157
Urban microclimate and thermal comfort in outdoor spaces in hot dry Damascus Moohammed Wasim Yahia, Erik Johansson. Housing Development & Management, Lund University, Sweden.
Abstract Due to the complexity of urban microclimate and thermal comfort related to outdoor urban spaces, it is very necessary to deepen our knowledge of these issues in order to enhance better guidelines for the urban planning and urban design processes, especially when the relationship between ur-ban design and urban microclimate is not known. The aim of this study is to investigate different thermal environments in the city of Damascus, Syria during summer and winter time concerning outdoor thermal comfort. This study is based on microclimatic field measurements and structured inter-views in six different locations including residential areas and parks in modern Damascus as well as a residential street in Old Damascus. The re-sults show that microclimatic conditions vary considerably between the dif-ferent sites. It is illustrated that outdoor spaces in Old Damascus are more comfortable than outdoor spaces in modern Damascus. It is also shown that parks are more comfortable than residential areas in modern Damas-cus. The study highlights the effect of urban design on microclimate and demonstrates the need to create better urban spaces in harmony with mi-croclimate. Keywords: Damascus; Hot dry; Microclimate; Thermal comfort; Urban spaces
1. Introduction The quality of outdoor urban spaces has received a great deal of attention in recent years. In addition, there is a broad recognition that microclimatic conditions contribute to the quality of life in cities, both from the economic and social viewpoint. Thus, the quality of outdoor urban spaces has a great importance in urban planning and design as well as in planning social, envi-ronmental, and cultural functions. On the other hand, the combination of urban microclimates and thermal comfort in the outdoor built environment can be useful to improve the physical and climatic aspects of urban spaces, to make it possible to animate underused parts in the city, and to enhance the quality of life by reaching a level of harmony between the outdoor envi-ronment, microclimates and thermal comfort. This is a very important topic especially in hot dry regions where the large temperature variation between summer and winter as well as between night and day makes the adapta-

Towards better Urban Spaces Moohammed Wasim Yahia
158
tion to the climate difficult. In addition, human performance of both mental and physical tasks diminishes at uncomfortably high temperatures.
Previous studies in hot and dry climates have highlighted the importance of microclimate and thermal comfort in urban design. A few studies have conducted simulations focusing either on microclimate and thermal com-fort in street canyons, e.g. [1] or on the influence of urban planning regula-tions in hot and dry climates, e.g. [2]. Some others have conducted mea-surements, e.g. [3]. Others have focused on subjective thermal sensation in urban parks, e.g. [4]. Although these and other studies have provided useful insights in the field of microclimate and thermal comfort, there is still a need to investigate all types of thermal environments in hot dry regions so as to develop useful guidelines for architects and urban designers. The aim of this study is to investigate different thermal environments in the city of Damascus, Syria through microclimatic measurements and structured in-terviews on outdoor thermal comfort during summer and winter.
2. Materials and methods
2.1 The city of Damascus and its climate Damascus city (Elevation: 620 meters, Latitude: 33.5° N, Longitude: 36.5° E) is located in the south-west of the Syrian Arab Republic in the Middle East and It has two main parts:
1. The old part: It has a regular planning in general, with N-S and E-W street orientations. Most streets are narrow in the form of deep canyons and the buildings have an inward orientation to the courtyards.
2. The modern part: The approach to urban design changed radically during the French colonial period (1920–45). New areas were built up with wide streets in a grid pattern and buildings were outwardly oriented. Da-mascus is surrounded by an oasis – the Ghouta region – watered by the Ba-rada River that used to provide the city with drinking water.
Damascus has sunny summers (June to August) and fairly cold winters (December to February). Summer temperatures can reach in excess of 35°C during the day, but evenings are generally cool. In winter, minimum temperatures can reach 0°C. Snowfall is common in winter on the moun-tains surrounding the city. Spring and autumn have the most comfortable climate with average temperatures in the range of 16 to 20°C
2.2 Measurements and structured interviews Both field measurements and a questionnaire survey were conducted dur-ing the summer of 2009 and the winter of 2010 in Damascus and six loca-tions were selected for the fieldwork and these locations were divided into three categories. The first category – residential areas in modern Damascus – contained three measurement locations: Al Gassany area (picture b in Fig.1), the New Dummar area (picture c) and the Barzza area (picture d). The second category – Old Damascus – contained a deep canyon: Al Qay-marieh Street (picture f). The third category – parks in modern Damascus – contained two locations: Al Tigara Park (picture a), and Al Mazza Park, (pic-ture e). In these six locations, the measurement fieldwork was scheduled mainly during the three hours starting from around noon, since this time is
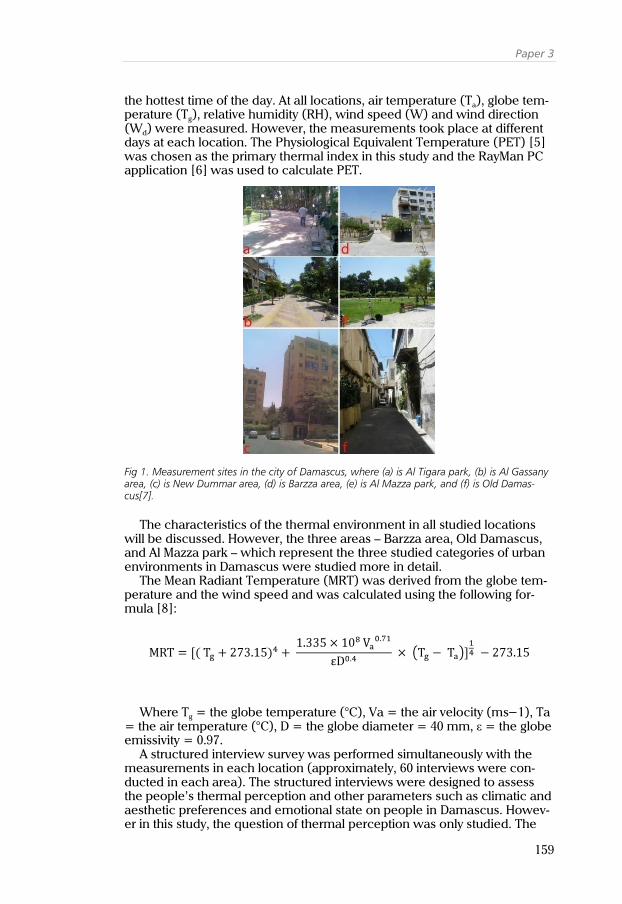
Paper 3
159
the hottest time of the day. At all locations, air temperature (Ta), globe tem-perature (Tg), relative humidity (RH), wind speed (W) and wind direction (Wd) were measured. However, the measurements took place at different days at each location. The Physiological Equivalent Temperature (PET) [5] was chosen as the primary thermal index in this study and the RayMan PC application [6] was used to calculate PET.
Fig 1. Measurement sites in the city of Damascus, where (a) is Al Tigara park, (b) is Al Gassany area, (c) is New Dummar area, (d) is Barzza area, (e) is Al Mazza park, and (f) is Old Damas-cus[7].
The characteristics of the thermal environment in all studied locations will be discussed. However, the three areas – Barzza area, Old Damascus, and Al Mazza park – which represent the three studied categories of urban environments in Damascus were studied more in detail.
The Mean Radiant Temperature (MRT) was derived from the globe tem-perature and the wind speed and was calculated using the following for-mula [8]:
Where Tg = the globe temperature (°C), Va = the air velocity (ms−1), Ta = the air temperature (°C), D = the globe diameter = 40 mm, ε = the globe emissivity = 0.97.
A structured interview survey was performed simultaneously with the measurements in each location (approximately, 60 interviews were con-ducted in each area). The structured interviews were designed to assess the people’s thermal perception and other parameters such as climatic and aesthetic preferences and emotional state on people in Damascus. Howev-er in this study, the question of thermal perception was only studied. The
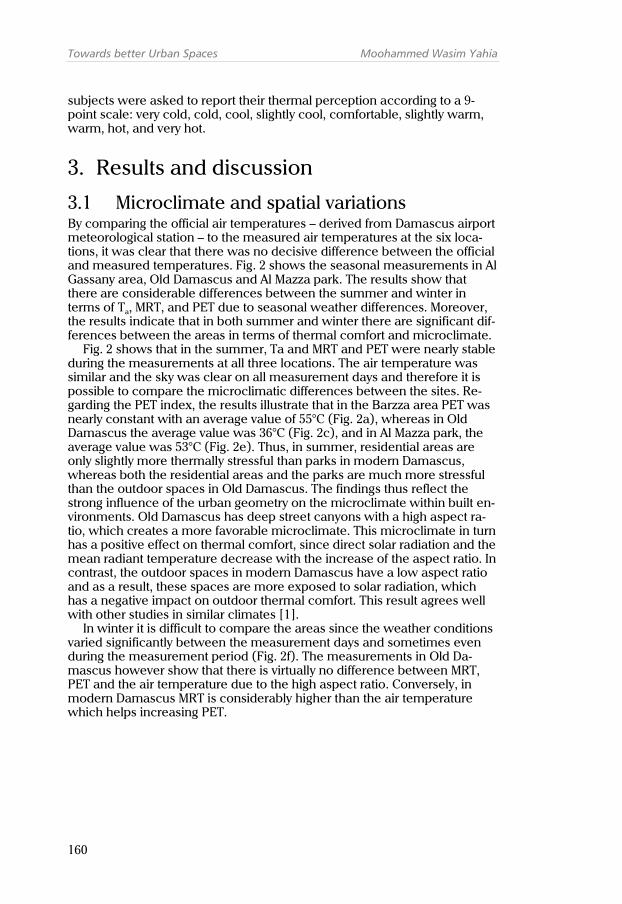
Towards better Urban Spaces Moohammed Wasim Yahia
160
subjects were asked to report their thermal perception according to a 9-point scale: very cold, cold, cool, slightly cool, comfortable, slightly warm, warm, hot, and very hot.
3. Results and discussion
3.1 Microclimate and spatial variations By comparing the official air temperatures – derived from Damascus airport meteorological station – to the measured air temperatures at the six loca-tions, it was clear that there was no decisive difference between the official and measured temperatures. Fig. 2 shows the seasonal measurements in Al Gassany area, Old Damascus and Al Mazza park. The results show that there are considerable differences between the summer and winter in terms of Ta, MRT, and PET due to seasonal weather differences. Moreover, the results indicate that in both summer and winter there are significant dif-ferences between the areas in terms of thermal comfort and microclimate.
Fig. 2 shows that in the summer, Ta and MRT and PET were nearly stable during the measurements at all three locations. The air temperature was similar and the sky was clear on all measurement days and therefore it is possible to compare the microclimatic differences between the sites. Re-garding the PET index, the results illustrate that in the Barzza area PET was nearly constant with an average value of 55°C (Fig. 2a), whereas in Old Damascus the average value was 36°C (Fig. 2c), and in Al Mazza park, the average value was 53°C (Fig. 2e). Thus, in summer, residential areas are only slightly more thermally stressful than parks in modern Damascus, whereas both the residential areas and the parks are much more stressful than the outdoor spaces in Old Damascus. The findings thus reflect the strong influence of the urban geometry on the microclimate within built en-vironments. Old Damascus has deep street canyons with a high aspect ra-tio, which creates a more favorable microclimate. This microclimate in turn has a positive effect on thermal comfort, since direct solar radiation and the mean radiant temperature decrease with the increase of the aspect ratio. In contrast, the outdoor spaces in modern Damascus have a low aspect ratio and as a result, these spaces are more exposed to solar radiation, which has a negative impact on outdoor thermal comfort. This result agrees well with other studies in similar climates [1].
In winter it is difficult to compare the areas since the weather conditions varied significantly between the measurement days and sometimes even during the measurement period (Fig. 2f). The measurements in Old Da-mascus however show that there is virtually no difference between MRT, PET and the air temperature due to the high aspect ratio. Conversely, in modern Damascus MRT is considerably higher than the air temperature which helps increasing PET.

Paper 3
161
Fig 2. The results of measurements during summer and winter in the Barzza area, Old Damas-cus and Al Mazza park.
3.2 Thermal sensation The majority of the interviewees were between 20 and 65 years of age, of which 78% were male and 22% female. This percentage reflects the social life and the gender division during the fieldwork.
Fig. 3 shows the percentage distribution of thermal sensation for the in-terviewees in the summer and winter in the Barzza area, Old Damascus and Al Mazza park. In summer, the results in Barzza area show that the highest percentages of people (40%) feel hot, and in Old Damascus, the highest percentage (32%) feels comfortable, whereas in Al Mazza park, the highest percentage (25%) feels warm. Although both PET and MRT are simi-lar in Barzza area and Al Mazza park, the people perceive Al Mazza park less stressful, whereas Old damascus is clearly the least stressful.

Towards better Urban Spaces Moohammed Wasim Yahia
162
In winter, the results in Barzza area show that the highest percentage (45%) feels comfortable, and in Old Damascus, the highest percentage (32%) feels cold, whereas, in Al Mazza park, the highest percentage (48%) feels cold. It should be noted that it is difficult to compare the sites in winter since the weather conditions in the fieldwork days were so different. In the case of Old Damascus and in addition to the difference in weather in the fieldwork days, Old Damascus is colder than modern Damascus. This is partly explained by the fact that the deep canyons in Old Damascus prevent the solar radiation to reach the ground since the sun angle during the win-ter is lower than in the summer.
Fig 3. The percentage distribution people’s themal sensation during summer and winter in (a) Barzza area, (b) Old Damascus and (c) Al Mazza park.
In the three studied areas, the tendency – as regards the thermal sensa-tion – is similar between the areas. The results indicate that in summer, people in outdoor spaces in modern Damascus feel more stressed by the environment than people in the parks in modern Damascus. In addition,

Paper 3
163
people in the parks in modern Damascus feel more stressed than people in Old Damascus. This result agrees well with another study although in a dif-ferent climate [9].
4. Conclusion The study shows that microclimatic conditions vary considerably between the different sites. Especially during summer this is due to the impact of ur-ban design on the microclimate. It is illustrated that outdoor spaces in Old Damascus are more comfortable than outdoor spaces in modern Damas-cus during the summer which is the most problematic season. It is also shown that parks are perceived as more comfortable than residential areas in modern Damascus. In winter, however, the microclimatic differences between the locations were mainly due to the variation of the weather conditions between the measurement days. The solar access is however much lower in Old Damascus due to the high aspect ratio.
This study highlights the importance of a climate conscious urban design and design flexibility. Urban environments can be modified in summer and winter in order to provide a better outdoor thermal environment for people. In addition, the study also shows the importance of the harmony between microclimate and urban design. Such harmony can be achieved by includ-ing requirements for a climate-conscious urban design in the planning regu-lations for cities such as Damascus.
5. Acknowledgements This study was financially supported by Erasmus Mundus External Coopera-tion Window Lot 3 and Lund University, Sweden.
6. References 1. Ali-Toudert, F. and H. Mayer, (2006). Numerical study on the effects of aspect ratio
and solar orientation on outdoor thermal comfort in hot and dry climate. Buil-ding and Environment, 41: p. 94-108.
2. Yahia, M. W. and E. Johansson, (2012). Influence of urban planning regulations on the microclimate in a hot dry climate: The example of Damascus, Syria. J Hous and the Built Environ, DOI 10.1007/s10901-012-9280-y.
3. Johansson, E., (2006). Influence of urban geometry on outdoor thermal comfort in a hot dry climate: A study in Fez, Morocco. Building and Environment, 41: p. 1326-1338.
4. Mahmoud, A.H.A., (2011). Analysis of the microclimatic and human comfort con-ditions in an urban park in hot and arid regions. Building and Environment, 46: p. 2641-2656.
5. Höppe, P., (1999). The Physiological Equivalent Temperature- a universal index for the assessment of the thermal environment. Int J Biometeorol, 43: p. 71-75.
6. Matzarakis, A., F. Rutz. and H. Mayer, (2007). Modelling radiation fluxes in simple and complex environments – application of the RayMan model. Int J Biome-teorol, 51: p. 323-334.

Towards better Urban Spaces Moohammed Wasim Yahia
164
7. Yahia, M. W., (2012). Microclimate and thermal comfort of urban spaces in hot dry Damascus: Influence of urban design and planning regulations. Teknologie li-cenciat. Lund University.
8. Thorsson, S., F. Lindberg, I. Eliasson and B. Holmer, (2007). Different methods for estimating the mean radiant temperature in an outdoor urban setting. Int J Biometeorol, 27: p. 1983-93.
9. Thorsson, S., T. Honjo, F. Lindberg, I. Eliasson and E.M. Lim, (2007). Thermal com-fort and outdoor activity in Japanese urban public places. Environment and Behavior, 39: p. 66.0-684.

165
Originally presented at the 27th International conference on Passive and Low Energy Architecture (PLEA),13th -15th July, 2011, Louvain-la-Neuve, Belgium
Paper 4

Towards better Urban Spaces Moohammed Wasim Yahia
166

Paper 4
167
The Influence of Environment on People’s Thermal Comfort in Outdoor Urban Spaces in Hot Dry Climates – The example of Damascus, Syria Moohammed Wasim Yahia, Erik Johansson. Housing Development & Management, Lund University, Sweden.
Abstract It is well known that the quality of outdoor urban spaces becomes one of the important items in the urban design process not only for ecological and economical purposes, but also it is important from the social point of view. This study is part of a project in the city of Damascus, Syria which aims to point out the impact of current urban design on microclimate and outdoor thermal comfort in a hot dry climate during summer and winter. The aim of this study is to examine the influence of urban spaces on people’s thermal perception. The aim is also to examine how people experience the aes-thetical quality of the urban design in the studied areas (beautifulness, pleasantness). The study also examines the influence of the use of air con-ditioning devices on people’s thermal perception. This study is based on over 720 structured interviews during summer and winter. Results show clear differences between people’s thermal perception in both summer and winter seasons. Moreover, people's perception of pleasantness and beautifulness is influenced by the weather and climate. On the other hand, no significant impact could be found for the influence of air conditioning devices on people’s outdoor thermal perception. Keywords: Hot dry climate; Outdoor thermal comfort; Outdoor urban spaces; Thermal perception.
1. Introduction In urban settlements, the concentration of people and their activities create intensified demands on the environment. However, this concentration of-fers opportunities, through microclimatic adaptation, design and actions at an urban scale to minimize the impact on the ecosystem of the region without causing damage. It can then be said that a level of sustainable exis-

Towards better Urban Spaces Moohammed Wasim Yahia
168
tence has been reached at which the community can live in symbiotic harmony between design, microclimate, and its environment. On the other hand, it is well known that the quality of outdoor urban spaces becomes one of the important items in the urban design process not only for ecologi-cal and economical purposes, but also it is important from the social point of view.
Efforts by public agencies and private interest groups to revitalize the central business districts in urban environments have often included large expenditures for outdoor pedestrian spaces. Many such amenity spaces have failed to receive more than light use. This failure has been attributed partly to a general disregard for the physical-comfort needs of the users [1].
The need for thermal comfort is ubiquitous, but it seems often to be for-gotten in the designs of outdoor spaces. On the other hand human comfort and energy use of buildings are affected by the local climate conditions within the urban canopy [2] and the microclimate in the urban environ-ment may have a great influence on thermal comfort and the human body.
In warm climates, it is well known that mental and physical performance deteriorates at high temperatures and that heat stress may lead to heat- related illness [3]. Moreover, when the body´s adaptive mechanisms to heat stress fail to keep core body temperature close to 37°C, a number of physiological disorders can occur. Among the more common are: Heat ex-haustion, heat stroke, heart attack [4].
Thermal comfort is defined as the condition of mind which expresses satisfaction with the thermal environment [5]. Variables of thermal comfort are the air temperature, radiant temperature, relative humidity, air velocity, activity and clothing [6]. The microclimatic factors are affected by the ur-ban surface and at a given point; these factors affect the human activities from ground level up to 2 m height.
Recently, the importance of the concept of thermal comfort can be no-ticed in the latest related scientific researches. Some studies have focused on the influence of urban design and urban geometry on outdoor thermal comfort [7, 8]. Some others have focused on thermal comfort and outdoor activity in urban public places [9]. Others tried to study the thermal percep-tion, adaption and attendance in urban public spaces [10].
This study is part of a project in the city of Damascus, Syria (see Figure 1).which aims to point out the impact of current urban design on microcli-mate and outdoor thermal comfort in a hot dry climate during summer and winter. This is an area of research which has received little attention in the Middle East from the architectural perspective and it would be the first study of its kind in Damascus.
The main aim of this study is to examine the influence of outdoor urban spaces on people’s subjective perception of thermal comfort. The aim is also to examine how people experience the thermal environment in out-door urban spaces during summer and winter time in Damascus as an ex-ample of the hot dry climate.
This study is based on over 720 structured interviews to evaluate peo-ple’s actual thermal perception and to estimate the aesthetical qualities of places in six different types of outdoor spaces in Damascus city (streets, parks, spaces between buildings). This study also takes into account the influence of the use of air conditioning devices on people’s thermal percep-tion in outdoor urban spaces.

Paper 4
169
Figure 1: The location of Damascus city in Syria.
2. The city of Damascus The city of Damascus (Elevation: 620 meters, Latitude: 33.5°N, Longitude: 36.5°E) is located in south–west of Syrian Arab Republic in the Middle East.
Damascus (Latitude: 33.5°N) has a hot dry climate but it is actually lo-cated on the limit of hot dry zone which is normally found between lati-tudes 15° and 35°. Damascus has two main parts:
1. The old part. Old Damascus has a wealth of historical sites dating back to many different periods of the city's history. It has a regular planning in general; with streets oriented N–S and E–W. Typical style of architecture in Old Damascus is simple from outside and rich from inside with an inward orientation to the courtyards. Narrow streets and canyons are the main form of outdoor urban spaces in Old Damascus.
2. The modern part. The approach to urban design changed radically during the French colonial period 1920–1945. New areas were built with wide streets in a grid pattern and buildings were outwardly oriented [11]. The current features of architecture in modern Damascus were derived from the master plan made by French architect Michel Ecochar. Ecochar presented the new master plan for Damascus in 1968 and in addition he developed new planning regulations for Damascus which determined ur-ban form for a duration of 20 years 1965–1985. Michel Ecochar’s master plan and his planning regulations were the essential documents when up-dating the next urban regulations in Damascus in 1997.
3. Climate in Damascus Damascus has hot sunny summers from June to August and mild winters from December to February. Snowfall is common in winter on the moun-tains surrounding Damascus. Summer temperatures can reach in excess of 35°C during the day, but evenings are generally cool. Spring and autumn are the most comfortable periods, averaging 22°C during the day.
The average maximum air temperature according to the weather sta-tions for the period 1961–1990 in Damascus during summer time is 35.6°C and the average minimum temperature during summertime is about 17.6°C. On the other hand, the average maximum air temperature during

Towards better Urban Spaces Moohammed Wasim Yahia
170
winter time is about 13.9°C while the average minimum air temperature during winter time is about 2.5°C, see Figure 2.
Figure 2: The average values of temperature and relative humidity in Damascus city for the period 1961–90.
4. Materials and methods Field measurements and a questionnaire survey were conducted during summer and winter in Damascus City to describe different thermal envi-ronments as well as to determine outdoor thermal comfort. However, this paper discusses only the survey study.
Since the summer and winter seasons in Damascus have the most ex-treme weather, the study was only conducted during August and Septem-ber 2009 for the summer, as well as during January and February 2010 for the winter time. In both summer and winter seasons, a survey in outdoor physical environment was carried out through structured interviews, col-lecting data about thermal sensation, clothing and people’s activities both in old and in modern Damascus.
4.1 Sample The sample of this study contained 720 participants of which 360 in the win-ter season and 360 in the summer season. Six locations were selected for case studies and 60 interviews were conducted in each location. The inter-viewees were between 20 and 65 years of age of which 78% were males and 22% were females.
4.2 Environment of the studied areas Since outdoor thermal comfort is of importance for residential areas as well as for parks in Damascus, six locations were selected for case studies and were divided into three kinds of categories. The purpose of dividing those six locations into three categories was to study various physical environ-ments in Damascus in order to see the differences between them concern-ing outdoor thermal comfort and its relationship with urban design. The first category – outdoor spaces in modern Damascus – contained three studied areas: Al Gassany area which is located in the east of Damascus,

Paper 4
171
see number 2 in Fig. 3, New Dummar area which is located in the west of Damascus, see number 3 in Fig. 3, and Barzza area which is located in north east of Damascus, see number 4 in Fig. 3. The second category – out-door spaces in Old Damascus – contained only deep canyons and narrow streets and Al Qaymarieh Street was selected to represent Old Damascus, see number 6 in Fig. 3. The third category – parks in modern Damascus – contained two measurement areas: Al Tigara Park which is located in the east of Damascus, see number 1 in Fig. 3, and Al Mazza Park which is lo-cated in the west of Damascus, see number 5 in Fig. 3.
The field study took place between 12:00 and 15:00 on both weekdays and weekends. At this time of the day, both the air temperature (Ta) and solar radiation reach their daily maximum, and all places have the most visitors. The field study was only performed on days without precipitation. Answers when precipitation occurred were excluded from the analysis.
Figure 3: The six urban spaces in Damascus for the case studies. Read section 4.2.

Towards better Urban Spaces Moohammed Wasim Yahia
172
5. Results and discussion In each season, a total of 360 people were interviewed in order to examine people’s thermal perception, aesthetical qualities of places, and the influ-ence of the use of air conditioning devices on people thermal perception.
5.1 Thermal comfort perception Figure 4 illustrates the clear differences between people’s answers con-
cerning thermal comfort perception in both the summer and winter sea-sons (Chi-square = 294.6, P=.000, df = 8). Figure 4 shows that the people’s thermal perception in the summer time is between cool and very hot, whereas in winter time their thermal perception is between very cold and hot. The majority of people feel comfortable in the winter time whereas they feel hot in the summer time. The result shows that the distribution of the answers are widely spread in both summer and winter seasons and that this is because of differences of people’s thermal perceptions besides the complexity of the outdoor thermal environment concerning the weather conditions. A similar distribution between the summer and winter seasons has been found in the subtropical climate of Sydney, Australia [12].
Figure 4: Percentage frequencies for people's thermal perception in both summer and winter seasons.
5.2 Aesthetical quality of the place Figure 5 shows the percentage frequencies for the aesthetical quality of the places (beautifulness, ugliness). Result shows that the majority of the peo-ple, 72% and 82% in summer and winter respectively, experience the same places during the summer and winter seasons as beautiful whereas, only 18% and 13% in summer and winter respectively experience the places as neutral, and 10% and 5% in summer and winter respectively experience the places as ugly (Chi-square = 10.52, P=.005, df = 2). In addition, the results show that the people experience the same places in the winter season more beautiful than in the summer season. The results imply that, people's perception of beauty is influenced by the weather and climate. The result agrees with other studies in different climates [13].

Paper 4
173
Figure 5: Percentage frequencies for people's perception of beauty in both summer and winter seasons.
Figure 6 illustrates the percentage frequencies for the aesthetical quality of the places (pleasantness, unpleasantness). Result shows that the major-ity of the people, 68% and 78% in summer and winter respectively, experi-ence the same places during summer and winter seasons as pleasant whereas, only 19% and 16% in summer and winter respectively experience the place as neutral, and 13% and 6% in summer and winter respectively experience the place as unpleasant (Chi-square = 11.14, P=.004, df = 2). In addition, result shows that the people experience the same places in the winter season more pleasant than in the summer season. The results imply that people's perception of pleasantness is influenced by the weather and climate. The result agrees with other studies in different climates [14].
Figure 6: Percentage frequencies for people's perception of beauty (pleasantness) in both summer and winter seasons.

Towards better Urban Spaces Moohammed Wasim Yahia
174
5.3 The influence of air conditioning devices on thermal comfort Since Damascus has a hot dry climate, people usually have air conditioning devices either at home or at work. Figure 7 shows the percentage fre-quency in summer and winter seasons for people who use the air condi-tioning devices and for those who do not. The result shows that around 73% of the interviewees use air conditioning devices whereas, 27% of the inter-viewees do not use them. Thus, air conditioning devices in Damascus city are widely used during summer and winter time either for heating or for cooling purposes. This can be explained by the lack of the comfortable conditions and the need for better thermal adaption between indoor and outdoor environment.
Figure 7: Percentage frequencies for people who use the air conditioning devices.
Figure 8 shows the influence of the use of air conditioning devices on people's outdoor thermal perception in summer time. The result shows that there is no significant difference between the people who use air condition-ing and those who do not concerning outdoor thermal perception (Chi-square = 6.3, P=.390, df = 6).
Figure 8: The influence of the air conditioning devices on people's outdoor thermal percep-tion in summer season.

Paper 4
175
Figure 9 reveals the effect of the use of air conditioning devices on peo-ple’s thermal perception in winter time. Figure 9 illustrates that there is no significant difference between the people who use air conditioning and the people who do not concerning outdoor thermal perception (Chi-square = 10.5, P=.162, df = 7).
Figure 9: The influence of the air conditioning devices on people's outdoor thermal perception in winter season.
Consequently, there is no clear relationship between outdoor thermal perception and the use of air conditioning devices. The reason could be that people adapt quickly to their outdoor conditions in spite of the differ-ences between indoor and outdoor environments.
Other studies for indoor environments reported that there is significant difference between the people who use air conditioning at home or in the office and the people who do not concerning thermal comfort perception [15].
6. Conclusions As regards the thermal comfort in Damascus city, the influence of micro-climate on people's thermal perception in the summer season is com-pletely different from the influence in the winter season at the same places. In summer time, the study found that the majority of interviewees felt hot. This can be improved by enhancing the urban design [16] in Damascus city as well as by adding trees or shading devices [17] in order to provide shade for people who pass or linger on these places.
In spite of the differences in people's thermal perception at the same places between summer and winter seasons, people experience the places as beautiful and pleasant regardless of the differences in seasons. So the current urban design of the study areas has been recognized by interview-ees as beautiful and pleasant. On the other hand, the beautifulness and the pleasantness of the place is affected by the quality of the urban design, In addition, thermal comfort is very well needed for enhancing the quality of the urban spaces especially in a hot dry climate. Therefore, the considera-

Towards better Urban Spaces Moohammed Wasim Yahia
176
tions of outdoor thermal comfort should be taken into account in the urban design process.
Regarding the influence of the use of air conditioning devices on peo-ple's outdoor thermal perception, no significant result was reported in spite of the big number of the people who use air conditioning devices. How-ever, when people use air conditioning, the microclimate in the summer time will be negatively affected because the exhaust heat from the air con-ditioning devices will lead to increased air temperatures in outdoor urban spaces. Therefore, encouraging people's desire to spend much more time in outdoor urban spaces will help to reduce the use of air conditioning. On the other hand, the good quality of urban design is needed to attract people to spend time in outdoor environments.
7. Future studies More studies, including both summer and winter seasons will be performed within the framework of the project including statistical analysis of the emo-tional states, preferable weather conditions, and evaluating the outdoor ac-tivities for the people who live in Damascus. In addition, simulation studies will be conducted in order to give examples to enhance the thermal envi-ronment in outdoor urban spaces in Damascus city.

Paper 4
177
8. References [1] W. H. Whyte (1972), Please, just a nice place to sit. N.Y. Times Sunday
Mag. 3 Dec. 1972.
[2] B. Givoni (1998), Climate considerations in buildings and urban design. New York: Van Nostrand Reinhold.
[3] D.A. McIntyre (1980), Indoor climate, Applied Science Publishers Ltd, London.
[4] P.A. Bell (red) (2001), Environmental psychology, Fort Worth.Tex: Har-court College.
[5] H.J. Plumley (1977), Design of outdoor urban spaces for thermal com-fort. In: Heisler, Gordon M.; Herrington, Lee P (Red). Proceedings of the conference on metropolitan physical environment; Gen. Tech. Rep. NE–25., 152–162. PA: U.S. Upper Darby.
[6] ASHRAE (2004), Thermal environmental condition for human occu-pancy. Atlanta: American Society of Heating.
[7] E. Johansson (2006a), Influence of urban geometry on outdoor thermal comfort in a hot dry climate: A study in Fez, Morocco. Building and En-vironment 41: 1326–1338.
[8] E. Johansson (2006b), Uurban design and outdoor thermal comfort in warm climates – studies in Fez and Colombo. PhD Thesis, Housing De-velopment & Management, Lund University, Lund, Sweden.
[9] I. Knez and S. Thorsson (2007), Thermal, emotional and perceptual evaluation of a park: Cross-cultural and environmental attitude com-parison. Building and Environment, 43 (2008) 1483-1490.
[10] T. Ping Lin (2009), Thermal perception, adaption and attendance in a public square in hot and humid regions. Journal of Building and Envi-ronment, 44, 2017–2026.
[11] K. Al-Kodmany (1999), Residential Visual Privacy: Traditional and Mod-ern Architecture and Urban Design. Journal of Urban Design, 04, 283–312.
[12] J. Spagnolo and R. de Dear (2003), A field study of the thermal comfort in outdoor and semioutdoor environments in subtropical Sydney Aus-tralia. Building and Environment, 38,721–738.
[13] I. Knez (2003), Climate: A nested structure in places. The 5th Interna-tional Conference on Urban Climate (ICUC-5) (pp. 65–67). Poland: Uni-versity of Lodz.

Towards better Urban Spaces Moohammed Wasim Yahia
178
[14] I. Knez and S. Thorsson (2006). Influences of culture and environmental attitude on thermal, emotional and perceptual evaluations of a square. International Journal of Biometeorology, 50, 258–268.
[15] J.F. Busch (1992), A tale of two populations: thermal comfort in air- conditioned and naturally ventilated offices in Thailand. Energy and Buildings 18:235–249.
[16] F. Ali-Toudert and H. Mayer (2007), Effects of asymmetry, galleries, overhanging facades and vegetation on thermal comfort in urban street canyons. Solar Energy, 81, 742–754.
[17] J.M. Ochoa and R. Serra (2009), Vegetation influences on the human thermal comfort in outdoor spaces. Retrieved June 10, 2010, from School of Architecture of Barcelona, Dept. Constructions Arquitec-tòniques I & Dept. Física Aplicada, Web site: http://www.fa.upc.es/personals/jroset/lyonvege.html.

179
Originally published in Journal of Earth Science and Engineering
Paper 5

Towards better Urban Spaces Moohammed Wasim Yahia
180

Paper 5
181
Microclimate in hot dry Damascus: The influence of the urban environment on human perception Moohammed Wasim Yahia, Erik Johansson. Housing Development & Management, Lund University, Sweden.
Abstract There is a broad recognition that microclimatic conditions contribute to the quality of life in cities. A favorable microclimate has a positive influence on both commercial and social activities. The aim of this study is to investigate the relationship between the human being and the surrounding thermal environment in terms of thermal acceptability, physical quality of the place, emotional state and the usage of the urban space in hot dry Damascus, Syria. The study is based on questionnaire surveys during the summer and winter in six locations with different microclimates. It is shown that the ur-ban design plays a significant role in improving the microclimate, especially during the summer. The study also illustrates that when people’s thermal perception is within the thermally acceptable range (i.e. slightly cool, com-fortable and slightly warm) they experience the urban design as signifi-cantly more beautiful and more pleasant than during thermally unaccept-able conditions. The results indicate that there is an interactive relationship between the urban design and humans’ emotional state. Our findings sug-gest that a new perspective is needed for determining urban microclimate requirements and incorporating them into the urban design process to en-hance the thermal environment in outdoor urban spaces in Damascus. Keywords: Damascus; Hot dry climate; outdoor urban spaces; thermal per-ception; urban design
1. Introduction In the city development, the importance of creating successful urban spaces has become a fundamental demand for architects, designers and planners. The quality of the urban spaces has received a great attention not only from social and economical perspectives, but also from an environ-mental point of view. In connection to this, the role of microclimate and thermal comfort is an essential component for the quality of outdoor urban spaces. The combination of urban design, urban microclimate and thermal comfort is useful to enhance the attractiveness of the urban spaces and to

Towards better Urban Spaces Moohammed Wasim Yahia
182
develop the built environment in the city. Recently, the concept of outdoor thermal comfort has received increased attention in scientific research.
Some studies have focused on the influence of urban design and urban morphology on outdoor thermal comfort. Johansson [1] investigated the influence of urban geometry on outdoor thermal comfort by comparing shallow and deep street canyons in Fez, Morocco. By conducting mea-surements, the author found that the deep canyon was considerably cooler than the shallow one during the summer whereas in winter, the shallow canyon was more comfortable as solar access is possible. Yahia and Jo-hansson [2] investigated the influence of urban planning regulations and urban morphology on outdoor thermal comfort for attached and detached buildings. The authors indicated that for deep canyons, there is an interac-tive relationship between aspect ratio, orientation and vegetation.
However, for detached buildings, there is only a weak influence of street orientation and aspect ratio but a strong influence of vegetation on outdoor thermal comfort. Some other studies have focused on the influences of cul-ture and environmental attitude on thermal, emotional and perceptual evaluations of urban public places. Knez and Thorsson [3] examined the influence of culture for Swedes and Japanese by investigating the influence of environmental attitude on peoples' thermal, emotional and perceptual assessments of a square. The authors argued that the persons living in dif-ferent cultures with different environmental attitudes would psychologically evaluate the space differently despite similar thermal conditions. Other stu-dies have focused on the influence of environment on outdoor thermal comfort. Yahia and Johansson [4] examined the influence of urban spaces on people’s thermal perception in the city of Damascus. The authors found clear differences between people’s thermal perception in both summer and winter seasons. They also argued that the people's perception of plea-santness and beautifulness is influenced by the weather and climate. Other studies have investigated the thermal perception, adaption and attendance in urban public spaces. Lin [5] examined people’s thermal comfort in a public square in Taiwan. By conducting physical measurements and ques-tionnaires, the author indicated that the thermal comfort range and neutral temperatures of the people were higher than those of people in a tempe-rate region. In addition, local people in Taiwan preferred cool temperatures and weak sunlight, and adapted themselves to the thermal environment by seeking shelter outdoors. The study concluded that the psychological and behavioral factors play important roles in outdoor thermal comfort.
Although these and other studies provided useful insights in the field of microclimate and thermal comfort, there is still a need to examine the rela-tionship between people’s thermal comfort, perception, emotional states and physical characteristics of urban spaces in all types of thermal envi-ronments especially in regions with warm climates where both global and urban warming have a negative impact on the physical environment, people’s thermal perception, physical and mental performance as well as health problems [6]. Therefore, the aim of this study is to investigate the re-lationship between the human and the surrounding thermal environment in terms of thermal acceptability, physical quality of the urban design, hu-mans’ emotional state and the usage of urban space during summer and winter in the hot dry city of Damascus, Syria. The aim of this study is to highlight the role of thermal perception, aesthetics, psychological aspects and the use of space in hot dry Damascus where the microclimate is one of the main factors that can provide better urban design.

Paper 5
183
2. Methodology
2.1 The location and climate of Damascus Damascus city (Elevation: 620 meters, Latitude: 33.5° N, Longitude: 36.5° E) is located in the south-west of the Syrian Arab Republic in the Middle East (see Fig.1) and It has two main parts:
1. The old part: It has a regular planning in general, with N-S and E-W street orientation. Most streets are narrow in the form of deep canyons and the buildings have inward orientation to the courtyards.
2. The modern part: The approach to urban design changed radically during the French colonial period (1920–45). New areas were built with wide streets in a grid pattern and buildings were outwardly oriented [7]. Damascus is surrounded by an oasis – the Ghouta region – watered by the Barada River that used to provide the city with drinking water.
Damascus has sunny summers (June to August) and fairly cold winters (December to February). Summer temperatures can reach in excess of 35°C during the day, but evenings are generally cool. In winter, minimum temperatures can reach 0°C. Snowfall is common in winter on the moun-tains surrounding the city. Spring and autumn have the most comfortable climate with average temperatures in the range of 16 to 20°C (see Fig. 2).
Fig. 1 The location of the city of Damascus in Syria
Towards better Urban Spaces Moohammed Wasim Yahia
184
Fig. 2 The average values of temperature and relative humidity in Damascus city for the period 1961-90. Source: Damascus airport meteorological station
2.2 Structured interviews Micrometeorological measurements and structured interviews were con-ducted during the summer and winter in Damascus to describe different thermal environments as well as to determine the outdoor thermal comfort. However, this paper discusses only the questionnaire survey study. The study was conducted during August and September 2009 for the summer, and during January and February 2010 for the winter. The sample of this study contained 720 participants of which 360 in the winter season and 360 in the summer season. Six locations were selected and 60 interviews were conducted in each location. The interviewees were between 20 and 65 years of age of which 78% were males and 22% were females. These six locations were divided into three categories that represent the most com-mon urban environments in
Damascus. The first category – outdoor spaces in modern Damascus – contained three studied areas: Al Gassany area which is located in the east of Damascus (see Picture b in Fig. 3), New Dummar area which is located in the west of Damascus, see picture c in Fig. 3, and Barzza area which is located in north east of Damascus (see picture d in Fig. 3). The second cat-egory – outdoor spaces in Old Damascus – contained deep canyons and narrow streets and Al Qaymarieh Street was selected to represent Old Da-mascus (see picture f in Fig. 3). The third category – parks in modern Da-mascus – contained two areas: Al Tigara Park which is located in the east of Damascus (see picture a in Fig. 3), and Al Mazza Park which is located in the west of Damascus (see picture e in Fig. 3).

Paper 5
185
Fig. 3 Studied locations in the city of Damascus, where (a) is Al Tigara park, (b) is Al Gassany area, (c) is New Dummar area, (d) is Barzza area, (e) is Al Mazza park, and (f) is Old Damascus [9]
The field study took place between 12:00 and 15:00 in both weekdays and weekends. At this time of the day, both the air temperature (Ta) and solar radiation reach their daily maximum, and all places have the most vis-itors. The questionnaires were designed to assess people’s thermal percep-tion and the people were asked to report their perceptions by responding to a 9-point scale ranging as the following: very cold, cold, cool, slightly cool, comfortable, slightly warm, warm, hot and very hot [8]. The questionnaires were also designed to assess the climatic and aesthetical preferences in Damascus, and it covered questions about gender and age, clothing, living or working in the city, the reason for being in the places, time spent out-doors and in the places, the assessment of the microclimate, the aesthetic qualities of the place, emotional state, preferred weather conditions and the attitude to urban outdoor exposure. This paper however, only discusses the results of thermal comfort and urban design, aesthetical quality of the place, thermal acceptability, emotional states and the results of the use of urban spaces. SPSS 18 (Statistical Package for the Social Sciences Software for Windows) was used to analyze the answers by calculating frequencies and Pearson Chi-Square test.
3. Results
3.1 Microclimate and urban design Fig. 4 shows the frequency distribution of how people experience the place when their thermal perception is within the thermal acceptable range (i.e. slightly cool, comfortable and slightly warm) [5] during the summer and winter. In summer – although the weather conditions were similar in all

Towards better Urban Spaces Moohammed Wasim Yahia
186
studied locations – Fig. 4a illustrates that people thermally accept the mi-croclimate in Old Damascus more than the microclimate in parks, whereas they thermally accept the microclimate in parks slightly more than the mi-croclimate in modern Damascus (Chi-square = 11.27, P = 0.004, df = 2). In contrast to the summer results, Fig. 4b reveals that people in winter ther-mally accept the microclimate in the residential areas of modern Damascus more than the microclimate in the parks, whereas they thermally accept the microclimate in the parks more than the microclimate in Old Damascus (Chi-square = 24.09, P = 0.000, df = 2). It should be noted that the studied day in Old Damascus was very cold, which at least partly may explain the results. (a) (b)
Fig. 4 The frequency distribution of how people thermally experience the place in modern Damascus, parks and Old Damascus during (a) summer and (b) winter
The results reflect the strong influence of the urban morphology and ur-ban design on microclimate and thermal comfort. Old Damascus has deep canyons with high aspect ratios. This has a positive effect on the microcli-mate and the outdoor thermal comfort in summer because the direct short wave radiation from the sun, and consequently the mean radiant tempera-ture – which considers both short-wave and long-wave radiation and represents the weighted average temperature of an imaginary enclosure that gives the same radiation as the complex urban environment – de-crease with the increase of the aspect ratio. In contrast, the outdoor spaces in modern Damascus have low aspect ratios and therefore these spaces are more exposed to solar radiation, and thus the mean radiant temperature increases, which is positive in the winter. In the parks, the open space can be similar to modern Damascus but the trees and vegetation help to create some shade that mitigate the thermal stress. The results illustrate that the urban design plays a significant role in creating different microclimates. This agrees well with other studies, e.g. [1].
3.2 Preferable microclimate in the urban spaces of Damascus Fig. 5 illustrates the percentage distribution of how people prefer the mi-croclimate in the urban spaces of Damascus – during summer and winter –

Paper 5
187
in terms of the exposure towards the solar radiation and air temperatures. In summer, Fig. 5a reveals that the majority of people in Damascus prefer more shaded spaces whereas in winter, the highest percentage shows that the people prefer no change. Conversely, people in the winter season pre-fer to be exposed to the solar radiation more than to be in shade (Chi-square = 243, P = 0.000, df = 2).
Fig. 5b shows that the majority of people in Damascus during the sum-mer time prefer the microclimate to be colder than it was during the survey whereas in winter, the highest percentage reveals that the people prefer no change. Conversely, people in the winter season prefer the microclimate to be warmer than, or equal to, what it was (Chi-square = 280, P = 0.000, df = 2).
(a) (b)
Fig. 5 The frequency distribution of how people prefer the microclimate in the urban spaces of Damascus during the summer and winter in terms of (a) the exposure to the solar radiation and (b) air temperatures
The results indicate that seeking shade in urban spaces of Damascus during the summer season is a key issue to create better urban design. This is also confirmed by the fact that people in Damascus seek colder micro-climates during the summer. This can be explained by the phenomenon that applies the concept of alliesthesia [10] which is a sort of psychological mechanism that explains the differences in perception between seasons, i.e. if the people – for example – feel warm, anything that make them feel colder would be pleasant and vice versa. This also agrees with other stu-dies in other climates [11].
3.3 Aesthetical quality and thermal perception Fig. 6 shows the frequency distribution of how people experience the place in terms of beautifulness and ugliness. Fig. 6a illustrates that when people’s thermal perception is within the thermal acceptable range; people perceive the urban design as more pleasant than when their thermal perception is out of the thermally acceptable range. (Chi-square = 13.68, P = 0.001, df = 2). In addition, Fig. 6b shows that when people’s thermal perception is within the thermally acceptable range, they perceive the urban design as more beautiful than when their thermal perception is out of the thermally

Towards better Urban Spaces Moohammed Wasim Yahia
188
acceptable range. (Chi-square = 17.26, P = 0.000, df = 2). Fig. 6 reveals that people’s perception of aesthetical quality of the urban design is affected by the weather and climate. The results agree well with other studies in the same climate [4].
(a) (b)
Fig. 6 The frequency distribution of how people who feel either thermally acceptable or unac-ceptable experience the aesthetical quality of the place in terms of (a) pleasantness and (b) beautifulness
3.4 Urban design and psychological effects Fig. 7 illustrates the frequency distribution of how people feel and how the urban design affects their psychological situation in terms of boredom and elatedness. Generally, the result shows that the people in Damascus are elated when they are outdoors. The result indicates that about 55% of the people in modern Damascus were elated whereas about 27% were neutral and about 18% were bored. In public parks, about 61% of the users were elated whereas about 26% were neutral and about 13% were bored. In Old Damascus, about 67% of the users were elated whereas about 29% were neutral and about 4% were bored. Fig. 7 reveals that the people in Old Da-mascus were more elated than those in the parks. In parks, the people in turn were more elated than those in modern Damascus (Chi-square = 16.26, P = 0.003, df = 4). The result shows that the type of urban design and the physical properties of the place affect the human’s psychological per-ception. It also can be said that the combination of microclimate parame-ters, thermal perception, cultural background and aesthetical qualities of the space have an impact on a person’s psychological perception. This agrees with other studies that investigated the influence of culture and envi-ronmental attitude on thermal, emotional and perceptual evaluation of the urban space [3].

Paper 5
189
Fig. 7 The frequency distribution of how people feel and how the urban design affects peo-ple’s psychological perception in terms of boredom and elatedness.
3.5 Enhancing the use of urban spaces Fig. 8 shows the frequency distribution of the most important reason for people to be outdoors in modern Damascus (residential areas), parks and Old Damascus. The result illustrates that the main reason for being in mod-ern Damascus – for about 75% of the users – is to go to work, home, or school, whereas about 20% of users were there to meet other people, relax and get some fresh air. Regarding the public parks, about 64% of the users go to the parks to meet other people, relax and get some fresh air, whereas about 30% were there for going to work, home, or school. In Old Damascus, about 48% of the users passed by in order to meet other people, relax and get some fresh air, whereas about 48% were there for going to work, home, or school.
Fig. 8 The frequency distribution of how people use the outdoor urban spaces in Modern Da-mascus, parks and Old Damascus
Fig. 8 reveals that people tend to go to the park mainly to have some fresh air, meet other people and relax, whereas only 20% of the users in modern Damascus use the urban spaces for recreational reasons (Chi-square = 127.07, P = 0.000, df = 4). Another study in a different climate found that the most important reason for being in the square is going to work, home, or to school, whereas the reason for being in the park was to

Towards better Urban Spaces Moohammed Wasim Yahia
190
get fresh air, to exercise, etc [12]. These results show that the difference between the studied areas in terms of urban design has an impact on the chosen activity by people. Thus, the results highlight the importance of im-proving the urban spaces in residential areas in modern Damascus so as to encourage people to spend time outdoors for recreational reasons and not only for passing by on the way to work, school or home.
4. Discussion This study highlights the relationship between urban design, microclimate and thermal comfort in outdoor urban spaces. The study illustrates that the urban design plays a significant role in improving the microclimate, espe-cially during the summer. Moreover, the study reveals that people’s percep-tion of the aesthetical quality of the urban design is affected by the weather and climate. Furthermore, the study shows that the majority of the people in Damascus tend to go to parks mainly to have some fresh air, meet other people and relax, whereas only 20% of the users in modern Damascus use the urban spaces for recreational reasons.
The study indicates that in summer the people in Damascus seek shade and prefer the climate to be colder. These two results have the same ten-dency (see Figs. 5a and 5b). This can be important information for archi-tects and urban designers to be considered in their proposals for hot dry climates.
The study also investigated people’s emotional state in Damascus and showed that there is a link between the surrounding environment and the psychological perception. Gifford [13] argued that the people that have a positive mood compared to those in a less positive mood rated the interior environment as more pleasant. For the outdoor environment, the situation is more complicated due to other climatic parameters which strongly affect the users such as wind speed, solar radiation, reflected radiation, humidity, etc. On the other hand, the physical qualities of the outdoor space also af-fect the human emotional states. For example, if the person is elated, he/she might perceive the outdoor space as more pleasant and more beau-tiful than the one who is bored. It might be also the opposite, i.e. if the place is beautiful and pleasant, this might affect a person’s emotional state and this person will become more elated. Therefore, the study suggests that there is an interactive relationship between the human being and the sur-rounding environment, and this relationship will affect and be affected by the human perception at all levels e.g. thermal, emotional, aesthetical, cul-tural, etc.
5. Conclusion The study concludes that the outdoor environment has a considerable ef-fect on human perception and behavior. In order to design better urban spaces in the city, these parameters must be highlighted. One way to un-derstand and control the relationship – between humans and the surround-ing environment – is to enhance the urban design quality in the outdoor spaces considering all these parameters. One of the aspects that can help to enhance the urban design is to improve the microclimate in residential areas in modern Damascus and to increase the thermal comfort in outdoor urban spaces, especially during summer which is the most problematic

Paper 5
191
season in hot dry Damascus. These improvements can help to encourage people to spend more time outdoors than indoors.
Regarding microclimate and thermal comfort, the findings suggest that a new perspective is needed for determining urban microclimate require-ments and incorporating them into the urban design process. This can be done by considering microclimate and thermal comfort in urban planning regulations, to develop outdoor urban spaces and to enhance the quality of life.
More studies can be performed including further statistical analysis of the emotional states, preferable weather conditions, and evaluating the out-door activities for the people who live in Damascus. In addition, simulation studies can also be conducted in order to enhance the thermal environ-ment in Damascus’ urban spaces by using different types of vegetation and landscape elements which affect the urban design and outdoor thermal comfort.
Acknowledgements This study was financially supported by Erasmus Mundus External Coopera-tion Window Lot 3 and Lund University, Sweden.
Towards better Urban Spaces Moohammed Wasim Yahia
192
References [1] E. Johansson, Influence of urban geometry on outdoor thermal comfort in a hot dry climate: A study in Fez, Morocco, Journal of Building and Environment 41(2006) 1326-1338
[2] M.W. Yahia, E. Johansson, Influence of urban planning regulations on the mi-croclimate in a hot dry climate: The example of Damascus, Syria. Journal of Housing and Built Environment 28 (2013) 51-65
[3] I. Knez, S. Thorsson, Influences of culture and environmental attitude on thermal, emotional and perceptual evaluations of a square. International Journal of Biometeorology 50 (2006) 258-268
[4] M.W. Yahia, E. Johansson, The influence of environment on people’s thermal comfort in outdoor urban spaces in hot dry climates - The example of Damascus, Syria, in: 27th International conference on Passive and Low Energy Architec-ture, Louvain-la-Neuve, Belgium, 2011
[5] T.P. Lin, Thermal perception, adaptation and attendance in a public square in hot and humid regions, Journal of Building and Environment 44 (2009) 2017-2026
[6] P.A. Bell, Environmental psychology, Fort Worth. Texas: Harcourt College, 2001
[7] K. Al-Kodmany, Privacy: traditional and modern architecture and urban de-sign, Journal of Urban Design 4 (1999) 283-312
[8] A. Matzarakis, H. Mayer, Another kind of environmental stress: thermal stress, WHO Collaborating Centre for Air Quality Management and Air Pollution Control, Newsletters 18 (1996) 7-10
[9] M.W. Yahia, E. Johansson, Evaluating the behaviour of different thermal in dices by investigating various outdoor urban environments in the hot dry city of Damascus, Syria, International Journal of Biometeorology 57 (2013) 615-630
[10] I.U.P.S., Thermal-Commission, Glossary of terms for thermal physiology, The Japanese Journal of Physiology 51 (2001) 245-280
[11] J. Spagnolo, R. de Dear, A field study of the thermal comfort in outdoor and semi outdoor environments in subtropical Sydney Australia, Journal of Building and Environment 38 (2003) 721-738
[12] S. Thorsson, T. Honjo, F. Linberg, I. Eliasson, E.M. Lim, Thermal comfort and out- door activity in Japanese urban public places, Journal of Environment and Behavior 39 (2007) 660-684

Paper 5
193
[13] R. Gifford, Environmental dispositions and the evaluation of architectural in-teriors, Journal of Research in Personality 14 (1980) 386-399

Towards better Urban Spaces Moohammed Wasim Yahia
194

195
Originally published in Landscape and Urban Planning
Paper 6

Towards better Urban Spaces Moohammed Wasim Yahia
196

Paper 6
197
Landscape interventions in improving thermal comfort in the hot dry city of Damascus, Syria –The example of residential spaces with detached buildings Moohammed Wasim Yahia, Erik Johansson. Housing Development & Management, Lund University, Sweden.
Abstract The aim of this paper is to explore how vegetation and landscape elements affect the outdoor thermal comfort for detached buildings in hot dry Da-mascus, Syria by investigating different urban design scenarios. The study uses two different thermal indices and examines two different street orien-tations in summer and winter using microclimatic simulations with ENVI-met and analyzing the thermal comfort maps for the studied cases. In order to improve the thermal environment of detached urban morphologies in Damascus, the streets and the spaces between buildings must be taken into account in the urban and landscape design processes. Shading is an essential strategy to reduce thermal stress and by using vegetation and shading devices, it is even possible to achieve thermal comfort during the warmest hours in the summer, which is the most problematic season in Damascus. The improvement of the Physiologically Equivalent Tempera-ture (PET) between the existing and suggested urban design for the east-west street orientation at 14:00 is about 19°C. The study discusses advan-tages and disadvantages of different urban design patterns in Damascus and argues that an efficient use of vegetation and landscape elements posi-tively affects the thermal environment and thus develops the quality of ur-ban design. There is therefore a need for further investigation about the role of vegetation and landscape from a shading perspective taking the 3D form of trees and other landscape elements into account. This is recommended to be linked with urban planning regulations in the city. Keywords: Damascus; Hot dry; Landscape elements; thermal comfort; Vegetation; Urban design.

Towards better Urban Spaces Moohammed Wasim Yahia
198
1. Introduction In the built environment, urban spaces are often characterized by unac-ceptable microclimate and lack of thermal comfort. Generally, urban mi-croclimate and outdoor thermal comfort are given little importance in the urban design and planning processes (Eliasson, 2000; Johansson, 2006a, 2006b). However, many studies – such as Chow & Brazel (2012) and Ali-Toudert & Mayer (2007) – have highlighted how vegetation and landscape in urban design and planning can improve microclimate and thermal com-fort. Akbari et al. (2001) argued that the shade caused by trees intercept so-lar radiation before it warms the buildings. The authors also found that ur-ban shade trees provide significant benefits by both reducing artificial air-conditioning and lowering air temperatures. Designing environmental ur-ban spaces in harmony with the local climate – using vegetation and land-scape elements – is a key issue in hot dry climates, where the temperatures are normally high during the summer. Such high temperatures cause dis-comfort to the users, in addition to the negative impact on public health (Brown, 2010; Yahia, 2012).
Several studies in hot dry climates have investigated the use of vegeta-tion and landscape as a strategy to improve the microclimate and thermal comfort in outdoor urban spaces. Some studies have dealt with courtyards (Berkovic et al., 2012; Fahmy & Sharples, 2009). Berkovic et al. (2012) stu-died three different courtyards surrounded by a 9 m high and 12 m wide building and argued that the amount of shade is mainly affected by the courtyard orientation. In addition, shading in hot dry climates has the major role in improving the thermal comfort, while the contribution of wind under all configurations studied is limited and much smaller than the shade con-tribution. The authors found that the thermal comfort is significantly im-proved by adding trees and/or galleries to the closed courtyard. Fahmy & Sharples (2009) – who studied courtyards and urban canyons derived from urban planning laws in Cairo – showed examples of more acceptable thermal comfort conditions for some orientations and degrees of urban compactness due to the clustered form with green cool islands and wind flow. Other studies have mainly focused on urban canyons such as Ali-Toudert & Mayer (2007), Bourbia & Awbi (2004a, 2004b) and Johansson (2006a, 2006b). These studies found that using trees in urban canyons is very efficient in improving the thermal comfort. Ali-Toudert and Mayer (2007) investigated the effects of asymmetry, galleries, overhanging façades and vegetation on thermal comfort in urban street canyons for different height to width (H/W) ratio in the hot dry climate. The authors argued – in the case of urban canyons – that the larger opening towards the sky, the higher the heat stress. For the canyons with a smaller sky view, the orienta-tion is decisive and E–W orientations are the most stressful. The authors al-so found that galleries, overhanging façades and vegetation provide a con-siderable decrease of the period of sun exposure and therefore improve the thermal comfort. Bourbia & Awbi (2004b) examined and evaluated the ef-fect of different H/W ratios on the shading of street surfaces and ground for different orientations in the hot dry city of EL-Oued, Algeria. By doing simu-lations, the authors found for the wide urban canyons (H/W < 0.5), tall trees should be considered to improve the thermal environment in urban canyons whereas for the narrower canyons (H /W > 0.5), taller trees are not expected to have an improvement on thermal environment of the ur-ban canyons. Johansson (2006b) – who investigated the outdoor thermal

Paper 6
199
comfort in the hot dry city of Fez by making microclimatic simulations – found that the streets with low H/W ratio are preferable during winter whe-reas in summer, H/W ratio needs to be at least 4 to provide shade and east-west (E–W) street orientation is the most problematic regarding thermal comfort. The author concluded that overhead shading, colonnades, shading devices and trees should be provided to improve the thermal comfort for pedestrians.Yahia and Johansson (2013a) studied streets with detached buildings in Damascus city. They showed that there is only a weak influ-ence of street orientation and aspect ratio but a strong influence of vegeta-tion on surface temperatures and outdoor thermal comfort. The authors concluded that the thermal comfort in existing urban environments in Da-mascus could be improved by introducing vegetation and landscaping in the urban design process by creating a link between urban landscaping and urban planning regulations. Shashua-Bar et al. (2011) investigated the effect of trees and grass on thermal comfort by measuring the radiant flux in a courtyard in the hot dry climate of the Negev desert. The study showed that adding trees is the most efficient solution economically and this is because grass needs much irrigation. Moreover, grass brings little improvement to the thermal comfort, because it does not provide shade. The study argued that vegetation contributes to the thermal comfort not only by direct shad-ing but also by reducing the long wave emission from courtyard surfaces and by limiting the amount of reflected solar radiation.
Although the previous studies have added new knowledge and provided new insights, they have mainly concentrated on the summer period. There is therefore a need to investigate the winter conditions in the hot dry cli-mate. Thus, the aim of this paper is to explore how vegetation and land-scape elements affect the outdoor thermal comfort for detached buildings in hot dry Damascus, Syria by investigating different urban design scenarios. The study uses two different thermal indices. Two different street orienta-tions in summer and winter are examined using microclimatic simulations with ENVI-met and followed by analysis of thermal comfort maps for the studied cases.
2. Methods
2.1. The city of Damascus Damascus is the capital and the largest city in Syria. Old Damascus mainly has attached buildings and a compact urban fabric with deep canyons due to the large building footprints. The buildings have an inward orientation towards the courtyards and ecologically friendly construction materials are used. The modern part, on the other hand, has wide streets in a grid pattern and buildings are outwardly oriented (Al-Kodmany, 1999). It includes both attached and detached buildings as a consequence of different master plans (Yahia & Johansson, 2013a). Damascus has a hot dry climate with hot summers and cold winters. The summer period, when temperatures often exceed 35 °C in the afternoon, typically lasts from June to August and some-times from May to September. During the winter period, normally from De-cember to February, temperatures may fall to below 0 °C at night.

Towards better Urban Spaces Moohammed Wasim Yahia
200
2.2. The selection of the studied urban zone The zone Inhabited Rural Area (IRA) from the current urban planning regu-lations was selected to be simulated in this study. This zone consists of neighborhoods in the suburbs of Damascus that are surrounded by green areas (see Fig. 1). The IRA urban zone is exemplified by the sub zone of New Planning Area. This sub zone is the most common urban residential zone for new development in Damascus. In addition, it is among the worst examples from a thermal comfort point of view. It contains only detached buildings and has the biggest plot size (>600 m2) and the highest maxi-mum building height (15 m). It also contains prescribed setbacks for all sides of the building (Yahia & Johansson, 2013a).
Fig. 1. Simplified map of Damascus city, which is located between the Kassioun mountain chain in the northwest and an oasis in the south. The IRA urban zone is a part of the Damas-cus suburbs (Yahia & Johansson, 2013b)
2.3. Simulation model – structure and limitations The urban microclimate modeling approach has many advantages. It can be used to investigate the thermal characteristics and energy fluxes in the built environment for different urban design proposals. It gives the possibil-ity of predicting the thermal conditions in high spatial and temporal resolu-tion. Another advantage with the modeling approach is that it makes it pos-sible to investigate an infinite number of spots of the studied area whereas micrometeorological measurements only provide data for a limited number of spots.
For this study, the thermal characteristics of different urban design sce-narios at the street level were investigated by ENVI-met 3.1 (Bruse, 2009; Bruse & Fleer, 1998). The program uses a three-dimensional computational fluid dynamics and energy balance model. The model has a high spatial and temporal resolution enabling a detailed study of how the microclimate varies within the studied space over time. The model gives a large amount of output data including the necessary variables to be able to calculate thermal comfort indices. In order to conduct the simulations, the basic data about the geographical position (latitude and longitude) and cloud cover – to determine the components of direct and diffuse solar radiation – have to be defined. The calculations require the initial temperature (which is the

Paper 6
201
constant temperature at the upper model border at 2500 m), wind speed and its direction at 10 m height and specific humidity at 2500 m and initial relative humidity at 2 m. In addition, the initial temperatures and the soil moisture in the soil layers – at 0–0.2 m, 0.2–0.5 m and 0.5–2 m – have to be defined.
Although ENVI-met is a useful tool to investigate the thermal environ-ment, it has several limitations including:
- The model does not take the thermal mass of the buildings into ac-count and this may affect the surface temperature of the walls and conse-quently the MRT, especially near the buildings.
- The model sets the same indoor temperature for all buildings (constant value throughout the simulations). In addition, all buildings have the same values of reflectivity for the walls and roofs respectively.
- It is not possible to create complicated building geometries such as curved shapes, sloped elevations and shading devices.
2.4. Simulation procedure In this study, both the summer and winter seasons were simulated. In summer, the study was carried out on the 21st of July since this day is more or less in the middle of the three hottest months in Damascus (June, July and August). In winter, the day 15th of January was studied to represent the winter season because it is in the middle of the three coldest moths in Da-mascus (December, January and February).The simulated period lasted from 5:00 local time (LT) in the morning until 16:00 LT in the afternoon in order to include the maximum air temperature, which normally occurs at 14:00. In addition, the study focused on 12:00, and 16:00 because at 12:00 residential streets are full of students who return back home from school and at 16:00, the streets and urban spaces are full of employees who return back home from work. Both east-west (E–W) and north-south (N–S) street orientations were investigated. The street width was fixed to 12 m since this width is the most common in residential areas in modern Damascus and this was divided into 9 m as a vehicle route and 1.5 m for each pavement. 2.4.1 Parametric study This parametric study consisted of a base case and three additional cases. The base case was modeled according to the urban zone IRA (New Plan-ning Area) and had the following characteristics: plot size 600 m2 (20 m x 30 m), plot frontage 20 m, plot coverage 40%, maximum building height 15 m, and frontal, rear and side setbacks of 3 m, 4 m, and 5 m respectively (see Fig. 2). For the three cases, only one parameter was changed at a time in order to determine the relative influence of each. The effect of the design parameters – such as H/W ratio, street orientation, spacing between build-ings, vegetation and shading devices – on thermal comfort were studied. The characteristics of the three cases in addition to the base case are shown in Fig. 3. The studied parameters have been divided into three main categories: - Urban morphology: a new extension – with a height of 7 m – was added to the original building (base case) in the front block side. This affects the frontal and the side setbacks as well as the H/W ratio (see Fig. 3b). - Vegetation: a continuous row of street trees were added along the pave-ments (see Fig. 3c).

Towards better Urban Spaces Moohammed Wasim Yahia
202
- Vegetation and shading devices: a mixture of horizontal shading devices – over the plot walls as well as the pavement – and street trees were added (see Fig. 3d).
Fig. 2. Perspective and plans of the studied zone IRA (New Planning Area) including the 2 m high wall which surrounds the plots (Yahia & Johansson, 2013a)

Paper 6
203
Fig. 3. Sections and plans for the four studied cases where (a) the base case, (b) the case of urban morphology, (c) the case of vegetation and (d) the case of vegetation and shading de-vices
In order to analyse the studied cases in detail, the public space between the buildings was divided into three zones. For the E-W street orientation, zone A consists of the northern pavement of the street and zone B consists of the southern pavement. For the N-S orientation, zone A is the eastern pavement of the street and zone B is the western pavement. For both orien-tations zone C consists of the street between zones A an B (see Fig. 4).

Towards better Urban Spaces Moohammed Wasim Yahia
204
Fig. 4.The division of the public space into zones for (a) E-W and (b) N-S orientations
2.5. Model calibration In order to achieve realistic results, a simulation of an existing urban area in Damascus (150 m x 150 m) was carried out and the results were compared with on site measurements during both summer and winter according to Yahia & Johansson (2013b). The site was modeled as accurately as possible as regards geometry, street orientation and thermal properties of the ground surface materials. Some adjustments were made to some values of the input data – such as initial temperatures of the atmosphere and the soil, wind speed at 10 m above ground level, Specific humidity and relative hu-midity – as a result of the deviation between simulated and measured re-sults. The general input data which were used in the summer and winter simulations – as a result of the calibration – are shown in Table 1. The model grid resolution was 1 m in all directions (dx, dy and dz).
Several studies have pointed out that ENVI-met underestimates the diur-nal temperature fluctuations (Ali-Toudert & Mayer, 2006; Johansson, 2006b). This is because ENVI-met calculates the urban climate at a micro or local scale and that larger regional (meso scale) effects are not taken into account (Bruse, 2009). Since we are mainly interested to study the warmest hours that are normally between 12:00 and 16:00, the input values for the calibration process were set in order to reach the measured values at 14:00 and thus the initial temperature was overestimated at the start of the simu-lations (hour 5:00).

Paper 6
205
Table 1 The basic input configuration data used in the ENVI-met simulations for summer and winter. The values used are a result of the calibration process
Category Configuration data Summer Winter Time Start of simulation (h) 5:00 5:00 Meteorology Wind speed at 10 m above ground level [m/s] 2.5 2
Wind direction [°] 225 225 Initial temperature of the atmosphere [K] 302 283 Solar adjustment factora 0.85 0.85 Specific humidity [g/m3] 7 3 Relative humidity at 2m [%] 30 65 Fraction of LOW clouds (x/8) 0 2 Fraction of MEDIUM clouds (x/8) 0 2 Fraction of HIGH clouds (x/8) 0 1
Soil Initial Temperature Upper Layer (0–20 cm) [K] 291 280 Initial Temperature Middle Layer (20–50 cm) [K] 293 281 Initial Temperature Deep Layer (below 50 cm) [K] 298 282 Relative humidity in all layers [%] 25 40
Buildings Albedo of walls for buildings 0.3 0.3
Albedo of roofs for buildings 0.3 0.3
a The solar radiation, which is calculated depending on latitude, was slightly over-estimated by ENVI-met for Damascus conditions and was therefore decreased to 85%
2.6. Assessment of thermal comfort for the simulated models In this study, thermal comfort was estimated by calculating the two follow-ing indices: the Physiologically Equivalent Temperature (PET) (Höppe, 1999) and the Outdoor Standard Effective Temperature (OUT_SET*), which is an adaptation of the Standard Effective Temperature (SET*) for outdoor use (Pickup & de Dear, 2000). PET and OUT_SET*, which are expressed in °C, are based on the energy balance of the human body. To calculate PET, air temperature, relative humidity, wind speed and the mean radiant tem-perature (MRT) – which is a key variable in determining the thermal com-fort outdoors – are sufficient, whereas for OUT_SET*, the data of clothing and activity are also needed together with the climatic data mentioned above. Although these indices have not been fully calibrated for Damascus – only neutral temperatures and lower and upper limits of thermal comfort for winter and summer respectively were obtained from the calculations (Yahia & Johansson, 2013b) – these indices make it possible to compare different urban design proposals.
For all four cases, the E-W street orientation was simulated for the sum-mer because this orientation is more stressful than N-S (Ali-Toudert & Mayer, 2006; Johansson, 2006b) and the summer is the most problematic season. For the base and the best cases, additional simulations were con-ducted for the N-S orientation as well as for the winter season. For both street orientations, both PET and OUT_SET* were calculated for the base and the best cases. For OUT_SET*, the data of clothing and activity were taken from previous studies about Damascus (0.57 clo and 1.5 met for the

Towards better Urban Spaces Moohammed Wasim Yahia
206
summer and 0.97 clo and 1.6 for winter) (Yahia & Johansson, 2013b). In this study, the RayMan PC model (Matzarakis et al, 2007) was used to calculate PET, whereas the ASHRAE Thermal Comfort Program (Fountain & Huizenga, 1994) was used to calculate the OUT_SET*.
2.7. Modeling of vegetation and landscape elements The vegetation and landscape elements used were trees and horizontal overhead shading devices. The selection of trees in the urban environment to create a specific urban design can be based on many aspects such as provision of shade, which depends on foliage properties, the type of soil, the type of root system as well as the possibility to adapt to the climate and hazards (Arnold, 1980; Trowbridge & Bassuk, 2004).
The Leaf Area Index (LAI) is defined as the total one-sided leaf surface area (m2) per unit ground area (m2) and it can be considered simply as the ratio of leaves to ground covered (Ong, 2003). A tree can be divided into horizontal layers with different Leaf Area Density (LAD), which is defined as the total one sided leaf area (m2) per unit layer volume (m3) in each hori-zontal layer of the tree. In other words, it can be defined as the total leaf area per unit volume of the horizontal slices along the height of the tree and gives an idea about the vertical leaves distribution (Meir, Grace, & Miranda, 2000; Law, Cescatti, & Baldocchi, 2001b). If the LAD’s of the different layers are known, the LAI can be calculated as:
(1)
Where is the number of layers and dz is the layer thickness (m) For hot climates, only a few studies such as Kotzen (2003) and Shahidan
et al. (2007) have investigated the LAI for trees either by measurements or modelling. However, Fahmy et al. (2010) investigated how trees can be modelled without information of LAI or LAD values. The authors discussed the minimum LAI value of a tree that is needed to produce maximum sha-dow at peak hour of a mid latitude site. The authors reported that, for the hot dry climate of Cairo, a LAI of 1 can be considered the minimum value of a tree to intercept about half of the short wave direct radiation. They also suggested that LAI should not be less than 4 to intercept about 100% of the direct radiation for shading trees in a mid latitude location.
Ulmus Americana (American Elm), a specie which is commonly used in the Middle East as a street tree (Mahadin, 2001), was modelled in this study. The tree was 8 m high, which is appropriate for the urban design pattern of the IRA urban zone in Damascus, and a LAI of 4.6 was assumed during the summer. In winter on the other hand, 30% of the summer LAI values was assumed. This is because Ulmus Americana is a deciduous tree and it loses most of its leaves in winter. Because ENVI-met 3.1 does not include shading devices, a very dense horizontal layer of vegetation (LAI of 9) was used to model a shading device that totally blocks the solar radiation. The LAD and LAI values for the summer and winter seasons are shown in Table 2.

Paper 6
207
Table 2 Trees and shading devices used in the summer and winter simulations, where D is Ul-mus Americana (American Elm)a and Sh is a very dense vegetation type used as shading device. LAI was calculated according to Eq. 1
D (summer) D (winter) Sh Height (m) 8 8 3 LAD 1 0.1 0.03 0 LAD 2 0.1 0.03 0 LAD 3 0.1 0.03 0 LAD 4 0.6 0.2 0 LAD 5 1 0.3 0 LAD 6 1 0.3 0 LAD 7 1 0.3 0 LAD 8 1 0.3 0 LAD 9 0.6 0.2 0 LAD10 0.3 0.1 30 LAD total 5.8 1.8 30 LAI 4.6 1.5 9
aUlmus Americana (American Elm) is a tree that is commonly used in the Middle East. The maximum height can be 20 m. It is a deciduous tree and can be planted in tight places in ur-ban areas. It can also be planted as a street tree. It prefers sunny conditions and therefore it can be used to provide shade (Mahadin, 2001).
3. Results
3.1. The effect of urban design on thermal comfort Fig. 5 shows the PET index results at 14:00 for the E-W street orientation of the four studied cases including the base case. The figure illustrates that the urban space – pavements and the street – in the base case (Fig. 5a) is very stressful (PET is between 51 and 58 °C). When urban morphology is changed (Fig. 3b), the thermal comfort is improved for the southern pave-ment where PET is about 36 °C (Fig. 5b) because of the tall wall (7 m) that provides shade. In the case of trees on the pavements, thermal comfort has improved considerably both on the pavements and in the street space where PET is between 35 and 50 °C (Fig. 5c). In the case of using shading devices together with trees on the pavements, thermal comfort is improved significantly even more than the case of using only trees, and the PET varies between 32 °C under shade and 48 °C in the middle of the street (Fig. 5d). In addition, more shaded spaces were provided over the pavements for pedestrians needs. The results indicate that the last case (Fig. 5d) is clearly better than the other cases regarding outdoor thermal comfort. In addition, it is shown that the idea of using a mixture of shading devices and trees is a good strategy to have less stressful urban spaces.

Towards better Urban Spaces Moohammed Wasim Yahia
208
Fig. 5. Calculated PET at 14:00 for the E-W street orientation for (a) base case, (b) urban mor-phology, (c) vegetation and (d) vegetation and shading devices
3.2. The effect of street orientation and seasonal differences on thermal comfort Fig. 6 shows the PET results of different street orientations for the case street trees and shading devices (best case) compared to the base case at 14:00 during the summer time. For the base case, the results show that N-S orientation is less stressful than E-W mainly for the west pavement (Fig. 6b) due to the shade created by the buildings. By using street trees and shading devices, both orientations are more comfortable than the base case al-though N-S is a bit more stressful than E-W, especially in the spaces be-tween buildings where the E-W orientation provides plenty of shade due to the self shading. On the other hand, the street space – in both orientations – is less stressful when trees and shading devices are used over the pave-ments and this is because the trees and shading devices help to prevent the solar radiation to heat up the street when sun angles are low.

Paper 6
209
Fig. 6. The PET results of different street orientations at 14:00 during the summer time, where: (a) base case E–W, (b) base case N–S, (c) vegetation and shading devices E–W and (d) vegetation and shading devices N–S
Fig. 7 illustrates the OUT_SET* results of different street orientations for the case street trees and shading devices (best case) compared to the base case at 14:00 during the summer time. The result shows that OUT_SET* has the same tendency as PET (Fig. 6) regarding the thermal comfort although OUT_SET* values – for both orientations – are lower than PET values. The maximum PET value in the base case for both orientations (Fig. 6a,b) is about 58 °C, whereas it is about 41 °C for OUT_SET* (Fig. 7a,b). In the case of trees and shading devices, the maximum PET value for both orientations (Fig. 6a,b) is about 49 °C, whereas for OUT_SET* (Fig. 7a,b), it is about 36 °C.
In winter, the effect of street orientation and urban design on thermal comfort is completely different from the summer time. Fig. 8 and Fig. 9 show the PET and OUT_SET* results respectively for different street orienta-tions for the case street trees and shading devices (best case) compared to the base case at 14:00. The results illustrate that the main difference be-tween E-W and N-S orientations for both PET and OUT_SET* is that there is no significant difference in maximum temperature values in the base case as well as the case where trees and shading devices are added. The maxi-mum PET value of the base case for E-W (Fig. 8a) is about 16 °C, whereas it is about 17 °C for N-S (Fig. 8b). When trees and shading devices are added, the maximum PET value for E-W and N-S (Fig. 8c, d) is about the same (15 °C). On the other hand, the maximum OUT_SET* value in the base case for E-W (Fig. 9a) is about 23 °C, whereas it is about 24 °C for N-S (Fig. 9b). When trees and shading devices are added, the maximum OUT_SET* value for E-W and N-S (Fig. 9c, d) is about the same (22 °C).
Towards better Urban Spaces Moohammed Wasim Yahia
210
Fig. 7. The OUT_SET* results of different street orientations at 14:00 during the summer time, where: (a) base case E–W, (b) base case N–S, (c) vegetation and shading devices E–W and (d) vegetation and shading devices N–S
Fig. 8. The PET results of different street orientations at 14:00 during the winter time where: (a) base case E–W, (b) base case N–S, (c) vegetation and shading devices E–W and (d) vegeta-tion and shading devices N–S

Paper 6
211
Fig. 9. The OUT_SET* results of different street orientations at 14:00 during the winter time where: (a) base case E–W, (b) base case N–S, (c) vegetation and shading devices E–W and (d) vegetation and shading devices N–S
3.3. Spatial and temporal variations of thermal comfort Fig. 10 and Fig. 11 show the average values of PET and OUT_SET* for the pedestrian zones A and B (Fig. 4) of different street orientations for the case street trees and shading devices (best case) at the hours 12:00, 14:00 and 16:00 in summer and winter respectively. The results show the same ten-dency of thermal comfort for PET and OUT_SET*. In summer, Fig. 10 re-veals that N-S is the street orientation that shows the largest variation be-tween the pavements. The most stressful zone is the eastern pavement (zone A) during the afternoon (14:00 and 16:00) with PET values 6–7 °C higher than for the western pavement (zone B). The corresponding OUT_SET* values are 2–3 °C higher. The reason is that in the afternoon, this side of the street receives high amounts of solar radiation due to the rela-tively low solar angles, which allow the radiation to penetrate under the tree crowns and shading devices. In the morning, when the solar radiation comes from east, the conditions are reversed, but the difference in tem-perature is much smaller (less than 1 °C for both PET and OUT_SET*). For the E-W orientation, on the other hand, the northern pavement (zone A) is the most comfortable at 12:00 and 14:00 for both PET and OUT_SET*, whereas the southern pavement (zone B) is the most comfortable at 16:00, although the differences between the zones are small (less than 1 °C for both PET and OUT_SET*). This is because zone A is protected against solar radiation in the early morning due to the shade that is created by buildings on the northern side of the street, whereas zone B receives solar radiation

Towards better Urban Spaces Moohammed Wasim Yahia
212
due to low solar angles and the ground is heated up. In the late afternoon (16:00), zone A is heated up due to the low sun angle, which penetrates be-low the tree crowns and shading devices. In relation to the thermal comfort zones for Damascus found by Yahia & Johansson (2013b) – which reported upper thermal comfort limits in summer of 31.3 °C for both PET and OUT_SET* – the results for both pavements are clearly above the upper limit of PET (Fig. 10a), whereas only the eastern pavement of the N-S street has values clearly above the limit of OUT_SET* (Fig. 10b).
Fig. 10. The average values for (a) PET and (b) OUT_SET* of different street orientations using street trees and shading devices (best case) at hours 12:00, 14:00 and 16:00 in summer where the bold horizontal lines in (a) and (b) are the upper comfort limits in summer for PET and OUT_SET* respectively (Yahia & Johansson, 2013b)
In winter, Fig. 11 shows that for the N-S orientation the eastern pavement (zone A) is the warmest at 14:00, about 2.5 °C higher than zone B for both PET and OUT_SET*. This is due to the direct solar radiation that reaches this zone since the sun angle is much lower than in summer. On the other hand, the western pavement (zone B) is slightly warmer at 12:00. For the E-W orientation the northern pavement (zone A) is the warmest zone at both 12:00 and 14:00. This is because this zone receives solar radiation due to the low solar angles whereas the southern pavement (zone B) is in shade from buildings, trees and shading devices. The winter results indicate that

Paper 6
213
the hour 16:00 is the worst for both zones A and B since both zones are un-der shade because this hour is near the time of sunset in Damascus. In comparison with the thermal comfort zones for Damascus found by Yahia & Johansson (2013b) – which reported lower thermal comfort limits in win-ter of 21.0 °C for PET and 27.7 °C for OUT_SET* – the results for both pave-ments are clearly below the lower limit of both PET (Fig. 11a) and OUT_SET* (Fig. 11b), at least 8 °C lower for both indices.
Fig. 11. The average values for (a) PET and (b) OUT_SET* of different street orientations using street trees and shading devices (best case) at hours 12:00, 14:00 and 16:00 in winter where the bold horizontal lines in (a) and (b) are the lower comfort limits in winter for PET and OUT_SET* respectively (Yahia & Johansson, 2013b)
Fig. 12 and Fig. 13 show the PET and OUT_SET* values for the entire area of zones A, B and C for the base and best cases for the summer, which is the most problematic season. For both indices there is a considerable thermal comfort improvement when street trees and shading devices are used. For PET, Fig. 12b shows that minimum and maximum values – for the case of trees and shading devices – are 30.2 °C and 49.4 °C respectively, whereas for the base case, the minimum and maximum values are 35.1°C and 57.5 °C respectively (Fig. 12a). The most decisive improvement occurs

Towards better Urban Spaces Moohammed Wasim Yahia
214
at 14:00 and 16:00 for the E-W orientation and the difference between the average PET values of the base and best cases is 10.5 °C at 12:00 and 14:00. The average values of PET are clearly above the upper limit of thermal com-fort. However, the minimum values are slightly below or above this limit which shows that comfortable spots exist in the street space.
Fig. 12. The minimum, maximum and average values of PET for different street orientations in all studied zones A, B and C (Fig. 4) at 12:00, 14:00 and 16:00 during the summer time where (a) the base case, (b) the best case (street trees and shading devices) and the horizontal dotted line is the upper comfort limit in summer for PET (Yahia & Johansson, 2013b)
For OUT_SET* the tendency is the same as for PET, see Fig. 13. However, the values of OUT_SET* are closer to the thermal comfort limits and the dif-ference between minimum and maximum values is, in general, lower. Fig. 13b shows that minimum and maximum values for the best case are 27.9 °C and 36.3 °C respectively, whereas the minimum and maximum values for the base case are 30.1 °C and 40.6 °C respectively (Fig. 13a). The most decisive improvement occurs also at 14:00 and 16:00 for the E-W orienta-tion and the difference between the average OUT_SET* values of the base and best cases is 4.2 °C at 12:00 and 4.4 °C at 14:00. The average values of OUT_SET* are, with a few exceptions, a few °C above the upper limit of thermal comfort. However, all minimum values are clearly below this limit which shows that comfortable spots exist in the street space for all studied hours.

Paper 6
215
Fig. 13. The minimum, maximum and average values of OUT_SET* for different street orienta-tions in all studied zones A, B and C (Fig. 4) at 12:00, 14:00 and 16:00 during the summer time where (a) the base case, (b) the best case (street trees and shading devices) and the hori-zontal dotted line is the upper comfort limit in summer for OUT_SET* (Yahia & Johansson, 2013b)
4. Discussion
4.1. The influence of street orientation on thermal comfort in summer and winter This study deals with detached buildings which reflect the urban planning regulations in Damascus. For the street space and the pavement in summer at 14:00, the simulations show that the N-S street orientation of the base case is less stressful than E-W for both PET and OUT_SET* (Figs. 6 and 7). This agrees with other studies of urban canyons which report that a N-S ori-entation is more comfortable than E-W (Ali-Toudert & Mayer, 2006; Johans-son, 2006a). In contrast, the E-W orientation – for detached urban mor-phologies – is more comfortable than N-S in the case of the spaces be-tween buildings (the side setbacks). This can be explained by the influence of the self-shading effect.
When trees and shading devices are added, the thermal comfort for both PET and OUT_SET* is improved for both orientations. This agrees with oth-er studies which report that the direct radiation under the tree canopy sig-nificantly decreases (Ochoa, Roset & Serra, 2009; Ali-Toudert & Mayer,

Towards better Urban Spaces Moohammed Wasim Yahia
216
2007). Conversely, the study also shows that for the best case (street trees and shading devices) the E-W orientation is slightly less stressful than N-S at street level (Fig. 6 and Fig. 7). Thus, when proper horizontal shading is pro-vided the street orientation is less important. This agrees with Yahia & Jo-hansson (2013a) who argued that for streets with detached buildings in Damascus there is only a weak influence of street orientation and aspect ratio but a strong influence of vegetation on surface temperatures and out-door thermal comfort. In addition, the lateral spaces between buildings (as a result of the side setbacks) are more comfortable for the E-W orientation than for the N-S due to the self shading created by the buildings (Fig. 6 and Fig. 7). Thus, this study shows that the effect of street orientation on out-door thermal comfort for detached buildings does not only affect the street space, but also affects the spaces between buildings. Consequently, in or-der to improve the thermal environment of detached urban morphologies, all spaces – including the streets and the spaces between buildings – must be taken into account in the urban and landscape design processes.
In winter, the N-S orientation is more comfortable in the early afternoon than E-W for the base case, at least the eastern pavement (Fig. 8b and Fig. 9b). For the E-W orientation, the building geometry affects the radiation and creates a shade which partly covers the northern pavement (Fig. 8a and Fig. 9a). The best case follows the same pattern although there is much more shade than in the base case due to the trees and the shading devices. The great improvement in summer for the best case thus implies slightly wor-sened conditions during winter.
4.2. Relation to thermal comfort limits Since people adapt to the thermal conditions they are exposed to, the thermal comfort zone varies from one city to another. This has been con-firmed by many studies which have determined the thermal comfort zone in different cities for different thermal indices such as PET of the urban parks of Cairo (Mahmoud, 2011), PET of subtropical Taiwan (Lin, 2009; Lin & Matzarakis, 2008), OUT_SET* of subtropical Taiwan (Lin et al., 2011) and PET and OUT_SET* of Damascus (Yahia & Johansson, 2013b). In this study the simulated results are compared with the thermal comfort limits for PET and OUT_SET* found in the latter study, see Table 3.
Table 3 Lower and upper comfort limits for PET and OUT_SET* during summer and winter in the hot dry city of Damascus according to Yahia & Johansson (2013b)
Index Comfort range limits (°C)
Acceptability (%) Lower limit Winter Upper limit Summer
PET 80 21.0 31.3
OUT_SET* 80 27.6 31.3
In summer, the PET values of the best case were clearly above the upper
comfort limit (31 °C), see Fig. 10a, whereas the OUT_SET* values were mainly below the upper comfort limit (31 °C), see Fig. 10b. However, it should be noted that the calculated PET and OUT_SET* values in Figs. 10–13 are average values and thus there are many spots within the pedestrian

Paper 6
217
zones where comfort limits are reached, see Figs. 6c, d and 7c, d. This study thus confirms that it is possible – for both E-W and N-S street orienta-tions – to achieve the comfort limits during the warmest hours (at 12:00, 14:00 and 16:00 LT) during the summer which is the most problematic sea-son, see Fig. 14 as an example at 14:00.
Fig. 14. The comfortable spots (the hatched areas) at the street space for the case vegetation and shading devices in different street orientations at 14:00 during the summer time where: (a) PET E-W, (b) PET N-S, (c) OUT_SET* E-W and (d) OUT_SET* N-S
In winter, however, the thermal comfort values were well below the limit (Fig. 10b and Fig. 11b). It should be noted, however, that the winter period is short compared to the summer season and that people are able to im-prove their thermal comfort by using heavier clothing. Moreover, as men-tioned above, the values in Figs. 10–13 are average values and thus there are many spots within the pedestrian zones which are closer to the comfort limits, see Figs. 8c, d and 9c, d. In order to approach the winter thermal lim-it, flexible landscape elements could be used such as shading devices that can be modified or regulated in winter to allow more direct radiation. Simi-larly, using deciduous trees, which is done in this study, or grape vines, will allow the solar radiation in winter to reach the ground and heat up the air whereas during the summer the vegetation will block the direct radiation. Another strategy to improve winter conditions is to provide open public spaces, e.g. small squares and parks within the residential areas.

Towards better Urban Spaces Moohammed Wasim Yahia
218
4.3. Comparison of the PET and OUT_SET* indices This study investigates the effect of landscape, seasonal differences and street orientation on thermal comfort by using two different thermal indi-ces, PET and OUT_SET*. In general, the study shows that they demonstrate the same tendency although they differ in magnitude and in the relation to their thermal comfort limits (Figs. 10–13) as discussed above. The differ-ence in magnitude between the two indices can be explained by the fact that although PET and OUT_SET* have the same meteorological input data, they use different equations to calculate the thermal conditions. In addition, PET uses fixed values for clothing and activity, whereas OUT_SET* was cal-culated using realistic values for Damascus as input data (see Section 2.6). Therefore, OUT_SET* is more suitable in the hot dry climate since it has large yearly variations and thus the clothing and activity levels vary a lot be-tween the different seasons. Moreover, OUT_SET* has proven to have a bet-ter correlation with thermal perception and thermal acceptability than PET in this climate (Yahia & Johansson, 2013b). If, however, the purpose of the study is to examine and evaluate the effect of landscape on the built envi-ronment independently of people’s perceptions, the urban designers and planners can use PET.
4.4. Landscaping and urban planning regulations This study highlights the importance of creating landscape tools and polices to be linked with urban planning regulations in the city. Such strategies will affect the master plan and urban regulations in terms of spaces between buildings, setbacks, street widths, etc. These and other strategies are needed to reach more sustainable cities in harmony with climatic needs. One of these tools is the Green Plot Ratio (GPR) suggested by Ong (2003) which is defined as the average LAI of the greenery on a site. GPR allows a more precise regulation of greenery on a site without excluding a corre-sponding portion of the site from building development. Although this con-cept provides flexibility to the designer while simultaneously protecting the green quota in the design, it does not recognize the 3D dimension since it only treats the amount of greenery per surface area. The GPR does not specify the type of vegetation, i.e. whether it is grass, bushes, trees etc, which will strongly affect the shading of the site. Another study by (Ng et al., 2012) conducted simulations to investigate the required percentage of greenery (green coverage ratio) in the urban environment to create cooling However, this study concentrated on the effect of the air temperature and did not take the 3D dimension of vegetation and landscape elements into account. Therefore, there is a future need to investigate the role of vegeta-tion and landscape elements from a shading point of view and to create re-alistic links with urban regulations in the city to be applied in practice espe-cially in terms of the 3D form of trees and other landscape elements.

Paper 6
219
5. Conclusions This study investigated the effect of vegetation and landscape elements on outdoor thermal comfort for detached buildings in Damascus, Syria.
The study shows that urban morphology, orientation and vegetation strongly affect the street design. Moreover, it was shown that the effect of street orientation on outdoor thermal comfort for detached buildings does not only affect the street space, but also affects the lateral spaces between buildings. In order to improve the thermal environment of detached build-ings, all spaces – including the streets and the spaces between buildings – must be taken into account in urban and landscape design processes.
By using vegetation and landscape elements, it is possible to achieve the comfort limits during the warmest hours (at 12:00, 14:00 and 16:00 LT) for both E-W and N-S street orientations in the summer which is the most prob-lematic season. However, in winter the thermal comfort values were found to be lower than the comfort limit. It is suggested to use flexible landscape elements such as moveable shading devices or deciduous vegetation to al-low solar radiation to reach the ground.
This study showed that PET and OUT_SET* have the same tendency, however the OUT_SET* values were closer to thermal comfort, especially in summer. If the aim is to examine how comfortable an urban design pro-posal is, OUT_SET*, which takes clothing and activity into account, is rec-ommended. If only a relative comparison of different alternatives is needed, then it is also possible to use PET.
This article highlights the importance of creating landscape tools and po-lices to be linked with the urban planning regulations of the city. Such strat-egies will help to reach more sustainable cities in harmony with climatic needs. This should be done by investigating the role of vegetation and land-scape elements from a shading point of view taking the 3D form of trees and other landscape elements into account.
The ENVI-met simulations pointed out the need to consider microclimat-ic requirements in the urban design and planning processes and showed the importance of a climate smart urban design. Moreover, it illustrated how to develop the thermal environment for the case of detached buildings which is a common urban form in Damascus. It is thus an advantage to use ENVI-met simulations in the field of urban design and planning to evaluate different urban design proposals.
Although the results of this study are limited to the city of Damascus and only dealt with the IRA urban zone, containing only detached buildings, the recommendations can be applied for other cities in hot dry regions. Such strategies will provide a common base towards creating standards to use in future studies in hot dry climates regarding the methodologies and ap-proaches to investigate the thermal environments and creating a comforta-ble microclimate.

Towards better Urban Spaces Moohammed Wasim Yahia
220
References Akbari, H., Pomerantz, M., & Taha, H. (2001). Cool Surfaces and Shade Trees to Re-
duce Energy Use and Improve Air Quality in Urban Areas. Solar Energy, 70 (3), 295–310. http://dx.doi.org/10.1016/S0038-092X(00)00089-X.
Ali-Toudert, F., & Mayer, H. (2006). Numerical Study on the effects of aspect ratio and orientation on an urban street canyon on outdoor thermal comfort in hot and dry climate. Build Environ, 41, 94–108. http://dx.doi.org/10.1016/j.buildenv.2005.01.013.
Ali-Toudert, F., & Mayer, H. (2007). Effects of asymmetry, galleries, overhanging fa-cades and vegetation on thermal comfort in urban street canyons. Solar Energy, 81, 742–754. http://dx.doi.org/10.1016/j.solener.2006.10.007.
Al-Kodmany, K. (1999). Privacy: traditional and modern architecture and urban de-sign. Urban Design, 4, 283–312. http://dx.doi.org/10.1080/13574809908724452
Arnold, H.F. (Ed.). (1980). Trees in urban design. New York - Van Nostrand Reinhold
Berkovic, S., Yezioro, A., & Bitan, A. (2012). Study of thermal comfort in courtyards in a hot arid climate. Solar Energy, 86, 1173–1186. http://dx.doi.org/10.1016/j.solener.2012.01.010.
Brown, R. (2010). Design with Microclimate: The Secret to Comfortable Outdoor Space. Washington DC - Island press.
Bruse, M. (2009). ENVI-met simulation program. Retrieved December 18, 2009 from - http //www.envi-met.com.
Bruse, M., & Fleer, H. (1998). Simulating surface-plant-air interactions inside urban environments with a three dimensional numerical model. Environmental Mo-delling & Software, 13, 373–384. http://dx.doi.org/10.1016/S1364-8152(98)00042-5.
Chow, W.T.L., & Brazel, A.J. (2012). Assessing xeriscaping as a sustainable heat is-land mitigation approach for a desert city. Build Environ, 47, 170–181. http://dx.doi.org/10.1016/j.buildenv.2011.07.027.
Eliasson, I. (2000). The use of climate knowledge in urban planning. Landscape and Urban Planning, 48, 31–44. http://dx.doi.org/10.1016/S0169-2046(00)00034-7.
Fahmy, M., & Sharples, S. (2009). On the development of an urban passive thermal comfort system in Cairo, Egypt. Build Environ, 44, 1907–1916. http://dx.doi.org/10.1016/j.buildenv.2009.01.010.
Fahmy, H., Sharples, S., & Yahia, M. (2010). LAI based trees selection for mid latitude urban developments: a microclimatic study in Cairo, Egypt. Build Environ, 45, 345–357. http://dx.doi.org/10.1016/j.buildenv.2009.06.014.
Fountain, M.E., & Huizenga, C. (1994). Using the ASHRAE thermal comfort tool. An ASHRAE Special Publication, ASHRAE, Atlanta.
Höppe, P. (1999). The physiological equivalent temperature – a universal index for the assessment of the thermal environment. Int. J. Biometeorol, 43, 71–75. http://dx.doi.org/10.1007/s004840050118.
Johansson, E. (2006a). Influence of urban geometry on outdoor thermal comfort in a hot dry climate: a study in Fez, Morocco. Build Environ, 41, 1326–1338. http://dx.doi.org/10.1016/j.buildenv.2005.05.022.
Johansson, E. (2006b). Urban design and outdoor thermal comfort in warm climates – studies in Fez and Colombo (PhD dissertation). Lund, Sweden. Department of Housing Development & Management, Lund University.

Paper 6
221
Kotzen, B. (2003). An investigation of shade under six different tree species of the Negev desert towards their potential use for enhancing micro-climatic condi-tions in landscape architectural development. J Arid Environ, 55, 231–274. http://dx.doi.org/10.1016/S0140-1963(03)00030-2.
Law, B.E., Cescatti, A., & BAaldocchi, D.D. (2001). Leaf area distribution and radiative transfer in open-canopy forests: implications for mass and energy exchange. Tree Physiol, 21,777–787. http://dx.doi.org/10.1093/treephys/21.12-13.777.
Lin, T.P., & Matzarakis, A. (2008). Tourism climate and thermal comfort in Sun Moon Lake, Taiwan. Int J Biometeorol, 52 (4), 281–290. http://dx.doi.org/10.1007/s00484-007-0122-7.
Lin, T.P. (2009). Thermal perception, adaption and attendance in a public square in hot and humid regions. Build Environ, 44, 2017–2026. http://dx.doi.org/10.1016/j.buildenv.2009.02.004.
Lin, T.P., de Dear, R., & Hwang, R.L. (2011). Effect of thermal adaptation on seasonal outdoor thermal comfort. Int J Climatol, 31, 302–312. http://dx.doi.org/10.1002/joc.2120.
Mahadin, K.O. (2001). Landscape plants for Jordan and the Middle East. Jordan – M.K. associates.
Mahmoud, A.H.A. (2011). Analysis of the microclimatic and human comfort condi-tions in an urban park in hot and arid regions. Build Environ, 46, 2641–2656. http://dx.doi.org/10.1016/j.buildenv.2011.06.025.
Matzarakis, A., Rutz, F., & Mayer, H. (2007). Modelling radiation fluxes in simple and complex environments – application of the RayMan model. Int. J. Biometeorol, 51,323–334. http://dx.doi.org/10.1007/s00484-006-0061-8.
Matzarakis, A., & Mayer, H. (1996). Another kind of environmental stress: thermal stress. WHO Colloborating Centre for Air Quality Management and Air Pollu-tion Control. Newsletters 18, 7–10.
Meir, P., Grace, J., & Miranda, A.C. (2000). Photographic method to measure the ver-tical distribution of leaf area density in forests. Agric For Meteorol, 102, 105–111. http://dx.doi.org/10.1016/S0168-1923(00)00122-2.
Ng, E., Chen, L., Wang, Y., & Yuan, C. (2012). A study on the cooling effects of the greening in a high- density city: An experience from Hong Kong. Build Environ, 47, 256–271. http://dx.doi.org/10.1016/j.buildenv. 2011.07.014.
Ochoa, J. M., Roset, J., & Serra, R. (2009). Vegetation influences on the human ther-mal comfort in outdoor spaces. Retrieved July16, 2013, from School of Archi-tecture of Barcelona, Department of Constructions Arquitectòniques I and De-partment of Física Aplicada – http://www-fa.upc.es/personals/jroset/lyonvege.html.
Ong, B.L. (2003). Green plot ratio: an ecological measure for architecture and urban planning. Landscape and urban planning, 63, 197–211. http://dx.doi.org/10.1016/S0169-2046 (02)00191-3.
Pickup, J., & de Dear, R. (2000). An outdoor thermal comfort index (OUT_SET*) Part I – The model and its assumptions. In: de Dear R et al. (Eds.) Biometeorology and urban climatology at the turn of the millennium (pp. 71–98). World Meteo-rological Organization- Sydney.
Shahidan, M.F., Salleh, E., & Shariff, K.M. (2007). Effects of Tree canopies on solar radiation filtration in a tropical microclimatic environment. In: The 24th confe-rence on passive and low energy architecture, Singapore 22–24 November,

Towards better Urban Spaces Moohammed Wasim Yahia
222
2007. Available online from the organization Passive & Low Energy Architectu-re (PLEA) – http://www.plea-arch.org/ARCHIVE/2007/html/pdf/P0282.pdf.
Shashua-Bar, L., Pearlmutter, D., & Evyatar, E. (2011). The influence of trees and grass on outdoor thermal comfort in a hot-arid environment. Int. J. Climatol, 31, 1498–1506. http://dx.doi.org/10.1002/joc.2177.
Trowbridge, P.J., & Bassuk, N.L. (2004). Trees in the urban landscape; site assess-ment, design and installation. New Jersey - John Wiley & Sons Inc.
Yahia, M.W., & Johansson, E. (2013a). Influence of urban planning regulations on the microclimate in a hot dry climate: The example of Damascus, Syria. Housing and the Built Environment, 28 (1), 51–65. http://dx.doi.org/10.1007/s10901-012-9280-y.
Yahia, M.W., & Johansson, E. (2013b). Evaluating the behaviour of different thermal indices by investigating various outdoor urban environments in the hot dry city of Damascus, Syria. Int. J. Biometeorol, 57(4), 615–630. http://dx.doi.org/10.1007/s00484-012-0589-8.
Yahia, M.W. (2012). Urban Microclimate and Thermal Comfort of Urban Spaces in Hot Dry Damascus: Influence of urban design and planning regulations (Licen-tiate dissertation). Lund, Sweden. Department of Housing Development & Ma-nagement, Lund University.


![Real-time Urban Microclimate Analysis Using … Urban Microclimate Analysis Using Internet of Things ... In many IoT applications, ... urban microclimate monitoring [20]. To study](https://img.pdfslide.us/doc/110x75/5ac834157f8b9aa3298bdae6/real-time-urban-microclimate-analysis-using-urban-microclimate-analysis-using.jpg)