Embed Size (px)
Citation preview

Towards a theory on the causes of the Greek depression and its implications for understanding the Eurozone crisis
by Paul-Adrien HYPPOLITE
for Greek Economists for Reform.com
September 2016
1
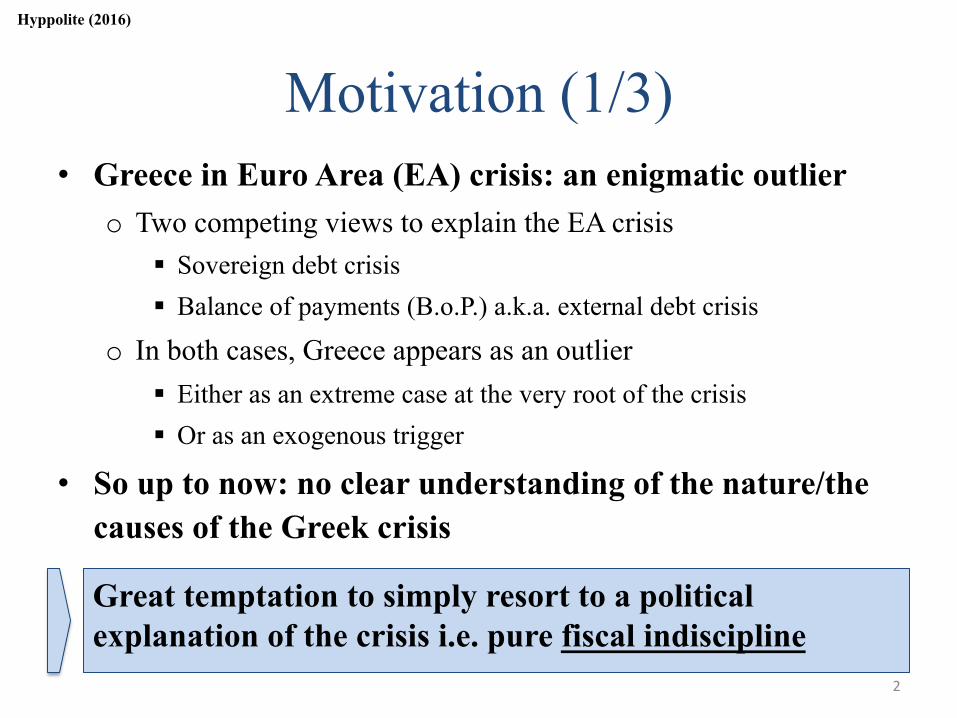
Motivation (1/3) • Greece in Euro Area (EA) crisis: an enigmatic outlier
o Two competing views to explain the EA crisis § Sovereign debt crisis § Balance of payments (B.o.P.) a.k.a. external debt crisis
o In both cases, Greece appears as an outlier § Either as an extreme case at the very root of the crisis § Or as an exogenous trigger
• So up to now: no clear understanding of the nature/the causes of the Greek crisis
Great temptation to simply resort to a political explanation of the crisis i.e. pure fiscal indiscipline
Hyppolite (2016)
2
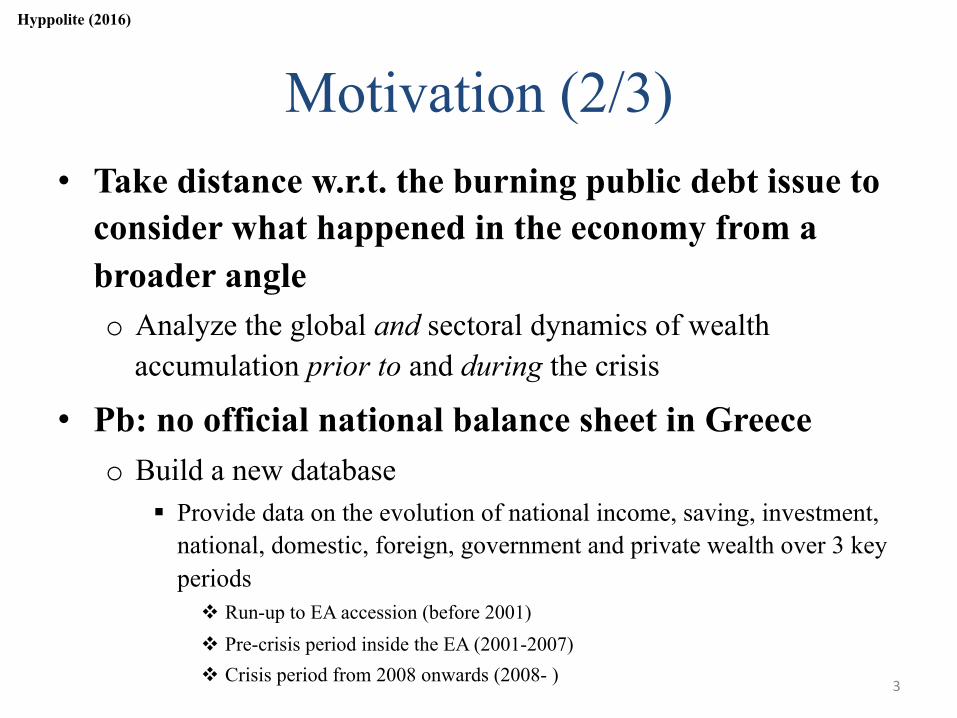
Motivation (2/3) • Take distance w.r.t. the burning public debt issue to
consider what happened in the economy from a broader angle o Analyze the global and sectoral dynamics of wealth
accumulation prior to and during the crisis
• Pb: no official national balance sheet in Greece o Build a new database
§ Provide data on the evolution of national income, saving, investment, national, domestic, foreign, government and private wealth over 3 key periods
v Run-up to EA accession (before 2001) v Pre-crisis period inside the EA (2001-2007) v Crisis period from 2008 onwards (2008- )
Hyppolite (2016)
3
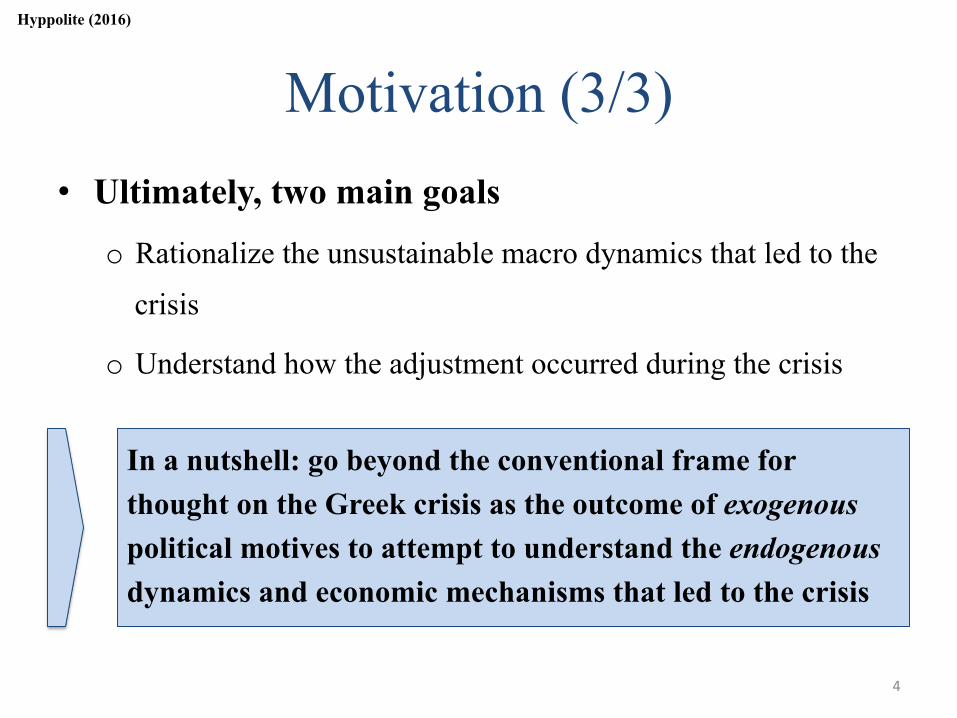
Motivation (3/3)
In a nutshell: go beyond the conventional frame for thought on the Greek crisis as the outcome of exogenous political motives to attempt to understand the endogenous dynamics and economic mechanisms that led to the crisis
• Ultimately, two main goals
o Rationalize the unsustainable macro dynamics that led to the
crisis
o Understand how the adjustment occurred during the crisis
Hyppolite (2016)
4
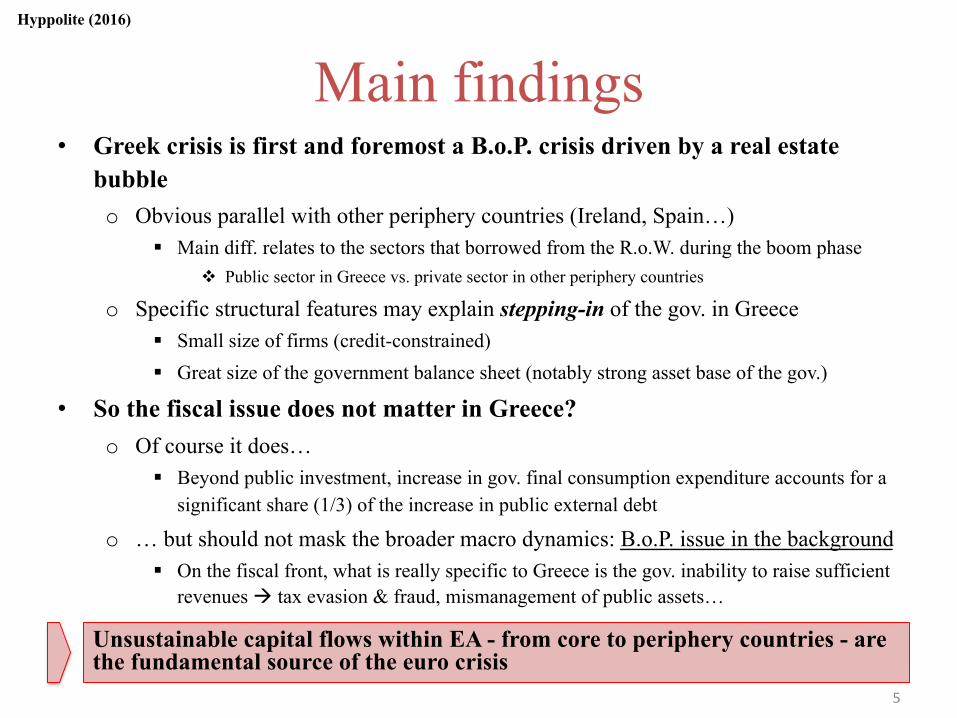
Main findings • Greek crisis is first and foremost a B.o.P. crisis driven by a real estate
bubble o Obvious parallel with other periphery countries (Ireland, Spain…)
§ Main diff. relates to the sectors that borrowed from the R.o.W. during the boom phase v Public sector in Greece vs. private sector in other periphery countries
o Specific structural features may explain stepping-in of the gov. in Greece § Small size of firms (credit-constrained) § Great size of the government balance sheet (notably strong asset base of the gov.)
• So the fiscal issue does not matter in Greece? o Of course it does…
§ Beyond public investment, increase in gov. final consumption expenditure accounts for a significant share (1/3) of the increase in public external debt
o … but should not mask the broader macro dynamics: B.o.P. issue in the background § On the fiscal front, what is really specific to Greece is the gov. inability to raise sufficient
revenues à tax evasion & fraud, mismanagement of public assets…
Hyppolite (2016)
Unsustainable capital flows within EA - from core to periphery countries - are the fundamental source of the euro crisis
5
Outline
① National balance sheets: the general framework
② Greek series
③ Decomposition of national wealth accumulation
④ The Greek crisis: not such an exception after all?
⑤ Policy implications 6

National balance sheets: the general framework
7
National balance sheets (1/7) • Measurement of national wealth
o International guidelines (SNA2008 and ESA2010) provide a framework to estimate wealth series § Economic assets (i.e. ownership rights can be enforced
and provide economic benefits to owners) included
§ Human capital, future government expenditures and transfers excluded by definition
§ But natural capital (e.g. land and proven natural reserves) plus intangible capital (e.g. intellectual property) included
Hyppolite (2016)
8
National balance sheets (2/7) • Breakdown of national wealth
o Residents divided into 3 main sectors: households, corporations and government, while foreigners = rest of the world (R.o.W.)
o Wealth of each sector = sum of its non-financial and financial assets minus its liabilities
o National wealth = sum of the wealth of the 3 main sectors = net foreign asset positions (NFAP) + non-financial assets of the 3 main sectors = foreign wealth + domestic wealth
Hyppolite (2016)
9
National balance sheets (3/7) • Private and government wealth
o With equity of corporations at book value, wealth of corporations = 0 by definition, so national wealth = wealth of households + wealth of the government = private wealth + government wealth
o With equity of corporations at market value, one can have a non-zero “residual corporate wealth”. Why? Two interpretations § Temporary market fluctuations above or below the book value à book
value seen as the “fair value”
§ Measurement errors in the book value due to the difficulty to properly estimate the value of corporations’ non-fin assets like equipment, factories etc. à market value seen as the “fair value”
Hyppolite (2016)
10
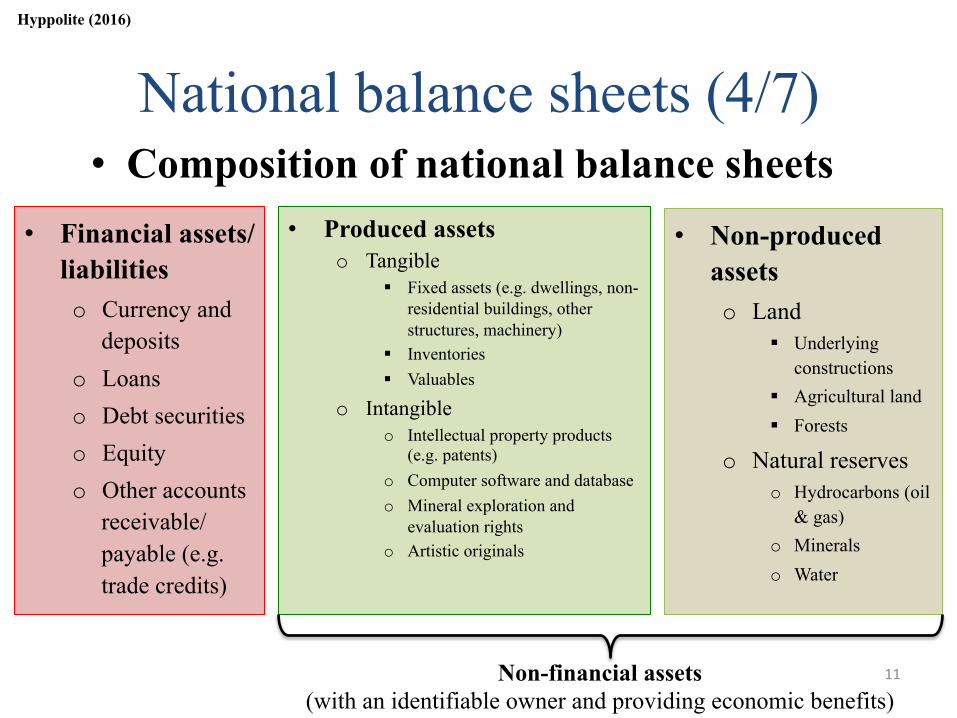
National balance sheets (4/7) • Composition of national balance sheets
• Financial assets/liabilities o Currency and
deposits o Loans o Debt securities o Equity o Other accounts
receivable/payable (e.g. trade credits)
• Produced assets o Tangible
§ Fixed assets (e.g. dwellings, non-residential buildings, other structures, machinery)
§ Inventories § Valuables
o Intangible o Intellectual property products
(e.g. patents) o Computer software and database o Mineral exploration and
evaluation rights o Artistic originals
• Non-produced assets o Land
§ Underlying constructions
§ Agricultural land § Forests
o Natural reserves o Hydrocarbons (oil
& gas) o Minerals o Water
Non-financial assets (with an identifiable owner and providing economic benefits)
Hyppolite (2016)
11
National balance sheets (5/7) • Valuation of assets/liabilities
o Financial assets/liabilities: market value whenever possible (nominal value for deposits, loans) § For unquoted shares, statisticians compute market-value estimates
using comparable listed companies
o Produced assets: market value & PIM § Market value derived from housing surveys or market transactions on
real estate market, simulated auctions for machinery, equipment etc.
o Non-produced assets: market value & NPV § Land value surveys & NPV of future revenue with a long-term
discount rate for proven natural reserves (owned by gov. or corporations if concessions granted)
Key idea: resort to as many market-value data as possible
Hyppolite (2016)
Note: PIM = perpetual inventory method 12
National balance sheets (6/7) • Construction of Greek series
o No comprehensive dataset but several data sources (complying with ESA2010) can be used to estimate national wealth + detailed breakdown starting from 1997 § Financial assets/liabilities: financial accounts of the Bank of Greece § Produced assets: point estimate for end 2012 by Eurostat/OECD + PIM
v Cumulating national saving flows (AMECO) and adjusting with a market price indicator (Bank of Greece)
§ Natural capital: data for a regional peer-country from Eurostat/OECD v Adjustment taking into account the relative physical characteristics of Greece
i.e. size & structure of land + volume of proven reserves (CIA World Factbook database) + water reserves
Valuation standards broadly consistent with official guidelines
Hyppolite (2016)
13
National balance sheets (7/7)
0%
100%
200%
300%
400%
500%
600%
700%
1997
19
98 19
99 20
00 20
01 20
02 20
03 20
04 20
05 20
06 20
07 20
08 20
09 20
10 20
11 20
12 20
13 20
14
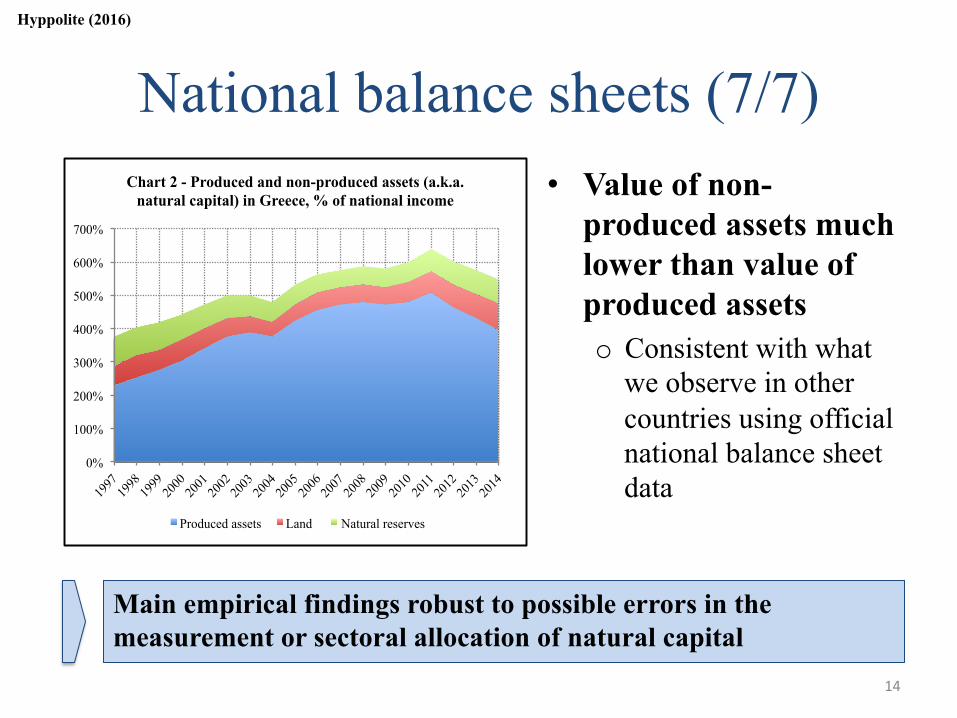
Chart 2 - Produced and non-produced assets (a.k.a. natural capital) in Greece, % of national income
Produced assets Land Natural reserves
Main empirical findings robust to possible errors in the measurement or sectoral allocation of natural capital
Hyppolite (2016)
• Value of non-produced assets much lower than value of produced assets o Consistent with what
we observe in other countries using official national balance sheet data
14

Greek series
15
Greek series (1/6)
0%
100%
200%
300%
400%
500%
600%
1997
19
98 19
99 20
00 20
01 20
02 20
03 20
04 20
05 20
06
2007
20
08 20
09 20
10 20
11 20
12 20
13 20
14
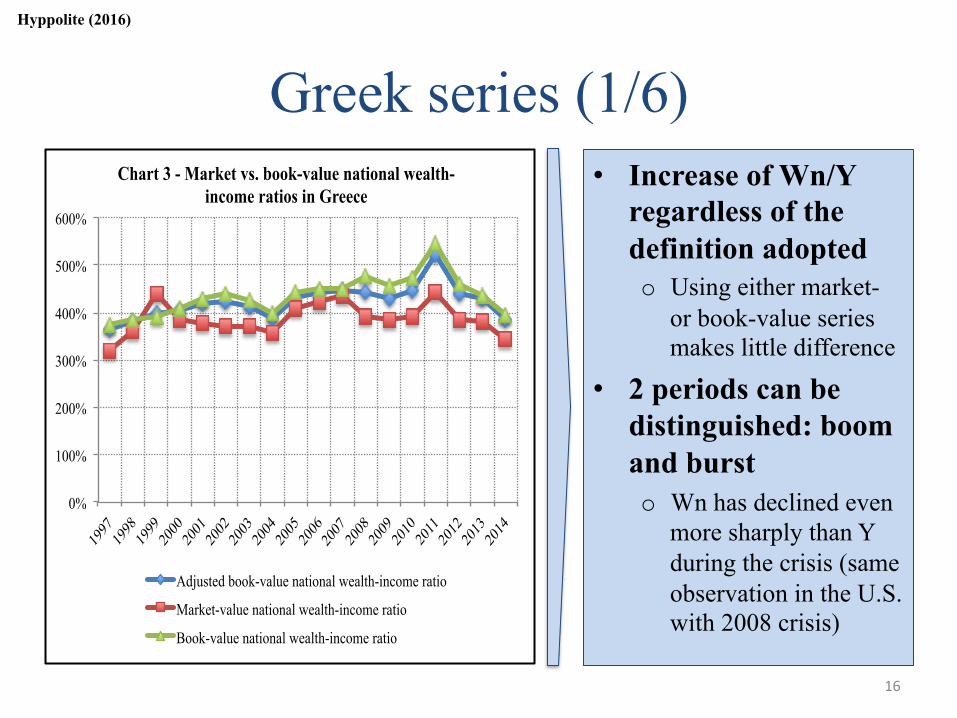
Chart 3 - Market vs. book-value national wealth-income ratios in Greece
Adjusted book-value national wealth-income ratio
Market-value national wealth-income ratio
Book-value national wealth-income ratio
• Increase of Wn/Y regardless of the definition adopted o Using either market-
or book-value series makes little difference
• 2 periods can be distinguished: boom and burst o Wn has declined even
more sharply than Y during the crisis (same observation in the U.S. with 2008 crisis)
Hyppolite (2016)
16
Greek series (2/6)
-200%
-100%
0%
100%
200%
300%
400%
500%
600%
700%
1997 1998
1999 2000
2001 2002
2003 2004
2005 2006
2007 2008
2009 2010
2011 2012
2013 2014
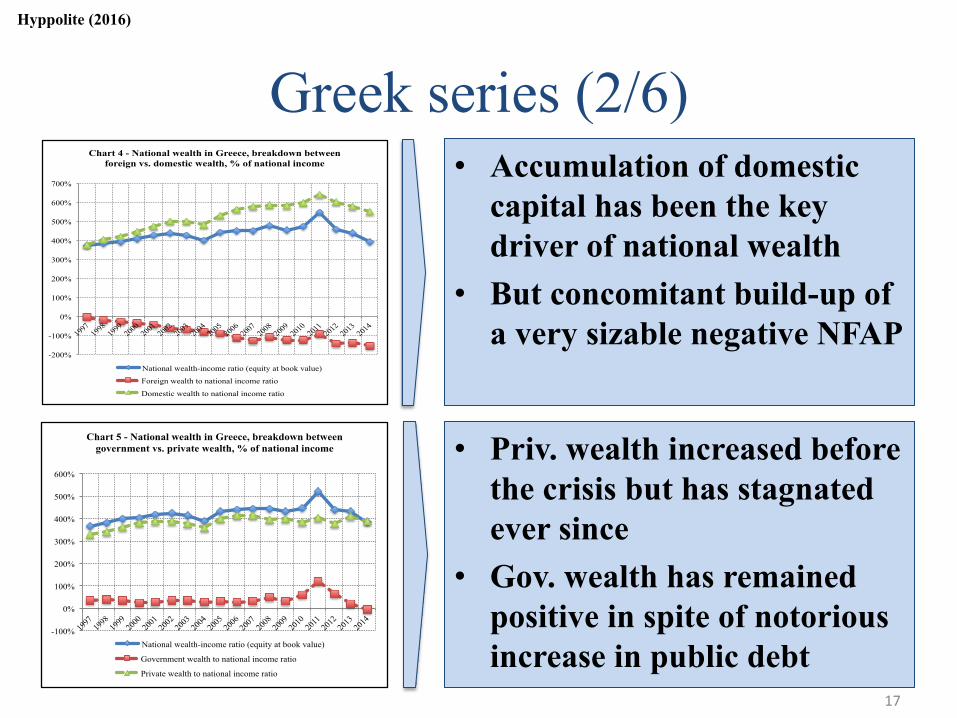
Chart 4 - National wealth in Greece, breakdown between foreign vs. domestic wealth, % of national income
National wealth-income ratio (equity at book value)
Foreign wealth to national income ratio
Domestic wealth to national income ratio
-100%
0%
100%
200%
300%
400%
500%
600%
1997
19
98 19
99 20
00 20
01 20
02 20
03 20
04 20
05 20
06 20
07 20
08 20
09 20
10 20
11 20
12 20
13 20
14
Chart 5 - National wealth in Greece, breakdown between government vs. private wealth, % of national income
National wealth-income ratio (equity at book value)
Government wealth to national income ratio
Private wealth to national income ratio
• Accumulation of domestic capital has been the key driver of national wealth
• But concomitant build-up of a very sizable negative NFAP
• Priv. wealth increased before the crisis but has stagnated ever since
• Gov. wealth has remained positive in spite of notorious increase in public debt
Hyppolite (2016)
17
Greek series (3/6)
0%
100%
200%
300%
400%
500%
600%
1997
19
98 19
99 20
00 20
01 20
02 20
03 20
04 20
05 20
06 20
07 20
08 20
09 20
10 20
11 20
12 20
13 20
14
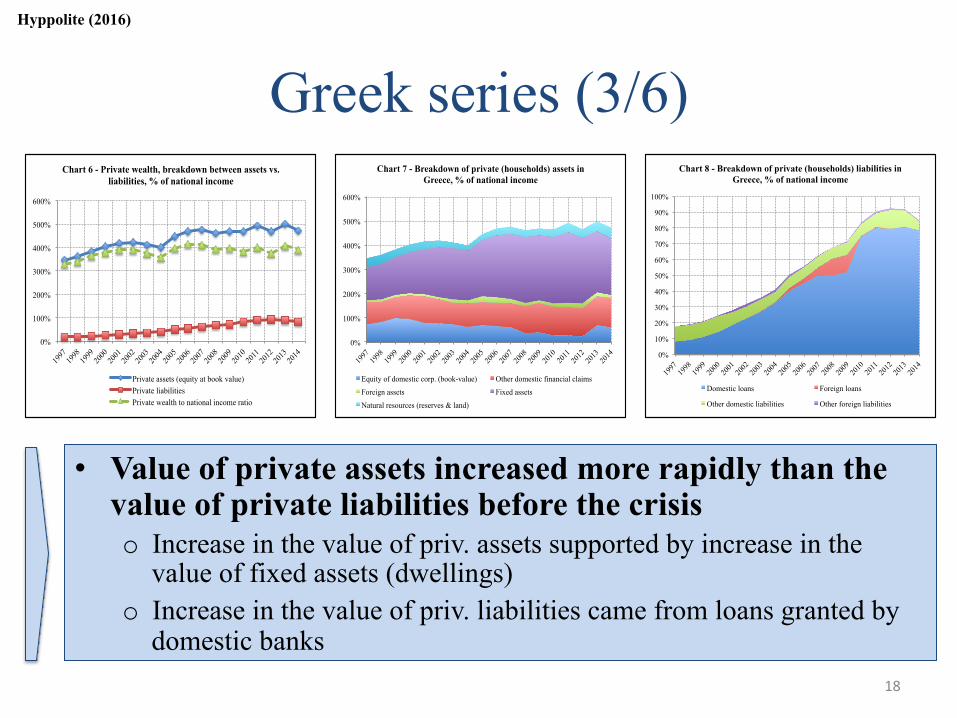
Chart 6 - Private wealth, breakdown between assets vs. liabilities, % of national income
Private assets (equity at book value) Private liabilities Private wealth to national income ratio
0%
100%
200%
300%
400%
500%
600%
1997
19
98 19
99 20
00 20
01 20
02 20
03 20
04 20
05 20
06 20
07 20
08 20
09 20
10 20
11 20
12 20
13 20
14
Chart 7 - Breakdown of private (households) assets in Greece, % of national income
Equity of domestic corp. (book-value) Other domestic financial claims
Foreign assets Fixed assets
Natural resources (reserves & land)
0%
10%
20%
30%
40%
50%
60%
70%
80%
90%
100%
1997
19
98 19
99 20
00 20
01 20
02 20
03 20
04 20
05 20
06 20
07 20
08 20
09 20
10 20
11 20
12 20
13 20
14
Chart 8 - Breakdown of private (households) liabilities in Greece, % of national income
Domestic loans Foreign loans
Other domestic liabilities Other foreign liabilities
• Value of private assets increased more rapidly than the value of private liabilities before the crisis o Increase in the value of priv. assets supported by increase in the
value of fixed assets (dwellings) o Increase in the value of priv. liabilities came from loans granted by
domestic banks
Hyppolite (2016)
18
Greek series (4/6)
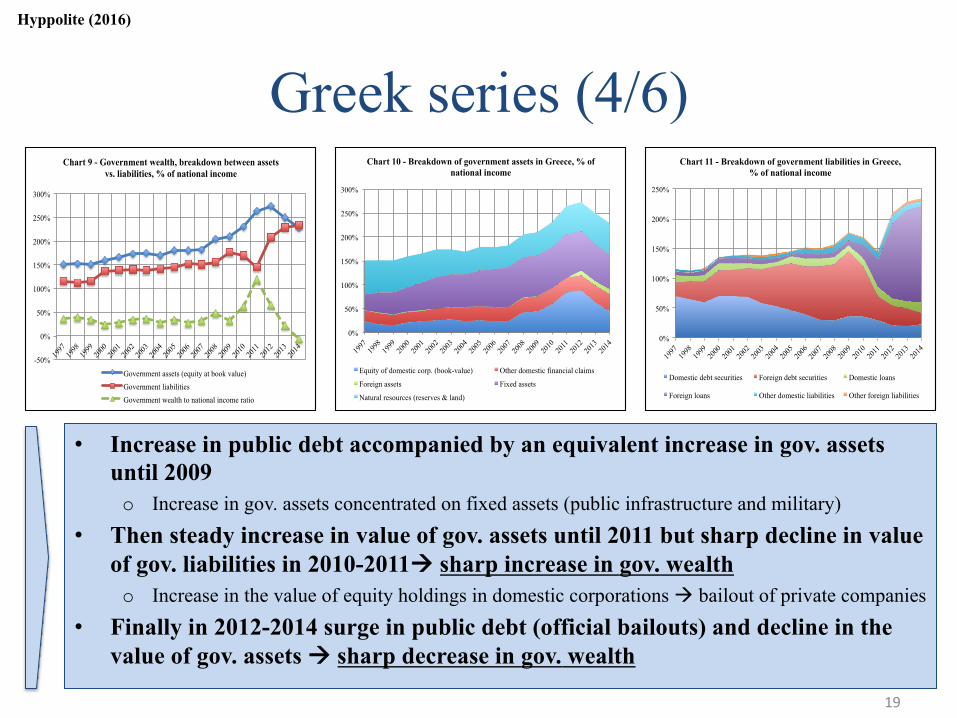
• Increase in public debt accompanied by an equivalent increase in gov. assets until 2009 o Increase in gov. assets concentrated on fixed assets (public infrastructure and military)
• Then steady increase in value of gov. assets until 2011 but sharp decline in value of gov. liabilities in 2010-2011à sharp increase in gov. wealth o Increase in the value of equity holdings in domestic corporations à bailout of private companies
• Finally in 2012-2014 surge in public debt (official bailouts) and decline in the value of gov. assets à sharp decrease in gov. wealth
-50%
0%
50%
100%
150%
200%
250%
300%
1997
19
98 19
99 20
00 20
01 20
02 20
03 20
04 20
05 20
06 20
07 20
08 20
09 20
10 20
11 20
12 20
13 20
14
Chart 9 - Government wealth, breakdown between assets vs. liabilities, % of national income
Government assets (equity at book value)
Government liabilities
Government wealth to national income ratio
0%
50%
100%
150%
200%
250%
300%
1997
19
98
1999
20
00
2001
20
02
2003
20
04
2005
20
06
2007
20
08
2009
20
10
2011
20
12
2013
20
14
Chart 10 - Breakdown of government assets in Greece, % of national income
Equity of domestic corp. (book-value) Other domestic financial claims
Foreign assets Fixed assets
Natural resources (reserves & land)
0%
50%
100%
150%
200%
250%
1997
19
98
1999
20
00
2001
20
02
2003
20
04
2005
20
06 20
07
2008
20
09
2010
20
11
2012
20
13
2014
Chart 11 - Breakdown of government liabilities in Greece, % of national income
Domestic debt securities Foreign debt securities Domestic loans
Foreign loans Other domestic liabilities Other foreign liabilities
Hyppolite (2016)
19
Greek series (5/6)
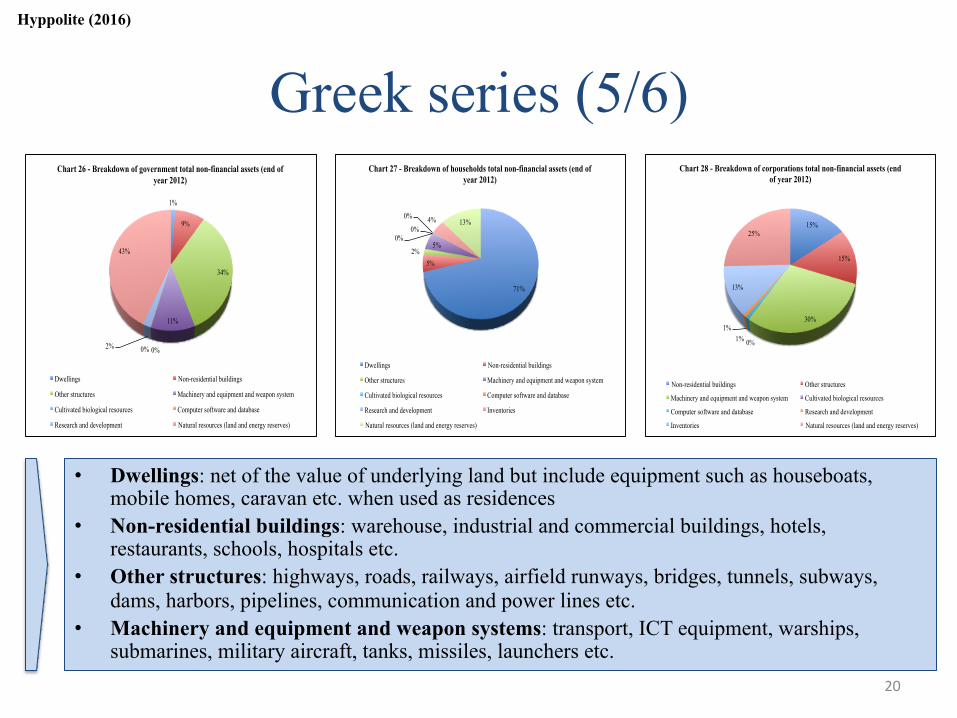
• Dwellings: net of the value of underlying land but include equipment such as houseboats, mobile homes, caravan etc. when used as residences
• Non-residential buildings: warehouse, industrial and commercial buildings, hotels, restaurants, schools, hospitals etc.
• Other structures: highways, roads, railways, airfield runways, bridges, tunnels, subways, dams, harbors, pipelines, communication and power lines etc.
• Machinery and equipment and weapon systems: transport, ICT equipment, warships, submarines, military aircraft, tanks, missiles, launchers etc.
1%
9%
34%
11%
0% 0% 2%
43%
Chart 26 - Breakdown of government total non-financial assets (end of year 2012)
Dwellings Non-residential buildings
Other structures Machinery and equipment and weapon system
Cultivated biological resources Computer software and database
Research and development Natural resources (land and energy reserves)
71%
5% 2%
5% 0%
0%
0% 4% 13%
Chart 27 - Breakdown of households total non-financial assets (end of year 2012)
Dwellings Non-residential buildings
Other structures Machinery and equipment and weapon system
Cultivated biological resources Computer software and database
Research and development Inventories
Natural resources (land and energy reserves)
15%
15%
30%
0% 1% 1%
13%
25%
Chart 28 - Breakdown of corporations total non-financial assets (end of year 2012)
Non-residential buildings Other structures
Machinery and equipment and weapon system Cultivated biological resources
Computer software and database Research and development
Inventories Natural resources (land and energy reserves)
Hyppolite (2016)
20
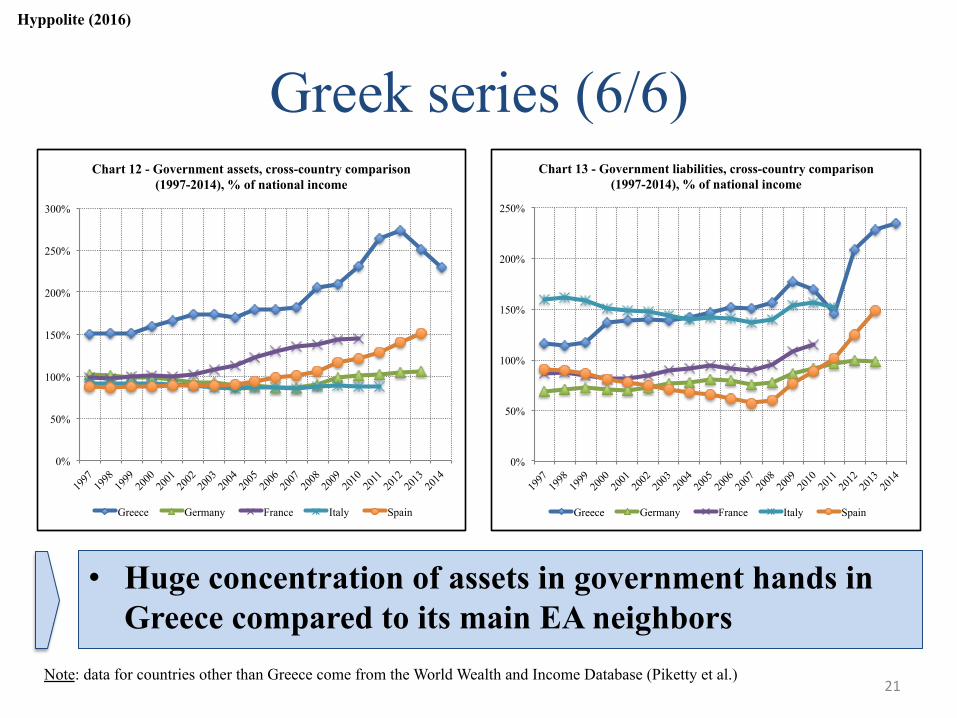
Greek series (6/6)
• Huge concentration of assets in government hands in Greece compared to its main EA neighbors
0%
50%
100%
150%
200%
250%
300%
1997
19
98 19
99 20
00 20
01 20
02 20
03 20
04 20
05 20
06 20
07 20
08 20
09 20
10 20
11 20
12 20
13 20
14
Chart 12 - Government assets, cross-country comparison (1997-2014), % of national income
Greece Germany France Italy Spain
0%
50%
100%
150%
200%
250%
1997
19
98 19
99 20
00 20
01 20
02 20
03 20
04 20
05 20
06 20
07 20
08 20
09 20
10
2011
20
12 20
13 20
14
Chart 13 - Government liabilities, cross-country comparison (1997-2014), % of national income
Greece Germany France Italy Spain
Hyppolite (2016)
Note: data for countries other than Greece come from the World Wealth and Income Database (Piketty et al.) 21
Decomposition of national wealth accumulation
22
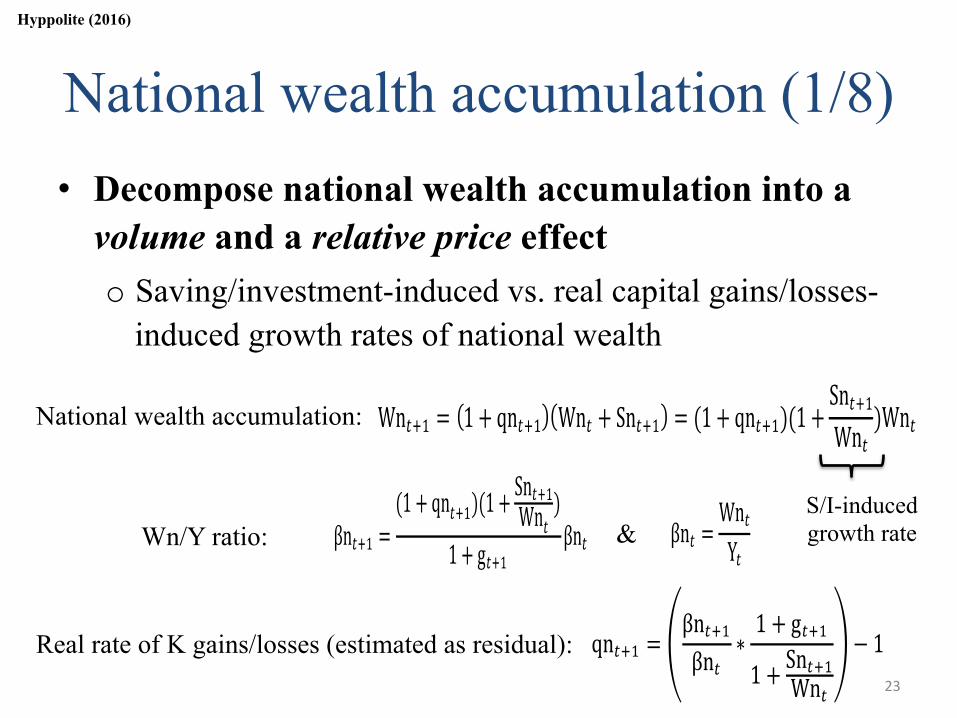
National wealth accumulation (1/8) • Decompose national wealth accumulation into a
volume and a relative price effect o Saving/investment-induced vs. real capital gains/losses-
induced growth rates of national wealth
Wn!!! = 1+ qn!!! Wn! + Sn!!! = (1+ qn!!!)(1+Sn!!!Wn! )Wn! !
βn!!! =(1+ qn!!!)(1+ Sn!!!Wn! )
1+ g!!! βn! ! βn! =Wn!Y! !
qn!!! =βn!!!βn! ∗ 1+ g!!!
1+ Sn!!!Wn!− 1!
Hyppolite (2016)
&
National wealth accumulation:
Wn/Y ratio:
Real rate of K gains/losses (estimated as residual):
S/I-induced growth rate
23
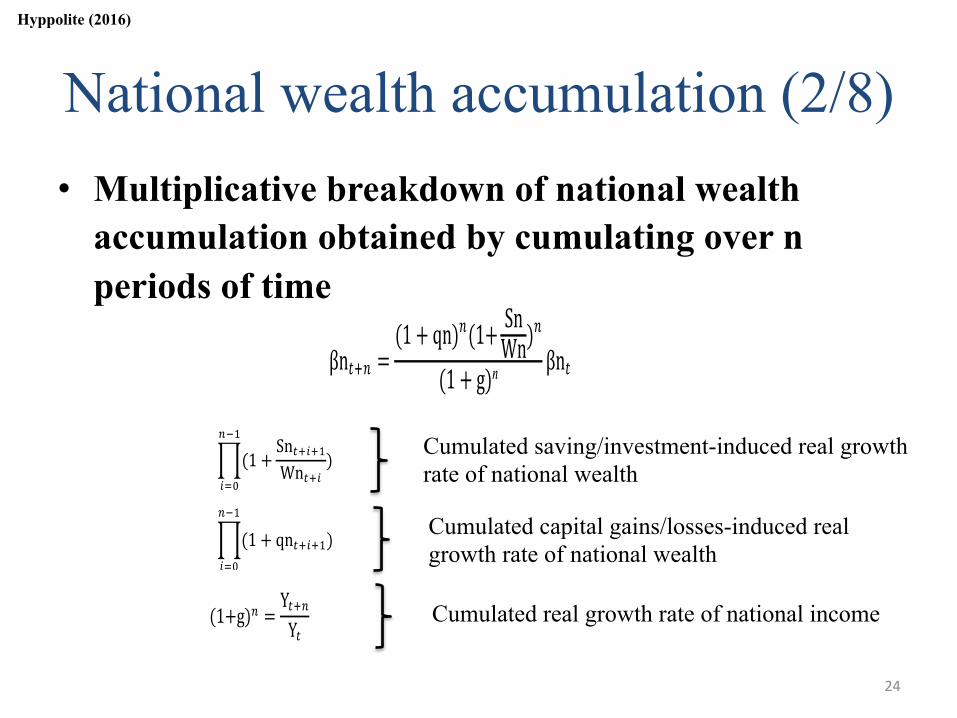
National wealth accumulation (2/8) • Multiplicative breakdown of national wealth
accumulation obtained by cumulating over n periods of time
βn!!! =(1+ qn)!(1+ Sn
Wn)!
(1+ g)! βn! !
(1+ Sn!!!!!Wn!!!
!!!
!!!)!
(1+ qn!!!!!)!!!
!!!!
(1+g)! = Y!!!Y! !
Cumulated saving/investment-induced real growth rate of national wealth
Cumulated capital gains/losses-induced real growth rate of national wealth
Cumulated real growth rate of national income
Hyppolite (2016)
24
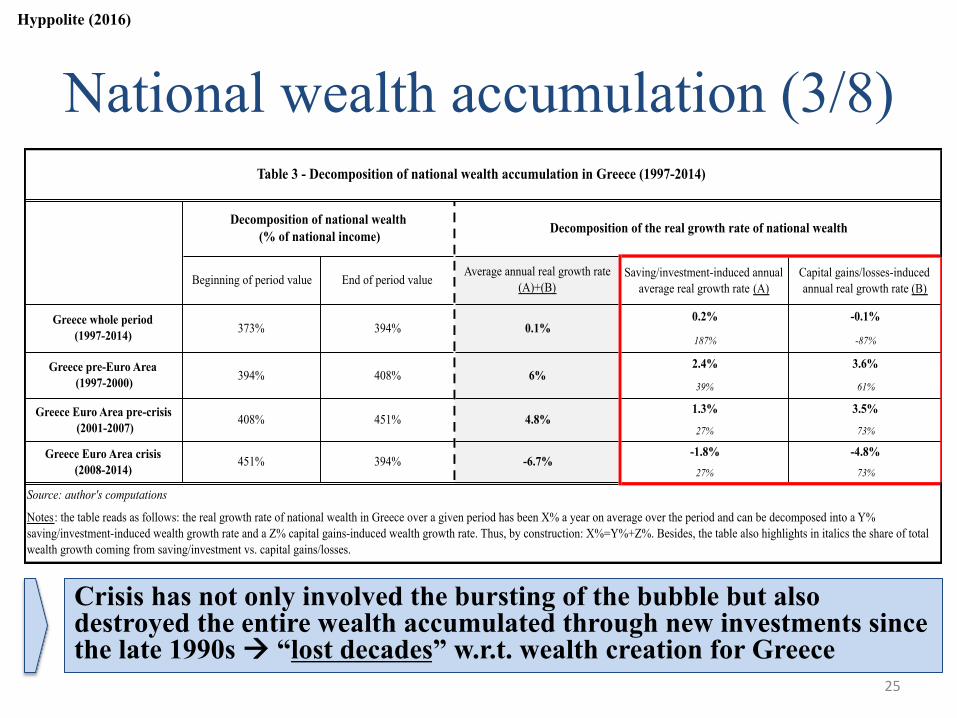
National wealth accumulation (3/8)
Source: author's computations
Notes: the table reads as follows: the real growth rate of national wealth in Greece over a given period has been X% a year on average over the period and can be decomposed into a Y% saving/investment-induced wealth growth rate and a Z% capital gains-induced wealth growth rate. Thus, by construction: X%=Y%+Z%. Besides, the table also highlights in italics the share of total wealth growth coming from saving/investment vs. capital gains/losses.
Greece Euro Area crisis (2008-2014)
451% 394% -6.7%-1.8% -4.8%
27% 73%
Greece Euro Area pre-crisis (2001-2007)
408% 451% 4.8%1.3% 3.5%
27% 73%
Greece pre-Euro Area (1997-2000) 394% 408% 6%
2.4% 3.6%
39% 61%
Greece whole period (1997-2014) 373% 394% 0.1%
0.2% -0.1%
187% -87%
Table 3 - Decomposition of national wealth accumulation in Greece (1997-2014)
Decomposition of national wealth (% of national income) Decomposition of the real growth rate of national wealth
Beginning of period value End of period valueAverage annual real growth rate
(A)+(B)Saving/investment-induced annual
average real growth rate (A)Capital gains/losses-induced annual real growth rate (B)
Crisis has not only involved the bursting of the bubble but also destroyed the entire wealth accumulated through new investments since the late 1990s à “lost decades” w.r.t. wealth creation for Greece
Hyppolite (2016)
25
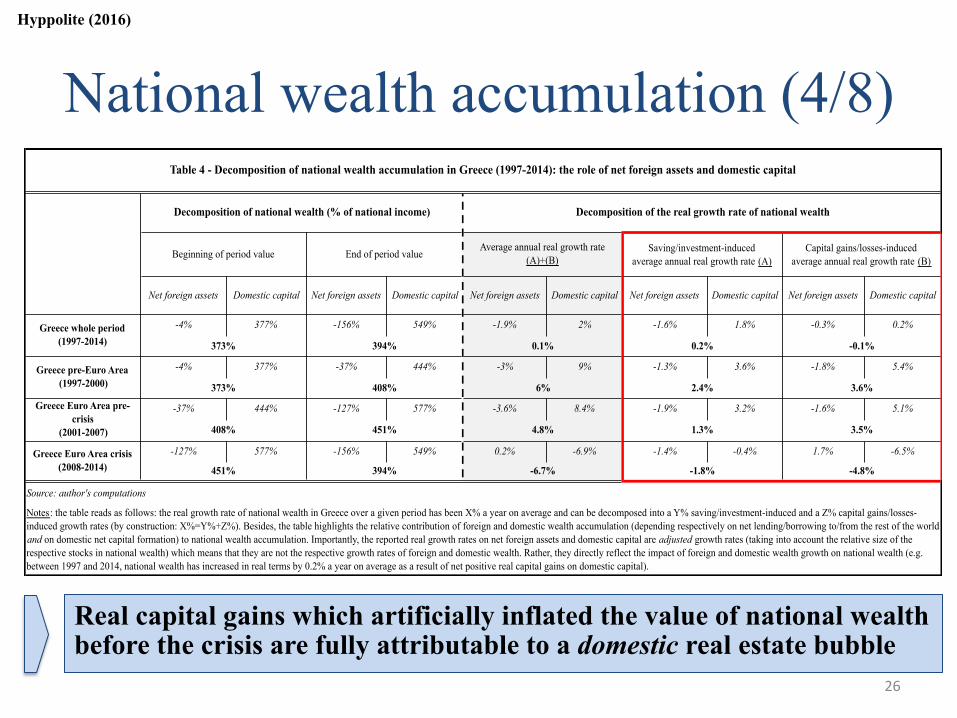
National wealth accumulation (4/8)
Real capital gains which artificially inflated the value of national wealth before the crisis are fully attributable to a domestic real estate bubble
Net foreign assets Domestic capital Net foreign assets Domestic capital Net foreign assets Domestic capital Net foreign assets Domestic capital Net foreign assets Domestic capital
-4% 377% -156% 549% -1.9% 2% -1.6% 1.8% -0.3% 0.2%
-4% 377% -37% 444% -3% 9% -1.3% 3.6% -1.8% 5.4%
-37% 444% -127% 577% -3.6% 8.4% -1.9% 3.2% -1.6% 5.1%
-127% 577% -156% 549% 0.2% -6.9% -1.4% -0.4% 1.7% -6.5%
-0.1%
Table 4 - Decomposition of national wealth accumulation in Greece (1997-2014): the role of net foreign assets and domestic capital
Decomposition of national wealth (% of national income) Decomposition of the real growth rate of national wealth
Beginning of period value End of period valueAverage annual real growth rate
(A)+(B)Saving/investment-induced
average annual real growth rate (A)Capital gains/losses-induced
average annual real growth rate (B)
Greece whole period (1997-2014) 373% 394% 0.1% 0.2%
3.5%
Greece pre-Euro Area (1997-2000) 373% 408% 6% 2.4% 3.6%
Greece Euro Area pre-crisis
(2001-2007) 408% 451% 4.8% 1.3%
Source: author's computations
Notes: the table reads as follows: the real growth rate of national wealth in Greece over a given period has been X% a year on average and can be decomposed into a Y% saving/investment-induced and a Z% capital gains/losses-induced growth rates (by construction: X%=Y%+Z%). Besides, the table highlights the relative contribution of foreign and domestic wealth accumulation (depending respectively on net lending/borrowing to/from the rest of the world and on domestic net capital formation) to national wealth accumulation. Importantly, the reported real growth rates on net foreign assets and domestic capital are adjusted growth rates (taking into account the relative size of the respective stocks in national wealth) which means that they are not the respective growth rates of foreign and domestic wealth. Rather, they directly reflect the impact of foreign and domestic wealth growth on national wealth (e.g. between 1997 and 2014, national wealth has increased in real terms by 0.2% a year on average as a result of net positive real capital gains on domestic capital).
Greece Euro Area crisis (2008-2014) 451% 394% -6.7% -1.8% -4.8%
Hyppolite (2016)
26
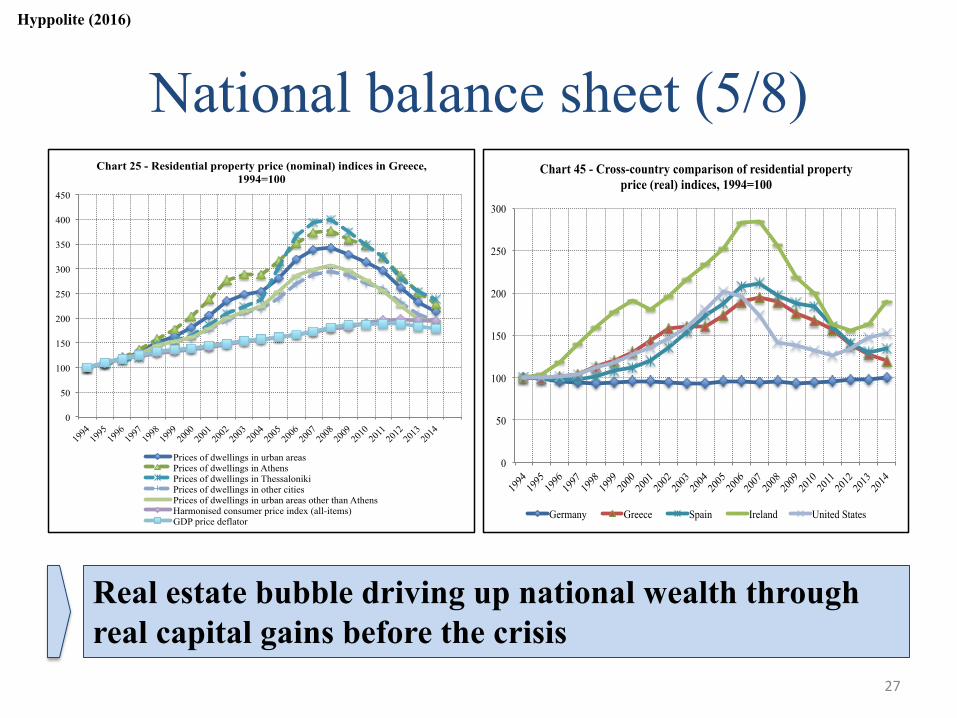
National balance sheet (5/8)
Real estate bubble driving up national wealth through real capital gains before the crisis
0
50
100
150
200
250
300
350
400
450
1994
19
95 19
96 19
97 19
98 19
99 20
00 20
01 20
02 20
03 20
04 20
05 20
06 20
07 20
08 20
09 20
10 20
11 20
12 20
13 20
14
Chart 25 - Residential property price (nominal) indices in Greece, 1994=100
Prices of dwellings in urban areas Prices of dwellings in Athens Prices of dwellings in Thessaloniki Prices of dwellings in other cities Prices of dwellings in urban areas other than Athens Harmonised consumer price index (all-items) GDP price deflator
0
50
100
150
200
250
300
1994
19
95 19
96 19
97 19
98 19
99 20
00 20
01 20
02 20
03 20
04 20
05 20
06 20
07 20
08 20
09 20
10 20
11 20
12 20
13 20
14
Chart 45 - Cross-country comparison of residential property price (real) indices, 1994=100
Germany Greece Spain Ireland United States
Hyppolite (2016)
27
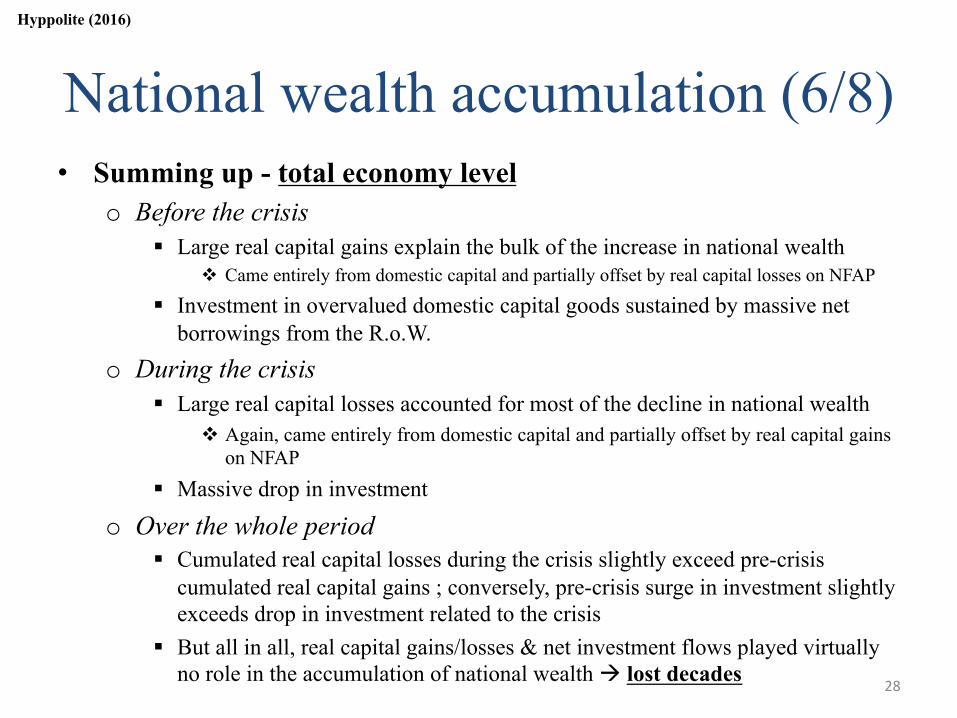
National wealth accumulation (6/8) • Summing up - total economy level
o Before the crisis § Large real capital gains explain the bulk of the increase in national wealth
v Came entirely from domestic capital and partially offset by real capital losses on NFAP
§ Investment in overvalued domestic capital goods sustained by massive net borrowings from the R.o.W.
o During the crisis § Large real capital losses accounted for most of the decline in national wealth
v Again, came entirely from domestic capital and partially offset by real capital gains on NFAP
§ Massive drop in investment
o Over the whole period § Cumulated real capital losses during the crisis slightly exceed pre-crisis
cumulated real capital gains ; conversely, pre-crisis surge in investment slightly exceeds drop in investment related to the crisis
§ But all in all, real capital gains/losses & net investment flows played virtually no role in the accumulation of national wealth à lost decades
Hyppolite (2016)
28
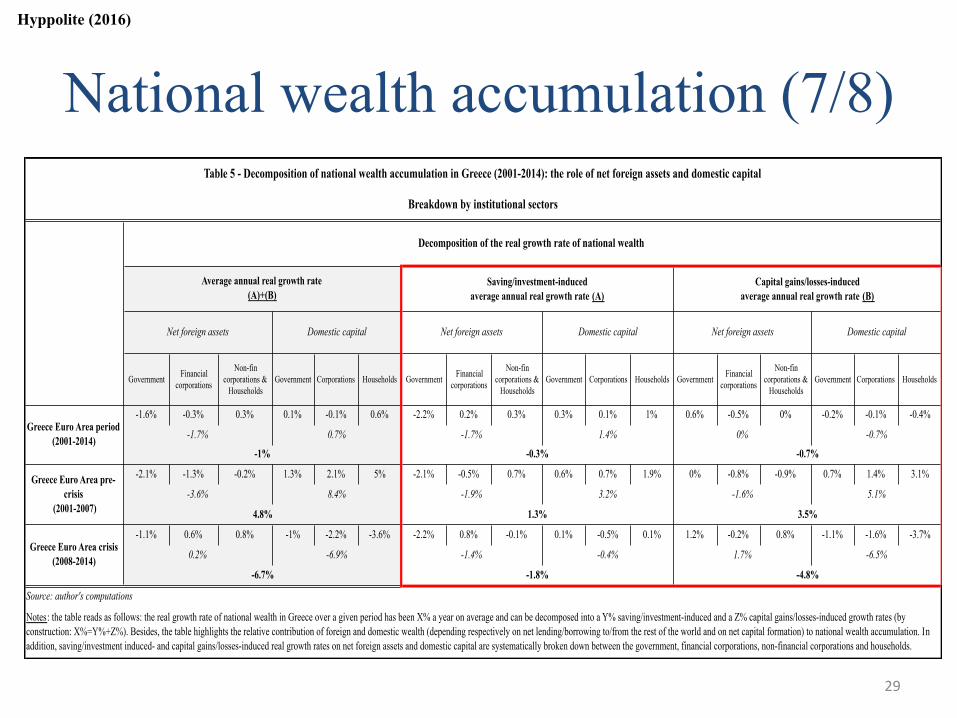
National wealth accumulation (7/8)
Government Financial corporations
Non-fin corporations &
HouseholdsGovernment Corporations Households Government Financial
corporations
Non-fin corporations &
HouseholdsGovernment Corporations Households Government Financial
corporations
Non-fin corporations &
HouseholdsGovernment Corporations Households
-1.6% -0.3% 0.3% 0.1% -0.1% 0.6% -2.2% 0.2% 0.3% 0.3% 0.1% 1% 0.6% -0.5% 0% -0.2% -0.1% -0.4%
-2.1% -1.3% -0.2% 1.3% 2.1% 5% -2.1% -0.5% 0.7% 0.6% 0.7% 1.9% 0% -0.8% -0.9% 0.7% 1.4% 3.1%
-1.1% 0.6% 0.8% -1% -2.2% -3.6% -2.2% 0.8% -0.1% 0.1% -0.5% 0.1% 1.2% -0.2% 0.8% -1.1% -1.6% -3.7%
Domestic capitalNet foreign assets Domestic capital Net foreign assets Domestic capital Net foreign assets
Table 5 - Decomposition of national wealth accumulation in Greece (2001-2014): the role of net foreign assets and domestic capital
Breakdown by institutional sectors
Decomposition of the real growth rate of national wealth
Average annual real growth rate (A)+(B)
Saving/investment-induced average annual real growth rate (A)
Capital gains/losses-induced average annual real growth rate (B)
-0.7%
-1% -0.3% -0.7%
Greece Euro Area pre-crisis
(2001-2007)-3.6% 8.4% -1.9% 3.2% -1.6%
Greece Euro Area period (2001-2014) -1.7% 0.7% -1.7% 1.4% 0%
Notes: the table reads as follows: the real growth rate of national wealth in Greece over a given period has been X% a year on average and can be decomposed into a Y% saving/investment-induced and a Z% capital gains/losses-induced growth rates (by construction: X%=Y%+Z%). Besides, the table highlights the relative contribution of foreign and domestic wealth (depending respectively on net lending/borrowing to/from the rest of the world and on net capital formation) to national wealth accumulation. In addition, saving/investment induced- and capital gains/losses-induced real growth rates on net foreign assets and domestic capital are systematically broken down between the government, financial corporations, non-financial corporations and households.
5.1%
4.8% 1.3% 3.5%
Greece Euro Area crisis (2008-2014) 0.2% -6.9% -1.4% -0.4% 1.7% -6.5%
-6.7% -1.8% -4.8%
Source: author's computations
Hyppolite (2016)
29
National wealth accumulation (8/8) • Summing up - sectoral level
o Before the crisis § Households were the primary beneficiaries from real capital gains on
domestic capital and also the main driver of investment § Gov. and corp. contributed to domestic capital accumulation in roughly
similar proportion in terms of net investment flows à distinctive feature of Greece compared to other periphery countries (more later)
§ Rise in external indebtedness mostly driven by gov. and banks in terms of flows and by the private sector at large in terms of real capital losses
o During the crisis § Persistent external borrowings by gov. (official bailouts) but sharp
adjustment by banks (drying-up of interbank market) § Real capital gains on NFAP concentrated on gov. (tradable debt) and
corporations (equity) § Prolonged investment slump in the private sector but also, though to a
lesser extent, in the public sector
Hyppolite (2016)
30
The Greek crisis: not such an exception after all?
31
The Greek crisis: not such an exception after all? (1/6)
• So Greek crisis appears as a classic B.o.P. crisis like in Spain or Ireland à comprehensive view of the euro crisis
Excess saving in core countries à regional real estate bubble in periphery countries due to capital flows à wealth effect and national saving rates go
down in periphery countries à further borrowings from the R.o.W. to finance investment in overvalued assets à sudden stop when foreign creditors realize that value of debt > value of assets à bursting of the
bubble and sharp adjustment
• The main difference between Greece vs. Ireland and Spain relates to the sectors that borrowed from the R.o.W. to keep the investment rate constant, namely the public vs. the private sector
Hyppolite (2016)
32
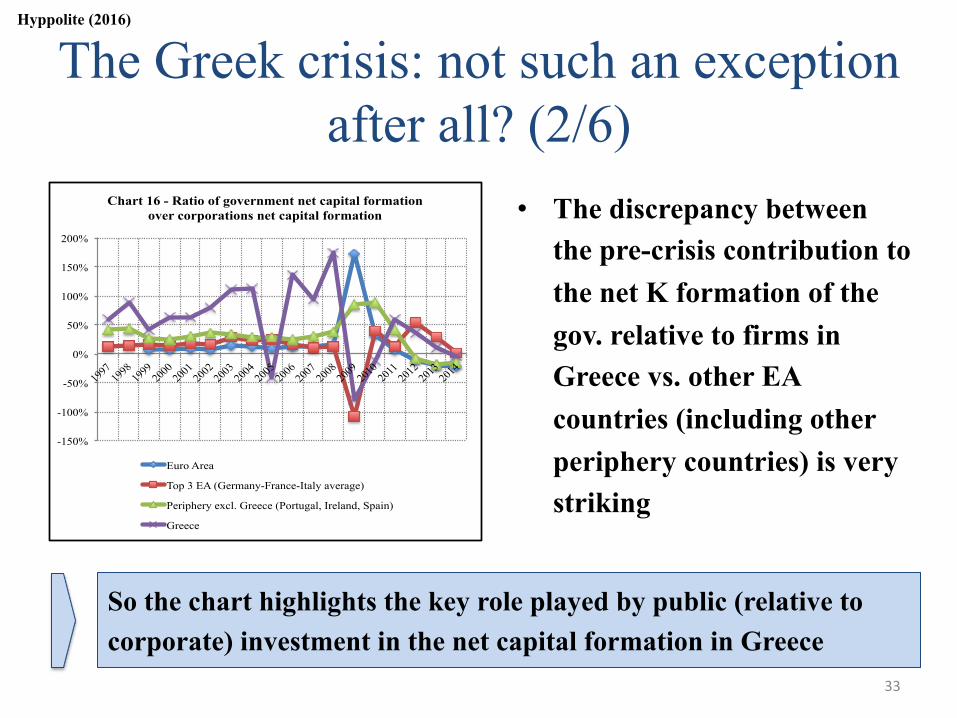
The Greek crisis: not such an exception after all? (2/6)
Hyppolite (2016)
So the chart highlights the key role played by public (relative to corporate) investment in the net capital formation in Greece
• The discrepancy between the pre-crisis contribution to the net K formation of the gov. relative to firms in Greece vs. other EA countries (including other periphery countries) is very striking
-150%
-100%
-50%
0%
50%
100%
150%
200%
1997
19
98 19
99 20
00 20
01 20
02 20
03 20
04 20
05 20
06 20
07 20
08 20
09 20
10 20
11 20
12 20
13 20
14
Chart 16 - Ratio of government net capital formation over corporations net capital formation
Euro Area
Top 3 EA (Germany-France-Italy average)
Periphery excl. Greece (Portugal, Ireland, Spain)
Greece
33
The Greek crisis: not such an exception after all? (3/6)
• Two specific features of the Greek economy might explain the difference between the Greek vs. Spanish & Irish crises o Small size of Greek firms à credit-constraints because low
level of national saving combined with limited international market access
o Great size of the public sector à strong incentives to invest and address the drop in corporate investment
Asymmetric shock in terms of funding costs
following entry into the monetary union and stepping-in of the government
Hyppolite (2016)
34
The Greek crisis: not such an exception after all? (4/6)
• Does the stepping-in theory make sense? o Need to check that public investments carried out over the pre-crisis period could have been made by the
corporate sector i.e. notably that public investments were not public or quasi-public goods (e.g. national defense, sewer systems, public parks, public roads…)
o Very difficult to assess in practice because we have no detailed breakdown of the government portfolio by types of assets over the whole period…
§ What we do know, though: v The value of government assets increased over the pre-crisis period because of investments in fixed assets v The government fixed assets portfolio is composed for about 60% of public infrastructures, 19% of machinery and weapon
systems and 16% of non-residential buildings
o … plus, by essence, the distinction between quasi-public goods and classic capital goods can be very fuzzy when it comes to public infrastructure (e.g. roads, railways, airfield runways, bridges, tunnels, subways, dams, pipelines, communication or power lines etc.)…
o … and finally even leaving aside the question of quasi-public goods, it is very tricky to say with certainty if a particular public investment in infrastructure could have been carried out by the private sector à no counterfactual, see e.g.
§ Investments directly related to the Olympics (e.g. stadiums, swimming-pools…): YES or NO? § Early 2000s large-scale public investment in transportation infrastructure around Athens: YES or NO?
v Athens Metro system (expansion/modernization), new metropolitan light rail system (the “Athens Tram”), new suburban railway system linking the airport and the suburban towns of Athens (the “Proastiakos”), new motorway encircling Athens (the “Attiki Odos”)…
à The least one can say is that more public-private partnerships could well have been contemplated…
Hyppolite (2016)
35
The Greek crisis: not such an exception after all? (5/6)
• Fiscal issue does not matter? o Of course it does but it is not quite that simple…
§ Extreme view: it is all about fiscal indiscipline (increase in gov. final consumption expenditure + overinvestment) à public investment is simply another facet of fiscal slippage
§ Moderate view: B.o.P. issue in the background combined with domestic firms’ credit constraints à stepping-in of the gov. + fiscal indiscipline related to the increase in gov. final consumption expenditure
v Note that what is really specific to Greece compared to other periphery countries is not the increase in gov. final consumption expenditure per se, but rather the gov. inability to raise revenues at the same pace (tax evasion & fraud, mismanagement of public assets…)
à In the end, it is all about whether or not we believe in the stepping-in theory
Hyppolite (2016)
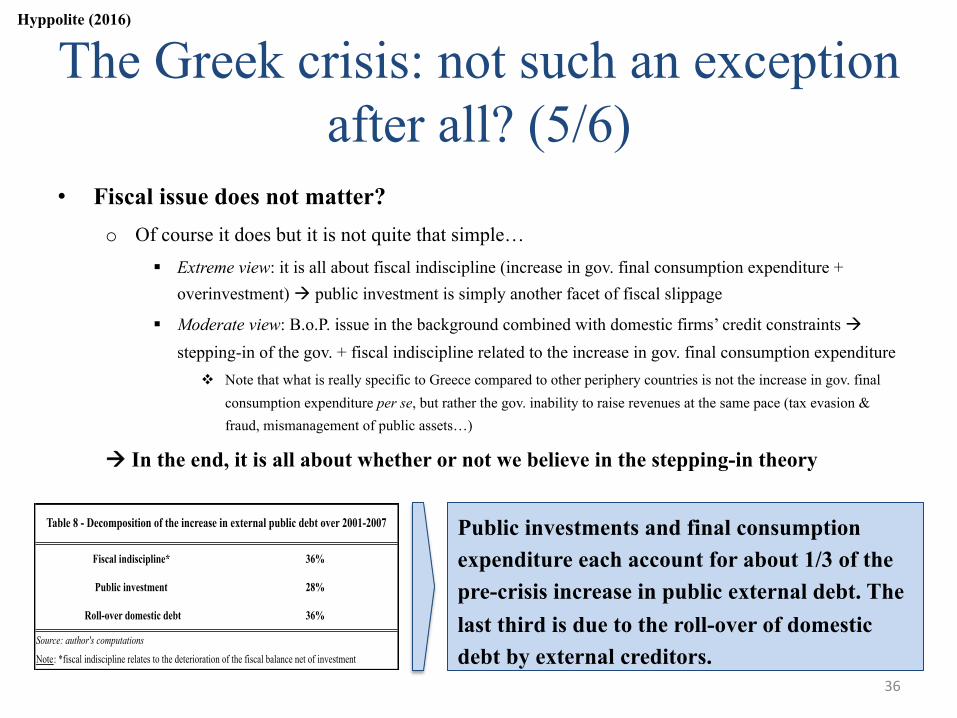
Public investments and final consumption expenditure each account for about 1/3 of the pre-crisis increase in public external debt. The last third is due to the roll-over of domestic debt by external creditors. Note: *fiscal indiscipline relates to the deterioration of the fiscal balance net of investment
36%
28%
36%
Table 8 - Decomposition of the increase in external public debt over 2001-2007
Fiscal indiscipline*
Public investment
Roll-over domestic debt
Source: author's computations
36
The Greek crisis: not such an exception after all? (6/6)
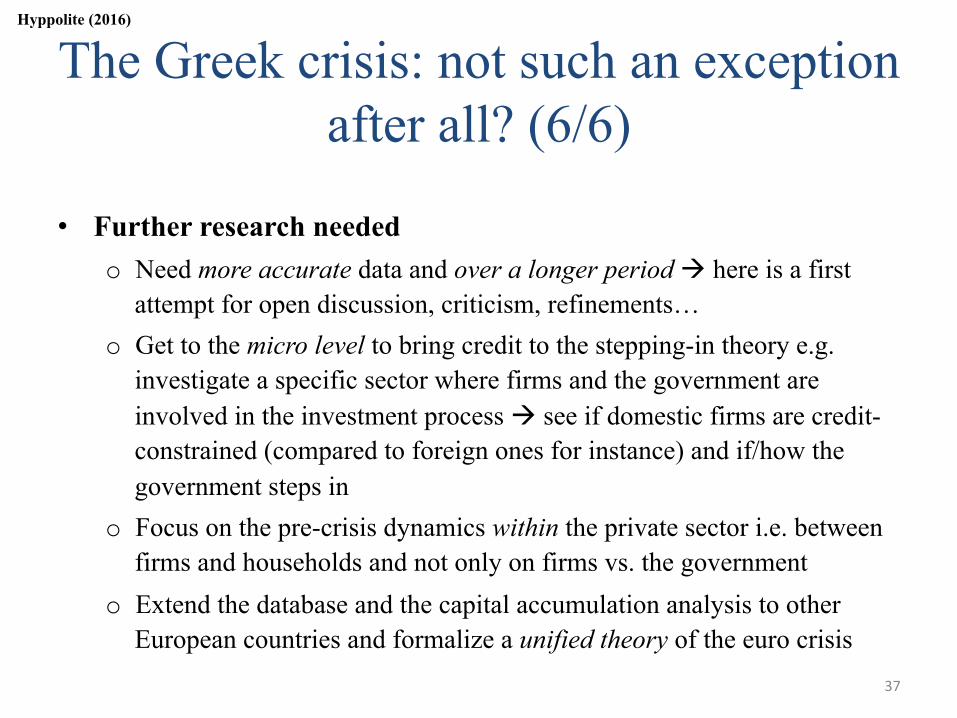
• Further research needed o Need more accurate data and over a longer period à here is a first
attempt for open discussion, criticism, refinements… o Get to the micro level to bring credit to the stepping-in theory e.g.
investigate a specific sector where firms and the government are involved in the investment process à see if domestic firms are credit-constrained (compared to foreign ones for instance) and if/how the government steps in
o Focus on the pre-crisis dynamics within the private sector i.e. between firms and households and not only on firms vs. the government
o Extend the database and the capital accumulation analysis to other European countries and formalize a unified theory of the euro crisis
Hyppolite (2016)
37
Policy implications
38
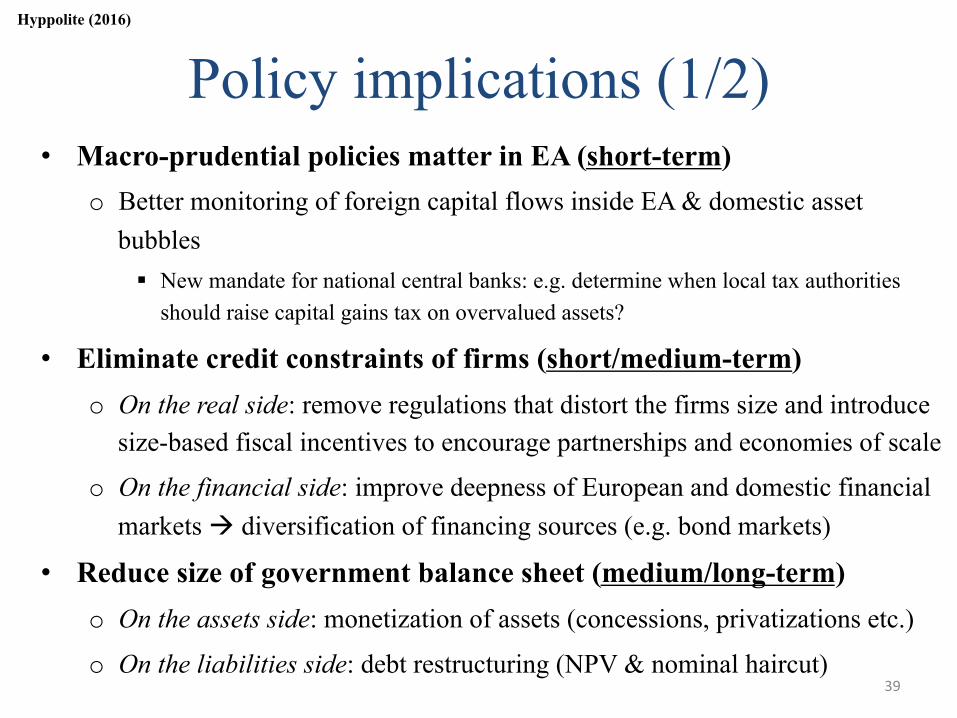
Policy implications (1/2) • Macro-prudential policies matter in EA (short-term)
o Better monitoring of foreign capital flows inside EA & domestic asset bubbles § New mandate for national central banks: e.g. determine when local tax authorities
should raise capital gains tax on overvalued assets?
• Eliminate credit constraints of firms (short/medium-term) o On the real side: remove regulations that distort the firms size and introduce
size-based fiscal incentives to encourage partnerships and economies of scale
o On the financial side: improve deepness of European and domestic financial markets à diversification of financing sources (e.g. bond markets)
• Reduce size of government balance sheet (medium/long-term) o On the assets side: monetization of assets (concessions, privatizations etc.)
o On the liabilities side: debt restructuring (NPV & nominal haircut)
Hyppolite (2016)
39
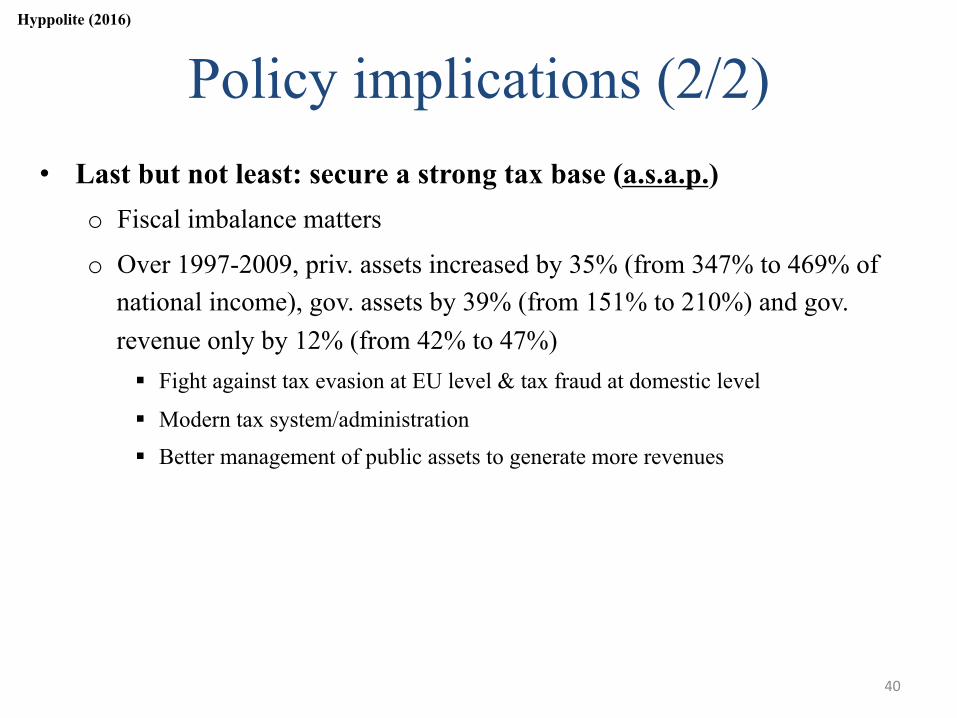
Policy implications (2/2) • Last but not least: secure a strong tax base (a.s.a.p.)
o Fiscal imbalance matters
o Over 1997-2009, priv. assets increased by 35% (from 347% to 469% of national income), gov. assets by 39% (from 151% to 210%) and gov. revenue only by 12% (from 42% to 47%) § Fight against tax evasion at EU level & tax fraud at domestic level
§ Modern tax system/administration
§ Better management of public assets to generate more revenues
Hyppolite (2016)
40
For more details, working paper online:
http://piketty-backend.pse.ens.fr/files/Hyppolite2016.pdf
Hyppolite P-A (2016), “Towards a theory on the
causes of the Greek crisis: an investigation of national balance sheet data (1997-2014)”
Contact: [email protected]
41