Embed Size (px)
Citation preview

TOWARDS A
SUSTAINABLEFUTURE
SUSTAINABILITY REPORT FY13

02 CEO foreword 04 Preface06 NEA at a glance for FY2013
08 TOWARDS A SUSTAINABLE ORGANISATION10 Introduction10 Our mandate10 Corporate governance12 NEA’s organisation chart15 Sustainability in our public initiatives19 Managing our risk22 Managing our corporate sustainability
26 TOWARDS GREATER SUSTAINABILITY MILESTONES28 Monitoring our sustainability efforts28 An analysis of our current situation30 Our material issues31 Awards and benchmarks
34 TOWARDS A SUSTAINABLE ENVIRONMENT36 Sustaining our environment36 Pollution control38 Resource conservation
48 TOWARDS BETTER SOCIAL SUSTAINABILITY50 Sustaining our workplace50 Workplace safety and health53 People excellence64 Community outreach: incorporating a caring culture into NEA
70 TOWARDS BETTER SUSTAINABLE GROWTH72 Sustaining our finances72 Our finances72 Our supply chain73 Innovation and productivity
76 GRI G4 CONTENT INDEX FOR ‘IN ACCORDANCE’ - CORE
CONTENTS

02 NEA SUSTAINABILITY REPORT FY13CEO FOREWORD
In 2009, the Government released the Sustainable Singapore Blueprint (SSB) which seeks to transform Singapore into a more liveable and sustainable city and achieve economic growth without compromising on the quality of our living environment. Five years on, the Blueprint was reviewed and launched in November 2014, outlining our national vision and plans for a more liveable and sustainable Singapore – a liveable and endearing home, a vibrant and sustainable city, an active and gracious community.
The second Blueprint is a plan for action and provides all of us with a unique opportunity to work together to create a better home, a better environment and a better future that citizens can all be proud of. In line with one of the SSB aims to make Singapore’s economy greener, businesses are encouraged to embrace environmental sustainability in their daily operations.
EMBRACING SUSTAINABILITY AS AN ORGANISATIONSimilar to private organisations, public agencies such as the National Environment Agency (NEA), have an important role to play in Singapore’s
sustainability plans. Being a responsible corporate citizen, NEA embeds sustainability in our day-to-day work. We believe that embracing sustainability not only benefits the environment that we operate in, but also enables us to increase our productivity and effectiveness. In an era of resource scarcity and consideration for environmental and social impact, it is vital for us to rethink and restructure to factor in these perspectives. We believe that embracing sustainability presents opportunities for us to collaborate for growth as well as tackle the challenges of climate change and other environmental problems effectively.
OUR THIRD SUSTAINABILITY REPORTAdopting Sustainability Reporting allows NEA to be transparent and accountable in our work and address its corporate environmental and social impact. Our FY2013 sustainability report was drafted ‘in accordance with the GRI G4 Guidelines – Core option and was submitted for the GRI Materiality Disclosures Service, and GRI confirmed the correctness of the locations of the G4 materiality disclosures [G4-17 to G4-27]. This report is user-friendly and provides updates on our sustainability efforts.
CEO FOREWORD
WE HOPE OUR INITIATIVES WOULD INSPIRE THE BUSINESS COMMUNITY TO JOIN IN THE SUSTAINABILITY JOURNEY AND EMBRACE SUSTAINABLE BUSINESS OPERATIONS
CEO FOREWORDNEA SUSTAINABILITY REPORT FY13 03
STEPS TAKEN IN OUR SUSTAINABILITY JOURNEYWe have introduced various initiatives within NEA to promote environmental awareness among staff and instil sustainability practices. A good example is our ‘8 Effective Habits - 10% Challenge’ campaign which aims to reduce our electricity, water and paper consumption by 10% in FY2016, from FY2011 levels. Other steps include procuring environmentally-friendly products and office equipment, implementing environmentally-friendly best practices in our corporate events, leveraging technology as well as encouraging innovation through idea incubation.
We have also enhanced our workplace safety and health programmes to cover NEA’s diverse operations risks and cultivated a risk culture within the organisation. NEA ensures fair employment and aligns our work polices with the principles of the Tripartite Alliance for Fair & Progressive Employment Practices. We have also refined our HR policies and strategies to drive work-life balance and encourage continual learning. As such, we have established a robust work-life harmony framework to meet the needs of staff holistically and provide various learning opportunities for staff. In addition, NEA strives to create a caring culture by nurturing our people and engaging them to become champions of the environment who give back to the community.
In NEA, we believe integrating environmental and social considerations in our operations is essential as it allows us to achieve financial sustainability. For example, our environmental initiatives such as resource conservation and pollution control have enabled NEA to reduce our operational cost and avoid unnecessary financial penalties. Additionally, we believe our robust work-life harmony framework and diverse learning and development opportunities will not only help us attract and retain employees but also improve their productivity. Similarly, enhancing our workplace safety and health initiatives and putting in place a proper risk management system can also reduce any financial implications.
NEA also adopts financial sustainability initiatives such as ensuring responsible procurement, operations and investment decisions. We constantly encourage innovation for sustainability and explore the possibility of leveraging technology. Through these measures, we hope to reap savings and benefits for our organisation and stakeholders as well as bring impactful changes for greater resource-efficiency.
OUR FY2013 SUSTAINABILITY PERFORMANCE & ACHIEVEMENTSI am heartened that our firm commitment and efforts have borne fruit. With our ‘8 Effective Habits - 10% Challenge’ campaign, we are making good progress towards meeting our FY2016 targets for reduction in our electricity,
water and paper consumption. All our 18 premises have attained the Eco-Office certification and are in compliance with the Public Sector Taking the Lead in Environmental Sustainability (PSTLES) requirements.
NEA has maintained a low resignation rate of 5.5%, which is lower than the statutory board average of 7% in 2013. NEA has also emerged as one of the leading employers in the 2013 Singapore’s 100 Leading Graduate Employers survey and we were conferred eight HR awards at the Singapore Human Resources Institute (SHRI) HR Awards 2013. NEA is ISO 9001 certified and our key installations have also attained the ISO 14001 certification. In addition, our fundraising activities to support charitable causes have been successful; we raised a total of $329,000 in FY2013.
MOVING FORWARDMoving forward, as a leading agency that adopts sustainable practices within the organisation for the benefit of our environment, economy and community, we will continue to review our plans and strategies in order to continue improving ourselves. We hope our initiatives would inspire the business community to join in the sustainability journey and embrace sustainable business operations. In addition, we look forward to collaborating with our partners in the journey of sustainability.
Ronnie TayChief Executive OfficerNational Environment Agency
04 NEA SUSTAINABILITY REPORT FY13PREFACE
Formed on 1 July 2002, the National Environment Agency (NEA) is the public organisation responsible for improving and sustaining a clean and green environment in Singapore.
NEA develops and spearheads environmental initiatives and programmes through its partnership with the People, Public and Private (3P) sectors. It is committed to motivating every individual to take up environmental ownership and care for the environment as a way of life.
By protecting Singapore’s environment from pollution, maintaining a high level of public health, encouraging resource efficiency and conservation and providing timely meteorological information, NEA endeavours to ensure sustainable development and a quality living environment for present and future generations.
As of end FY2013 (31 March 2014), NEA has 3,841 employees in 15 different divisions and offices, which are governed by a 12-member Board of Directors. Within NEA, some divisions focus on singular responsibilities, and others focus on multiple ones:
1. 3P Network Division (3PND)2. Corporate Services and Development Division (CSDD)3. Environmental Protection Division (EPD)4. Environmental Public Health Division (EPHD)5. Environment Technology Office (ETO)6. Hawker Centres Division (HCD)7. Human Resource Division (HRD)8. Industry Development & Promotion Office (IDPO)9. Joint Operations & Planning Division (JOPD)10. Meteorological Service Singapore (MSS)11. Policy and Planning Division (PPD)12. Service Quality Division (SQD)13. Singapore Environment Institute (SEI)14. Strategic Development & Transformation Office (SDTO)15. Sustainability Office (SO)
NEA has a diverse nature of work, with the following key programmes underpinning NEA’s mission to ensure the sustainability of Singapore’s natural and urban environments:
• 3P (People, Public and Private) Partnership• Energy Efficiency
• Environmental Training• Industry Development and Promotion• Management of Hawker Centres• Meteorological Services• Prevention and Control of Vector-borne Diseases• Pollution Control• Public Hygiene and Cleanliness• Radiation Protection and Nuclear Safety• Solid Waste Management
OUR APPROACH FOR THIS REPORT [G4-18, G4-26]This sustainability report was prepared using the GRI G4 Guidelines and was submitted for the GRI Materiality Disclosures Service, and GRI confirmed the correctness of the locations of the G4 materiality disclosures [G4-17 to G4-27].
There are no significant changes in the measurement methodology in this report from NEA’s Sustainability Report FY2012. More information about our sustainability reporting is available online at www.nea.gov.sg.
Our sustainability report is an annual publication about how we engage our employees in our undertakings to encourage sustainability within NEA. It focuses on our organisation’s social, environmental and financial impact from our daily operations which we directly control and influence, and highlights our internal framework, policies, processes and initiatives in driving sustainability. [G4-18]
More importantly, this report gives our stakeholders a clear review of our performance in sustainability, which is substantiated by key performance indicators. This is a separate report from the NEA annual report 2013/14, which is a comprehensive report detailing our organisation’s activities, achievements and financial performance.
NEA’s Sustainability Report FY2013 is testament to our commitment in achieving our goal of being a leading agency that adopts sustainable practices to benefit our environment, economy and community. It also serves as a foundation to reflect our ongoing sustainability developments, and provides guidance for future progression.
We hope this will become a useful reference tool for other organisations and government agencies, inspiring them to embark on their own journey of sustainability.
PREFACE

PREFACENEA SUSTAINABILITY REPORT FY13 05
REPORTING PERIOD AND SCOPE [G4-17]NEA’s sustainability report documents the organisation’s key internal sustainability performance in FY2013 (1 April 2013 to 31 March 2014), covering operations of the 18 key premises which comprise 12 NEA office premises and six industrial premises:
Our 12 Office PremisesThese are categorised into seven NEA stand-alone office premises and five NEA tenanted office premises:
• Stand-alone Office Premises– Centre for Climate Research Singapore (CCRS) at Kim Chuan Road– Department of Public Cleanliness (DPC)1 at Neythal Road– Five NEA Regional Offices (ROs): North-East (NERO), North-West
(NWRO), Central (CRO), South-East (SERO) and South-West (SWRO)
• Tenanted Office Premises– Environmental Health Institute (EHI) at the Helios Building in Biopolis– Hawker Centres Division (HCD) at the HDB Hub– Meteorological Services Singapore (MSS) at Changi Airport
– NEA Headquarters at the Environment Building– Singapore Environment Institute (SEI)
Our Six Industrial Premises– Choa Chu Kang Crematorium & Columbarium and Cemetery (CCKCCC)– Mandai Crematorium and Columbarium (MCC)– Semakau Landfill (SL)– Tuas Marine Transfer Station (TMTS)– Two Incineration Plants (IPs): Tuas South (TSIP) and Tuas (TIP)
Note: The consumption data for the hawker centres currently managed by NEA are not included in the scope of this report.
ENQUIRIESAs part of NEA’s environmental conservation efforts, only limited copies of this report will be printed. The soft copies of the past and current sustainability reports can be found on our website: www.nea.gov.sg. Your feedback is appreciated, and will help us improve our sustainability efforts. To give us your feedback, please contact the NEA Sustainability Office through our NEA Call Centre via 1800-CALL NEA (1800-2255 632) or [email protected].
1 DPC also resides in SERO and HDB Hub.
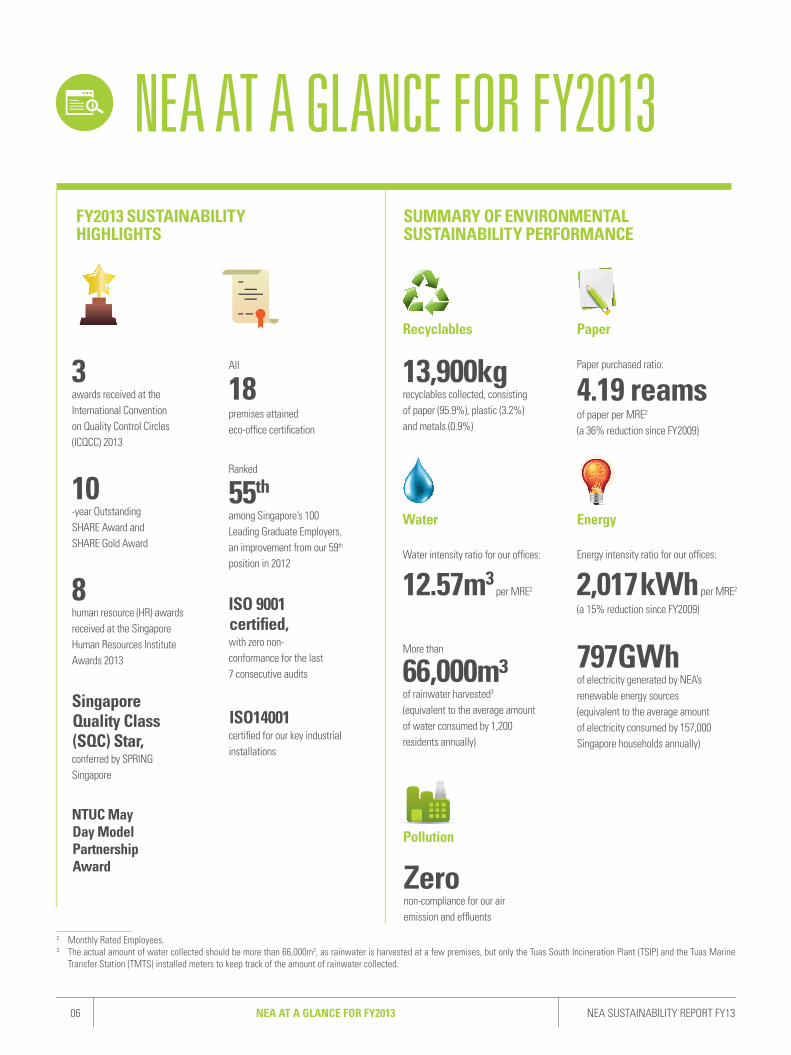
06 NEA SUSTAINABILITY REPORT FY13NEA AT A GLANCE FOR FY2013
NEA AT A GLANCE FOR FY2013
All
18 premises attained eco-office certification
FY2013 SUSTAINABILITY HIGHLIGHTS
Ranked
55th
among Singapore’s 100 Leading Graduate Employers, an improvement from our 59th
position in 2012
8 human resource (HR) awards received at the Singapore Human Resources Institute Awards 2013
10 -year Outstanding SHARE Award and SHARE Gold Award
3 awards received at the International Convention on Quality Control Circles (ICQCC) 2013
NTUC May Day Model Partnership Award
ISO 9001 certified, with zero non-conformance for the last 7 consecutive audits
Singapore Quality Class (SQC) Star,conferred by SPRING Singapore
ISO14001 certified for our key industrial installations
Recyclables
SUMMARY OF ENVIRONMENTAL SUSTAINABILITY PERFORMANCE
13,900kg recyclables collected, consisting of paper (95.9%), plastic (3.2%) and metals (0.9%)
Paper
4.19 reamsPaper purchased ratio:
of paper per MRE2 (a 36% reduction since FY2009)
Energy intensity ratio for our offices:
2,017 kWh per MRE2
(a 15% reduction since FY2009)
Energy
797GWh of electricity generated by NEA’s renewable energy sources (equivalent to the average amount of electricity consumed by 157,000 Singapore households annually)
Pollution
Zero non-compliance for our air emission and effluents
Water intensity ratio for our offices:
12.57m3 per MRE2
More than
66,000m³ of rainwater harvested3 (equivalent to the average amount of water consumed by 1,200 residents annually)
Water
2 Monthly Rated Employees.3 The actual amount of water collected should be more than 66,000m3, as rainwater is harvested at a few premises, but only the Tuas South Incineration Plant (TSIP) and the Tuas Marine
Transfer Station (TMTS) installed meters to keep track of the amount of rainwater collected.

NEA AT A GLANCE FOR FY2013NEA SUSTAINABILITY REPORT FY13 07
3,000 suppliers engaged, with 99% of our contracts awarded to local suppliers
Workplace Safety and Health
2 charitieswere adopted – the Children’s Cancer Foundation (CCF) and the Singapore Children’s Society (SCS)
SUMMARY OF FINANCIAL SUSTAINABILITY PERFORMANCE
Community Outreach
142 innovation projects completed, achieving over $2.1 million of annual productivity gains4
SUMMARY OF SOCIAL SUSTAINABILITY PERFORMANCE
0 fatalities, with 73 incident cases reported to NEA’s management
Human Capital
459 new employees, with our most senior new staff being 69 years old
5.5% resignation rate in 2013, which is lower than the statutory-board average of 7% in 2013
57training hours per employee, which is above the recommended industry guide of 40 hours
100%employees were engaged in their performance management review with their supervisors
Supply Chain
Innovation and Productivity
11.1% employee participation rate, with 1,610.5 community hours logged in by 423 staff volunteers
$329,000 in cash contributions from employees
4 Productivity gains refer to gains (cost savings and/or cost avoidance) from productivity improvement projects. Examples of these projects could be a result of automation, process
improvement, quality management, increased customer satisfaction and improved in innovation.


AT NEA, EVERYONE STANDS UNITED IN OUR JOURNEY OF SUSTAINABILITY. TOGETHER, WE BELIEVE WE CAN CREATE A MORE SUSTAINABLE ENVIRONMENT.
TOWARDS A SUSTAINABLE ORGANISATION
10 NEA SUSTAINABILITY REPORT FY13INTRODUCTION
INTRODUCTION
OUR MANDATENEA takes a long-term view to driving environmental sustainability in Singapore. This is reflected in our Vision, Mission and Core Values.
Vision A clean environment: Towards a liveable and sustainable Singapore
MissionTo ensure a clean and sustainable environment for Singapore, together with our partners and the community
Core ValuesFundamental to NEA’s success in realising our Vision and Mission are our five core values. These are NEA’s cornerstone, and they govern the organisation’s best practices as we fulfil our responsibilities and strive for greater excellence in the future:
1. Care – We value each individual and strive to exceed our customers’ expectations.
2. Integrity – We uphold the trust and confidence of others in us.
3. Teamwork – We work as a team and with our partners to achieve common goals.
4. Innovation – We constantly pursue new ideas and creative solutions.
5. Professionalism – We take pride in what we do and strive for excellence.
CORPORATE GOVERNANCELed by Chairman Ms Chew Gek Khim, the Board has established three Board committees to assist in the execution of its responsibilities: the Audit Committee, the Human Resource Committee and the Board Strategy Committee.
Audit CommitteeThe Audit Committee is tasked with assisting the Board in maintaining a high standard of corporate governance, particularly in the areas of financial accounting and reporting and internal control systems. Together with NEA’s external and internal auditors, the annual accounts, audit plans, internal control systems and audit reports are reviewed.
Committee: Mr Ong Chao Choon (Chairman), Ms Lynette Leong, Mr Lee Chuan Seng, and Mr Tan Peng Yam
Gender Allocation:
Human Resource CommitteeThe Human Resource Committee assists the Board of Directors in providing strategic guidance to NEA’s management ensuring that NEA’s human resource practices are fair and forward-looking, so as to attract, motivate, retain and build a future-ready workforce.
Committee: Ms Chew Gek Khim (Chairman) and Mr Ronnie Tay
Gender Allocation:
Board Strategy CommitteeFormed in 2009, the Board Strategy Committee provides strategic guidance to NEA’s management.
Committee: Ms Chew Gek Khim (Chairman), Mr Liak Teng Lit (Deputy Chairman), Mr Ronnie Tay, Mr Ashvinkumar s/o Kantilal, Prof Chia Kee Seng, Mr Han Fook Kwang, and Mr Zainal Bin Sapari
Gender Allocation:
75% male
85.7% male
50% male
50% female
25% female
14.3% female

INTRODUCTIONNEA SUSTAINABILITY REPORT FY13 11
Ms Chew Gek Khim Chairman
National Environment Agency Executive Chairman, Tecity Group
Mr Liak Teng Lit Deputy Chairman
National Environment Agency Group CEO, Alexandra Health System
Mr Ronnie Tay Chief Executive Officer
National Environmental Agency
Prof Chia Kee Seng Dean, Saw Swee Hock School of
Public Health National University of Singapore
Mr Tan Peng Yam Chief Executive
Defence Science & Technology Agency
Mr Zainal Bin Sapari Assistant Secretary General
National Trades Union Congress (NTUC)
Mr Lee Chuan Seng Emeritus Chairman
Beca Asia Holdings Pte Ltd
Mr Han Fook Kwang Editor-at-Large
Singapore Press Holdings
Mr Ashvinkumar s/o Kantilal Group Chief Operating Officer
Ong & Ong Pte Ltd
Mr Ong Chao ChoonPartner,
PricewaterhouseCoopers LLP
INTEGRATION OF NEA’S CORE VALUES IN OUR DRIVE FOR SUSTAINABILITY WITHIN NEASustainability is a core strategy for business excellence in NEA. Through our internal drive for sustainability, NEA aims to further promote our core values, integrating them into our internal sustainability framework, governance structure and initiatives:• Care and Innovation as fundamental values in NEA’s sustainability framework• To ensure Teamwork by emphasising engagement • To uphold Integrity through good corporate governance for sustainability• To ensure Professionalism by benchmarking our efforts in sustainability
Ms Lynette Leong Chin YeeChief Executive Officer
CapitalCommercial Trust Management Ltd
NEA’s Board of DirectorsPlaying an advisory role in NEA’s corporate governance is our 11-member Board of Directors, which provides strategic direction and oversight of NEA’s functions and goals, steering the organisation towards achieving its Vision and Mission.
In addition, the Board is responsible for the appointment of external auditors, which is critical for NEA’s overall governance framework. All in all, the Board comprises individuals with diverse and extensive experience in both the private and public sectors, and is commissioned by the Minister for the Environment and Water Resources. The board members, as of 1 February 2015, are as follows:

12 NEA SUSTAINABILITY REPORT FY13
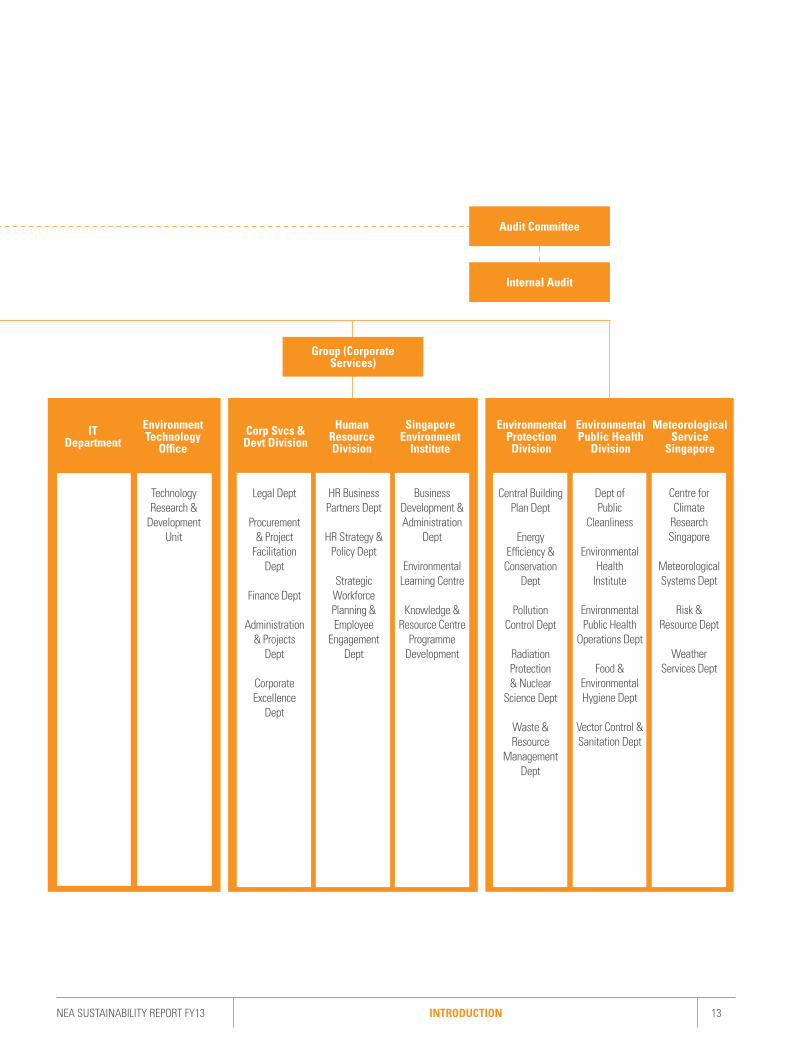
NEA’S ORGANISATION CHART5
5 As of February 2015.
Chief Executive Officer
Deputy CEO
Group (Joint Operations& Technology)
Policy & Planning Division
3PN Division
Hawker Centres Division
Corporate Communications
Department
Strategic Devt &
Transformation Office
Service Quality Division
Industry Devt & Promotion
Office / Sustainability
Office
Joint Operations & Planning
Division
Climate Change
Programme Dept
Public Health & Hawkers Policy
Dept
Environmental Protection Policy Dept
International Relations Dept
Research & Statistics Dept
Strategic Planning Dept
International Law Unit
3PND & Corporate, NGOs &
Marketing Dept
Community & Outreach Dept
Schools & Youth Dept
Planning & Development
Dept
Tenancy Management
& Services Dept
Emergency Preparedness
& CrisisManagement
Dept
Systems Integration
Dept
Transformation, Future Concept of Operations
& Organisation Review Dept
Customer & Quality Service
Dept
Operational Excellence
Dept
Complaints Investigation
Unit
Productivity & Standards
Cluster Development
Resource Planning &
Development
INTRODUCTION
NEA SUSTAINABILITY REPORT FY13 13
Group (Corporate Services)
Audit Committee
Internal Audit
IT Department
Environment Technology
OfficeCorp Svcs &
Devt DivisionHuman
ResourceDivision
Singapore Environment
Institute
Environmental Protection
Division
EnvironmentalPublic Health
Division
Meteorological Service
Singapore
Central Building Plan Dept
Energy Efficiency &Conservation
Dept
Pollution Control Dept
Radiation Protection& Nuclear
Science Dept
Waste & Resource
Management Dept
Legal Dept
Procurement & Project
Facilitation Dept
Finance Dept
Administration & Projects
Dept
Corporate Excellence
Dept
Technology Research &
Development Unit
HR Business Partners Dept
HR Strategy & Policy Dept
Strategic Workforce Planning & Employee
Engagement Dept
Business Development & Administration
Dept
Environmental Learning Centre
Knowledge & Resource Centre
Programme Development
Dept of Public
Cleanliness
Environmental Health
Institute
Environmental Public Health
Operations Dept
Food & Environmental Hygiene Dept
Vector Control &Sanitation Dept
Centre for Climate
Research Singapore
Meteorological Systems Dept
Risk & Resource Dept
Weather Services Dept
INTRODUCTION
14 NEA SUSTAINABILITY REPORT FY13INTRODUCTION
NEA’s Management
Management CommitteeIn addition to the three Board committees, NEA has a Management Committee that comprises the organisation’s senior management. This includes the Chief Executive Officer (CEO), Deputy CEO (DCEO), Director-Generals, Group Directors, Divisional-Directors and some Directors). The Management Committee meets regularly to review management and operational policies and activities. The committee also plays a pivotal role in leading NEA’s transformational efforts. Through strategically themed meetings and projects, NEA’s senior management guides the agency in becoming more effective in its roles as a regulator and an advocate for the environment. These efforts seek to improve how NEA is organised, enabling it to achieve better results by working smarter, winning hearts and minds, and doing its best.
Enterprise Risk & Safety Steering (ERSS) CommitteeThe ERSS Committee provides overall leadership and guidance in enterprise risk and safety activities and programmes. These include reviewing risk management and safety policies, procedures, assessments, and treatment plans. The quarterly ERSS Committee meeting is chaired by NEA’s CEO. The committee comprises NEA’s senior management (the designated Risk Owners), chairpersons of safety committees (heads of selected operational departments), and the Head of Internal Audit, who acts as an observer for the meeting and provides input regarding audit issues pertaining to risk management when necessary. The ERSS Committee reports to the Board of Directors, which provides high-level oversight of Enterprise Risk Management (ERM) activities and guidance for NEA’s risk management matters. More information can be found on page 19.
Sustainability Governance StructureWith support from NEA’s senior management, a robust governance structure has been put in place to drive and implement sustainability initiatives within NEA. This provides a structural channel for the systemic flow of information from the ground staff to the top management, and vice versa. More information can be found on page 23.
Audit
Internal AuditThe Internal Audit Department (IAD) advises NEA’s management and the Audit Committee about the system of internal controls in NEA. IAD conducts reviews to assist the Board in promoting good corporate governance, through assessing the design and operating effectiveness of controls and evaluating the compliance of NEA’s policies and procedures.
External AuditExternal auditors provide the Board with an independent opinion regarding NEA’s financial statements, providing reasonable assurance that they are free from material misstatement and highlighting areas in NEA’s system of internal controls and accounting procedures that can be enhanced.
The Audit Committee assesses the external auditors based on factors such as the quality of their audit and the independence of the auditors, and recommends their appointment to the Board. In order to maintain the independence of the external auditors, the external auditors are required to declare their state of independence to the Audit Committee prior to appointment.
Employees’ Code of ConductNEA maintains a zero-tolerance policy regarding fraud and misconduct.
Every officer must maintain the highest standards of personal conduct, so as to uphold the integrity of the public service, as well as public confidence. Based on NEA’s biennial Organisational Climate Survey (OCS)6 conducted in 2013, 95% of NEA’s staff agreed that it is every employee’s responsibility to help ensure that NEA is free from any misconduct or fraudulent or corrupt practices.
NEA has established the NEA Person Code – an internal set of guidelines for ethical and professional conduct that applies to all employees. The Code outlines NEA’s Vision, Mission and Values, appropriate conduct, procedures with conflicts of interest, confidentiality, prevention of corruption, and financial stewardship, and sets out principles to guide employees in carrying out their duties and responsibilities to the highest standards of personal and corporate integrity.
In addition, the NEA Disciplinary Policy details the appropriate procedures to deal with any breach of discipline. The NEA Person Code, which is aligned with the Civil Service’s Code of Conduct, is readily available on our intranet and in the NEA Handbook. All new staff is informed about the NEA Person Code. Based on our OCS conducted in 2013, 77% of our staff agreed that they have been given appropriate guidance and training for issues that concern integrity, ethics, fraud, misconduct and corruption.
NEA constantly reminds our staff to follow the NEA Person Code in the course of their work. Essentially, under NEA’s comprehensive whistle-blowing policy, NEA encourages all employees and third parties to report any incidents of fraud and serious misconduct.
There was no misconduct, fraudulent or corrupt practices reported in FY2013.
6 NEA conducted our biennial Organisation Climate Survey (OCS) 2013, which is a key feedback platform that we use to assess our staff’s well-being and satisfaction.

INTRODUCTIONNEA SUSTAINABILITY REPORT FY13 15
SUSTAINABILITY IN OUR PUBLIC INITIATIVESAs a regulator and an advocate for the environment, NEA seeks to formulate clear policies and public initiatives for our environment, society and economy in the long run. The table below highlights some of NEA’s strategies to steer our community towards developing a liveable and sustainable Singapore:
NEA’s Strategies Details of NEA’s Work
Improving Energy Efficiency as a Key Strategy to Mitigate Climate Change
• Improve energy efficiency and promote energy management practices across all sectors in Singapore through legislation (e.g. the Energy Conservation Act), incentive schemes (e.g. the Energy Efficiency Improvement Assistance Scheme and the Grant for Energy Efficient Technologies), collaboration with partners (e.g. the Energy Efficiency National Partnership programme), and provision of trainings to build capabilities (e.g. the Singapore Certified Energy Manager training programme), and providing information (e.g. website, mobile apps)
• Research and collaborate with partners to understand our vulnerabilities to climate change, identify and assess adaptation measures required for climate change, and mitigate greenhouse gas emission
Clean Air, Land and Water, and Striving towards Zero Landfill
• Formulate environmental policies for clean air, land and water
• Control and monitor air pollution, water pollution and noise levels, and tighten standards for the control of toxic waste and hazardous substances
• Ensure that environmental factors are incorporated into land-use planning and development, as well as the building control of new developments
• Ensure the safe use of ionising and non-ionising radiation
• Promote waste minimisation and segregation at the source
• Build cost-effective waste management systems
• Maximise land use for waste management and landfill lifespan
• Shape behaviour to build a resource-efficient society
Building Capabilities and Expertise
• Support collaboration for innovation and the development and adaptation of green technology and products
• Provide training through our training and knowledge division — the Singapore Environment Institute (SEI)
• Develop the environmental industry and forge greater international partnerships
An Environmentally Responsible Community
• Encourage greater environmental ownership and active citizenry through our 3P (People, Public and Private) partnership
• Collaborate with 3P partners to co-design initiatives (e.g. the Eco-Music Challenge)
• Reach out and connect with everyone to promote a culture of reducing waste, using energy and other resources efficiently, and making greener consumer and commuting choices
• Organise community environmental activities (e.g. Clean & Green Singapore)

16 NEA SUSTAINABILITY REPORT FY13INTRODUCTION
Ensuring High Standards of Public Health
• Ensure high standards of public cleanliness, public health and hygiene by:
- Maintaining cleaning standards and inculcating anti-littering behaviour
- Promoting socially responsible behaviour through environmental campaigns
- Comprehensive and enhanced ground surveillance and enforcement
- Building food hygiene-related capabilities, research and technology
- Enhancing community ownership by promoting socially responsible behaviour through environmental campaigns and community engagement, and 3P and inter-agency collaboration
- Taking an integrated approach for dengue control
• Ensure affordable food prices, and clean and hygienic hawker centres by:
- Building new hawker centres
- Creating vibrant and pleasant hawker centres
Efficient Service Provider • Provide timely and reliable weather information
• Provide care-for-the-dead services
• Continue to pursue corporate and organisational excellence
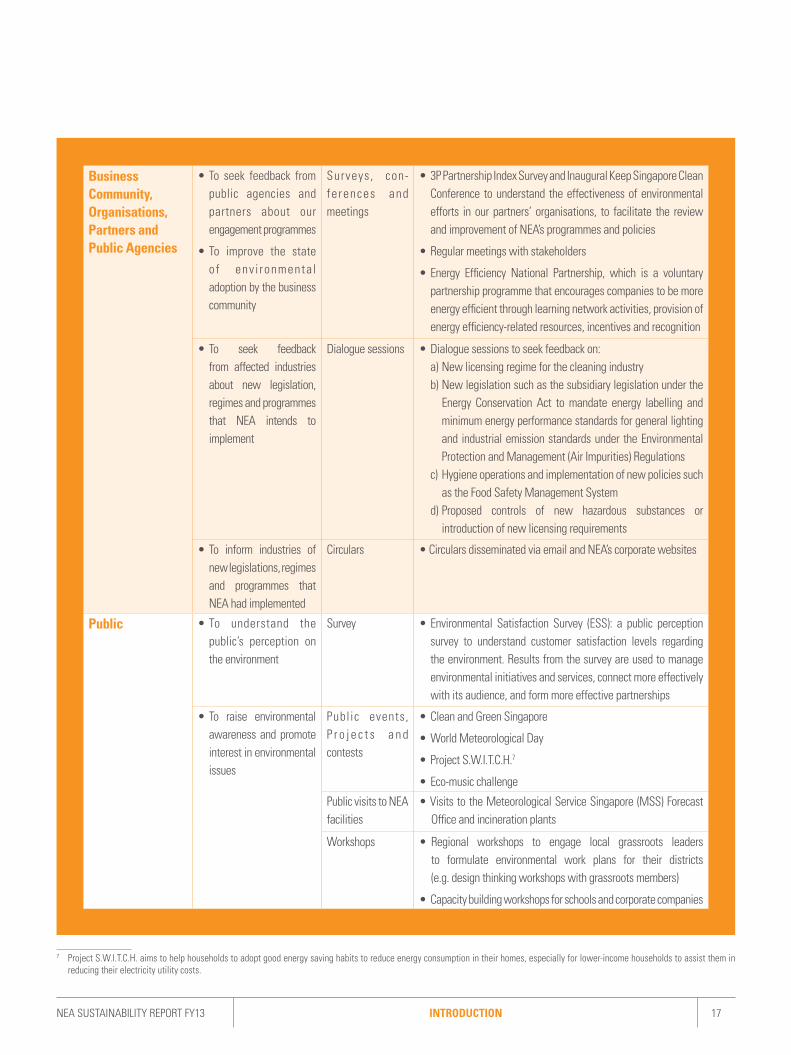
Our Stakeholders [G4-24]
Purpose of Engagement
Engagement Methods [G4-26]
Example(s) of Engagements [G4-26]
Employees • To understand the challenges they face at work
• To update them about any key policy changes / processes and seek their feedback
Surveys, dialogues, roadshows, emails, meetings
• Biennial Organisation Climate Survey (OCS)
• Two-way communication avenues for NEA’s management and employees, such as CEO Townhall, human resource (HR) roadshows, tea sessions, CEO visits to departments and off-site offices, Budget Briefing Sessions, Financial Performance Review sessions
• To enhance their k n o w l e d g e a n d capabilities
Training • Regular sharing sessions such as Lunch and Learn, Superman Forum, Learning Fiesta, Operational Excellence (OpEx) assemblies and forums
• To enhance staff bonding and sense of belonging
Activities • Festive celebrations, annual dinner-and-dance events, sports and recreational activities
Engaging Our Stakeholders [G4-25]NEA’s success in achieving a liveable and sustainable Singapore hinges on the commitment and support of stakeholders.
NEA recognises the importance of encouraging open communication and initiating collaborations with our stakeholders to foster a strong relationship with them, and to promote environmental awareness. In NEA’s course
of work, we engaged three main groups of stakeholders. The frequency of our ongoing engagement with our stakeholders varies with their needs as well as the topics of engagement.
Examples of the various engagement platforms used to address some of our key stakeholders’ concerns are as follows:
INTRODUCTIONNEA SUSTAINABILITY REPORT FY13 17
Business Community, Organisations, Partners and Public Agencies
• To seek feedback from public agencies and partners about our engagement programmes
• To improve the state o f env i ronmenta l adoption by the business community
Surveys, con-fe rences and meetings
• 3P Partnership Index Survey and Inaugural Keep Singapore Clean Conference to understand the effectiveness of environmental efforts in our partners’ organisations, to facilitate the review and improvement of NEA’s programmes and policies
• Regular meetings with stakeholders
• Energy Efficiency National Partnership, which is a voluntary partnership programme that encourages companies to be more energy efficient through learning network activities, provision of energy efficiency-related resources, incentives and recognition
• To seek feedback from affected industries about new legislation, regimes and programmes that NEA intends to implement
Dialogue sessions • Dialogue sessions to seek feedback on:a) New licensing regime for the cleaning industryb) New legislation such as the subsidiary legislation under the
Energy Conservation Act to mandate energy labelling and minimum energy performance standards for general lighting and industrial emission standards under the Environmental Protection and Management (Air Impurities) Regulations
c) Hygiene operations and implementation of new policies such as the Food Safety Management System
d) Proposed controls of new hazardous substances or introduction of new licensing requirements
• To inform industries of new legislations, regimes and programmes that NEA had implemented
Circulars • Circulars disseminated via email and NEA’s corporate websites
Public • To understand the public’s perception on the environment
Survey • Environmental Satisfaction Survey (ESS): a public perception survey to understand customer satisfaction levels regarding the environment. Results from the survey are used to manage environmental initiatives and services, connect more effectively with its audience, and form more effective partnerships
• To raise environmental awareness and promote interest in environmental issues
Public events, P r o j e c t s a n d contests
• Clean and Green Singapore
• World Meteorological Day
• Project S.W.I.T.C.H.7
• Eco-music challenge
Public visits to NEA facilities
• Visits to the Meteorological Service Singapore (MSS) Forecast Office and incineration plants
Workshops • Regional workshops to engage local grassroots leaders to formulate environmental work plans for their districts (e.g. design thinking workshops with grassroots members)
• Capacity building workshops for schools and corporate companies
7 Project S.W.I.T.C.H. aims to help households to adopt good energy saving habits to reduce energy consumption in their homes, especially for lower-income households to assist them in
reducing their electricity utility costs.
18 NEA SUSTAINABILITY REPORT FY13INTRODUCTION
As an organisation, NEA has embarked on a transformational effort since 2010 to be “Future Ready”. This means having the necessary systems, processes and people to do a good job in the face of future challenges. NEA is working to be more relevant, responsive and resilient, ensuring that the organisation will continue to operate effectively and efficiently in the future.
To drive organisational sustainability, NEA seeks to be well informed and prepared for the future by adopting innovative ways to remain relevant. This includes efforts to leverage technology to deliver high-quality public service, keep in touch with the public in our outreach programmes, and develop a networked approach for a faster, better response:
a. Ensuring a High Quality of ServiceNEA aims to provide high-quality service for the community through people-centric processes and systems, as well as service-oriented staff. By devoting more resources to the front-line operations and redesigning our work processes, NEA aims to provide a whole-of-government approach to managing customer feedback and complaints.
Internally, NEA has introduced the CARE (Customer, Ambassador, Relationship, and Experience) framework to guide us in our efforts to introduce and manage various service initiatives. This framework focuses on people as our customers, and rallies our staff to become service ambassadors in our delivery of people-centric experience.
b. Strong Community Engagement and OutreachWhile NEA continues to maintain high standards of public health and cleanliness in Singapore, our focus is on community engagement efforts to promote a stronger sense of social graciousness and environmental consciousness within society.
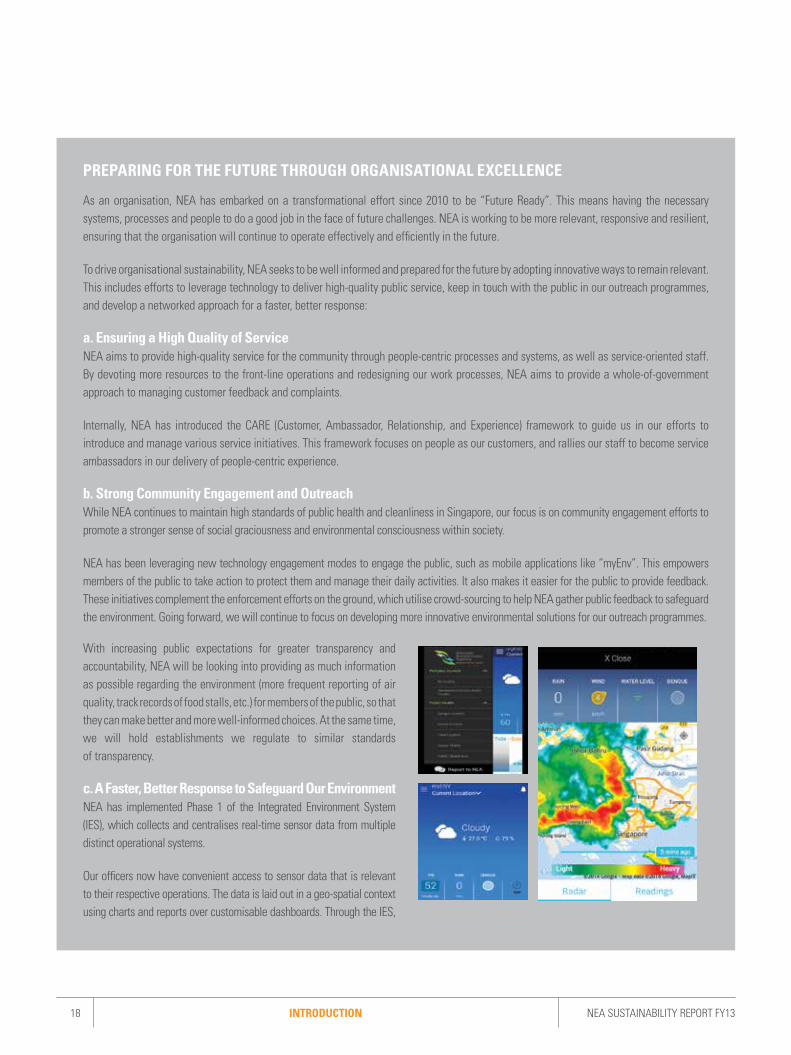
NEA has been leveraging new technology engagement modes to engage the public, such as mobile applications like “myEnv”. This empowers members of the public to take action to protect them and manage their daily activities. It also makes it easier for the public to provide feedback. These initiatives complement the enforcement efforts on the ground, which utilise crowd-sourcing to help NEA gather public feedback to safeguard the environment. Going forward, we will continue to focus on developing more innovative environmental solutions for our outreach programmes.
With increasing public expectations for greater transparency and accountability, NEA will be looking into providing as much information as possible regarding the environment (more frequent reporting of air quality, track records of food stalls, etc.) for members of the public, so that they can make better and more well-informed choices. At the same time, we will hold establishments we regulate to similar standards of transparency.
c. A Faster, Better Response to Safeguard Our EnvironmentNEA has implemented Phase 1 of the Integrated Environment System (IES), which collects and centralises real-time sensor data from multiple distinct operational systems.
Our officers now have convenient access to sensor data that is relevant to their respective operations. The data is laid out in a geo-spatial context using charts and reports over customisable dashboards. Through the IES,
PREPARING FOR THE FUTURE THROUGH ORGANISATIONAL EXCELLENCE

INTRODUCTIONNEA SUSTAINABILITY REPORT FY13 19
MANAGING OUR RISKManaging risk is an integral part of our business activities, and it creates value for our organisation.
More risks have surfaced in the recent years. Greater public expectations, higher standards, more effective operations, mounting environmental issues, new work areas and technological changes are just some of the key challenges we face on a day-to-day basis, in an increasingly complex and dynamic environment. These key challenges, if not handled carefully and with sensitivity, will not only directly impact and influence NEA’s public policies and programmes, but will affect how NEA as an organisation prepares itself to be sustainable as well.
NEA recognises how a structured and integrated framework to oversee key enterprise risks is part of good corporate governance and strategic planning. We therefore embarked on the Enterprise Risk Management (ERM) journey in 2007.
Proper risk management enables NEA to identify and address possible risks immediately, helping to reduce the impact of the risk through contingency planning. Because of the diverse work NEA handles, the organisation approaches risk management in a holistic, open and effective manner. Otherwise, the combined impact of risks could derail our pursuit of NEA’s strategic objectives and damage our reputation.
The purpose of implementing the ERM is to enable NEA to identify, as-sess, prioritise, and treat its key strategic risks on an ongoing basis. It also aims to enhance:
• Risk Awareness — by providing an integrated view of the combined impact of different risks in the organisation, thereby breaking down silo thinking in managing risk
• Risk Ownership — by providing a formalised structure to assign account ability for key risks and their mitigating measures or action plans
• Proactive Risk Management — by providing a structured and robust management tool to minimise risk, optimise resources and seize opportunities, based on both top-down and bottom-up approaches.
Our Enterprise Risk Management Governance Structure NEA’s Enterprise Risk Management (ERM) reporting approach clearly defines the respective roles and authorities for establishing an ERM framework that is distinct to the organisation.
In our bid to streamline our processes and build stronger capabilities to face the increasing uncertainty of events and challenges, both the ERM and Workplace Safety and Health (WSH) governance structures were reviewed. Since October 2013, the Enterprise Risk Management Committee (ERMC) merged with the NEA Safety Steering Committee (NSSC) to form the Enterprise Risk and Safety Steering Committee (ERSSC).
ERSSC meets every quarter to review the key strategic and operational risks facing NEA and the progress of its risk treatment plans. ERSSC also looks at trends and emerging issues that may have an impact on NEA.
The Incident and Risk Review Committee (IRRC), which is chaired by NEA’s Chief Risk Officer (CRO), reports to ERSSC. IRRC serves a dual role in the ERM and WSH governance structures. Under the ERM governance structure, IRRC ensures the comprehensiveness of NEA’s risk register and other indicators for policy sensing and sense-making of risks.
Identifying, assessing, and monitoring key strategic risks and treatment plans is the responsibility of Risk Owners. Process Owners provide risk content (causes, consequences and controls), and are involved in implementing and monitoring the effectiveness of risk treatment plans.
we can achieve better situational awareness and improve our responses to feedback. For example, for feedback about construction noise, we provide the unified view of construction sites, noise sensitive premises and noise level measurements.
IES Phase 2 will build on its current capabilities through an exchange platform that facilitates data sharing among government agencies and research institutions. IES Phase 2 will also include data analytics and predictive capabilities to provide early environmental warning, as well as sense-making to support our field operations.

20 NEA SUSTAINABILITY REPORT FY13INTRODUCTION
Each department has a Risk Champion. They act as a risk representative who administers risk policies and procedures at the departmental level, and document risks and related control plans in their own department’s risk register.
Risk registers are regularly updated and subsequently collated from all departments for the purpose of outlining strategic and key operational risks onto a risk map. The risk map provides ERSSC with a quick overview of the top priority risks that NEA faces, allowing the committee to observe the full effectiveness of control plans in managing risk.
To ensure the organisation’s sustainability and management in the risk of fraud occurrences, NEA has put in place controls and Standard Operating Procedures (SOPs) to ensure that processes are done correctly, with appropriate levels of checks. Officers in positions susceptible to exploitation also go through job rotations, and have their duties segregated.
Departments with key functions in procurement, finance and staff discipline have also assessed risks related to fraud, and have put in place suitable risk control and treatment plans.
Enhancing the Risk Management Culture in NEANEA has embarked on the risk management journey since 2006. Having established basic risk management systems and processes, there is still much to do to build up an active risk management culture in the organisation. The effectiveness of Enterprise Risk Management (ERM) in NEA is very much dependent on the strength of its risk culture.
To strengthen our risk culture, we have conducted numerous trainings and customised briefings over the years to progressively intensify our efforts:
• Risk Training Risk management workshops were conducted at NEA Leaders in
Environmental Action Programme (LEAP) for middle management staff who have been in service for a few years. The purpose is to create greater awareness and understanding of risk management and its importance to NEA’s role and functions.
In FY13, NEA began to instill a risk-awareness mindset in new hires joining the organisation. To this end, NEA has incorporated a risk management
NEA’s revised ERM and WSH governance structures
NEA Board
Audit Comm (AC)
ERSS Comm (ERSSC)Chair: CEO
Secretariat(CED)
Our revised ERM Governance Structure
IRR Comm (IRRC)Chair: CRO
Internal Audit Dept (IAD)
Risk Owners (DGs/ Div Dirs)
Process Owners(HODs)
Installation /Offsite WSH Committees
WSH Rep First Aiders
Dept WSH Comm*/ NEA WSH Driver
Observer
LegendReporting
Collaborating
On need basis*

INTRODUCTIONNEA SUSTAINABILITY REPORT FY13 21
MANAGING RISKS FOR A FUTURE-READY NEA As NEA continues our Enterprise Risk Management (ERM) journey, we recognise the need to bridge the gaps of risk management between our senior management and the officers on the ground.
As such, NEA adopts a risk-based approach to enhance our risk management capabilities and culture. One initiative was the roll-out of a customised risk management training and assessment project for NEA’s Hawker Centres Division (HCD). The training was timely, as HCD had expanded its work functions to meet the public’s rising needs. The training also provided an avenue for risks to be identified from the ground up, through a formalised risk escalation process that was communicated to the officers as part of the training.
In 2013, a similar training programme was rolled out for the Department of Public Cleanliness (DPC), as it undertook an expanded scope because of the integration of cleaning contracts from the various government agencies. The training enabled the officers to be better equipped with risk management knowledge and tools, aiding them in identifying and managing their risks.
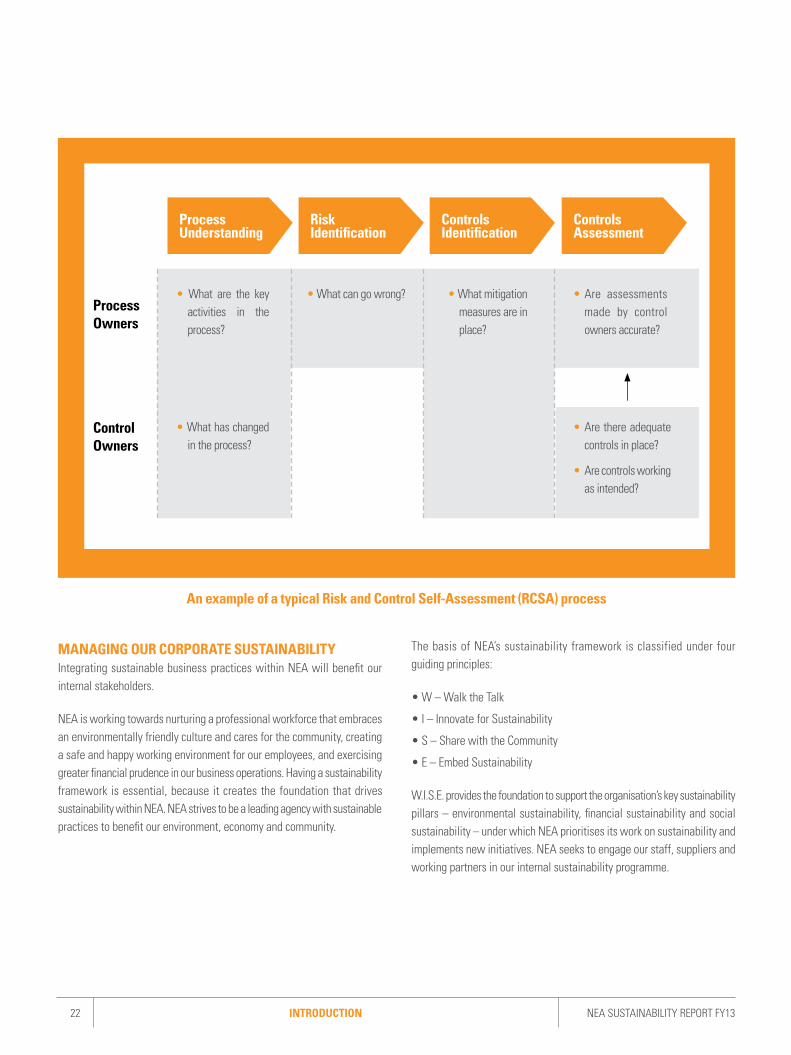
To ensure the effectiveness of NEA’s internal controls, we launched a pilot Risk and Control Self-Assessment (RCSA) exercise in early 2013. NEA is now in the process of directing its RCSA efforts to selected departments focusing on procurement processes. This was done because of how important procurement is within NEA, and because of the public’s increasing scrutiny of its processes.
In 2014 and 2015, NEA will be looking at enhancing the integration of its strategic planning and risk management processes. This will enable NEA to better anticipate and manage potential risks or challenges arising from its strategic initiatives.
module into the induction programme for new hires. This ensures that all new hires are given a firm grounding in NEA’s risk management practices and how they can contribute to the whole.
• Risk Communication Since July 2009, NEA has been updating staff biennially on the latest risk
management issues and happenings through an internal risk management newsletter, the Risk Digest. There is also a risk management Intranet site allowing staff to access risk management matters in NEA. It serves as a source of risk management information that includes speeches and videos featuring past risk management training sessions and external speakers.
On top of that, NEA proactively collates risk-related news from the mass media and disseminates it to employees. Lessons learnt can then be applied in NEA.
• Rewards and Recognition NEA recognises staff for their efforts in promoting risk management
through the NEA Risk Ambassador award. The award was first introduced in January 2011. In 2013, three outstanding staff were presented with the award.
For their contributions, departmental Risk Champions are granted due recognition in their personal HR records. The Director (Corporate Services & Development) meets with these Risk Champions on a regular basis to understand their needs and obtain invaluable feedback.
Moving forward, while NEA continues to place emphasis on managing operational risk in our organisation and engaging staff to strengthen our risk culture, more needs to be done to link risk management to our business continuity and emergency planning efforts. Risk management is useful for identifying potential events that may impact NEA’s processes and operations by highlighting key areas of caution in business
continuity projects.
22 NEA SUSTAINABILITY REPORT FY13INTRODUCTION
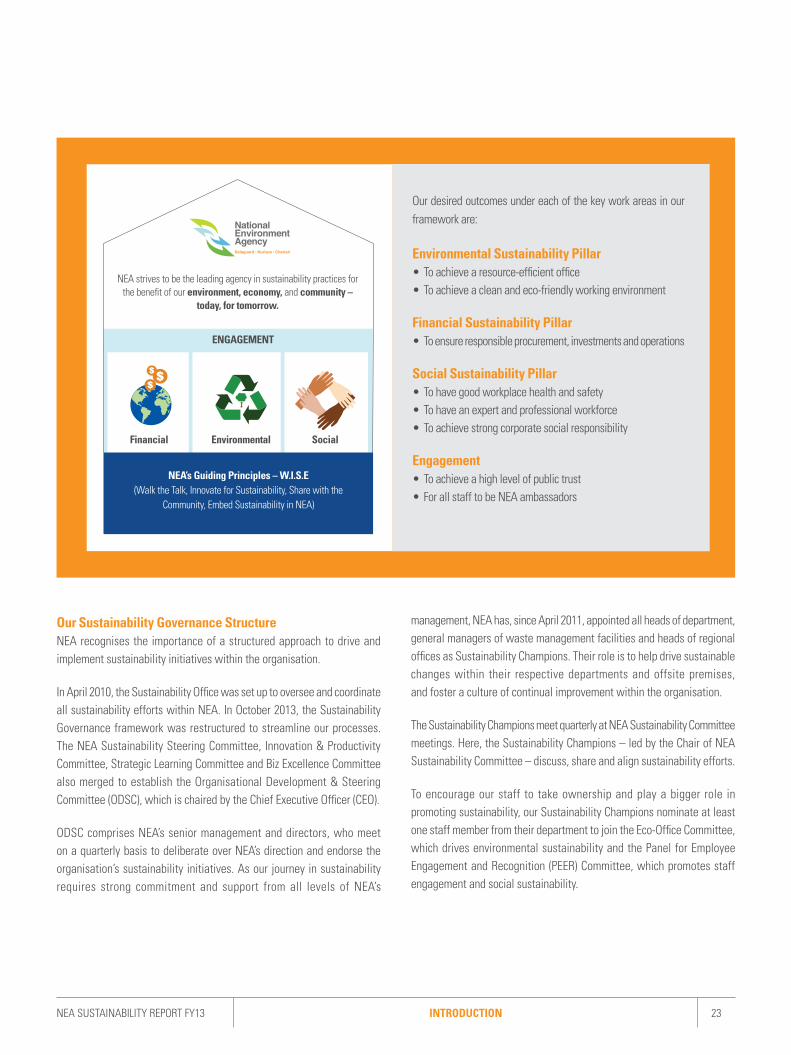
MANAGING OUR CORPORATE SUSTAINABILITYIntegrating sustainable business practices within NEA will benefit our internal stakeholders.
NEA is working towards nurturing a professional workforce that embraces an environmentally friendly culture and cares for the community, creating a safe and happy working environment for our employees, and exercising greater financial prudence in our business operations. Having a sustainability framework is essential, because it creates the foundation that drives sustainability within NEA. NEA strives to be a leading agency with sustainable practices to benefit our environment, economy and community.
The basis of NEA’s sustainability framework is classified under four guiding principles:
• W – Walk the Talk
• I – Innovate for Sustainability
• S – Share with the Community
• E – Embed Sustainability
W.I.S.E. provides the foundation to support the organisation’s key sustainability pillars – environmental sustainability, financial sustainability and social sustainability – under which NEA prioritises its work on sustainability and implements new initiatives. NEA seeks to engage our staff, suppliers and working partners in our internal sustainability programme.
Process Understanding
Risk Identification
Controls Identification
Controls Assessment
Process Owners
• What are the key activities in the process?
• What can go wrong? • What mitigation measures are in place?
• Are assessments made by control owners accurate?
• Are there adequate controls in place?
• Are controls working as intended?
An example of a typical Risk and Control Self-Assessment (RCSA) process
ControlOwners
• What has changed in the process?
INTRODUCTIONNEA SUSTAINABILITY REPORT FY13 23
Our desired outcomes under each of the key work areas in our framework are:
Environmental Sustainability Pillar• To achieve a resource-efficient office • To achieve a clean and eco-friendly working environment
Financial Sustainability Pillar• To ensure responsible procurement, investments and operations
Social Sustainability Pillar• To have good workplace health and safety• To have an expert and professional workforce• To achieve strong corporate social responsibility
Engagement• To achieve a high level of public trust• For all staff to be NEA ambassadors
Our Sustainability Governance StructureNEA recognises the importance of a structured approach to drive and implement sustainability initiatives within the organisation.
In April 2010, the Sustainability Office was set up to oversee and coordinate all sustainability efforts within NEA. In October 2013, the Sustainability Governance framework was restructured to streamline our processes. The NEA Sustainability Steering Committee, Innovation & Productivity Committee, Strategic Learning Committee and Biz Excellence Committee also merged to establish the Organisational Development & Steering Committee (ODSC), which is chaired by the Chief Executive Officer (CEO).
ODSC comprises NEA’s senior management and directors, who meet on a quarterly basis to deliberate over NEA’s direction and endorse the organisation’s sustainability initiatives. As our journey in sustainability requires strong commitment and support from all levels of NEA’s
management, NEA has, since April 2011, appointed all heads of department, general managers of waste management facilities and heads of regional offices as Sustainability Champions. Their role is to help drive sustainable changes within their respective departments and offsite premises, and foster a culture of continual improvement within the organisation.
The Sustainability Champions meet quarterly at NEA Sustainability Committee meetings. Here, the Sustainability Champions – led by the Chair of NEA Sustainability Committee – discuss, share and align sustainability efforts.
To encourage our staff to take ownership and play a bigger role in promoting sustainability, our Sustainability Champions nominate at least one staff member from their department to join the Eco-Office Committee, which drives environmental sustainability and the Panel for Employee Engagement and Recognition (PEER) Committee, which promotes staff engagement and social sustainability.
ENGAGEMENT
Financial Environmental Social
NEA strives to be the leading agency in sustainability practices for the benefit of our environment, economy, and community –
today, for tomorrow.
NEA’s Guiding Principles – W.I.S.E(Walk the Talk, Innovate for Sustainability, Share with the
Community, Embed Sustainability in NEA)

24 NEA SUSTAINABILITY REPORT FY13INTRODUCTION
Mechanisms have also been put in place to review and rotate our staff on a regular basis, to encourage new ideas and increase staff involvement in our sustainability journey. In many of our off-site premises, the representative from the Eco-Office Committee will chair a sub-committee within their own department to implement site-specific eco-office initiatives, monitor the effectiveness of the action plans and gather feedback, educate staff and update staff regarding their performance.
Staff Engagement and Communication [G4-24, G4-25 G4-26, G4-27]The seeds of change for sustainability practices are often initiated at the staff level.
NEA encourages staff involvement and feedback regarding our sustainability initiatives through various channels, such as the CEO Townhall, the intranet, email blasts, discussion forums, focus group discussions, contests, My-Ideas, etc. This is to create a conducive environment for our staff to contribute innovative ideas, thereby enhancing NEA’s capabilities to operate in a more environmentally, socially and financially sustainable manner. As our report focuses on internal sustainability, we have identified our staff as the main stakeholder.
We have categorised our staff engagement into different levels, for which the most effective and efficient communication platforms are identified. (See page 25).
NEA has also put in place adequate channels for employees to air their grievances on matters that affect the terms and conditions of their service. NEA’s employees can voice their concerns officially about their employment terms as long as they do so to the appropriate departmental authorities, and not to external third parties. As of FY2013, no grievances have been raised.
Based on the 2013 OCS conducted with our staff, 73% of NEA’s staff agreed that NEA is efficient in keeping our employees informed about matters that affect them. This is an improvement from our 2011 OCS results, where only 69% agreed with the statement.
NEA will continue to build on our initiatives to create a world-class, engaged workforce, as well as a workplace where passionate environmental advocates work together in this dynamic and challenging field.
(NEA’s Sustainability Governance Structure (as of November 2014)
Organisational Development Steering CommitteeTo provide overall leadership & direction on sustainability efforts in NEA
Chair: CEOCommittee members: Senior Management
Senior Management’s Support
NEA Sustainability CommitteeTo discuss, share and align our sustainability efforts
Chair: GD(JOT)Deputy Chair: D(SO)
Committee members: All Heads of Departments
Eco-Office Committee
Volunteers for ad-hoc Projects
Staff Involvement PEER
Middle Management’s Support

INTRODUCTIONNEA SUSTAINABILITY REPORT FY13 25
Engagement at Different Levels [G4-24, G4-25]
Description Examples [G4-26]
NEA-wide Different engagement and learning platforms at various segments and levels of NEA’s workforce
CEO Townhall, human resource (HR) roadshows to various departments, monthly CEO visits to departments and off-site offices, Organisation Climate Survey (OCS), NEA’s intranet, communication through circulars, HR Snapshots
Team Focus on Innovation and Service MyiDeas, Work Improvement Teams (WITs), service forums, innovation forums, risk talks, Learning Fiesta, innovation and production roadshows, etc.
Improve productivity and enhance career advancement
Job redesigning initiatives
Committees to look into Workplace Safety and Health (WSH), eco-habits, community outreach programmes, staff welfare activities
Eco-Office Committee, WSH Committee, Panel for Employee Engagement and Recognition (PEER) Committee, NEA Sports and Recreational Committee (NEASRC)
Individual Attract, develop and retain talent Formal work review sessions with learning plan input, providing a two-way communication channel between supervisors and individuals, tea sessions with different segments of staff, e.g. young talents, NEW scholars, new staff, Daily Rated Workers (DREs), etc.
Motivate staff to achieve better performance
Holistic performance management report that includes an individual’s contribution to areas outside the formal work scope, such as improvement and innovation projects
Programmes that match staff skills and interests with charity needs for deeper engagement
Christmas carolling at the Singapore Children’s Society (SCS), Charity Run in support of the Children’s Cancer Foundation (CCF)
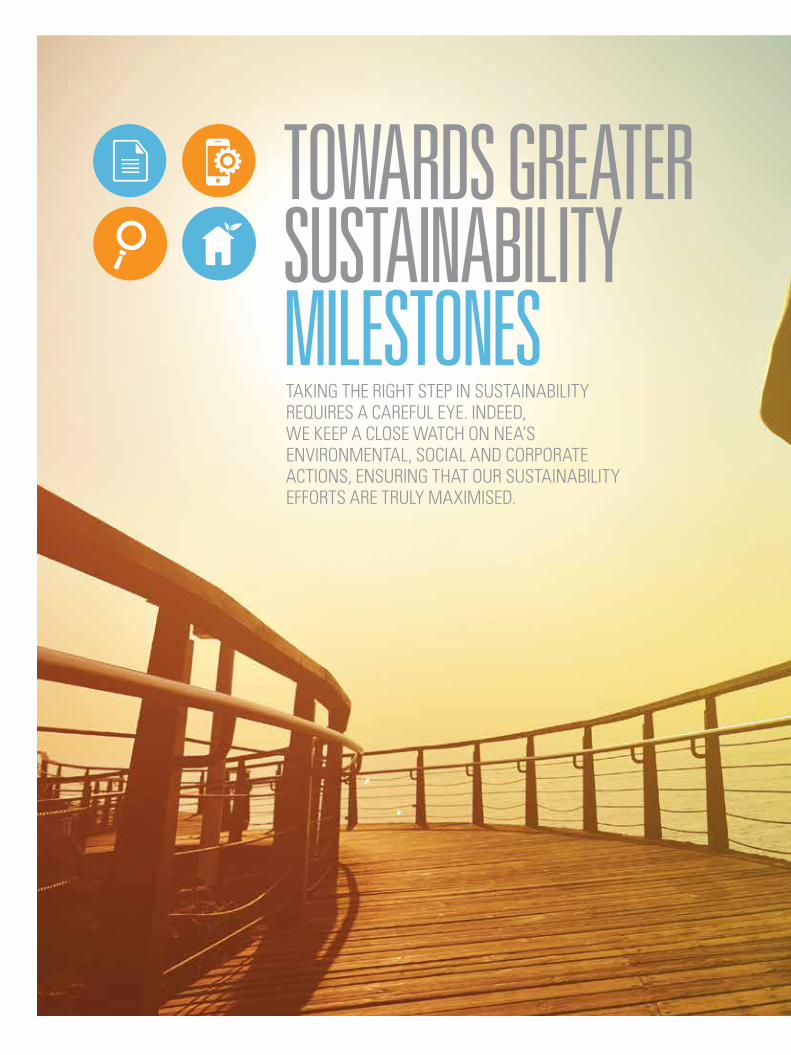
TOWARDS GREATER SUSTAINABILITY MILESTONESTAKING THE RIGHT STEP IN SUSTAINABILITY REQUIRES A CAREFUL EYE. INDEED, WE KEEP A CLOSE WATCH ON NEA’S ENVIRONMENTAL, SOCIAL AND CORPORATE ACTIONS, ENSURING THAT OUR SUSTAINABILITY EFFORTS ARE TRULY MAXIMISED.


28 NEA SUSTAINABILITY REPORT FY13MONITORING OUR SUSTAINABILITY EFFORTS
AN ANALYSIS OF OUR CURRENT SITUATIONNEA believes that our drive for internal sustainability can help us better manage risks and identify opportunities. Based on national and global trends, compliance requirements and feedbacks from our internal stakeholders, NEA’s management has identified the following risks and opportunities related to driving sustainability within the organisation:
Key Issues Our Approach [G4-27] Opportunities [G4-27]Increasing public expectations for NEA to be the champion for the environment and to walk the talk
Drive infrastructure enhancement and behavioural changes to achieve environmental sustainability within NEA
Continue to innovate for sustainability and explore the possibility of relying on technology
Report on our progress through sustainability reports
NEA experiencing first-hand on the issues that may arise with implementation, and gaining public trust for our policies
The Singapore Exchange (SGX) will be developing sustainability reporting guidelines, and will soon be making it mandatory for all listed companies to publish sustainability reports in a “comply or explain” approach
Being the first public agency to report on sustainability allows NEA to develop our efforts further
Identifying areas for improvement through NEA’s sustainability reporting
Increasing expectations for NEA to incorporate sustainable supply chain
NEA can influence and engage business partners (sub-contractors, service providers and suppliers) in our sustainability efforts
The need to comply with:
i. The Public Sector Taking the Lead in Environmental Sustainability (PSTLES) version 2.0 initiative
ii. Energy management practices under the Energy Conservation Act (ECA)
iii. Environmental Protection and Management (Air Impurities) Regulations
Ensuring that NEA fulfils the environmental requirements
MONITORING OUR SUSTAINABILITY EFFORTS
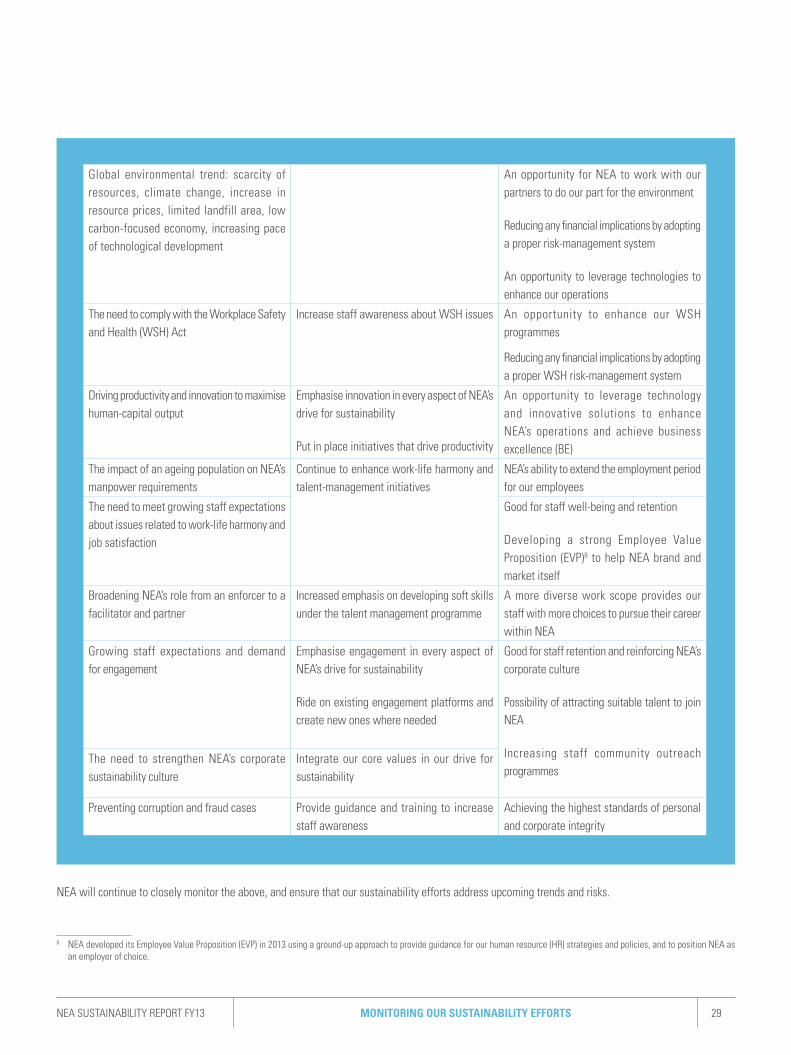
MONITORING OUR SUSTAINABILITY EFFORTSNEA SUSTAINABILITY REPORT FY13 29
Global environmental trend: scarcity of resources, climate change, increase in resource prices, limited landfill area, low carbon-focused economy, increasing pace of technological development
An opportunity for NEA to work with our partners to do our part for the environment
Reducing any financial implications by adopting a proper risk-management system
An opportunity to leverage technologies to enhance our operations
The need to comply with the Workplace Safety and Health (WSH) Act
Increase staff awareness about WSH issues An opportunity to enhance our WSH programmes
Reducing any financial implications by adopting a proper WSH risk-management system
Driving productivity and innovation to maximise human-capital output
Emphasise innovation in every aspect of NEA’s drive for sustainability
Put in place initiatives that drive productivity
An opportunity to leverage technology and innovative solutions to enhance NEA’s operations and achieve business excellence (BE)
The impact of an ageing population on NEA’s manpower requirements
Continue to enhance work-life harmony and talent-management initiatives
NEA’s ability to extend the employment period for our employees
The need to meet growing staff expectations about issues related to work-life harmony and job satisfaction
Good for staff well-being and retention
Developing a strong Employee Value Proposition (EVP)8 to help NEA brand and market itself
Broadening NEA’s role from an enforcer to a facilitator and partner
Increased emphasis on developing soft skills under the talent management programme
A more diverse work scope provides our staff with more choices to pursue their career within NEA
Growing staff expectations and demand for engagement
Emphasise engagement in every aspect of NEA’s drive for sustainability
Ride on existing engagement platforms and create new ones where needed
Good for staff retention and reinforcing NEA’s corporate culture
Possibility of attracting suitable talent to join NEA
Increasing staff community outreach programmes
The need to strengthen NEA’s corporate sustainability culture
Integrate our core values in our drive for sustainability
Preventing corruption and fraud cases Provide guidance and training to increase staff awareness
Achieving the highest standards of personal and corporate integrity
8 NEA developed its Employee Value Proposition (EVP) in 2013 using a ground-up approach to provide guidance for our human resource (HR) strategies and policies, and to position NEA as
an employer of choice.
NEA will continue to closely monitor the above, and ensure that our sustainability efforts address upcoming trends and risks.

30 NEA SUSTAINABILITY REPORT FY13MONITORING OUR SUSTAINABILITY EFFORTS
9 Not relevant Global Reporting Initiative (GRI) G4 aspects.
Material Focus Areas
Material Issues
GRI G4 Aspects [G4-19]
Impact Material to Internal Stakeholder(Employees) [G4-20]
Impact Material to External Stakeholders
[G4-21]
Environmental Sustainability
1. Pollution Control
Air emission and compliance
√ Community – how pollution is being controlled and managed
Effluents and compliance
√ Community – how pollution is being controlled and managed
2. Resource Conservation
Energy √ Community – how we manage and conserve our resourcesWater
Waste
Social Sustainability
3. Workplace Safety and
Health
Occupational safety and health
√ Ministry of Manpower (MOM) – Compliance to Workplace Safety and
Health (WSH) Act
4.People Excellence
Fair employment √ MOM – Compliance to Employment Act and Retirement and
Re-employment Act
Training and education
√ Training and experience are useful for personal career advancement, and may
be useful in another company
5. Community Involvement
Giving back to the community9
√ Empowering our community through support and knowledge
Financial Sustainability
6. Our Finances Optimisation of financial resources9
√ Community – how we manage our finances
7. Our Supply Chain
Procurement practices
√ Community – how we manage our supply chain
8. Innovation and Productivity
Maximising human-capital
output8
√ NA
OUR MATERIAL ISSUES Through regular staff engagement and an analysis of our current situation, we have identified eight material issues related to driving sustainability within NEA. The table below shows the focus areas and significant issues relevant to our organisation and staff.
The eight material issues form the basis of NEA’s sustainability initiatives and reporting, which are supported by our management. Our processes have
been developed to safeguard our environment, workplace and finances, ensuring that our sustainability efforts are truly maximised.
We have applied the principles of the Global Reporting Initiative (GRI) G4 Guidelines to determine our key material issues. The subsequent chapters will discuss relevant G4 material aspects further, detailing our management’s approach and performance. [G4-18].
MONITORING OUR SUSTAINABILITY EFFORTSNEA SUSTAINABILITY REPORT FY13 31
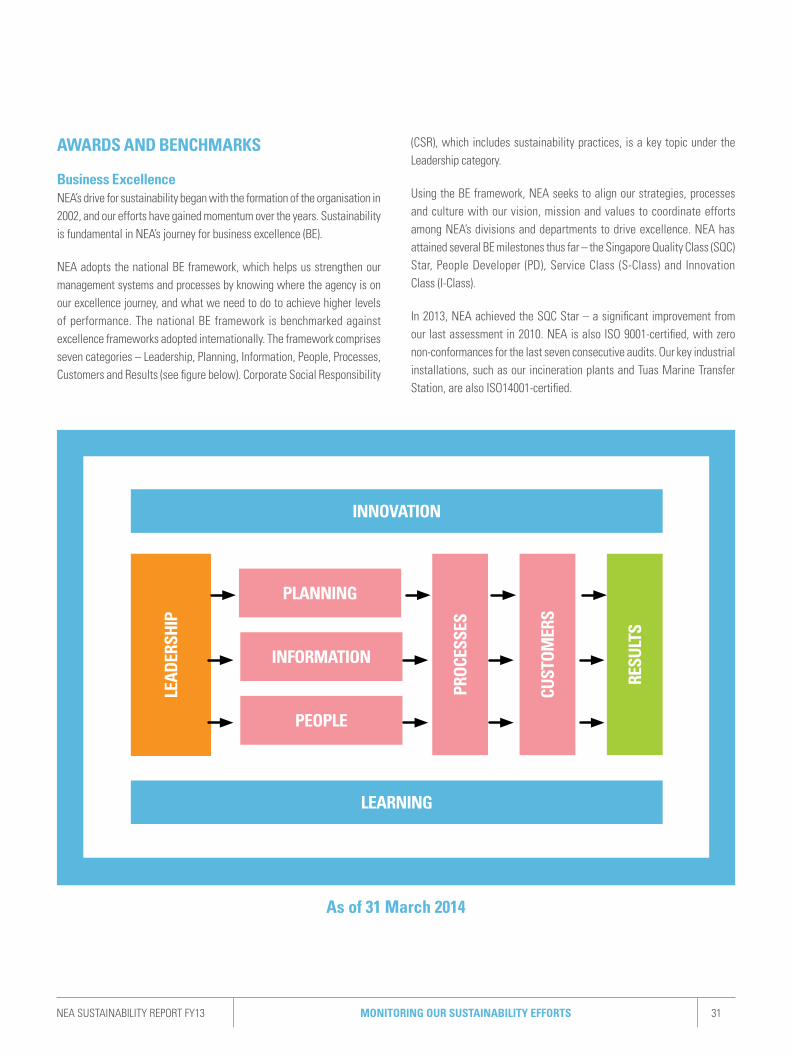
INNOVATION
LEARNING
LEAD
ERSH
IP
PLANNING
PROC
ESSE
S
CUST
OMER
S
RESU
LTS
INFORMATION
PEOPLE
As of 31 March 2014
AWARDS AND BENCHMARKS
Business ExcellenceNEA’s drive for sustainability began with the formation of the organisation in 2002, and our efforts have gained momentum over the years. Sustainability is fundamental in NEA’s journey for business excellence (BE).
NEA adopts the national BE framework, which helps us strengthen our management systems and processes by knowing where the agency is on our excellence journey, and what we need to do to achieve higher levels of performance. The national BE framework is benchmarked against excellence frameworks adopted internationally. The framework comprises seven categories – Leadership, Planning, Information, People, Processes, Customers and Results (see figure below). Corporate Social Responsibility
(CSR), which includes sustainability practices, is a key topic under the Leadership category.
Using the BE framework, NEA seeks to align our strategies, processes and culture with our vision, mission and values to coordinate efforts among NEA’s divisions and departments to drive excellence. NEA has attained several BE milestones thus far – the Singapore Quality Class (SQC) Star, People Developer (PD), Service Class (S-Class) and Innovation Class (I-Class).
In 2013, NEA achieved the SQC Star – a significant improvement from our last assessment in 2010. NEA is also ISO 9001-certified, with zero non-conformances for the last seven consecutive audits. Our key industrial installations, such as our incineration plants and Tuas Marine Transfer Station, are also ISO14001-certified.
32 NEA SUSTAINABILITY REPORT FY13MONITORING OUR SUSTAINABILITY EFFORTS
These various BE certifications conferred by SPRING Singapore affirmed that NEA is on the right track towards being an excellent organisation in our people, service and innovation aspects. Without doubt, this affirmation motivates us to do even better. NEA is building upon this foundation in our pursuit for the next milestone in our journey of excellence – the premier Singapore Quality Award (SQA). The SQA is the pinnacle for organisations that demonstrate world-class BE standards.
Our Environmental and Social AchievementsIn FY2013, NEA made some significant progress in our journey of environmental and social sustainability, which is highlighted below:
• As of FY2013, all NEA offices have achieved eco-office certification. A total of 14 of our office premises have undergone re-certification, while four new office premises set up in 2012 – the Singapore Environment Institute (SEI), the Centre for Climate Research Singapore (CCRS), the Department of Public Cleanliness (DPC) and the Hawker Centres Division (HCD) – have just been certified. More information can be found in Chapter 3, on page 34.
• For the third year running, NEA has been voted by students and graduates to be one of the leading graduate employers in the 2013 Singapore’s 100 Leading Graduate Employers survey. NEA was in the 55th position in 2013 – an improvement from our 59th position in 2012.
• NEA was conferred eight awards at the Singapore Human Resources Institute (SHRI) HR Awards 2013:
1. Leading CEO Award
2. Leading HR Leader Award
3. Leading HR Practices in Learning & Human Capital Development Award (Special Mention)
4. Leading HR Practices in Employee Relations & People Management Award
5. Leading HR Practices in Quality Worklife Physical Mental Well Being Award
6. Leading HR Practices in Corporate Social Responsibility Award
7. Leading HR Practices in Fair Employment Practices Award
8. Pinnacle award for overall HR excellence – the Corporate HR Award (this award is bestowed upon organisations that have achieved overall effectiveness in their HR and people-management practices, thus contributing to the needs of businesses, employees, industries and the nation)
• In 2013, NEA clinched the 10-year Outstanding SHARE Award and the SHARE Gold Award at the 2013 Community Chest Awards.
• NEA won the NTUC May Day Model Partnership Award in 2013 for the progressive Wage Model under the Institutional Category for the Cleaning Sector.
• NEA received an award at the International Convention on Quality Control Circles (ICQCC) 2013 for the following three projects:
1. Cleaning Performance Monitoring System (CPMS)
2. Real-time noise monitoring system
3. Automated checking of meteorological information and forecasts on various media platforms
• NEA also received the following awards:
1. Annual Best Practice Award 2013 – “Cleaning Performance Management Systems (CPMS)” emerged as the sole winner in the Regulation category
2. United Nations Public Service Awards (UNPSA) 2013 – “Co-creation of creative solutions through eGov initiatives” won second place under “Promoting Whole-of-Government (WOG) Approaches” in the Information Age category.
3. FutureGov Award – “myENV Mobile Application” won an award under the Wireless Government category. This award recognises NEA’s efforts in using wireless technologies to extend the reach of its services and raise employee productivity.
4. Public Category at Singapore Good Design Mark (SG Mark) Awards – “NEA’s Semakau Landfill project” won a Gold Award under “Social – Space, Architecture, Facilities” in the Public category. This award recognises innovative and exceptional designs that spur imagination and enhance lives.

MONITORING OUR SUSTAINABILITY EFFORTSNEA SUSTAINABILITY REPORT FY13 33
NEA seeks to benchmark our internal efforts in sustainability against our peers and industry standards. For example, in business excellence (BE), our HR policies are benchmarked against those implemented by companies that have obtained the Singapore Quality Award (SQA) and our peers from the public sector. Another example can be seen in how we benchmark our efforts in environmental sustainability against organisations that have been awarded the Eco-Office Label or the BCA Green Mark award.
NEA is no stranger to sustainability, and is always keeping track of fresh development in this area. We also lend our support to key sustainability initiatives in Singapore. Some notable ones include the Singapore Compact Awards for Corporate Social Responsibility, the Singapore Sustainability Awards by the Singapore Business Federation (SBF) and the ACCA Sustainability reporting awards.
NEA will continue to improve our work on sustainability, and promote sustainability to Singapore’s business community.


TOWARDS A SUSTAINABLE ENVIRONMENTTO CREATE A BETTER AND MORE SUSTAINABLE TOMORROW, WE NEED TO CHERISH WHAT WE HAVE TODAY. AT NEA, WE CONSTANTLY ENGAGE IN EFFORTS AND INITIATIVES TO CONSERVE RESOURCES AND REDUCE WASTE, MINIMISING OUR IMPACT ON OUR ENVIRONMENT.

36 NEA SUSTAINABILITY REPORT FY13SUSTAINING OUR ENVIRONMENT
SUSTAINING OUR ENVIRONMENT
NEA has examined our operations in 18 premises, identifying three key activities that we believe have a significant impact on our environment – our operations at our waste management facilities, our operations at our crematoriums and resource consumption in our day-to-day operations.
Environmental stewardship is an integral part of our operations philosophy. NEA’s management is committed to minimising the environmental impact caused by our activities by ensuring that we inculcate effective environmental practices. Two material issues have been identified under NEA’s environmental sustainability pillar: pollution control and resource conservation. We constantly engage in initiatives to conserve resources, reduce waste and innovate for sustainability, minimising our impact on our surroundings.
At NEA, we believe in building an eco-friendly culture, where we nurture our staff and shape individuals into environmental ambassadors who can help spread environmental messages to the community.
POLLUTION CONTROL (Relevant G4 material aspects: Air Emission, Effluents, Compliance)
Air Emission and ComplianceNEA manages four premises – two incineration plants and two crematoriums – which emit air pollutants such as dust, sulphur dioxide, nitrogen oxides, hydrogen chloride and carbon monoxide during the incineration and cremation processes. Noting that these air emissions have to comply with Singapore’s Environmental Protection and Management (Air Impurities) Regulations10, NEA has undertaken relevant mitigation measures to ensure that our air emissions are within the limits.
We have installed a telemetric monitoring system that is linked to the regulatory unit to continuously monitor air emission from our incineration plants. The results over the years are as follows:
11 TIP FY2010 FY2011 FY2012 FY2013 Emission Limit
Dust (mg/Nm3) 12.1 14.8 6.3 11.8 < 100
SO2 (mg/Nm3) 28 12.7 7.3 90.7 < 500
NOx (mg/Nm3) 414 362 345 391 < 700
11 TSIP FY2010 FY2011 FY2012 FY2013 Emission Limit
Dust (mg/Nm3) 0.68 0.68 1.67 2.53 < 100SO2 (mg/Nm3) 210 242 170 142 < 500NOx (mg/Nm3) 481 656 399 246 < 700
10 Air emission limits extracted from: http://statutes.agc.gov.sg/aol/search/display/view.w3p;page=0;query=Id%3A%227a8f0030-2233-44c8-9e89-aa7bb19cc208%22%20Status%3Ainforce;rec=0#Sc-
11 Figures for dust and SO2 are taken from online analyser, while figures for NOx are taken from the annual stack sampling test.

SUSTAINING OUR ENVIRONMENTNEA SUSTAINABILITY REPORT FY13 37
MCC FY10 FY11 FY12 FY13 Emission Limit
HCl (mg/Nm3) NA 0.23 < 0.1 < 0.20 < 200
Dust (mg/Nm3) 42 50.1 19.2 61.05 < 100
SO2 (mg/Nm3) NA 7.2 <1.0 < 1.0 < 500
NOx (mg/Nm3) 60.5 44.7 261.6 599.9 < 700
CO (mg/Nm3) 2.4 1.6 1.0 < 1.0 < 625
The two NEA incineration plants and crematorium have met the regulatory limits. There has been no smoky emission from the chimneys as well, and no odour has been detected.
NEA values the well-being of each of our stakeholders and the environment we live in. This is why we strive to incorporate sustainable practices in our daily operations and meet the needs of stakeholders, without compromising on the quality of our living environment. We have incorporated design features in our incineration plants and crematoriums to ensure the proper management of flue-gas emission. For instance, our efficient process-control systems at our incineration plants control the rate of air distribution and refuse feed to ensure proper combustion in the furnace. The flue gas generated is then treated to remove pollutants such as hydrogen chloride and dioxin before being released through the chimney.
In addition, we have put in place an effective environmental management system that comprises a framework of processes and practices that boost NEA’s operations efficiency and minimise environmental impact. The system allows us to review our performance periodically through consistent control of our operations, enabling us to fulfil our environmental objectives.
Mandai Crematorium
Tuas Incineration Plant
Effluents and ComplianceDuring the incineration process, wastewater is collected from refuse bunkers and discharged from ash pits.
As NEA administers the Environmental Protection and Management Act (EPMA) and the Environmental Protection and Management (Trade Effluent) Regulations, which regulate the discharge of wastewater into open drains, canals and rivers, it is essential for us to walk the talk and comply with these regulations. Similarly, NEA has to comply with the Sewerage and Drainage Act (SDA) and the Sewerage and Drainage (Trade Effluent) Regulations administered by PUB, which require industries to treat their wastewater according to specific standards before discharging it into the sewer or watercourse.
12 We only conduct annual source-emission testing for our main crematorium – the Mandai Crematorium and Columbarium (MCC). This practice is beyond Environmental Protection and Management Act, Section 37, where our crematoriums are not required to do any annual source-emission testing.
NEA monitors the air emission from our crematoriums by taking annual readings to ensure the emission is kept within limits12. The results over the years are as follows:
38 NEA SUSTAINABILITY REPORT FY13SUSTAINING OUR ENVIRONMENT
The two NEA incineration plants have installed wastewater treatment plants to treat the acidity of effluent water to between six and nine. The plants receive and mix wastewater from the regeneration of activated carbon filters and demineralisers, refuse bunkers, ash pits and other sub-processes. In addition, the built-in sensors in the plants monitor the acidity of the wastewater. Hydrochloric acid or sodium hydroxide is added to the wastewater to ensure the pH level meets the stipulated range of pH6 to pH9 before it is discharged into the public sewer.
In FY2013, the amount of treated wastewater discharged into the sewer was 20,472m3 at TIP and 100,419 m3 at TSIP. The testing of wastewater quality is carried out on a regular basis to ensure that the discharge has been treated effectively.
Thereafter, the discharged wastewater is further treated by PUB before it is released into waterways.
RESOURCE CONSERVATION(Relevant G4 Material Aspects: Energy, Water and Waste)
The use of resources in NEA’s day-to-day operations has significant environmental impact.
NEA realises the need to put in place stringent resource management system to tackle the global environmental issue of resource scarcity, which can lead to escalating prices and climate change. Indeed, resources like
fuel and water are vital in our world. As an organisation, we believe that we can play a part in resource conservation by reducing our carbon footprint and adopting technological and infrastructural changes in our business operations.
This has led to us putting put in place two initiatives: the 8 Effective Habits – 10% Challenge and Eco-Office Certification. These initiatives allow NEA to closely monitor and manage our resource consumption – energy, water and paper, as well as engage our staff to be passionate environmental ambassadors. More importantly, the two initiatives ensure that we are on track to comply with the Public Sector Taking the Lead in Environmental Sustainability (PSTLES) and the Energy Conservation Act (ECA) requirements.
We have set the number of Monthly Rated Employees (MREs) as our Business Activity Indicator (BAI) for all NEA office premises and NEA industrial premises. Thus, this BAI will be the basis of our comparison for resource consumption throughout our reporting process.
• 8 Effective Habits – 10% Challenge
In October 2011, NEA committed to a five-year internal environmental awareness movement: the 8 Effective Habits – 10% Challenge.
General campaign stickers reminding our staff of the eight effective habits have been pasted at key locations and all workstations. The “habits” mapped out in the challenge are as follows (the picture next page):
IMPLEMENTATION OF ENVIRONMENTAL MONITORING AND MANAGEMENT PLAN FOR SEMAKAU LANDFILL PHASE IIAs part of the development for Semakau Landfill (SL) Phase II, NEA carried out an Environmental Impact Assessment (EIA) Study to assess the potential environmental impact arising from the works.
After the EIA Study, an Environmental Monitoring and Management Plan (EMMP) was implemented for the Phase II development works. The EMMP commenced on 1 November 2013, and is expected to be completed by June 2015 after the completion of the Phase II works.
As of 31 March 2014, the environmental baseline reporting has been established, encompassing the instrumentation survey, habitat survey, coral habitat relocation survey, and water and sediment quality survey. Thereafter, during the civil works and construction, the quality of the environment will be monitored. Any adverse changes will result in the implementation of immediate mitigation measures, preventing any impact on the surrounding marine environment.
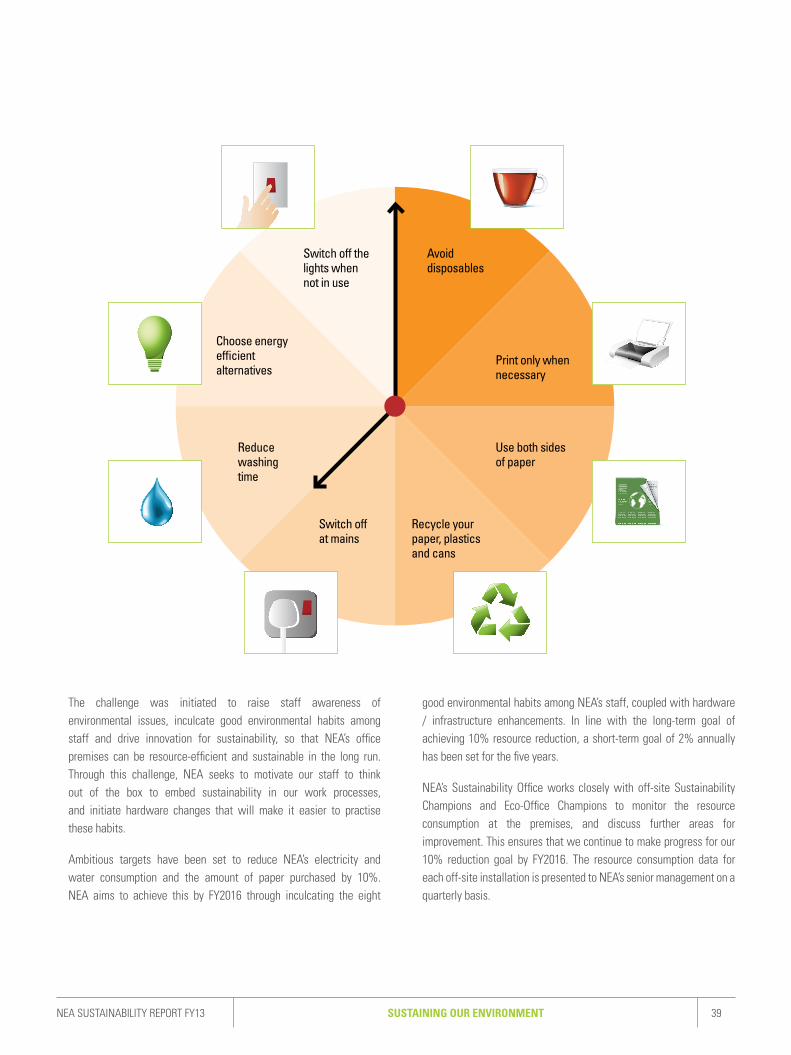
SUSTAINING OUR ENVIRONMENTNEA SUSTAINABILITY REPORT FY13 39
LOW RES
The challenge was initiated to raise staff awareness of environmental issues, inculcate good environmental habits among staff and drive innovation for sustainability, so that NEA’s office premises can be resource-efficient and sustainable in the long run. Through this challenge, NEA seeks to motivate our staff to think out of the box to embed sustainability in our work processes, and initiate hardware changes that will make it easier to practise these habits.
Ambitious targets have been set to reduce NEA’s electricity and water consumption and the amount of paper purchased by 10%. NEA aims to achieve this by FY2016 through inculcating the eight
good environmental habits among NEA’s staff, coupled with hardware / infrastructure enhancements. In line with the long-term goal of achieving 10% resource reduction, a short-term goal of 2% annually has been set for the five years.
NEA’s Sustainability Office works closely with off-site Sustainability Champions and Eco-Office Champions to monitor the resource consumption at the premises, and discuss further areas for improvement. This ensures that we continue to make progress for our 10% reduction goal by FY2016. The resource consumption data for each off-site installation is presented to NEA’s senior management on a quarterly basis.
Avoid disposables
Switch off the lights when not in use
Choose energyefficientalternatives
Reducewashing time
Print only when necessary
Use both sides of paper
Recycle your paper, plastics and cans
Switch off at mains
40 NEA SUSTAINABILITY REPORT FY13SUSTAINING OUR ENVIRONMENT
• Eco-Office Certification
NEA supports Eco-Office Certification – a collaboration between City Developments Limited (CDL) and the Singapore Environment Council (SEC) to encourage eco-friendly practices at Singapore’s offices.
The Eco-Office Certification recognises offices that have demonstrated commitment towards environmental protection, covering areas such as corporate environmental policy and responsibility, purchasing practices, energy and water conservation, waste minimisation, and recycling practices.
NEA first attained Eco-Office Certification for our offices in 2007. Since then, we have been undergoing the biennial re-certification. As mentioned in Chapter 2, in 2013, NEA’s 14 premises underwent the biennial re-assessment. Due to our increased scope of operations, four new premises were set up in 2012 to accommodate our expanded strength and capabilities. These four new offices were the Singapore Environment Institute (SEI) at Kay Siang Road, Centre for Climate Research Singapore (CCRS) at Kim Chuan Road, Department of Public Cleanliness (DPC) at Neythal Road and HDB Hub and Hawker Centres Division (HCD) at HDB Hub. Brief descriptions of the operations by the four offices are as follows:
FY2009 FY2010 FY2011 FY2012 FY2013 Targets13
Progress in Achieving Our
Targets
Electricity
NEA’s office premises (kWh/MRE) 2,370 2,210 2,136 2,141 2,017 To reduce consumption by 10% below BAU in FY2016
√
NEA’s industrial premises14 (kWh/MRE) 419,354 434,821 438,278 457,199 452,158 X15
Water
NEA’s office premises (m3/MRE) 12.69 11.85 10.98 11.46 12.57 To reduce consumption by 10% below BAU in FY2016
√16
NEA’s industrial premises (m3/MRE) 133.91 147.43 158.01 165.20 168 √15
Paper
All premises (A4 reams/MRE) 6.54 5.74 4.67 4.71 4.19To reduce paper purchased by 10% based on FY2010
levels by FY2016√
13 The targets for the 10% reduction for electricity, water and paper consumption are based on the FY2016 business-as-usual levels that are computed from the FY2009-2011 consumption data.
14 All electricity consumed at the incineration plants is self-generated by the waste burnt at the plants.
15 Electricity and water consumption at NEA’s industrial premises are related to factors beyond NEA’s control (e.g. amount and type of waste being burnt, number of visitors).
16 The increase was mainly attributed to the expansion of operations at four new premises, which were set up in FY2012, as well as the water incidents such as leakage of underground water pipes.
The table below summarises our annual resource consumption and our progress towards our 10% reduction targets:
Offsite Premises
Description
SEI SEI is the training and knowledge division of NEA. Within NEA, SEI distils and documents the knowledge residing with experienced staff, as well as knowledge from other relevant sources, for transfer to the next generation of officers via its training programmes. The Institute also develops and up-skills the local industry’s manpower capabilities, thereby adding value to Singapore’s environmental arena.
CCRS CCRS was established under the Meteorological Service Singapore (MSS) which aims to advance scientific understanding and prediction of the weather and climate of Singapore. It is the first in the world to use high resolution computer models to simulate weather and climate over Singapore and the wider Southeast Asia region.
DPC at Neythal Road and HDB Hub
In order to strengthen our Whole-Of-Government efforts to keep Singapore a clean, green and liveable city, the DPC was formed in April 2012 to manage and ensure the cleanliness of public areas and integrates the cleaning of public areas.
H C D a t HDB Hub
HCD manages and regulates markets and hawker centres in Singapore. Roles include management of tenancies, licences and public health aspects of the centres and oversee the upgrading of markets and hawker centres.
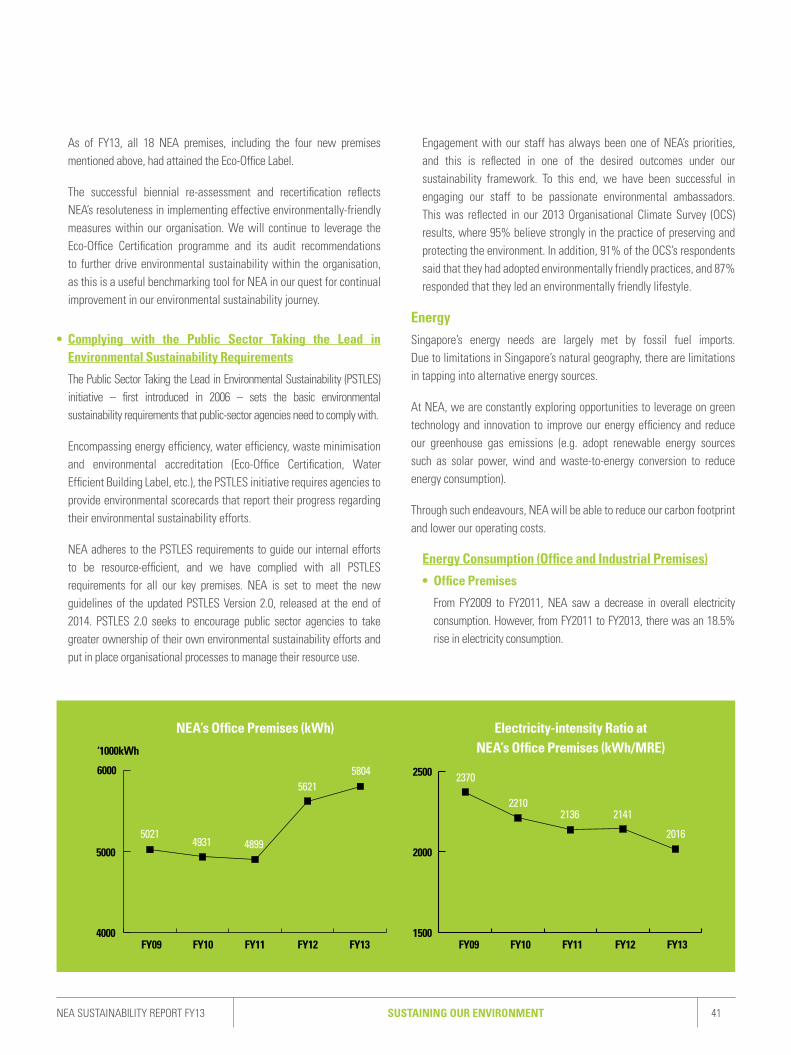
SUSTAINING OUR ENVIRONMENTNEA SUSTAINABILITY REPORT FY13 41
As of FY13, all 18 NEA premises, including the four new premises mentioned above, had attained the Eco-Office Label.
The successful biennial re-assessment and recertification reflects NEA’s resoluteness in implementing effective environmentally-friendly measures within our organisation. We will continue to leverage the Eco-Office Certification programme and its audit recommendations to further drive environmental sustainability within the organisation, as this is a useful benchmarking tool for NEA in our quest for continual improvement in our environmental sustainability journey.
• Complying with the Public Sector Taking the Lead in Environmental Sustainability Requirements
The Public Sector Taking the Lead in Environmental Sustainability (PSTLES) initiative – first introduced in 2006 – sets the basic environmental sustainability requirements that public-sector agencies need to comply with.
Encompassing energy efficiency, water efficiency, waste minimisation and environmental accreditation (Eco-Office Certification, Water Efficient Building Label, etc.), the PSTLES initiative requires agencies to provide environmental scorecards that report their progress regarding their environmental sustainability efforts.
NEA adheres to the PSTLES requirements to guide our internal efforts to be resource-efficient, and we have complied with all PSTLES requirements for all our key premises. NEA is set to meet the new guidelines of the updated PSTLES Version 2.0, released at the end of 2014. PSTLES 2.0 seeks to encourage public sector agencies to take greater ownership of their own environmental sustainability efforts and put in place organisational processes to manage their resource use.
Engagement with our staff has always been one of NEA’s priorities, and this is reflected in one of the desired outcomes under our sustainability framework. To this end, we have been successful in engaging our staff to be passionate environmental ambassadors. This was reflected in our 2013 Organisational Climate Survey (OCS) results, where 95% believe strongly in the practice of preserving and protecting the environment. In addition, 91% of the OCS’s respondents said that they had adopted environmentally friendly practices, and 87% responded that they led an environmentally friendly lifestyle.
EnergySingapore’s energy needs are largely met by fossil fuel imports. Due to limitations in Singapore’s natural geography, there are limitations in tapping into alternative energy sources.
At NEA, we are constantly exploring opportunities to leverage on green technology and innovation to improve our energy efficiency and reduce our greenhouse gas emissions (e.g. adopt renewable energy sources such as solar power, wind and waste-to-energy conversion to reduce energy consumption).
Through such endeavours, NEA will be able to reduce our carbon footprint and lower our operating costs.
Energy Consumption (Office and Industrial Premises)
• Office Premises
From FY2009 to FY2011, NEA saw a decrease in overall electricity consumption. However, from FY2011 to FY2013, there was an 18.5% rise in electricity consumption.
6000 2500
20005000
4000 1500
NEA’s Office Premises (kWh) Electricity-intensity Ratio at NEA’s Office Premises (kWh/MRE)
50214931 4899
56215804 2370
22102136 2141
2016
‘1000kWh
FY09 FY10 FY11 FY12 FY13 FY09 FY10 FY11 FY12 FY13
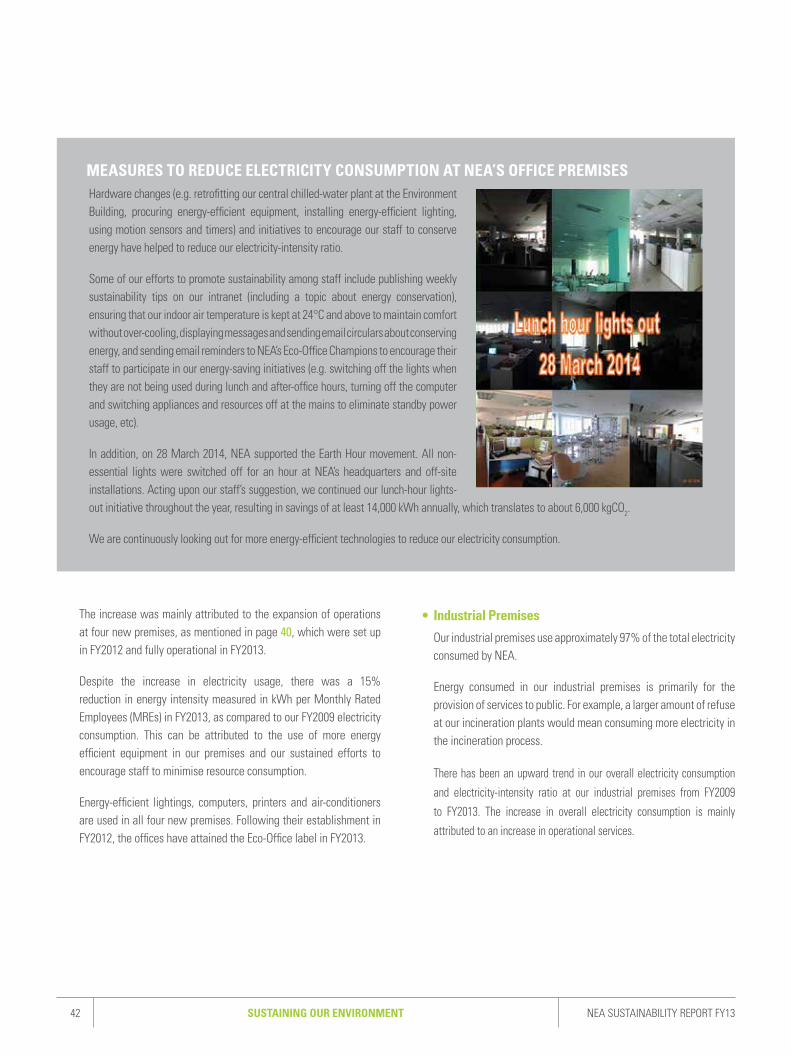
42 NEA SUSTAINABILITY REPORT FY13SUSTAINING OUR ENVIRONMENT
MEASURES TO REDUCE ELECTRICITY CONSUMPTION AT NEA’S OFFICE PREMISESHardware changes (e.g. retrofitting our central chilled-water plant at the Environment Building, procuring energy-efficient equipment, installing energy-efficient lighting, using motion sensors and timers) and initiatives to encourage our staff to conserve energy have helped to reduce our electricity-intensity ratio.
Some of our efforts to promote sustainability among staff include publishing weekly sustainability tips on our intranet (including a topic about energy conservation), ensuring that our indoor air temperature is kept at 24°C and above to maintain comfort without over-cooling, displaying messages and sending email circulars about conserving energy, and sending email reminders to NEA’s Eco-Office Champions to encourage their staff to participate in our energy-saving initiatives (e.g. switching off the lights when they are not being used during lunch and after-office hours, turning off the computer and switching appliances and resources off at the mains to eliminate standby power usage, etc).
In addition, on 28 March 2014, NEA supported the Earth Hour movement. All non-essential lights were switched off for an hour at NEA’s headquarters and off-site installations. Acting upon our staff’s suggestion, we continued our lunch-hour lights-out initiative throughout the year, resulting in savings of at least 14,000 kWh annually, which translates to about 6,000 kgCO2.
We are continuously looking out for more energy-efficient technologies to reduce our electricity consumption.
The increase was mainly attributed to the expansion of operations at four new premises, as mentioned in page 40, which were set up in FY2012 and fully operational in FY2013.
Despite the increase in electricity usage, there was a 15% reduction in energy intensity measured in kWh per Monthly Rated Employees (MREs) in FY2013, as compared to our FY2009 electricity consumption. This can be attributed to the use of more energy efficient equipment in our premises and our sustained efforts to encourage staff to minimise resource consumption.
Energy-efficient lightings, computers, printers and air-conditioners are used in all four new premises. Following their establishment in FY2012, the offices have attained the Eco-Office label in FY2013.
• Industrial Premises
Our industrial premises use approximately 97% of the total electricity consumed by NEA.
Energy consumed in our industrial premises is primarily for the provision of services to public. For example, a larger amount of refuse at our incineration plants would mean consuming more electricity in the incineration process.
There has been an upward trend in our overall electricity consumption
and electricity-intensity ratio at our industrial premises from FY2009
to FY2013. The increase in overall electricity consumption is mainly
attributed to an increase in operational services.
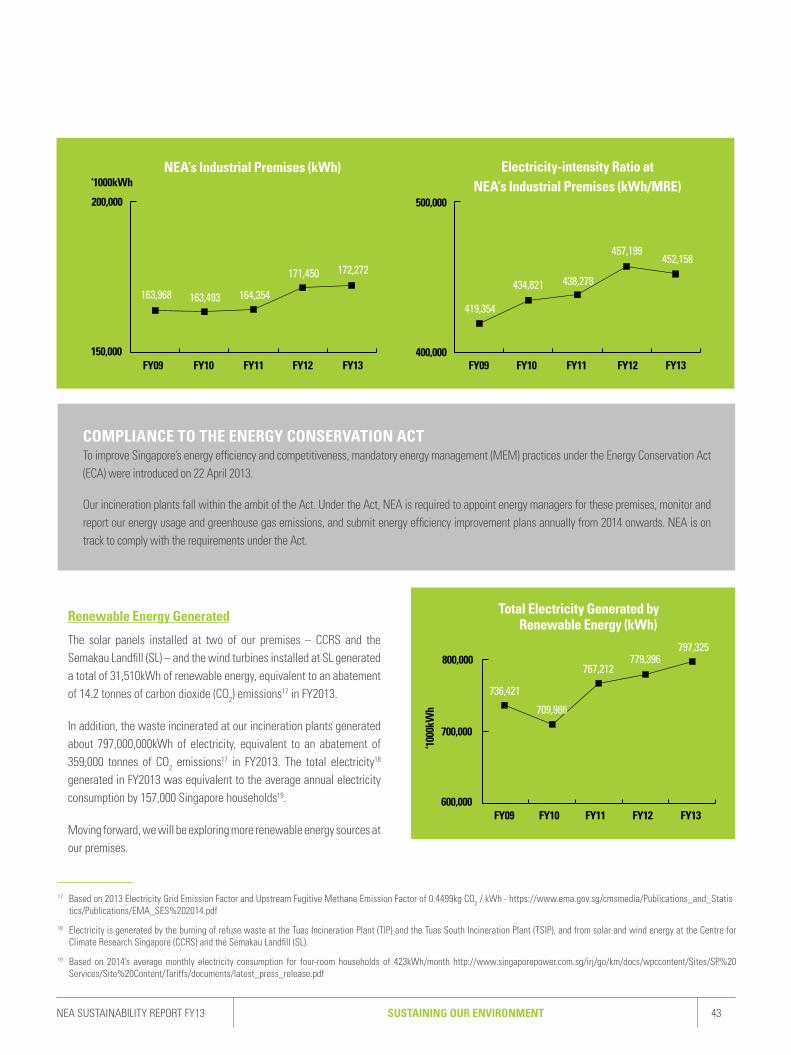
SUSTAINING OUR ENVIRONMENTNEA SUSTAINABILITY REPORT FY13 43
COMPLIANCE TO THE ENERGY CONSERVATION ACTTo improve Singapore’s energy efficiency and competitiveness, mandatory energy management (MEM) practices under the Energy Conservation Act (ECA) were introduced on 22 April 2013.
Our incineration plants fall within the ambit of the Act. Under the Act, NEA is required to appoint energy managers for these premises, monitor and report our energy usage and greenhouse gas emissions, and submit energy efficiency improvement plans annually from 2014 onwards. NEA is on track to comply with the requirements under the Act.
Total Electricity Generated by Renewable Energy (kWh)
800,000
700,000
600,000
736,421
709,986
767,212779,396
797,325
‘100
0kW
h
FY09 FY10 FY11 FY12 FY13
Renewable Energy Generated
The solar panels installed at two of our premises – CCRS and the Semakau Landfill (SL) – and the wind turbines installed at SL generated a total of 31,510kWh of renewable energy, equivalent to an abatement of 14.2 tonnes of carbon dioxide (CO2) emissions17 in FY2013.
In addition, the waste incinerated at our incineration plants generated about 797,000,000kWh of electricity, equivalent to an abatement of 359,000 tonnes of CO2 emissions17 in FY2013. The total electricity18
generated in FY2013 was equivalent to the average annual electricity consumption by 157,000 Singapore households19.
Moving forward, we will be exploring more renewable energy sources at our premises.
17 Based on 2013 Electricity Grid Emission Factor and Upstream Fugitive Methane Emission Factor of 0.4499kg CO2 / kWh - https://www.ema.gov.sg/cmsmedia/Publications_and_Statis tics/Publications/EMA_SES%202014.pdf
18 Electricity is generated by the burning of refuse waste at the Tuas Incineration Plant (TIP) and the Tuas South Incineration Plant (TSIP), and from solar and wind energy at the Centre for Climate Research Singapore (CCRS) and the Semakau Landfill (SL).
19 Based on 2014’s average monthly electricity consumption for four-room households of 423kWh/month http://www.singaporepower.com.sg/irj/go/km/docs/wpccontent/Sites/SP%20Services/Site%20Content/Tariffs/documents/latest_press_release.pdf
NEA’s Industrial Premises (kWh) Electricity-intensity Ratio at NEA’s Industrial Premises (kWh/MRE)
200,000
150,000FY09 FY10 FY11 FY12 FY13
163,968 163,493 164,354
171,450 172,272
500,000
400,000
419,354
434,821 438,278
457,199452,158
FY09 FY10 FY11 FY12 FY13
‘1000kWh

44 NEA SUSTAINABILITY REPORT FY13SUSTAINING OUR ENVIRONMENT
NEA’s Corporate Carbon Footprint for FY2013 Tonnes of CO2 Percentage (%) Rank
Direct Carbon Emissions (Scope 1)
Waste incineration21 896,535 50.99% 1
NEA-owned vehicles22 958 0.05% 6
LPG and town gas23 1,831 0.10% 5
Indirect Carbon Emissions (Scope 2)
Electricity (NEA’s office premises)24 2,611 0.15% 4
Electricity (NEA’s installations)24 77,505 4.41% 3
Sub-total CO2 Emissions (Scope 1 & 2) 1,062,345
Indirect Carbon Emissions (Scope 3)
Local25 staff business travel 397 0.02% 7
Overseas26 business travel (flights only) 778,378 44.27% 2
Total CO2 Emissions 1,758,215
20 Based on data for 2012.
21 CO2 emissions from waste incineration at TIP and TSIP are estimated from the portion of the waste that is fossil fuel based and the biomass fraction is excluded, in accordance to the 2006 IPCC guidelines for National Greenhouse Gas Inventories. According to the IPCC Guidelines, CH4 emissions from waste incineration are not likely to be significant because of the combus-tion conditions in incinerators.
As for the waste data used in the calculation of emissions, the total % plastic waste incinerated in 2013 is assumed to be similar to the % plastic waste incinerated in TIP and TSIP in FY2013. The 2013 waste data can be obtained from pages 67 and 82 of the Environmental Protection Division 2013 online report: http://www.nea.gov.sg/docs/default-source/training-knowledge-hub/publications/neareport2013.pdf?sfvrsn=2
22 Carbon emission calculated for NEA-owned vehicles which includes cars, vans and motorcycles, where they are fuelled by diesel, petrol or electricity - motor-vehicle fuel efficiency obtained from: http://www.lta.gov.sg/content/dam/ltaweb/corp/PublicationsResearch/files/FactsandFigures/Statistics_in_Brief_2009.pdf
23 Based on 69m3 LPG and 8.65GWh town gas consumed in FY2013, carbon emission is calculated for LPG and town gas used at the Choa Chu Kang and Mandai crematoriums respectively (usage directly related to factors beyond NEA’s control, such as the number of after-death services required and number of visitors).
24 Based on 2013 Electricity Grid Emission Factor and Upstream Fugitive Methane Emission Factor of 0.4499kg CO2 / kWh. https://www.ema.gov.sg/cmsmedia/Publications_and_Statistics/Publications/EMA_SES%202014.pdf
25 Carbon emission is calculated based on local business travel (by staff vehicles, assuming that the cars are fuelled by petrol and the motorcycles fuelled by diesel), not including staff travel to and from home.
26 Carbon emission factors and distance travelled are calculated from: http://www2.icao.int/en/carbonoffset/Pages/default.aspx and http://www.gcmap.com/
Corporate Carbon Footprint for FY2013
In Singapore, CO2 emission from the combustion of fossil fuels makes up 95%20 of Singapore’s total greenhouse gas emission.
NEA reports our Corporate Carbon Footprint which is calculated in-house according to “The Greenhouse Gas Protocol: A Corporate Accounting and Reporting Standard” set by the World Business Council for Sustainable Development (WBCSD) and the World Resources Institute (WRI), as we believe this standard provides the best tool for reporting about corporate emission. The methodology for calculating our CO2 emission is also in line with the 1996 Intergovernmental Panel on Climate Change (IPCC) guidelines, which Singapore uses for international reporting to the United Nations Framework Convention on Climate Change.
NEA’s waste incineration and overseas business travel were the main contributor to NEA’s corporate carbon footprint FY2013.
As Singapore adopts waste-to-energy incineration technology to reduce the volume of waste disposed at landfill since 1970s, incinerable waste that are not recycled are disposed at our waste-to-energy incineration plants. Out of the four waste-to-energy incineration plants, NEA manages and owns the Tuas Incineration Plant and Tuas South Incineration Plant, which emits 896,535 tonnes of CO2. In order to reduce emissions from the waste incineration process, NEA aims to increase the national recycling rate to 70% by 2030 under the Sustainable Singapore Blueprint.
As for the carbon emission arising from overseas business travel, we have put in process to minimise unnecessary overseas business travel.

SUSTAINING OUR ENVIRONMENTNEA SUSTAINABILITY REPORT FY13 45
40,000 15
30,000
20,000 12
10,000
90
NEA’s Office Premises (m3) Water-intensity Ratio at NEA’s Office Premises (m3/MRE)
FY09 FY09FY10 FY10FY11 FY11FY12 FY12FY13 FY13
25,727 24,837 23,70626,184
31,225
12.69
11.85
10.9811.46
12.57
There is a thorough evaluation process in place to ensure that every overseas travel request is properly justified by NEA’s departments and
approved by our Chief Executive Officer (CEO).
Water Due to water scarcity in Singapore, our supply of water is obtained through import, desalination, NEWater (i.e. high-grade reclaimed water) and local catchments, so as to meet the needs and demands of the people.
Recognising that water is precious in Singapore, and that its usage affects our operational cost, NEA’s management implemented a 10% challenge to reduce our water consumption by FY2016. To this end, NEA has installed water-efficient fittings and has attained the Water Efficient Building Label issued by Singapore’s national water agency, PUB, for all our 18 premises. NEA also practises rainwater harvesting, consumes NEWater and encourages our staff to practise water conservation.
In addition, NEA has water-reduction plans to minimise water usage for our premises, which can be implemented during dry spells. Some examples include withholding the option to wash vehicles, discontinuing water features and fountains, suspending the usage of high-pressure jets and hoses for washing activities, and avoiding unnecessary watering of plants and turf.
Water Consumption (Office and Industrial Premises)
• Office Premises
From FY2009 to FY2011, NEA saw a decreased in overall water consumption. However, from FY2011 to FY2013, there was a 31.7% rise in water consumption.
The increase was mainly attributed to the expansion of operations at four new premises, which were set up in FY2012, as mentioned on page 40 as well as the water incidents such as leakage of underground water pipes. Following the incidents, we have put in place a more effective mitigation system to ensure Eco-Office Committee monitor water usage patterns and report any anomalous water consumption that requires immediate rectification.
Water-efficient fittings and flow regulators are installed in all taps at the four new premises. Following their establishment in FY2012, the offices have achieved the Public Utilities Board’s Water Efficient Building (WEB) Label.
• Industrial Premises
Our industrial premises account for approximately 70% of the total water consumption at NEA’s premises.
Water consumed in our industrial premises is primarily for the provision of services to public. For example, an increased in after-death services at our crematoriums and columbarium would mean a higher number of visitors. This would result in an increase usage of sanitation facilities and thus lead to the increase in the water consumption.
There has been an upward trend in our overall water consumption and water-intensity ratio at our industrial premises from FY2009 to FY2013. The increase in overall water consumption is mainly attributed to an increase in operational services.
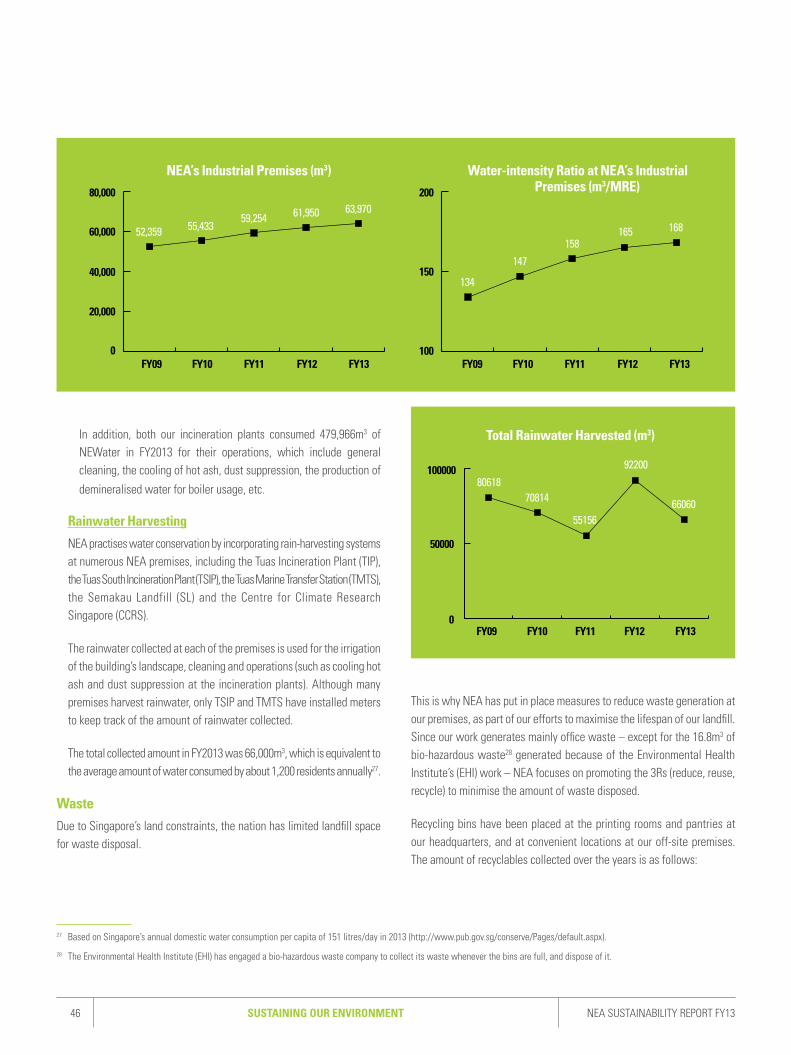
46 NEA SUSTAINABILITY REPORT FY13SUSTAINING OUR ENVIRONMENT
In addition, both our incineration plants consumed 479,966m3 of NEWater in FY2013 for their operations, which include general cleaning, the cooling of hot ash, dust suppression, the production of
demineralised water for boiler usage, etc.
Rainwater Harvesting
NEA practises water conservation by incorporating rain-harvesting systems at numerous NEA premises, including the Tuas Incineration Plant (TIP), the Tuas South Incineration Plant (TSIP), the Tuas Marine Transfer Station (TMTS), the Semakau Landfill (SL) and the Centre for Climate Research Singapore (CCRS).
The rainwater collected at each of the premises is used for the irrigation of the building’s landscape, cleaning and operations (such as cooling hot ash and dust suppression at the incineration plants). Although many premises harvest rainwater, only TSIP and TMTS have installed meters to keep track of the amount of rainwater collected.
The total collected amount in FY2013 was 66,000m3, which is equivalent to the average amount of water consumed by about 1,200 residents annually27.
WasteDue to Singapore’s land constraints, the nation has limited landfill space for waste disposal.
This is why NEA has put in place measures to reduce waste generation at our premises, as part of our efforts to maximise the lifespan of our landfill. Since our work generates mainly office waste – except for the 16.8m3 of bio-hazardous waste28 generated because of the Environmental Health Institute’s (EHI) work – NEA focuses on promoting the 3Rs (reduce, reuse, recycle) to minimise the amount of waste disposed.
Recycling bins have been placed at the printing rooms and pantries at our headquarters, and at convenient locations at our off-site premises. The amount of recyclables collected over the years is as follows:
Total Rainwater Harvested (m3)
100000
50000
0
8061870814
55156
92200
66060
FY09 FY10 FY11 FY12 FY13
NEA’s Industrial Premises (m3) Water-intensity Ratio at NEA’s Industrial Premises (m3/MRE)80,000 200
60,000
15040,000
100
20,000
0FY09 FY10 FY11 FY12 FY13 FY09 FY10 FY11 FY12 FY13
52,359 55,43359,254 61,950 63,970
134
147
158165 168
27 Based on Singapore’s annual domestic water consumption per capita of 151 litres/day in 2013 (http://www.pub.gov.sg/conserve/Pages/default.aspx).
28 The Environmental Health Institute (EHI) has engaged a bio-hazardous waste company to collect its waste whenever the bins are full, and dispose of it.
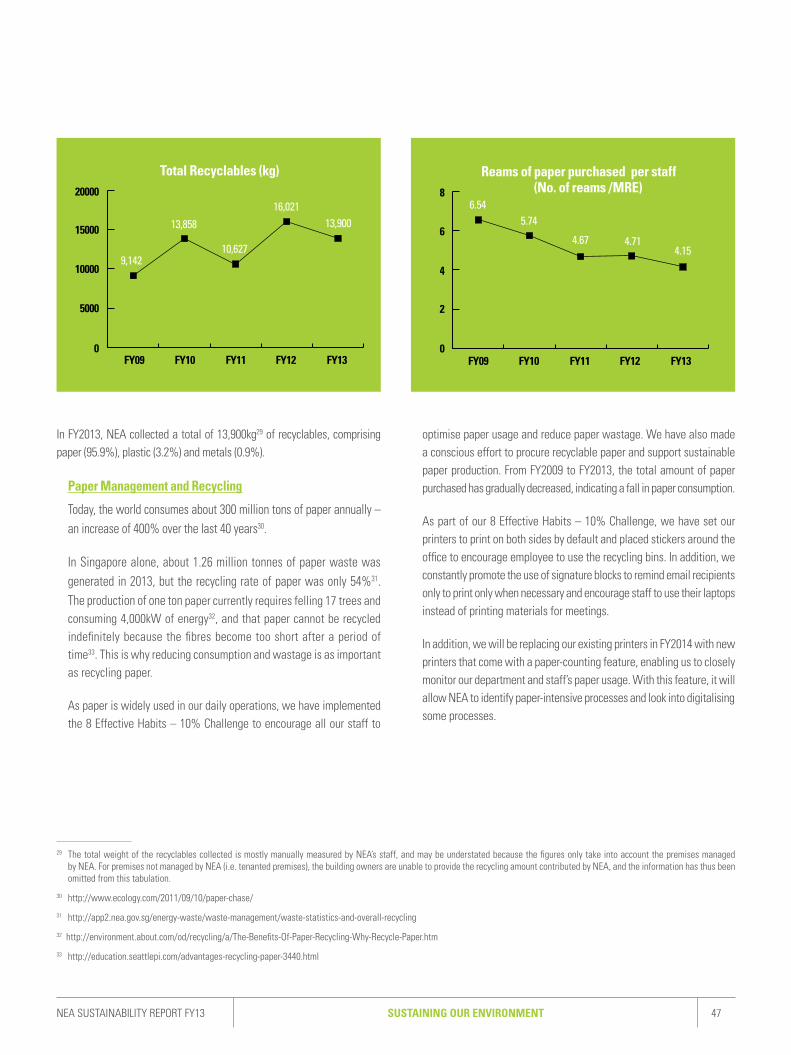
SUSTAINING OUR ENVIRONMENTNEA SUSTAINABILITY REPORT FY13 47
Total Recyclables (kg)20000
15000
10000
5000
0FY09 FY10 FY11 FY12 FY13
9,142
13,858
10,627
16,02113,900
Reams of paper purchased per staff (No. of reams /MRE)
6.545.74
4.67 4.714.15
8
6
4
2
0FY09 FY10 FY11 FY12 FY13
29 The total weight of the recyclables collected is mostly manually measured by NEA’s staff, and may be understated because the figures only take into account the premises managed by NEA. For premises not managed by NEA (i.e. tenanted premises), the building owners are unable to provide the recycling amount contributed by NEA, and the information has thus been omitted from this tabulation.
30 http://www.ecology.com/2011/09/10/paper-chase/
31 http://app2.nea.gov.sg/energy-waste/waste-management/waste-statistics-and-overall-recycling
32 http://environment.about.com/od/recycling/a/The-Benefits-Of-Paper-Recycling-Why-Recycle-Paper.htm
33 http://education.seattlepi.com/advantages-recycling-paper-3440.html
In FY2013, NEA collected a total of 13,900kg29 of recyclables, comprising paper (95.9%), plastic (3.2%) and metals (0.9%).
Paper Management and Recycling
Today, the world consumes about 300 million tons of paper annually – an increase of 400% over the last 40 years30.
In Singapore alone, about 1.26 million tonnes of paper waste was generated in 2013, but the recycling rate of paper was only 54%31. The production of one ton paper currently requires felling 17 trees and consuming 4,000kW of energy32, and that paper cannot be recycled indefinitely because the fibres become too short after a period of time33. This is why reducing consumption and wastage is as important as recycling paper.
As paper is widely used in our daily operations, we have implemented the 8 Effective Habits – 10% Challenge to encourage all our staff to
optimise paper usage and reduce paper wastage. We have also made a conscious effort to procure recyclable paper and support sustainable paper production. From FY2009 to FY2013, the total amount of paper purchased has gradually decreased, indicating a fall in paper consumption.
As part of our 8 Effective Habits – 10% Challenge, we have set our printers to print on both sides by default and placed stickers around the office to encourage employee to use the recycling bins. In addition, we constantly promote the use of signature blocks to remind email recipients only to print only when necessary and encourage staff to use their laptops instead of printing materials for meetings.
In addition, we will be replacing our existing printers in FY2014 with new printers that come with a paper-counting feature, enabling us to closely monitor our department and staff’s paper usage. With this feature, it will allow NEA to identify paper-intensive processes and look into digitalising some processes.
TOWARDS BETTER SOCIAL SUSTAINABILITYNEA STRIVES TO CREATE A RISK CULTURE, ENCOURAGE LIFE-LONG LEARNING AND PROMOTE WORK-LIFE BALANCE, WHILE NURTURING OUR PEOPLE TO GIVE BACK TO THE COMMUNITY.

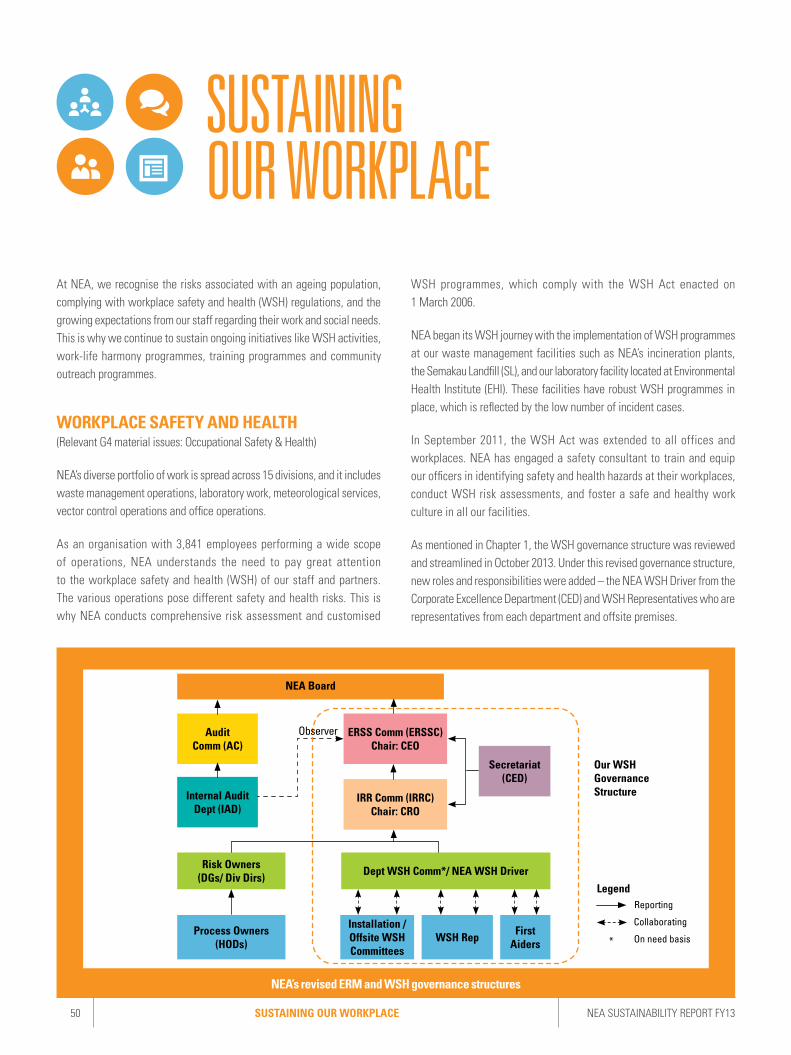
50 NEA SUSTAINABILITY REPORT FY13 SUSTAINING OUR WORKPLACE
SUSTAINING OUR WORKPLACE
At NEA, we recognise the risks associated with an ageing population, complying with workplace safety and health (WSH) regulations, and the growing expectations from our staff regarding their work and social needs. This is why we continue to sustain ongoing initiatives like WSH activities, work-life harmony programmes, training programmes and community outreach programmes.
WORKPLACE SAFETY AND HEALTH(Relevant G4 material issues: Occupational Safety & Health)
NEA’s diverse portfolio of work is spread across 15 divisions, and it includes waste management operations, laboratory work, meteorological services, vector control operations and office operations.
As an organisation with 3,841 employees performing a wide scope of operations, NEA understands the need to pay great attention to the workplace safety and health (WSH) of our staff and partners. The various operations pose different safety and health risks. This is why NEA conducts comprehensive risk assessment and customised
WSH programmes, which comply with the WSH Act enacted on 1 March 2006.
NEA began its WSH journey with the implementation of WSH programmes at our waste management facilities such as NEA’s incineration plants, the Semakau Landfill (SL), and our laboratory facility located at Environmental Health Institute (EHI). These facilities have robust WSH programmes in place, which is reflected by the low number of incident cases.
In September 2011, the WSH Act was extended to all offices and workplaces. NEA has engaged a safety consultant to train and equip our officers in identifying safety and health hazards at their workplaces, conduct WSH risk assessments, and foster a safe and healthy work culture in all our facilities.
As mentioned in Chapter 1, the WSH governance structure was reviewed and streamlined in October 2013. Under this revised governance structure, new roles and responsibilities were added – the NEA WSH Driver from the Corporate Excellence Department (CED) and WSH Representatives who are representatives from each department and offsite premises.
NEA’s revised ERM and WSH governance structures
NEA Board
Audit Comm (AC)
ERSS Comm (ERSSC)Chair: CEO
Secretariat(CED)
Our WSH Governance Structure
Legend
IRR Comm (IRRC)Chair: CRO
Internal Audit Dept (IAD)
Risk Owners (DGs/ Div Dirs)
Process Owners(HODs)
Installation /Offsite WSH Committees
WSH Rep First Aiders
Dept WSH Comm*/ NEA WSH Driver
Reporting
Collaborating
On need basis*
Observer
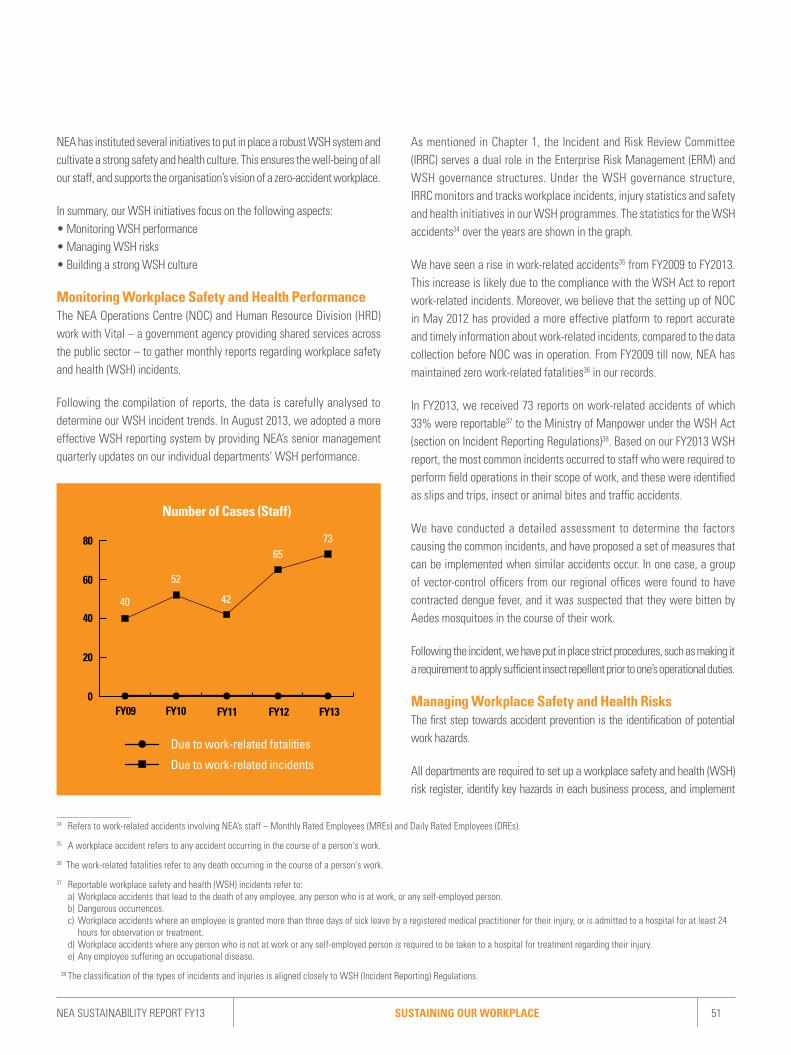
SUSTAINING OUR WORKPLACENEA SUSTAINABILITY REPORT FY13 51
NEA has instituted several initiatives to put in place a robust WSH system and cultivate a strong safety and health culture. This ensures the well-being of all our staff, and supports the organisation’s vision of a zero-accident workplace.
In summary, our WSH initiatives focus on the following aspects:• Monitoring WSH performance• Managing WSH risks• Building a strong WSH culture
Monitoring Workplace Safety and Health PerformanceThe NEA Operations Centre (NOC) and Human Resource Division (HRD) work with Vital – a government agency providing shared services across the public sector – to gather monthly reports regarding workplace safety and health (WSH) incidents.
Following the compilation of reports, the data is carefully analysed to determine our WSH incident trends. In August 2013, we adopted a more effective WSH reporting system by providing NEA’s senior management quarterly updates on our individual departments’ WSH performance.
As mentioned in Chapter 1, the Incident and Risk Review Committee (IRRC) serves a dual role in the Enterprise Risk Management (ERM) and WSH governance structures. Under the WSH governance structure, IRRC monitors and tracks workplace incidents, injury statistics and safety and health initiatives in our WSH programmes. The statistics for the WSH accidents34 over the years are shown in the graph.
We have seen a rise in work-related accidents35 from FY2009 to FY2013. This increase is likely due to the compliance with the WSH Act to report work-related incidents. Moreover, we believe that the setting up of NOC in May 2012 has provided a more effective platform to report accurate and timely information about work-related incidents, compared to the data collection before NOC was in operation. From FY2009 till now, NEA has maintained zero work-related fatalities36 in our records.
In FY2013, we received 73 reports on work-related accidents of which 33% were reportable37 to the Ministry of Manpower under the WSH Act (section on Incident Reporting Regulations)38. Based on our FY2013 WSH report, the most common incidents occurred to staff who were required to perform field operations in their scope of work, and these were identified as slips and trips, insect or animal bites and traffic accidents.
We have conducted a detailed assessment to determine the factors causing the common incidents, and have proposed a set of measures that can be implemented when similar accidents occur. In one case, a group of vector-control officers from our regional offices were found to have contracted dengue fever, and it was suspected that they were bitten by Aedes mosquitoes in the course of their work.
Following the incident, we have put in place strict procedures, such as making it a requirement to apply sufficient insect repellent prior to one’s operational duties.
Managing Workplace Safety and Health RisksThe first step towards accident prevention is the identification of potential work hazards.
All departments are required to set up a workplace safety and health (WSH) risk register, identify key hazards in each business process, and implement
Number of Cases (Staff)
80
60
40
20
0FY09 FY10 FY11 FY12 FY13
40
52
6573
42
Due to work-related fatalities
Due to work-related incidents
34 Refers to work-related accidents involving NEA’s staff – Monthly Rated Employees (MREs) and Daily Rated Employees (DREs).
35 A workplace accident refers to any accident occurring in the course of a person's work.
36 The work-related fatalities refer to any death occurring in the course of a person's work.
37 Reportable workplace safety and health (WSH) incidents refer to: a) Workplace accidents that lead to the death of any employee, any person who is at work, or any self-employed person. b) Dangerous occurrences. c) Workplace accidents where an employee is granted more than three days of sick leave by a registered medical practitioner for their injury, or is admitted to a hospital for at least 24
hours for observation or treatment. d) Workplace accidents where any person who is not at work or any self-employed person is required to be taken to a hospital for treatment regarding their injury. e) Any employee suffering an occupational disease.
38 The classification of the types of incidents and injuries is aligned closely to WSH (Incident Reporting) Regulations.

52 NEA SUSTAINABILITY REPORT FY13 SUSTAINING OUR WORKPLACE
appropriate control measures to eliminate or reduce safety risks at the workplace. The risk registers are endorsed by the head of department, who receives monthly updates regarding injury statistics.
Our NEA Operations Centre (NOC) functions as a centralised contact point for incident tracking and response for all work-related incidents. Incidents involving the safety and health of the public, staff, and contractors will be reported to NOC, which will determine their severity and escalate the matter to NEA’s management.
We have identified our waste-management facilities – NEA’s incineration plants, the Tuas Marine Transfer Station (TMTS) and the Semakau Landfill (SL) – as operationally intensive work areas. Workplace Safety and Health Officers (WSHOs) from external WSH consultancy firms have been engaged to assist in identifying and managing workplace hazards on-site.
In addition, the WSHOs conduct safety audits on a weekly basis to identify lapses and provide remedial measures to ensure that our employees and contractors perform their tasks safely. Monthly management walkabouts led by the General Manager of each facility and checks on NEA’s employees and contractors also ensure our full compliance with the WSH Act and its subsidiary legislation. Users of the IP are also expected to be trained in workplace safety and observe our safety rules and regulations.
At the NEA Induction Programme for our new employees, WSH is emphasised as well. First-aid training and WSH risk assessment courses are also conducted to equip NEA’s staff with the knowledge to identify and fine-tune existing WSH programmes.
Building a Strong Workplace Safety and Health CultureNEA believes that inculcating a strong workplace safety and health (WSH culture is as important as implementing a robust system to manage WSH risks.
Because of this, we have provided various safety and health courses, staff briefing sessions and communication messages to build our WSH culture across the organisation. The information that has been disseminated for the different types of work and levels has also been tailored to communicate a clear message and promote good practices.
Listed below are some of our initiatives:
• Training and Staff Briefing SessionsInstilling the importance of workplace safety and health (WSH) for our newcomers from day one is paramount in our goal to be an accident-free organisation.
The induction programme for all new employees incorporates a segment emphasising the importance of safety and health. In addition, the WSH
orientation is compulsory for those working at operationally intensive work areas, such as our incineration plants.
For existing staff, WSH education is included as part of NEA’s overall training and learning plan. Regular safety and health training and refresher training sessions are also conducted. Some of the topics covered in the training courses include Risk Assessments, First Aid, Safe Use of Cranes and Lifting Equipment, Oil and Chemical Spillage Training, Proper Use of Personal Protective Equipment, Fire Safety, Chemical Safety, and Biosafety Briefing Sessions. Key external contractors also have to undergo training to meet our WSH requirements.
At NEA, we understand that there is no room for complacency in our drive to completely eliminate accidents from the workplace, and that is why we are working to put in place a more structured training plan for all our staff. This involves both general WSH training and awareness, and specialised training for those who have WSH responsibilities.
• Off-site Briefing Sessions Safety toolbox meetings and workplace safety and health (WSH) briefing
sessions are regularly led by field supervisors to inform our staff – including all Daily Rated Employees (DREs) – about safety and health rules and practices. We have also taken it a step further, to send some of our DREs for WSH courses.
• Preventive Learning NEA studies and analyses all near-missed and work-related incidents
to facilitate learning. This allows us to weed out root causes, eliminate hazards and prevent recurring incidents.
• Drills and Exercises Drills and exercises are carried out to test the readiness of our staff in
dealing with crises or incidents at the workplace. For example, a large-scale emergency evacuation drill is held at each NEA office annually.
• Workplace Safety and Health Communication Messages To raise awareness of the importance of workplace safety and health
(WSH) across our offices, we have communicated safety and health messages using internal email broadcasting and poster displays.
• NEA Workplace Safety and Health Annual Report We have put together an annual report to give our stakeholders a detailed
account of workplace incidents, injury statistics, implemented safety and health initiatives, and recommended measures to address workplace safety and health (WSH) challenges. The report also serves as a platform for NEA’s senior management to reflect upon and further improve our WSH processes.

SUSTAINING OUR WORKPLACENEA SUSTAINABILITY REPORT FY13 53
• Safety and Health Week / Safety and Health Day NEA organises annual safety and health week / safety and health day at
workplaces with higher levels of risk, such as our incineration plants. During these events, a line-up of health and safety programmes is conducted. This includes training, practical sessions, practice drills, safety talks conducted by external experts and exhibition showcases.
PEOPLE EXCELLENCE(Relevant G4 material issues: Employment, Training & Education)
People are central to NEA’s success. This is why it is important for NEA to build a culture that creates a sense of belonging to the organisation and promotes staff development.
NEA has two broad People Visions – “Professional Workforce Embodying NEA’s Core Values” and “Effective and Dynamic Leadership”. To support this People Vision, our long-term human resource (HR) strategies are:
1. Build a committed workforce with the capabilities to contribute to a sustainable environment; and
2. Develop effective leaders who safeguard our environment, nurture our people and cherish our relationships
EmploymentIn order to position NEA as an employer of choice and provide guidance for our human resource (HR) strategies and policies, NEA developed its Employee Value Proposition (EVP) in 2013 using a ground-up approach.
The journey to develop NEA’s EVP started in November 2011, with focus-group discussions involving more than 100 employees. After several validation sessions to close gaps on the ground, it was launched in September 2013 at NEA’s CEO Townhall.
This section of the report highlights the following ways whereby NEA continuously creates a positive work environment for our employees:
• Fair Employment• Work-Life Harmony Framework
Fair EmploymentNEA ensures that we practise fair employment.
Our terms of employment are guided by Singapore’s legislations such as the Employment Act, the Workplace Safety and Health (WSH) Act and the Retirement and Re-employment Act. Our human resource (HR) practices align with the Tripartite Guidelines on Fair Employment.
Recruitment in NEA is based on merit, with no discrimination in terms of age, race, gender, religion, marital status or disability. Currently, NEA also employs 24 staff with physical disabilities. Our employees are rewarded fairly, based on their performance, contribution and experience. All our staff are given equal training and development opportunities to help them develop to their full potential.
Being a public agency, candidates for appointment in the permanent establishment are usually Singapore citizens. However, permanent
STRENGTHENING OUR WORKPLACE SAFETY AND HEALTH CULTUREThe Workplace Safety and Health (WSH) Driver conducts engagement visits at NEA’s off-site offices and installations.
These visits build NEA’s WSH culture, enhance communication and collaboration with our WSH stakeholders, and generate interest and awareness in safety and health. Through this engagement, the WSH Driver has gathered useful feedback regarding the WSH challenges faced by NEA, and has suggested appropriate solutions that meet the needs of the department and comply with our legislative requirements.
With greater publicity and emphasis on the importance of WSH, NEA’s staff are more cautious and committed to ensuring a safe and healthy workplace. The WSH Driver has been consulted on several occasions on WSH matters such as legal requirements, industry best practices and risk management. They have also worked with the Centre for Climate Research Singapore (CCRS) on the safe use of the roof area for releasing weather balloons, and with the Environmental Health Department to conduct risk assessment for Housing Development Board (HDB) rooftop inspection.
With greater emphasis and focus on safety and health issues, the WSH Driver of the Corporate Excellence Department (CED) will continue to provide assistance to NEA’s departments regarding all WSH matters, and work towards improving NEA’s overall WSH performance by promoting and implementing initiatives with the support of the Incident and Risk Review Committee (IRRC) and the Enterprise Risk & Safety Steering (ERSS) Committee chaired by the Deputy Chief Executive Officer (DCEO) and CEO respectively.

54 NEA SUSTAINABILITY REPORT FY13 SUSTAINING OUR WORKPLACE
residents of Singapore and foreign citizens are considered for posts that are not sensitive in nature.
• Staff Demographics As of 31 March 2014, NEA has a diverse workforce of about 3,841 staff
across our 18 key premises, and a total of 15 members representing the senior management.
At NEA, we strive to achieve our People Vision by building a committed workforce with the capabilities to contribute to a sustainable environment as well as developing effective leaders who safeguard our environment, nurture our people and cherish our relationships. As such, we ensure fair practices, establish good work policies (e.g. retirement, job redesigning and re-employment) as well as provide various learning and talent management programmes and work-life activities
Our supportive Human Resource policies have proved fruitful because NEA was voted as one of Singapore’s 100 leading Graduate Employers in 2013. Additionally, NEA was conferred eight awards at the Singapore HR Awards organised by the Singapore Human Resources Institute, which includes the Leading HR Practices in Employee Relations & People Management Award as well as the Leading HR Practices in Fair Employment Practices Award. More importantly, our policies have helped us attract, develop and retain talented individuals. In 2013, we had managed to recruit 459 staff. On the other hand, the number of staff who had left the organisation remained satisfactory at 286.
– Breakdown by Gender (as of 31 March 2014) In NEA, 68% of the total staff are males and 32% are females. NEA’s
senior management comprises 12 males and 3 females. In FY13, 65% of the new staff recruited were males while 35% were females. Of the 286 staff who left NEA, the proportion of female to male is almost equal, at a ratio of 45%:55%.
Gender Breakdown of Staff Strength: 3,841 (as at 31 March 2014)
No. of MREs
3,210 Male 67.3%
Female 32.7%
No. of DREs
631 Male 70.2%
Female 29.8%
– Breakdown by Age (as of 31 March 2014) In terms of age profile, 17% of NEA staff are aged below 30 years old,
while the percentage of NEA staff between 30 to 50 years old and above 50 years are almost the same, at 41% and 42% respectively. Majority of the members in senior management are above 50 years old, while the rest are aged between 30 to 50 years old.
In FY13, 60% of the new staff recruited are at least 30 years old or above, while 40% of them are above 50 years old. On the other hand, 24% staff who had left NEA are above 50 years old, 42% aged between 30 to 50 years old while the remaining staff are below 30 years old.
1,237(32%)
2,604(68%)
3(20%)
12(80%)
NEA staff(Total: 3,841)
Senior management(Total: 15)
No. of new staff recruited in FY13 (Total: 459)
No. of staff that left NEA in FY13 (Total: 286)
160(35%)
299(65%)
129(45%)
157(55%)
NEA staff (Total: 3,841)
Senior management(Total 15)
4(27%)
11(73%)
1,619(42%)
1,582(41%)
640(17%)
< 30 yrs 30-50 yrs > 50 yrs
Female Male
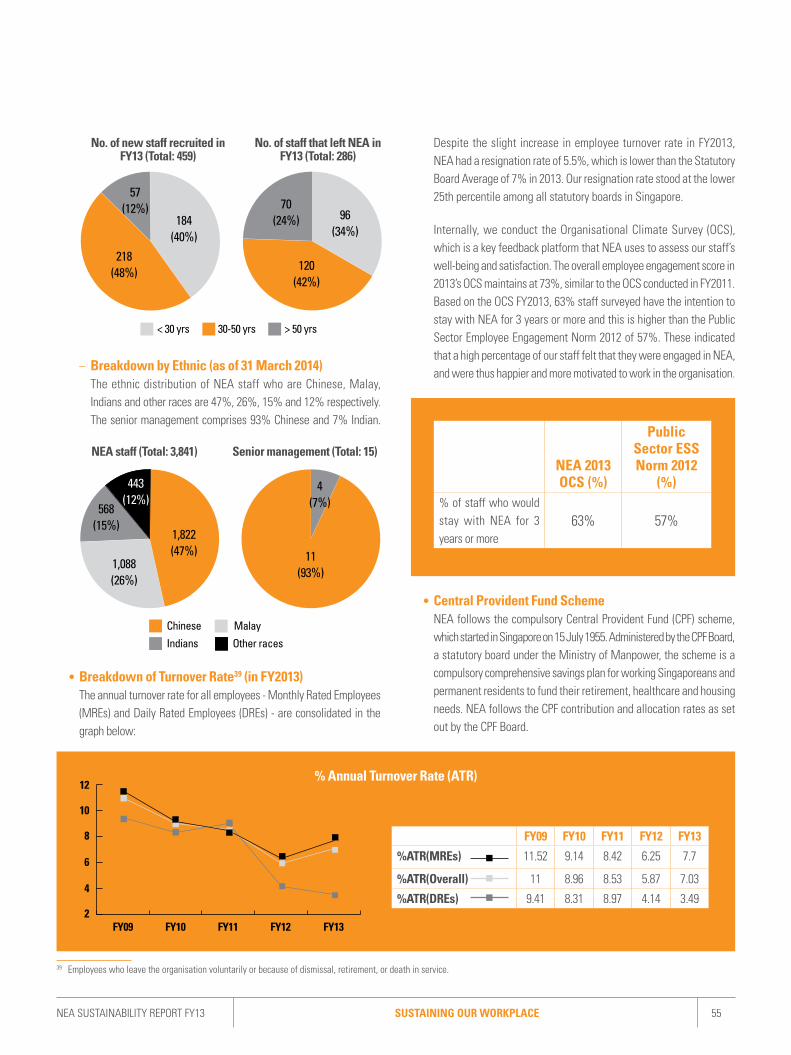
SUSTAINING OUR WORKPLACENEA SUSTAINABILITY REPORT FY13 55
– Breakdown by Ethnic (as of 31 March 2014) The ethnic distribution of NEA staff who are Chinese, Malay,
Indians and other races are 47%, 26%, 15% and 12% respectively. The senior management comprises 93% Chinese and 7% Indian.
• Breakdown of Turnover Rate39 (in FY2013) The annual turnover rate for all employees - Monthly Rated Employees
(MREs) and Daily Rated Employees (DREs) - are consolidated in the graph below:
Despite the slight increase in employee turnover rate in FY2013, NEA had a resignation rate of 5.5%, which is lower than the Statutory Board Average of 7% in 2013. Our resignation rate stood at the lower 25th percentile among all statutory boards in Singapore.
Internally, we conduct the Organisational Climate Survey (OCS), which is a key feedback platform that NEA uses to assess our staff’s well-being and satisfaction. The overall employee engagement score in 2013’s OCS maintains at 73%, similar to the OCS conducted in FY2011. Based on the OCS FY2013, 63% staff surveyed have the intention to stay with NEA for 3 years or more and this is higher than the Public Sector Employee Engagement Norm 2012 of 57%. These indicated that a high percentage of our staff felt that they were engaged in NEA, and were thus happier and more motivated to work in the organisation.
NEA 2013 OCS (%)
Public Sector ESS Norm 2012
(%)% of staff who would stay with NEA for 3 years or more
63% 57%
• Central Provident Fund Scheme NEA follows the compulsory Central Provident Fund (CPF) scheme,
which started in Singapore on 15 July 1955. Administered by the CPF Board, a statutory board under the Ministry of Manpower, the scheme is a compulsory comprehensive savings plan for working Singaporeans and permanent residents to fund their retirement, healthcare and housing needs. NEA follows the CPF contribution and allocation rates as set out by the CPF Board.
No. of new staff recruited in FY13 (Total: 459)
NEA staff (Total: 3,841)
No. of staff that left NEA in FY13 (Total: 286)
Senior management (Total: 15)
218(48%)
57(12%)
184(40%)
70(24%) 96
(34%)
120(42%)
Chinese Malay
Indians Other races
443(12%)
568(15%)
1,822(47%) 11
(93%)
4(7%)
1,088(26%)
FY09 FY10 FY11 FY12 FY13
%ATR(MREs) 11.52 9.14 8.42 6.25 7.7
%ATR(Overall) 11 8.96 8.53 5.87 7.03
%ATR(DREs) 9.41 8.31 8.97 4.14 3.49
% Annual Turnover Rate (ATR)12
10
8
6
4
2FY09 FY10 FY11 FY12 FY13
39 Employees who leave the organisation voluntarily or because of dismissal, retirement, or death in service.
< 30 yrs 30-50 yrs > 50 yrs
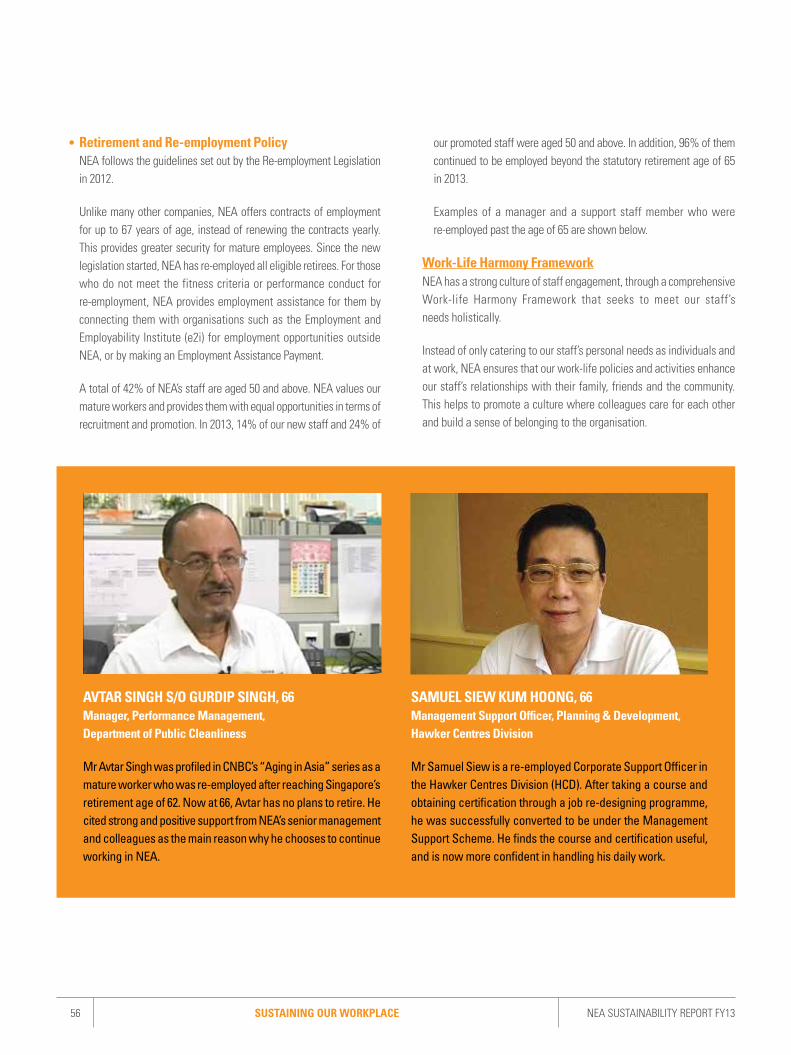
56 NEA SUSTAINABILITY REPORT FY13 SUSTAINING OUR WORKPLACE
• Retirement and Re-employment Policy NEA follows the guidelines set out by the Re-employment Legislation
in 2012.
Unlike many other companies, NEA offers contracts of employment for up to 67 years of age, instead of renewing the contracts yearly. This provides greater security for mature employees. Since the new legislation started, NEA has re-employed all eligible retirees. For those who do not meet the fitness criteria or performance conduct for re-employment, NEA provides employment assistance for them by connecting them with organisations such as the Employment and Employability Institute (e2i) for employment opportunities outside NEA, or by making an Employment Assistance Payment.
A total of 42% of NEA’s staff are aged 50 and above. NEA values our mature workers and provides them with equal opportunities in terms of recruitment and promotion. In 2013, 14% of our new staff and 24% of
our promoted staff were aged 50 and above. In addition, 96% of them continued to be employed beyond the statutory retirement age of 65 in 2013.
Examples of a manager and a support staff member who were re-employed past the age of 65 are shown below.
Work-Life Harmony Framework NEA has a strong culture of staff engagement, through a comprehensive
Work-life Harmony Framework that seeks to meet our staff’s needs holistically.
Instead of only catering to our staff’s personal needs as individuals and at work, NEA ensures that our work-life policies and activities enhance our staff’s relationships with their family, friends and the community. This helps to promote a culture where colleagues care for each other and build a sense of belonging to the organisation.
AVTAR SINGH S/O GURDIP SINGH, 66Manager, Performance Management, Department of Public Cleanliness
Mr Avtar Singh was profiled in CNBC’s “Aging in Asia” series as a mature worker who was re-employed after reaching Singapore’s retirement age of 62. Now at 66, Avtar has no plans to retire. He cited strong and positive support from NEA’s senior management and colleagues as the main reason why he chooses to continue working in NEA.
SAMUEL SIEW KUM HOONG, 66Management Support Officer, Planning & Development, Hawker Centres Division
Mr Samuel Siew is a re-employed Corporate Support Officer in the Hawker Centres Division (HCD). After taking a course and obtaining certification through a job re-designing programme, he was successfully converted to be under the Management Support Scheme. He finds the course and certification useful, and is now more confident in handling his daily work.

SUSTAINING OUR WORKPLACENEA SUSTAINABILITY REPORT FY13 57
SRC
PEER (Charity)
CED (Caring for ENV)
WL AMB (Family)
Interact Point (Singles-Friends)
WL AMB (in consultation with HR, where necessary)
• Personal work-life effectiveness• Workplace health • Resilience
SELFAchieving personal well-
being encompassing body, mind and spirit
COMMUNITYDeveloping a whole person through
corporate & personal contributions to society by helping the less fortunate,
caring for the environment and making a positive difference
to society
WORKHaving purpose, meaning and challenge at work. A career that provides:- Recognition / reward- Professional Development- Continuous Learning
FAMILY & FRIENDSDeveloping and strengthening significant relationships that include family, friends and significant others
• Corporate community involvement• Platforms for sharing• Regconition
• Family-friendly work environment•Opportunities to socialise
• Interpersonal effectiveness
• Quality leadership• Conducive organizational climate• Structural changes in workplace
• Flexible work arrangements
Vision of Work-Life
NEA’s staff engagement efforts can be seen in its employee engagement score of 73 in 2013’s Organisational Climate Survey (OCS) – the same score as 2011’s. In addition, NEA has a relatively low absentee rate40 of 0.0223, with an average of six days of medical leave taken per staff in FY2013.
To demonstrate our commitment to work-life harmony, our Deputy Chief Executive Officer (DCEO) takes on the role of Work-Life Advocate and a designated full-time human resource (HR) staff member supports him as the Work-life Ambassador.
NEA’s Work-Life Harmony Framework
10
5
0
Days of Medical Leave Taken Per Staff
FY09 FY10 FY11 FY12 FY13
8.0
6.8
5.3 5.66.1
40 The total number of medical days taken per financial year divided by the total number of days worked. This is calculated based on the official working hours of our Monthly Rated Employees
(MREs) and Daily Rated Employees (DREs).

58 NEA SUSTAINABILITY REPORT FY13 SUSTAINING OUR WORKPLACE
To organise activities for our staff, NEA’s Human Resource Division (HRD) works closely with the NEA Sports and Recreational Committee (NEASRC) and the Panel for Employee Engagement and Recognition (PEER). NEASRC manages the gym and organises social, sports and recreational activities to help our staff improve their physical fitness. PEER focuses on engaging NEA’s employees by encouraging staff volunteerism and philanthropy, giving out recognition awards, and promoting racial harmony through its many activities and initiatives.
At NEA, supporting staff well-being is broken down into the following areas:• Work-life policies• Work-life activities• Union membership
• Work-life Policies The list of Human Resource (HR) policies that support the needs of
our staff in each focus area is shown in the table below:
– Flexible Working Policies and Practices Flexible working arrangements such as part-time work, telecommuting
and staggered working hours help officers better manage their work and personal responsibilities. The 2013 Organisational Climate Survey (OCS) showed that 72% of our staff agree that their work schedule allows sufficient flexibility to meet their personal family needs.
Focus Areas Initiatives Self • Annual Health Screening • Quarterly Fruits Distribution
• Exercise Hour • Gym, Pantry and Cafeteria
• Wellness Workshops and Programmes and Lunch Time Talk
• Staff Care Support Programme
• Healthy Catering Recommendations • Interact Point for NEA Singles
• Sports Try-outs and Recreational Activities
Family and Friends
• PEER Festive Celebration • NEA Interest Groups
• NEAt Kids’ Club • NEA Family Day and Dinner & Dance
Community • Community Chest SHARE Programme (Workplace Giving Programme)
• Hair for Hope
• Community Outreach Programmes and Corporate Volunteerism
• Charity Run
• Vertical Challenge
Work • Flexible Working Hours and Telecommuting • Medical Benefits for Dependants
• Flexible Benefits Scheme • Welfare Gifts for Newborns and Marriage
• Birthday Leave • On-site Childcare Centre
• Parent Care Leave • Blue Sky Fridays
• Childcare Leave • Eat with Your Family Day
• Compassionate Leave

SUSTAINING OUR WORKPLACENEA SUSTAINABILITY REPORT FY13 59
Type of Leave/Time-off
Details
Birthday Leave Offers the privilege of an additional day off within a week before or after the officer’s birthday
Study and Exam Leave
For staff who are interested in upgrading themselves academically and technically; also applicable for non-NEA-sponsored courses
Exercise Hour All officers are permitted to take one hour off each week to exercise and unwind
– Leave Benefits and Time-off Policies NEA is an advocate of pro-family and work-life balance. In fact,
our employees have additional leave benefits and time-off policies that go beyond standard industry practices. Examples are shown in the table below.
– Flexi-Benefits Scheme Each year, every NEA employee is given $500 under the Flexi-
Benefits Scheme (FBS), regardless of job title or qualification. This scheme covers purchases related to health and wellness, pro-family and continuous-learning courses, health insurance, family travel expenses, and club and society memberships.
The summary of benefits extended to full-time employees, part time employees and temporary employees are as shown in the table below.
41 Parental leave refers to both maternity and paternity leave.
Types of Benefits Extended to:
Full-time Employees
Part-time Employees
Temporary Staff
Disability and Invalidity Coverage
Yes Yes Yes
Medical Reimbursements
Yes Yes Yes
Flexible Benefit Yes Pro-rated No
Paternity and Maternity Leave
Yes Yes Yes
Eligibility for Re-employment
Yes Yes No
Statistics on Parental Leave41 Taken in FY2013, by Gender
No. of employees entitled to parental leave Male: 64Female: 29
No. of employees who returned to work after parental leave ended
Male: 60 Female: 29
Retention rate of employees who return to work after parental leave
Male: 100% Female: 100%
No. of employees who returned to work after parental leave ended, and still employed 12 months after returning to work
Male: 55 Female: 28
NEA’s leave policies are in line with the government’s pro-baby legislation. In FY2013, 64 male employees and 29 female employees were entitled to parental leave, of which 60 male and 29 female employees took the parental leave they were entitled to and 100% of them returned to work after that. In addition, 55 male and 28 female employees remained in service after a year of returning to work. These figures are summarised in the table below.
• Work-life Activities Some of our work-life activities include:
– Fitness and Recreational Classes and Workshops All NEA employees are given unlimited access to the sports facilities
at NEA’s headquarters. The facilities include a gym, a badminton court, a squash court, a tennis court, a dance studio, lockers and heated showers. In 2013, NEA organised different sports activities with various levels of physical intensity to cater to the varied employee demographics. Some of these sports activities include golf, cable skiing and ice skating.
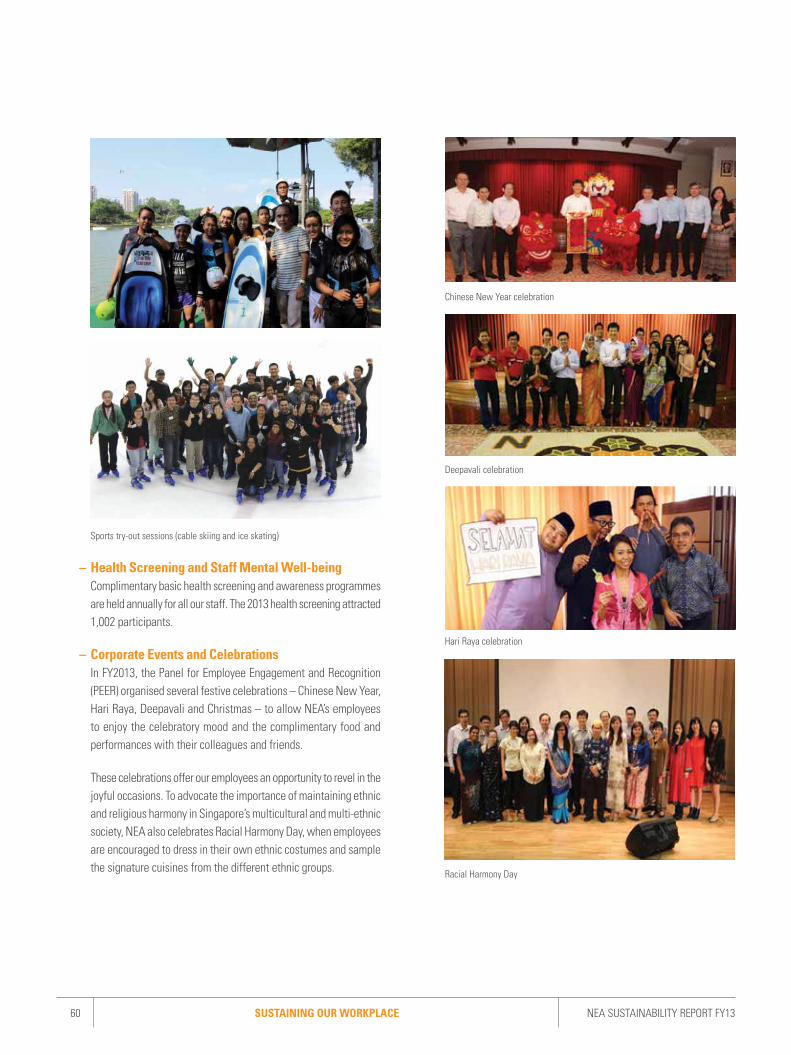
60 NEA SUSTAINABILITY REPORT FY13 SUSTAINING OUR WORKPLACE
Sports try-out sessions (cable skiing and ice skating)
– Health Screening and Staff Mental Well-being Complimentary basic health screening and awareness programmes
are held annually for all our staff. The 2013 health screening attracted 1,002 participants.
– Corporate Events and Celebrations In FY2013, the Panel for Employee Engagement and Recognition
(PEER) organised several festive celebrations – Chinese New Year, Hari Raya, Deepavali and Christmas – to allow NEA’s employees to enjoy the celebratory mood and the complimentary food and performances with their colleagues and friends.
These celebrations offer our employees an opportunity to revel in the joyful occasions. To advocate the importance of maintaining ethnic and religious harmony in Singapore’s multicultural and multi-ethnic society, NEA also celebrates Racial Harmony Day, when employees are encouraged to dress in their own ethnic costumes and sample the signature cuisines from the different ethnic groups.
Chinese New Year celebration
Deepavali celebration
Racial Harmony Day
Hari Raya celebration
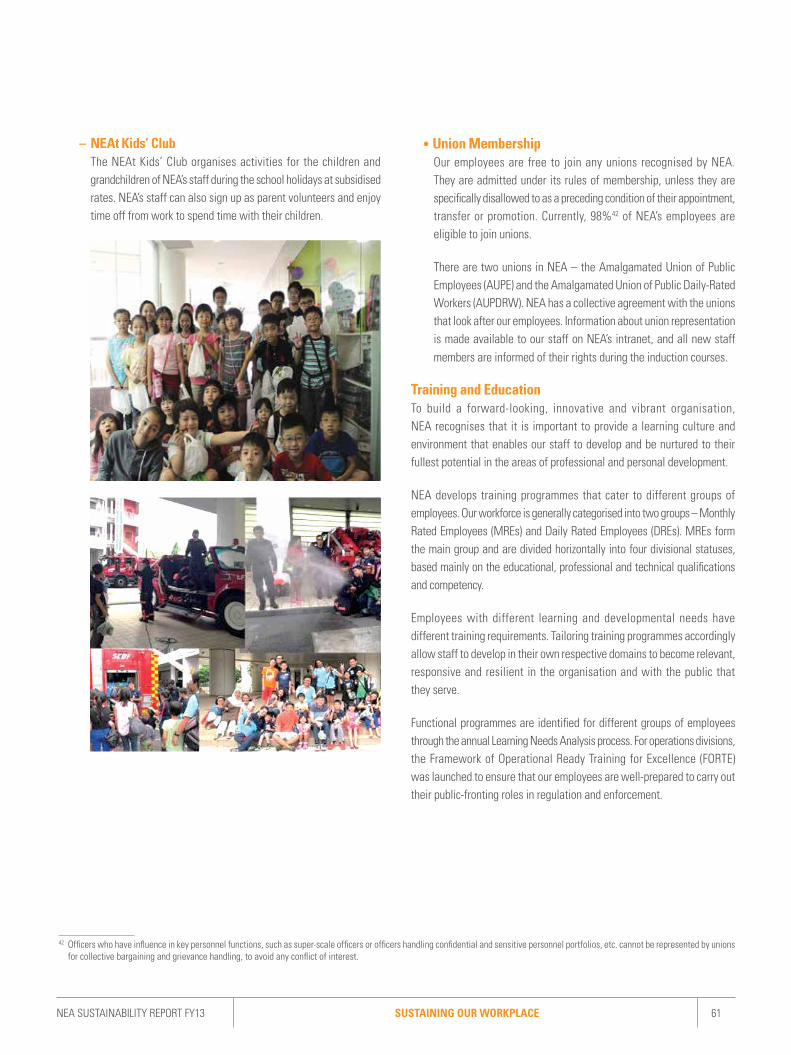
SUSTAINING OUR WORKPLACENEA SUSTAINABILITY REPORT FY13 61
– NEAt Kids’ Club The NEAt Kids’ Club organises activities for the children and
grandchildren of NEA’s staff during the school holidays at subsidised rates. NEA’s staff can also sign up as parent volunteers and enjoy time off from work to spend time with their children.
42 Officers who have influence in key personnel functions, such as super-scale officers or officers handling confidential and sensitive personnel portfolios, etc. cannot be represented by unions
for collective bargaining and grievance handling, to avoid any conflict of interest.
• Union Membership Our employees are free to join any unions recognised by NEA.
They are admitted under its rules of membership, unless they are specifically disallowed to as a preceding condition of their appointment, transfer or promotion. Currently, 98%42 of NEA’s employees are eligible to join unions.
There are two unions in NEA – the Amalgamated Union of Public Employees (AUPE) and the Amalgamated Union of Public Daily-Rated Workers (AUPDRW). NEA has a collective agreement with the unions that look after our employees. Information about union representation is made available to our staff on NEA’s intranet, and all new staff members are informed of their rights during the induction courses.
Training and EducationTo build a forward-looking, innovative and vibrant organisation, NEA recognises that it is important to provide a learning culture and environment that enables our staff to develop and be nurtured to their fullest potential in the areas of professional and personal development.
NEA develops training programmes that cater to different groups of employees. Our workforce is generally categorised into two groups – Monthly Rated Employees (MREs) and Daily Rated Employees (DREs). MREs form the main group and are divided horizontally into four divisional statuses, based mainly on the educational, professional and technical qualifications and competency.
Employees with different learning and developmental needs have different training requirements. Tailoring training programmes accordingly allow staff to develop in their own respective domains to become relevant, responsive and resilient in the organisation and with the public that they serve.
Functional programmes are identified for different groups of employees through the annual Learning Needs Analysis process. For operations divisions, the Framework of Operational Ready Training for Excellence (FORTE) was launched to ensure that our employees are well-prepared to carry out their public-fronting roles in regulation and enforcement.
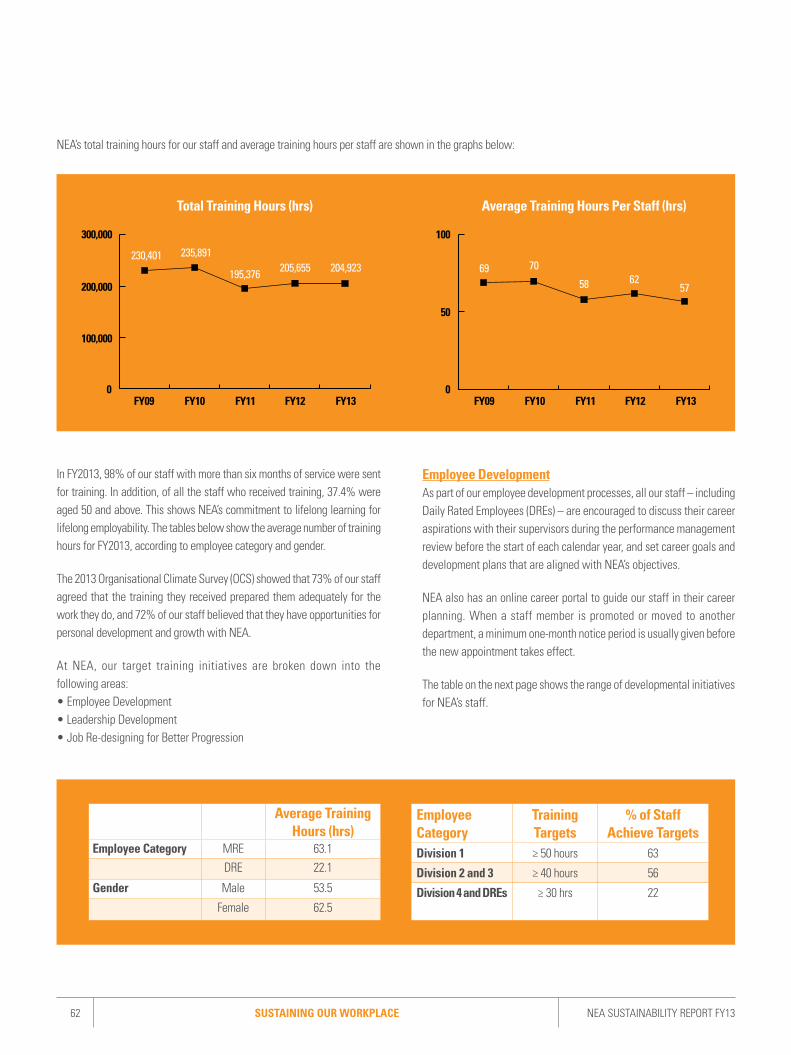
62 NEA SUSTAINABILITY REPORT FY13 SUSTAINING OUR WORKPLACE
NEA’s total training hours for our staff and average training hours per staff are shown in the graphs below:
Average Training Hours (hrs)
Employee Category MRE 63.1DRE 22.1
Gender Male 53.5
Female 62.5
Employee Category
Training Targets
% of Staff Achieve Targets
Division 1 ≥ 50 hours 63
Division 2 and 3 ≥ 40 hours 56
Division 4 and DREs ≥ 30 hrs 22
300,000 100
50
0
200,000
100,000
0
Total Training Hours (hrs) Average Training Hours Per Staff (hrs)
FY09 FY09FY10 FY10FY11 FY11FY12 FY12FY13 FY13
230,401 235,891
195,376 205,655 204,923 69 70
58 6257
Employee Development As part of our employee development processes, all our staff – including
Daily Rated Employees (DREs) – are encouraged to discuss their career aspirations with their supervisors during the performance management review before the start of each calendar year, and set career goals and development plans that are aligned with NEA’s objectives.
NEA also has an online career portal to guide our staff in their career planning. When a staff member is promoted or moved to another department, a minimum one-month notice period is usually given before the new appointment takes effect.
The table on the next page shows the range of developmental initiatives for NEA’s staff.
In FY2013, 98% of our staff with more than six months of service were sent for training. In addition, of all the staff who received training, 37.4% were aged 50 and above. This shows NEA’s commitment to lifelong learning for lifelong employability. The tables below show the average number of training hours for FY2013, according to employee category and gender.
The 2013 Organisational Climate Survey (OCS) showed that 73% of our staff agreed that the training they received prepared them adequately for the work they do, and 72% of our staff believed that they have opportunities for personal development and growth with NEA.
At NEA, our target training initiatives are broken down into the following areas:• Employee Development• Leadership Development• Job Re-designing for Better Progression
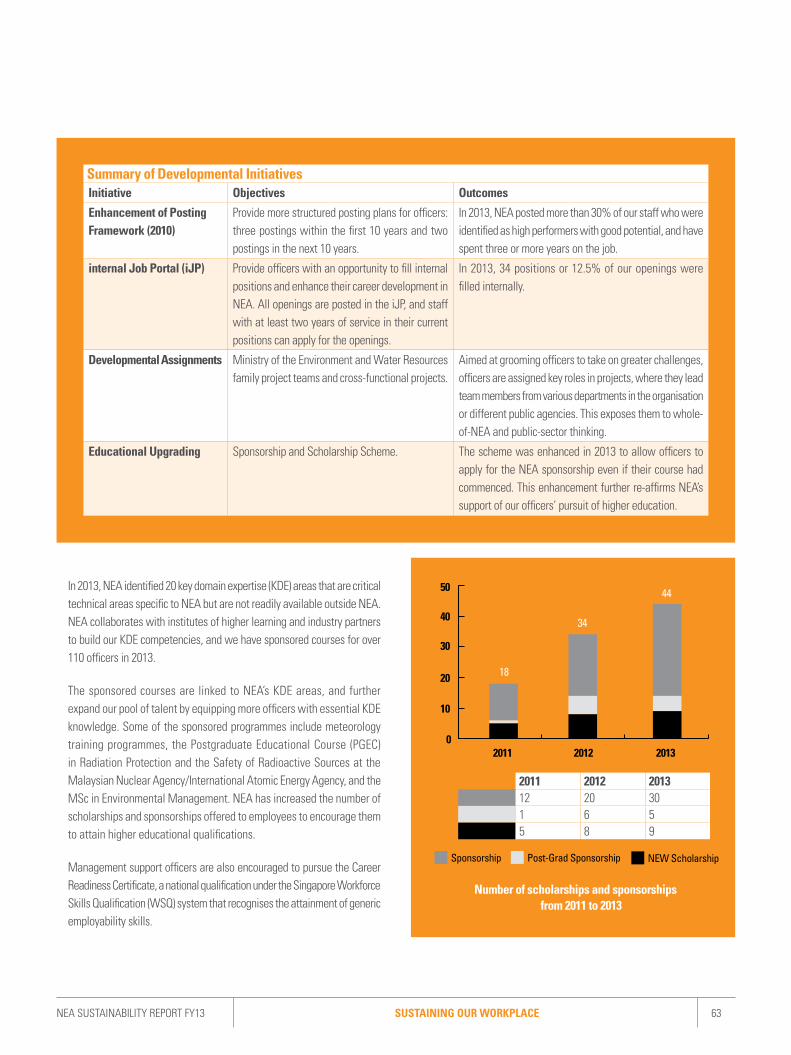
SUSTAINING OUR WORKPLACENEA SUSTAINABILITY REPORT FY13 63
Summary of Developmental InitiativesInitiative Objectives Outcomes
Enhancement of Posting Framework (2010)
Provide more structured posting plans for officers: three postings within the first 10 years and two postings in the next 10 years.
In 2013, NEA posted more than 30% of our staff who were identified as high performers with good potential, and have spent three or more years on the job.
internal Job Portal (iJP) Provide officers with an opportunity to fill internal positions and enhance their career development in NEA. All openings are posted in the iJP, and staff with at least two years of service in their current positions can apply for the openings.
In 2013, 34 positions or 12.5% of our openings were filled internally.
Developmental Assignments Ministry of the Environment and Water Resources family project teams and cross-functional projects.
Aimed at grooming officers to take on greater challenges, officers are assigned key roles in projects, where they lead team members from various departments in the organisation or different public agencies. This exposes them to whole-of-NEA and public-sector thinking.
Educational Upgrading Sponsorship and Scholarship Scheme. The scheme was enhanced in 2013 to allow officers to apply for the NEA sponsorship even if their course had commenced. This enhancement further re-affirms NEA’s support of our officers’ pursuit of higher education.
In 2013, NEA identified 20 key domain expertise (KDE) areas that are critical technical areas specific to NEA but are not readily available outside NEA. NEA collaborates with institutes of higher learning and industry partners to build our KDE competencies, and we have sponsored courses for over 110 officers in 2013.
The sponsored courses are linked to NEA’s KDE areas, and further expand our pool of talent by equipping more officers with essential KDE knowledge. Some of the sponsored programmes include meteorology training programmes, the Postgraduate Educational Course (PGEC) in Radiation Protection and the Safety of Radioactive Sources at the Malaysian Nuclear Agency/International Atomic Energy Agency, and the MSc in Environmental Management. NEA has increased the number of scholarships and sponsorships offered to employees to encourage them to attain higher educational qualifications.
Management support officers are also encouraged to pursue the Career Readiness Certificate, a national qualification under the Singapore Workforce Skills Qualification (WSQ) system that recognises the attainment of generic employability skills.
50
40
30
20
10
02011 2012 2013
Number of scholarships and sponsorships from 2011 to 2013
2011 2012 201312 20 301 6 55 8 9
NEW ScholarshipPost-Grad SponsorshipSponsorship
18
34
44

64 NEA SUSTAINABILITY REPORT FY13 SUSTAINING OUR WORKPLACE
Leadership Development NEA recognises the key role our leaders play in our transformation journey.
NEA’s leaders are defined as employees who have subordinates, and this is applied across all job grades. A total of five leadership roles and 15 leadership competencies have been identified. This has led to the formulation of the NEA Leadership Learning Roadmap, through which learning programmes are rolled out. The Leaders in Environment Action Programme (LEAP), an 11-day milestone programme for middle managers, has also been launched.
Change management (CM) was identified as a key competency, especially for employees actively involved in change initiatives. NEA has embarked on building enterprise CM capabilities, with the aim of having a common change language. The Prosci’s Awareness, Desire, Knowledge, Ability and Reinforcement (ADKAR) model was adopted. Our CM trainers are trained to plan and cascade the tool to change leaders and employees. With this head start in building enterprise CM capabilities, NEA has become one of the first agencies in the public sector to have a structured approach for CM that leverages an established tool.
To build a sustainable pipeline of effective and dynamic leaders, the Talent Development Programme was launched in May 2013. This programme targets NEA’s younger officers who have demonstrated good potential. The two-year programme aims to engage our high-potential employees, jointly plan their career progression, and coach them as part of their career development.
Job Re-designing for Better Progression To improve progression for our lower-wage workers and help them to
earn higher salaries through productivity gains and enlarged job scopes, NEA has continued to re-design jobs.
NEA currently employs over 200 daily-rated workers who are directly involved in street cleaning work within the private residential estates in Singapore. We have extended the scope of work for the majority of our cleaners to include the cleaning of scupper drains and open drains, in addition to the cleaning of streets and pavements. This is in line with our efforts within the industry to proactively help low-wage cleaners receive better pay.
Cleaners who are able to handle more complex cleaning equipment are assigned as members of Quick Response Teams (QRTs), which provide prompt response in areas that require immediate cleaning action. Some cleaners have also been trained to take on additional supervisory roles such as reporting cleaning work to our headquarters using the S3 (See, Shoot and Send) Self-Reporting System, which requires the pictorial submission of work done via mobile devices. With the productivity gains and enlarged job scopes arising from the job re-designing in 2013, our daily-rated cleaners have received salary adjustments, with effect from 1 February 2014.
Another job re-designing initiative undertaken by NEA was for the daily-rated foremen who work in our incineration plants. On top of their current job scope, the foremen are now required to supervise contractors in carrying out daily and urgent repair works for their plant’s equipment. In addition, they troubleshoot abnormalities of motors, fans and pumps.
With the expanded job scope, the foremen were re-designated as senior foremen and given a salary adjustment with effect from 1 June 2013.
COMMUNITY OUTREACH: INCORPORATING A CARING CULTURE INTO NEAGiving back to society has always been an integral part of NEA’s culture. At NEA, we believe that people are our greatest asset, and that a socially responsible workforce will benefit the community. In addition, we believe that our efforts to engage and support the community will establish rapport with the community.
Corporate Social Responsibility StrategiesUsing a structured approach, NEA has developed Corporate Social Responsibility (CSR) strategies that are aligned with the organisation’s mission of being an “Enterprising Agency, Embracing All in Achieving a Liveable and Sustainable Singapore”.
A range of community outreach activities have been organised to raise awareness among staff and provide volunteering opportunities for our employees with varied interests and skills.

SUSTAINING OUR WORKPLACENEA SUSTAINABILITY REPORT FY13 65
Structured ApproachDevelop an engaged, socially responsible workforce that gives back to the community, leveraging:
Close Partnerships Heightened Publicity Organisational SupportWith adopted charities that align with NEA’s Vision, Mission and Values – focus resources
for greater impact
For greater staff awareness of community needs and opportunities to serve
To enable staff volunteerism and embed CSR as an integral part of NEA’s culture
StrategiesProgrammes that match staff skills and interests with charity needs for
deeper engagement
Publicise needs and opportunities to encourage staff volunteerism
Put in place systems (education, recognition) to support CSR
Outcomes and Key Performance IndicatorsTotal corporate-wide cash or
in-kind contributionPercentage of staff volunteers/
total staffNo. of community hours logged by
staff volunteers
To ensure the effectiveness of our CSR strategies, we monitor the overall funds raised, total staff participation and overall community hours contributed. The figures are tracked annually to maintain the ongoing zeal and enthusiasm for community outreach activities in NEA.
Our Community Outreach EffortsThe figures on the right and the next page show results from our community outreach efforts.
In FY2013, 423 staff volunteers clocked a total of 1610.5 community hours for various programmes. In the same year, our fundraising activities managed to raise a total of $329,449.40 for our adopted charities, the Community Chest and other organisations.
Total Cash Contribution ($)
FY09 FY10 FY11 FY12 FY13
1000
800
600
400
200
0
$614 $550
$877*
$329
In th
ousa
nds
$437
* The amount raised shows a sharp increase in FY2012 due to NEA celebrating its 10th Anniversary and having several large-scale fundraising activities in the year, which garnered support from partners and corporate companies
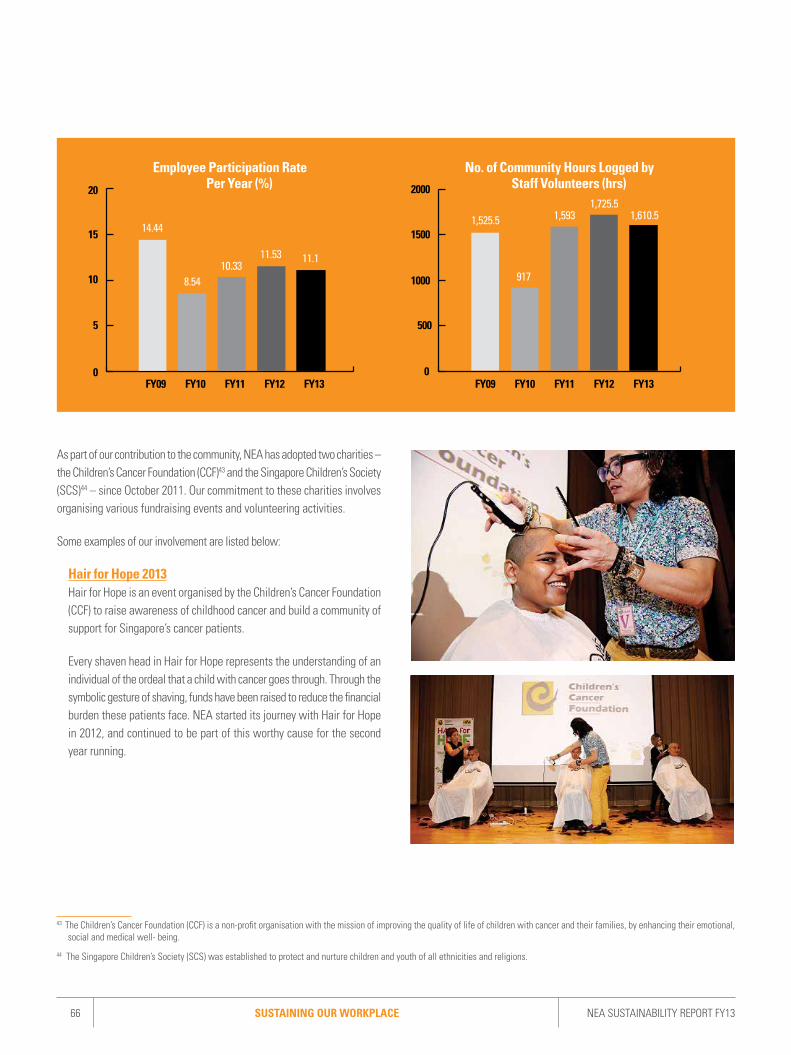
66 NEA SUSTAINABILITY REPORT FY13 SUSTAINING OUR WORKPLACE
As part of our contribution to the community, NEA has adopted two charities – the Children’s Cancer Foundation (CCF)43 and the Singapore Children’s Society (SCS)44 – since October 2011. Our commitment to these charities involves organising various fundraising events and volunteering activities.
Some examples of our involvement are listed below:
Hair for Hope 2013 Hair for Hope is an event organised by the Children’s Cancer Foundation
(CCF) to raise awareness of childhood cancer and build a community of support for Singapore’s cancer patients.
Every shaven head in Hair for Hope represents the understanding of an individual of the ordeal that a child with cancer goes through. Through the symbolic gesture of shaving, funds have been raised to reduce the financial burden these patients face. NEA started its journey with Hair for Hope in 2012, and continued to be part of this worthy cause for the second year running.
43 The Children’s Cancer Foundation (CCF) is a non-profit organisation with the mission of improving the quality of life of children with cancer and their families, by enhancing their emotional,
social and medical well- being.
44 The Singapore Children’s Society (SCS) was established to protect and nurture children and youth of all ethnicities and religions.
20
15
10
5
0
Employee Participation Rate Per Year (%)
FY09 FY09FY10 FY10FY11 FY11FY12 FY12FY13 FY13
2000
1500
1000
500
0
No. of Community Hours Logged by Staff Volunteers (hrs)
14.441,525.5
917
1,5931,725.5
1,610.5
8.5410.33
11.53 11.1
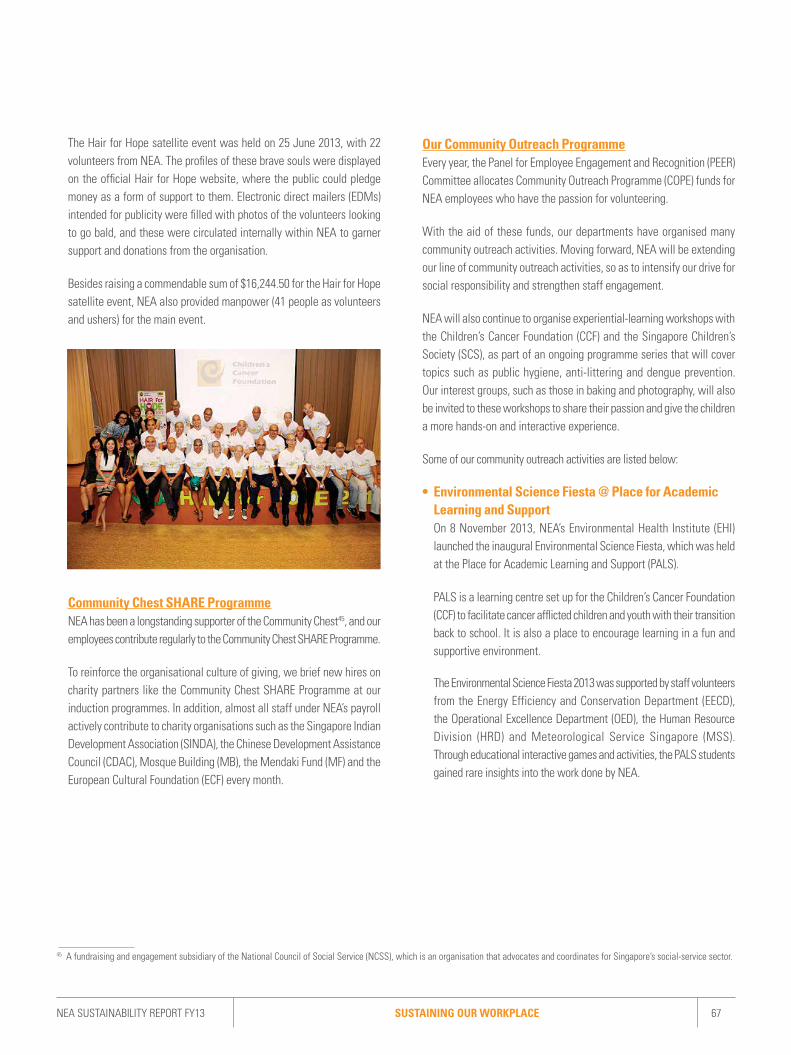
SUSTAINING OUR WORKPLACENEA SUSTAINABILITY REPORT FY13 67
The Hair for Hope satellite event was held on 25 June 2013, with 22 volunteers from NEA. The profiles of these brave souls were displayed on the official Hair for Hope website, where the public could pledge money as a form of support to them. Electronic direct mailers (EDMs) intended for publicity were filled with photos of the volunteers looking to go bald, and these were circulated internally within NEA to garner support and donations from the organisation.
Besides raising a commendable sum of $16,244.50 for the Hair for Hope satellite event, NEA also provided manpower (41 people as volunteers and ushers) for the main event.
Community Chest SHARE Programme NEA has been a longstanding supporter of the Community Chest45, and our
employees contribute regularly to the Community Chest SHARE Programme.
To reinforce the organisational culture of giving, we brief new hires on charity partners like the Community Chest SHARE Programme at our induction programmes. In addition, almost all staff under NEA’s payroll actively contribute to charity organisations such as the Singapore Indian Development Association (SINDA), the Chinese Development Assistance Council (CDAC), Mosque Building (MB), the Mendaki Fund (MF) and the European Cultural Foundation (ECF) every month.
45 A fundraising and engagement subsidiary of the National Council of Social Service (NCSS), which is an organisation that advocates and coordinates for Singapore’s social-service sector.
Our Community Outreach Programme Every year, the Panel for Employee Engagement and Recognition (PEER)
Committee allocates Community Outreach Programme (COPE) funds for NEA employees who have the passion for volunteering.
With the aid of these funds, our departments have organised many community outreach activities. Moving forward, NEA will be extending our line of community outreach activities, so as to intensify our drive for social responsibility and strengthen staff engagement.
NEA will also continue to organise experiential-learning workshops with the Children’s Cancer Foundation (CCF) and the Singapore Children’s Society (SCS), as part of an ongoing programme series that will cover topics such as public hygiene, anti-littering and dengue prevention. Our interest groups, such as those in baking and photography, will also be invited to these workshops to share their passion and give the children a more hands-on and interactive experience.
Some of our community outreach activities are listed below:
• Environmental Science Fiesta @ Place for Academic Learning and Support
On 8 November 2013, NEA’s Environmental Health Institute (EHI) launched the inaugural Environmental Science Fiesta, which was held at the Place for Academic Learning and Support (PALS).
PALS is a learning centre set up for the Children’s Cancer Foundation (CCF) to facilitate cancer afflicted children and youth with their transition back to school. It is also a place to encourage learning in a fun and supportive environment.
The Environmental Science Fiesta 2013 was supported by staff volunteers from the Energy Efficiency and Conservation Department (EECD), the Operational Excellence Department (OED), the Human Resource Division (HRD) and Meteorological Service Singapore (MSS). Through educational interactive games and activities, the PALS students gained rare insights into the work done by NEA.
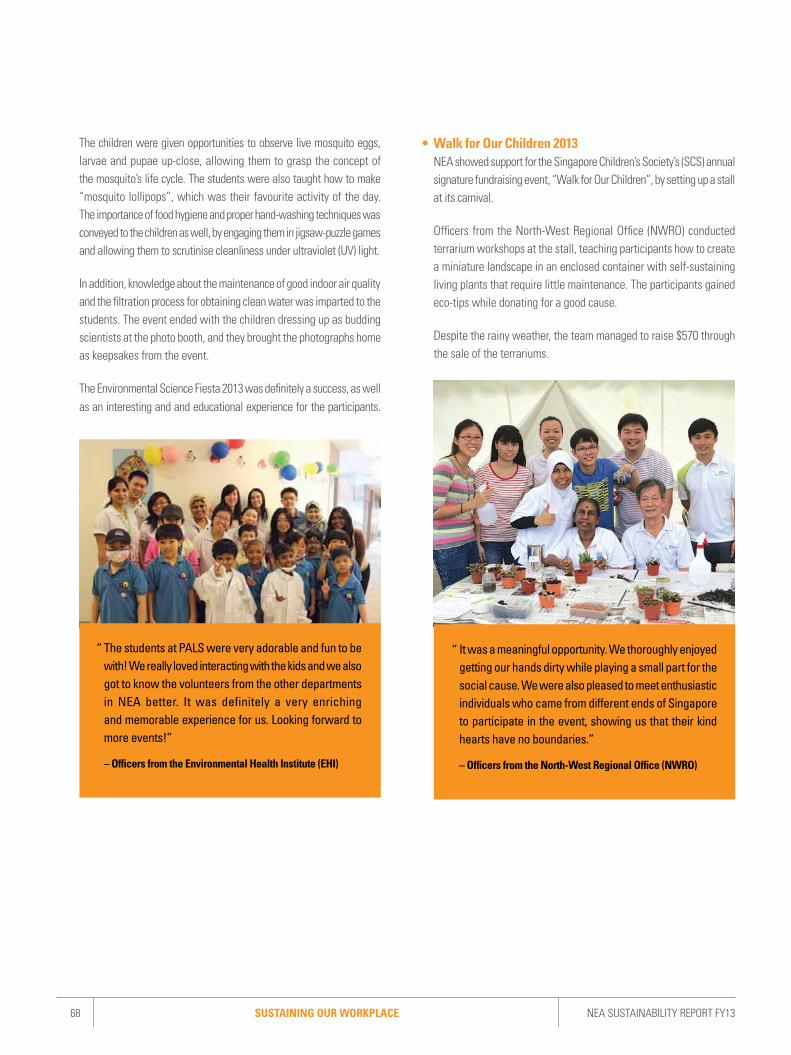
68 NEA SUSTAINABILITY REPORT FY13 SUSTAINING OUR WORKPLACE
The children were given opportunities to observe live mosquito eggs, larvae and pupae up-close, allowing them to grasp the concept of the mosquito’s life cycle. The students were also taught how to make “mosquito lollipops”, which was their favourite activity of the day. The importance of food hygiene and proper hand-washing techniques was conveyed to the children as well, by engaging them in jigsaw-puzzle games and allowing them to scrutinise cleanliness under ultraviolet (UV) light.
In addition, knowledge about the maintenance of good indoor air quality and the filtration process for obtaining clean water was imparted to the students. The event ended with the children dressing up as budding scientists at the photo booth, and they brought the photographs home as keepsakes from the event.
The Environmental Science Fiesta 2013 was definitely a success, as well as an interesting and and educational experience for the participants.
• Walk for Our Children 2013 NEA showed support for the Singapore Children’s Society’s (SCS) annual
signature fundraising event, “Walk for Our Children”, by setting up a stall at its carnival.
Officers from the North-West Regional Office (NWRO) conducted terrarium workshops at the stall, teaching participants how to create a miniature landscape in an enclosed container with self-sustaining living plants that require little maintenance. The participants gained eco-tips while donating for a good cause.
Despite the rainy weather, the team managed to raise $570 through the sale of the terrariums.
“ It was a meaningful opportunity. We thoroughly enjoyed getting our hands dirty while playing a small part for the social cause. We were also pleased to meet enthusiastic individuals who came from different ends of Singapore to participate in the event, showing us that their kind hearts have no boundaries.”
– Officers from the North-West Regional Office (NWRO)
“ The students at PALS were very adorable and fun to be with! We really loved interacting with the kids and we also got to know the volunteers from the other departments in NEA better. It was definitely a very enriching and memorable experience for us. Looking forward to more events!”
– Officers from the Environmental Health Institute (EHI)

SUSTAINING OUR WORKPLACENEA SUSTAINABILITY REPORT FY13 69
• Other Fundraising Activities and Volunteering Avenues Other examples of NEA’s fundraising and volunteering involvement are
listed below:
– Visits and experiential-learning workshops conducted by volunteers from the Panel for Employee Engagement and Recognition (PEER), the Singapore Environment Institute (SEI) and various regional offices at the Place for Academic Learning and Support (PALS).
– A total of 17 beneficiaries from the Singapore Children’s Society (SCS) were invited to join our fun-filled Christmas carnival celebration on 24 December 2013, when NEA’s senior management came together to grant their Christmas wishes, making their Christmas with NEA a special one.
– A collaboration with NEAt Kids Club for a Movie Day with the Fei Yue Family Service Centre.
– Mini Bazaars and donation drives during festive celebrations to raise funds for our adopted charities, e.g. henna-crafting during Deepavali and cupcake-baking during Hair for Hope 2013.
– Calls for donations to aid the Philippines in the wake of Typhoon Haiyan, where more than $15,000 was raised.
– Formation of interest groups, e.g. BookCross Club, Baking Club and Radio Control Club, which regularly participate in PEER events to help raise funds, as well as visits to SCS and the Children’s Cancer Foundation (CCF) to share their interests.


TOWARDS BETTER SUSTAINABLEGROWTHINTEGRATING ENVIRONMENTAL AND SOCIAL CONSIDERATIONS IN OUR OPERATIONS IS ESSENTIAL AS IT ALLOWS US TO ACHIEVE FINANCIAL SUSTAINABILITY. THIS IS WHY OUR PROCESSES HAVE BEEN DEVELOPED TO PROTECT OUR SURROUNDINGS, PEOPLE AND RESOURCES.

72 NEA SUSTAINABILITY REPORT FY13SUSTAINING OUR FINANCES
SUSTAINING OUR FINANCES
NEA constantly ensures that the organisation makes responsible procurement decisions to minimise any adverse financial implications, and commits to continuous innovation in order to be efficient and effective. This chapter will cover three main areas – Our Finances, Our Supply Chain and Innovation and Productivity.
OUR FINANCESNEA is funded mainly by government grants. As our financial resources are limited, the necessary training is provided to our staff to make financially responsible and sustainable decisions in our daily operations. NEA has also put in place the following practices to ensure financial sustainability.
Review of Fees and Charges Fees and Charges are reviewed periodically and are set based on policy intent.
The principles and policy considerations when setting Fees and Charges are:1. User pays principle: recover cost directly from user using the particular service
2. Linkage with Expenditure: As far as practical, should be linked to expenditure incurred in the provision of goods and services
3. Comparison with Private Sector: Should not be competing with Private Sector in the provision of goods and services
4. Keeping Cost Down: fees and charges to be set at cost recovery except when there are extenuating circumstances to under or over recover
Financial policies and Standard Operating ProceduresFinancial policies and procedures are put in place to ensure the optimisation of resources and the upholding of good corporate governance. These policies and procedures are reviewed regularly and published on NEA’s intranet to ensure compliance as well as to standardise departments’ practices.
BudgetNEA’s annual budget is presented and approved by the NEA Board of Directors before the start of the financial year. As our fiscal resources are limited, the budget has to be allocated optimally among departments. Quarterly performance reviews are conducted with major departments to update projections, as well as to ensure that budgets requested are utilised. NEA’s target budget utilisation rate (BUR) is 95% and the BUR is reported to senior management on a quarterly basis.
AuditThe NEA accounts are audited by external auditors and approved by the Board of Directors annually after endorsement by the Audit Committee. Our audited financial statements are made available in our Annual Report. The annual re-appointment of auditors is approved by Minister (MEWR) in consultation with the Auditor-General’s Office (AGO). At intervals, the AGO will perform scheduled and adhoc audits to ensure that governance is adhered to.
DRIVING GREEN PROCUREMENT IN NEASpecifically aimed at driving green procurement, NEA integrates sustainability considerations in our procurement requirements.
This includes requesting contractors to submit their environmental best practices and processes for relevant tenders, and purchasing common office items based on our internal green procurement guidelines. Some examples of our green purchases include office furniture certified by the Singapore Green Label Scheme (SGLS) (flooring, carpeting, paint, high-pressure laminates and flat-pressed particle boards), recycled paper (paper and letterheads made from bagasse, and name cards made from recycled pulp), and water-efficient fittings.
NEA has also purchased energy-efficient appliances such as lighting, refrigerators, air conditioners and ENERGY STAR-certified printers with a duplex printing function that takes into consideration the life-cycle cost.
OUR SUPPLY CHAIN(Relevant G4 material aspects: Procurement Practices)
In FY2013, we engaged approximately 3,000 suppliers and vendors to facilitate our diverse operations.
The type of services engaged included incineration plant-related services, facilities management services, consultancy services, public campaign services, conservancy services, cleaning and maintenance services, and information
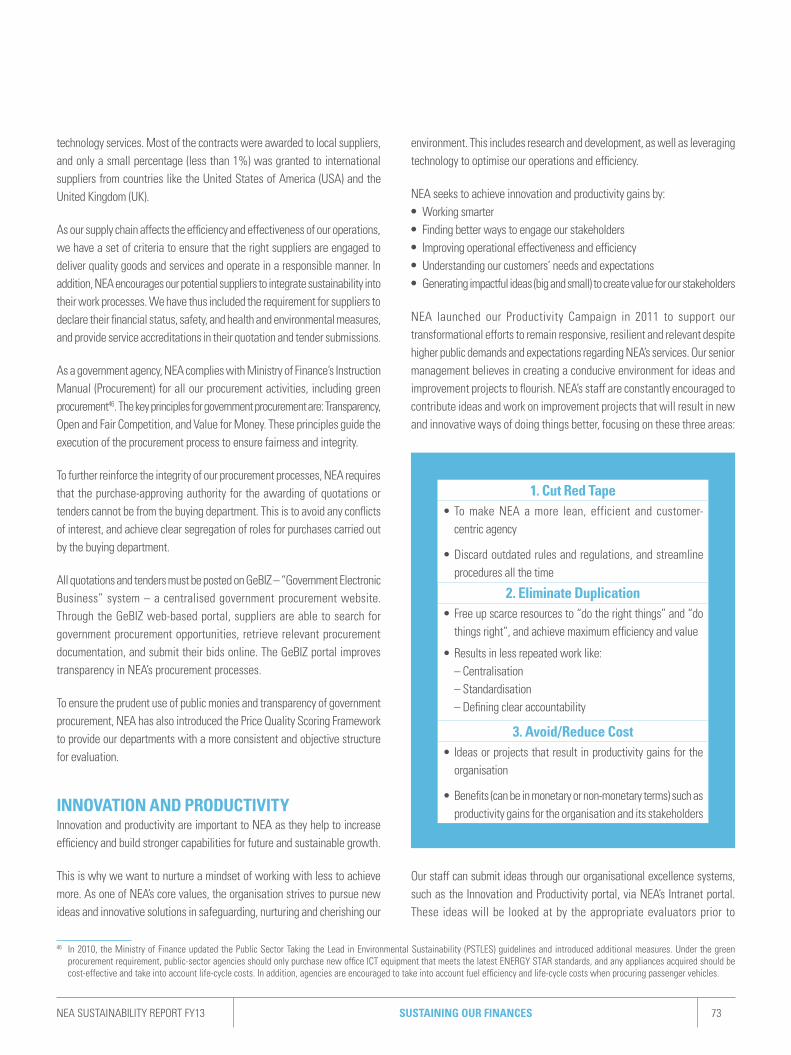
SUSTAINING OUR FINANCESNEA SUSTAINABILITY REPORT FY13 73
46 In 2010, the Ministry of Finance updated the Public Sector Taking the Lead in Environmental Sustainability (PSTLES) guidelines and introduced additional measures. Under the green
procurement requirement, public-sector agencies should only purchase new office ICT equipment that meets the latest ENERGY STAR standards, and any appliances acquired should be cost-effective and take into account life-cycle costs. In addition, agencies are encouraged to take into account fuel efficiency and life-cycle costs when procuring passenger vehicles.
technology services. Most of the contracts were awarded to local suppliers, and only a small percentage (less than 1%) was granted to international suppliers from countries like the United States of America (USA) and the United Kingdom (UK).
As our supply chain affects the efficiency and effectiveness of our operations, we have a set of criteria to ensure that the right suppliers are engaged to deliver quality goods and services and operate in a responsible manner. In addition, NEA encourages our potential suppliers to integrate sustainability into their work processes. We have thus included the requirement for suppliers to declare their financial status, safety, and health and environmental measures, and provide service accreditations in their quotation and tender submissions.
As a government agency, NEA complies with Ministry of Finance’s Instruction Manual (Procurement) for all our procurement activities, including green procurement46. The key principles for government procurement are: Transparency, Open and Fair Competition, and Value for Money. These principles guide the execution of the procurement process to ensure fairness and integrity.
To further reinforce the integrity of our procurement processes, NEA requires that the purchase-approving authority for the awarding of quotations or tenders cannot be from the buying department. This is to avoid any conflicts of interest, and achieve clear segregation of roles for purchases carried out by the buying department.
All quotations and tenders must be posted on GeBIZ – “Government Electronic Business” system – a centralised government procurement website. Through the GeBIZ web-based portal, suppliers are able to search for government procurement opportunities, retrieve relevant procurement documentation, and submit their bids online. The GeBIZ portal improves transparency in NEA’s procurement processes.
To ensure the prudent use of public monies and transparency of government procurement, NEA has also introduced the Price Quality Scoring Framework to provide our departments with a more consistent and objective structure for evaluation.
INNOVATION AND PRODUCTIVITYInnovation and productivity are important to NEA as they help to increase efficiency and build stronger capabilities for future and sustainable growth.
This is why we want to nurture a mindset of working with less to achieve more. As one of NEA’s core values, the organisation strives to pursue new ideas and innovative solutions in safeguarding, nurturing and cherishing our
environment. This includes research and development, as well as leveraging technology to optimise our operations and efficiency.
NEA seeks to achieve innovation and productivity gains by:• Working smarter• Finding better ways to engage our stakeholders• Improving operational effectiveness and efficiency• Understanding our customers’ needs and expectations• Generating impactful ideas (big and small) to create value for our stakeholders
NEA launched our Productivity Campaign in 2011 to support our transformational efforts to remain responsive, resilient and relevant despite higher public demands and expectations regarding NEA’s services. Our senior management believes in creating a conducive environment for ideas and improvement projects to flourish. NEA’s staff are constantly encouraged to contribute ideas and work on improvement projects that will result in new and innovative ways of doing things better, focusing on these three areas:
1. Cut Red Tape• To make NEA a more lean, efficient and customer-
centric agency
• Discard outdated rules and regulations, and streamline procedures all the time
2. Eliminate Duplication• Free up scarce resources to “do the right things” and “do
things right”, and achieve maximum efficiency and value
• Results in less repeated work like: – Centralisation – Standardisation – Defining clear accountability
3. Avoid/Reduce Cost• Ideas or projects that result in productivity gains for the
organisation
• Benefits (can be in monetary or non-monetary terms) such as productivity gains for the organisation and its stakeholders
Our staff can submit ideas through our organisational excellence systems, such as the Innovation and Productivity portal, via NEA’s Intranet portal. These ideas will be looked at by the appropriate evaluators prior to

74 NEA SUSTAINABILITY REPORT FY13SUSTAINING OUR FINANCES
VIDEO CAMERAS FOR FLARING AND STACK EMISSIONS PROJECTBefore the Video Cameras for Flaring and Stack Emissions project, NEA’s officers had to travel daily to different vantage points to observe and record emissions from major industries.
This mode of working was labour-intensive and time-consuming. It was also unsustainable, with the setting up of more major industries in Singapore. The project integrated available technologies, such as marine-graded Closed Circuit Television (CCTV) and Internet-connectivity devices, to enable our officers to remotely monitor the flaring and stack emissions by major industries in real time.
The project’s implementation has enhanced our productivity, with annual productivity gains of $992,201, after taking into account the initial set-up cost and the recurring cost of maintaining the video cameras. In addition to the annual productivity gains, the project has resulted in more efficient resource management.
This innovative project has been showcased, and it won the Gold Award at the annual International Convention of Quality Control Circles (ICQCC) – a key platform featuring the best-in-class quality process innovation in the Asia-Pacific region.
implementation. Based on our 2013 Organisational Climate Survey (OCS) results, 76% of our staff agreed that they feel encouraged to come up with innovative solutions for work-related problems.
NEA’s staff are incentivised to develop ideas and projects that are implementable. We also recognise outstanding ideas and projects that have created a positive impact on NEA’s efficiency, increased our stakeholders’ satisfaction, or challenged a status quo, setting a new performance level for other departments or public agencies to emulate.
Internal RecognitionThe NEA Innovation Awards, such as the Best Idea and Best Project Awards, recognise positive outcomes from ideas and projects, while the Best Ideator and Outstanding Activist Awards honour excellent contributions from innovative individuals.
• MyiDeas Scheme: Points are awarded to ideators, and the awarded points are encashed monthly to staff who put forward their ideas. To encourage implementation, the implementers are granted half of the points awarded to ideators for the ideas implemented. Good ideas will
Overview of the Video Cameras for Flaring and Stack Emissions project
Roof Top Cameras 4 channel CCTV• Marine proof• Powerful zoom• Pan and tilt function
Communication through • ADSL• Optic fiber• Wireless (3G/4G)
DVR controller / with back-up Desktop/Laptop Smartphone
Smoky Flare
iPad
Server Box

SUSTAINING OUR FINANCESNEA SUSTAINABILITY REPORT FY13 75
47 Calculated based on each project team’s assessment of the savings from manpower (based on our finance’s manpower rates), materials, and machine - implementation costs
(before and after).
also be judged and ranked by the Innovation and Productivity Committee for the Best MyiDeas Awards.
• Improvement Projects’ Scheme: Project teams that complete their improvement projects during the financial year will be incentivised. In addition, good projects will vie for the Best Project Awards, with the Innovation and Productivity Committee being the judging panel.
Targets have been set for our staff to submit at least one idea through the MyiDeas system per financial year, while each department will need to submit at least one improvement project per financial year. In FY2013, NEA’s staff completed 142 projects that have resulted in productivity gains of over $2.1 million47.
One exciting project is the Video Cameras for Flaring and Stack Emissions initiative from the Pollution Control Department, which is mentioned in the box below.
External RecognitionOutstanding ideas or projects are nominated for international awards such as the FutureGOV Awards, the Commonwealth Association for Public Administration & Management (CAPAM) Awards, the International Innovation Awards and the International Convention on Quality Control Circles (ICQCC) Awards.
The various awards we have garnered affirm that NEA is on the right track, and show that anchoring our core value – Innovation – in our mission provides our staff with a clearer direction and better understanding of the importance of efficiency and effectiveness in contributing to a sustainable Singapore.
NEA has won the following awards:
• Public Service 21 Innovation Champion Award: The Public Service 21 (PS21) Innovation Champion Award recognises individuals who have made significant contributions in terms of ideas and suggestions for improvement. Mr Deng Lu from the Environmental Health Institute (EHI) clinched the Gold Award, while Mr Nasir K K Maiden from the Department of Public Cleanliness (DPC) clinched the Silver Award.
• eGov Excellence Awards: The eGov Excellence Awards (GEA) is a biennial Singapore e-government award jointly organised by the Ministry of Finance and the Infocomm Development Authority of Singapore. The GEA showcases excellence in e-government in Singapore and public agencies’ innovation to deliver excellent government services electronically to Singapore’s citizens. NEA’s approach to data management and data sharing has earned the Merit Award under the Data Sharing category.
• International Convention on Quality Control Circles Awards: Moving beyond the shores of Singapore, NEA encourages our staff to compete for international awards to showcase our innovations, and learn practical tips from other good international projects. Three projects competed at the ICQCC Awards in Taipei, Taiwan, in October 2013. They were conferred the Excellence Award (equivalent to a Gold award). The three projects are:
Department Project TitleDepartment of Public Cleanliness
Cleaning Performance Monitoring System
Pollution Control Department
Real-time Noise Monitoring System
Weather Service Department
Automated Checking of Meteorological Information and Forecasts on Various Media Platforms
• FutureGov Awards: The FutureGov Awards are an annual award competition that celebrates good practices in Asia’s public sector, acknowledging the top government, education and healthcare organisations for their application of technology to drive service levels, productivity and governance. NEA’s myENV (short for “My Environment”) mobile application clinched the Wireless Government Award. The award recognises NEA’s efforts in using wireless technology to extend the reach of its services and engage the citizenry in collective ownership of the environment.
Award recipients at the International Convention on Quality Control Circles (ICQCC) Awards 2013
76 NEA SUSTAINABILITY REPORT FY13GRI G4 CONTENT INDEX FOR ‘IN ACCORDANCE’ - CORE
STANDARD DISCLOSURE TITLE PAGE NO. / SECTION TITLES / REMARKS
GENERAL STANDARD DISCLOSURES
Strategy And Analysis
G4-1 Provide a statement from the most senior decision-maker of the organization about the relevance of sustainability to the organization and the organization’s strategy for addressing sustainability
Pg 2 - 3: CEO foreword
G4-2 Provide a description of key impacts, risks, and opportunities Pg 2 - 3: CEO forewordPg 6 - 7: NEA at a glance For FY 2013Pg 10: Our mandatePg 19 - 22: Managing our riskPg 22 - 24: Managing our corporate sustainabilityPg 24 - 25: Staff engagement and communicationPg 28: An analysis of our current situation Pg 30: Our material issues
Organizational Profile
G4-3 Report the name of the organization Pg 4 - 5: Preface
G4-4 Report the primary brands, products, and services Pg 4 - 5: Preface
G4-5 Report the location of the organization’s headquarters Pg 4 - 5: Preface
G4-6 Report the number of countries where the organization operates, and names of countries where either the organization has significant operations or that are specifically relevant to the sustainability topics covered in the report
Pg 4 - 5: Preface – NEA’s operations are only in Singapore
G4-7 Report the nature of ownership and legal form Pg 4 - 5: Preface
G4-8 Report the markets served (including geographic breakdown, sectors served, and types of customers and beneficiaries)
Pg 4 - 5: Preface
G4-9 Report the scale of the organization Refer to Annual Financial StatementPg 4 - 5: PrefacePg 12: NEA’s organisation chartPg 15-16: Sustainability in our public initiatives
GRI G4 CONTENT INDEX FOR ‘IN ACCORDANCE’ - CORE
No external assurance was conducted for this report
GRI G4 CONTENT INDEX FOR ‘IN ACCORDANCE’ - CORENEA SUSTAINABILITY REPORT FY13 77
G4-10 Profile of employees Pg 51: Managing workplace safety and health risksPg 52: Building a strong workplace safety and health culturePg 54: Staff demographicsPg 72: Our supply chain
G4-11 Report the percentage of total employees covered by collective bargaining agreements
Pg 61: Union Membership – This information is not material, because NEA does
not keep this information about its employees, but leaves the option of joining unions to the employees themselves.
G4-12 Describe the organization’s supply chain Pg 72: Our supply chain
G4-13 Report any significant changes during the reporting period regarding the organization’s size, structure, ownership, or its supply chain
Pg 4 - 5: PrefacePg 40: Eco-office certification
G4-14 Report whether and how the precautionary approach or principle is addressed by the organization
Pg 14: Enterprise Risk & Safety Steering (ERSS) CommitteePg 18: Preparing for the future through organisational excellencePg 19 - 21: Managing our riskPg 36 - 38: Pollution controlPg 38 - 39: 8 effective habits - 10% challenge
G4-15 List externally developed economic, environmental and social charters, principles, or other initiatives to which the organization subscribes or which it endorses
Pg 31 - 32: Awards and benchmarks
G4-16 List memberships of associations (such as industry associations) and national or international advocacy organizations in which the organization
NEA is a member of Global Compact Network Singapore(Previously known as Singapore Compact for CSR)
Identified Material Aspects And Boundaries
G4-17 List all entities included in the organization’s consolidated financial statements or equivalent documents
Pg 5: Preface
G4-18 Explain the process for defining the report content and the aspect boundaries
Pg 4: PrefacePg 30: Our material issues
G4-19 List all the material aspects identified in the process for defining report content
Pg 30: Our material issues
G4-20 Report the aspect boundary for each material aspect within the organization
Pg 30: Our material issues
G4-21 Report the aspect boundary for each material aspect outside the organization
Pg 30: Our material issues
G4-22 Report the effect of any restatements of information provided in previous reports, and the reasons for such restatements
No restatements of any information in the previous reports
G4-23 Report significant changes from previous reporting periods in the scope and aspect
No changes in the scope and aspect boundaries from the previous reporting period
Stakeholder Engagement
G4-24 List of stakeholder groups engaged by the organization Pg 16 : Engaging our stakeholdersPg 24 - 25: Staff engagement and communication
G4-25 Basis for identification and selection of stakeholders with whom to engage
Pg 16 : Engaging our stakeholdersPg 24 - 25: Staff engagement and communication

78 NEA SUSTAINABILITY REPORT FY13GRI G4 CONTENT INDEX FOR ‘IN ACCORDANCE’ - CORE
G4-26 Organization’s approach to stakeholder engagement, including frequency of engagement by type and by stakeholder group
Pg 4: PrefacePg 16: Engaging our stakeholdersPg 24 - 25: Staff engagement and communication
G4-27 Key topics and concerns that have been raised through stakeholder engagement, and how the organization has responded
Pg 24: Staff engagement and communicationPg 28: An analysis of our current situation
Report Profile
G4-28 Reporting period for information provided Pg 5: Preface
G4-29 Date of most recent previous report Pg 4: Preface
G4-30 Reporting cycle Pg 4: Preface
G4-31 Contact point for questions regarding the report or its contents. Pg 5: Preface
G4-32 Report the ‘In Accordance’ option, GRI Content Index, reference to External Assurance Report
Pg 2 - 3: CEO forewordPg 76: GRI G4 content index
G4-33 Policy and current practice with regard to seeking external assurance for the report
Pg 76: GRI G4 content index
Governance
G4-34 Governance structure of the organization Pg 10: Corporate governance
Ethics And Integrity
G4-56 Describe the organization’s values, principles, standards and norms of behavior such as codes of conduct and codes of ethics
Pg 10: Our mandatePg 14: Employees’ code of conductPg 19: Our enterprise risk management governance structure
SPECIFIC STANDARD DISCLOSURES
CATEGORY: ECONOMIC
Material Aspect: Economic Performance
G4-DMA Generic Disclosures on Management Approach Pg 72: Our finances
G4-EC1 Direct economic value generated and distributed Refer to Annual Financial StatementPg 65: Our community outreach efforts
G4-EC2 Financial implications and other risks and opportunities for the organization’s activities due to climate change
Pg 29: An analysis of our current situation – NEA has not formally assessed the financial implications of climate change to the organisation.
G4-EC3 Coverage of the organization’s defined benefit plan obligations Refer to Annual Financial Statement Pg 55: Central Provident Fund schemePg 58 - 59: Work-life policies
G4-EC4 Financial assistance received from government Refer to Annual Financial Statement Pg 15: Sustainability in our public initiatives – NEA is funded mainly by government grants.
Aspect: Procurement Practices
G4-DMA Generic Disclosures on Management Approach Pg 72 - 73: Our supply chain
G4-EC9 Proportion of spending on local suppliers at significant locations of operation
Pg 72 - 73: Our supply chain
CATEGORY: ENVIRONMENTAL
Aspect: Energy
G4-DMA Generic Disclosures on Management Approach Pg 36: Sustaining our environmentPg 38 - 40: Resource conservationPg 41 - 43: Energy Pg 43: Renewable energy generated

GRI G4 CONTENT INDEX FOR ‘IN ACCORDANCE’ - CORENEA SUSTAINABILITY REPORT FY13 79
G4-EN3 Energy consumption within the organization Pg 38 - 40: Resource conservationPg 41 - 43: Energy Pg 43: Renewable energy generated
G4-EN4 Energy consumption outside of the organization Pg 44: Corporate carbon footprint For FY2013
G4-EN5 Energy intensity Pg 38 - 40: Resource conservationPg 41 - 43: Energy
G4-EN6 Reduction of energy consumption Pg41 - 42: Energy consumption (office and industrial premises)
G4-EN7 Reductions in energy requirements of products and services Not applicable
Aspect: Water
G4-DMA Generic Disclosures on Management Approach Pg 36: Sustaining our environmentPg 38 - 40: Resource conservationPg 45 - 46: Water
G4-EN8 Total water withdrawal by source Pg 45 - 46: Water consumption (office and industrial premises)Pg 46: Rainwater harvesting
G4-EN9 Water sources significantly affected by withdrawal of water Not Material – NEA consumes water for office use
G4-EN10 Percentage and total volume of water recycled and reused Not Material – NEA does not reuse water, but conserves it as it also collects rainwater for use
Aspect: Emissions
G4-DMA Generic Disclosures on Management Approach Pg 36: Sustaining our environmentPg 38 - 40: Resource conservationPg 44: Corporate carbon footprint for FY2013
G4-EN15 Direct greenhouse gas (GHG) emissions (Scope 1) Pg 44: Corporate carbon footprint for FY2013
G4-EN16 Energy indirect greenhouse gas (GHG) emissions (Scope 2) Pg 44: Corporate carbon footprint for FY2013
G4-EN17 Other indirect greenhouse gas (GHG) emissions (Scope 3) Pg 44: Corporate carbon footprint for FY2013
G4-EN18 Greenhouse gas (GHG) emissions intensity Not material
G4-EN19 Reduction of greenhouse gas (GHG) emissions Pg 42: Measures to reduce electricity consumption at NEA’s office premises
Pg 43: Renewable Energy Generated
G4-EN20 Emissions of ozone-depleting substances (ODS) Not material as NEA is not a significant emitter of ODS.
G4-EN21 NOX, SOX, and other significant air emissions Pg 36 - 37: Pollution control
Aspect: Effluents And Waste
G4-DMA Generic Disclosures on Management Approach Pg 36: Sustaining our environmentPg 36 - 38: Pollution controlPg 38 - 40: Resource conservationPg 46 - 47: Waste
G4-EN22 Total water discharge by quality and destination Pg 37 - 38: Effluents and compliance – There is no unplanned water discharges
G4-EN23 Total weight of waste by type and disposal method Pg 46 - 47: Waste
G4-EN24 Total number and volume of significant spills Not material as NEA has not had any significant spills
G4-EN25 Weight of transported, imported, exported, or treated waste deemed hazardous under the terms of the Basel Convention Annex I, II, III, and VIII, and percentage of transported waste shipped internationally
Pg 46: Waste

80 NEA SUSTAINABILITY REPORT FY13GRI G4 CONTENT INDEX FOR ‘IN ACCORDANCE’ - CORE
G4-EN26 Identity, size, protected status, and biodiversity value of water bodies and related habitats significantly affected by the organization’s discharges of water and runoff
Not material
Aspect: Compliance
G4-DMA Generic Disclosures on Management Approach Pg 36 - 37: Pollution control
G4-EN29 Monetary value of significant fines and total number of non-monetary sanctions for non-compliance with environmental laws and regulations
Not applicable as NEA does not have any fines
CATEGORY: SOCIAL
SUB-CATEGORY: LABOR PRACTICES AND DECENT WORK
Aspect: Employment
G4-DMA Generic Disclosures on Management Approach Pg 53: People excellence Pg 53 - 55: Fair employmentPg 56: Retirement and Re-Employment ActPg 56 - 57: Work-Life harmony frameworkPg 58 - 61: Work-Life policies
G4-LA1 Total number and rates of new employee hires and employee turnover by age group, gender and region
Pg 54 - 55: Staff demographics – NEA’s operations are only in Singapore
G4-LA2 Benefits provided to full-time employees that are not provided to temporary or part-time employees, by significant locations of operation
Pg 58 - 59: Work-life policies – NEA’s operations are only in Singapore
G4-LA3 Return to work and retention rates after parental leave, by gender Pg 58: Leave benefits and time-off policies
Aspect: Occupational Health And Safety
G4-DMA Generic Disclosures on Management Approach Pg 50 - 53: Workplace safety and health
G4-LA5 Percentage of total workforce represented in formal joint management-worker health and safety committees that help monitor and advise on occupational health and safety programs
Pg 50: Workplace safety and health
G4-LA6 Type of injury and rates of injury, occupational diseases, lost days, and absenteeism, and total number of work-related fatalities, by region and by gender
Pg 51: Monitoring workplace safety and health performance
Pg 57: Work-life harmony framework
G4-LA7 Workers with high incidence or high risk of diseases related to their occupation
Pg 51: Monitoring workplace safety and health performance
G4-LA8 Health and safety topics covered in formal agreements with trade unions
Not material
Aspect: Training And Education
G4-DMA Generic Disclosures on Management Approach Pg 61: Training and educationPg 62 - 63: Employee developmentPg 64: Leadership developmentPg 64: Job re-designing for better progression
G4-LA9 Average hours of training per year per employee by gender, and by employee category
Pg 62: Training and education
G4-LA10 Programs for skills management and lifelong learning that support the continued employability of employees and assist them in managing career endings
Pg 62 - 63: Employee developmentPg 64: Leadership developmentPg 64: Job re-designing for better progression
G4-LA11 Percentage of employees receiving regular performance and career development reviews, by gender and by employee category
Pg 62: Employee development

a coal productionwww.coal.com.sg

NATIONAL ENVIRONMENT AGENCY 40 Scotts Road
Environment Building #19-00
Singapore 228231Tel: 1800-2255 632
Fax: 62352611