Embed Size (px)
Citation preview
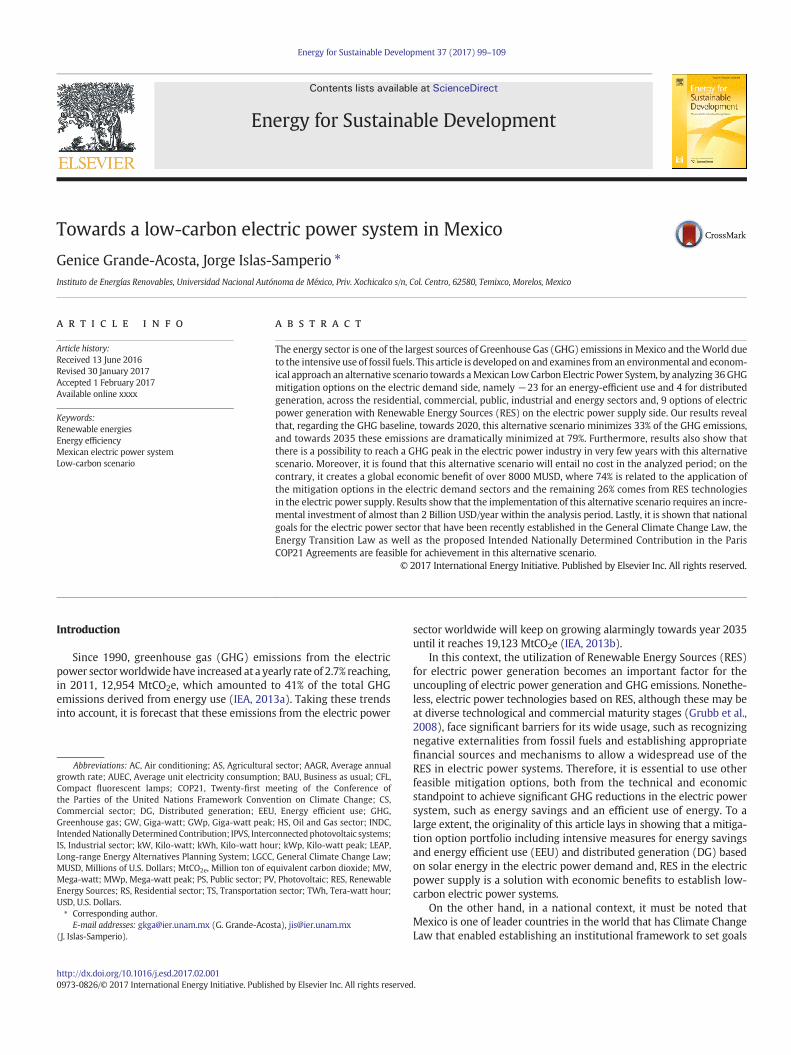
Energy for Sustainable Development 37 (2017) 99–109
Contents lists available at ScienceDirect
Energy for Sustainable Development
Towards a low-carbon electric power system in Mexico
Genice Grande-Acosta, Jorge Islas-Samperio ⁎Instituto de Energías Renovables, Universidad Nacional Autónoma de México, Priv. Xochicalco s/n, Col. Centro, 62580, Temixco, Morelos, Mexico
Abbreviations: AC, Air conditioning; AS, Agriculturalgrowth rate; AUEC, Average unit electricity consumptioCompact fluorescent lamps; COP21, Twenty-first mthe Parties of the United Nations Framework ConvenCommercial sector; DG, Distributed generation; EEUGreenhouse gas; GW, Giga-watt; GWp, Giga-watt peakIntendedNationally DeterminedContribution; IPVS, IntercIS, Industrial sector; kW, Kilo-watt; kWh, Kilo-watt houLong-range Energy Alternatives Planning System; LGCCMUSD, Millions of U.S. Dollars; MtCO2e, Million ton of eqMega-watt; MWp, Mega-watt peak; PS, Public sector; PVEnergy Sources; RS, Residential sector; TS, TransportatioUSD, U.S. Dollars.⁎ Corresponding author.
E-mail addresses: [email protected] (G. Grande-Acos(J. Islas-Samperio).
http://dx.doi.org/10.1016/j.esd.2017.02.0010973-0826/© 2017 International Energy Initiative. Publish
a b s t r a c t
a r t i c l e i n f oArticle history:Received 13 June 2016Revised 30 January 2017Accepted 1 February 2017Available online xxxx
The energy sector is one of the largest sources of Greenhouse Gas (GHG) emissions inMexico and theWorld dueto the intensive use of fossil fuels. This article is developed on and examines from an environmental and econom-ical approach an alternative scenario towards aMexican LowCarbon Electric Power System, by analyzing 36GHGmitigation options on the electric demand side, namely −23 for an energy-efficient use and 4 for distributedgeneration, across the residential, commercial, public, industrial and energy sectors and, 9 options of electricpower generation with Renewable Energy Sources (RES) on the electric power supply side. Our results revealthat, regarding the GHG baseline, towards 2020, this alternative scenario minimizes 33% of the GHG emissions,and towards 2035 these emissions are dramatically minimized at 79%. Furthermore, results also show thatthere is a possibility to reach a GHG peak in the electric power industry in very few years with this alternativescenario. Moreover, it is found that this alternative scenario will entail no cost in the analyzed period; on thecontrary, it creates a global economic benefit of over 8000 MUSD, where 74% is related to the application ofthe mitigation options in the electric demand sectors and the remaining 26% comes from RES technologiesin the electric power supply. Results show that the implementation of this alternative scenario requires an incre-mental investment of almost than 2 Billion USD/year within the analysis period. Lastly, it is shown that nationalgoals for the electric power sector that have been recently established in the General Climate Change Law, theEnergy Transition Law as well as the proposed Intended Nationally Determined Contribution in the ParisCOP21 Agreements are feasible for achievement in this alternative scenario.
© 2017 International Energy Initiative. Published by Elsevier Inc. All rights reserved.
Keywords:Renewable energiesEnergy efficiencyMexican electric power systemLow-carbon scenario
Introduction
Since 1990, greenhouse gas (GHG) emissions from the electricpower sectorworldwide have increased at a yearly rate of 2.7% reaching,in 2011, 12,954 MtCO2e, which amounted to 41% of the total GHGemissions derived from energy use (IEA, 2013a). Taking these trendsinto account, it is forecast that these emissions from the electric power
sector; AAGR, Average annualn; BAU, Business as usual; CFL,eeting of the Conference oftion on Climate Change; CS,, Energy efficient use; GHG,; HS, Oil and Gas sector; INDC,onnectedphotovoltaic systems;r; kWp, Kilo-watt peak; LEAP,, General Climate Change Law;uivalent carbon dioxide; MW,, Photovoltaic; RES, Renewablen sector; TWh, Tera-watt hour;
ta), [email protected]
ed by Elsevier Inc. All rights reserved
sector worldwide will keep on growing alarmingly towards year 2035until it reaches 19,123 MtCO2e (IEA, 2013b).
In this context, the utilization of Renewable Energy Sources (RES)for electric power generation becomes an important factor for theuncoupling of electric power generation and GHG emissions. Nonethe-less, electric power technologies based on RES, although these may beat diverse technological and commercial maturity stages (Grubb et al.,2008), face significant barriers for its wide usage, such as recognizingnegative externalities from fossil fuels and establishing appropriatefinancial sources and mechanisms to allow a widespread use of theRES in electric power systems. Therefore, it is essential to use otherfeasible mitigation options, both from the technical and economicstandpoint to achieve significant GHG reductions in the electric powersystem, such as energy savings and an efficient use of energy. To alarge extent, the originality of this article lays in showing that a mitiga-tion option portfolio including intensive measures for energy savingsand energy efficient use (EEU) and distributed generation (DG) basedon solar energy in the electric power demand and, RES in the electricpower supply is a solution with economic benefits to establish low-carbon electric power systems.
On the other hand, in a national context, it must be noted thatMexico is one of leader countries in the world that has Climate ChangeLaw that enabled establishing an institutional framework to set goals
.
100 G. Grande-Acosta, J. Islas-Samperio / Energy for Sustainable Development 37 (2017) 99–109
and foster plans, programs and mechanisms that favor GHG mitigationand the adaptation to climate change in Mexico. This law was recentlyenacted in 2012 and named the General Climate Change Law (LGCC)(DOF, 2012) establishing three ambitious and volunteer goals speciallyto minimize GHG emissions in the medium and long term. The firstone aims tominimizing national GHG emissions in 30% by 2020 againstthe current base line; the second one, and the most relevant for thisarticle, provides for that by 2024, the percentage of electric powergeneration with clean energies must be 35%, while the third one setsa 50% national GHG emission reduction goal by 2050 against GHGemissions in 2000.
More recently, in the framework of the international negotiations ofthe Conference of the Parties of the United Nations Framework Conven-tion on Climate Change during its twenty-first meeting (COP21),Mexico presented its Intended Nationally Determined Contributions(INDC) to minimize GHG, by establishing, on the one hand, an uncondi-tioned goal to reduce 22% its GHG emissions by 2030 against the currentbase line and, on the other hand, a conditioned goal to reduce 36% itsGHG emissions in that same year if a global agreement is to be reachedto ensure the financial support and technology transfer to enforce mit-igation actions in developing countries (Gobierno de la República,México, 2014). Regarding the electric power sector, the INDC forMexico established that for the unconditioned goal, theMexican electricpower sector achieves a 31% GHG reduction against its GHG emissionsector base line (SEMARNAT, 2015). The goals set under the LGCC andthe INDC of the Mexican government for the electric power sector are,furthermore, framed in a new institutional context derived from themost recent Mexican energy sector reform (Alpizar and Rodríguez,2016), especially with the new Energy Transition Law (DOF, 2015)which established a minimum number of clean energy involvement inelectric power generation, namely: 25% in 2018, 30% in 2021 and 35%in 2024.
Before these important mitigation goals and the legal provisions toestablish clean energy involvement goals, reliable and accurate data isrequired to develop a GHG mitigation action portfolio that is deemedfeasible in Mexico to achieve them. This article addressed this issuefocusing on the Mexican electric sector, which is responsible for 24%of the total GHG emissions due to the use of energy in Mexico. For thispurpose, this article shows the development of an alternative scenariofor the Mexican electric sector based on an intense use of EEU and DGon the electric power demand side and RES on the electric powersupply, which is critical to attain a cost effective low-carbon scenariothat is aligned with the national GHG reduction goals. Several studieswere developed mitigation scenarios for the electric power sectorin Mexico, focusing on the electric power supply mainly from RES(Manzini et al., 2001; Islas et al., 2003, 2004a, 2004b; Santoyo et al.,2014; Vidal et al., 2015) and, this way, EEU and DG mitigation optionshave been overlooked for the electric power demand. Very few studiesin Mexico (McKinsey and Centro Mario Molina, 2009; Johnson et al.,2010; Martínez and Sheinbaum, 2016) include GHGmitigation options,both on the electric power demand and supply. However, the EEU andDG are not explored in an exhaustive way in the electric power demandas mitigation options; accordingly, the potential in the mitigation op-tions for the electric demand have not been properly taken into accountto develop more ambitious GHG mitigation scenarios in the electricpower sector and, this way, to make them feasible from a technicaland economical approach.
The current situation in the Mexican electric power sector
The Mexican electric power sector, according to the world's trend,has characterized over the last decades for the prevalence of fossilfuels as energy input which amounted to 82% (SENER, 2015a). Thishas caused a significant GHG emission contribution that reached127 MtCO2e (INECC, 2015), which represented, as stated above, about24% of the national GHG emissions (522 MtCO2e) from combustion of
energy fuels and over 19% of the global emissions in Mexico(665 MtCO2e) (INECC, 2015). Accordingly, if this country is pursuing aroute to significantly reduce its GHG emissions, the electric power sectmust be de-carbonized.
Table 1 shows data about the total installed capacity based on RES inMexico for the electric power generation in 2014 (SENER, 2015b) andthe maximum and minimum values of the RES potential, which hasbeen reported in several studies (CFE, 2010; CONUEE, 2011; CRE,2011; García et al., 2015; Islas et al., 2013; NREL, 2003; SENER and IIE,2011; SENER, 2012a, 2013). According to this table, this trend towardsa predominant use of fossil fuels and lowparticipation of RES in the elec-tric power sector seems paradoxical when we know that Mexico has animportant RES potential.
On the other hand, since the beginning of the 1990s, especiallythrough the implementation of The National Commission for EnergySavings (Comisión Nacional para el Ahorro de la Energía) (todayCONUEE — Comisión Nacional para el Uso Eficiente de la Energía),EEU has been part of national energy policies and in the context ofnational commitments and targets for climate change and the reduc-tion of proven national oil reserves, it appears that EEU policies inMexico will become more important. To date the Mexican Ministryof Energy through the CONUEE has issued 27 EEU standards ofwhich 22 impact the consumption of electricity (CONUEE, 2016).This article takes into account 23 EEU options which 8 are Mexicanstandards and 4 DG (distributed generation) solar energy based op-tions and try to show that all these options imply an important re-duction of electric power demand which may significantly reducethe consumption of fossil fuels for electricity generation. Evenmore, this article is seeking to prove the technical and economic fea-sibility of low-carbon scenarios in the electric power systems basedon an intensive use of EEU and DG based on renewable energy inthe demand side and the use of RES power plants in electricity sup-ply. The method used to prove this feasibility is the development ofscenarios and the global cost-benefit analysis of an alternative sce-nario against the base scenario. This research may be a benchmarkfor national studies conducted in other countries
General methodology
To develop this work the following steps are made:
• First and foremost, the reference year is established as 2010, since inthis year there are enough data to duly represent the electricity de-mand and the power supply in Mexico to develop the business asusual (BAU) scenario and the low-carbon alternative scenario, for aforecast period of 25 years.
• Secondly, the BAU scenario is created by following the official forecastto develop the electric demand and the power supply (mainly basedin combined cycle and coal plants) in Mexico.
• Thirdly, the low-carbon alternative scenario is created based intwo main components. On the one hand, by representing intenseGHG mitigation actions on the electric demand side, with the im-plementation of 27 emission mitigation options, out of which, 23are related to EEU and 4 are related to DG. On the other hand,with GHG mitigation actions on the power supply considering 9RES-based technologies.
• Finally, a cost-benefit analysis is conducted to define the economicviability of the low-carbon scenario in relation to the BAU scenario.
All of this is simulated in LEAP software (Heaps, 2008), which isan accounting bottom-up model, where a draw between the electricdemand and the generation supply is an unavoidable condition tosimulate in an adequate way for the whole analysis period (Grande,2013).
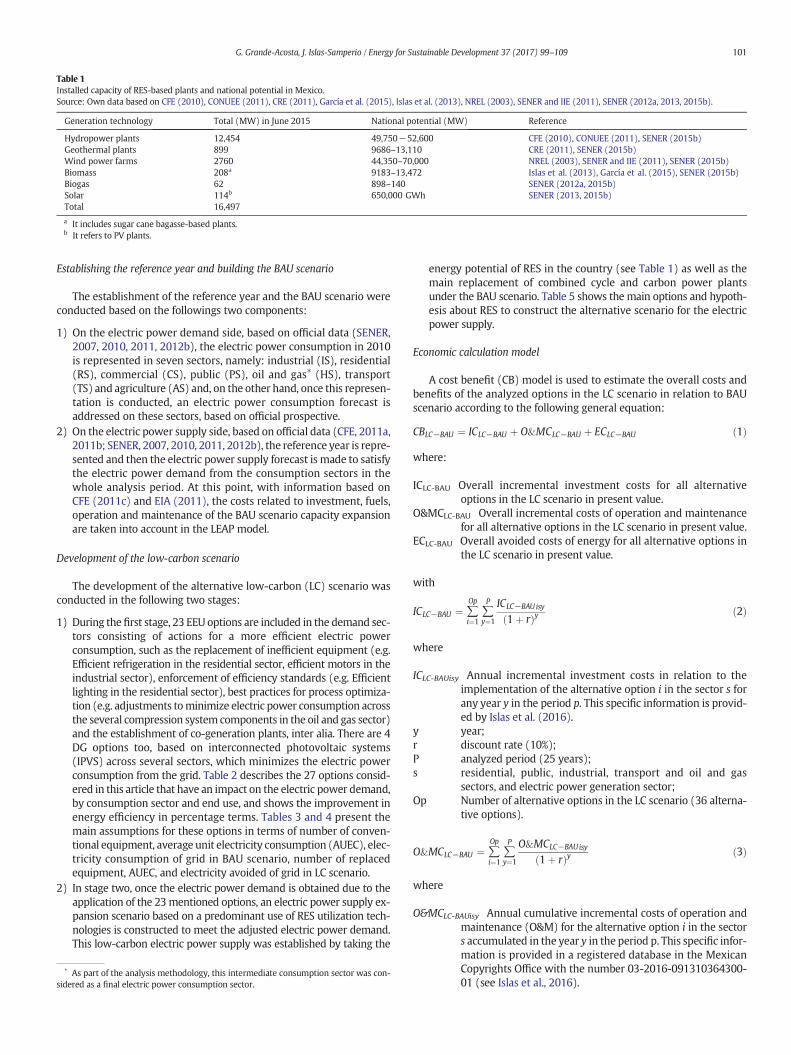
Table 1Installed capacity of RES-based plants and national potential in Mexico.Source: Own data based on CFE (2010), CONUEE (2011), CRE (2011), García et al. (2015), Islas et al. (2013), NREL (2003), SENER and IIE (2011), SENER (2012a, 2013, 2015b).
Generation technology Total (MW) in June 2015 National potential (MW) Reference
Hydropower plants 12,454 49,750−52,600 CFE (2010), CONUEE (2011), SENER (2015b)Geothermal plants 899 9686–13,110 CRE (2011), SENER (2015b)Wind power farms 2760 44,350–70,000 NREL (2003), SENER and IIE (2011), SENER (2015b)Biomass 208a 9183–13,472 Islas et al. (2013), García et al. (2015), SENER (2015b)Biogas 62 898–140 SENER (2012a, 2015b)Solar 114b 650,000 GWh SENER (2013, 2015b)Total 16,497
a It includes sugar cane bagasse-based plants.b It refers to PV plants.
101G. Grande-Acosta, J. Islas-Samperio / Energy for Sustainable Development 37 (2017) 99–109
Establishing the reference year and building the BAU scenario
The establishment of the reference year and the BAU scenario wereconducted based on the followings two components:
1) On the electric power demand side, based on official data (SENER,2007, 2010, 2011, 2012b), the electric power consumption in 2010is represented in seven sectors, namely: industrial (IS), residential(RS), commercial (CS), public (PS), oil and gas⁎ (HS), transport(TS) and agriculture (AS) and, on the other hand, once this represen-tation is conducted, an electric power consumption forecast isaddressed on these sectors, based on official prospective.
2) On the electric power supply side, based on official data (CFE, 2011a,2011b; SENER, 2007, 2010, 2011, 2012b), the reference year is repre-sented and then the electric power supply forecast is made to satisfythe electric power demand from the consumption sectors in thewhole analysis period. At this point, with information based onCFE (2011c) and EIA (2011), the costs related to investment, fuels,operation and maintenance of the BAU scenario capacity expansionare taken into account in the LEAP model.
Development of the low-carbon scenario
The development of the alternative low-carbon (LC) scenario wasconducted in the following two stages:
1) During the first stage, 23 EEU options are included in the demand sec-tors consisting of actions for a more efficient electric powerconsumption, such as the replacement of inefficient equipment (e.g.Efficient refrigeration in the residential sector, efficient motors in theindustrial sector), enforcement of efficiency standards (e.g. Efficientlighting in the residential sector), best practices for process optimiza-tion (e.g. adjustments tominimize electric power consumption acrossthe several compression system components in the oil and gas sector)and the establishment of co-generation plants, inter alia. There are 4DG options too, based on interconnected photovoltaic systems(IPVS) across several sectors, which minimizes the electric powerconsumption from the grid. Table 2 describes the 27 options consid-ered in this article that have an impact on the electric power demand,by consumption sector and end use, and shows the improvement inenergy efficiency in percentage terms. Tables 3 and 4 present themain assumptions for these options in terms of number of conven-tional equipment, average unit electricity consumption (AUEC), elec-tricity consumption of grid in BAU scenario, number of replacedequipment, AUEC, and electricity avoided of grid in LC scenario.
2) In stage two, once the electric power demand is obtained due to theapplication of the 23mentioned options, an electric power supply ex-pansion scenario based on a predominant use of RES utilization tech-nologies is constructed to meet the adjusted electric power demand.This low-carbon electric power supply was established by taking the
⁎ As part of the analysis methodology, this intermediate consumption sector was con-sidered as a final electric power consumption sector.
energy potential of RES in the country (see Table 1) as well as themain replacement of combined cycle and carbon power plantsunder the BAU scenario. Table 5 shows the main options and hypoth-esis about RES to construct the alternative scenario for the electricpower supply.
Economic calculation model
A cost benefit (CB) model is used to estimate the overall costs andbenefits of the analyzed options in the LC scenario in relation to BAUscenario according to the following general equation:
CBLC−BAU ¼ ICLC−BAU þ O&MCLC−BAU þ ECLC−BAU ð1Þ
where:
ICLC-BAU Overall incremental investment costs for all alternativeoptions in the LC scenario in present value.
O&MCLC-BAU Overall incremental costs of operation and maintenancefor all alternative options in the LC scenario in present value.
ECLC-BAU Overall avoided costs of energy for all alternative options inthe LC scenario in present value.
with
ICLC−BAU ¼ ∑Op
i¼1∑P
y¼1
ICLC−BAU isy
1þ rð Þy ð2Þ
where
ICLC-BAUisy Annual incremental investment costs in relation to theimplementation of the alternative option i in the sector s forany year y in the period p. This specific information is provid-ed by Islas et al. (2016).
y year;r discount rate (10%);P analyzed period (25 years);s residential, public, industrial, transport and oil and gas
sectors, and electric power generation sector;Op Number of alternative options in the LC scenario (36 alterna-
tive options).
O&MCLC−BAU ¼ ∑Op
i¼1∑P
y¼1
O&MCLC−BAUisy
1þ rð Þy ð3Þ
where
O&MCLC-BAUisy Annual cumulative incremental costs of operation andmaintenance (O&M) for the alternative option i in the sectors accumulated in the year y in the period p. This specific infor-mation is provided in a registered database in the MexicanCopyrights Office with the number 03-2016-091310364300-01 (see Islas et al., 2016).

Table 2Options for the efficient use of electric power and distributed generation under the low-carbon scenario.Source: Own data based on Islas et al. (2013).
Sector End use Option IDa Option Description
Residential Lighting EEU-RS-ELB Efficient light bulbs 100% of incandescent bulbs are replaced with compact fluorescent lamps (CFL) towards2035. As of the first year of the analyzed period, the use of incandescent light bulbs of100 W or more is forbidden. 7.6 million incandescent light bulbs are replaced annually.The application of NOM-028-ENER-2010 standard is strengthened.
Refrigeration EEU-RS-ER Efficient refrigerators-RS Replacement of the total refrigerators number within the analysis period withefficient refrigerators meeting NOM-015-ENER-2012 standard.
Space conditioning EEU-RS-EACTI Efficient air conditioningand thermal insulation-RS
Replacement of 100% inefficient air conditioning (AC) systems and devices with efficientones, along with the implementation of thermal insulation in roofs. The application ofNOM-023-ENER-2010 and NOM-018-ENER-2011 standards are strengthened.
Use of electric power DG-RS-IPVS Interconnected photovoltaicsystems-RS
All high consumption users in tariff 1 install an IPVS by 2035. A monthly averageconsumption of 353 kWh and the installation of 1 kWp IPVS is considered;therefore, 667 MWp of end capacity in the period are expected.
Commercial Lighting EEU-CS-EL Efficient lighting-CS Replacement of 100% existing lamps (38.5 million in the reference year) byefficient lamps in 2035. The application of NOM-028-ENER-2010 standard isstrengthened.
Air conditioning EEU-CS-EACTI Efficient air conditioningand thermal insulation-CS
Air conditioning equipment replacement with more efficient and thermal insulationis considered. Overall, more than half a million of inefficient equipment are replacedby 2035. The application of NOM-023-ENER-2010 and NOM-018-ENER-2011standards are strengthened.
Public Public lighting EEU-PS-LPL LED public lighting 100% of the existing lamps of the public lighting nationwide are replaced withlight-emitting diode (LED) lamps towards 2035. This option complies with theNOM-031-ENER-2012 standard.
DG-PS-PLIPVS Public lighting with IPVS 3.8 GWp of distributed photovoltaic systems with a capacity of 2.6 kWp, areconnected to the electric power grid in nationwide by 2035 to cover, under a netmetering scheme, the public lighting.
Municipal pumping DG-PS-MPIPVS Municipal pumpingsytems with IPVS
1.2 GWp of distributed photovoltaic systems with a capacity of 2.6 kWp, areconnected to the electric power grid in nationwide by 2035 to supply electric powerto the grid during sunstroke hours nationwide to cover, under a net meteringscheme, the municipal pumping systems.
Industrial Motors EEU-IS-EM Efficient motors It is estimated that there are currently 1.4 million motors in the country and 5million towards 2035. 100% of the inefficient motors in the BAU scenario arereplaced with more efficient ones in the analyzed period. The application ofNOM-016-ENER-2010 standard is strengthened.
Pumps, fans,compressors
EEU-IS-SD Speed variators This option considers the application of variable speed drives in the pumps, fans andcompressors.
Compressors EEU-IS-AC Air compressors This option assumes that by repairing leaks in air compression systems, savings of9716 GWh would be obtained by the end of the analyzed period.
Chillers EEU-IS-EC Efficient chillers-IS It is estimated that there are currently 1.7 million chillers in this sector and therewill be 6.5 million by 2035. 100% of these equipment will be replaced with moreefficient chillers within the analyzed period, thus, savings of 4679 GWh will beobtained by the end of the period.
Lighting EEU-IS-EL Efficient lighting-IS It is estimated that there are currently 49.1 million lamps in this sector and therewill be 181.2 million by 2035. 100% replacement with more efficient lamps isconsidered by the end of the analysis period. The application ofNOM-028-ENER-2010 standard is strengthened.
Electric furnaces andheaters
EEU-IS-EEFH Efficient electric furnacesand heaters
This option considers that is possible the use of more efficient electric furnaces andheaters in this sector.
Iron and steel, aluminum,glass and paper industries
EEU-IS-MR Material recycling An average 27% increase is considered in the use of recycled materials. 2274 GWhare reached in electric power savings by 2035.
Electric powerconsumption
EEU-IS-CG Co-generation-IS It is considered that 8454 MW of cogeneration is fully implemented in this sector by2035.
DG-IS-IPVS Interconnected photovoltaicsystems-IS
12 GWp of photovoltaic systems in distributed generation, are installed andconnected to the grid, under a net metering scheme, by 2035.
Oil and gas Compressors EEU-HS-CRO Compression ratiooptimization
This option consists in the installation of transducers at compressor ports and thecomputerized review of suction and compression cycles in 390 existingcompression systems towards 2035. This option represents 42 GWh annual savings.
EEU-HS-CVA Compressor valveadjustment
It consists in adjusting the suction pressure valve, the return valve and backpressurevalve to minimize the return and feed to the compressor in 390 existingcompression systems towards 2035. Annual 42 GWh savings are also obtained.
EEU-HS-GCSR Gas compression systemresizing
Gas compression systems are deemed resized to minimize losses. This is applicableto all compression systems included towards 2035. This represents up to28 GWh/year in electric power savings.
EEU-HS-FCVA Free cylinder volumeadjustment
It consists in making a manual or automated free cylinder volume adjustment so asto run at its highest capacity in 390 existing compressors systems. 28 GWh/year inelectric power savings are obtained.
EEU-HS-CCOA Compressor cylinderopening adjustment
It consists in making a cylinder opening adjustment at a minimum value to optimizethe compressor efficiency. 28 GWh/year in electric power savings are obtained.
EEU-HS-IISC Intra and inter stage coolers It consists in the implementation of coolers at the compressor use stages to improvethe compressor efficiency. 56 GWh/year are saved with this action.
Heating steam heatersand systems
EEU-HS-IOSMIEE Introduction of on-sitemetering to improve energyefficiency
Supervision, control and data acquisition software utilization to meter on site so asto increase the energy efficiency at this sector's thermal processes. 5 GWh/yearsavings in electric power are achieved in this sector with this action.
EEU-HS-PCP Pipe cleaning with pigging It consists of conducting 390 pipe cleaning projects towards 2035. 3 GWh/yearsavings in electric power in the sector are considered.
102 G. Grande-Acosta, J. Islas-Samperio / Energy for Sustainable Development 37 (2017) 99–109
Table 2 (continued)
Sector End use Option IDa Option Description
Gas production EEU-HS-ONGPS Optimization of gasproduction Systems
This is the implementation of optimization measures in gas production(e.g. inspection of the piping network, optimizing flow to minimize pressure drop andcompressor feed). 7 GWh/year are saved in electric power with this action in the sector.
a EEU = Energy-Efficient Use, DG= Distributed Generation.
103G. Grande-Acosta, J. Islas-Samperio / Energy for Sustainable Development 37 (2017) 99–109
ECLC−BAU ¼ ∑Op
i¼1∑P
y¼1
ECLC−BAU isye
1þ rð Þy ð4Þ
where
ECLC-BAUisy Annual cumulative costs of energy savings (fossil fuel orelectricity) for the alternative option i in the sector s in theyear y in the period p; electricity when the option i in thesector s is an option of electric power demand side and, fossilfuel (fuel oil, diesel, natural gas and coal) when the option i isan option of electric power supply side. This specific informa-tion is provided by Islas et al. (2016).
In order to calculate the mitigation cost for each alternative optionthe following calculation is used:
MCLC−BAUis ¼ TCLC−BAUis
GHGLC−BAUisð6Þ
where
TCLC-BAUis Total incremental costs for the alternative option i of thesector s in the LC scenario in present value.
Table 3Main assumptions of the options for the efficient use of electric power under the low-carbon sSource: Own data based on Islas et al. (2013).
BAU scenario
ID option Number ofconventionalequipment/system/process(thousand)
AUECa
(kWh/year)AAGRa
(%)
2010 2035
EEU-RS ELB 154,546 190,121 117 0.8EEU-RS-ER 24,661 49,539 828 2.8EEU-RS-EACTI 10,841 21,102 1638 2.7EEU-CS-EL 38,467 142,575 500 5.4EEU-CS-EACTI 138 500 7518 5.3EEU-PS-LPL 4620 12,616 963 4.1EEU-IS-EM 1462 4975 48,131 5EEU-IS-SV 687 2338 54,464 5EEU-IS-AC 278 945 51,346 5EEU-IS-EC 1770 6500 3006 5.3EEU-IS-EL 49,822 181,182 202 5.3EEU-IS-EEFH 1.6 5.7 9,091,560 5.3EEU-IS-MR 5500b 10,706b 708 2.7EEU-IS-CG 107,824 392,125 c 5.3EEU-HS-CRO 390 390 711,710 0EEU-HS-CVA 390 390 711,710 0EEU-HS-GCSR 893 893 310,825 0EEU-HS-FCVA 390 390 711,710 0EEU-HS-CCOA 390 390 711,710 0EEU-HS-IISC 893 893 310,825 0EEU-HS-IOSMIEE 350 350 310,623 0EEU-HS-PCP 390 390 278,764 0EEU-HS-ONGPS 450 450 289,914 0
a AAGR= Average Annual Growth Rate, AUEC = Average Unit Electricity Consumption.b Values in tones of production in the iron and steel, aluminum, glass and paper industries.c Refers to energy consumption to grid, and not applicable in this option.
GHG LC-BAUis Total Greenhouse gases emissionsmitigated by the imple-mentation of the alternative option i of the sector s in the LCscenario.
with
TCLC−BAUis ¼ ∑P
y¼1
ICLC−BAUisy
1þ rð Þy þ O&MCLC−BAUisy
1þ rð Þy þ ECLC−BAU isye
1þ rð Þy� �
ð7Þ
GHGLC−BAUis ¼ ESLC−BAUise � EFe ð8Þ
where
ESLC-BAUise Cumulative energy savings in the analyzed period related tothe implementation of alternative option i of the sector s. Theenergy savings e is electricity when the option i in the sector sis an option of the electric power demand side and, fossil fuel(fuel oil, diesel, natural gas and coal) when the option i is anoption of the electric power supply side. This specific infor-mation is provided by Islas et al. (2016).
EFe GHG emission factor of energy e.
cenario.
LC scenario
Number of replacedequipment/system/process(thousand)
AUEC(kWh/year)
AAGR(%)
Percentage efficiencyimprovement of theAUEC (%)
2011 2035
7392 190,121 33 14.5 721000 49,539 372 17.7 551000 21,102 983 13.5 402500 142,575 435 18.4 1350 500 4511 10.1 4032 12,616 490 28.2 4951 4975 44,509 21 824 2338 43,571 21 2010 945 41,077 21.1 2062 6500 2254 21.4 251727 181,182 176 21.4 130.1 5.7 8,000,573 18.3 123100b 10,706b 496 5.3 30110.8 67,390 c 30.6 17390 390 604,953 0 15390 390 604,953 0 15893 893 279,743 0 10390 390 640,539 0 10390 390 640,539 0 10893 893 248,660 0 20350 350 295,091 0 5390 390 270,401 0 3450 450 275,419 0 5

Table 4Main assumptions of the options for distributed generation under the low-carbon scenario.Source: Own data based on Islas et al. (2013).
BAU scenario LC scenario
ID option Electricity consumptionof gridin the sectorial base line(GWh)
AAGR(%)
Electricity avoided ofgrid(GWh)
AAGR(%)
New installedcapacity (MW)
Percentage ofelectricity avoidedof grid (%)
2010 2035 2011 2035 2011 2035
DG-RS-IPVS 1723 2827 2.0 7.5 1006 21.6 5.0 667 35.6DG-PS-PLIPVS 4583 12,514 4.1 15.8 6179 27.0 9.4 3773 49.4DG-PS-MPIPVS 3140 8575 4.1 27.8 2069 18.8 16.7 1246 24.1DG-IS-IPVS 107,824 392,125 5.3 1.1 24,646 49.3 0.6 12,058 6.3
104 G. Grande-Acosta, J. Islas-Samperio / Energy for Sustainable Development 37 (2017) 99–109
Results
BAU scenario
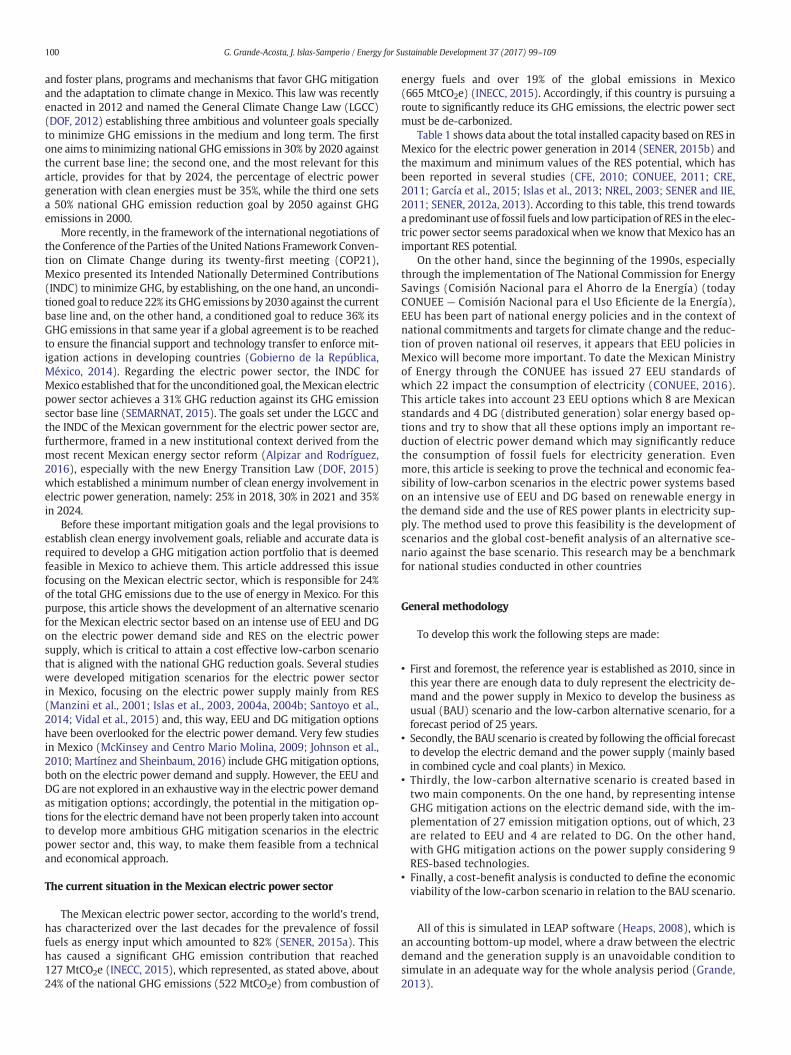
The current official projections were reproduced appropriatelyin the BAU scenario (see Fig. 1). In this scenario according to ourresults, electric power demand in Mexico shows an acceleratedannual growth of 4.9% in average and by the end of the analysisperiod reaches 663 TWh, which represents 3.3 times the electricpower demand in 2010 (199 TWh). This growth is fostered by theindustrial and commercial sector demand developing at an annualgrowth rate of 5.3%, followed by the residential sector (4.6%) andthe oil and gas and the transportation sectors with the same annualgrowth of 3.6%. Lastly, the agricultural sector has the lowest dynamism,since its electric power demand is expected to grow at 1.8%/year(Fig. 1).
To meet the electric power demand under this scenario, the pre-ferred technologies under the BAU scenario, according to the Mexicanofficial prospective, gas combined cycle and coal power plants whichcapacity has an average annual growth from 5.3% and 6.1%, respectively.
Table 5RES options selected for the low-carbon scenario.Source: Own data based on Islas et al. (2013).
Option IDa RES option for theelectrical supply
Main hypothesis
RES-BGAS Biogas The highest estimated potential in SENER(2012a) of 1.4 GW is reached by 2035.
RES-BIOMW Biomass from waste Plants with capacities of 25, 35 and 50 MWusing waste from the forest and rainforestsustainable management are installed, and8.25 GW is reached by 2035.
RES-BIOMEP Biomass fromenergy plantations
Plants with capacities of 25, 35 and 50 MWusing biomass from energy plantations areinstalled as of 2020, and 1.2 GW is reached.
RES-WIND Wind power A total Wind power capacity of 20 GW isinstalled in the analyzed period.
RES-GEO Geothermal plants A total of 12.4 GW is installed by 2035 of thistechnology.
RES-HYDROG Power plantN30 MW
The installation of additional 17.4 GW hydropower plants is considered where the 35% ofthis capacity (mostly peak capacity) is used tomanage the intermittence from wind powerand PV plants and in this way to adjust theelectricity demand curve and the electricpower supply.
RES-HYDROS Small power plantsb30 MW
In 2035 4.4 GW of small power plants areutilized.
RES-SPV Solar PV 4 GW in PV plants are reached nationwide in2035.
RES-STH Solar Thermal 1.1 GW of solar thermal power plants with15% storage is reached in 2035, mainly indesert areas in the northern area of thecountry.
a RES = Renewable Energy Sources.
On the contrary, the capacity of fuel oil-based thermal power plants willdecrease 3.1%/year in average (Fig. 2).
Regarding technologies based in renewable energy, power plantscapacity (including low scale ones) show an average annual growth of3.1% where geothermal, wind power and solar power plants have anannual average capacity increase of about 7.5%, a growth that is insuffi-cient for RES involvement to become significant in electric power gener-ation. Lastly, the nuclear technology capacity grows at an annual rate of0.7%, due to the repowering of the existing units.
The described supply scenario leads to electric power inputs on thesupply side for 5662 PJ in 2035, where 88% (5019 PJ) come from fossilfuels (natural gas, coal, fuel oil, diesel and petroleum coke), which rep-resent a growth of 270% against the one in 2010. This scenario is ex-panded mainly to gas and coal based against the use of fuel oil, whichhas a high GHG emission and pollutant factor, due to the scheduledshutdown, throughout the period, of steam-based plants based on thisoil by-product. Regardless of this replacement, forecast trends for thefuel consumption structure in the electric power sector have a signifi-cant impact on the GHG emission volume (Fig. 3), which amountto 334.4 MtCO2e in 2035, a 284% higher figure against the number in2010. Gas will be more involved in emission volume, from 47% to 59%of the total number. A similar trend results in coal emissions, whichoverall GHG emission involvement will go from 25% to 38% (Fig. 3).Lastly, the GHG emission ratio from fuel oil will decrease significantly,since 2010 amounts to 27% to 1% in 2035%, while diesel and petroleumcoke involvement in global GHG emissions go from 1% to 3% by the endof this period.
Low-carbon scenario
Electric power demandThe impact of EEU and DG options that have been considered in the
electrical demand sector may be seen in Fig. 4. From these options, theannual growth average of the overall electric power demand will gofrom 4.9% under the trend scenario to 2.9% under the low-carbonscenario. As youmay see, the six options contributingmore significantlyto the electric power demand reduction are co-generation, speedvariators, IPVS and efficient motors in the industrial sector as well asefficient refrigerators and light bulbs in the residential sector.
Electric power supplyTo satisfy the adjusted electrical demand of the low-carbon scenario,
the electrical supply is constructed considering the use of renewablesources in a predominant way. PV centrals grow at an annual rate of67% to reach a total of 4000MW in 2035.Windpower plants showa sig-nificant annual growth of 41% amounting to a total of 20,085 MW in2035. As for geothermal plants, an annual increase of 11% is estimated,which represents an installed capacity of about 13,000 MW by the endof the analyzed period. On the other hand, solar thermal plants thatwill start spreading as of the first decade of the analyzed period and
Fig. 1. Electric power demand in Mexico by sector in the BAU scenario according to official projections.Source: Own data based on SENER (2007, 2010, 2011, 2012b).
105G. Grande-Acosta, J. Islas-Samperio / Energy for Sustainable Development 37 (2017) 99–109
will reach 1000MW,which entails an annual increase in capacity of 20%(Fig. 5).
As for hydroelectricity plants (including low scale ones), thesewill have an annual average capacity growth of 4%, adding up to29,452 MW by the end of the period. Likewise, the use of biomasswill have an annual average growth of 18%, which results in a totalinstalled capacity of 9435MWby 2035; especially, due to the utiliza-tion of biomass waste from the sustainable management of forestsand rainforests. Lastly, it must be noted that, under this low-carbonscenario, an installation of 1228 MW from electric power generationsystems frommunicipal solid waste (MSW) and livestock waste bio-gas will be taken into account, with an average annual growth rate of31%.
Cost-benefit and GHG emission reduction analysis
The cost-benefit analysis results for each EEU, DG and RES optionsdescribed in the section above are shown in Fig. 6. Axis Y represents
Fig. 2. Capacity by generation technology in the BSource: Own data based on CFE (2011a, 2011b), S
the mitigation cost and axis X represents GHG emissions accumulatedin the analysis period derived from the implementation of every optionand sorted from a lower to a higher cost. As you may see, most ofthe EEU options and RES entail negative costs, i.e., economic benefitsare obtained when applied, while solar options, both distributed andcentrals have the higher costs but a significant volume of GHG emissionreduction.
From all options, efficient lighting in residential sector is the actionwith the highest economic benefit and an important GHG reduction,the second best option is the efficient electric furnaces and heaters inthe industrial sector with also an important GHG reduction, and thethird, is the adjustment of the free cylinder volume option in the Oiland Gas sector but with a very low volume of GHG reduction. Whilethe higher cost options are IPVS in the industry sector, street lightingwith IPVS and the utility pumping with IPVS in the public sector, thesethree options have an important GHG reduction but high costs.
The Table 6 shows the low-carbon scenario results in global benefitsof about $8524MUSD throughout the 25-year period, out of which, 74%
AU scenario according to official projections.ENER (2007, 2010, 2011, 2012b).

Fig. 3. Consumption from the Mexican electric power sector by energy source and GHG emissions in the BAU scenario.Source: Own data.
106 G. Grande-Acosta, J. Islas-Samperio / Energy for Sustainable Development 37 (2017) 99–109
will be generated from the electric power demand side where EEU andDG options are put in place and the remaining 16% is obtained from theelectric power supply side with the implementation of renewableenergy power plants. However, this scenario entails a significant totalinvestment cost of about $48,970 MUSD in the analysis period and,in this item, RES options for electric power supply amount to a littlemore than half those costs and the remaining from the EEU and DGoptions on the electric power demand; therefore, the aspiration ofachieving a low-carbon electric power system, just like the one statedin this article represents huge funding challenges. While the total oper-ation and maintenance represents savings in the amount of $4353MUSD, it must be noted that these benefits are focused on RES optionsin the electric power supply and these type of benefits are relativelylow in EEU and DG options on the electric power demand side. Wemust highlight that by putting this scenario in place, there will be alsoimportant benefits, such as fuel savings of about $53,141 MUSD,
Fig. 4. EEU and DG option contribution to reduce theSource: Own data.
where 57% come from the electric power demand and the remaining43% from the electric power supply.
Regarding GHG emissions, the low carbon scenario implementationmeans, on the one hand, an accumulated reduction of 2526 MtCO2e inthe electricity generation during the analysis period, which representsa 50% reduction of the accumulated GHGemissions for the BAU scenarioand, on the other hand, that the electricity generation has, by 2035,annual emissions for 71 MtCO2e, which means a 79% reduction relatedto the annual emissions of the BAU scenario for 2035. Moreover, if thelow-carbon scenario is pursuit, GHG emissions by 2035 from the elec-tricity generation will be 40% less than in 2010, which consolidatesthe path towards stabilizing GHG emissions in the Mexican electricitygeneration (Fig. 7).
In terms of the goal under the LGCC of achieving 35% of the electricpower generation with clean energy by 2024, the low-carbon scenariowould achieve it since 59% of the electricity generation comes from
electricity demand in the Low Carbon scenario.

Fig. 5. Capacity by type of generation technology in the electric power supply in the low-carbon scenario.Source: Own data.
107G. Grande-Acosta, J. Islas-Samperio / Energy for Sustainable Development 37 (2017) 99–109
renewable energies in that year. Likewise, the objective of minimizingthe electric power sector GHG emissions in 31% against a base line setto meet the unconditioned INDC in Mexico in this sector, is achievedunder the low-carbon scenario, since GHG emissions are minimizedin 67% against GHG emissions in the BAU scenario. Lastly, the goalsunder the most recent Energy Transition Law of a minimum share ofclean energies for electric power generation that would be 25% for2018, 30% for 2021 and 35% for 2024 are achieved in this alternativescenario, since energy generation from renewable energies is 43% in2018, 51.3% in 2021 and 59% in 2024.
Fig. 6.Mitigation costs curve for EEU, DG and RES options in theSource: Own data.
As stated above, the implementation of this low-carbon scenariowould entail incremental investment costs, according to our results,on the order of $48,970 million dollars (MUSD) throughout the25 years of the analysis period (equivalent to an annual incremental in-vestment cost of around $2000 MUSD) which are divided by $23,715MUSD due to the implementation of EEU and DG options on the electricdemand side and $25,255 MUSD due to the implementation of REStechnologies in the electric power supply, i.e., an incremental invest-ment of almost 1 Billion USD per year, both on the electric demandand supply sides.
low carbon scenario for the Mexican electric power system.

Table 6Cost-benefit and saved emissions by type of option and sector in the low-carbon scenario.Source: Own data.
Sector Type ofoption
Investment cost(MUSD2007)
O&M cost(MUSD2007)
Fuel cost(MUSD2007)
Total cost-benefit(MUSD)
Saved emissions(MtCO2e)
Demand EEU $635 $0 −$1496 −$861 32Oil and gas EEU $185 $42 −$564 −$337 13Industrial DG $9928 $99 −$1200 $8827 40
EEU $4182 $32 −$15,167 −$10,954 445Public DG $2855 $0 −$660 $2196 18
EEU $537 $0 −$416 $121 12Residential DG $420 $2 −$168 $254 2
EEU $4973 $0 −$10,521 −$5548 201Demand subtotal $23,715 $175 −$30,192 −$6301 763
Supply Electric power generation E-RES $25,255 −$4528 −$22,949 −$2223 1763Supply subtotal $25,255 −$4528 −$22,949 −$2223 1763Global $48,970 −$4353 −$53,141 −$8524 2526
EEU = Energy-Efficient Use options, DG= Renewable distributed generation options.
108 G. Grande-Acosta, J. Islas-Samperio / Energy for Sustainable Development 37 (2017) 99–109
Conclusions
Under the BAU scenario conditions, the amount of the requiredenergy in México is 5662 PJ in 2035 that is higher at 270% in relationto the one in 2010. According to this trend, the GHG emissions reach334.4 MtCO2e in 2035 with a 284% increase against 2010. These emis-sions comemainly from the use of gas in the first place, and it is follow-ed by coal.
The GHG emission reduction in the electricity generation under thelow-carbon scenario comes from two components –the application of27 mitigation options from the electrical demand side, out of which 23are EEU and 4 are DG, and are implemented across the several electricityfinal consumption sectors, including the oil and gas sector and, on theother hand, the expansion of the RES in the electricity supply side.This portfolio of options offers a potential of emission reduction equalto 2526 MtCO2e in the analysis period (762 MtCO2e related to the EEUand DG options on the electrical demand side and 1763 MtCO2e fromRES on the electric power supply side), equal to 50% accumulated emis-sions in the BAU scenario in the analysis period.
According to our estimations made, in the low-carbon emissionscenario, a 63% of the electricity generation from RES may be achieved
Fig. 7. Reduction emissions with RES,Source: Own data.
towards 2035 on the electric supply side. Under this scenario, EEUoptions, at most, will yield benefits. However, DG options entails costs,but with a significant potential to mitigate GHG emissions. On the elec-tric power supply side, both hydroelectricity and solar technologies(thermal and PV) entail mitigation costs and the highest ones arefound in the two solar technologies. However, the remaining optionsyield benefits. All mitigation actions under the low-carbon scenarioaltogether cause benefits in the amount of $53,141 MUSD to exceedcosts for $48,970 MUSD, so that a low-carbon scenario at no cost iscreated with a net economic benefit in the amount of $8524 MUSD.
Results show that the low-carbon scenario is also well aligned withthe national goals for the electric power sector established underthe LGCC, the Mexican INDC and those under the most recent EnergyTransition Law, since the low-carbon scenario exceeds them. Resultsshow that it is also possible to reach a GHG emission peak in theMexican electric power sector within a short period if the low-carbonscenario is implemented.
However, results show that the main constraint to implement thisscenario is the funding, since the incremental investment is in theballpark of the required 2000 MUSD/year for its implementation;accordingly, it is essential to define the objective of obtaining higher
EEU and DG options, 2010–2035.

109G. Grande-Acosta, J. Islas-Samperio / Energy for Sustainable Development 37 (2017) 99–109
sources of funding, both domestic and international, and to createappropriate funding mechanisms for each type of mitigation action.More particularly, for concentrated solar thermal power and PVtechnologies, it is crucial to set mechanisms and incentives to supporta larger scale dissemination thereof.
Acknowledgments
The authors acknowledge Project 117808 of SENER-CONACYTEnergy Sustainability Fund for having funded this study and the PhDscholarship (No. 207111) granted by CONACYT.
References
Alpizar I, Rodríguez C. Review of Mexico's energy reform in 2013: background, analysis ofthe reform and reactions. Renew Sustain Energy Rev 2016;58:725–36.
Comisión Federal de Electricidad (CFE). Potencial hidroeléctrico nacional. México: CFE;2010.
Comisión Federal de Electricidad (CFE). Estadísticas 2010. México: CFE; 2011a.Comisión Federal de Electricidad (CFE). Programa de Obras e Inversiones del Sector
Eléctrico 2011–2025. México: CFE; 2011b [Available from: http://www.sener.gob.mx/portal/Default.aspx?id=1453 [accessed on January 20, 2013]].
Comisión Federal de Electricidad (CFE). Costos y Parámetros de Referencia para laFormulación de Proyectos de Inversión del Sector Eléctrico 2010. Mexico: CFE; 2011c.
Comisión Nacional para el Uso Eficiente de Energía (CONUEE). Fuentes renovables deenergía. Tecnologías de aprovechamiento. Hidráulica. [Internet]. México: CONUEE;2011, [Available from: http://www.conae.gob.mx/wb/CONAE/CONA_24_energias_renovables [accessed on July 27, 2011]].
Comisión Nacional para el Uso Eficiente de Energía (CONUEE). Normas OficialesMexicanas de Eficiencia Energética NOMs. [Internet]. México: CONUEE; 2016,[Available from: http://www.gob.mx/conuee/documentos/normas-oficiales-mexicanas-de-eficiencia-energetica-89073?idiom=es [accessed on December 9, 2016]].
Comisión Reguladora de Energía (CRE). Evaluación de la Energía Geotérmica en México.México: Comisión Reguladora de Energía, BID; 2011.
Diario Oficial de la Federación (DOF). Ley General de Cambio Climático. Enacted onJune 6, 2012. México: HCU; 2012 [Available from: http://www.diputados.gob.mx/LeyesBiblio/pdf/LGCC_130515.pdf [accessed on March 10, 2014]].
Diario Oficial de la Federación (DOF). Decreto por el que se expide la Ley de TransiciónEnergética. Enacted on december 24, 2015. México: HCU; 2015 [Available from:http://dof.gob.mx/nota_detalle.php?codigo=5421295&fecha=24/12/2015 [accessedon January 10, 2016]].
Energy Information Administration (EIA). Annual energy outlook 2011. USA: Departmentof Energy, EIA; 2011.
García C, Riegelhaupt E, Ghilardi A, Skutsch M, Islas J, Manzini F, et al. Sustainablebioenergy options for Mexico: GHG mitigation and costs. Renew Sustain EnergyRev 2015;43:545–52.
Gobierno de la República, México. Versión de Difusión del Programa Especial de CambioClimático 2014–2018 (PECC 2014–2018). México: SEMARNAT, Gobierno de laRepública; 2014 [Available from: http://www.cenapred.unam.mx/es/documentosWeb/Avisos/cambio_climatico.pdf [accessed on June 03, 2015]].
Grande G. Análisis técnico económico de escenarios de energías renovables parageneración de electricidad en México 2035 [Tesis de Doctorado] México: Programade Posgrado en Ingeniería, Universidad Nacional Autónoma de México; 2013.
Grubb M, Jamasb T, Pollit MG. Delivering a low carbon electricity system: technologies,economics and policy. Cambridge: Cambridge University Press; 2008.
Heaps CG. Long-range energy alternatives planning (LEAP) system. [Software version2008.0.0.33]. USA: Stockholm Environment Institute; 2008.
InstitutoNacional de Cambio Climático (INECC). Inventario deGases y Compuestos de EfectoInvernadero 2013. Mexico: INECC; 2015 [Available from: http://www.inecc.gob.mx/descargas/cclimatico/2015_inv_nal_emis_gei_result.pdf [accessed on September 20,2015]].
International Energy Agency (IEA). World energy outlook. France: IEA; 2013a.
International Energy Agency (IEA). CO2 emissions from fuel combustion. France: IEA;2013b.
Islas J, Manzini F, Martínez M. Cost-benefit analysis of energy scenarios for the Mexicanpower sector. Energy 2003;28(10):979–92.
Islas J, Hernández H, Manzini F, Macías P. Nuevas energías renovables: Una alternativaenergética sustentable para México. Análisis y propuesta. México: Instituto deInvestigaciones Legislativas del Senado de la República; 2004a.
Islas J, Manzini F, Martínez M. CO2 mitigation costs for new renewable energy capacity inthe Mexican electricity sector using renewable energies. Solar Energy 2004b;76:499–507.
Islas J, Macías P, Grande G. Reporte Final. Proyecto 117808 del Fondo de SustentabilidadEnergética SENER-CONACYT “Evaluación Económica y Ambiental de Escenarios al2030 de la Inserción de Fuentes Alternas de Energía y Medidas de EficienciaEnergética en el Sistema Energético Mexicano en Base a su Potencial de Reducciónde GEI”. Mexico: Centro de Investigación en Energía de la UNAM, Instituto deEnergías Renovables de la UNAM; 2013.
Islas J, Pérez M, Grande G. Base de datos económicos, energéticos y ambientales de lasacciones y medidas de mitigación de GEI al 2035 para México. Registro de Autor(copyright) 03-2016-091310364300-01. Mexico: INDAUTOR; 2016.
Johnson T, Alatorre C, Romo Z, Liu F. Low-carbon development for Mexico. The WorldBank; 2010.
Manzini F, Islas J, MartínezM. Reduction of greenhouse gases using renewable energies inMexico 2025. Int J Hydrogen Energy 2001;26(2):145–9.
Martínez S, Sheinbaum C. The impact of energy efficiency standards on residentialelectricity consumption in Mexico. Energy Sustain Dev 2016;32:50–61.
McKinsey and Centro Mario Molina. Low-carbon growth. A potential path for Mexico.México: McKinsey; 2009.
National Renewable Energy Laboratory (NREL). Wind energy resource. Atlas of Oaxaca.USA: NREL; 2003.
Santoyo E, Stamford L, Azapagic A. Environmental implications of decarbonising electric-ity supply in large economies: the case of Mexico. Energ Convers Manage 2014;85:272–91.
Secretaría de Energía (SENER). Prospectiva del Sector Eléctrico 2007–2016.México: SENER;2007 [Available from: http://www.sener.gob.mx/res/PE_y_DT/pub/Prospectiva%20Sector%20Electrico%20FINAS.pdf [accessed on October 20, 2012]].
Secretaría de Energía (SENER). Prospectiva del Sector Eléctrico 2010–2025.México: SENER;2010 [Available from: http://www.sener.gob.mx/res/1825/SECTOR_ELECTRICO.pdf[accessed on February 20, 2013]].
Secretaría de Energía (SENER). Balance Nacional de Energía 2010. México: SENER; 2011[Available from: http://sener.gob.mx/res/PE_y_DT/pub/2011/Balance%20Nacional%20de%20Energ%C3%ADa%202010_2.pdf [accessed on September 12, 2012]].
Secretaría de Energía (SENER). Biogás [internet]. México: SENER; 2012a [Available from:http://www.renovables.gob.mx/portal/Default.aspx?id=2195&lang=2 [accessed onSeptember 12, 2012]].
Secretaría de Energía (SENER). Sistema de Información Energética [internet]. México:SENER; 2012b [Available from: http://sie.energia.gob.mx/bdiController.do?action=cuadro&subAction=applyOptions [Accessed on September 17, 2012]].
Secretaría de Energía (SENER). Prospectiva de Energías Renovables 2013–2027. México:SENER; 2013 [Available from: http://sener.gob.mx/res/PE_y_DT/pub/2014/Prospectiva_Energias_Reno_13-2027.pdf [accessed on October 13, 2014]].
Secretaría de Energía (SENER). Balance Nacional de Energía 2014. México: SENER; 2015a[Available from: http://www.gob.mx/cms/uploads/attachment/file/44353/Balance_Nacional_de_Energ_a_2014.pdf [accessed on January 15, 2016]].
Secretaría de Energía (SENER). Prospectiva de Energías Renovables 2015–2029. México:SENER; 2015b.
Secretaría de Energía, Instituto de Investigaciones Eléctricas (SENER and IIE). Zonas deAprovechamiento Potencial para la Generación Eoloeléctrica. México: SENER, IIE;2011i.
Secretaría de Medio Ambiente y Recursos Naturales (SEMARNAT). Compromisosde Mitigación y Adaptación ante el Cambio Climático para el periodo 2020–2030.México: SEMARNAT, Gobierno de la República; 2015T [Available from: http://www.inecc.gob.mx/descargas/adaptacion/2015_indc_esp.pdf [accessed on June 20, 2015]].
Vidal J, Østergaard P, Sheinbaum C. Optimal energy mix for transitioning from fossilfuels to renewable energy sources — the case of the Mexican electricity system.Appl Energy 2015;150:80–96.