Embed Size (px)
Citation preview
Partnership for theTropical Forest
Margins
Towards a Landscape Approach for Reducing Emissions
A Substantive Report ofthe Reducing Emissions from All Land Uses (REALU) Project
Norad
To
Redu
Novemb
oward
ucing Em
er 2013
ds a LRed
A Sumission
Landducin
bstantins from
scapeg Em
ve RepoAll Lan
e Appmissio
ort of tnd Uses
proacons
he (REALU
IAAR
ch for
U) Proje
RD
r
ect
ii
Edited by: Florence Bernard1, Peter A. Minang1, Meine van Noordwijk2, Olivia E. Freeman1, Lalisa A. Duguma1
1World Agroforestry Centre, ASB Partnership for the Tropical Forest Margins. United Nations Avenue, Gigiri, PO Box 30677, 00100, Nairobi, Kenya
www.worldagroforestry.org ; www.asb.cgiar.org
2World Agroforestry Centre, Southeast Asia Regional Office, ASB Partnership for the Tropical Forest Margins Jl. CIFOR, Situ Gede, Sindang Barang, Bogor 16115 PO Box 161, Bogor 16001, Indonesia
www.worldagroforestry.org/sea
Contributors:
Cameroon: Dieudonne Alemagi1, Mireille Feudjio1, Martin Yemefack2, Nathalie Ewane2, Anne Nadège Magne2, Martin Tchienkoua3, T. Nyobe3, R.Njomgang3, Zac Tchoundjeu1, Ebenezar Assah1
Indonesia: Atiek Widayati1, Suyanto1, Sonya Dewi1, Agung Putra1, Andree Ekadinata1, Gamma Galudra1, Feri Johana1, Rachmat Mulia1, Fahmuddin Agus4, M Maswar4, Anang Firmansyah4, Jubaedah4, Siti Nurzakiah4, Ratna Akiefnawati, Jasnari, Ni’matul Khasanah1, Subekti Rahayu1, Dinna Tazkiana1, Noviana Khususiyah1, Muhammad Sofiyuddin1, Elok Mulyoutami1, Arif Rahmanulloh1, Muhammad Thoha Zulkarnain1, Janudianto1, Aulia Perdana1, Ujjwal Pradhan1
Peru: Claudia Silva1, Valentina Robiglio1, Glenn Hyman5, Douglas White6, Jason Donovan1, Jonathan Cornelius1, Bruno Paino1, Diego Garcia7, Julio Alegre8
Vietnam: Do Trong Hoan1, Rohit Jindal9, Rachmat Mulia1, Hoang Minh Ha10, Delia Catacutan1, Vu Tan Phuong11, Do Dinh Sam11, Tran Thi Thu Anh11, David Eastman12
1World Agroforestry Centre; 2International Institute of Tropical Agriculture-Cameroun; 3Institute for Agricultural Research and Development; 4Indonesian Agency for Agricultural Research and development (IAARD); 5Centre for International Tropical Agriculture (CIAT); 6Consultant R4D&C; 7Peruvian Amazon Research Institute (IIAP); 8University of La Molina, Lima, Peru; 9School of Business, MacEwan University, Canada; 10Swedish University of Agricultural Sciences (SLU); 11Vietnamese Academy of Forest Sciences (VAFS); 12Consultant with UN-REDD Secretariat in Switzerland.
iii
Citation
Bernard, F., Minang, P.A., van Noordwijk, M., Freeman, O.E., Duguma, L.A. (Eds) 2013. Towards a landscape approach for reducing emissions: substantive report of Reducing Emissions from All Land Uses (REALU) project. Nairobi, Kenya. World Agroforestry Centre – ICRAF. 119 p.
ISBN 978-92-9059-355-3
Contact person
Florence Bernard ([email protected])
Cover image
Do Trong Hoan, Claudia Silva, Agung Putra, Dieudonne Alemagi, Mireille Feudjio
Design and layout
Judith Nzyoka, Florence Bernard, Olivia E. Freeman
Disclaimer
The views expressed in this publication are those of the author(s) and not necessarily those of the World Agroforestry Centre.
Articles appearing in this publication may be quoted or reproduced without charge, provided the source is acknowledged.
All images remain the sole property of their source and may not be used for any purpose without written permission of the source.
iv
TABLE�OF�CONTENTS�
LIST OF FIGURES ...................................................................................................................... vii
LIST OF TABLES ......................................................................................................................... ix
LIST OF ACRONYMS .................................................................................................................. x
EXECUTIVE SUMMARY .......................................................................................................... xii
The project ................................................................................................................................. xii
Pathways to impact ................................................................................................................... xiv
Summary of lessons and recommendations .............................................................................. xv
Next steps ................................................................................................................................ xvii
LIST OF PUBLICATIONS ....................................................................................................... xviii
OUTLINE OF THE REPORT .................................................................................................... xxx
I REALU: AN INTRODUCTION ............................................................................................... 1
1.1 The project .......................................................................................................................... 1
1.1.1 REALU project goal and indicator .............................................................................. 1
1.1.2 REALU objectives ....................................................................................................... 1
1.1.3 REALU project components ....................................................................................... 2
1.2 Why REALU? .................................................................................................................... 3
1.2.1 The absence of a globally agreed definition of ‘forest’ ............................................... 3
1.2.2 High potential emissions reduction and sequestration in other land uses ................... 4
1.2.3 Drivers of deforestation largely outside the forests ..................................................... 4
1.2.4 Potential of intermediate land uses such as tree-based agricultural systems ............... 5
1.3 How different is REALU from REDD+? ........................................................................... 6
1.4 Landscape considerations in REALU ................................................................................ 8
1.5 Project countries and landscapes ...................................................................................... 10
1.5.1 Efoulan Municipality in southern Cameroon ............................................................ 12
1.5.2 Tanjung Jabung Barat (Tanjabar) District in Indonesia ............................................ 13
v
1.5.3 Padre Abad Province in Peru ..................................................................................... 14
1.5.4 Bac Kan Province in Vietnam ................................................................................... 15
II REALU FEASIBILITY IN FOUR DIFFERENT LANDSCAPES ....................................... 19
2.1 Rationale ........................................................................................................................... 19
2.1.1 Overarching goal ....................................................................................................... 19
2.1.2 Methods and tools ...................................................................................................... 19
2.2 Opportunities for reducing emissions from all land uses in the four demonstration landscapes .................................................................................................................................. 20
2.2.1 Feasibility assessment in Efoulan Municipality in Cameroon .................................. 21
2.2.2 Feasibility assessment in Tanjabar District in Indonesia........................................... 24
2.2.3 Feasibility assessment in Padre Abad Province in Peru ............................................ 32
2.2.4 Feasibility assessment in Bac Kan Province in Vietnam .......................................... 38
III POTENTIAL FOR EMISSION REDUCTION THROUGH PEATLAND MANAGEMENT 45
3.1 Importance of peatlands as major carbon pool ................................................................. 45
3.2 Characterization of peatlands in the upper Nyong River basin, Central Southern Cameroon .................................................................................................................................. 46
3.3 Characterization of CO2 emissions in peatlands in Indonesia .......................................... 47
3.3.1 Spatial variation of water table depth and CO2 emission from a peat soil in Indonesia 47
3.3.2 Peatland carbon emissions resulting from different forest conversions .................... 48
3.4 Characterization of Aguajales in the Aguaytia River basin, Peru .................................... 51
3.5 Characterization of peatlands in Ca Mau and Kien Giang provinces, Vietnam .............. 53
IV INCENTIVE SCHEMES FOR REALU .............................................................................. 56
4.1 Rationale ........................................................................................................................... 56
4.2 Incentives for the four landscapes .................................................................................... 56
4.2.1 Cocoa intensification through tree improvement and domestication in Efoulan, Cameroon............................................................................................................................... 56
vi
4.2.2 Formalization of a community forestry mechanism in Tanjabar Indonesia .............. 58
4.2.3 Strengthening Dyera polyphylla (Jelutong) value chain in Tanjabar, Indonesia ...... 59
4.2.4 Improving carbon stock within land units including cocoa, pasture, forests in Padre Abad, Peru ............................................................................................................................. 61
4.2.5 Community forest management and agroforestry for increasing carbon stocks in the Bac Kan landscape, Vietnam ................................................................................................. 63
V ENABLING CONDITIONS FOR LANDSCAPE APPROACHES ..................................... 65
5.1 REDD+ readiness ............................................................................................................. 65
5.2 Benefit distribution ........................................................................................................... 67
5.2.1 Lessons from benefit distribution across scales for REDD+ in Vietnam .................. 67
5.3 Promoting a co-investment approach including the private sector .................................. 71
VI METHODS AND TOOLS FOR LANDSCAPE LEVEL ASSESSMENT AND PLANNING FOR REDD+ WITH SUSTAINABLE BENEFITS ..................................................................... 73
6.1 Legitimacy versus validity: a dilemma for choosing the right tool kit for assessing, planning and decision making in landscapes ............................................................................ 73
6.2 Land-use planning for low-emission development strategies (LUWES) ......................... 75
6.2.1 Why LUWES? ........................................................................................................... 76
6.2.2 What can LUWES do? .............................................................................................. 76
6.2.3 LUWES in six steps ................................................................................................... 77
VII FROM REALU TO LANDSCAPE APPROACHES: LESSONS AND RECOMMENDATIONS .............................................................................................................. 79
REFERENCES ............................................................................................................................. 84
vii
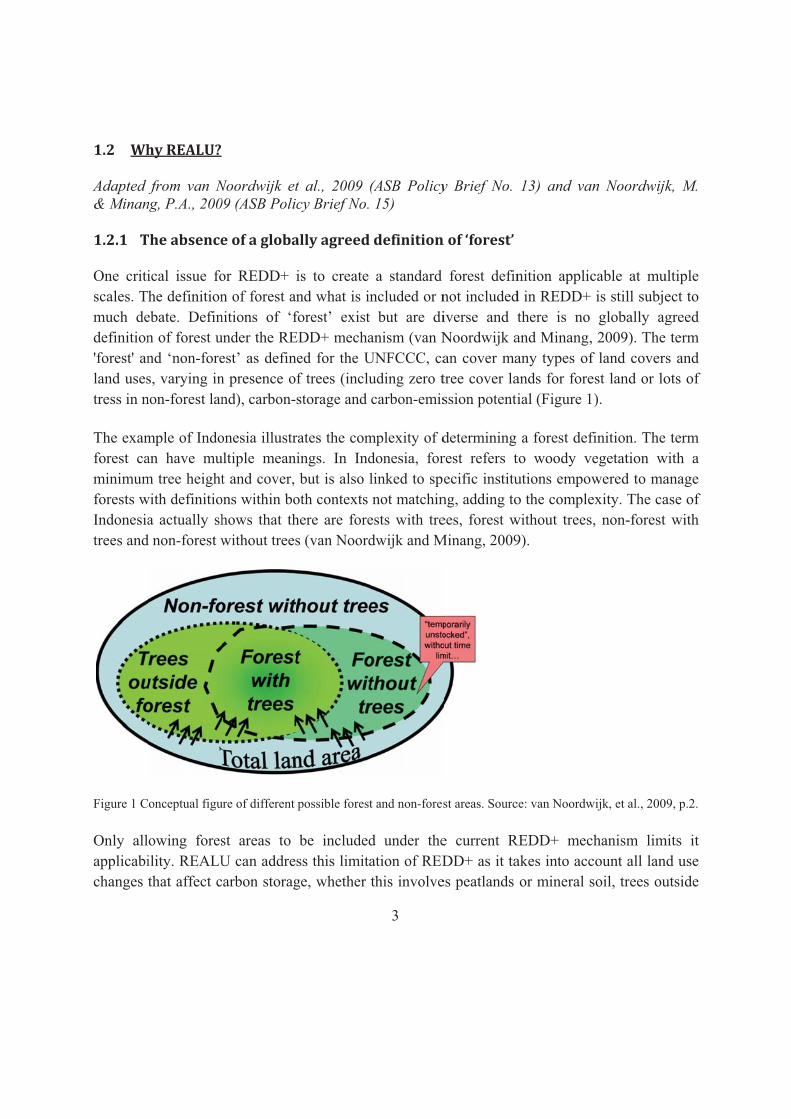
LIST�OF�FIGURES�Figure 1 Conceptual figure of different possible forest and non-forest areas. Source: van Noordwijk, et al., 2009, p.2. ........................................................................................................... 3
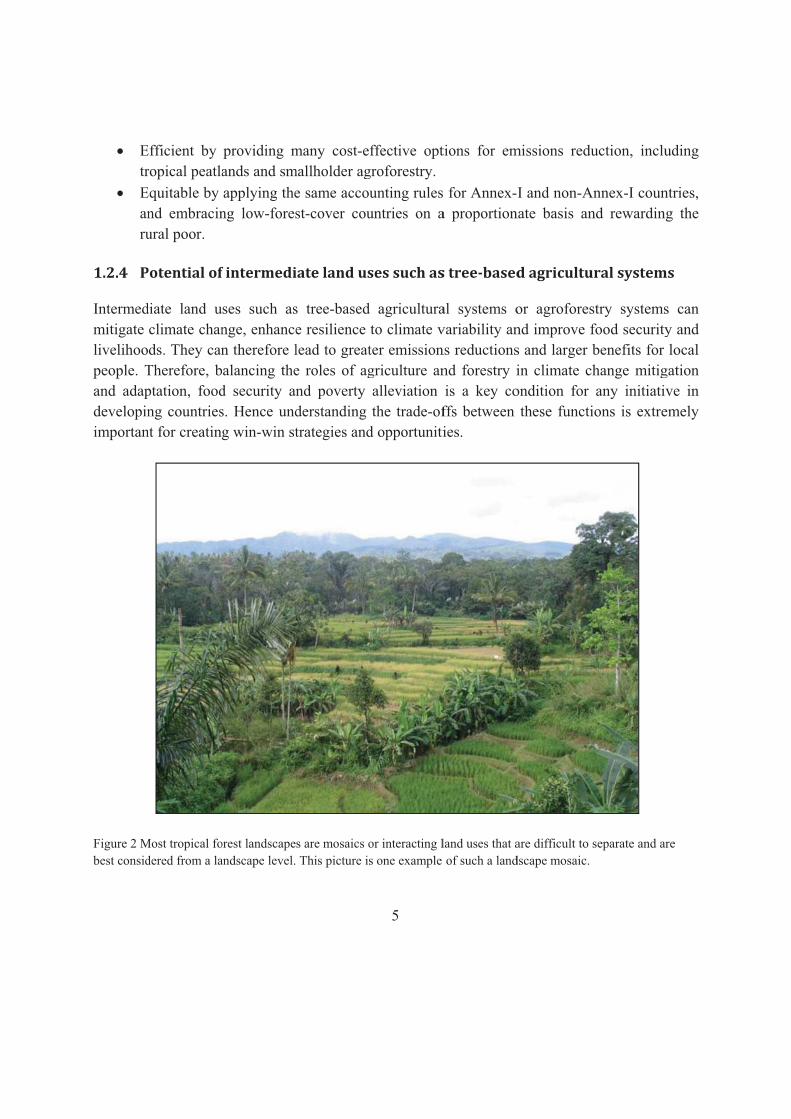
Figure 2 Most tropical forest landscapes are mosaics or interacting land uses that are difficult to separate and are best considered from a landscape level. This picture is one example of such a landscape mosaic. ........................................................................................................................... 5
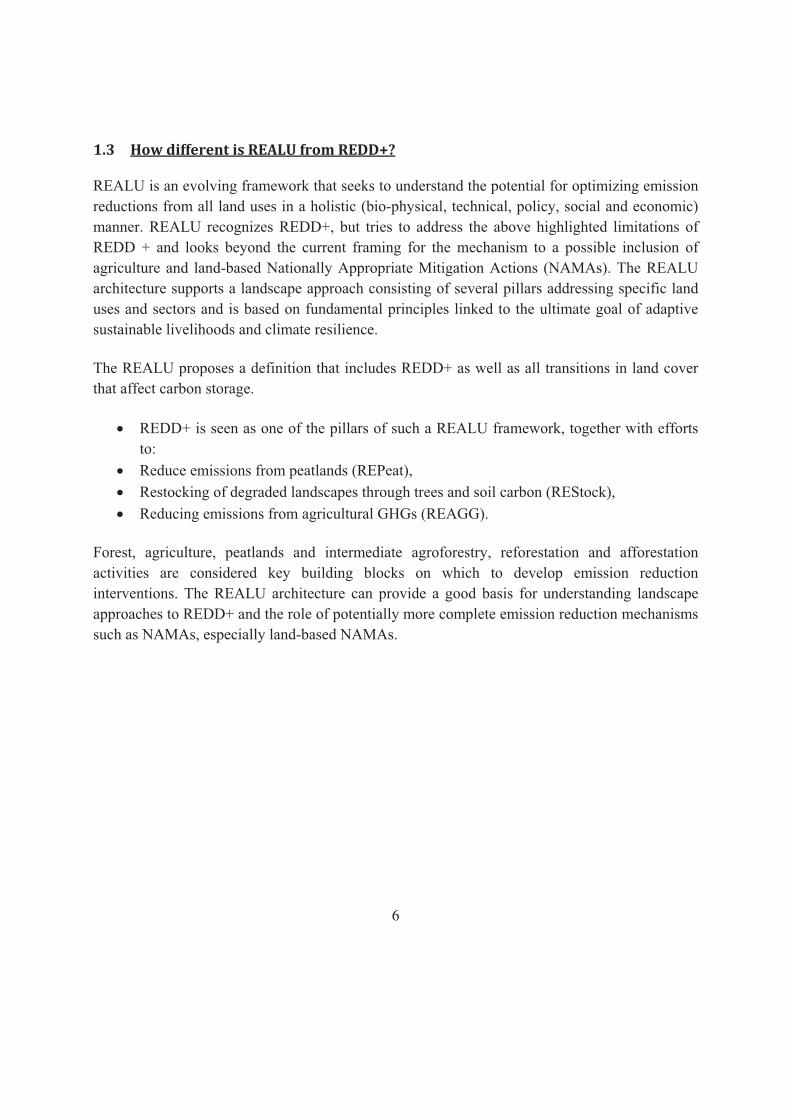
Figure 3 The four pillars above the three principles that support a landscape agenda for carbon management and emissions reduction. ........................................................................................... 7
Figure 4 Landscapes can be characterized by the interactions between six aspects (groups of key questions), which jointly describe a feedback loop where the consequences of actions lead to leverage on the drivers of change. .................................................................................................. 9
Figure 5 REALU project countries positioned along the forest/tree cover transition. Dotted lines represent possible deviations from the trend. ............................................................................... 11
Figure 6 Location of the demonstration landscapes in the four project countries. ....................... 11
Figure 7 Location of the Efoulan landscape in Cameroon. .......................................................... 12
Figure 8 Location of Tanjabar District, Jambi Province, Sumatra, Indonesia. ............................. 13
Figure 9 Location of the Padre Abad Province in Peru. ............................................................... 15
Figure 10 Location of Bac Kan Province. Left: Bac Kan Province as a part of Northeast Vietnam (source: JOFCA and JFTA, 2011); Right: Land use map of Bac Kan Province, 2010 (source: Samek, 2012, adapted from FIPI and NIAPP, 2011). ................................................................... 16
Figure 11 GHG emission potentials (in tCO2e) for the various development scenarios simulated over a 30-year period in Efoulan Municipality ............................................................................. 23
Figure 12 Forest loss in Tanjabar from 1990-2009. ..................................................................... 25
Figure 13 Opportunity cost curve for Tanjabar, 1990–2000. ....................................................... 26
Figure 14 Opportunity cost curve for Tanjabar, 2000-2005. ........................................................ 27
Figure 15 Opportunity cost curve for Tanjabar, 2005-2009. ........................................................ 27
Figure 16 Land cover output maps of the five different scenarios for Tanjabar district .............. 29
Figure 17 Impact of each scenario application relative to the BAU scenario on standing carbon stock in the landscape (106 tCO2e) and economic impact by income (USD per capita) averaged over the 30-year simulation period in Tanjabar district ................................................................ 30
Figure 18 Estimated annual emissions in 2020 under various scenarios of reference emissions levels and emission reduction strategies in Tanjabar district ........................................................ 31
Figure 19 The top five land-use change transitions in the Aguaytía study area within Padre Abad. Estimated density of canopy cover (%) of forest under each scenario is indicated. ..................... 33
viii
Figure 20 Opportunity costs of simple land use systems from a private perspective (15% discount rate) for the baseline scenario in ACATPA study site .................................................................. 34
Figure 21 NPV and carbon stocks for the varying land use types in Padre Abad. The green-arced dotted line represents a trade-off trajectory between NPV and carbon stocks for the different land use types. The red circle represents land uses with both low NPV and low carbon stocks indicating the any improvement in land use in these areas could result in win-win outcomes. ... 35
Figure 22 Projected emissions for the four scenarios over a 30-year period in ACATPA study site ................................................................................................................................................. 36
Figure 23 Sketch of the current land use portfolio of the farm and farmer’s commitment to increase carbon stock within their farm. ....................................................................................... 37
Figure 24 Emissions, sequestration and net emissions in the Bac Kan landscape from 1990 to 2010............................................................................................................................................... 38
Figure 25 Opportunity cost curve for Bac Kan, 1990–1995 demonstrating the amount of compensation needed to promote different kinds of possible land uses changes and the corresponding amount of resulting emissions. .............................................................................. 39
Figure 26 Opportunity cost curve for Bac Kan, 1995–2000. ........................................................ 40
Figure 27 Opportunity cost curve for Bac Kan, 2000–2005. ........................................................ 40
Figure 28 Opportunity cost curve for Bac Kan, 2005–2010. ........................................................ 41
Figure 29 Land cover output maps for the different scenarios in Bac Kan .................................. 42
Figure 30 Average landscape carbon stock and income per capita for land use change scenarios in Bac Kan Province compared to the BAU scenario. .................................................................. 43
Figure 31 Cumulative peat carbon losses using the ‘broken stick’ relationship between peat profile carbon stock and distance to the drainage canal. .............................................................. 50
Figure 32 REALU incentives target at shifting current unsustainable land use practices to potential carbon rich land use options. ......................................................................................... 63
Figure 33 REDD+ readiness comparison across the four project countries using the six key functions identified. Note: the maximum a country can attain on the Y-axis is 18 (six functions each with maximum score of three). ............................................................................................. 66
Figure 34 ICRAF/ASB Tools for REDD+/REALU readiness compared based upon how product oriented vs processed oriented each tool was. .............................................................................. 74
Figure 35 A land-use planning process that incorporates development plans and their consequences for ecosystem services, while internalizing the externalities (for acronym definitions, see van Noordwijk et al 2013). .................................................................................. 76
Figure 36 Typical hierarchy of needs across REALU’s countries and sites (van Noordwijk et al., 2013). ............................................................................................................................................ 81

ix
LIST�OF�TABLES�Table 1 Land use dynamics in Efoulan Municipality and the associated carbon stock changes. . 21
Table 2 Current land uses, alternative land uses and requisites for conversion. .......................... 37
Table 3 Category/nature of tools, how each category is defined and examples of tools that fall within the categories. .................................................................................................................... 75
x
LIST�OF�ACRONYMS�ACATPA Asociacion de cacaoteros tecnificados de Padre Abad AFOLU Agriculture, forestry and other land uses ASB ASB Partnership for the Tropical Forest Margins, formerly Alternatives to
Slash-and-Burn BAPENAS The National Planning Board for Development, Indonesia BAU Business as Usual BDS Benefit Distribution System CDM Clean Development Mechanism CIS Co-Investment in Landscape Stewardship CO2 Carbon Dioxide COP Conference of Parties COS Compensation for Opportunity Skipped CSR Corporate Social Responsibility DNPI National Council on Climate Change, Indonesia (Dewan Nasional Perubahan
Iklim) FALLOW Forest, Agriculture, Low-value Lands or Wasteland model FCPF Forest Carbon Partnership Facility FPF Floodplain with swampy forest, Cameroon FPG Floodplain with grass, Cameroon FPIC Free and Prior Informed Consent FRT Tributaries with swampy forest, Cameroon GDP Gross Domestic Product GHG Greenhouse Gas GIS Geographic Information Systems HKm Community-managed forests, Indonesia HLG Peat Forest (Hutan Lindung Gambut), Indonesia ICRAF The World Agroforestry Centre, formerly the International Centre for Research
in Agroforestry ISRI Indonesian Soil Research Institute KPHLG Peat Forest Protection Management Unit KPHP Production Forest Management Unit LURC Land Use Right Certificates, Vietnam
xi
LUWES Land-Use Planning for Low Emission Development Strategy MRV Monitoring, Reporting and Verification NAMAs Nationally Appropriate Mitigation Actions NGO Non-Governmental Organization NICFI Norway’s Climate and Forest Initiative NORAD Norwegian Agency for Development Cooperation NPV Net Present Value NTFP Non-Timber Forest Products PES Payments or rewards for environmental services PFES Payment for Forest Environmental Services RACSA Rapid Carbon Stock Appraisal RATA Rapid Land Tenure Claim Analysis REAGG Reducing Emissions from Agricultural Greenhouse Gasses REALU Reducing Emissions from All Land Uses REDD Reducing emissions from deforestation and forest degradation REDD+ Reducing Emissions from Deforestation and forest Degradation plus
conservation, sustainable management of forests and enhancement of carbon stocks
RELs Reference Emission Levels REPeat Reduce Emissions from Peatlands RESFA REDD+ site level feasibility appraisal Restock Restocking of degraded landscapes through trees and soil carbon RPP Readiness Preparation Plans RUPES Rewarding Upland Poor for the Environmental Services Satgas REDD National REDD Task Force, Indonesia SBSTA Subsidiary Body for Scientific and Technological Advice SECURED Landscapes
Securing Ecosystems and Carbon benefits by Unlocking Reversal of Emissions Drivers
TALaS Trade-off Analysis for Land use Scenarios tCO2e Tonnes Carbon Dioxide Equivalent UN-REDD United Nations collaborative programme on Reducing Emissions from
Deforestation and Forest Degradation in developing countries UNFCCC United Nations framework convention on climate change VER Verified Emission Reduction
xii
EXECUTIVE�SUMMARY�This report documents lessons and experiences from the Reduced Emission from All Land Use (REALU) project, implemented by the ASB Partnership for the Tropical Forest Margins (ASB) hosted by the World Agroforestry Centre (ICRAF) from 2009 – 2013 with financial support from Norway’s Climate and Forest Initiative (NICFI)/the Norwegian Agency for Development Cooperation (NORAD). The report synthesizes findings and learning from exploratory work on landscape approaches towards emission reductions, the results of which aim to support actors in Reducing Emissions from Deforestation and Forest Degradation (REDD+), agriculture and climate smart landscapes. Given that this is an action research project, this report represents work in progress as the results and outcomes of the project are still being digested and further developed in the current phase of the project titled SECURED LANDSCAPES - Securing Ecosystems and Carbon benefits by Unlocking Reversal of Emissions Drivers in Landscapes.
The�project�
The REALU project goal was to develop through action research, a set of approaches, methodologies and national capacities to implement effective landscape-based strategies for REDD+ within a context of rural sustainable development, national sovereignty, respect for indigenous rights, and the integrity of a global greenhouse gas (GHG) accounting system.
Justification for a landscape approach for reducing emissions has, from the start, been based on a number of factors namely, (a) that most drivers of deforestation originate from outside the forest sector; (b) that absence of a globally agreed upon definition of a forest was a major implementation challenge for a forest-based REDD+ mechanism; (c) that for developing countries, emission reductions from agriculture, peatland management, re-stocking of degraded lands and others could be as significant, if not greater than potential emission reductions from forests; (d) that claims of emission reduction in forests would not be credible unless a landscape accounting method was employed that could quantify leakage and demonstrate additionality; and (e) that full accounting for all land uses will embrace low forest cover countries and reward rural poor (hence more equitable).
The project was structured around four components: two of which were substantive components (namely, demonstration landscapes and comparative action research on landscape approaches to reducing emissions), one method and capacity-building component (national-level backstopping through UN-REDD and FCPF processes) and one knowledge-to-action component (enhancing
xiii
science-policy interactions). Specific attention is paid to the potential contributions of landscape approaches to REDD+, to the understanding and practice of addressing drivers of deforestation, leakage and the broader interaction of multiple-use landscapes in reducing emissions. The project phase reported herein was implemented in four countries namely, Cameroon, Indonesia, Peru and Vietnam.
Under the demonstration landscapes component, the project explored feasibility of emission reduction, using mainly a participatory scenario development approach in all four project landscapes, namely, Tanjung Jabung Barat District in Jambi Province, Indonesia; Efoulan Municipality in Southern Cameroon; Ba Be District in Bac Kan Province, Vietnam; and Padre Abad Province, in the Ucayali Region in Peru. The Land Use Planning for Low Emissions Development Strategy (LUWES) methodology, which enables the development of baselines, estimation of potential emission reductions and planning of emission reduction schemes, was applied and tested in these landscapes. From the emission reduction potentials identified in the aforementioned processes, and the feasibility assessments (economic and institutional), incentive schemes for REDD+ and sustainable benefits were identified and developed for piloting in each of the landscapes (all of which are at various stages of development and implementation).
These incentive schemes include:
REDD+ through conservation of forest carbon stocks:
1 Co-management in peat protection forest areas with local communities through appropriate community forestry schemes in Tanjung Jabung Barat, Indonesia
2 Communal (council forests) in Efoulan Municipality, Southern Cameroon
REDD+ through agroforestry-based intensification:
1 Tree-based intensification of maize production in Ba Be District, Bac Kan Province, Vietnam 2 Cocoa intensification through tree improvement and domestication in Efoulan, Cameroon 3 Potential of Jelutong (Dyera lowrii) for agroforestry and trade in Tanjung Jabung Barat,
Indonesia 4 Improving carbon stock within land use units (including cocoa, pastures and forests) in Padre
Abad Province, Ucayali, Peru
The objective of this comparative action research was to study the enabling conditions for emission reductions at the landscape scale as determined by factors beyond the operational scale. REDD+ was chosen as a focus given that it is the only land-based mechanism for which rules are
xiv
being developed with corresponding efforts to build policy, institutional and technical capacities. A REDD+ readiness assessment framework was developed and applied to all four project countries. Some effort has also been put into the analysis of drivers of deforestation at national levels, especially focusing on the extent that these drivers impact and or could potentially impact the projects’ landscapes.
The methods and capacity-building component focused on methodology development and refinement and its use in supporting national and sub-national REDD+ readiness processes in project countries through training and application. In the first instance the project focused on updating, training and application of a methodology for REDD+ opportunity cost analysis at the national level (training) and application at landscape levels, with over 250 people trained worldwide. More than fifteen trainings have been conducted in the use of the LUWES methodology, carbon measurement tools and land tenure analysis in various countries at the request of governments and other REDD+ actors. There has also been extensive engagement and contribution to Readiness Preparation Plans (RPP) and Monitoring, Reporting and Verification (MRV) development processes at the national level.
Eventually, the knowledge to action component entailed bringing the results and experiences of the project into the policy and science arena as well as to communities. This involved presenting results at national workshops, symposia at important REDD+ and climate conferences and United Nations Framework Convention on Climate Change (UNFCCC) and other policy forums.
Pathways�to�impact�
The REALU project has initiated potentially high impact processes in policy and decision-making at sub-national and national levels. Firstly, by generating methods on land use planning and opportunity costs for emission reductions and sustainable benefits analysis and training widely on them; reaching more than 250 middle level government and non-government officials in project countries and beyond. While the governments in Peru and Cameroon have shown interest in taking these forward, the government in Indonesia, BAPENAS (the National Planning Board for Development) has recommended the use of the LUWES tool for local governments to plan their actions to reduce GHG for entire provinces in Indonesia. A total of 33 provinces used the tool, enabling each province to estimate their contribution in achieving Indonesia’s national goals, to unilaterally reduce GHG emissions by as much as 26% below 2020 projections in addition to a 15% reduction with multilateral support. Decisions relating to how the national emission reduction targets are shared can thus be supported by these tools in these countries.
xv
Secondly, by developing a readiness assessment framework and applying it to all four project countries, it is hoped that it will contribute to a solid basis for adaptive management in the readiness processes. Thirdly, the hope is efforts to understand drivers of deforestation in terms of leverage points and levers for unlocking and reversing drivers of deforestation and degradation, initiated in this project, will become mainstream, thus supporting both policy and decision-making in the medium term. Lastly, by working with actors to design and test diverse (financial and non-financial) emission reduction incentives at the landscape level, the aim is to contribute to potential scaling-up of efforts in the project countries and beyond.
Summary�of�lessons�and�recommendations�
A number of key lessons have been gained thus far from the exploratory journey into landscapes for emission reduction in the four countries presented below each with corresponding recommendations.
Lesson 1: Incentives targeting non-forest high carbon stock land uses such as agroforestry, tree-based systems and peatlands were found to be attractive, potentially effective and efficient options for achieving REDD+, global climate change objectives and promoting sustainable livelihoods:
Recommendation 1: Further linkage of REDD+ discussions in the international arena with the emerging Nationally Appropriate Mitigation Actions (NAMAs) framing is needed to create rules and incentives for landscape approaches and investments.
Lesson 2: Success in emissions reduction initiatives will need entry points beyond a sole emissions reduction focus given that carbon and its associated finance is unlikely to be a priority concern for local stakeholders:
Recommendation 2: Emissions reduction planning and implementation needs to be integrated into the wider development aspirations of stakeholders if it is to succeed.
Recommendations 3: Landscape approaches would benefit from greater effectiveness and efficiency when synergy is sought between emission reductions and other environmental, social and economic objectives including climate change adaptation and green economy approaches.
xvi
Lesson 3: A co-investment approach is emerging as a necessary condition for achieving multiple landscape-level objectives:
Recommendation 4: Key frameworks and models should be developed to enable better private sector involvement (financing and sharing of technical expertise) in emission reductions and sustainable development schemes at the landscape level. This could allow and involve innovative financial mechanisms for public and private investments. Such a mechanism could allow integration and optimization between currently separated mitigation and adaptation funding streams for example.
Lesson 4: Landscape and jurisdictional approaches to emissions reduction can be complementary:
Recommendation 5: Better research is required to understand and identify potential options for landscapes and jurisdictional interactions under different political economy contexts.
Recommendation 6: REDD+ readiness (and indeed future climate change readiness –NAMA, climate smart agriculture and others) needs to invest more in sub-national level REDD+ designs in order to enable landscape approaches for emissions reduction to thrive. Current readiness focuses more on international accountability structures and national levels, which does not automatically translate to a nested-systems architecture required to address drivers of deforestation at the landscape level.
Lesson 5: Nesting landscapes to the national level is a necessary condition for success and scaling-up
Recommendation 7: Rules and guidance for nesting landscapes to the national level are needed. These could include specifying among others issues related to ownership rights to carbon, duties and royalties to be paid on investments, crediting, distribution of national emission targets, benefit sharing, risk management, MRV and baselines.
Lesson 6: Identifying and understanding leverage points and potential levers of emissions beyond landscape boundaries is necessary to address drivers effectively.
Recommendation 8: The design and use of approaches that aim at identifying leverage points and levers for addressing drivers, as opposed to the current identification of land uses responsible for most conversions and a description of the processes, is needed.

xvii
Beyond this, leverage points, the potential effects of various levers and the chain of reactions that these levers can have in the reversal of drivers of emissions need to be identified and analysed.
Next�steps�
A new phase of this project is underway spanning from July 2013 to December 2015. This phase is titled SECURED LANDSCAPES - Securing Ecosystems and Carbon benefits by Unlocking Reversal of Emissions Drivers in Landscapes. It will build on the lessons and experiences highlighted above focusing on (i) piloting incentives in five demonstration landscapes in five countries (Cameroon, Democratic Republic of Congo, Indonesia, Peru and Vietnam); (ii) exploring landscape investment and private sector engagement options; (iii) developing frameworks for strategic and tactical nesting of landscapes to national level REDD+ and other relevant activities; and (iv) development of globally relevant methods, policy and investment guidance for decision-making and negotiations in sustainable landscapes.
xviii
LIST�OF�PUBLICATIONS�This list showcases the publications produced during the REALU project (2010-2013). They are all available from ASB’s searchable online publications database.
Journal�articles�
1. Crossman, N.D.; Bryan, B.A.; de Groot, R.S.; Yu-Pin; Minang, P.A. 2013. Land science contributions to ecosystem services Human settlements and industrial systems
2. Danielsen, F., T. Adrian, S. Brofeldt, M. van Noordwijk, M. K. Poulsen, S. Rahayu, E. Rutishauser, I. Theilade, A. Widayati, N. The An, T. Nguyen Bang, A. Budiman, M. Enghoff, A. E. Jensen, Y. Kurniawan, Q. Li, Z. Mingxu, D. Schmidt-Vogt, S. Prixa, V. Thoumtone, Z. Warta, and N. Burgess. 2013. Community monitoring for REDD+: international promises and field realities. Ecology and Society 18(3): 41.
3. Galudra G, van Noordwijk M, Agung P, Suyanto S, Pradhan U. 2013. Migrants, land markets and carbon emissions in Jambi, Indonesia: land tenure change and the prospect of emission reduction. Mitigation and Adaptation Strategies for Global Change.
4. Lusiana B, van Noordwijk M, Johana F, Galudra G, Suyanto S, Cadisch G, 2013. Implication of uncertainty and scale in carbon emission estimates on locally appropriate designs to reduce emissions from deforestation and degradation (REDD+). Mitigation and Adaptation Strategies for Global Change
5. Tata, H.L., van Noordwijk, M., Ruysschaert, D., Mulia, R., Rahayu, S., Mulyoutami, E., Widayati, A., Ekadinata, A., Zen, R., Dorsayo, A., Oktaviani, R., and Dewi, S., 2013. Will REDD+ funding to Reduce Emissions from Deforestation and (forest) Degradation stop peat swamp conversion to oil palm in orangutan habitat in Tripa (Aceh, Sumatra, Indonesia)? Mitigation and Adaptation Strategies for Global Change
6. Villamor GB, Desrianti F, Akiefnawati R, Amaruzaman S, van Noordwijk M, 2013. Gender influences decisions to change land use practices in the tropical forest margins of Jambi, Indonesia. Mitig Adapt Strateg Glob Change
7. Villamor GB, Pontius RG, van Noordwijk M, 2013. Agroforest’s growing role in reducing carbon losses from Jambi (Sumatra), Indonesia. Reg Environ Change
8. Mbow C, Smith P, Skole D, Lalisa Duguma L A., Mercedes Bustamante M. Achieving mitigation and adaptation to climate change through sustainable agroforestry practices in Africa. Current Opinion in Environmental Sustainability 2014 6 (8-14)
xix
9. Mbow, C, Neufeldt H, van Noordwijk M, Minang, PA, Kowero G, Luedeling E. Agroforestry solutions to address climate change and food security challenges in Africa. Current Opinion in Environmental Sustainability 2014
10. Minang PA, Duguma LA, Bernard F, Mertz O, van Noordwijk M. 2013. Prospects for Agroforestry in REDD+ landscapes in Africa. Current Opinion in Environmental Sustainability 2014, 6: DOI 10.1016/j.cosust.2013.10.015.
11. Harvey, C.A., M. Chacon, C. Donatti, E, Garen, L. Hannah, A. Andrade, L. Bede, D. Brown, A. Calle, J. Chara, C. Celment, E. Gray, M.H. Hoang, P. A. Minang, A.M. Rodriguez, C. Seeberg-Elverfeldt, B. Semroc, S. Shames, S. Smuckler, E. Somarriba, E. Torquebiau, J. van Etten and E. Wollenberg. 2013. Climate-smart landscapes: Opportunities and challenges for integrating adaptation and mitigation in tropical agricultural landscapes. Conservation Letters DOI: 10.1111/conl.12066
12. van Noordwijk, M.; Agus, F.; Dewi, S.; Purnomo, H. 2013. Reducing emissions from land use in Indonesia: motivation, policy instruments and expected funding streams. Mitigation and Adaptation Strategies for Global Change DOI 10.1007/s11027-013-9502-y
13. Mulia R., Widayati A., Agung P., Suyanto S. and Zulkarnain MT. 2013. Low carbon emission development strategies for Jambi, Indonesia: simulation and trade-off analysis using the FALLOW model, Mitigation and Adaptation Strategies for Global Change (DOI 10.1007/s11027-013-9485-8)
14. Dewi, S., van Noordwijk, M., Ekadinata, A., Jean-Laurent, P. 2013. Protected areas within multifunctional landscapes: Squeezing out intermediate land use intensities in the tropics? Land Use Policy, Volume 30, Issue 1, January 2013, Pages 38–56
15. Hoang, M. H., Do, T. H., Pham, M.T., van Noordwijk, M., & Minang, P. A. 2013. Benefit distribution across scales to reduce emissions from deforestation and forest degradation (REDD+) in Vietnam. Land Use Policy, 31, 48-60. doi:10.1016/j.landusepol.2011.09.013
16. Minang PA, van Noordwijk M. 2013. Design challenges for Reduced Emissions from Deforestation and forest Degradation through conservation: Leveraging multiple paradigms at the tropical forest margins. Land Use Policy
17. Mertz O, Muller D, Sikor T, Hett C, Heinimann A, Castella J, Lestrelin G, Ryan CM, Reay DS, Schmidt-Vogt D, Danielsen F, Theilade I, van Noordwijk M, Verchot LV, Burgess ND, Berry NJ, Pham TT, Messerli P, Xu JC, Fensholt R, Hostert P. Pflugmacher D, Bruun TB, Neergaard A, Dons K, Dewi S, Rutishauer E, Sun ZL. 2012.
xx
The forgotten D: challenges of addressing forest degradation in complex mosaic landscapes under REDD+. Danish Journal of Geography
18. Sofiyuddin M., Rahmanulloh A., and Suyanto S. 2012. Assessment of Profitability of Land Use Systems in Tanjung Jabung Barat District, Jambi Province, Indonesia. Open Journal of Forestry
19. Robiglio, V.; Lescuyer, G.; Cerutti, P. 2012. From Farmers to Loggers: The Role of Shifting Cultivation Landscapes in Timber Production in Cameroon. Small-scale Forestry
20. Rodel D. Lasco, Rizza Karen A. Veridiano, Marie Habito, Florencia B. Pulhin. 2012. Reducing emissions from deforestation and forest degradation plus (REDD+) in the Philippines: will it make a difference in financing forest development? Mitigation and Adaptation Strategies for Global Change
21. van Noordwijk M, Leimona B, Jindal R, Villamor G B, Vardhan M, Namirembe S, Catacutan D, Kerr J, Minang PA, Tomich TP, 2012. Payments for Environmental Services: evolution towards efficient and fair incentives for multifunctional landscapes. Annu. Rev. Environ. Resour. 37, 389-420
22. Galudra, G., van Noordwijk, M., Suyanto, Sardi, I., Pradhan, U., and Catacutan, D. 2011. Hot Spots of Confusion: Contested Policies and Competing Carbon Claims in the Peatlands of Central Kalimantan (Indonesia). International Forestry Review 13: 431-441
23. Lasco, R., Pulhin, F., Bugayong, L., Mendoza, M. 2011. An Assessment of Potential Benefits to Smallholders of REDD+ Components in the Philippines. Annals of Tropical Research, 33(1): 31–48 (2011)
24. Robiglio, V.; Sinclair, F. 2011. Maintaining the Conservation Value of Shifting Cultivation Landscapes Requires Spatially Explicit Interventions. Environmental Management August 2011, Volume 48, Issue 2, pp 289-306
25. Villamor, G.; van Noordwijk, M. 2011. Social Role-Play Games Vs Individual Perceptions of Conservation and PES Agreements for Maintaining Rubber Agroforests in Jambi (Sumatra), Indonesia. Ecology and Society
26. Gockowski, J.; Sonwa, D. 2011. Cocoa Intensification Scenarios and Their Predicted Impact on CO2 Emissions, Biodiversity Conservation, and Rural Livelihoods in the Guinea Rain Forest of West Africa. Environmental Management. August 2011, Volume 48, Issue 2, pp 307-321
xxi
27. Cerbu, G.A.; Swallow, B.M.; Thompson, D.Y. 2010. Locating REDD: A global survey and analysis of REDD readiness and demonstration activities. Environmental Science and Policy
28. Akiefnawati, R.; Villamor, G.B.; Zulfikar, F.; Budisetiawan, I.; Mulyoutami, E.; Ayat, A.; van Noordwijk, M. 2010. Stewardship Agreement to Reduce Emissions from Deforestation and Degradation (REDD): Case Study from Lubuk Beringin’s Hutan Desa, Jambi Province, Sumatra, Indonesia. International Forestry Review.
29. Rodel, Lasco. D.; Remedios, Evangelista. S.; Florencia, Pulhin. B. 2010. Potential of Community-Based Forest Management to Mitigate Climate Change in the Philippines. Small-scale Forestry. December 2010, Volume 9, Issue 4, pp 429-443
Book�chapters�
30. Agus, F., Gunarso, P, Sahardjo, B.H., Harris, N., van Noordwijk, M. & Killeen, T.J. 2013, Historical CO2 emissions from land use and land cover change from the oil palm industry in Indonesia, Malaysia and Papua New Guinea. In: T.J. Killeen & J. Goon (eds.) Reports from the Technical Panels of the Second Greenhouse Gas Working Group of the Roundtable for Sustainable Palm Oil (RSPO); RSPO, Kuala Lumpur. pp 65-88. http://www.rspo.org/file/GHGWG2/5_historical_CO2_emissions_Agus_et_al.pdf
31. Agus, F., Henson, I.E., Sahardjo, B.H., Harris, N., van Noordwijk, M. & Killeen, T.J., 2013. Review of emission factors for assessment of CO2 emission from land use change to oil palm in Southeast Asia. In: T.J. Killeen & J. Goon (eds.) Reports from the Technical Panels of the Second Greenhouse Gas Working Group of the Roundtable for Sustainable Palm Oil (RSPO); RSPO, Kuala Lumpur. pp 7-27. http://www.rspo.org/file/GHGWG2/3_review_of_emission_factors_Agus_et_al.pdf
32. Gupta, J., Mathews, R., Minang, P., van Noordwijk, M., Kuik, O. and van der Gijp, N., 2013. Climate change and forests: from the Noordwijk Declaration to REDD. In: J.Gupta, N. van der Grijp and O. Kuik (Eds.) Climate Change, Forests and REDD: Lessons for Institutional Design. pp 1-24, Routledge, London
33. Minang PA, van Noordwijk M and Swallow BM, 2012. High-Carbon-Stock Rural Development Pathways in Asia and Africa: Improved Land Management for Climate Change Mitigation. In: Agroforestry: The Future of Global Land Use. Nair PKR and Garrity DP (eds.), Springer, The Netherlands pp 127-143
34. van Noordwijk M, Tata H L, Xu J, Dewi S and Minang P, 2012. Segregate or integrate for multifunctionality and sustained change through rubber-based agroforestry in Indonesia
xxii
and China. In: Agroforestry: The Future of Global Land Use. Nair PKR and Garrity DP (eds.), Springer, The Netherlands pp 69-104
35. van Noordwijk M, Hoang MH, Neufeldt H, Öborn I, Yatich T, eds. 2011. How trees and people can co-adapt to climate change: reducing vulnerability through multifunctional agroforestry landscapes. Nairobi: World Agroforestry Centre (ICRAF).
36. Minang PA, van Noordwijk M, and Gockowski J. 2011. Carbon trade-offs along tropical forest margins: Lessons from ASB work in Cameroon. In Climate Change Mitigation and Agriculture. Wollenberg E, et al, (eds.) Earthscan.
Conference�papers�
37. Khususiyah N., Suyanto S. and Janudianto. 2013. Migrants, livelihoods and equity: Understanding for Emissions Reduction in Jambi, Indonesia. IUFRO-2013, Fukuoka, Japan
38. Agung P., Galudra G., Soedomo S. and Nugroho B. 2013. How tenure insecurity formulates land market institutions in the limited production forest area in Tanjung Jabung Barat district, Jambi province, Indonesia. IUFRO-2013, Fukuoka, Japan
39. Zulkarnain MT, Ekadinata A. and Widayati A. 2013. Land Cover Mapping of Tanjung Jabung Barat, Jambi Using Landsat - Alos Palsar Data Fusion and Object Based Hierarchical Classification, Asian Conference of Remote Sensing, Bali, Indonesia
40. Sausman, C., Garci,M., Fearne, A., Donovan, J. and Silvia, C. 2013. Creating social capital from the outside: Insights from a cacao global value chain in Peru” accepted in: The European Association of Agricultural Economists (EAAE) conference of 2013. Paper prepared for the 138th EAAE Seminar on Pro-poor Innovations in Food Supply Chains, Ghent Belgium September 11-3, 2013
Policy�briefs�
41. Agung, P., Dewi, S., Johana, F., Ekadinata, A. Submitted Land-use planning for low-emission development strategies (LUWES). ASB Policy Brief 35
42. Yemefack, M., Alemagi, D., Duguma, L.A., Minang, P.A., Tchoundjeu, Z. 2013. Linking development pathways and emission reduction at local levels: An analysis of feasibility in the Efoulan municipality, Cameroon. ASB Policybrief. ASB Partnership for the Tropical Forest Margins, Nairobi, Kenya.
xxiii
43. van Noordwijk M, Agus F, Dewi S, Purnomo H, Lusiana B, Villamor GB. 2013. Reducing emissions from all land uses in Indonesia: motivation, expected funding streams and multi-scale policy instruments. .ASB Policybrief No. 34. ASB Partnership for the Tropical Forest Margins, Nairobi, Kenya.
44. Ekadinata S, van Noordwijk M, Budidarsono S, Dewi S. 2013. Hot spots in Riau, haze in Singapore: the June 2013 event analyzed. ASB Policy Brief No. 33. ASB Partnership for the Tropical Forest Margins, Nairobi, Kenya.
45. Minang, P.A.; van Noordwijk, M.; Kahurani, E.; Bernard, F. 2012 REDD+ Through Conservation Landscapes: Opportunities and Challenges. ASB Policy Brief No. 29, ASB Partnership for the Tropical Forest Margins, Nairobi, Kenya.
46. Eastman, D. 2012. Implications for a REDD+ Benefit Distribution System in Viet Nam. Benefit Distribution System in Viet Nam. ASB Policy Brief No. 28, ASB Partnership for the Tropical Forest Margins, Nairobi, Kenya.
47. Alemagi, D.; Duguma, L.; Minang, P.A.; Tchoundjeu, Z. 2012 Incentives for Reducing Carbon Emission From Illegal Logging in Cameroon. ASB Policy Brief No. 30, ASB Partnership for the Tropical Forest Margins, Nairobi, Kenya.
48. Do, T.H.; Catacutan, D.; Vu, T.H.; Lai, T.Q. 2012 Will Current Forest Land Tenure Impede REDD+ Efforts in Viet Nam? ASB Policy Brief No. 27, ASB Partnership for the Tropical Forest Margins, Nairobi, Kenya.
49. Widayati A, Johana F, Zulkarnain MT and Mulyoutami E. 2012. Perubahan Penggunaan Lahan, Faktor Pemicu dan Pengaruhnya terhadap Emisi CO2 di Kabupaten Tanjung Jabung Barat (Tanjabar), Propinsi Jambi (Land Use Changes, Driving Factors and the Consequences on CO2 Emissions in Tanjung Jabung Barat, Jambi). Brief No 21. Bogor, Indonesia. World Agroforestry Centre - ICRAF, SEA Regional Office. 4p.
50. Khususiyah N, Sofiyuddin M and Suyanto S. 2012. Strategi Sumber Penghidupan Petani di Tanjung Jabung Barat (Local Livelihood Strategies in Tanjung Jabung Barat). Brief No 22. Bogor, Indonesia. World Agroforestry Centre - ICRAF, SEA Regional Office. 4p.
51. Sofiyuddin M, Janudianto and Perdana A. 2012. Potensi Pengembangan dan Pemasaran Jelutung di Tanjung Jabung Barat (Development and Mareket Potentials of Jelutung in Tanjung Jabung Barat). Brief No 23. Bogor, Indonesia. World Agroforestry Centre - ICRAF, SEA Regional Office. 4p.
52. Agung P, Novia CY, Jasnari and Galudra G. 2012. Menuju Pengelolaan Hutan Lindung Gambut Lestari di Tanjung Jabung Barat (Towards Sustainable Management of Peat
xxiv
Protection Forest in Tanjung Jabung Barat). Brief No 24. Bogor, Indonesia. World Agroforestry Centre - ICRAF, SEA Regional Office. 4p.
53. Tata HL, van Noordwijk M, Mulyoutami E and Widayati A. 2012. Economics versus conservation: a case study of Tripa peatland. Brief no. 34, Tripa series. Bogor, Indonesia. World Agroforestry Centre (ICRAF) Southeast Asia Regional Program. 4 p.
54. Ekadinata, A., Agung, P. 2011. Planning for low emissions development in Tanjung Jabung Barat district, Jambi province, Indonesia. Brief No. 20. Bogor, Indonesia. World Agroforestry Center (ICRAF), SEA Regional Office. 6 p.
55. Robiglio, V.; Minang, P.A.; Asare, R. 2011 On-farm timber production for emission reduction with sustainable benefits at the tropical forest margins. ASB Policy brief 23. ASB Partnership for the Tropical Forest Margins, Nairobi, Kenya.
56. Santos-Martin, F.; Bertomeu, M.; van Noordwijk, M.; Navarro, R. 2011. Why smallholders plant native timber trees away from the forest margin: Lessons from Leyte, the Philippines. ASB Policy brief 24. ASB Partnership for the Tropical Forest Margins, Nairobi, Kenya.
57. Scherr, S.J.; Shames, S.; Wallace, C.; Hatcher, J.; White, A.; Minang, P. 2011 Making REAL(U) Right: Harmonizing Agriculture, Forests and Rights in the Design of REDD+
58. Tata, H.L.; Widayati, A.; Mulyoutami, E.; van Noordwijk, M. 2011. Co-existence of people and orangutan in Sumatra - Stabilizing gradients for landscape multifunctionality. ASB Policy Brief No. 20, ASB Partnership for the Tropical Forest Margins, Nairobi, Kenya.
59. van Noordwijk, M.; Catacutan, D.; Clark, W.C. 2011. Linking Scientific Knowledge with Policy Action in Natural Resource Management. ASB Policy Brief No. 19, ASB Partnership for the Tropical Forest Margins, Nairobi, Kenya.
60. Janudianto.; Mulyoutami, E.; Joshi, L.; Wardell, D.A.; van Noordwijk, M. 2011 Recognizing traditional tree tenure as part of conservation and REDD+ strategy. ASB Policy brief 22. ASB Partnership for the Tropical Forest Margins, Nairobi, Kenya.
61. Meyfroidt, P.; van Noordwijk, M.; Minang, P.A.; Dewi, S.; Lambin, E.F. 2011. Drivers and consequences of tropical forest transitions: options to bypass land degradation? ASB Policy brief 25. ASB Partnership for the Tropical Forest Margins, Nairobi, Kenya.
62. Minang PA, Bernard F, van Noordwijk M, Kahurani E. 2011. Agroforestry in REDD+: Opportunities and Challenges. ASB Policy Brief No. 26, ASB Partnership for the Tropical Forest Margins, Nairobi, Kenya
xxv
63. Ekadinata, A.; van Noordwijk, M.; Dewi, S.; Minang, P.A. 2010. Reducing emissions from deforestation, inside and outside the ‘forest’. ASB Policy Brief No. 16, ASB Partnership for the Tropical Forest Margins, Nairobi, Kenya
64. Galudra, G.; van Noordwijk, M.; Suyanto, S.; Pradhan, U. 2010. Hot Spots of Confusion: Contested Policies and Competing Carbon Claims in the Peatlands of Central Kalimantan, Indonesia. ASB Policy brief 21. ASB Partnership for the Tropical Forest Margins, Nairobi, Kenya.
65. Akiefnawati R, Villamor GB, Ayat A, Galudra G, van Noordwijk M. 2010. Stewardship agreement to reduce emissions from deforestation and degradation (REDD) in Indonesia. ASB Policy brief 18, ASB Partnership for the Tropical Forest Margins, Nairobi, Kenya.
66. Minang P A, van Noordwijk M, Meyfroidt P, Agus F, Dewi S. 2010. Emissions Embodied in Trade (EET) and Land use in Tropical Forest Margins. ASB Policy Brief 17, ASB Partnership for the Tropical Forest Margins, Nairobi, Kenya.
67. van Noordwijk, M.; Minang, P.A.; Dewi, S.; Hall, J.; Rantala, S. 2009. Reducing Emissions from All Land Uses: The case for a whole landscape approach. ASB Policy Brief No. 13, ASB Partnership for the Tropical Forest Margins, Nairobi, Kenya
68. van Noordwijk, M.; Minang, P.A. 2009. Forest definitions and REDD. ASB Policy Brief No. 15, ASB Partnership for the Tropical Forest Margins, Nairobi, Kenya
69. Velarde, S.; van Noordwijk, M.; Suyanto, S. 2009. Perceptions on Fairness and Efficiency of the REDD Value Chain: Methods and Results from Pilot Analyses in Indonesia and Peru. ASB Policy Brief No. 14, ASB Partnership for the Tropical Forest Margins, Nairobi, Kenya
Reports��
Global�reports�
70. Bernard, F., Minang, P., Kasyoki, J. 2012. REALU Global Methodology and Training Workshop. Bogor – Indonesia, 16 – 19th January 2012. ASB Partnership, Nairobi, Kenya.
71. Bernard, F., Minang, PA., van Noordwijk, M. 2011. Review of current tools and methods for REDD+ and REALU value chain. ASB Partnership, Nairobi, Kenya.
REALU/REDD+�feasibility�plans�in�the�four�countries��
72. Do Trong Hoan, Rohit Jindal, Hoang Minh Ha, and Delia Catacutan.2012. Feasibility notes for reducing emissions from all land uses in Bac Kan province, Vietnam. Contributors:
xxvi
Dam Viet Bac, Alba Saray Pérez Terán, Rachmat Mulia, and Peter Minang. World Agroforestry Centre – ICRAF Vietnam, Hanoi.
73. Robiglio, V., Silva, C., White, D., Hyman, G., Donovan, J., Cornelius, J. 2012. An Assessment of REALU Feasibility in smallholder colonist farmers context in PADRE ABAD (Ucayali-Peru). World Agroforestry Centre – ICRAF Peru, Lima.
74. Atiek Widayati, Suyanto and Meine van Noordwijk. 2011. Towards Reduced Emissions in a High-Stake District. REALU Project Design for Tanjung Jabung Barat (Tanjabar), Jambi, Indonesia. (Version 1.0). World Agroforestry Centre – ICRAF Indonesia, Bogor.
75. Yemefack, M. (eds)l. 2013. REALU Feasibility Study Document For Emission Reduction for the Efoulan Council, South Region, Cameroon
76. White, D. et al. 2012. Is Reducing Emissions from All Land Uses Worthwhile in Ucayali, Peru? An Assessment of REALU Feasibility. Contributing Scientists and Policymakers: Douglas White, Glenn Hyman, Marcos Tito, Elena Mejía, Efraín Leguía, Julio Ugarte, Claudia Silva, Patricia Seijas, Diego Garcia, Jorge Vela, Mirela Clavo, Ymber Flores, Johannes Dietz, Konstantin Konig, Jason Donovan, Roberto Porro, Jonathan Cornelius
Incentive�reports�
77. Alemagi, D., Feudjio, M. 2013. Incentives for intensification of cocoa agroforestry systems in the Efoulan municipality of Cameroon. Alternative to Slash and Burn (ASB) Final country report for Cameroon. ASB Partnership for the Tropical Forest Margins, Nairobi, Kenya
78. Do, T.H., Catacutan, D., Eastman, D., Guarnaschelli, S., Dam, V.B., and Hoang, V.G. 2013. A pilot incentive scheme for reducing emissions from all land uses in Bac Kan landscape. Hanoi: World Agroforestry Centre (ICRAF), Hanoi, Vietnam. 26 p
79. Feudjio, M., Magne, A.N., Alemagi, D., Robiglio, V., Ewane, N., Yemefack, M., Asaah, E., Tchienkoua, M. 2012. Incentives measures for the REED+ mechanism and sustainable development in the Efoulan Municipality of the South Region of Cameroon. Alternative to Slash and Burn (ASB) Technical Report. ASB Partnership for the Tropical Forest Margins, Nairobi, Kenya.
80. Hoang, M.H, and Do.T.H. 2011. Assessing potential and designing of mechanisms of Payment for Environmental Services in Bac Kan. World Agroforestry Centre – ICRAF Vietnam, November 2011.
xxvii
81. Silva, C., Robiglio, V., Donovan, J., Paino, B. 2013. Incentives for carbon stock enhancements , a study of cocoa producers and cooperatives in Padre Abad, Peru: World Agroforestry Centre (ICRAF), Lima, Peru.
82. Climate Adapt, 2013. Comparative analysis of standards for the carbon market: Assessment of options for smallholders farmers to access carbon finance in the Ucayali region based on different land use interventions and project activities. Reviewed by Claudia Silva, ICRAF.
83. ICRAF Indonesia, 2013. Incentive Mechanism in Peat Protection Forest Management Unit (KPHLG) in Tanjabar through Formalization of Community-Managed Forest and Strengthening Dyera polyphylla (Jelutong) Value Chain
Country�substantive�reports�
84. Substantive Report of REALU II- Indonesia. Version 1.0. 2013. Edited by: Atiek Widayati and Suyanto. World Agroforestry Centre – ICRAF Southeast Asia. Indonesia, Bogor – August 2013
85. Do Trong Hoan, Rohit Jindal, Rachmat Mulia, Hoang Minh Ha, and Delia Catacutan. 2013. REALU Country Report – Vietnam
86. Alemagi, D., Yemefack, M., Feudjio, M., Ewane, N., Magne, N., Tchienkoua, M. Reducing emissions from all land uses. Substantive report for Cameroon.
Training�needs�and�training�workshops�
87. Jindal, R. 2011. Report of training needs assessment for REALU in Bac Kan province. World Agroforestry Centre – ICRAF Vietnam, May 2011.
88. Mejía, E. 2011. Assessing the State of Governance for REDD / REALU in Peru. World Agroforestry Centre – ICRAF Peru, July 2011.
89. Mejía, E. 2011. Development and transfer of knowledge on REDD in Peru: What has been done? What does it take? World Agroforestry Centre – ICRAF Peru, July 2011.
90. Ngendakumana, S., Feudjio, M. 2011. Training needs assessment for REDD+ and REALU methods in Cameroon. World Agroforestry Centre – ICRAF Cameroon, July 2011.Sausman, C., Garci, M., Fearne, A., Donovan, J., Silva, C. 2013. Conference Paper “Creating social capital from the outside: Insights from a cacao global value chain in Peru” accepted in: The European Association of Agricultural Economists (EAAE) conference of 2013.
xxviii
91. Feudjio, M., Ngaunkam, P., Alemagi, D., Ewane Nonga, N., Magne, A., Nkemuoe, 2012. Land use planning for Low emission development strategies (LUWES). Training Workshop Report. ASB Partnership for the Tropical Forest Margins, Nairobi, Kenya.
92. Ngendakumana, S., Feudjio, M. 2011. “Estimating opportunity Cost for REDD+ in Cameroon”. Short report for Limbe Training workshop.
Peatland�reports�
93. Agus, F., Maswar, M. Anang Firmansyah, Jubaedah, Siti Nurzakiah. 2011. Spatial Variation of Water Table Depth and CO2 Emission from a Peat Soil in Indonesia. Indonesian Soil Research Institute, Bogor, Indonesia. With participation of Assessment Institute of Agricultural Technology (AIAT) and Indonesian Swamp Agriculture Research Institute (ISARI) 2011
94. Tchienkoua, M.Y., Nyobe, T., Njomgang, R. 2011. Characterization of peatlands in the upper Nyong river basin (Central Southern Cameroon). Institute of Agricultural Research for Development (IRAD)
95. Vu Tan Phuong, Do Dinh Sam & Tran Thi Thu Anh. 2011. Report on potential for emission reduction through peatlands management in Vietnam. Research Centre for Forest Ecology and Environment (RCFEE)
96. Garcia, D., Alegre, J., Silva, C. 2013. Characterization of aguajales in the Aguaytia river basin: Current C stocks, its condition as peatland, potential threats and options for future management. IIAP and World Agroforestry Centre (ICRAF), Lima, Peru.
REDD+�Readiness�
97. Do, T.H; Jindal, R. 2011. Brief summary of backstopping support provided by ICRAF to UN-REDD and other national REDD processes in Vietnam. World Agroforestry Centre – ICRAF Vietnam, July 2011.
98. Do, T.H; Jindal, R. 2011. Country level assessments of Readiness for REALU: Report from Vietnam. World Agroforestry Centre – ICRAF Vietnam, July 2011.
Training�manuals�
99. ICRAF Vietnam. 2012. Technical Manual for Participatory Carbon Monitoring, Calculation and Measurement (Vietnam).

xxix
100. Jindal, R., Namirembe, S. 2012. International Market for Forest Carbon Offsets: How these offsets are created and traded.ASB Lecture Note 14.
101. White, D., Minang, P. 2011. Estimating the Opportunity Costs of REDD+ - A Training Manual.
102. Tito, M. 2011. Technical manual N° 11: Guide to determine carbon stock in small farms. (Peru)Hairiah K, Dewi S, Agus F, Velarde SJ, Ekadinata A, Rahayu S and van Noordwijk M. 2011. Measuring Carbon Stocks Across Land Use Systems: A Manual. Bogor, Indonesia. World Agroforestry Centre - ICRAF, SEA Regional Office. 154 p
Monograph�
103. Dewi, S.; Ekadinata, A.; Galudra, G.; Agung, P.; Johana, F. 2011 Land use planning for low emission development strategy (LUWES) - Case studies from Indonesia
104. Harja D, Dewi S, van Noordwijk M, Ekadinata A, Rahmanulloh A, Johana F. 2012. REDD Abacus SP - Buku Panduan Pengguna dan Software. Bogor, Indonesia. World Agroforestry Centre (ICRAF) Southeast Asia Regional Program. 148p
Background�papers�
105. Bernard, F., McFatridge, S., Minang, P. 2012. The Private Sector in the REDD+ Supply Chain: Trends, Challenges and Opportunities. ASB Partnership for the Tropical Forest Margins and International Institute for Sustainable Development.
106. Bernard, F., Minang, PA. 2011. Strengthening MRV (Measurement, Reporting and Verification) for REDD+. ASB Partnership for the Tropical Forest Margins. Nairobi, Kenya.
Submission�to�UNFCCC�
107. Dewi, S.; van Noordwijk, M.; Minang, P. 2012. Reference Emission Levels (REL) in the context of REDD and land-based NAMAs: forest transition stages can inform nested negotiations. Submission to SBSTA UNFCCC, February 28 2012
Working�papers�
108. Eastman D, Catacutan DC, Do TH, Guarnaschelli S, Dam VB, Bishaw B. 2013. Stakeholder preferences over rewards for ecosystem services: implications for a REDD+ benefit distribution system in Viet Nam. Working Paper 171. Bogor, Indonesia: World Agroforestry Centre (ICRAF) Southeast Asia Regional Program.

xxx
OUTLINE�OF�THE�REPORT�This report brings together three years of substantive exploratory research on the concept of Reducing Emission from All Land Uses (REALU). Section 1 of this report provides a comprehensive description of the REALU concept approach and the rationale behind it. It describes the operational perspective on landscapes and introduces the four REALU landscapes in which the project operated. Section 2 synthesizes the experiences from the four REALU landscapes in their exploration for potential emission reduction and planning. Section 3 zooms into the second pillar of the REALU concept approach, REPeat – Reducing Emissions from Peatlands, a dominant global source of non-forest, land-based emissions, and stresses the importance of such ecosystems for carbon sequestration. From the emission reduction potentials identified in Section 2 and 3, Section 4 describes the incentive schemes which have been developed in the four REALU landscapes. Section 5 emphasizes the enabling conditions for effective landscape-based strategies such as REDD+ readiness, co-investment in landscapes including engagement of the private sector and developing a clear benefit sharing mechanism. Section 6 highlights the importance of process tools that supports learning, participation and negotiation capacities of relevant actors and focuses on LUWES as an illustrative tool. Finally Section 7 synthesises and shares the lessons from the REALU project as well as recommendations for moving forward with landscape approaches for emissions reduction.
1
I REALU:�AN�INTRODUCTION��1.1 The�project�1.1.1 REALU�project�goal�and�indicator�
The REALU Phase II project goal is to develop through action research, a set of approaches, methodologies and national capacities to implement effective landscape-based strategies for Reducing Emissions from Deforestation and Degradation (REDD+) within a context of rural sustainable development, national sovereignty, respect for indigenous rights, and the integrity of a global greenhouse gas (GHG) accounting system. This phase of the project is building upon the first phase of the project in 2009-2010 whose research and reviews focused on key areas that could enhance the understanding of landscape approaches to REDD+ and the implications for United Nations Framework Convention on Climate Change (UNFCCC) negotiations.
The Indicator for goal attainment is the acceptance and implementation by the national authorities negotiating modalities and procedures for REDD+ agreement beyond the UNFCCC Conference of the Parties (COP) 15, of a broad framework for dealing with GHG emissions from any land use, acknowledging cross-sectoral linkages and leakage, and embracing REDD+, forest protection, and high carbon-stock/low carbon emission development pathways as its pillars.
1.1.2 REALU�objectives�
The project objectives are to:
1. Backstop country-level planning and implementation of landscape approaches to REDD+ through the provision of methods, tools and relevant training at multiple levels within the framework of multi-lateral initiatives such as the Forest Carbon Partnership Facility (FCPF) and UN-REDD.
2. Explore in four demonstration landscapes (in Asia, Africa and Latin America, namely, Cameroon, Indonesia, Peru and Vietnam) how landscape approaches to REDD+ or a broader approach to reducing emissions from all land uses (REALU) can enhance the protection of natural forests, reduce net emissions while reducing poverty, respecting rights and allowing for sustainable resource access.
3. Engage in global comparative action research that explores the relationships between efforts for REDD+ in developing countries, rural poverty and livelihood strategies, ‘carbon rights’, and other land use options and their GHG emissions profiles. Such comparative research provides a global synthesis on readiness for landscape approaches to REALU as a logical next step of REDD+.
2
4. Enhance science and policy interactions and expand the global debate on REDD+ and other mitigating strategies through the validation and dissemination of a comprehensive REALU framework and the findings from the REALU II research activities.
1.1.3 REALU�project�components�
Backstopping country level planning and implementation of landscape approaches for REDD+
This component reviewed, tested and further refined methods and tools as necessary for eventual use in landscape approaches to REDD+. It also provided relevant training at multiple levels within the framework of multi-lateral initiatives. In addition, tools for nesting, baselines, additionality and leakage will continue to be developed as these are considered the main challenges for switching from REDD+ to REALU or agriculture, forestry and other land uses (AFOLU) accounting. This component requires building local and national capacity, and therefore readiness, for REDD+/REALU.
Demonstration Landscapes The project explored in the four pilot landscapes at sub-national/meso level in Cameroon, Indonesia Peru and Vietnam how a landscape approach to REDD+ or a broader approach to REALU can enhance the protection of natural forests, decrease net emissions while alleviating poverty and respecting rights and resource access. The aim is to assess and demonstrate through these pilot sites the extent and modalities of reductions in emissions from all land uses. Specifically understanding of leakage in agriculture-forest mosaics and the ”forest”-”non-forest” interface in the landscape was examined including classic REDD+ projects that focus on ”forest” only, while also addressing other land uses and drivers of deforestation at the landscape level. It also tested methods for “nesting” sub-national to national level baselines and for addressing drivers of deforestation.
Global Comparative Study This component built upon the results from REALU Phase I. It relied on a country level, global comparative analysis of readiness for landscape approaches to REDD+ in the countries also highlighting the training needs for REDD+ and REALU implementation.
Knowledge to Action
This aimed at facilitating science-policy interaction in decision-making processes and ensuring that the synthesis of lessons learnt at the global level reached both science and international climate change policy communities. This was facilitated through active participation in major science and policy conferences such as UNFCCC COP and the Subsidiary Body for Scientific and Technological Advice (SBSTA) events.
1.2 Wh
Adapted & Minan
1.2.1 T
One critiscales. Tmuch dedefinition'forest' anland usestress in n
The examforest caminimumforests wIndonesiatrees and
Figure 1 C
Only allapplicabichanges
hy�REALU?�
from van Nng, P.A., 200
The�absence
ical issue fohe definition
ebate. Definn of forest und ‘non-fores, varying in
non-forest lan
mple of Indoan have mum tree heightwith definitio
a actually shd non-forest w
Conceptual figu
owing foresility. REALUthat affect c
Noordwijk et09 (ASB Poli
e�of�a�globa
or REDD+ n of forest a
nitions of ‘funder the REest’ as definn presence ond), carbon-
onesia illustrultiple meant and cover,
ons within bohows that thwithout trees
ure of different
st areas to U can addrecarbon storag
t al., 2009 icy Brief No.
ally�agreed
is to create and what is iforest’ existEDD+ mechaned for the Uf trees (inclustorage and
rates the comnings. In Ind
but is also loth contexts here are fores (van Noord
possible forest
be includedss this limitage, whether
3
(ASB Policy 15)
�definition
a standard ncluded or n
t but are dianism (van NUNFCCC, cauding zero tcarbon-emis
mplexity of ddonesia, forlinked to spenot matchin
ests with tredwijk and M
t and non-fores
d under theation of REDthis involve
y Brief No.
n�of�‘forest’�
forest definnot includediverse and tNoordwijk aan cover matree cover lassion potenti
determining rest refers tecific institu
ng, adding toees, forest w
Minang, 2009
st areas. Sourc
e current RDD+ as it ta
es peatlands
13) and va
�
nition applicd in REDD+ there is no and Minang,any types ofands for foreial (Figure 1
a forest defto woody vutions empowo the comple
without trees9).
ce: van Noordw
REDD+ mecakes into accor mineral s
n Noordwijk
cable at muis still subjeglobally ag
, 2009). Thef land coverest land or lo1).
finition. Thevegetation wwered to maexity. The cas, non-forest
wijk, et al., 200
chanism limcount all lansoil, trees ou
k, M.
ultiple ect to greed term s and ots of
term with a anage ase of t with
09, p.2.
mits it nd use utside
4
of the forest, agroforests, plantations or natural forest thereby not requiring an operational definition of forest.
1.2.2 High�potential�emissions�reduction�and�sequestration�in�other�land�uses�
While the international community has embraced REDD+, the role played by land outside the forest in storing carbon and reducing emissions has not been sufficiently addressed. While it is clear that deforestation is an important source of global carbon emissions, land use is also a significant contributor of global emissions (20-30%). In many cases, vegetation outside of institutionally defined “forest” contains large amounts of carbon stocks and can contribute more to emissions reduction than institutionally defined forest areas. For instance, one third of Indonesia’s forest emissions (a total of 0.6 gigatonnes of carbon per year (GtC/yr)) occur outside institutionally defined forests, and are not accounted for under the current national policy for REDD+. Trees and woody vegetation outside forest and peatlands contain large amounts of carbon stocks that are excluded from current mitigation discussions within the UNFCCC. Therefore, there is a real potential for areas outside the forest to help reduce deforestation and create benefits for local people which needs to be explored across the tropics.
1.2.3 Drivers�of�deforestation�largely�outside�the�forests�
So far drivers of deforestation are not adequately addressed within REDD+. Emissions from forests are driven and influenced by actions and factors outside of forests. Hence accounting for emission reductions from forests is unlikely to be possible without consideration of other land uses. Therefore, REDD+, as a partial accounting mechanism of land use and land use change, is challenged by cross-scale issues such as additionality, leakage and permanence. Addressing forests only though the REDD+ mechanism is unlikely to avoid local-level leakage. In Indonesia, for instance, carbon stocks outside of institutional forests are more at risk than those inside, and may be depleted by 2032, partly due to emission leakages from protected forests (Ekadinata et al., 2010).
Landscape approaches and accounting of AFOLU is needed as a way of minimizing leakage and bypassing definition/eligibility questions hampering the implementation of REDD+, CDM and other mitigation options as currently framed under the UNFCCC. Although facing its own challenges, such an approach could be more:
� Effective in bringing major ‘leakage’ concerns into the accounting rules and allowing increased land use intensity outside forests as a contributor to net emission reductions.
� Etr
� Eanru
1.2.4 P
Intermedmitigate livelihoopeople. Tand adapdevelopinimportan
Figure 2 Mbest consid
Efficient by ropical peatla
Equitable by nd embracinural poor.
Potential�of
diate land uclimate chands. They can
Therefore, bptation, foodng countries
nt for creatin
Most tropical fodered from a la
providing mands and smapplying the
ng low-fores
f�intermedi
uses such asnge, enhancen therefore l
balancing thed security as. Hence undg win-win st
orest landscapeandscape level.
many cost-emallholder ag
e same accoust-cover cou
iate�land�us
s tree-basede resilience lead to greate roles of agnd poverty derstanding trategies and
s are mosaics o This picture is
5
ffective optgroforestry. unting rules untries on a
ses�such�as
d agriculturato climate vter emissiongriculture analleviation the trade-of
d opportuniti
or interacting ls one example
tions for em
for Annex-Ia proportion
s�tree-based
al systems ovariability anns reductionsnd forestry iis a key co
ffs between ies.
land uses that aof such a land
missions redu
I and non-Anate basis an
d�agricultu
or agroforesnd improve fs and larger in climate c
ondition for these functi
are difficult to dscape mosaic.
uction, inclu
Annex-I counnd rewardin
ural�system
stry systemsfood securitybenefits for
change mitigany initiativ
ions is extre
separate and ar
uding
ntries, g the
ms��
s can y and local
gation ve in
emely
re
6
1.3 How�different�is�REALU�from�REDD+?�
REALU is an evolving framework that seeks to understand the potential for optimizing emission reductions from all land uses in a holistic (bio-physical, technical, policy, social and economic) manner. REALU recognizes REDD+, but tries to address the above highlighted limitations of REDD + and looks beyond the current framing for the mechanism to a possible inclusion of agriculture and land-based Nationally Appropriate Mitigation Actions (NAMAs). The REALU architecture supports a landscape approach consisting of several pillars addressing specific land uses and sectors and is based on fundamental principles linked to the ultimate goal of adaptive sustainable livelihoods and climate resilience.
The REALU proposes a definition that includes REDD+ as well as all transitions in land cover that affect carbon storage.
� REDD+ is seen as one of the pillars of such a REALU framework, together with efforts to:
� Reduce emissions from peatlands (REPeat), � Restocking of degraded landscapes through trees and soil carbon (REStock), � Reducing emissions from agricultural GHGs (REAGG).
Forest, agriculture, peatlands and intermediate agroforestry, reforestation and afforestation activities are considered key building blocks on which to develop emission reduction interventions. The REALU architecture can provide a good basis for understanding landscape approaches to REDD+ and the role of potentially more complete emission reduction mechanisms such as NAMAs, especially land-based NAMAs.
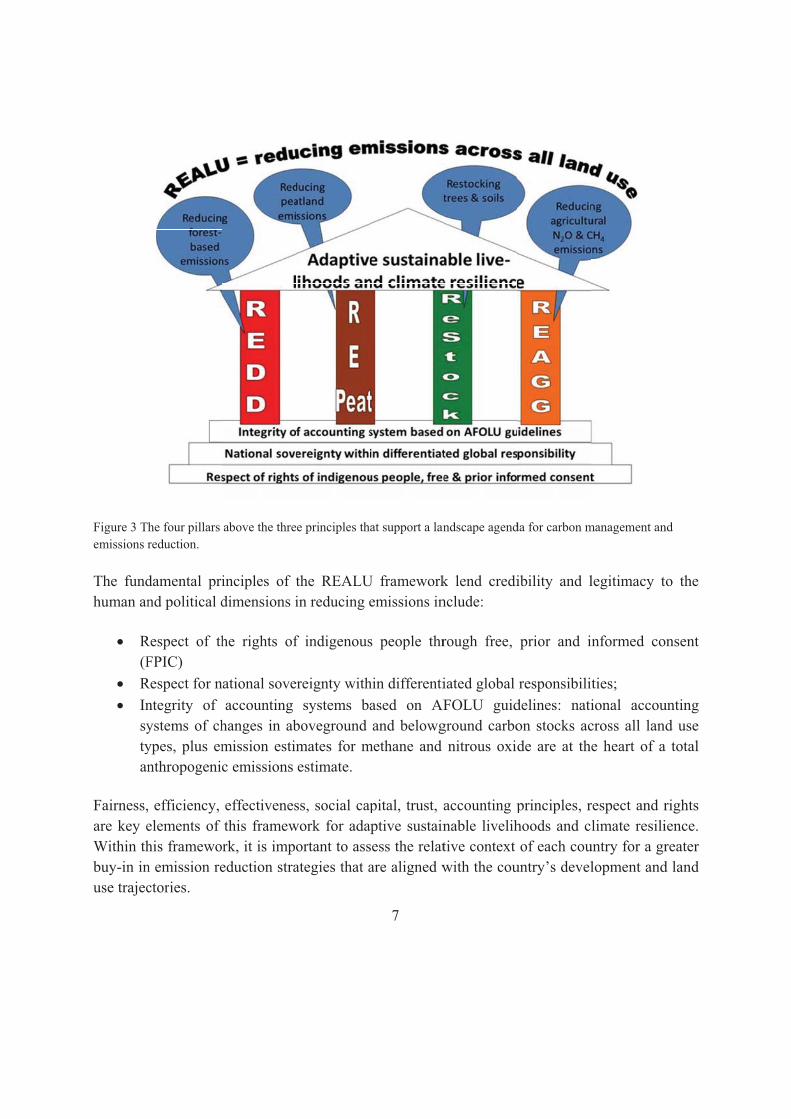
Figure 3 Temissions r
The fundhuman an
� R(F
� R� In
sytyan
Fairness,are key eWithin thbuy-in inuse trajec
he four pillars reduction.
damental prind political d
Respect of thFPIC)
Respect for nntegrity of ystems of chypes, plus emnthropogeni
, efficiency, elements of his framewon emission rectories.
above the thre
inciples of dimensions i
he rights of
national soveaccounting
hanges in abmission estic emissions
effectivenesthis framewrk, it is impeduction stra
ee principles th
the REALUin reducing e
f indigenous
ereignty withsystems b
boveground mates for mestimate.
ss, social capwork for adaortant to assategies that a
7
at support a lan
U frameworkemissions in
s people thr
hin differentiased on AFand belowg
methane and
pital, trust, aaptive sustainsess the relatare aligned w
ndscape agend
k lend credinclude:
rough free,
iated global FOLU guid
ground carbonitrous oxid
accounting pnable livelihtive context with the cou
da for carbon m
ibility and l
prior and i
responsibilitdelines: nation stocks acde are at the
principles, rhoods and cof each cou
untry’s devel
management an
legitimacy t
nformed co
ties; ional accoucross all lande heart of a
respect and rlimate resili
untry for a grlopment and
nd
o the
nsent
unting d use
a total
rights ience. reater d land
8
1.4 Landscape�considerations�in�REALU��
In this section the operational perspective of landscapes, on which this work is based, is presented reflecting how landscapes have been interpreted. First a number of key considerations of landscapes are presented and the four REALU landscapes are introduced.
The key considerations for understanding and operationalising landscape approaches in the project include, but are not limited to, heterogeneity, integration and interactions, multi-functionality, synergy and scale. Each of these concepts is briefly introduced below.
Heterogeneity: In most of the landscapes ASB has worked in over the last 20 years, heterogeneity in land uses and land use patterns has been a defining feature. Hence these complex overlapping patterns are understood as one inherent dimension in landscapes from a spatial point of view.
Interactions and integrations: Landscapes represent complex systems with sets of social, biophysical, human ecological and economic dimensions that interact with each other (Figure 4). Processes are thus important. Such interactions happen at multiple levels, e.g. the plot, farm, and field levels and beyond. Integration enables understanding of such cross-scale interactions which determine numerous landscape-level patterns and changes. Understanding and building on interactions and feedback loops is thus important for success.
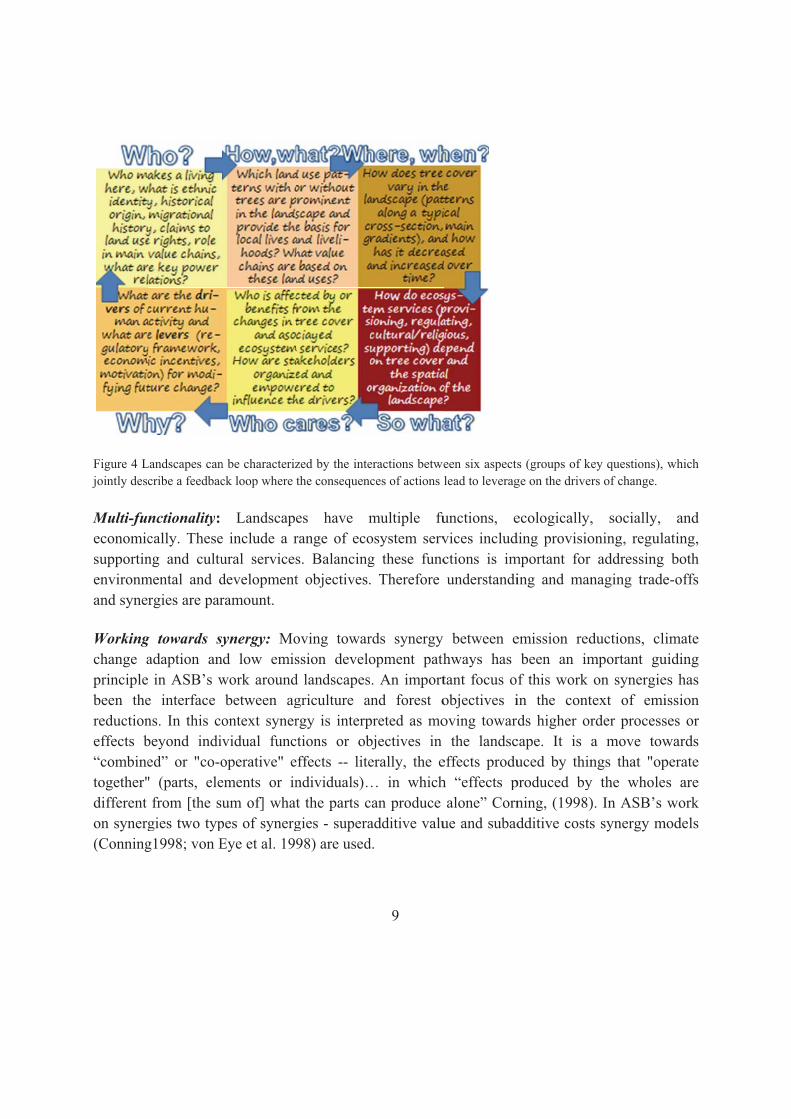
Figure 4 Ljointly des
Multi-funeconomicsupportinenvironmand syne
Workingchange aprinciplebeen thereductioneffects b“combinetogether"different on synerg(Conning
Landscapes cancribe a feedbac
nctionality: cally. Theseng and cultumental and drgies are par
g towards syadaption an in ASB’s w
e interface ns. In this cobeyond indied” or "co-o" (parts, elefrom [the s
gies two typg1998; von E
n be characterizck loop where
Landscape include a rural servicesdevelopmentramount.
synergy: Mond low emiswork aroundbetween ag
ontext synervidual funcoperative" eements or inum of] wha
pes of synergEye et al. 19
zed by the intethe consequen
es have mrange of ecos. Balancingt objectives.
oving towarssion develod landscapesgriculture argy is interpctions or obeffects -- litendividuals)…t the parts cgies - supera98) are used
9
eractions betweces of actions
multiple fuosystem servg these func. Therefore
rds synergy opment paths. An importand forest opreted as mobjectives in erally, the e… in whichcan produce additive valud.
een six aspectslead to leverag
unctions, evices includctions is imunderstandi
between ehways has tant focus oobjectives ioving toward
the landsceffects produh “effects p
alone” Cornue and subad
s (groups of kege on the driver
ecologically,ding provisiomportant for ing and man
emission redbeen an imf this work in the contds higher or
cape. It is auced by thin
produced byning, (1998)dditive costs
ey questions), rs of change.
, socially, oning, regula
addressing naging trade
ductions, climportant guon synergie
text of emirder processa move towngs that "op
y the whole). In ASB’s s synergy m
which
and ating, both
e-offs
imate uiding es has ission ses or wards perate s are work
models
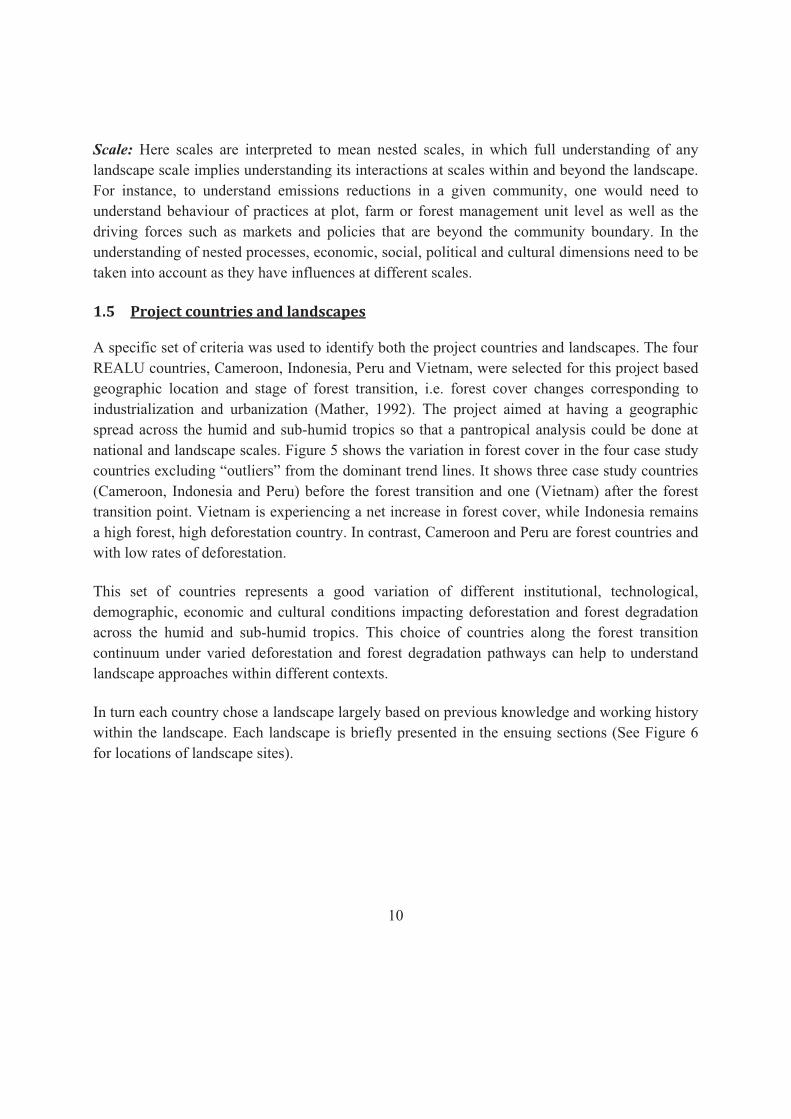
10
Scale: Here scales are interpreted to mean nested scales, in which full understanding of any landscape scale implies understanding its interactions at scales within and beyond the landscape. For instance, to understand emissions reductions in a given community, one would need to understand behaviour of practices at plot, farm or forest management unit level as well as the driving forces such as markets and policies that are beyond the community boundary. In the understanding of nested processes, economic, social, political and cultural dimensions need to be taken into account as they have influences at different scales.
1.5 Project�countries�and�landscapes�
A specific set of criteria was used to identify both the project countries and landscapes. The four REALU countries, Cameroon, Indonesia, Peru and Vietnam, were selected for this project based geographic location and stage of forest transition, i.e. forest cover changes corresponding to industrialization and urbanization (Mather, 1992). The project aimed at having a geographic spread across the humid and sub-humid tropics so that a pantropical analysis could be done at national and landscape scales. Figure 5 shows the variation in forest cover in the four case study countries excluding “outliers” from the dominant trend lines. It shows three case study countries (Cameroon, Indonesia and Peru) before the forest transition and one (Vietnam) after the forest transition point. Vietnam is experiencing a net increase in forest cover, while Indonesia remains a high forest, high deforestation country. In contrast, Cameroon and Peru are forest countries and with low rates of deforestation.
This set of countries represents a good variation of different institutional, technological, demographic, economic and cultural conditions impacting deforestation and forest degradation across the humid and sub-humid tropics. This choice of countries along the forest transition continuum under varied deforestation and forest degradation pathways can help to understand landscape approaches within different contexts.
In turn each country chose a landscape largely based on previous knowledge and working history within the landscape. Each landscape is briefly presented in the ensuing sections (See Figure 6 for locations of landscape sites).

Figure 5 Rdeviations
Figure 6 L
REALU projectfrom the trend
ocation of the
t countries posid.
demonstration
itioned along th
landscapes in 11
he forest/tree c
the four projec
cover transition
ct countries.
n. Dotted lines represent poss
sible
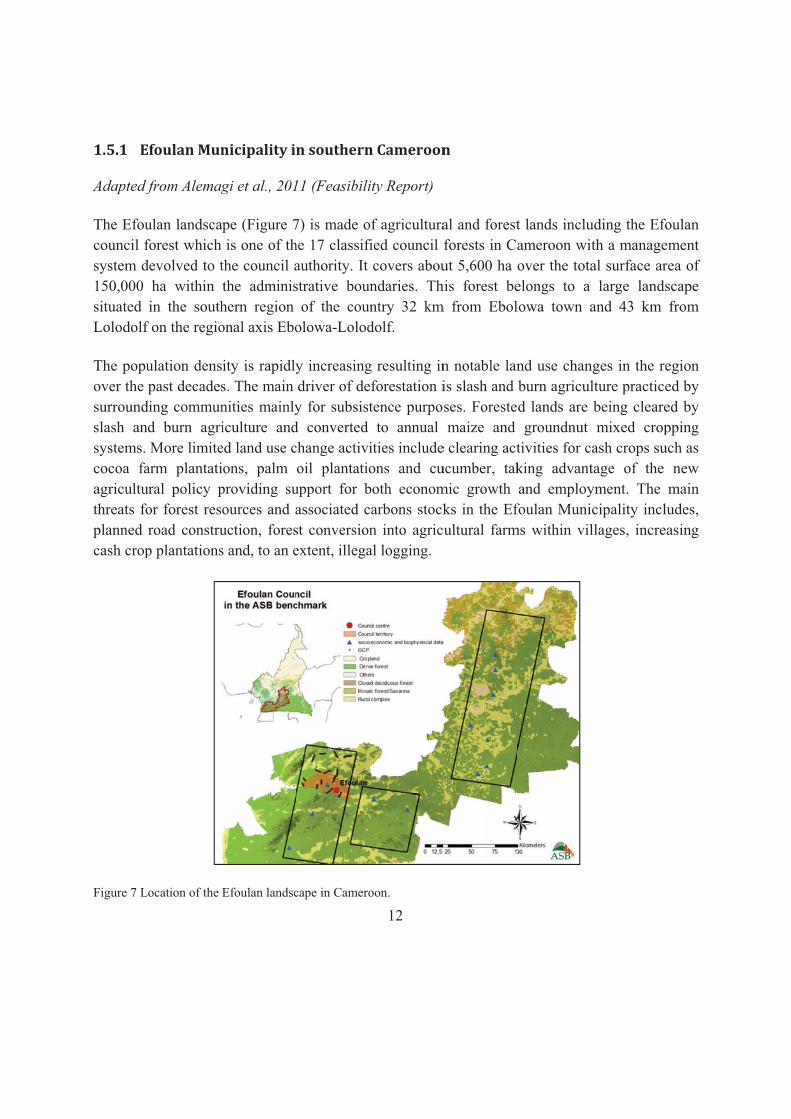
1.5.1 E
Adapted f
The Efoucouncil fsystem d150,000 situated Lolodolf
The popuover the surroundslash ansystems. cocoa faagricultuthreats foplanned cash crop
Figure 7 L
Efoulan�Mun
from Alemag
ulan landscaforest which devolved to t
ha within in the south
f on the regio
ulation denspast decades
ding commund burn agriMore limite
arm plantatiural policy por forest resroad construp plantations
ocation of the
nicipality�i
gi et al., 201
ape (Figure 7is one of th
the council athe adminishern region onal axis Ebo
ity is rapidlys. The main nities mainlyiculture anded land use cions, palm providing suources and auction, foress and, to an e
Efoulan landsc
n�southern
11 (Feasibili
7) is made ohe 17 classifiauthority. It strative bou
of the counolowa-Lolod
y increasingdriver of dey for subsistd converted change activioil plantatio
upport for bassociated cst conversionextent, illega
cape in Camero
12
n�Cameroon
ity Report)
of agriculturafied council f
covers aboundaries. Thntry 32 kmdolf.
g resulting ineforestation itence purpo
to annual ities includeons and cu
both economcarbons stockn into agricual logging.
oon.
n�
al and forestforests in Caut 5,600 ha o
his forest bem from Ebol
n notable lanis slash and ses. Forestemaize and
e clearing actucumber, takmic growth ks in the Efultural farm
t lands incluameroon witover the totaelongs to a lowa town a
nd use chanburn agriculd lands are groundnut
tivities for cking advantand employ
foulan Munims within vil
uding the Efoth a manageal surface ar
large landsand 43 km
nges in the relture practicebeing clearemixed crop
ash crops sutage of the yment. The cipality inclllages, incre
foulan ement rea of scape from
egion ed by ed by pping
uch as new
main ludes, easing
1.5.2 T
Adapted f
Tanjabarin the nor
The distrkm2. Locpeat aretransmigr
The distdominatedistrict aforest, 6.‘non-foreagrofores
Land chreforestatdriven bypeatland
Figure 8 L
Tanjung�Jab
from Widay
r District is lrth and cove
rict populatical people doeas and coaration from J
trict comprised by podsoare classified.65% as protest area’ in stry, rubber m
hange activittion for the y active immand forested
ocation of Tan
bung�Barat�
ati, al., 2011
located on thers an area of
on is aroundominate the dastal villagJava began a
ses of approlic, alluvial d as ‘forest atected peat fthis district monoculture
ties in Tanjpulp and pa
migration. Thd areas.
njabar District,
(Tanjabar)
1 (Feasibility
he eastcoast f approxima
d 280,000 pdistrict’s soues (in the around 1980
roximately 4and grey h
area’. Abouforest and 3is very high
es and, most
njabar includaper industryhese numero
Jambi Provinc
13
)�District�in
y Report)
of the Jambately 500,000
eople, with uth-western
northeast).0 and continu
40% peatlanydromorphict 71% of th.66% reservh and is domrecently, oi
des active dy, oil palm pous land-base
ce, Sumatra, In
n�Indonesia
bi Province, 0 ha (Figure
a populationinland area, In both ued up until
nd and 60%c soil. Abou
his forest areved for natiominated by l palm plant
deforestationplantations aed activities
ndonesia.
a�
bordering th8).
n density ofwhile migrainland and 2000.
% of mineraut 48% or 2ea is classifional parks. Tcoconut agr
tations.
n, conversioand smallho
s has put pre
he province,
f 56 residentants dominat
lowland a
al-enriched 240,000 ha oied as produThe proportiroforestry, ru
on of peatlolder agriculssure on bot
Riau
ts per te the areas,
land, of the uction on of ubber
lands, ltural, th the

14
1.5.3 Padre�Abad�Province�in�Peru�
Adapted from Robiglio et al., 2012 (Feasibility Report)
The Padre Abad Province is located in the northwest of the Ucayali Region, one of the five Amazonian regions in Peru (Figure 9). It covers an area of 9,450 km2 much of which is of flat topography.
The whole province is within Peru’s humid tropic area with tropical evergreen rain forests and wet premontane tropical forests in transition to tropical rainforests located at higher altitudes in the Andean foothills. Permanent production concessions, protected areas and indigenous communities occupy most of the forest land. Unclassified land or land that has not yet been allocated or titled is found along the transport network and is the land where the most deforestation and degradation occurs. Pastures, annual and biannual crops, permanent tree crops, fallows, secondary forest and degraded forest remnants constitute the landscape mosaic.
The population in Padre Abad (63,892 people in 2007) is increasing and urbanizing. General population density is 6.33 people/km2 with concentrated population around urban centres (52.82%) creating uneven distribution. Padre Abad is a relatively old deforestation frontier with population concentrated along the Federico Basadre Highway built around the 1940’s and the first transport axis connecting the Amazon to the capital, Lima, along the banks of the water courses.
Settlement configuration is not yet stable with new hamlets (villages) in the process of registration. Increased accessibility by road or river is shaping settlement and land occupation strategies by settlers. Centres in the area are developing fast thanks to the role they play in the marketing of agricultural commodities such as papaya, plantain and more recently cacao and oil palm to supply Pucallpa, Tingo Maria and Lima.
Smallholder colonist farmers in Padre Abad are the major actors of deforestation and overall land use change in the agricultural mosaic. Both cacao and oil palm are booming commodities creating livelihood opportunities for smallholders to farm profitable legal crops allowing for the abandonment of illegal coca cultivation. Such shifts in cultivation are being supported nationally and internationally.

Figure 9 L
1.5.4 B
Adapted f
The prov10), withrate in co
Accordinpeople, oseven etfollowed
The averbeen a sicontributcomparedsector hain rural a
ocation of the
Bac�Kan�Pro
from Do Tro
vince of Bach 56.6% foreontrast to the
ng to Bac Koccupying anhnic groups
d by the Kinh
rage annual ignificant reting only 4d to the mor
ave undergonareas, agricu
Padre Abad Pr
ovince�in�Vi
ong Hoan et
c Kan is oneest cover come 13.4% natio
Kan Statisticsn area of 4,s in the proh (19.3%), th
income per structuring i1.08% of tre than 60%ne impressivulture and fo
rovince in Peru
ietnam�
t al., 2012 (F
e of the mostmpared to coonal average
s Office (20861 km2 wiovince, the he Dao (9.5%
capita in 20in the econothe province contribution
ve growth noorestry rema
15
u.
Feasibility R
t forested anountry’s avere (Bac Kan S
10), the totaith an averag‘Tay’ group
%), and the N
007 was 309omy with thee’s total grn ten years pow contributain the main
eport)
nd poorest prage of 39.1%Statistical Y
al populationge density op form 60.4Nung (7.4%)
9 USD (~ 4.e agricultureross domestprior. Both tting to 60% n sources of
provinces in % and arounearbooks, 20
n of the proof 61people/4% of the ).
95 million Ve, forestry antic product the industriaof the provi
f livelihood.
Vietnam (Fnd a 37% po010).
ovince is 293/km2. Amontotal popula
VND). Thernd fishing se
(GDP) in al and the seince’s GDP. Out of the
Figure overty
3,628 ng the ation,
re has ectors 2010
ervice Still, total
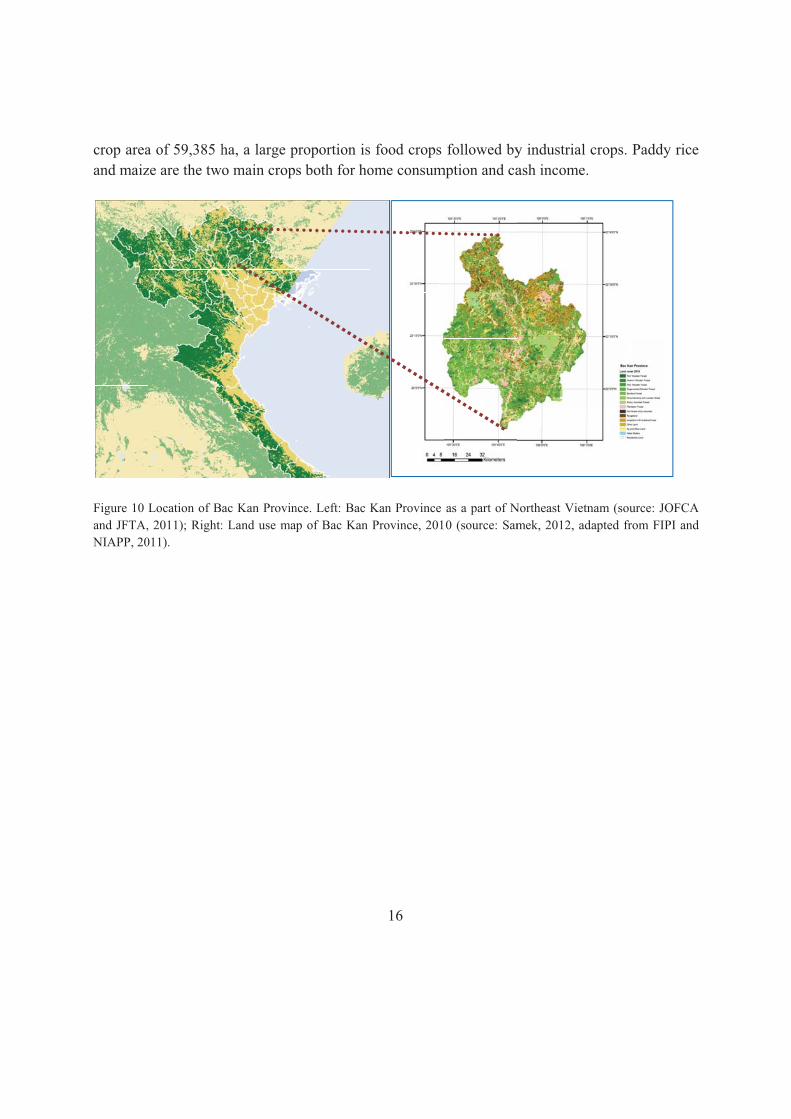
crop areaand maiz
Figure 10 and JFTA,NIAPP, 20
a of 59,385 hze are the tw
Location of B, 2011); Right:011).
ha, a large po main crop
ac Kan Provin: Land use ma
proportion iss both for ho
nce. Left: Bac ap of Bac Kan
16
s food crops ome consum
Kan Province Province, 201
followed bymption and ca
as a part of N10 (source: Sam
y industrial cash income.
Northeast Vietnmek, 2012, ada
crops. Paddy
nam (source: JOapted from FIP
y rice
OFCA PI and
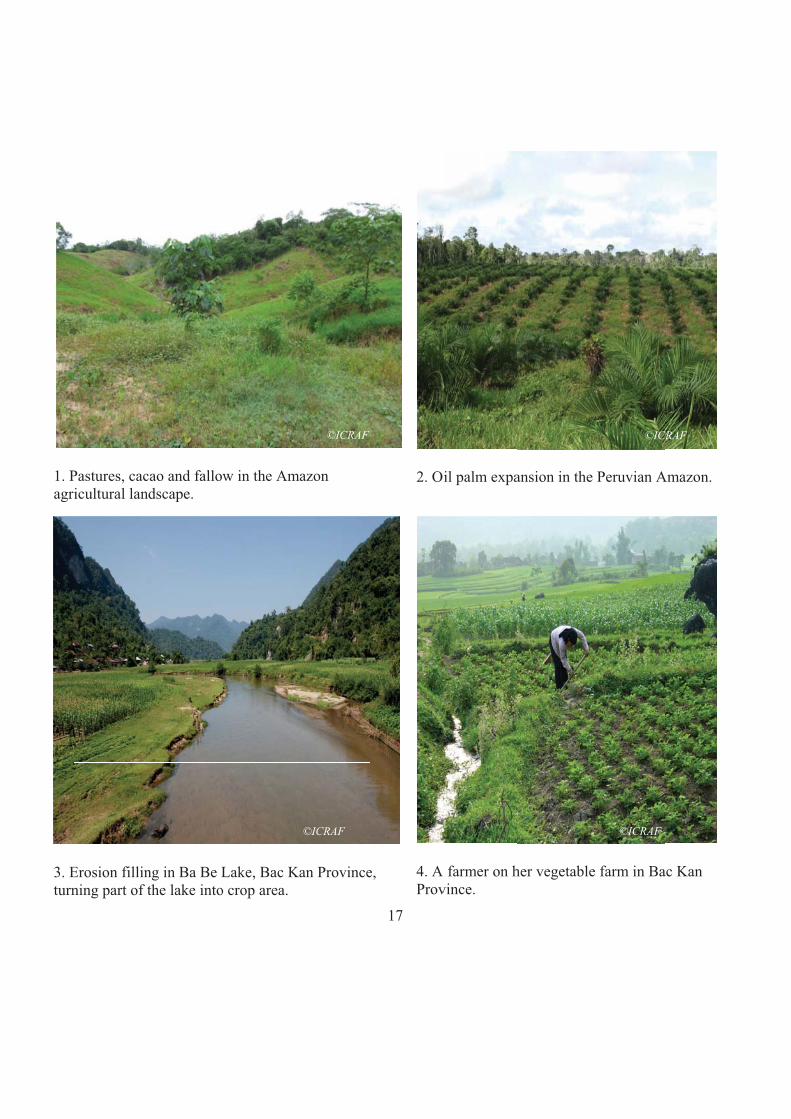
1. Pagri
3. Eturn
Pastures, cacicultural lan
Erosion fillinning part of t
cao and fallodscape.
ng in Ba Be Lthe lake into
w in the Am
Lake, Bac Ko crop area.
mazon
Kan Province
©ICRAF
©ICRAF
17
2. Oi
e, 4. A Prov
il palm expa
farmer on hvince.
ansion in the
her vegetable
e Peruvian A
e farm in Ba
©ICRAF
©ICR
Amazon.
ac Kan
CRAF

5. F
7. OJam
Forest landsc
Oil palm andmbi Province
cape in Efou
d forest fronte.
ulan, Camero
tier in Tanjun
©
©ICRA
oon.
ng Jabung B
©Asep Ayat
AF Cameroon
18
6. Pe
Barat, 8. Anplantfores
eatland –A lo
nnual crop uted with oil st (KPHLG)
ow hanging
used for landpalm in the
), Tanjung Ja
fruit in Cam
d preparationarea of peat
abung Barat
©ICR
©ICRA
meroon.
n before protection District.
RAF Cameroon
AF Indonesia
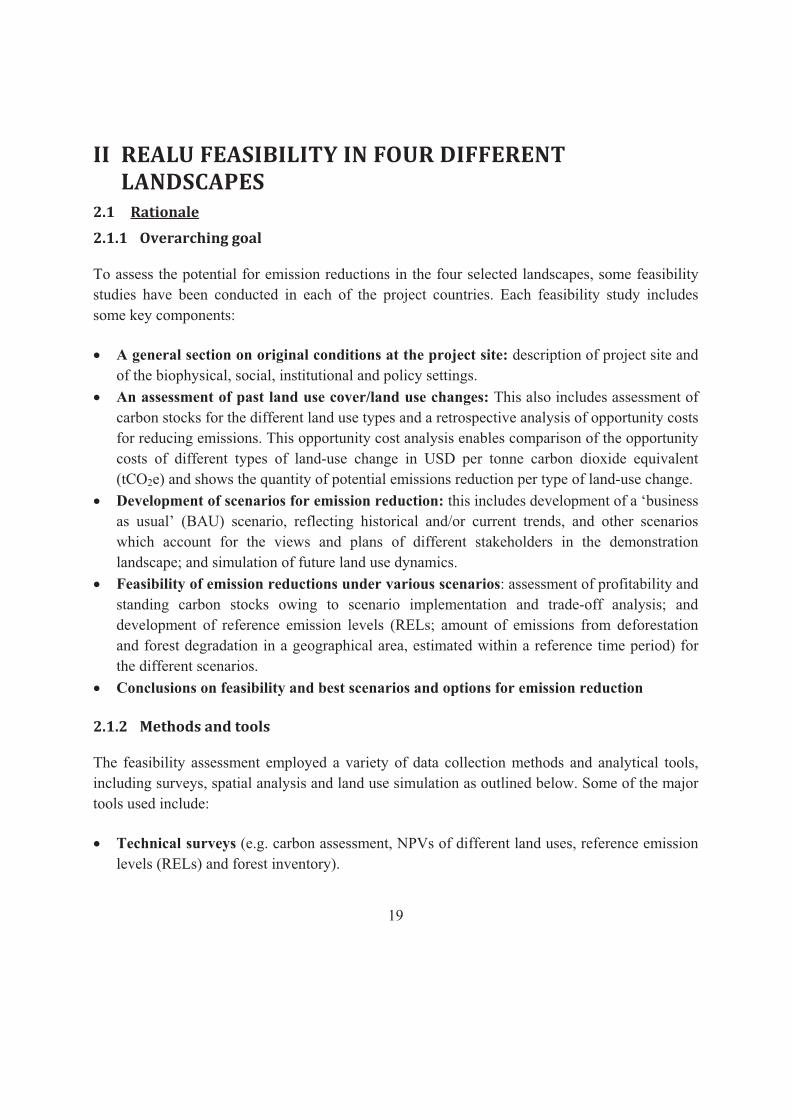
19
II REALU�FEASIBILITY�IN�FOUR�DIFFERENT�LANDSCAPES�
2.1 Rationale�
2.1.1 Overarching�goal�
To assess the potential for emission reductions in the four selected landscapes, some feasibility studies have been conducted in each of the project countries. Each feasibility study includes some key components:
� A general section on original conditions at the project site: description of project site and of the biophysical, social, institutional and policy settings.
� An assessment of past land use cover/land use changes: This also includes assessment of carbon stocks for the different land use types and a retrospective analysis of opportunity costs for reducing emissions. This opportunity cost analysis enables comparison of the opportunity costs of different types of land-use change in USD per tonne carbon dioxide equivalent (tCO2e) and shows the quantity of potential emissions reduction per type of land-use change.
� Development of scenarios for emission reduction: this includes development of a ‘business as usual’ (BAU) scenario, reflecting historical and/or current trends, and other scenarios which account for the views and plans of different stakeholders in the demonstration landscape; and simulation of future land use dynamics.
� Feasibility of emission reductions under various scenarios: assessment of profitability and standing carbon stocks owing to scenario implementation and trade-off analysis; and development of reference emission levels (RELs; amount of emissions from deforestation and forest degradation in a geographical area, estimated within a reference time period) for the different scenarios.
� Conclusions on feasibility and best scenarios and options for emission reduction
2.1.2 Methods�and�tools�
The feasibility assessment employed a variety of data collection methods and analytical tools, including surveys, spatial analysis and land use simulation as outlined below. Some of the major tools used include:
� Technical surveys (e.g. carbon assessment, NPVs of different land uses, reference emission levels (RELs) and forest inventory).
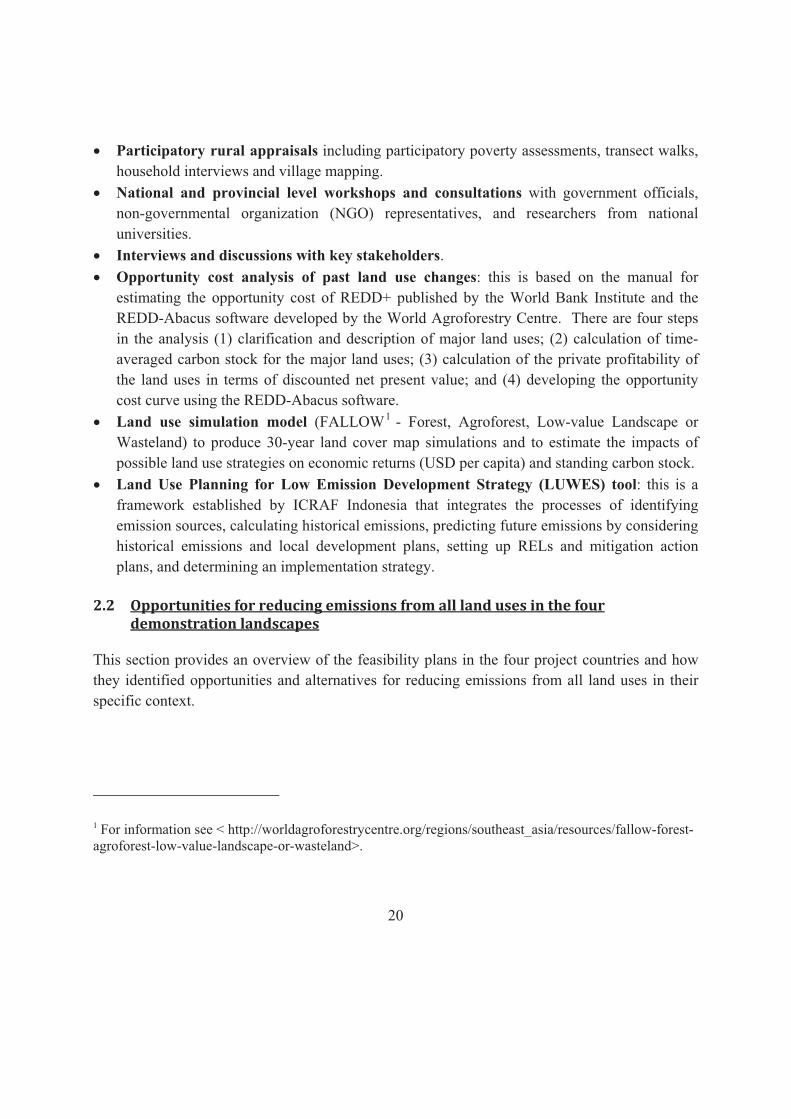
20
� Participatory rural appraisals including participatory poverty assessments, transect walks, household interviews and village mapping.
� National and provincial level workshops and consultations with government officials, non-governmental organization (NGO) representatives, and researchers from national universities.
� Interviews and discussions with key stakeholders. � Opportunity cost analysis of past land use changes: this is based on the manual for
estimating the opportunity cost of REDD+ published by the World Bank Institute and the REDD-Abacus software developed by the World Agroforestry Centre. There are four steps in the analysis (1) clarification and description of major land uses; (2) calculation of time-averaged carbon stock for the major land uses; (3) calculation of the private profitability of the land uses in terms of discounted net present value; and (4) developing the opportunity cost curve using the REDD-Abacus software.
� Land use simulation model (FALLOW1 - Forest, Agroforest, Low-value Landscape or Wasteland) to produce 30-year land cover map simulations and to estimate the impacts of possible land use strategies on economic returns (USD per capita) and standing carbon stock.
� Land Use Planning for Low Emission Development Strategy (LUWES) tool: this is a framework established by ICRAF Indonesia that integrates the processes of identifying emission sources, calculating historical emissions, predicting future emissions by considering historical emissions and local development plans, setting up RELs and mitigation action plans, and determining an implementation strategy.
2.2 Opportunities�for�reducing�emissions�from�all�land�uses�in�the�four�demonstration�landscapes�
This section provides an overview of the feasibility plans in the four project countries and how they identified opportunities and alternatives for reducing emissions from all land uses in their specific context.
1 For information see < http://worldagroforestrycentre.org/regions/southeast_asia/resources/fallow-forest-agroforest-low-value-landscape-or-wasteland>.
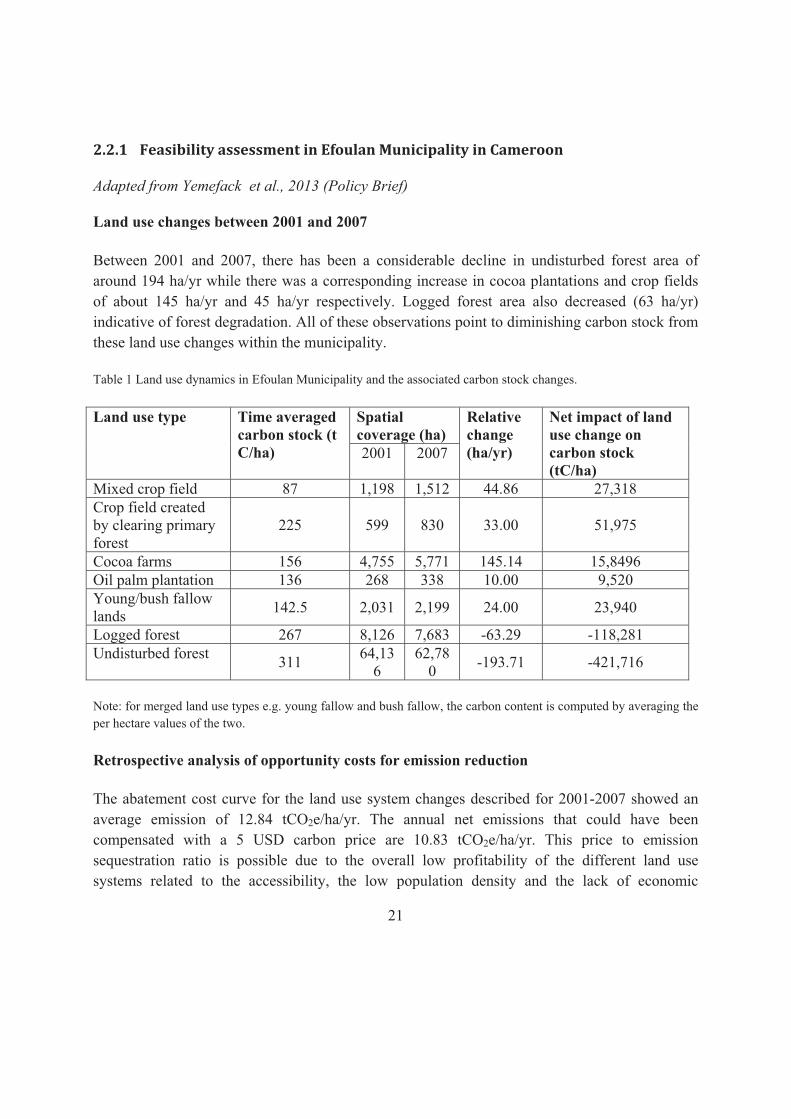
21
2.2.1 Feasibility�assessment�in�Efoulan�Municipality�in�Cameroon�
Adapted from Yemefack et al., 2013 (Policy Brief)
Land use changes between 2001 and 2007
Between 2001 and 2007, there has been a considerable decline in undisturbed forest area of around 194 ha/yr while there was a corresponding increase in cocoa plantations and crop fields of about 145 ha/yr and 45 ha/yr respectively. Logged forest area also decreased (63 ha/yr) indicative of forest degradation. All of these observations point to diminishing carbon stock from these land use changes within the municipality.
Table 1 Land use dynamics in Efoulan Municipality and the associated carbon stock changes.
Land use type Time averaged carbon stock (t C/ha)
Spatial coverage (ha)
Relative change (ha/yr)
Net impact of land use change on carbon stock (tC/ha)
2001 2007
Mixed crop field 87 1,198 1,512 44.86 27,318 Crop field created by clearing primary forest
225 599 830 33.00 51,975
Cocoa farms 156 4,755 5,771 145.14 15,8496 Oil palm plantation 136 268 338 10.00 9,520 Young/bush fallow lands 142.5 2,031 2,199 24.00 23,940
Logged forest 267 8,126 7,683 -63.29 -118,281 Undisturbed forest 311 64,13
6 62,78
0 -193.71 -421,716
Note: for merged land use types e.g. young fallow and bush fallow, the carbon content is computed by averaging the per hectare values of the two.
Retrospective analysis of opportunity costs for emission reduction
The abatement cost curve for the land use system changes described for 2001-2007 showed an average emission of 12.84 tCO2e/ha/yr. The annual net emissions that could have been compensated with a 5 USD carbon price are 10.83 tCO2e/ha/yr. This price to emission sequestration ratio is possible due to the overall low profitability of the different land use systems related to the accessibility, the low population density and the lack of economic

22
alternatives/opportunities. Based upon these findings it appears that the area of Efoulan would be suitable for establishing a cost-effective REDD+ program.
Development of land use scenarios
Four land use scenarios were developed for simulation:
1) ‘BAU’ reflecting the current trend from the historical baseline if no measures are taken to reduce emissions at the landscape level. Here it is assumed that the rate of forestland conversion to other land uses continues at a similar pace as in the past due to lack of interventions;
2) ‘Cacao Extension’ reflecting the current interest of the government and the local population to increase cacao production by extending the cocoa farms in the area. In the Cameroonian Government rural development strategy (SDSR, 2006), it is clearly stated that the government will promote the extension of cocoa farms by more than 50,000 ha from 2010 to 2015. Forest zones in different municipalities are the targets of this expansion plan;
3) ‘Sustainable Forest Management’ involving the implementation of good forest management strategies (like reforestation and reduced impact logging) in production forest, community forest and communal forest; and
4) ‘Sustainable Forest Management and Cacao Extension’ combining the two scenarios with both cocoa extension and sustainable forest management application whereby intensification using input and integration of timber and fruit trees are applied in the cacao plantations and afforestation/reforestation and reduced impact logging practices are applied in forested areas.
Feasibility of emission reductions under various scenarios
� Trade-offs analysis between carbon sequestration and profitability
It was found that cocoa farms with a high yield, stock less carbon which is likely related to the fact that they have a lower density of trees (with less shading) while those with a low yield have a higher density of large trees. Hence tree density in cocoa farms will need to balance both yield and carbon stock.
� Reference emission levels
The RELs were projected from the historic emission. Figure 7 shows the GHG emission potentials (in tCO2e) for the various development scenarios simulated over a 30-year period.
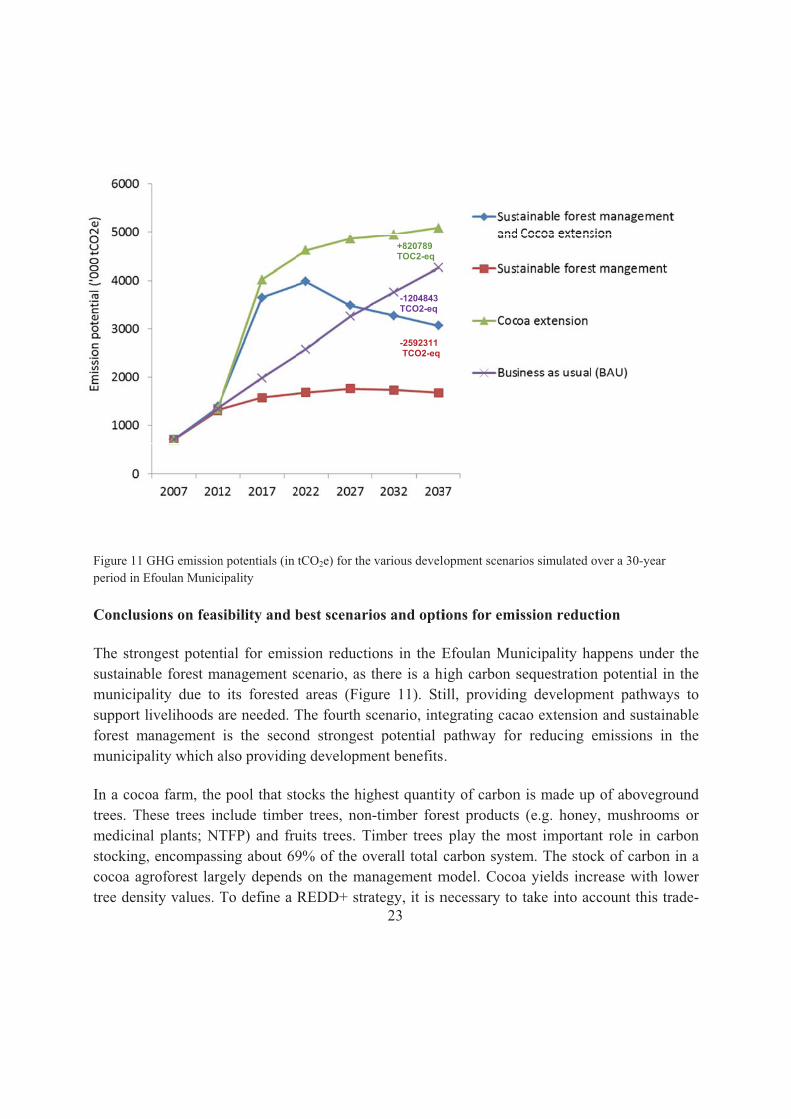
Figure 11 Gperiod in E
Conclusi
The stronsustainabmunicipasupport lforest mmunicipa
In a cocotrees. Thmedicinastocking,cocoa agtree dens
GHG emissionEfoulan Munici
ions on feas
ngest potentble forest maality due to livelihoods a
management ality which a
oa farm, the hese trees inal plants; NT, encompass
groforest largsity values. T
n potentials (in ipality
sibility and b
tial for emisanagement sits forested
are needed. Tis the secon
also providin
pool that stnclude timbeTFP) and frusing about 69gely dependTo define a
tCO2e) for the
best scenari
ssion reductiscenario, as d areas (FigThe fourth snd strongestng developm
tocks the higer trees, nonuits trees. T9% of the o
ds on the maREDD+ stra
23
e various develo
ios and opti
ions in the Ethere is a hi
gure 11). Stiscenario, intet potential p
ment benefits
ghest quantitn-timber foreTimber trees
verall total canagement mategy, it is n
-2592311 TCO2-eq
-1204843 TCO2-eq
+820789 TOC2-eq
opment scenar
ions for emi
Efoulan Muigh carbon sill, providinegrating cacpathway for.
ty of carbonest productsplay the m
carbon systemodel. Coconecessary to
rios simulated o
ission reduc
unicipality hasequestration
ng developmcao extensionr reducing
n is made ups (e.g. honey
most importanem. The stocoa yields inc
take into ac
over a 30-year
ction
appens unden potential i
ment pathwan and sustainemissions in
p of abovegry, mushroomnt role in cack of carbon
crease with lccount this t
r
er the in the ays to nable n the
round ms or arbon n in a lower trade-
24
off and the possibility of orienting interventions towards conservation/enrichment of systems with appropriate timber species in a suitable density. Cocoa farmers could exploit this option to increase their revenues and improve their livelihoods.
The following interventions can therefore, be explored:
� For old cocoa farms, tree density should be regulated (thinning and distance control) considering the main role of big timber trees species as carbon pools.
� Enrich young cocoa farms with timber species with good potential of carbon stock during the development of the system and, if necessary, eliminate some remnant trees in such a way that an optimal density is guaranteed.
� For new cocoa farms, proceed with a selective introduction of associated species with a preference for timber trees species, fruits species and other NTFPs.
Moreover, to increase the yield of the cocoa agroforestry system and its productivity, the following key conditions should be considered:
� Promote cocoa farm intensification through high quality seeds and application of modern techniques (treatment with pesticides and fertilizers, mechanization and regular weeding).
� Facilitate accessibility and availability of these farm inputs. � Provide farmers with effective knowledge on cocoa farming through capacity building of
cocoa farmers.
2.2.2 Feasibility�assessment�in�Tanjabar�District�in�Indonesia�
Adapted from Widayati, al., 2011 (Feasibility Report)
Land use changes between 1990 and 2010
In 2009, the remaining forest cover in the Tanjabar District was approximately 110,872 ha (24% of district area), representing a marked decrease from 316,901 ha in 1990 (Figure 12). Within this area the forest is dominated by lowland to submontane forest (66%) located in the western part of the district towards Bukit Tiga Puluh National Park. The second major forest type in the district is eat forest (22%), including peat swamp forest, located in the northeastern lowland part of the district. The latter is mostly designated as peat forest protection areas (Hutan Lindung Gambut; HLG). Since the establishment of oil palm plantations in the 1990s, such activities have continued to be dominant within the landscape. Large plantations flourished, followed by extensive development of independent smallholder oil palm plantations. Industrial plantations
(mostly Alarge-sca
Figure 12 F
In Tanjab2000s, afpeat protdue to inpalm.
On the oincreasedintercropunproduc
Retrospe
Opportuncould cotCO2e/hademonstr
Acacia) emeale operators
Forest loss in T
bar, abovegrfter which etection foresncreasing enc
other hand, d vegetation pping in dictive/low pro
ective analy
nity cost anaompensate a/yr for 20rates the hig
erged in the.
Tanjabar from
round carboemissions det areas in thcroachment
the amountdensities in
ifferent treeoductivity fa
ysis of oppor
alyses in Taemissions
000–2005 (Fgher emissio
e 2000s, but
1990-2009.
on loss and ecreased, likhe recent yeafor small-sc
t of carbon n different tre-based systarms.
rtunity cost
njabar showamounting Figure 13-F
ons from con25
are more li
related emiskely owing tars there havcale gardens
sequestratioree-based sytems and t
s for emissi
w that a 5 USto 4.49 tC
Figure 15).nversion to l
imited in ex
ssions had tto the minimve been highand cultivat
on has beenystems, increto some ex
ion reductio
SD price of CO2e/ha/yr . The increlower NPV
xtent and are
the highest rmum stock ah rates of emtion of cash
n increasingeased agrofoxtent, aband
on
f carbon in tfor 1990-2
ease of eliland uses (S
e only owne
rates in the available. W
missions probcrops such
g, a reflectioorestry, additdonment of
the global m2000 and igible emisSuyanto et a
ed by
early Within
bably as oil
on of tional f the
market 10.28 ssions al., in
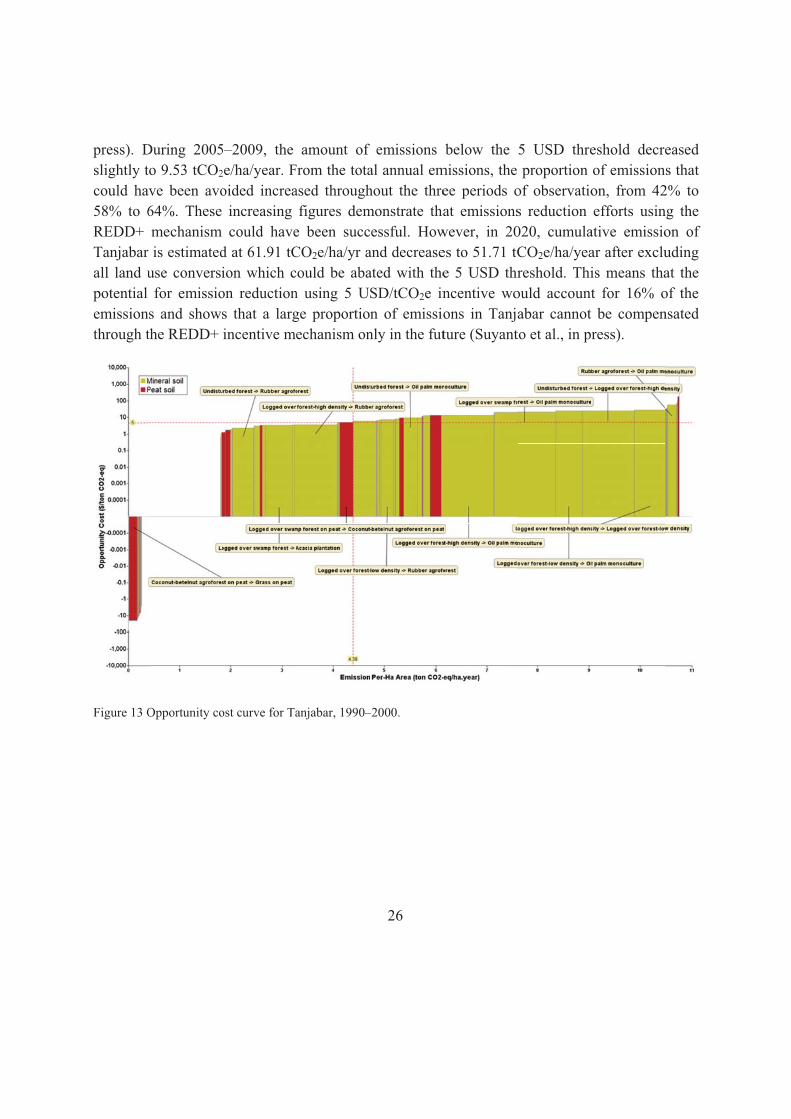
press). Dslightly tcould ha58% to 6REDD+ Tanjabarall land upotential emissionthrough t
Figure 13 O
During 2005to 9.53 tCO2
ave been avo64%. Thesemechanism
r is estimateduse conversifor emissio
ns and showthe REDD+
Opportunity co
5–2009, the 2e/ha/year. Foided increa increasing could have
d at 61.91 tCion which con reductions that a largincentive m
ost curve for Ta
amount of From the totaased throughfigures dem
e been succCO2e/ha/yr acould be aban using 5 Uge proportioechanism on
anjabar, 1990–
26
f emissions al annual emhout the thremonstrate thacessful. Howand decreaseated with theSD/tCO2e inn of emissio
nly in the fut
–2000.
below the missions, the ee periods oat emissions
wever, in 20es to 51.71 tCe 5 USD thrncentive woons in Tanjature (Suyant
5 USD thre proportion of observatios reduction 020, cumulaCO2e/ha/yeareshold. Thi
ould accountabar cannot to et al., in p
eshold decreof emissionon, from 42efforts usin
ative emissioar after excluis means that for 16% obe compen
ress).
eased s that
2% to ng the on of uding at the of the nsated

Figure 14 O
Figure 15 O
Opportunity co
Opportunity co
ost curve for Ta
ost curve for Ta
anjabar, 2000-2
anjabar, 2005-2
27
2005.
2009.
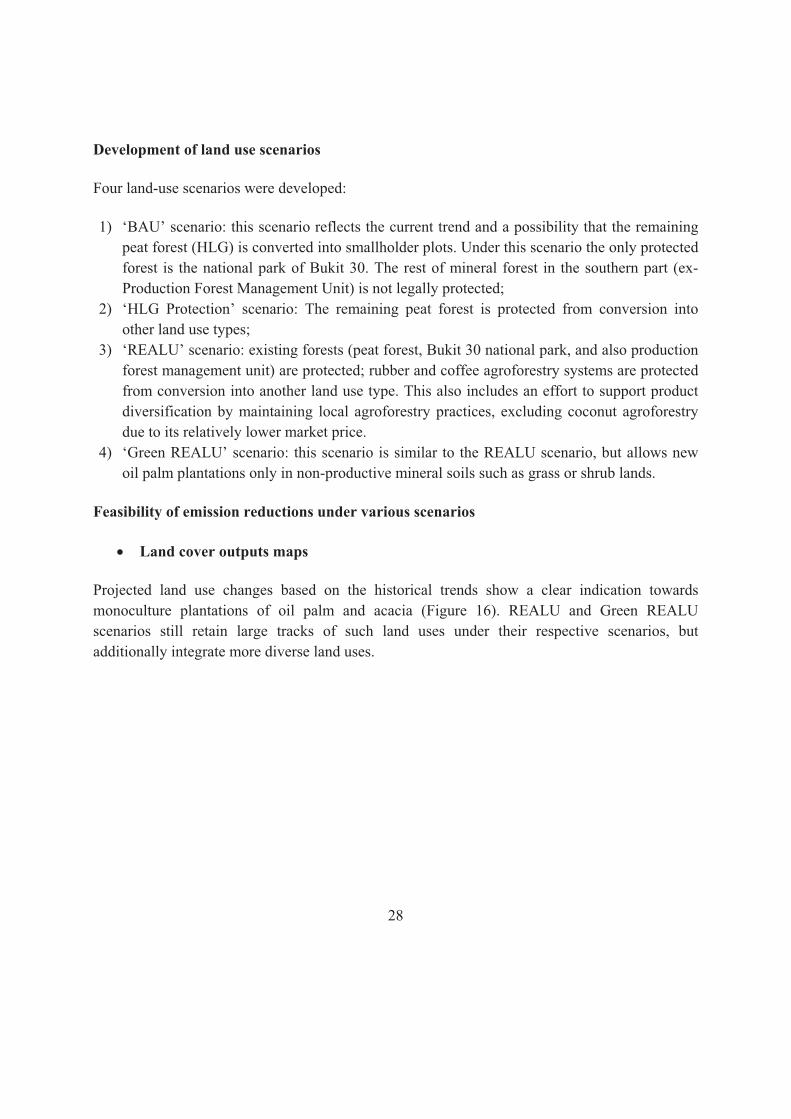
28
Development of land use scenarios
Four land-use scenarios were developed:
1) ‘BAU’ scenario: this scenario reflects the current trend and a possibility that the remaining peat forest (HLG) is converted into smallholder plots. Under this scenario the only protected forest is the national park of Bukit 30. The rest of mineral forest in the southern part (ex-Production Forest Management Unit) is not legally protected;
2) ‘HLG Protection’ scenario: The remaining peat forest is protected from conversion into other land use types;
3) ‘REALU’ scenario: existing forests (peat forest, Bukit 30 national park, and also production forest management unit) are protected; rubber and coffee agroforestry systems are protected from conversion into another land use type. This also includes an effort to support product diversification by maintaining local agroforestry practices, excluding coconut agroforestry due to its relatively lower market price.
4) ‘Green REALU’ scenario: this scenario is similar to the REALU scenario, but allows new oil palm plantations only in non-productive mineral soils such as grass or shrub lands.
Feasibility of emission reductions under various scenarios
� Land cover outputs maps
Projected land use changes based on the historical trends show a clear indication towards monoculture plantations of oil palm and acacia (Figure 16). REALU and Green REALU scenarios still retain large tracks of such land uses under their respective scenarios, but additionally integrate more diverse land uses.
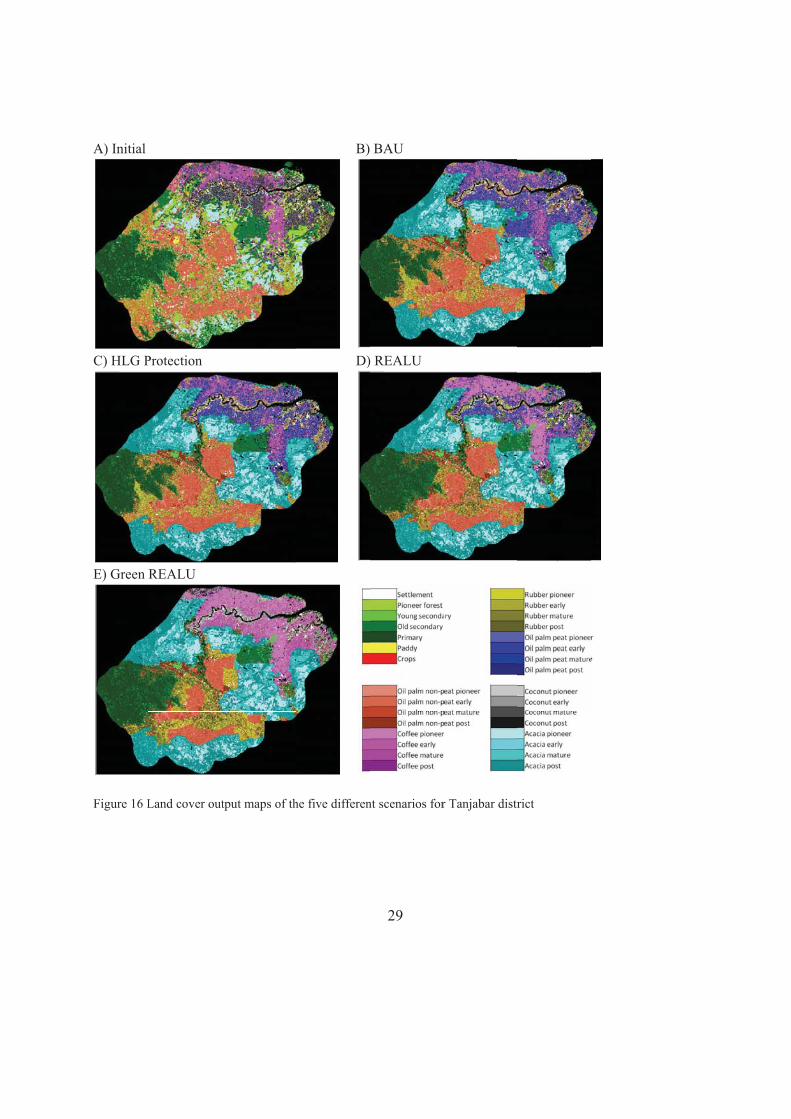
A) Initial
C) HLG P
E) Green
Figure 16 L
Protection
REALU
Land cover outtput maps of th
B)
D)
he five differen
29
BAU
) REALU
nt scenarios forr Tanjabar distrrict
30
� Trade-off analysis between carbon sequestration and profitability
In terms of the trade-offs between carbon sequestration and profitability for the land-use scenarios, they all result in a lower income per capita compared to the BAU. On the other hand, higher carbon stocks are obtained mainly through conserving larger forest areas (i.e. the remaining peat forest, area of Bukit 30 national park and ex-production forest management unit). In the Green REALU, protection of old rubber systems contributes to increasing carbon stocks.
Figure 17 Impact of each scenario application relative to the BAU scenario on standing carbon stock in the landscape (106 tCO2e) and economic impact by income (USD per capita) averaged over the 30-year simulation period in Tanjabar district
From the economic perspective however, there is a clear reduction of income when going from the HLG Protection to the Green REALU scenario. The decrease of income is well correlated with the percentage of oil palm area in the landscape, indicating that income from oil palm plantations largely determines total income at the district level. Therefore, there are two possible ways for reducing the potential income loss due to the conservation programs. First, getting compensation from external sources such as rewards for the carbon storage achieved and the level of carbon emissions avoided and second, introducing new technologies for managing agricultural crop lands in a less carbon intensive way and/or promotion of new profitable commodities which allow for the preservation of forest and more environment-friendly land uses.
-300
-250
-200
-150
-100
-50
00 1 2 3 4
� In
com
e (U
SD p
erca
pita
yea
r-1)
� C stock (106 ton CO2 eq.)
BAU
HLG Protection
REALU
Green REALU
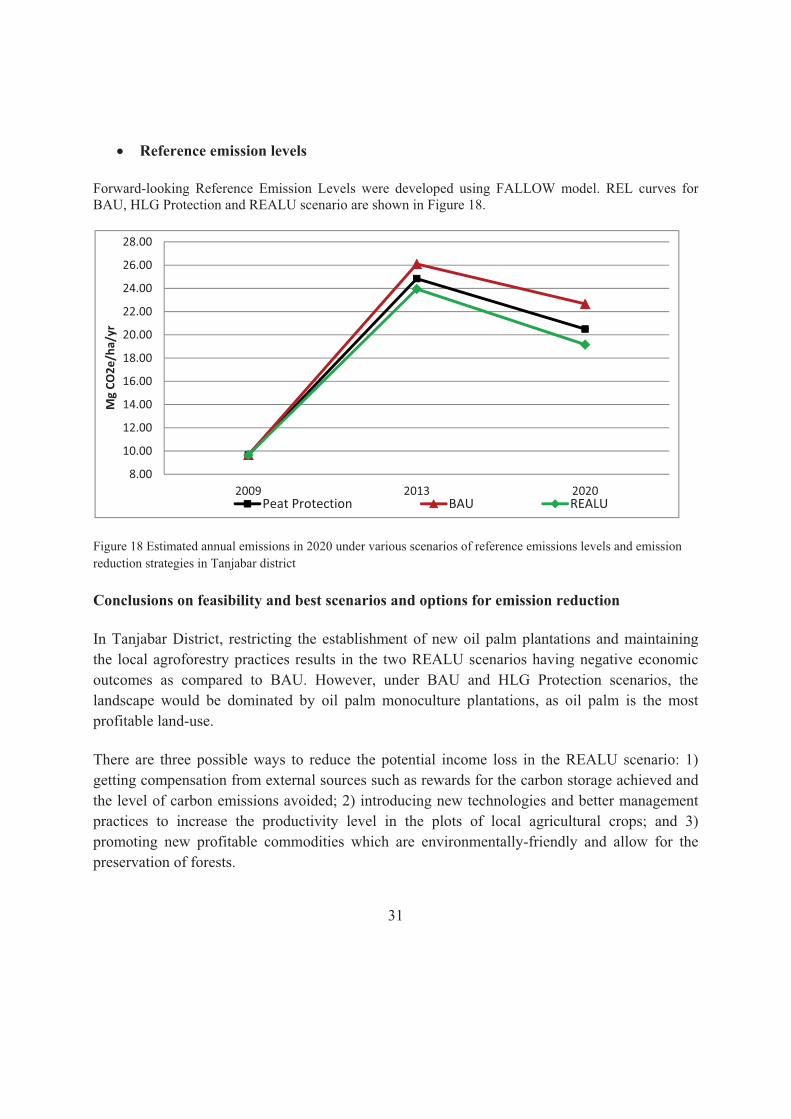
31
� Reference emission levels
Forward-looking Reference Emission Levels were developed using FALLOW model. REL curves for BAU, HLG Protection and REALU scenario are shown in Figure 18.
Figure 18 Estimated annual emissions in 2020 under various scenarios of reference emissions levels and emission reduction strategies in Tanjabar district
Conclusions on feasibility and best scenarios and options for emission reduction
In Tanjabar District, restricting the establishment of new oil palm plantations and maintaining the local agroforestry practices results in the two REALU scenarios having negative economic outcomes as compared to BAU. However, under BAU and HLG Protection scenarios, the landscape would be dominated by oil palm monoculture plantations, as oil palm is the most profitable land-use.
There are three possible ways to reduce the potential income loss in the REALU scenario: 1) getting compensation from external sources such as rewards for the carbon storage achieved and the level of carbon emissions avoided; 2) introducing new technologies and better management practices to increase the productivity level in the plots of local agricultural crops; and 3) promoting new profitable commodities which are environmentally-friendly and allow for the preservation of forests.
8.00
10.00
12.00
14.00
16.00
18.00
20.00
22.00
24.00
26.00
28.00
2009 2013 2020
Mg
CO2e
/ha/
yr
Peat Protection BAU REALU
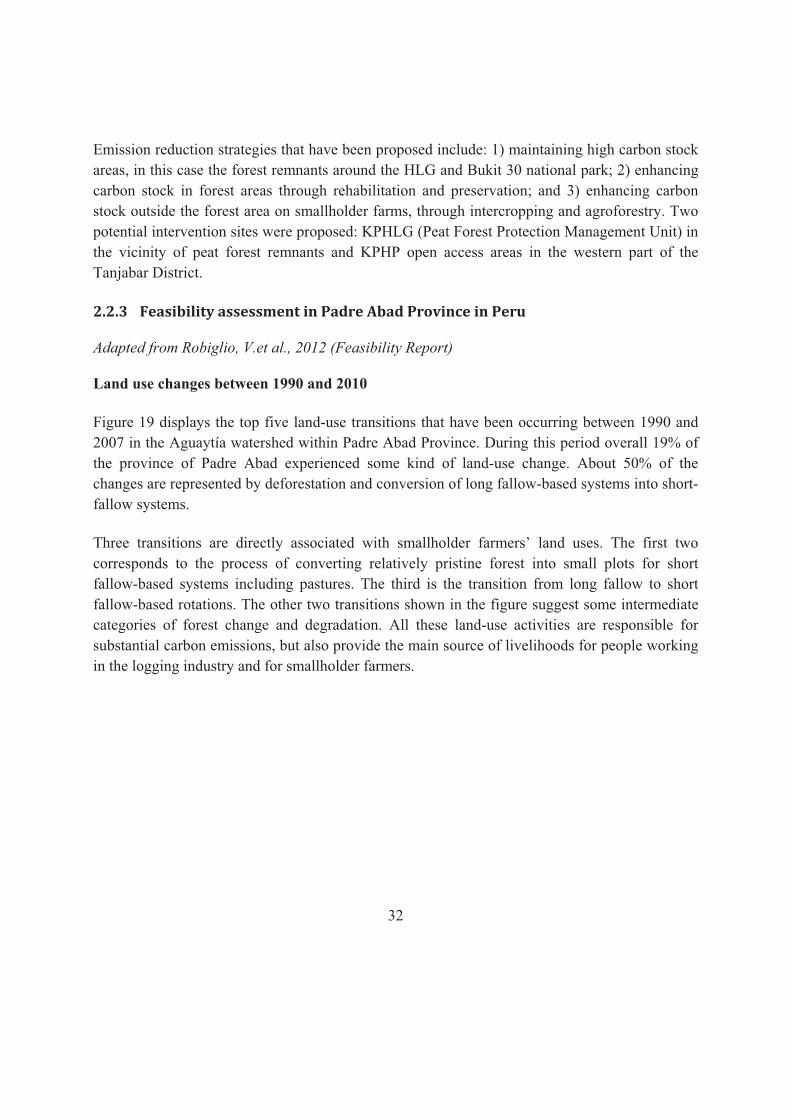
32
Emission reduction strategies that have been proposed include: 1) maintaining high carbon stock areas, in this case the forest remnants around the HLG and Bukit 30 national park; 2) enhancing carbon stock in forest areas through rehabilitation and preservation; and 3) enhancing carbon stock outside the forest area on smallholder farms, through intercropping and agroforestry. Two potential intervention sites were proposed: KPHLG (Peat Forest Protection Management Unit) in the vicinity of peat forest remnants and KPHP open access areas in the western part of the Tanjabar District.
2.2.3 Feasibility�assessment�in�Padre�Abad�Province�in�Peru�
Adapted from Robiglio, V.et al., 2012 (Feasibility Report)
Land use changes between 1990 and 2010
Figure 19 displays the top five land-use transitions that have been occurring between 1990 and 2007 in the Aguaytía watershed within Padre Abad Province. During this period overall 19% of the province of Padre Abad experienced some kind of land-use change. About 50% of the changes are represented by deforestation and conversion of long fallow-based systems into short-fallow systems.
Three transitions are directly associated with smallholder farmers’ land uses. The first two corresponds to the process of converting relatively pristine forest into small plots for short fallow-based systems including pastures. The third is the transition from long fallow to short fallow-based rotations. The other two transitions shown in the figure suggest some intermediate categories of forest change and degradation. All these land-use activities are responsible for substantial carbon emissions, but also provide the main source of livelihoods for people working in the logging industry and for smallholder farmers.
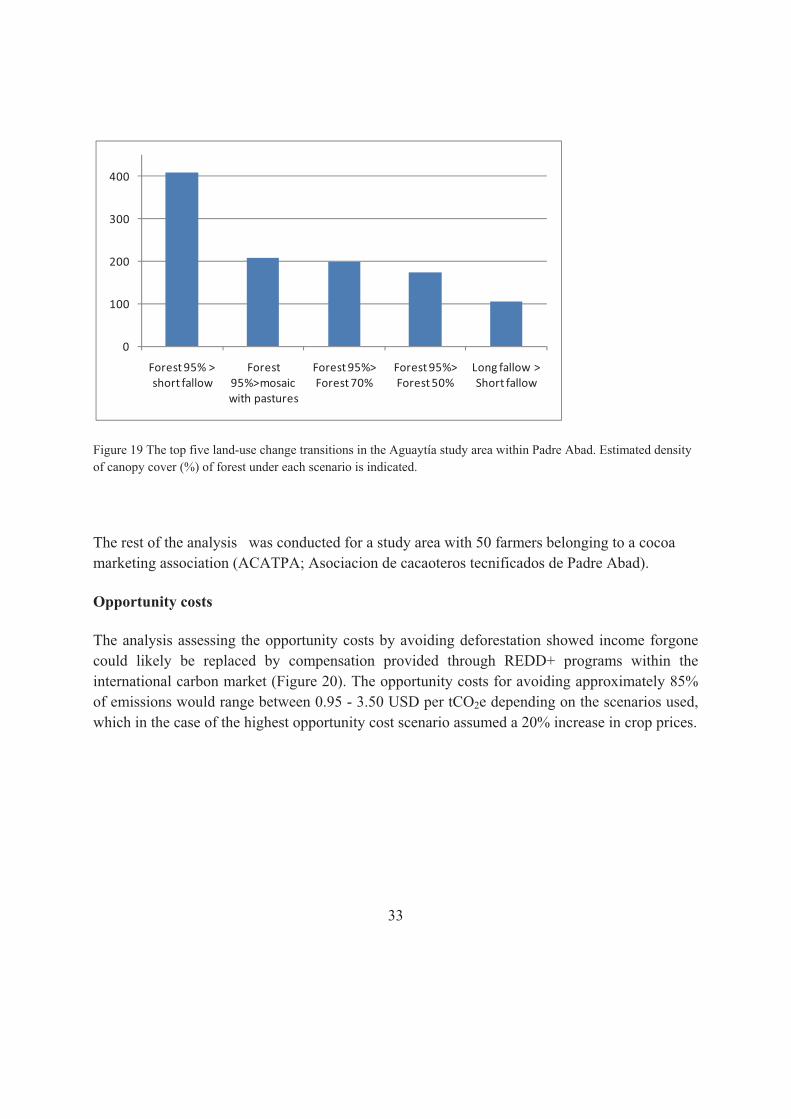
33
Figure 19 The top five land-use change transitions in the Aguaytía study area within Padre Abad. Estimated density of canopy cover (%) of forest under each scenario is indicated.
The rest of the analysis was conducted for a study area with 50 farmers belonging to a cocoa marketing association (ACATPA; Asociacion de cacaoteros tecnificados de Padre Abad).
Opportunity costs
The analysis assessing the opportunity costs by avoiding deforestation showed income forgone could likely be replaced by compensation provided through REDD+ programs within the international carbon market (Figure 20). The opportunity costs for avoiding approximately 85% of emissions would range between 0.95 - 3.50 USD per tCO2e depending on the scenarios used, which in the case of the highest opportunity cost scenario assumed a 20% increase in crop prices.
0
100
200
300
400
Forest 95% > short fallow
Forest 95%>mosaic with pastures
Forest 95%> Forest 70%
Forest 95%> Forest 50%
Long fallow > Short fallow
Figure 20 baseline sc
Developm
Four diff
1) A2) A
ch3) ‘B
ensu
4) ‘Rd
Opportunity ccenario in ACA
ment of lan
ferent land u
An historical A ‘BAU Dechanges in fuBAU-ADef’nrichment aurface is alloREALU’ inveforestation
costs of simpleATPA study sit
d use scena
use scenarios
baseline (‘Bclared’ base
uture degrada scenario fo
and avoidedocated to forvolving the(part of the
e land use syste
rios
were develo
Baseline’), baeline, similaration. ocusing on imd establishmrest conserva improvemeforest is allo
34
stems from a
oped:
ased upon thr to the hist
mproving cament of cocoation) ent of carboocated to con
private perspe
he prior five-torical basel
arbon stock oa over the
on stock innservation).
ective (15% di
-year land usline, but tak
in cocoa fare forest land
n all land u
iscount rate) f
se patterns king into acc
rms through d (correspon
uses and red
for the
count
trees nding
duced

35
Feasibility of emission reductions under various scenarios
� Trade-offs analysis between carbon sequestration and profitability
Land uses in the area of Padre Abad are located along a trade-off arc (green line) in Figure 21 ranging from high profitability - low carbon stock such as agricultural and ranching land uses, to low profitability - high carbon stock, exemplified by forest land uses. A few points in the lower left corner (red circle) represent low levels of profit and carbon, such as pasture systems. Converting these low carbon - low profit lands into more profitable and carbon-rich lands does not represent a trade-off, but a win-win result according to economic and environment criteria. Consequently, converting this land use could be considered a synergy between carbon and profits and could be a REDD+/REALU policy priority.
Figure 21 NPV and carbon stocks for the varying land use types in Padre Abad. The green-arced dotted line represents a trade-off trajectory between NPV and carbon stocks for the different land use types. The red circle represents land uses with both low NPV and low carbon stocks indicating the any improvement in land use in these areas could result in win-win outcomes.
� Reference emission levels
The four scenarios were compared over a 30-year period projecting each scenario’s potential carbon emissions (Figure 22).
Dense forest (95% canopy)
Selective logged forest (80%
canopy)
Logged forest (65% canopy)
Agriculture 8yr fallow
Agriculture 4yr fallow
Oil palm
Cocoa
Improved pastures
Degraded pastures
-50
0
50
100
150
200
250
300
0 50 100 150 200 250 300Priv
ate
pers
pect
ive
prof
its (N
PV, $
/ha)
Above-ground Carbon (tC/ha)

36
Figure 22 Projected emissions for the four scenarios over a 30-year period in ACATPA study site
Conclusions on feasibility and best scenarios and options for emission reduction
REALU is the only scenario resulting in net emission reduction over this time period. A series of options were evaluated and discussed in ACATPA farmer focus groups to identify possible schemes to enhance carbon stock over their landscapes and access carbon credits systems as compensation for their shift in land use. Cocoa was identified to be a good starting point, but a household approach accounting for the whole land use portfolio has a greater potential for increased carbon payments for smallholders. The amount of Verified Emission Reductions (VERs) to be sold will be determined by the carbon differential among the trajectories of the different land uses and the commitment the farmers are willing to fulfil in adopting richer carbon systems and practices.
Under such a scheme, a series of management options were presented to the farmers where low carbon land use systems are converted to high carbon production systems. Table 2 shows the current land uses of the farms, the carbon enriched land uses and the requisites for their conversion or adoption.
-100-80-60-40-20
020406080
100
2010 2015 2020 2025 2030 2035 2040
baseline BAU declared BAU-ADef _Cacao improved REALU
tCO
2e
(tho
usan
d)

Table 2 C
Land u
Cocoa
Pastures
Forest
Fallow
The farmsystems wis an exaland uses
Figure 23 within thei
The farmcooperatidifferent critical m
Current land
se Car
Car
s Silv
Con
Enr
mers had thewith more c
ample of a 26s.
Sketch of the ir farm.
mer would sigive will plafarms and a
mass needed
d uses, altern
rbon rich la
rbon enriche
vopastures
nservation fo
riched fallow
e possibilityarbon and h6 ha farm w
current land u
gn a contracay the role add up all tto be able to
ative land us
and use
d cocoa
orest
w
y to decide how much of
where the farm
use portfolio o
ct with the Aof administhe carbon c
o cover the tr
37
ses and requ
RequisitMinimumcomposiMinimumcomposiNo defoforest (inFallow etrees, mi
how much of their forest mer commit
f the farm and
ACATPA coorator and m
credits from ransaction co
uisites for con
tes m of 200 treition of timbm of 300 treition of timborestation nncrease of stenriched witinimum 200
of their landthey were w
tted portions
d farmer’s com
operative to manager of
different lanosts of the p
nversion
ees per ha wber trees ees per ha w
ber trees nor degradattock) th high den
0 trees per ha
d they wantwilling to pres of his farm
mmitment to in
fulfil this agthe VERs cnd uses in o
process.
with a 50%
with a 50%
tion of the
sity timber a
ted to conveeserve. Figu
m to carbon r
ncrease carbon
greement ancoming fromorder to hav
ert to ure 23 richer
n stock
nd the m the ve the
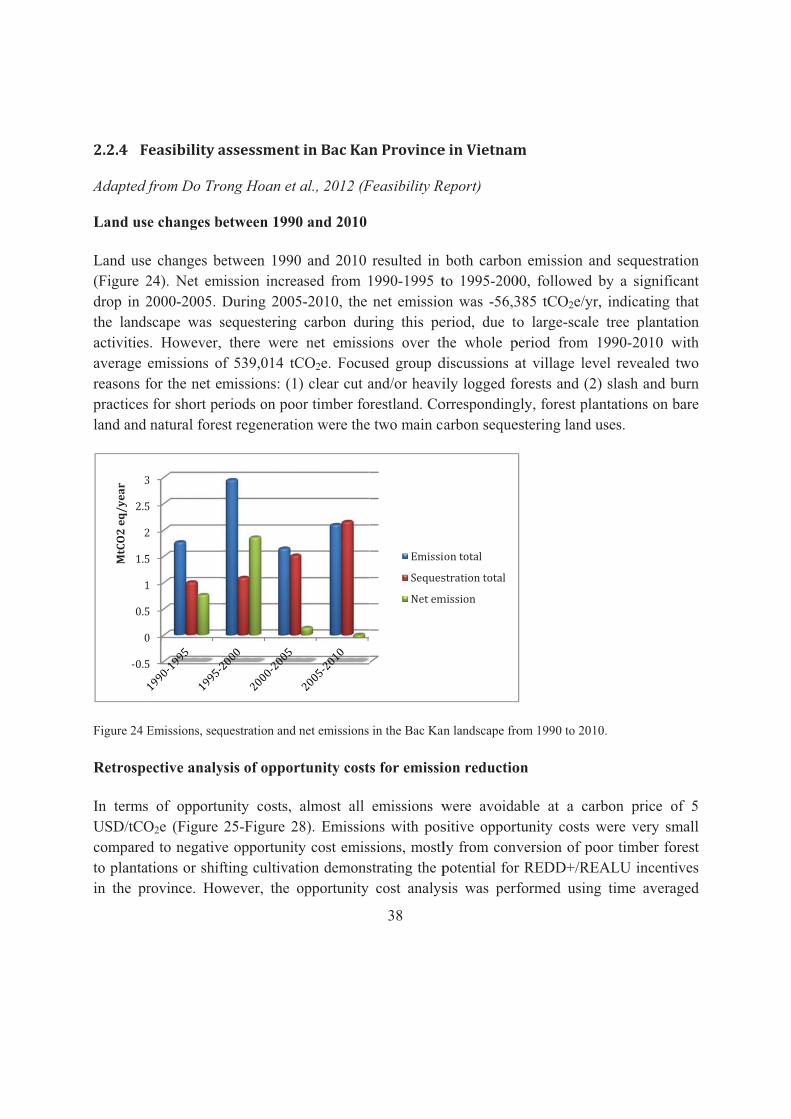
2.2.4 F
Adapted f
Land use
Land use(Figure 2drop in 2the landsactivitiesaverage reasons fpracticesland and
Figure 24 E
Retrospe
In termsUSD/tCOcomparedto plantain the pr
����
�
���
�
���
�
���
MtCO2�eq/year
easibility�a
from Do Tro
e changes b
e changes be24). Net em2000-2005. scape was ss. However, emissions ofor the net e for short penatural fore
Emissions, seq
ective analy
of opportuO2e (Figure d to negativ
ations or shifrovince. Ho
�
�
�
�
�
�
�
assessment
ong Hoan et
between 199
etween 1990mission incre
During 2005sequestering
there weref 539,014 tCmissions: (1
eriods on poost regenerati
questration and
ysis of oppor
unity costs, 25-Figure 2e opportunitfting cultivatwever, the
t�in�Bac�Kan
t al., 2012 (F
0 and 2010
0 and 2010 eased from 15-2010, the
g carbon dure net emissiCO2e. Focus1) clear cut aor timber foion were the
d net emissions
rtunity cost
almost all 28). Emissioty cost emistion demonsopportunity
38
n�Province
Feasibility R
resulted in1990-1995 tnet emissio
ring this peions over thsed group dand/or heavirestland. Co
e two main c
in the Bac Kan
s for emissi
emissions wons with possions, mostl
strating the pcost analys
�� �
�����
������
e�in�Vietnam
eport)
both carbonto 1995-200on was -56,3eriod, due tohe whole p
discussions aily logged foorrespondingarbon seque
n landscape fro
ion reductio
were avoidasitive opportly from convpotential forsis was perf
��������
�������������
�� ���
m�
n emission a00, followed385 tCO2e/yo large-scal
period from at village leorests and (2gly, forest plestering land
om 1990 to 20
on
able at a catunity costs version of pr REDD+/REformed usin
and sequestrd by a signifyr, indicatingle tree plant
1990-2010 vel revealed2) slash and lantations onuses.
10.
arbon price were very
poor timber fEALU incenng time aver
ration ficant g that tation with
d two d burn n bare
of 5 small forest ntives raged
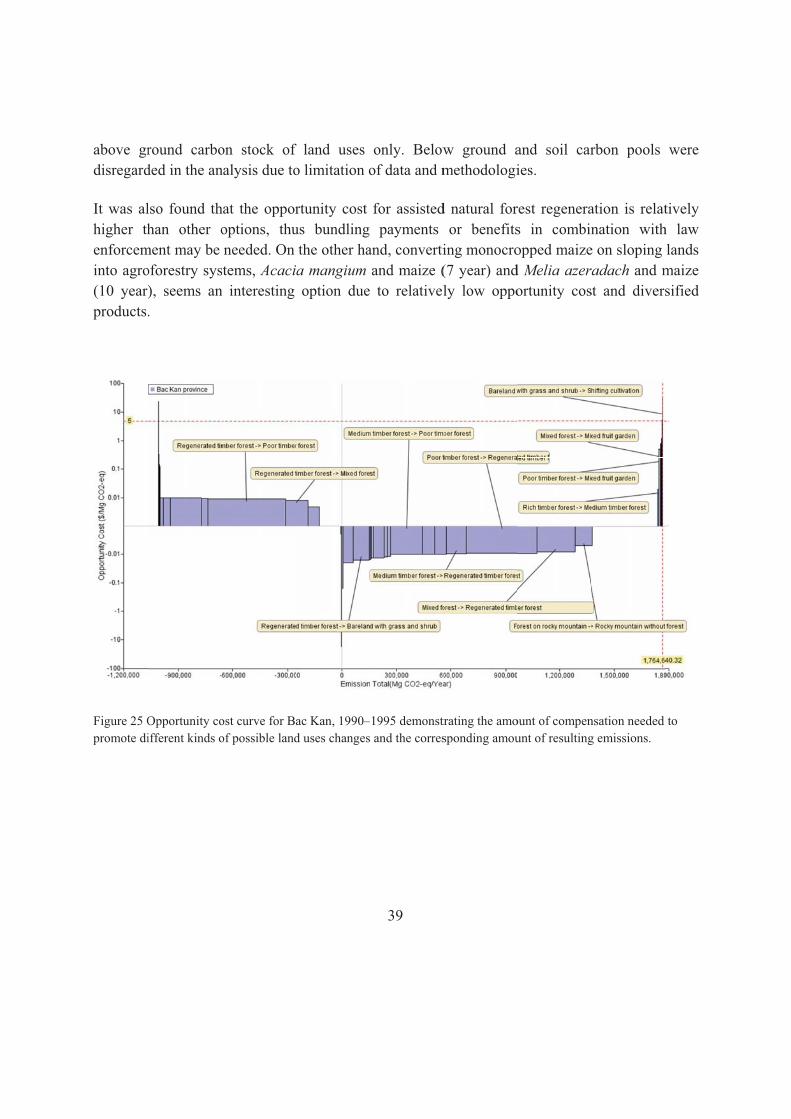
above grdisregard
It was alhigher thenforceminto agro(10 year)products
Figure 25 Opromote di
round carboded in the an
lso found thhan other o
ment may be oforestry sys), seems an.
Opportunity coifferent kinds o
on stock of nalysis due to
hat the opporoptions, thuneeded. On
stems, Acacin interesting
ost curve for Bof possible land
f land uses o limitation o
rtunity cost us bundlingthe other ha
ia mangiumoption due
ac Kan, 1990–d uses changes
39
only. Belowof data and m
for assisted payments
and, convertiand maize (
e to relativel
–1995 demonstrs and the corres
w ground amethodologi
d natural foror benefits
ing monocro(7 year) andly low oppo
trating the amosponding amou
and soil caries.
rest regeneras in combinopped maized Melia azerortunity cos
ount of compenunt of resulting
rbon pools
ation is relatnation with
e on sloping radach and mst and divers
nsation needed g emissions.
were
tively h law lands
maize sified
to
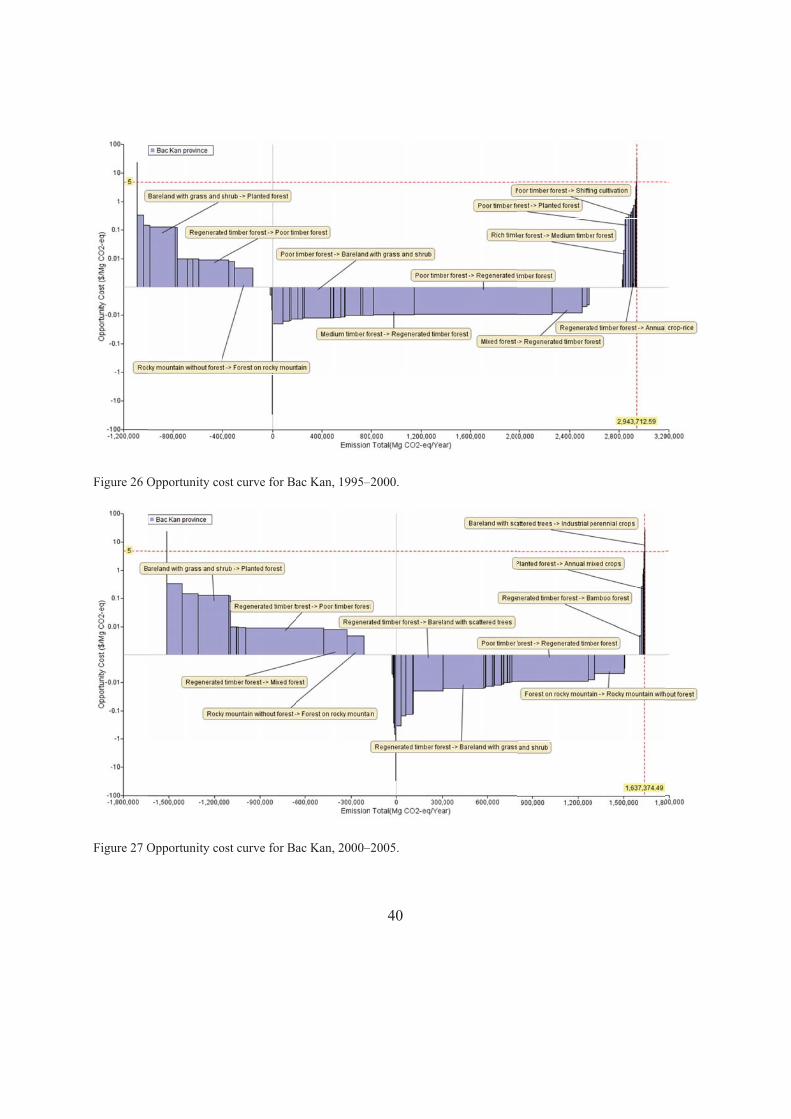
Figure 26 O
Figure 27 O
Opportunity co
Opportunity co
ost curve for B
ost curve for B
ac Kan, 1995–
ac Kan, 2000–
40
–2000.
–2005.

Figure 28 O
Developm
Five scen
1) ‘BA2) ‘Aca3) ‘Cro4) ‘RE
whil5) ‘RE
smalagro
Opportunity co
ment of lan
narios were d
AU’ with freeacia Forest op Expansio
EDD+’ wherele illegal log
EALU’ stimullholder aca
oforestry sys
ost curve for B
d use scena
developed:
e competitionExpansion’on’ where sue bare lands
gging will beulating a situcia plantatiotem.
ac Kan, 2005–
rios
n of all land where subs
ubsidies are and speciall
e completelyuation whereons, and tree
41
–2010.
uses based oidies are givgiven to smaly used fores stopped; an
e unused landes introduce
on economicven to smallhallholders fost will be pl
nd ds outside fod in agricul
c profit; holders for for annual croanted with f
orest areas altural croplan
forest plantatops; forest tree sp
are convertednds as part
tions;
pecies
d into of an
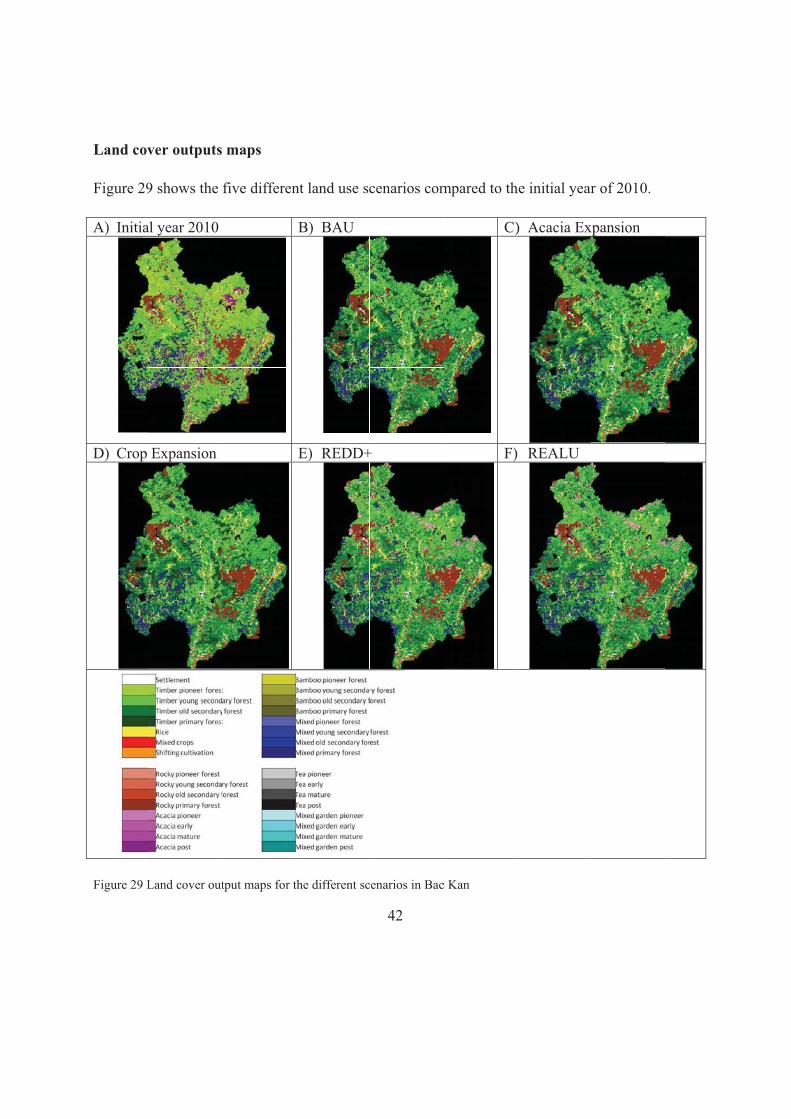
Land cov
Figure 29
A) Initia
D) Crop
Figure 29 L
ver outputs
9 shows the
al year 2010
Expansion
Land cover out
maps
five differen
tput maps for t
nt land use sc
B) BAU
E) REDD+
the different sc
42
cenarios com
+
cenarios in Bac
mpared to th
C)
F)
c Kan
he initial year
) Acacia Ex
REALU
r of 2010.
xpansion
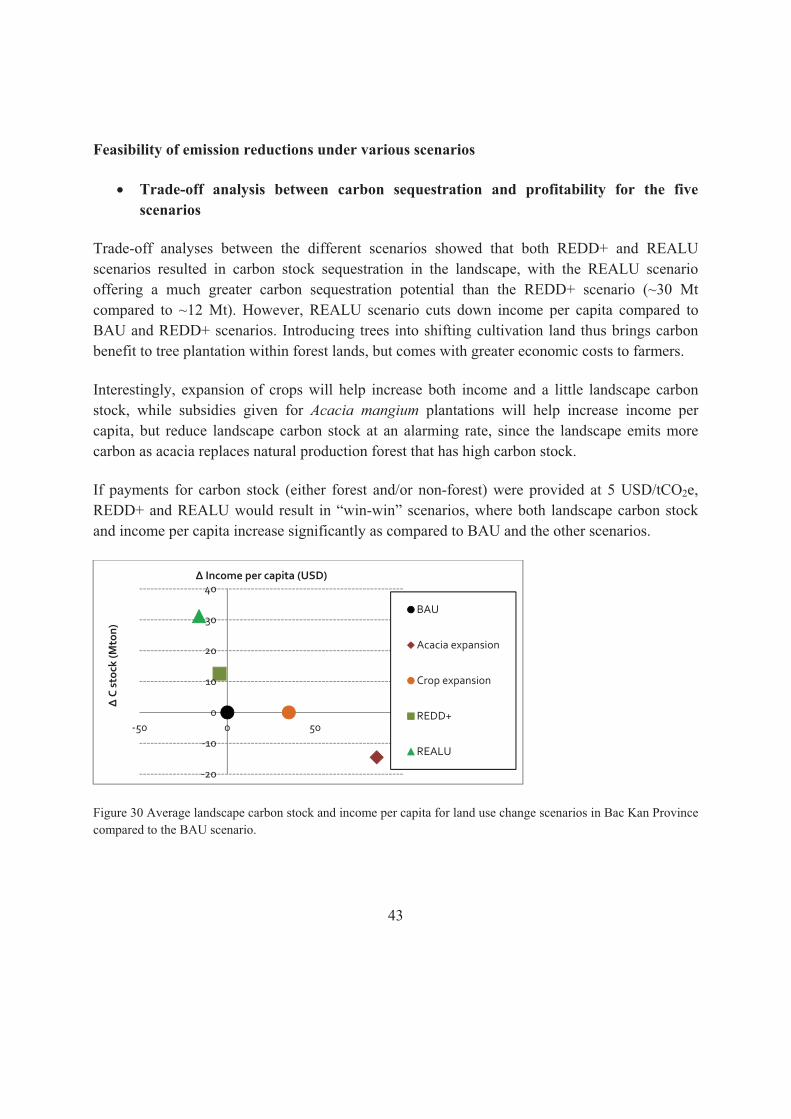
43
Feasibility of emission reductions under various scenarios
� Trade-off analysis between carbon sequestration and profitability for the five scenarios
Trade-off analyses between the different scenarios showed that both REDD+ and REALU scenarios resulted in carbon stock sequestration in the landscape, with the REALU scenario offering a much greater carbon sequestration potential than the REDD+ scenario (~30 Mt compared to ~12 Mt). However, REALU scenario cuts down income per capita compared to BAU and REDD+ scenarios. Introducing trees into shifting cultivation land thus brings carbon benefit to tree plantation within forest lands, but comes with greater economic costs to farmers.
Interestingly, expansion of crops will help increase both income and a little landscape carbon stock, while subsidies given for Acacia mangium plantations will help increase income per capita, but reduce landscape carbon stock at an alarming rate, since the landscape emits more carbon as acacia replaces natural production forest that has high carbon stock.
If payments for carbon stock (either forest and/or non-forest) were provided at 5 USD/tCO2e, REDD+ and REALU would result in “win-win” scenarios, where both landscape carbon stock and income per capita increase significantly as compared to BAU and the other scenarios.
Figure 30 Average landscape carbon stock and income per capita for land use change scenarios in Bac Kan Province compared to the BAU scenario.
-20
-10
0
10
20
30
40
-50 0 50 100
�C
stoc
k (M
ton)
� Income per capita (USD)
BAU
Acacia expansion
Crop expansion
REDD+
REALU
44
� Reference emission levels
Reference Emission Levels (RELs) for REDD+ and REALU in Bac Kan were estimated using both historical trends and forward-looking trends. Historical REL was developed using activity data from 1990 to 2010. Since 99.97% of landscape carbon emissions were from the forest sector, historical REDD+’s REL and REALU’s REL of Bac Kan are identical. Forward looking REL calculated using the FALLOW model was found more appropriate to design emission reduction strategies. Following the forward-looking REL, the REDD+ scenario will contribute only 29% (1.82 MtC/6.37 MtC) carbon stock enhancement in the landscape. Therefore, emission reduction strategies should not only look at forestlands, but also other land uses.
Conclusions on feasibility and best scenarios and options for emission reduction
REALU will be feasible in Bac Kan Province if:
1. An incentive mechanism is in place to compensate for income loss from production. 2. A landscape approach to carbon accounting is applied. 3. A forward looking REL is used for carbon credit calculation. 4. Carbon rich land use practices such as agroforestry is widely promoted and incorporated
in major development plans in the province.
If the province adopts REALU as its emissions reduction strategy, at least two following land use pathways should be considered:
� Enhancement of forest carbon stock (under both REDD+ and REALU) including activities such as planting forest tree species in forest areas and assisting with natural forest regeneration.
� Maintenance and enhancement of carbon rich land uses (under REALU, but not necessarily under REDD+) including promotion of high carbon stock land covers such as forest, agroforestry systems and other sustainable land use practices that aims at enhancing carbon stock (and, as much as possible, improving livelihoods). One such practice would involve introducing xoan (local name of Melia azedarach) onto slope land maize monocropping under the REALU scenario.

45
III POTENTIAL�FOR�EMISSION�REDUCTION�THROUGH�PEATLAND�MANAGEMENT�
This chapter focuses on the second pillar of REALU, i.e. REPeat, and stresses the importance of peatlands, the largest terrestrial long-term sink of atmospheric carbon accounting for twice as much carbon as the biomass of the world’s forests. Over the past 10,000 years, peatlands have absorbed around 1.2 tCO2, with a net cooling effect on the earth climate. Here studies completed in each REALU country are presented to further understand functions and emission reduction potentials within peatlands occurring in tropical ecosystems.
3.1 Importance�of�peatlands�as�major�carbon�pool�
Adapted from Tchienkoua, M. et al., 2011 (Peatland Report)
Peatlands are wetland ecosystems characterized by the accumulation of organic matter under cold and/or anaerobic conditions. They play a vital role in biosphere biogeochemical processes and their potential effect on global environmental change (Immirzi et al., 1992). Because they are estimated to actually represent between 25-30% of all terrestrial carbon, they are of growing concern in the global arena of international environment conventions, namely the deliberations of the UNFCCC and the Convention on Biological Diversity. The UNFCCC is primarily concerned with the implications of peatland loss and its impact on the global GHG emissions, as well as in possible mitigation and adaptation options.
Peatlands ecosystems have been comprehensively investigated in boreal zones, but in contrast there is limited data about such ecosystems within tropical areas. Tropical forest peatlands are essential terrestrial carbon pools with diverse direct environmental functions including water regulation, protection from natural geomorphic processes, and mitigation from flood and macroclimate stabilization (Page et al., 2006; Page et al., 2004; Rieley et al., 2008). They also provide diversity in terms of plant communities, wildlife, hydrological functions and many other environmental dimensions.
Since 1994, there has been a strong international effort to develop awareness around the importance and use of peatland resources. Today, with growing population and urbanization, these resources are endangered in front of expanding agricultural frontiers, illegal logging and poor management. In many tropical countries, controls and regulations on peatland resources have not yet been put in place due to the absence of essential information about their value and
46
characterisation. Therefore their inventory and evaluation appears essential for formulating a national peatland policy.
3.2 Characterization�of�peatlands�in�the�upper�Nyong�River�basin,�Central�Southern�Cameroon�
Adapted from Tchienkoua M. et al., 2011 (Peatland Report)
This section provides information on carbon storage potentials of terrestrial peatlands in the upper part of the Nyong watershed (Central Cameroon), called the Ayos-Abong-Mbang peatlands and reports on peatland physicochemical characteristics, current use and prospects for sustainable use in the future, in order to support decision-making processes for integrated landscape planning and management options essential for balancing future demand for peatland resources and environmental concerns.
Peatland physicochemical characteristics and carbon storage potentials
The upper part of the Nyong watershed is characterized by relatively flat topography and extensive marshy land. The mapping process identified three mapping units differentiated by their hydrological characteristics, floodplains with grass (FPG), floodplains with swampy forest (FPF), and Nyong river tributaries with swampy forest (FRT). The study indicates that the soil carbon component of the Ayos-Abong-Mbang peatlands is an important carbon sink storing between 143.9 and 841.6 tC/ha. This represents between two and five times the average amount carbon stored in well-drained soils. Furthermore, this pool corresponds only to a fraction of the actual carbon storage since the study was confined to the 0-150 cm depth and did not account for any of the above ground stock of the swamp forests. The swampy forest is typified by Sterculia subveola and Raphia lookeri species. Mean thickness of peat horizons ranged from 20 cm to 300 cm increasing in the order of FPF�FRT>FPG. Mean carbon stocks at 1.3 m depth was highest in FPG (470.9 tC) and FRT (446.1 tC) with values being at least 4 times the values found in well drained soils. The lowest value was under FPF (262.1 tC). Peats that occurred in FPG were two-layered with a hemic O layer darkened by recurrent bush fire. It was generally overlying sapric clayey substrata. Peats in FPF and FRT were water saturated all year round and exhibited fibric materials with bulk densities between 0.03 and 0.40 g/cm3. The coefficient of variation of carbon stock within mapping units was high, ranging from 40% in FRT to 72.9% in FPF, indicating a greater heterogeneity imposed by hydrological and pedological attributes.
47
Current use and prospects for sustainable use in the future
In contrary to southeast Asian peatlands which are being rapidly converted into production systems for lucrative agribusiness purposes (Murdiyarso et al., 2010), the studied peatlands are undeveloped because of the low commercial value of dominant species, mainly Sterculia subviolacea and Raphia lookeri, and the low pressure on soil resources.
However, regional development strategies must be designed for preserving the sensitive ecosystems by putting in place management mechanisms that balance future demands on the resources and environmental preservation. To this extent, the potential of these peatlands for agricultural production is variable. In the floodplain where the soils are submerged under water for at least three months in the year, suitable agricultural systems that may conserve environmental benefits need to be implemented. Land use systems such as wetland rice will probably enhance carbon stocks while at the same time improving the economic livelihoods of local peoples. The floodplain under grassland covers about 6,127 ha that could be allocated to rice cultivation with irrigation schemes that could help reduce organic matter oxidation. Such a management scheme should be integrated into regional land use and socio-economic development planning on the basis of all stakeholders. It is also hoped that carbon markets may provide an opportunity for peat swamp forest conservation to generate income for local communities. This could put an economic value on these continental peat swamp forests and their globally important carbon stores by providing incentives for their protection. The FPF and FRT landscapes extending over roughly 70,000 ha offer great opportunities protection of endemic plant species, improvement of livelihoods and successful intervention for creating a carbon rich environment.
3.3 Characterization�of�CO2�emissions�in�peatlands�in�Indonesia�
3.3.1 Spatial�variation�of�water�table�depth�and�CO2�emission�from�a�peat�soil�in�Indonesia�
Adapted from Fahmuddin Agus et al., 2011 (Peatland Report)
Peatland in Indonesia covers an area of about 20 million ha or approximately 10% of Indonesia's land area, mostly found in the three major islands, namely Sumatra, Kalimantan and Papua. Peatsoil has a very high carbon stock which is conserved under natural conditions, but is easily emitted under open and drained states. Disturbed peatlands which have been cleared and/or drained is considered one of the highest contributors of CO2 emissions. The most likely determining factor for CO2 emissions is the depth of water table and peat water content. Both are related to the volume of unsaturated peat; the portion more easily decomposed by aerobic
48
micro-organisms. A clear fitted relationship between water table depth and CO2 emissions is still lacking requiring further field measurements and research to better understand such processes. This calls for more intensive measurements in different land cover areas with different levels of peat maturity.
This study measured CO2 emissions in relatively mature peat (sapric and hemic maturity) under rubber plantations with a 3 m drainage canal varying in water level from -0.7 to -2 m, depending on the season. The study captures the late rainy season (March-May 2011) with moderate water table depth within the said range. The objectives of this research were to (i) develop the relationship of CO2 flux, water table depth and water content within the specific site, (ii) study spatial and temporal variations of the CO2 gas flux and (iii) compare the CO2 gas fluxes and peat properties of Aceh Province under rubber and oil palm with that of Central Kalimantan Province under rubber systems.
As water table depth correlated negatively with water content, the CO2 flux in most cases increased with the decrease of water content, under which conditions the soil is more aerobic. It was found that in general, CO2 flux decreases with the increase in water content for the range of water content between 40-57% during the research. Under more extreme, drier conditions, emissions tend to be lower but the results of this study do not have a wider range of data to demonstrate such a trend.
The research site at Jabiren in Central Kalimantan Province has a unique feature of thick enrichment of mineral soil resulting from flooding. Carbon density is relatively high, leading to the high carbon stock despite the moderate peat thickness. CO2 emissions under the rubber plantation were much lower in Aceh than in Kalimatan because of the shallow water table and perhaps also because of low input management of the former versus the deep drainage and high fertilization of the latter. With the deep drainage of Kalimantan rubber plantation, it had comparable emissions with that of the oil palm plantation in Aceh. As rubber is relatively tolerant to shallow drainage, keeping the water table at a shallow level is expected to decrease the emission level in Kalimantan.
3.3.2 Peatland�carbon�emissions�resulting�from�different�forest�conversions�
Adapted from Khasanah et al. 2013 (Indonesia Substantive Report)
An additional study looked at different emission rates resulting from varying peatland forest conversions in Indonesia. The objectives of the study were to estimate peatland carbon emissions due to peat oxidation in relation to drainage management of 1) simple rubber agroforestry, 2)

49
mixed coconut, 3) shaded coffee cultivation and 4) oil palm plantations by smallholder farms using the carbon stock difference approach (for 1�3) and the rate of subsidence approach (for 1�4). Further it aimed to estimate the effect of fertilizer application on the peat decomposition rates of three land cover types (simple rubber agroforestry, oil palm and logged-over forest) using rate of subsidence and microrelief approaches, for which only preliminary results were available.
Three types of smallholder farmland found commonly in Tanjabar peatland areas are: 1) simple rubber agroforestry (40 years old), 2) mixed coconut (50 years old) and 3) shaded coffee cultivation (25 years old). Belowground carbon stock of these land cover types were estimated by measuring soil bulk density and analysing soil carbon content. This was accomplished by taking soil samples using a peat auger throughout the entire soil depth at four measurement points in transects perpendicular to the drains (5, 15, 25 and 45 m from the drainage canal). Each type of land cover had three replications. The sample was then analysed in a laboratory at the Indonesian Soil Research Institute (ISRI), Ministry of Agriculture. The soil carbon content was analysed via the loss-on-ignition method. Depth of the groundwater table at each measurement point was also recorded. The same approach was also done in disturbed forest as a reference level of carbon stock representing initial condition before conversion. It was measured at three measurement points in transects perpendicular to the drains (50, 140, and 190 m from the drainage canal). Peat subsidence was monitored by installing metal rods at four measurement points in transects perpendicular to the drains.
The primary method for estimation of peat carbon emissions was observing the difference between carbon stocks of a certain land-use systems/farming systems and the carbon stock of forest when it was cleared and drained. Belowground carbon stock will become lower with closer proximity to the canal; conversely it will be higher with greater distance from the canal. The ‘broken stick’ relationship is normally used to describe this relationship as shown in Figure 31. In conditions with no emissions, carbon stock will be on the carbon stock maximum line; as drainage builds, the carbon stock declines following the sloping line (Figure 31). The total loss of carbon, or carbon emissions, can be estimated from the triangular area (identified with the arrow in Figure 31).

Figure 31 Cdistance to
For Tanjreferencebecause fall land-uwith aroureferenceassumptibetween
PreliminaCO2 emicoffee, siare not covariationmaintenacoconut water levcoffee. Cemissionaverage 2mixed coactivity.
Cumulative peo the drainage c
abar, three e level or inforest conveuse systems und 100 cm e carbon stocon was arbimajor canal
ary results oission from imple rubberonsidered, fo
n of emissioance of the csystem, whvel controlle
Canopy covens from fores26.0 t/ha. Thoconut (48.3
at carbon lossecanal.
assumptionsnitial conditiersions normwere locatedpeat depth
ck; and 3) 1itrarily applis.
of broken sticforest conv
r agroforestrorest conver
ons between canals and aere the farmed by the flr that is exp
st conversionhis value is
3 t/ha). More
es using the ‘br
s were used ion of total
mally take plad in the samand with car00 m was uied due to l
ck regressionversion was ry and mixedrsion in Tanj
land uses age of the plmer maintainlow of the r
pressed in abn in peatlandlowest com
e open area
50
roken stick’ rel
for the analbelowgrounace after fore peat domerbon stock o
used as a refelimitations in
n analysis shabout 28.8
d coconut reabar potentican be linklots. The lowned the watriver. The h
boveground bd areas. Abov
mpared to simmay increa
lationship betw
lyses: 1) Dind carbon storest logging e (the same pof around 58ference for dn the field t
howed that f8, 13.6 and spectively. Hially emittedked to the tywest emissioter level of highest emisbiomass canveground bimple rubberase sunlight
ween peat profi
sturbed foreock for all or other dist
peat depth be80 t/ha. Thisdistance betwto measure
for the first 59.5 tCO2e/h
However, if d about 15.8 ype of landons were foudrainage ca
ssions were n also explainiomass of shr agroforestrexposure an
file carbon stoc
est was usedland-use systurbance; 2)efore convers was used aween canals.the true dis
50 m to the cha/yr for shland-use systCO2e/ha/yr
d managemeund in the manals besidefound in shn the variati
haded coffee ry (58.0 t/hand decompos
k and
d as a stems That rsion) as the . This stance
canal, haded stems r. The ent or mixed es the haded ion of is on
a) and sition
51
3.4 Characterization�of�Aguajales�in�the�Aguaytia�River�basin,�Peru�
Adapted from Garcia, D. et al., 2012
Aguajales are forests made up of aguaje palm (Mautitia flexuosa L.f.), a species predominantly found in extensive flooded areas. Such aguajales ecosystems provide many benefits to Amazon inhabitants (Freitas et al., 2006) while also being an important part in the complex food chain providing nutritious fruit, key habitat for some species and playing a significant part in the carbon cycle. The deforestation and degradation of such systems is resulting in the loss of wildlife, increased decomposition of organic matter releasing net CO2 emissions into the atmosphere and negative impacts on the livelihoods of local peoples. A distinction can be made between three different types of aguajales in the Aguytia River basin, dense aguajales, mixed aguajales and sacha aguajal (fake agujal). The objective of this work was to characterise the different types of aguajales based upon different carbon stock potentials while also exploring options for low-emission development.
The dense aguajales are palm groves/lowland aguajales that consist of communities of almost pure aguaje palms (Mauritia flexuosa L.f.), gigantic and single-stemmed, associated to the “huasaí” (Euterpe precatoria), Virola sp., Symphonia globulifera, Hura crepitans and others. All the species are adapted to swampy and hydromorphic soils from gently undulating to low terrace flats in both the interior areas and far from the banks of rivers. They are not exposed directly to seasonal flooding on account of the rise in the rivers. The accumulation of water occurs due to the drainage from the rains off adjacent lands, the rise in the river levels, the effect of filtration from the system of interconnecting channels and from waters filtered by the vegetation’s foliage. Mixed aguajales are communities of aguaje palms associated with other medium and large caulinar and cespitosa palms, Virola (Myristicaceae), Moracae and Cecropiaceae trees, smaller cespitosa and thorny palms and/or abundant aquatic herbaceous plants in the intermediate shallow pools. All the species are adapted to swampy substrate, formed by recent or sub recent hydromorphic soils from the low terrace flats, partially exposed to seasonal flooding from the nearby rivers. Finally sacha agual are characterized for being associated with other, medium-sized cespitosa and caulinar palms, or with Moracea or Cecropiacea trees and other, smaller, cespitosa and thorny palms. All the species are adapted to the swampy substrate, although these sacha aguajales do not have hydromorphic soils and their topography is moderately undulating.
Dense aguajales had the highest average carbon stocks with a total average of 399.58 tC/ha. Mixed aguajales, the most wide-spread type of aguajales in the Aguaytia basin, had intermediate levels of carbon stocks with an average of 209.63 tC/ha. Finally sacha aguajales had the lowest levels of average carbon stocks, significantly lower to the other types, with an average of 61.56

52
tC/ha. Coverage of dense aguajales and mixed aguajales have been both decreasing between 1990 and 2010, where in contrast the area of sacha aguajales has been on the increase.
According to the content of organic matter, it was found that only the surface layer —at a depth of 0-20 cm with maximum averages of 22.31% carbon— meets the requirements to be considered peatland, and can be called organic soils, but as the depth increases to 200 cm, the carbon diminishes to maximum values of between 14.1% up to 0.7% because mineral soils are then mixed with the organic matter and the subsurface no longer qualifies as organic soils.
The sustainable management of aguajales ecosystems in the Amazon presents an opportunity to both utilize and value swamp forests (Khan, 1993; Peters et al., 1989), as is being done in a number of tropical countries with other types of palm that grow on flood plains, an example being the Euterpe oleraceae in Brazil (Anderson et al., 1987). Management plans have been developed with different techniques management techniques proposed such as: family nurseries, management of natural regeneration, agroforestry systems and management of natural stands (Bejarano and Piana, 2002). Management could be carried out individually or through community management with family allotments of aguajales belonging to the community. In all cases there must be technically substantiated management plans, with the active participation of the interested parties, reinforcing motivation and commitment and the consolidation of the organizations. The basic principle of using aguajales should be the harvesting of fruit without resorting to the cutting down of female palms using simple technologies and encouraging the use of climbers.
Other potential sustainable management strategies include a system of “beltways”, locating and joining the plants through a system of narrow trails, similar to those used in the harvesting of shiringa latex or Brazil nuts. The best palms should be chosen in each area for the quality of fruit, production and height, and these should be marked. Establishment of harvest rotations, plantations in already deforested areas and agroforestry systems containing both other fruit and nut trees as well as timber species all could enhance both ecosystem function within the aguajales systems as well as promote sustainable livelihoods. Sustainable production practices should complement those that seek to solve the problems of commercialization, transport and marketing of the product through different types of agreements. This includes the integrated use of the species, extending beyond simply fruit-related products.
53
3.5 Characterization�of�peatlands�in�Ca�Mau�and�Kien�Giang�provinces,�Vietnam�
Adapted from Vu Tan Phuong et al., 2011 (Peatland Report)
Peatlands in Vietnam are located in the Red River Delta, the Mekong Delta, the Central Coastal Area and some southeast provinces. To date, data on peatland areas and its geographic volume have not been sufficiently inventoried. In 1985, the Vietnam National Coal Mineral Industries Corporation (Nguyen Trong Khiem, 1985), estimated national peatland resources were around 7,100 m3, including 5,000 m3 distributed in the Southern Region, 450 m3 in Central Region and 1,650 m3 in Red River Delta. Located in the Southern Region, the Mekong Delta has the largest amount of the country’s peatlands, most of which are located within the two provinces of Ca Mau and Kien Giang, this study’s area of focus.
The objective of this study was to assess the emission reduction potential from peatland management in Vietnam in U Minh Thuong (Kien Giang) and U Minh Ha (Ca Mau), the areas with the largest volume of peatland and highest amount of carbon stock. In doing so peatlands were mapped, characterized based upon use and land use change, carbon stock and emissions estimated and potential management options were evaluated.
Peatlands in Vietnam can be characterized into the following types: 1) old coastal swampy peatland mainly distributed in Mekong and Red River Delta; 2) new coastal swampy peatland in Mekong Delta; and 3) old riverbed peatland mainly distributed in Mekong, Red River Delta and other regions. Peatland in Kien Giang and Ca Mau is old riverbed peat (known as lung by local people) and swampy peat. Currently, Melaleuca Cajuputy, Melaleuca plantation after fire, Phragmites or Eleocharis in addition to various lianas, cover a large peatland area in the Mekong Delta along side a small area of mixed broad leaves forest.
Peatland exploitation and use is rather limited in Vietnam. A small number of peatland areas were fragmentally exploited for fuel meanwhile other areas were exploited for small-scale fertilizer processing in some provinces. It is estimated that annually around 100,000 tonnes of peatland per year is exploited for use mostly converted into agricultural production within the Red River Delta and Mekong Delta. A number of national and regional scientific workshops have been organized to discuss peatland management and use in Vietnam as an energy source, fertilizer and charcoal, but such uses are controversial due to the related high amounts of carbon emissions. Currently, main land use types in peatland are: i) intact peatlands located mainly in U Minh Thuong and U Minh Ha NP of Kien Giang and Ca Mau provinces; ii) agricultural production on peatland, growing mainly Deris elliptical; iii) Melaleuca forests with Melaleuca
54
cajuputy as the main species; v) peatland exploitation for fertilizer production; and vi) unused peatland.
Three main activities that create the emission of GHGs (mainly CO2) from peatland are 1) the burning of biomass and peat caused by fires, 2) the peatland groundwater table lowering resulting in peatland oxidization and 3) the production of fertilizer. Here the first two are the area of focus. Low peatland groundwater table is caused by peatland exploitation, agro-forestry production and canal digging within the peatland Mekong Delta area for transportation.
41 soil samples were taken from different depth and land uses in peatland areas for analysis. Bulk density and carbon content was analysed for each sample. Bulk density value for surface layer of peatland was between 0.25 to 0.26 g/cm3. For the bottom layer, this value was from 0.15 to 0.20 g/cm3. Some peatland samples at the surface had a significantly higher bulk density (0.32 and 0.38 g/cm3 by peat fires or drying in agricultural production). Results of carbon content analysis indicated that carbon content in peatland in the upper layers to a depth of 50 cm usually ranges from 32-34% and about 28-30% in next layer. In the deep layer of the samples (over 100 cm) it is only about 16-20% depending on the quality of the peat.
Forest fires are seen as the main cause of the reduced peatland and carbon stock in Kien Giang and Ca Mau, mainly Melaleuca fire in U Minh. Over the last 33 years (1976-2009), annual average peatland area and stock has declined 530 ha/yr and 6.59 Mt/yr (3.29 MtC/yr) respectively. According to preliminary calculations of CO2 emissions from peatlands resulting from different land uses within the two provinces 12.76 Mt CO2/yr is emitted. Of this amount, the CO2 emissions from forest fires (biomass burning and peat fire) is the largest, accounting for 95% (12.1 Mt/yr) with CO2 emissions by oxidation of peat amounting to about 0.6 Mt/yr, while the agricultural and mining production is not large because of its small scale.
Peat soil management under the form of a national park or nature reserve is seen as the most effective solution to protect peatland and preserve carbon stock and can involve both wetland biodiversity conservation and ecotourism development. Forest fire management is also a focal task to protect peatland in UMinh. It is therefore, necessary to further study the harmonization between water storage during the dry season to minimize forest fires and supporting ecological diversity in Melaleuca Cajuputy.
Data on peatland areas and corresponding carbon stock is not consistent and assessments on peatland changes in Vietnam are rather limited. As such, it is crucial to have a comprehensive peatland area and stock assessment program, with a special focus on the Red River and Mekong Delta regions. It is necessary to have a scientific basis to identify sustainable peatland

55
management and use, to move towards preserving the important role of peatlands in environmental protection (e.g. fresh water storage and salinity prevention) and reduction of GHG emissions from peatland use.
56
IV INCENTIVE�SCHEMES�FOR�REALU�4.1 Rationale�
Incentives are factors (financial or non-financial) that enable or motivate a particular course of action, or count as a reason for preferring one choice to other alternatives. In the context of REDD+/REALU, incentives seek to influence decisions by either making the carbon-intensive land conversions less profitable or, conversely, by increasing the profitability of establishing or maintaining forest. To work towards the operationalisation of the REALU landscape approach, incentive schemes in the four landscapes were assessed; each specifically tailored to the landscape’s context. Potential incentive schemes were evaluated based on three main criteria: 1) emission reduction potentials, 2) opportunities for local participation and 3) the overall relative landscape impact. Whenever possible, incentives were identified that allowed for win-win approaches to reducing deforestation while also alleviating poverty. To assess the potential viability of the proposed incentive schemes, a set of enabling conditions were examined including the policy and institutional landscape, legal, market and investment limitations and opportunities, and lastly, potential leakage. For each incentive scheme, potential leakage was assessed. Options for stakeholder reward preferences, benefit sharing arrangements and MRV were also assessed.
Within the specific country landscapes, Cameroon focused on intensification of cocoa plantations while Peru focused on improving carbon stocks within land use units (including cocoa, pastures and forests). Indonesia focused on the potential for creating a community forest management mechanism that included provision for alternative livelihoods and on strengthening the value chain for Dyera polyphylla (Jelutong). Lastly Vietnam looked at the potential for payment for environmental services (PES) schemes based both on community forest management and agroforestry activities.
4.2 Incentives�for�the�four�landscapes�4.2.1 Cocoa�intensification�through�tree�improvement�and�domestication�in�
Efoulan,�Cameroon�
Adapted from Alemagi, D. & Feudjio, M., 2013
Description of the incentive
To promote sustainable intensification pathways on tropical forest margins, ten forest-dependent communities within the Efoulan Municipality in Cameroon were used as a case study to examine
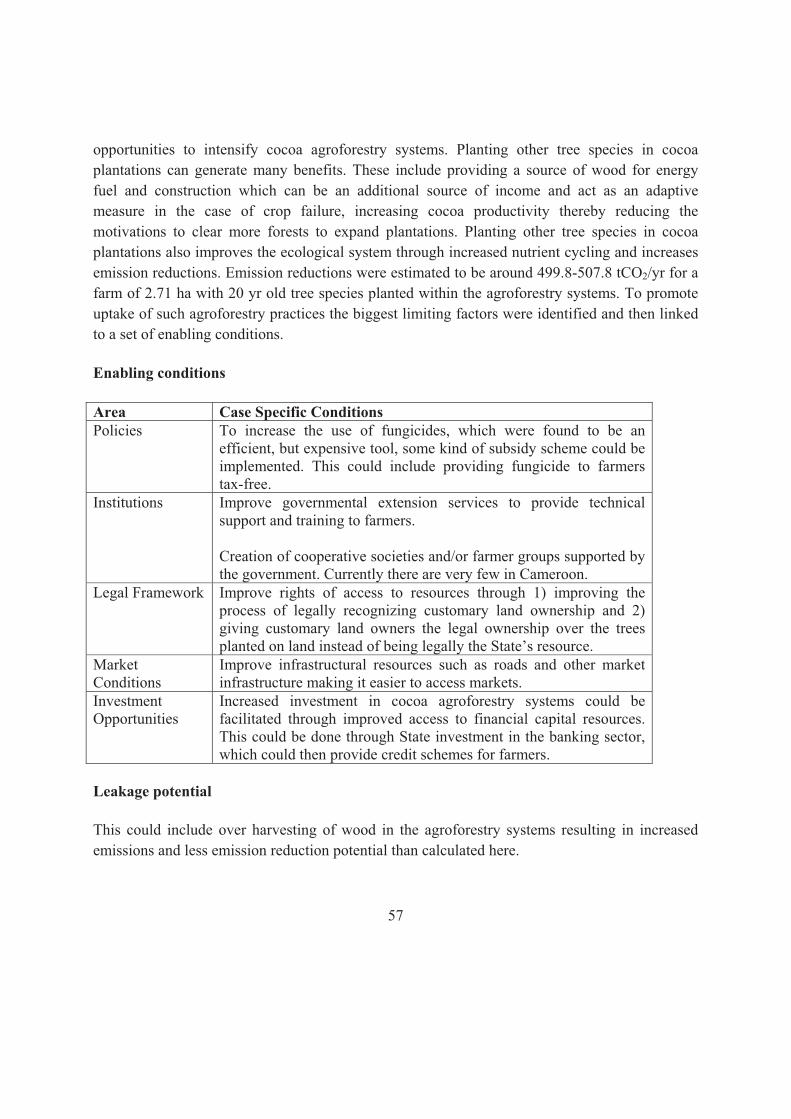
57
opportunities to intensify cocoa agroforestry systems. Planting other tree species in cocoa plantations can generate many benefits. These include providing a source of wood for energy fuel and construction which can be an additional source of income and act as an adaptive measure in the case of crop failure, increasing cocoa productivity thereby reducing the motivations to clear more forests to expand plantations. Planting other tree species in cocoa plantations also improves the ecological system through increased nutrient cycling and increases emission reductions. Emission reductions were estimated to be around 499.8-507.8 tCO2/yr for a farm of 2.71 ha with 20 yr old tree species planted within the agroforestry systems. To promote uptake of such agroforestry practices the biggest limiting factors were identified and then linked to a set of enabling conditions.
Enabling conditions
Area Case Specific Conditions Policies To increase the use of fungicides, which were found to be an
efficient, but expensive tool, some kind of subsidy scheme could be implemented. This could include providing fungicide to farmers tax-free.
Institutions Improve governmental extension services to provide technical support and training to farmers.
Creation of cooperative societies and/or farmer groups supported by the government. Currently there are very few in Cameroon.
Legal Framework Improve rights of access to resources through 1) improving the process of legally recognizing customary land ownership and 2) giving customary land owners the legal ownership over the trees planted on land instead of being legally the State’s resource.
Market Conditions
Improve infrastructural resources such as roads and other market infrastructure making it easier to access markets.
Investment Opportunities
Increased investment in cocoa agroforestry systems could be facilitated through improved access to financial capital resources. This could be done through State investment in the banking sector, which could then provide credit schemes for farmers.
Leakage potential
This could include over harvesting of wood in the agroforestry systems resulting in increased emissions and less emission reduction potential than calculated here.
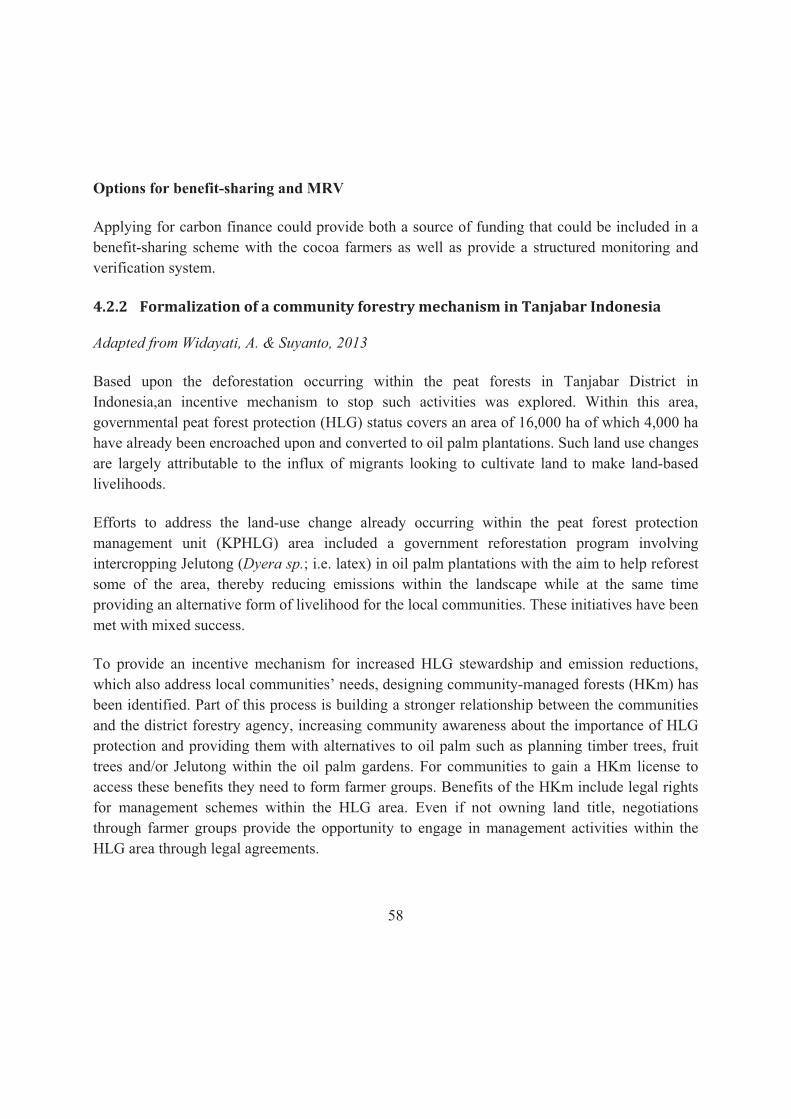
58
Options for benefit-sharing and MRV
Applying for carbon finance could provide both a source of funding that could be included in a benefit-sharing scheme with the cocoa farmers as well as provide a structured monitoring and verification system.
4.2.2 Formalization�of�a�community�forestry�mechanism�in�Tanjabar�Indonesia�
Adapted from Widayati, A. & Suyanto, 2013
Based upon the deforestation occurring within the peat forests in Tanjabar District in Indonesia,an incentive mechanism to stop such activities was explored. Within this area, governmental peat forest protection (HLG) status covers an area of 16,000 ha of which 4,000 ha have already been encroached upon and converted to oil palm plantations. Such land use changes are largely attributable to the influx of migrants looking to cultivate land to make land-based livelihoods.
Efforts to address the land-use change already occurring within the peat forest protection management unit (KPHLG) area included a government reforestation program involving intercropping Jelutong (Dyera sp.; i.e. latex) in oil palm plantations with the aim to help reforest some of the area, thereby reducing emissions within the landscape while at the same time providing an alternative form of livelihood for the local communities. These initiatives have been met with mixed success.
To provide an incentive mechanism for increased HLG stewardship and emission reductions, which also address local communities’ needs, designing community-managed forests (HKm) has been identified. Part of this process is building a stronger relationship between the communities and the district forestry agency, increasing community awareness about the importance of HLG protection and providing them with alternatives to oil palm such as planning timber trees, fruit trees and/or Jelutong within the oil palm gardens. For communities to gain a HKm license to access these benefits they need to form farmer groups. Benefits of the HKm include legal rights for management schemes within the HLG area. Even if not owning land title, negotiations through farmer groups provide the opportunity to engage in management activities within the HLG area through legal agreements.
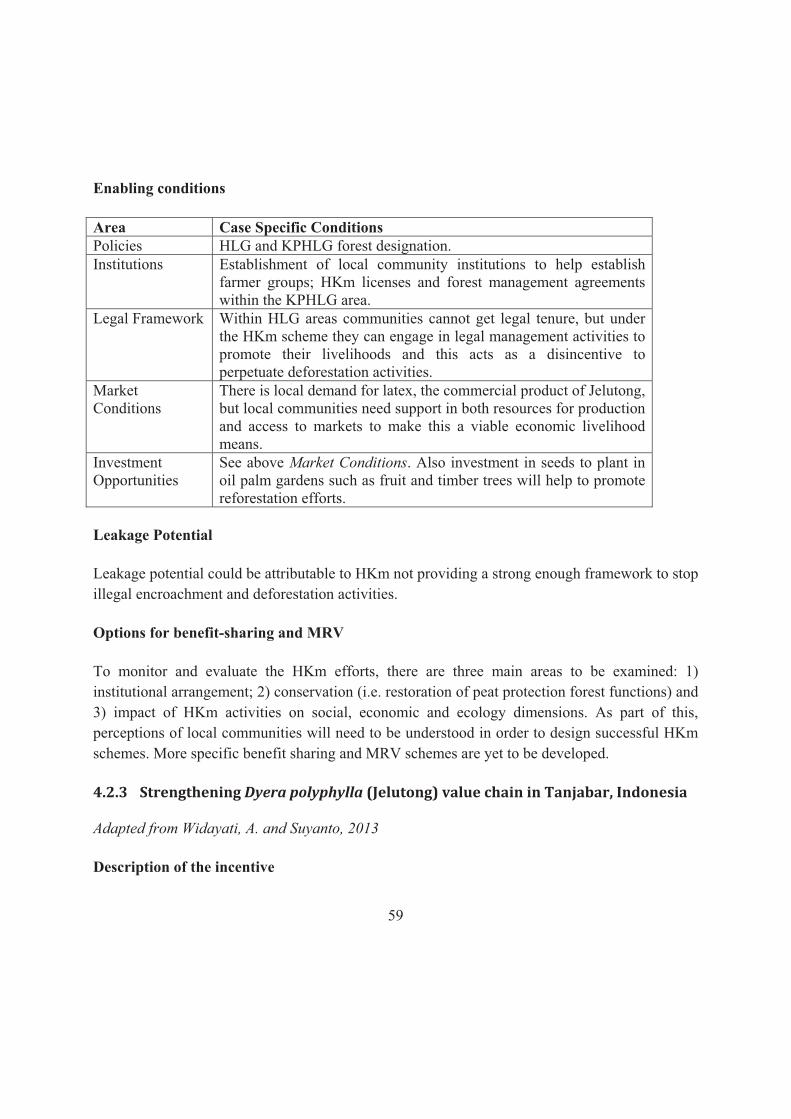
59
Enabling conditions
Area Case Specific Conditions Policies HLG and KPHLG forest designation. Institutions Establishment of local community institutions to help establish
farmer groups; HKm licenses and forest management agreements within the KPHLG area.
Legal Framework Within HLG areas communities cannot get legal tenure, but under the HKm scheme they can engage in legal management activities to promote their livelihoods and this acts as a disincentive to perpetuate deforestation activities.
Market Conditions
There is local demand for latex, the commercial product of Jelutong, but local communities need support in both resources for production and access to markets to make this a viable economic livelihood means.
Investment Opportunities
See above Market Conditions. Also investment in seeds to plant in oil palm gardens such as fruit and timber trees will help to promote reforestation efforts.
Leakage Potential
Leakage potential could be attributable to HKm not providing a strong enough framework to stop illegal encroachment and deforestation activities.
Options for benefit-sharing and MRV
To monitor and evaluate the HKm efforts, there are three main areas to be examined: 1) institutional arrangement; 2) conservation (i.e. restoration of peat protection forest functions) and 3) impact of HKm activities on social, economic and ecology dimensions. As part of this, perceptions of local communities will need to be understood in order to design successful HKm schemes. More specific benefit sharing and MRV schemes are yet to be developed.
4.2.3 Strengthening�Dyera polyphylla�(Jelutong)�value�chain�in�Tanjabar,�Indonesia�
Adapted from Widayati, A. and Suyanto, 2013
Description of the incentive

60
The second incentive mechanism identified in Indonesia for further support in peat forestry protection is the increased production of Jelutong (latex). This was seen as a more sustainable alternative to the oil palm plantations/gardens resulting in less CO2 emissions while also presenting a potential alternative for generating an economic livelihood. To create an incentive mechanism for the increased planting of Jelutong, the latex value chain was examined to assess demand and market potentials. It was found that there is a local demand for latex, but this market needs to be further developed increasing production and establishing market supply chains. This requires increased awareness about production and markets as well as access to financial capital required for initial investment to shift production systems.
Enabling conditions
Area Case Specific Conditions Policies Local government policies around non-timber forest product use
and harvesting need to facilitate ease of harvesting and access to markets. See Legal Framework.
Institutions Coordination is needed between district and provincial forestry agencies, and the trade and industrial agencies to make it easier for Jelutong tappers to get their products to both domestic and international markets.
Increasing capacity is needed within farmer groups, by providing knowledge about both production and market conditions.
Access to micro credit through financial institutions or other sources will also be an enabling factor for farmer groups.
Legal Framework Changing the regulations around Jelutong latex harvesting to make it less complicated and cumbersome is needed so that there are less barriers to sell legally harvested latex within Tanjabar. They could follow a model similar to that for the Central Kalimantan local government which is more flexible and accommodating.
Market Conditions
There is local and international demand for latex, the commercial product of Jelutong, but local communities need support in both resources for production and access to markets to make this a viable economic livelihood means.
Investment Opportunities
See above Market Conditions.
There is the opportunity to create a Jelutong sap-processing industry at the provincial level.
61
Options for benefit-sharing and MRV
Farmer groups will directly benefit from increased production of latex through the resulting increases in household income. Ensuring that they get a fair price for their product will be important so that the main profits don’t go simply to middlemen, reducing the incentive for Jelutong planting. MRV procedures are yet to be developed.
4.2.4 Improving�carbon�stock�within�land�units�including�cocoa,�pasture,�forests�in�Padre�Abad,�Peru�
Adapted from Silva, C. et al., 2013
Description of the incentive
Incentive design was explored with the major cocoa marketing association, ACATPA (Asociacion de cacaoteros tecnificados de Padre Abad) in Padre Abad, which connects farmers to markets and helps them to get better prices for their product by taking out intermediaries and using certification schemes. ACATPAalso provides technical assistance and other services to support farmers’ production activities. Due to the many benefits associated with being a member, ACATPA continues to grow its member base increasing from 40 to 231 members between 2008 and 2011. Though cocoa production is the dominant income generating activity for the members, the majority (~64%) also relied on some form of off-farm income. This combined with scarce hired labour resulted in farm intensification creating high trade-offs for farmers.
Cocoa farms are located within mosaics made up of a combination of the following land uses: cocoa, forest, fallow, reforestation, oil palm, pasture and annual crops. To reduce emissions and increase carbon stock, two strategies were identified: 1) intensify cocoa farming by increasing the density of the cocoa trees and 2) improve the carbon stock across all land uses within the mosaic. Although such shifts in land use can result in a number of additional benefits such as additional food sources from fruit trees, increased income from timber trees planted, and other ecological benefits from improved soil quality and ecological resilience, transaction costs for such shifts in land uses are high.
However, carbon finance has been identified as one potential source to help fill this gap. One benefit that ACATPA provides to their members is their agreement with SUMAQAO, a Peruvian-based enterprise in the business of cocoa trading. SUMAQAO has a commercial agreement with a Swiss based company, PRONATEC, a cocoa buyer and processor to whom they sell all the raw material. In its path to become a sustainable enterprise, PRONATEC is
62
aiming to be a carbon neutral company and therefore has decided to offset their carbon footprint by buying carbon credits from their associated suppliers in developing countries, the members of ACATAPA being one such group. Therefore even though recently the carbon markets have demonstrated less than optimal performance, the partnership with SUMAQAO provides a direct channel for ACATPA members to engage with carbon financed activities to generate additional income while also managing their land in a less carbon intensive way also resulting in additional livelihood benefits.
Enabling conditions
Area Case Specific Conditions Policies Strong governmental and international support for cocoa production
to displace illegal coca production. Institutions Improving technical assistance provided through ACATPA.
ACATPA’s exclusive agreement with SUMAQAO qualifying them to be beneficiaries of carbon financed schemes funded by PRONATEC.
Legal Framework See Policies. Market Conditions
Enabling factors to increase production include reducing production costs and increasing access to hired labour.
Investment Opportunities
Investment opportunities to increase cocoa farming are limited by scarce sources of hired labour.
ACATPA financing scheme provided to members acts as an enabling mechanism.
PRONATEC’s interest in buying carbon credits from their producers, i.e. the ACTAPA farmers, creates the opportunity for farmers to gain additional income through carbon finance.
Leakage Potential
If dependent on carbon financing to provide emission reductions, there is risk that the carbon market can crash taking away the financial incentive for the low-carbon land management.
Options for benefit-sharing and MRV
Carbon finance can provide a direct financial benefit for farmers based upon their activities aimed to increase carbon stock within their landholding and this could be included in a benefit
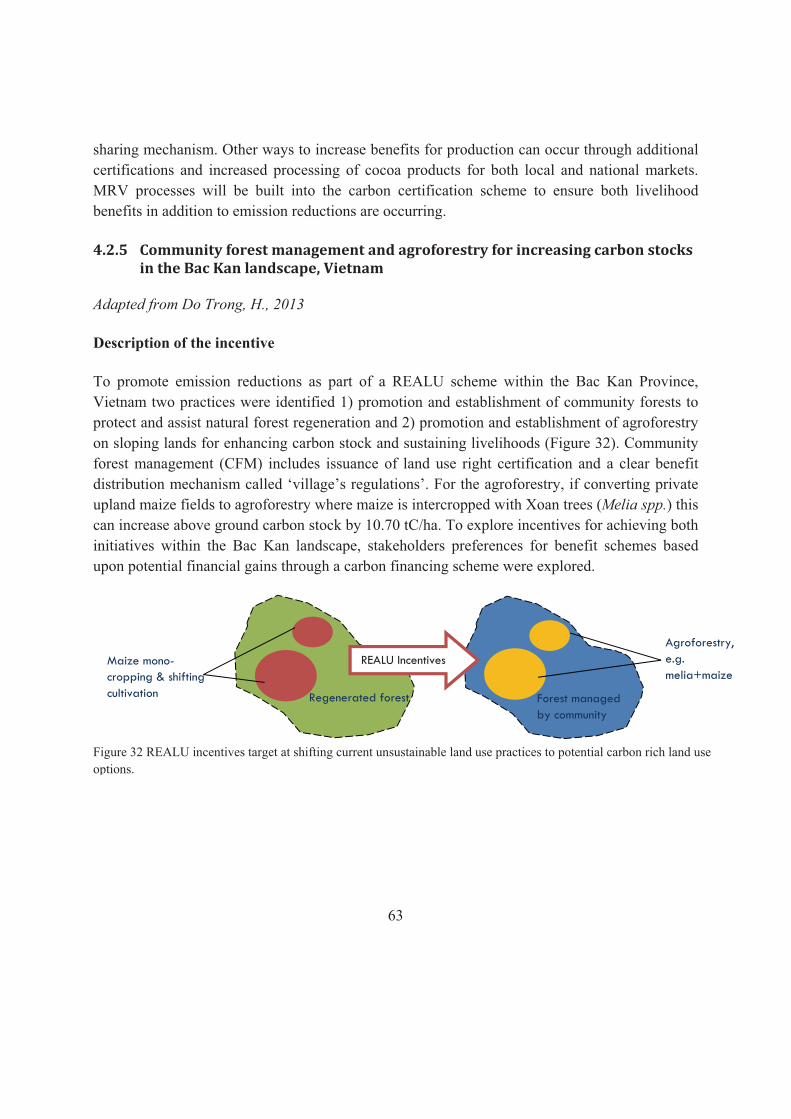
63
sharing mechanism. Other ways to increase benefits for production can occur through additional certifications and increased processing of cocoa products for both local and national markets. MRV processes will be built into the carbon certification scheme to ensure both livelihood benefits in addition to emission reductions are occurring.
4.2.5 Community�forest�management�and�agroforestry�for�increasing�carbon�stocks�in�the�Bac�Kan�landscape,�Vietnam�
Adapted from Do Trong, H., 2013
Description of the incentive
To promote emission reductions as part of a REALU scheme within the Bac Kan Province, Vietnam two practices were identified 1) promotion and establishment of community forests to protect and assist natural forest regeneration and 2) promotion and establishment of agroforestry on sloping lands for enhancing carbon stock and sustaining livelihoods (Figure 32). Community forest management (CFM) includes issuance of land use right certification and a clear benefit distribution mechanism called ‘village’s regulations’. For the agroforestry, if converting private upland maize fields to agroforestry where maize is intercropped with Xoan trees (Melia spp.) this can increase above ground carbon stock by 10.70 tC/ha. To explore incentives for achieving both initiatives within the Bac Kan landscape, stakeholders preferences for benefit schemes based upon potential financial gains through a carbon financing scheme were explored.
Regenerated forest Forest managed
by community
Maize mono-cropping & shifting cultivation
Agroforestry, e.g. melia+maize
REALU Incentives
Figure 32 REALU incentives target at shifting current unsustainable land use practices to potential carbon rich land use options.
64
Enabling conditions
Area Case Specific Conditions Policies 17 existing policy decisions that are pre-conditions for REDD+
benefit-sharing to work in the country.
Some policies around land tenure are conflicting and need to be clarified. See Legal Framework.
Institutions For implementing a REDD+ PES scheme, there are many related institutions from the community levels to the international level. All will need to work together in order to develop a successful PES scheme.
Legal Framework There are different designations of legal land use and access within the communities. Sometimes this legal designation can be weakly enforced and in some places tenure rights are overlapping. There will be need for clear legal land use designation to be enforced.
Market Conditions
The opportunity cost for one tCO2e is less than 5 USD therefore a price equivalent to this or higher will be required to implement PES schemes. Another option is to bundle the ecosystem services provided when possible.
Investment Opportunities
See Market Conditions.
Leakage Potential
If carbon finance benefits are not as great as expected this may provide a disincentive to continue carbon enriching land use practices causing leakage and regression into previous practices.
Options for benefit-sharing and MRV
Stakeholder preferences were explored around benefit-sharing schemes for communities who engaged with emission reduction activities. The amount of potential financial awards is based around carbon finance for REDD+ related certification. Five main benefits types were presented. The top two benefits included cash for infrastructure and issuance of land use right certificates (LURC). This points to land use rights holding significant importance for communities. For MRV, remote-sensing based forest and carbon monitoring has been proposed using a GIS-Web application Carbon2MarketsTM as well as participatory carbon measurements.
65
V �ENABLING�CONDITIONS�FOR�LANDSCAPE�APPROACHES�
There are a number of design questions/challenges emerging with regards to REDD+ such as issues of scale, nesting, leakage, benefit sharing strategies, and choices between which of the multiple policies and instruments to draw upon (e.g. between sparing and sharing for addressing drivers of deforestation, payments, rewards and or co-investments in the achievement of multiple benefits (Minang, PA. and van Noordwijk, M., 2012)). Enabling conditions are defined as conditions that will enable REDD+ and REALU to be effective and efficient land use policy approaches and to address the above challenges. In this section, three aspects are focused upon, namely the readiness levels of the four countries, an example of the benefit distribution system (BDS) in Vietnam and the need for a co-investment approach including the private sector.
5.1 REDD+�readiness�
Adapted from Minang et al., in review
Readiness for REDD+ has been cited as the main prerequisite for countries to move towards implementing REDD+ projects in an effective manner. In order to explore the readiness level of countries for REDD+, drawing on a literature review, the FCPF readiness elements and a review of other relevant REDD+ documents, a readiness assessment framework was developed. This framework is based on six key functions and 29 corresponding indicators. The six functions are as follows: 1) planning and coordination, 2) policy, legal and institutional frameworks, 3) MRV and audit, 4) benefit sharing, 5) financing, and 6) demonstration and pilots. Countries were then given scores for each of the 29 indicators on a scale of 0 to 3 with the following designations: 0 - no evidence of readiness consideration, 1 - aware of it and being discussed, 2 - agreed in principle (or some draft document and or recommendations exists) and 3 - established rules exist in law and or are being implemented. Comparison of readiness was done by aggregating the values for the six functions with a maximum value of 18 (six functions each with maximum score of three).
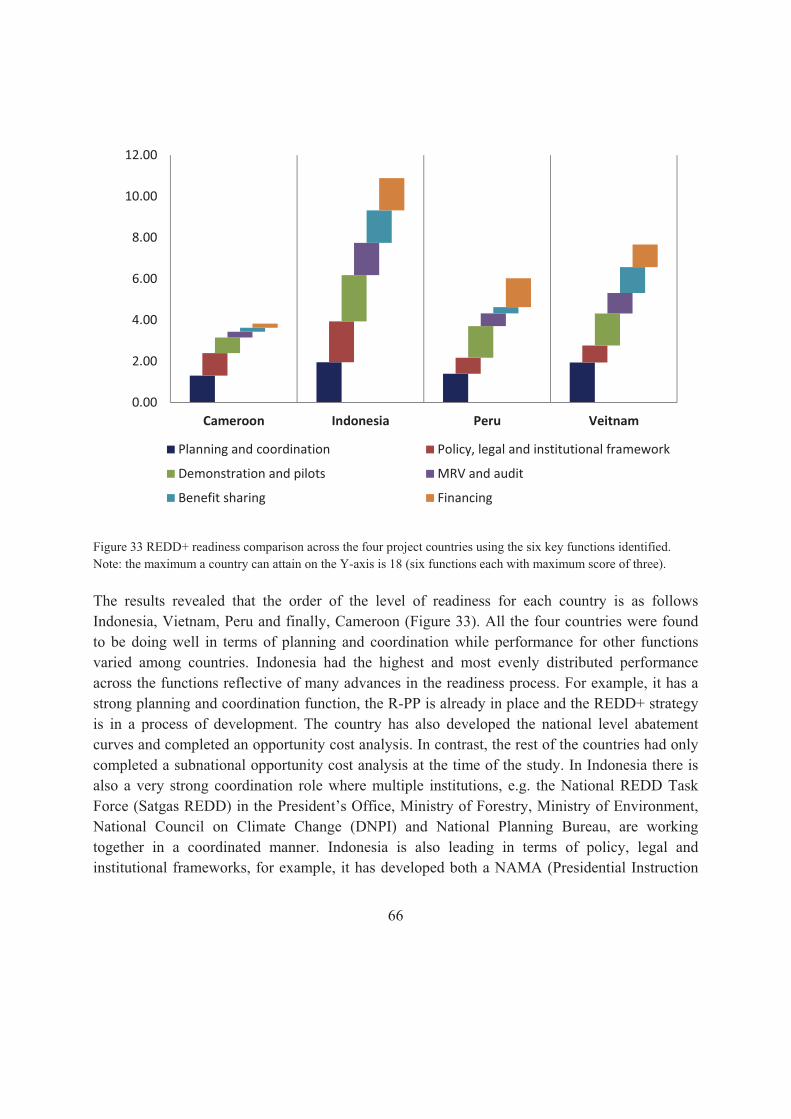
66
Figure 33 REDD+ readiness comparison across the four project countries using the six key functions identified. Note: the maximum a country can attain on the Y-axis is 18 (six functions each with maximum score of three).
The results revealed that the order of the level of readiness for each country is as follows Indonesia, Vietnam, Peru and finally, Cameroon (Figure 33). All the four countries were found to be doing well in terms of planning and coordination while performance for other functions varied among countries. Indonesia had the highest and most evenly distributed performance across the functions reflective of many advances in the readiness process. For example, it has a strong planning and coordination function, the R-PP is already in place and the REDD+ strategy is in a process of development. The country has also developed the national level abatement curves and completed an opportunity cost analysis. In contrast, the rest of the countries had only completed a subnational opportunity cost analysis at the time of the study. In Indonesia there is also a very strong coordination role where multiple institutions, e.g. the National REDD Task Force (Satgas REDD) in the President’s Office, Ministry of Forestry, Ministry of Environment, National Council on Climate Change (DNPI) and National Planning Bureau, are working together in a coordinated manner. Indonesia is also leading in terms of policy, legal and institutional frameworks, for example, it has developed both a NAMA (Presidential Instruction
0.00
2.00
4.00
6.00
8.00
10.00
12.00
Cameroon Indonesia Peru Veitnam
Planning and coordination Policy, legal and institutional framework
Demonstration and pilots MRV and audit
Benefit sharing Financing
67
61 and 71 of 2011) and REDD+ policy (P 68/2008 and P 30/2009) and has enacted and implemented a moratorium on logging within the context of REDD+.
Benefit sharing as a function was strong in both Vietnam and Indonesia. Vietnam is exceptional in this regard as they have the strongest benefit sharing mechanisms in place compared to all other countries. This to some extent might be due to the fact that the country is building upon an existing system which initially had strong benefit sharing exercises. Peru, despite being among the Amazon basin countries where the rights issues (particularly with the indigenous communities) are strongly prominent, is doing poorly in the benefit sharing function. Moreover, the MRV and audit function which embraces the safeguards issues is still weak in Peru. This implies that with the rights issue being very critical in the Amazon, Peru needs to invest strongly in the benefit sharing and MRV and audit functions.
The financing function was found to be stronger in Indonesia, Vietnam and Peru as these countries are doing relatively better in securing finances for REDD+ related activities than Cameroon. Indonesia has secured one billion USD, Vietnam 100 million USD and Peru 60 million USD through bilateral and multilateral agreements. However, in all the countries serious engagements with governments and to some extent of the private sector in financing REDD+ activities are rarely reported. Cameroon from all aspects of financing is doing little.
Demonstration and pilot activities were among the key strengths within the four countries though relatively weaker in Cameroon. All the countries reported a considerable number of demonstrations and REDD+ pilots being implemented by NGOs, community groups and the private sector. However, the various REDD+ projects and pilots lack a standardized definition thus proving complex to compare. Indonesia is the only country that currently has regulations to standardized REDD+ demonstrations and pilots being carried out while Peru is developing modalities for projects registry. In total the number of REDD+ pilots in the four countries were 44-77 in Indonesia, 35 in Peru, 31 in Cameroon and 30 in Vietnam.
5.2 Benefit�distribution�
5.2.1 Lessons�from�benefit�distribution�across�scales�for�REDD+�in�Vietnam�
Adapted from Hoang M H et al., 2012
Across the ASB REALU sites, Vietnam completed the most comprehensive study around the potentials of a REDD+ benefit sharing mechanism. Such a mechanism is part of a crucial foundation, which aims at respecting rights and sharing benefits with the ultimate beneficiaries who are the ones required to change their practices to facilitate land-based emission reduction
68
activities. This section focuses on the work Vietnam did around developing such a mechanism based on a Payment for Forest Environmental Services (PFES) scheme and the corresponding results and insights.
REDD+ revenues aim at contributing to forest conservation as well as poverty reduction and, therefore, to sustainable development. The design of a comprehensive benefit distribution system (BDS) for REDD+ revenues is among the necessary steps in the readiness process. The main challenge lies in distributing the revenues to local partners and beneficiaries, in a transparent, equitable and cost-effective manner, while complying fully with government regulations, UNFCCC or other international requirements, and managing the risks of participants awaiting payment. There is currently no prescribed BDS for REDD+ within the UNFCCC and there are few existing benefit sharing systems for REDD+ at country level.
The features of a good BDS are defined as follows:
1. Engages the right stakeholders 2. Determines the right forms and level of incentives 3. Creates legitimate mechanisms for management of benefits 4. Enforces effective transparency provisions 5. Develops effective dispute settlement mechanisms
These features are shaped by different governance contexts and can be complicated by factors such as unclear tenure and rights, corruption, poor analytical capacity and poor enforcement of rules and laws.
In Bac Kan Province in Vietnam, incentives for local communities to contribute to REALU scenario (see section II) and facilitate the requested changes in the landscape included: 1) provision of under allocated land use right certificates (LURC) for the poor/regenerated forests or under community management without LURC and 2) financial and technical support to develop agroforestry models on maize mono-cropping plots and shifting cultivation plots within or around forest areas, and to assist forest regeneration through silvicultural interventions.
To assess stakeholders’ preferences of incentives/benefits to compensate for changes in their land management practices, stakeholders were invited to participate in a theoretical game where they got to rank their preference of benefits. Their choice for benefit types included cash payments, cash for infrastructure provision (such as roads, schools, electricity, or water to households), agricultural inputs, land use rights certificates for 100 ha of the hypothetical forest, and other volunteered ideas. Ways to quantify the amounts of environmental services being

69
created, the institutional landscape and methods for MRV were also analyzed to gain insights into both the challenges and opportunities for providing an effective benefit-sharing mechanism.
Preferences over benefit type varied by individual forest land tenure status. Majority of stakeholders holding LURCs for protection forest (83%) preferred to receive LURCs for production forest, while almost all stakeholders holding LURCs for production forest (90%) wanted cash. Preferences over LURC benefits indicate the importance to forest stakeholders of formalized resource access rights. LURC holders have the state-sanctioned power to use lands as collateral for loans and extract certain amounts or volumes of forest products both in production and protection forests. The state sanctions their power to exclude others from using the resource. As such, it is not surprising that stakeholders who already held production forest LURCs preferred cash, but it is notable that holders of protection forest LURCs preferred production forest LURCs over cash, indicating that use rights given in production forest LURCs have economic value to them.
Results from this study emphasize that full participation of stakeholders at all levels, by merging top–down with bottom–up approaches, is key to effective and equitable REDD+ at the landscape level. To operationalise a BDS, placing management at the lowest possible level with due consideration for efficiency, transparency and manageability was also identified as a potential enabling strategy. The greater the number of hierarchical levels at which revenues are managed, the less cost-effective the mechanism is likely to be, because of higher implementation costs and a greater risk of rent-seeking and corruption. On the other hand, fewer hierarchical levels make it harder to ensure efficiency and equity in disbursement because of the ‘distance’ between the source and target of the funds. Civil society organizations were identified to be the most effective intermediaries in PES and other conservation programs at the grass-root level in Vietnam. To further promote a transparent process, institutions responsible for implementation should be different from those tasked with determining the amount of benefits that should be allocated to participants.
Ideally, local farmers should be supported in shifting from unsustainable practices such as shifting cultivation and monocropping on steep slopes to carbon-rich land uses that can provide both PES for carbon and water as well as good income from land-use products. Since income from carbon-rich land uses may be less than that of status quo practices, especially in initial years, the incentives of a BDS system must at least compensate for the gap between status quo practices and carbon-rich land uses, which represents transaction and opportunity costs. On the other hand, although there is an expectation that carbon-rich land uses such as promoting community forests and agroforestry could generate relatively higher income to local farmers

70
compared to current PES and conservation payments, there are no reliable estimates of how much income can actually be earned from them. Making farmers bear the initial investment costs and wait for payments may waver their commitment and create the risk of inadequate outcomes. Performance payments of PES are unlikely to be an effective instrument for REDD, unless certain prior conditions (economic, institutional, informational, and cultural) are met, as well as covering the upfront risks of farmers.
In this regard, two kinds of payments can be envisaged: 1) Participation payments to be made when participants deliver evidence of their participation to the MRV system and 2) Performance payments to be made periodically on the basis of verified net emission reductions. The challenge for both methods of payment is how to define the payment amount, obtain conditionality and conduct monitoring efficiently. A well-designed BDS should ensure that all beneficiaries, including village communities that successfully reduce emissions, receive equal performance payments per unit of net emission reductions. These payments also need to reflect social and other environmental goals through the application of carefully constructed coefficients to differentiate distribution levels.
At the community level in Vietnam, appropriate modes of payments, rewards or co-investment are required. These include Compensation for Opportunity Skipped (COS) and Co-Investment in Landscape Stewardship (CIS) paradigms. In both COS and CIS, the amount of REDD+ payments can be negotiated and contracted against the expended level of effort and opportunity costs. This can enhance conditionality and monitoring efficiency of the PES and a REDD+ BDS. The various PES paradigms can be combined in a REDD+ value chain linking local actions with global benefits. Bundling the income from land use ‘goods’, together with PES from those land uses will provide greater sustainability by creating additional funding for forest conservation and improvements in livelihoods of local people. It will help raise the compensation levels and reduce the risk of BDS failure.
Further lessons from the study include:
1. Effective forest protection requires more than REDD+ payments and non-cash incentives. Support for improved forest governance, and land tenure and rights for forest dependent communities, are also important for the success of a PES scheme and therefore for REDD+.
2. Compared to the first pathway of BDS, where communities receive payments for stopping their present activities, the second pathway of BDS promoting new ‘best practices’ may be more effective though more evidence is required.
71
3. In REDD+ mechanisms, there are additional considerations, for example, international investors who can influence the criteria used in benefit structuring.
This study of Bac Kan has demonstrated the multiple dimensions that need to be considered when developing a BDS. As this will be key to the success for REDD+ and/or REALU initiatives, the considerations highlighted here in this brief summary should be taking into account. Working across scales, ensuring participatory engagement of stakeholders and bundling of services can all be steps in the process to generate sustainable outcomes.
5.3 Promoting�a�co-investment�approach�including�the�private�sector�
Adapted from Bernard et al., 2012
In order to ensure a sustainable landscape approach to REDD+, co-investment is critical for addressing the costs of implementing REDD+/REALU, with private sector actors playing a potential important role.
Indeed, there is growing evidence that public finance alone is unlikely to meet the emission reduction investment requirements. Up-front investment of approximately 17–40 billion USD per year is needed to realize the climate change mitigation potential of forests (Eliasch, 2008; UNEP Financing Initiative, 2011), whereas cumulatively available public REDD+ funds from donor countries pledged since 2008 stand at approximately 7.2 billion USD (the actualized figures are much lower) (Simula Ardo, 2010). Therefore, the role of the private sector in financing and supporting emission reductions needs to be enhanced, their involvement absolutely critical to scaling up investment in REDD+. Presently, several pioneering investment banks seeking future investment opportunities are major players in the REDD+ investment arena and more efforts to engage with financial institutions have to be pursued. Private sector REDD+ investment is also undertaken by emissions-intensive industries searching for large volumes of offset credits and large multinational firms investing in the form of grants, which often directly implicate themselves in project activities as part of their corporate social responsibility (CSR) initiatives.
Additionally, several segments of the private sector are part of the problem, acting as drivers of deforestation, which need to be directly addressed. Export-oriented agribusiness and extractive industries such as logging, mining, oil and gas have been important drivers of deforestation and their contributions are both direct and indirect. Reassuringly, a number of those companies recognize the problems and are willing to become part of the solution. Such stakeholders also need to be the target of REDD+/REALU incentives to address the major drivers of deforestation.

72
Eventually, aside from the scale and speed at which investment needs to flow, the private sector has an enormous role to play in providing the expertise, technological innovation and adaptability that will encourage and facilitate REDD+. In many instances, the private sector has taken on a more active role by providing technical expertise, innovation and management skills and being fully or partly involved in project implementation. An example of national-level technological expertise and capacity includes GAF AG, a leading European firm for geographic information systems (GIS) that is providing institutional arrangements and stakeholder analysis, deforestation and degradation mapping via remote sensing analysis, mapping of degradation hotspots, and capacity-building services for a REDD+ pilot project in Cameroon. Additionally, many REDD+ projects are implemented by medium- to large-sized private firms as part of their core expertise and business niche. This is the case of Wildlife Works, a major leading private developer of REDD+, with the Kasigau Corridor REDD+ project in Kenya.
However, analysis of the policy and institutional environment show that some critical challenges hinder further private sector engagement in scale and scope in the REDD+ mechanism. This starts with the need to create long-term and robust demand for REDD+ credits as well as the need for a strong policy signal and further involvement of the private sector in REDD+ policy development. Furthermore, clarifying land tenure and carbon ownership in a manner that respects the rights of indigenous and forest-dependent communities, while also remaining attractive from the government and the private sector’s perspectives, is a crucial precondition for successful implementation of REDD+ activities and a functioning market for tradable REDD+ credits. Further consultation between governments and the private sector is also required to establish the legal basis for private investment in REDD+, especially around issues of effective risk-sharing and risk-mitigation mechanisms, due diligence in the investment process, explicit arbitration procedures, and clear and fair benefit-sharing mechanisms.
Additionally, there is a need to go beyond the confines of carbon trading, especially in the context of REALU, and to actually identify relevant private sector segments to support investment in new sustainable land uses practices such as climate-smart agriculture and agroforestry that address diverse drivers of deforestation. This requires determining what other investable opportunities can produce sustainable land management outcomes and developing a mechanism or other similar approach through which these opportunities can be connected with optimal sources of investment.
Closer engagement between civil society, NGOs, government and private sector actors is also needed to build bridges and promote and facilitate public-private partnerships.
73
VI METHODS�AND�TOOLS�FOR�LANDSCAPE�LEVEL�ASSESSMENT�AND�PLANNING�FOR�REDD+�WITH�SUSTAINABLE�BENEFITS�
6.1 Legitimacy�versus�validity:�a�dilemma�for�choosing�the�right�tool�kit�for�assessing,�planning�and�decision�making�in�landscapes�
Adapted from Bernard, F. et al., 2011
In the context of planning emissions reductions projects across all land uses, governments, technical staff and local agents often lack the tools and methods to develop and implement area-specific REDD+ or REALU initiatives. Therefore, there is a need for improved access to useful and innovative tools to enable the implementation of REDD+ and REALU to support both the technical dimensions required and the planning and implementation process itself.
As much as there is a need for tools addressing technical issues such as assessment of carbon emission reduction potential and costs and MRV and for clear numerical performance targets, tools for a transparent participatory process are of equal importance. In particular, the process that one follows is as important as the results that are produced. Without understanding the underlying process, stakeholders cannot make relevant decisions, and it is difficult to understand how a certain set of results were achieved, or why they were positive or negative. Therefore, there is crucial need for process tools which can also allow for a comprehensive and sustained approach to sharing information and experiences between local and external stakeholders.
As Figure 34 shows, some tools primarily lead to ‘extractive’ information (above the diagonal) and target external stakeholders while other tools primarily support local learning and places emphasis on participatory appraisal steps (below the diagonal) towards Free, Prior and Informed Consent (FPIC) targeting local stakeholders.
The challenge is to have tools that are relevant for both sides of the negotiation table, external and local stakeholders. Some tools are now available to support simultaneous stakeholder learning curves along the main diagonal, but current methodologies may still have to be improved, with a focus on balancing technical and participatory interests. For instance, carbon stock measurements need to comply with all requirements of the scientific process while also needing to be comprehensible to local stakeholders. Tools that stimulate learning by and with stakeholders are important. Thanks to some of these tools, people in the landscape can increase their capacity to negotiate for themselves, leading to increased understanding and project
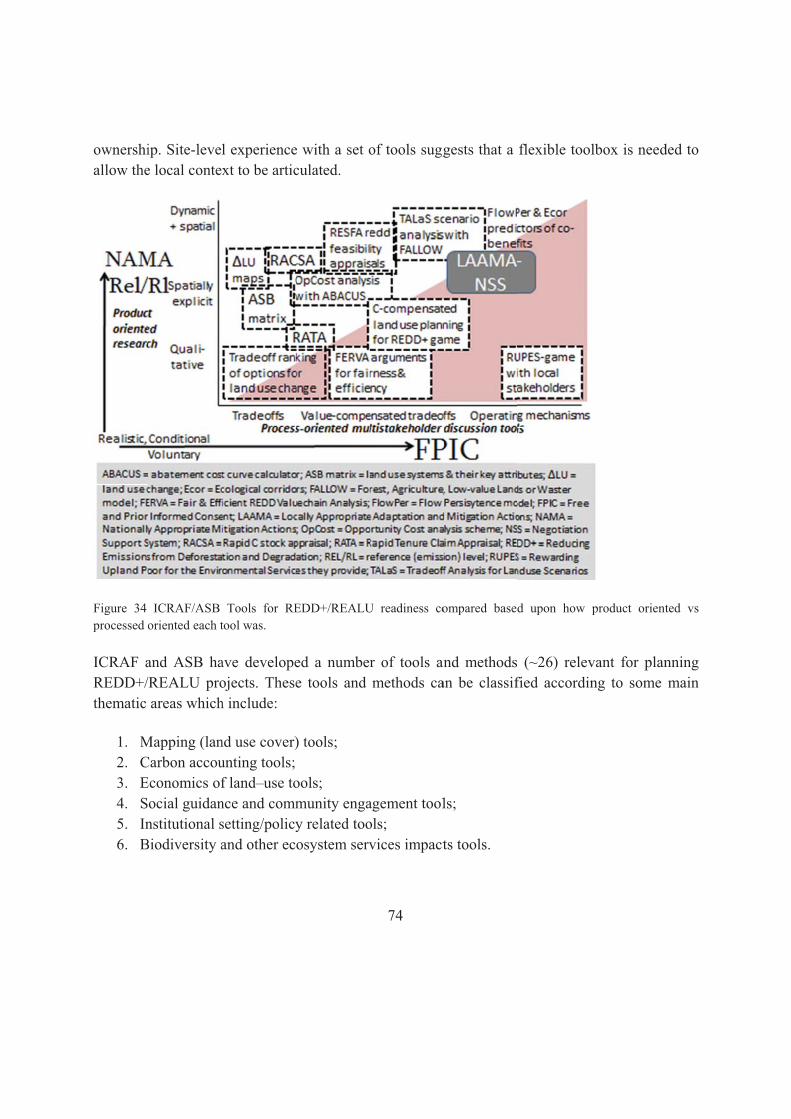
ownershiallow the
Figure 34 processed
ICRAF aREDD+/thematic
1. M2. C3. E4. S5. In6. B
ip. Site-levee local conte
ICRAF/ASB oriented each t
and ASB ha/REALU proareas which
Mapping (lanCarbon accouEconomics of
ocial guidannstitutional s
Biodiversity a
l experiencext to be artic
Tools for REtool was.
ave developeojects. Theseh include:
nd use cover)unting tools; f land–use tonce and commsetting/policyand other ec
e with a set oculated.
EDD+/REALU
ed a numbee tools and
) tools;
ools; munity engay related tooosystem serv
74
of tools sugg
U readiness co
r of tools anmethods ca
agement toolols; vices impact
gests that a
ompared based
nd methodsan be classif
ls;
ts tools.
flexible tool
d upon how
(~26) relevfied accordin
lbox is need
product orient
vant for planng to some
ded to
ted vs
nning main

75
These thematic areas can be further distilled into three categories reflecting the nature of the tool. These include qualitative, spatially explicit and spatial and dynamic tools.
Table 3 provides a definition for each category of tool along with examples.
Most tools can be relevant for various scales, i.e., national and local or project-based activities. However, depending on the scale one is operating at, specific issues should be tackled accordingly as there are varying levels of accuracy for each tool at different levels.
Beyond the scope of ASB/ICRAF tools, there exist a variety of other resources and tools which can both complement and bridge gaps inherent in ICRAF and ASB’s current set of tools. A wide range of guidelines, best practices and tools for REDD+ and REALU project assessment and development are currently available (Bernard et al., 2011).
Table 3 Category/nature of tools, how each category is defined and examples of tools that fall within the categories.
Nature of tool Definition Examples of tools Qualitative A tool that aims to an in-depth understanding
of human behaviour and the reasons that govern such behaviour. The qualitative tool investigates the ‘’why’’ and ‘’how’’ of decision making, not just the ‘’what’’, ‘’where’’, ‘’when’’.
FERVA, RUPES game, RATA
Spatially Explicit
A tool that demonstrates importance of “where” in addition to “what” and “how much”.
OppCost analysis with ABACUS, Land use change
Spatial and Dynamic
A tool that captures dynamic feedbacks between existing population demographics, economics, labour, transport, land use, energy and environmental (energy, water, etc) models and presents dynamic changes in a two-dimensional spatial manner.
TALas scenario analysis with FALLOW, RESFA
6.2 Land-use�planning�for�low-emission�development�strategies�(LUWES)�
Adapted from Agung et al. 2013
Here the LUWES tool is overviewed in detail, as it was one of the main outputs of the REALU Phase II work, and was used for identifying low-emission development strategies within the specific landscape contexts.
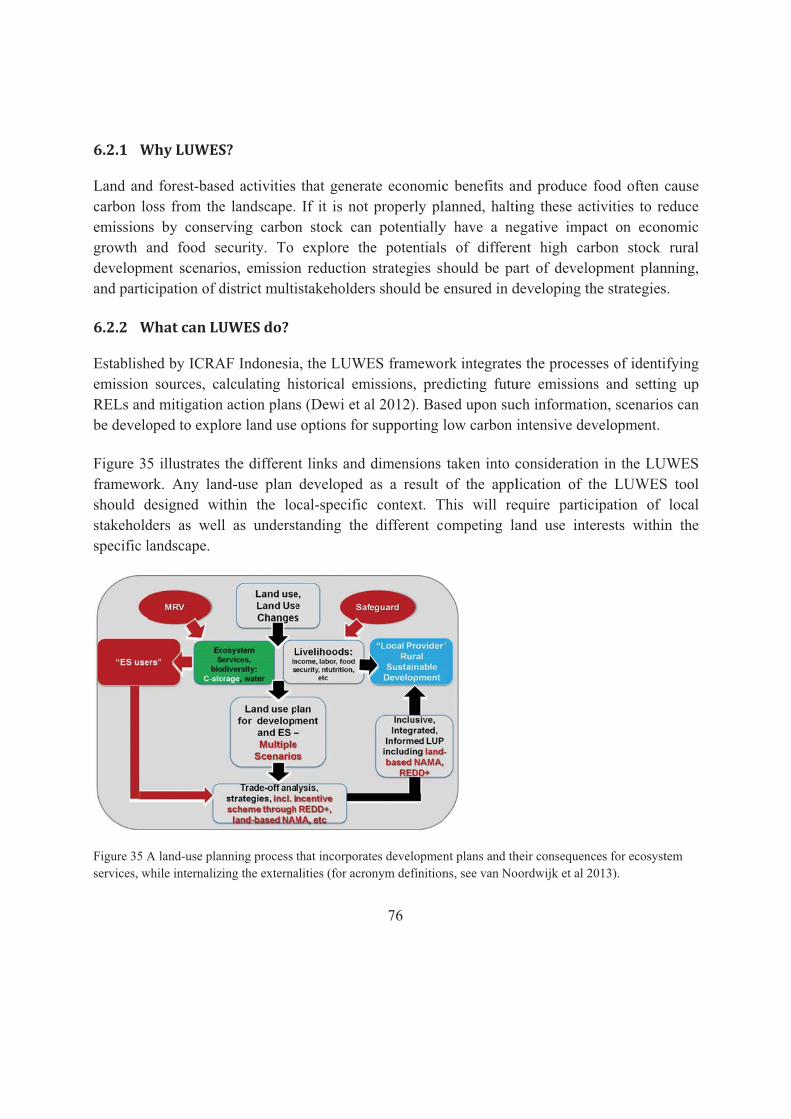
6.2.1 W
Land andcarbon loemissiongrowth adevelopmand parti
6.2.2 W
EstablishemissionRELs andbe develo
Figure 35framewoshould dstakeholdspecific l
Figure 35 Aservices, w
Why�LUWES
d forest-baseoss from the
ns by conserand food sement scenaricipation of d
What�can�LU
hed by ICRAn sources, cad mitigationoped to expl
5 illustrates rk. Any lan
designed widers as welllandscape.
A land-use planwhile internaliz
S?�
ed activities e landscape.rving carbonecurity. To ios, emissiondistrict multi
UWES�do?�
AF Indonesiaalculating hi
n action planore land use
the differennd-use plan ithin the lol as underst
nning process ing the externa
that genera If it is not n stock can
explore thn reduction istakeholder
a, the LUWEistorical ems (Dewi et a
e options for
nt links and developed
ocal-specific tanding the
that incorporatalities (for acro
76
ate economicproperly pl
n potentiallyhe potentials
strategies shs should be
ES framewomissions, preal 2012). Bas
supporting l
dimensions as a result context. Tdifferent c
tes developmenonym definition
c benefits anlanned, haltiy have a nes of differehould be paensured in d
rk integratesdicting futused upon suclow carbon i
taken into cof the appl
This will reompeting la
nt plans and thns, see van No
nd produce ing these acegative impaent high carart of develodeveloping th
s the processure emissionch informatiintensive dev
considerationlication of tequire particand use inte
heir consequencordwijk et al 2
food often ctivities to react on econrbon stock opment planhe strategies
ses of identins and settinon, scenariovelopment.
n in the LUthe LUWEScipation of erests within
ces for ecosyst2013).
cause educe nomic
rural nning, s.
ifying ng up os can
UWES S tool
local n the
tem
77
6.2.3 LUWES�in�six�steps�
Material in this section has been taken directly from Agung et al. 2013.
LUWES focuses on the local decision-making process. It offers a method for producing an integrated form of land-use planning that connects development planning and land allocation in sustainable ways (Box 1). LUWES uses ex ante trade-off analysis to help establish a land-use plan for low-emissions development at the landscape level; this would be an economic system that minimizes GHG emissions while still generating appropriate economic benefits. Length of time necessary to implement each step was approximated from the experiences in conducting LUWES in several districts in Indonesia (Johana et al 2011, Ekadinata et al 2011) (Box 2). Emission estimation through carbon-stock differences from land use and land-use changes within steps 2 and 4 can be conducted through Rapid Carbon Stock Appraisal (RaCSA) (Hairiah et al 2011), which has been widely adopted. Step 3 is setting baseline scenarios and REL at sub-national level that are fair and efficient by using the forest transition stages as a basis, which suits large and heterogeneous countries, such as Indonesia.
Box 1. LUWES in six steps
Step 1: Integration of current socio-economic conditions, development and spatial planning, biophysical and functional zones to identify planning units through multistakeholder discussions and spatial analyses
Step 2: Estimation of historical land-use changes and their consequences for carbon storage through spatial analyses, carbon stock and carbon-stock differences appraisal
Step 3: Baseline scenario development of land-use and land-cover changes and estimation of REL through stakeholder discussions and modeling of the options
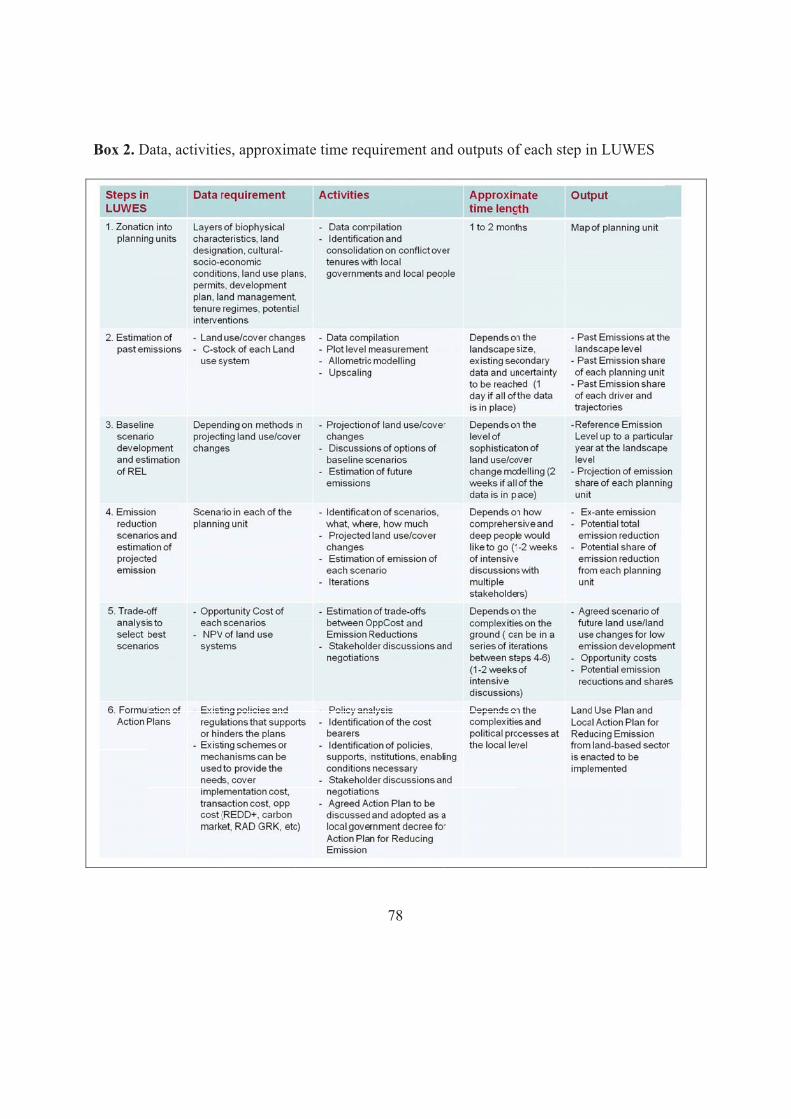
Box 2. DData, activitiees, approximmate time req
78
quirement annd outputs off each step inn LUWES
79
VII FROM�REALU�TO�LANDSCAPE�APPROACHES:�LESSONS�AND�RECOMMENDATIONS�
This report sets out to synthesize and share the lessons from the REALU project as well as provide recommendations for moving forward with landscape approaches in which emission reductions are an important component. So far, the experiences from various landscapes, countries, and specific themes have been presented. In this section the major lessons and recommendations are brought together from across the board (scales, themes, issues and stakeholder perspectives), based on the experiences reported in the publications (published and in-development) and summarized in the preceding sections. Below each major lesson is presented with corresponding recommendations.
Lesson 1: Incentives targeting non-forest high carbon stock land uses such as agroforestry, tree-based systems and peatlands were found to be attractive, potentially effective and efficient options for achieving REDD+, global climate change objectives and promoting sustainable livelihoods:
One of the assumptions at the beginning of this action research was that a landscape approach to emission reductions and managing carbon stocks can help address drivers of deforestation, reduce problems like leakage, and eliminate the need for a precise forest definition. The analyses in this project within the various landscapes suggest that non-forest land uses could potentially reduce more than forests (Section II, van Noordwijk M and Minang PA. 2009) and that targeting non-forest land uses was perceived to be potentially useful for achieving REDD+ (Minang et al., 2013; Minang et al., 2011). Compared to schemes currently under discussion for forest-based emissions mitigation, REALU will be more effective in bringing major leakage concerns into the accounting rules and allowing increased land use intensity outside forests as a contributor to net emission reductions (Minang & van Noordwijk, 2013). In this regard agroforestry and tree-based intensification systems emerged as preferred emissions reduction incentives alongside forests in all landscapes (See Section IV).
Recommendation 1: Further linkage of REDD+ discussions in the international arena with the emerging NAMAs framing is needed to create rules and incentives for landscape approaches and investments.
80
Lesson 2: Success in emissions reduction initiatives will need entry points beyond a sole emissions reduction focus given that carbon and its associated finance is unlikely to be a priority concern for local stakeholders:
In the landscapes in which ASB works and at other levels such as at the national level, emission reduction is not the primary concern of the majority of the people and governments. Figure 36 illustrates a typical hierarchy of needs across REALU’s countries and sites. Basic concerns of food security and basic infrastructure (e.g. education and health) are considered priority. This implies that other benefits such as increased food productivity or other production interests are needed alongside emissions reduction. Demonstrating the value added of emission reductions in achieving wider economic, social and environmental interests is extremely important (Dewi et al., 2013; Feasibility studies in Section II). This lesson leads to two recommendations.
Recommendation 2: Emissions reduction planning and implementation needs to be integrated into the wider development aspirations of stakeholders if it is to succeed.
Recommendations 3: Landscape approaches would benefit from greater effectiveness and efficiency when synergy is sought between emission reductions and other environmental, social and economic objectives including climate change adaptation and green economy approaches.
Lesson 3: A co-investment approach is emerging as a necessary condition for achieving multiple landscape-level objectives:
From our analyses at the landscape level and other cost estimates, with the current carbon investment flows and a carbon price below 5 USD per tCO2e, it is unlikely that cost of emissions will be met in many places. Cost of participation and negotiation of multiple objectives among many actors can be very high. Moreover, little evidence was found of direct government investments in emission reduction programmes in the project countries across all scales. In some cases taxes levied on electricity or water use institutions and allocated to watershed maintenance could be leveraged in such a co-investment mechanism. Therefore, the recommendation follows below.
Recommendation 4: Key frameworks and models should be developed to enable better private sector involvement (financing and sharing of technical expertise) in emission reductions and sustainable development schemes at the landscape level. This could allow and involve innovative financial mechanisms for public and private investments. Such a mechanism could allow integration and optimization between currently separated mitigation and adaptation funding streams for example.
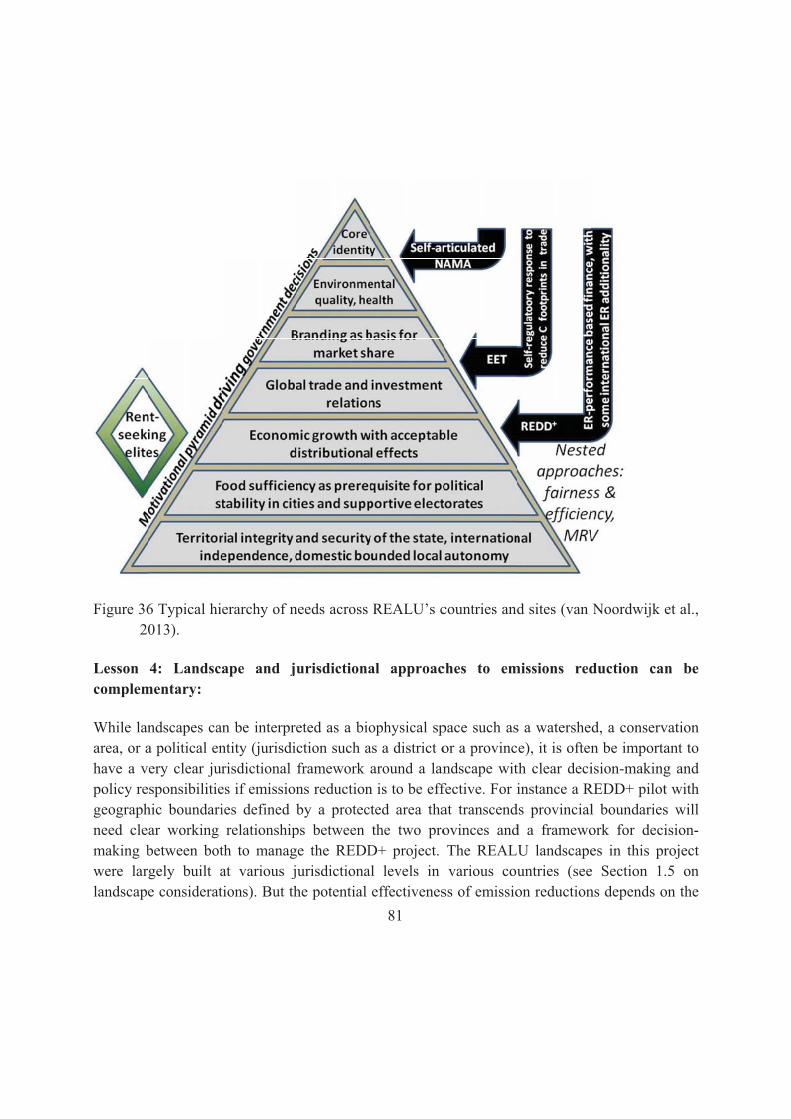
Figure 362
Lesson complem
While lanarea, or ahave a vpolicy regeographneed clemaking bwere larlandscap
6 Typical hi013).
4: Landscmentary:
ndscapes caa political en
very clear juresponsibilitiehic boundariar working between botrgely built ae considerat
erarchy of n
ape and j
an be interprntity (jurisdirisdictional
es if emissioies defined relationship
th to managat various jtions). But th
needs across
urisdictiona
eted as a bioction such aframework ns reductionby a protec
ps between ge the REDDjurisdictionahe potential
81
REALU’s c
al approac
ophysical spas a district oaround a lan
n is to be effcted area tha
the two proD+ project. al levels in
effectivenes
countries and
ches to em
pace such asor a provincndscape witfective. For iat transcendovinces andThe REALUvarious cou
ss of emissio
d sites (van
missions red
s a watershee), it is often
th clear deciinstance a R
ds provinciald a framewoU landscapeuntries (seeon reduction
Noordwijk e
duction can
d, a conservn be importaision-making
REDD+ pilotl boundariesork for decies in this pr
e Section 1.ns depends o
et al.,
n be
vation ant to g and t with s will ision-roject .5 on on the
82
degree of decentralization and/or devolution of power to the jurisdictional level in terms of planning and for more specific issues of land management and natural resources management including REDD+. Still huge issues around political economy influence the potential for success of landscape approaches (See Section 5.1).
Recommendation 5: Better research is required to understand and identify potential options for landscapes and jurisdictional interactions under different political economy contexts.
Recommendation 6: REDD+ readiness (and indeed future climate change readiness –NAMA, climate smart agriculture and others) needs to invest more in sub-national level REDD+ designs in order to enable landscape approaches for emissions reduction to thrive. Current readiness focuses more on international accountability structures and national levels, which does not automatically translate to a nested-systems architecture required to address drivers of deforestation at the landscape level.
Lesson 5: Nesting landscapes to the national level is a necessary condition for success and scaling-up:
In principle emission reductions under REDD+ and/or NAMA will have to be accounted for at the national level, hence, reference levels and MRV approaches and methods will have to be integrated at both the landscape and at the national level. Beyond that, sharing the national emission reductions “burden” and benefits needs to be clarified across sub-national and national levels. These issues indicate that clearer nesting rules are required for landscape-level emission reductions to be successful in the long run (Minang & van Noordwijk, 2012). In Indonesia the REALU project is working with district and provincial government to determine references levels and realistic emission reduction targets that take into account their development aspirations using the LUWES methodology. These districts and provinces can thus use these in negotiations of their share of the national emission reduction target as a next step.
Recommendation 7: Rules and guidance for nesting landscapes to the national level are needed. These could include specifying among others issues related to ownership rights to carbon, duties and royalties to be paid on investments, crediting, distribution of national emission targets, benefit sharing, risk management, MRV and baselines.
83
Lesson 6: Identifying and understanding leverage points and potential levers of emissions beyond landscape boundaries is necessary to address drivers effectively:
Drivers of land use change and emissions reduction do not respect landscape boundaries hence landscape emission management analysis and planning should go beyond the physical boundary of a landscape. This also suggests working beyond the boundaries of the space referred to as a landscape. The analyses of drivers at landscape and national levels (largely reviews) with classic land use change and modelling approaches, though useful, were not sufficient to enable designs of incentives that target specific leverage points and relevant levers.
Recommendation 8: The design and use of approaches that aim at identifying leverage points and levers for addressing drivers, as opposed to the current identification of land uses responsible for most conversions and a description of the processes, is needed. Beyond this, leverage points, the potential effects of various levers and the chain of reactions that these levers can have in the reversal of drivers of emissions need to be identified and analysed.

84
REFERENCES�Agung, P., Dewi, S., Johana, F., Ekadinata, A. Submitted Land-use planning for low-emission
development strategies (LUWES). ASB Policy Brief 35
Agus, F., Maswar, M. Anang Firmansyah, Jubaedah, Siti Nurzakiah. 2011. Spatial Variation of Water Table Depth and CO2 Emission from a Peat Soil in Indonesia. Indonesian Soil Research Institute, Bogor, Indonesia. With participation of Assessment Institute of Agricultural Technology (AIAT) and Indonesian Swamp Agriculture Research Institute (ISARI) 2011
Alemagi, D., Feudjio, M. 2013. Incentives for intensification of cocoa agroforestry systems in the Efoulan municipality of Cameroon. Alternative to Slash and Burn (ASB) Final country report for Cameroon. ASB Partnership for the Tropical Forest Margins, Nairobi, Kenya
Anderson, A. B. 1987. Manejo de bosques de palmas nativas: una comparación de estudios de casos en Indonesia y Brasil. Agroforestry, realidades, posibilidades y potencialidades. H.L. Gholn. Ed. MartinusNojhoff Publisher.
Bac Kan Statistics Office. 2011. Bac Kan Statistical Yearbook 2010. Hanoi: Statistics Publishing House.
Bejarano, P.; Piana. R. 2002. Plan de manejo de los aguajales aledaños al caño Parianri. Junglevagtfor Amazonas WWF – AIF/DK, Comprehensive Program of Development and Conservation - Pacaya Samiria. Iquitos, Peru. 85 p.
Bernard, F., Minang, PA., van Noordwijk, M. 2011. Review of current tools and methods for REDD+ and REALU value chain. ASB Partnership, Nairobi, Kenya.
Bernard, F., McFatridge, S., Minang, P. 2012. The Private Sector in the REDD+ Supply Chain: Trends, Challenges and Opportunities. ASB Partnership for the Tropical Forest Margins and International Institute for Sustainable Development.
Corning PA (1998) The Synergism hypothesis: on the concept of synergy and its role in the evolution of complex systems. J Soc Evol Syst 21(2): 133-172.
85
Dewi, S., Johana, F., Ekadinata,A., Agung, P. 2013. Land-use planning for low-emission development strategies (LUWES).. ASB Policy Brief No. 15. ASB Partnership for the Tropical Forest Margins, Nairobi, Kenya. Available at: www.asb.cgiar.org
Dewi, S.; Ekadinata, A.; Galudra, G.; Agung, P.; Johana, F. 2011 Land use planning for low emission development strategy (LUWES) - Case studies from Indonesia
Do Trong, H., Jindal, R., Hoang, MA; Catacutan, D..2012. Feasibility notes for reducing emissions from all land uses in Bac Kan province, Vietnam. Contributors: Dam Viet Bac, Alba Saray Pérez Terán, Rachmat Mulia, and Peter Minang. World Agroforestry Centre – ICRAF Vietnam, Hanoi.
Do, T.H., Catacutan, D., Eastman, D., Guarnaschelli, S., Dam, V.B., and Hoang, V.G. 2013. A pilot incentive scheme for reducing emissions from all land uses in Bac Kan landscape. Hanoi: World Agroforestry Centre (ICRAF), Hanoi, Vietnam. 26 p
Do Trong, H.. Jindal, R., Mulia, R., Hoang, MA., Catacutan, D.. 2013. REALU Country Report – Vietnam
Eastman D, Catacutan DC, Do TH, Guarnaschelli S, Dam VB, Bishaw B. 2013. Stakeholder preferences over rewards for ecosystem services: implications for a REDD+ benefit distribution system in Viet Nam. Working Paper 171. Bogor, Indonesia: World Agroforestry Centre (ICRAF) Southeast Asia Regional Program.
Ekadinata, A., van Noordwijk, M., Dewi, S., and Minang, P.A., 2010. Reducing emissions from deforestation, inside and outside the 'forest'. ASB Brief 16. Nairobi: ASB Partnership for the Tropical Forest Margins.
Eliasch, J. (2008). Climate change: Financing global forests: the Eliasch review. Earthscan.
Ekadinata A, Vincent G (2011) Rubber agroforests in a changing landscape: analysis of land use/cover trajectories in Bungo district, Indonesia. Forests, Trees and Livelihoods 20: 3–14
86
Feudjio, M., Magne, A.N., Alemagi, D., Robiglio, V., Ewane, N., Yemefack, M., Asaah, E., Tchienkoua, M. 2012. Incentives measures for the REED+ mechanism and sustainable development in the Efoulan Municipality of the South Region of Cameroon. Alternative to Slash and Burn (ASB) Technical Report. ASB Partnership for the Tropical Forest Margins, Nairobi, Kenya.
Freitas, L.; Otárola, E.; Del Castillo, D.; Linares, C.; Martínez, P.; Malca, G. 2006. Servicios ambientales de almacenamiento y secuestro de carbono del ecosistema aguajal en la reserva nacional Pacaya Samiria, Loreto - Perú, Technical Document No. 29. Peruvian Amazonia Research Institute, 65pGarcia, D., Alegre, J., Silva, C. 2013. Characterization of aguajales in the Aguaytia river basin: Current C stocks, its condition as peatland, potential threats and options for future management. IIAP and World Agroforestry Centre (ICRAF), Lima, Peru.
Hairiah K, Dewi S, Agus F, Velarde S, Ekadinata A, Rahayu S, van Noordwijk M. 2011. Measuring carbon stocks across land use systems: a manual. Bogor, Indonesia: World Agroforestry Centre (ICRAF) Southeast Asia Regional Program.
Hoang M H, Hoan DT, Thoa P M, van Noordwijk M and Minang PA (2013) Benefit distribution across scales to reduce emissions from deforestation and forest degradation (REDD+) in Vietnam. Land Use Policy 31, 48-60
Immirzi, C.P., E. Maltby, and R.S. Clymo. 1992. The global status of peatlands and their role in carbon cycling, Report No. 11, Wetlands Research Group. Friends of the Earth, London.
Johana F, Agung P, Galudra G, Ekadinata A, Fadila D, Bahri S, Erwinsyah. 2011. Merencanakan pembangunan rendah emisi di Kabupaten Merangin, Provinsi Jambi. Planning low-emissions development in Merangin district, Jambi province. Brief 17. Bogor, Indonesia: World Agroforestry Centre (ICRAF) Southeast Asia Regional Program.
JOFCA and JFTA. 2011. Interim Report 2: The Study on Potential Forests and Land Related to “Climate Change and Forests” in the Socialist Republic of Viet Nam. Hanoi: JICA in Vietnam
Khan, F.; Mejía, K.; Moussa, F.; Gómez, D. 1993. Mauritia flexuosa (Palmae), la más acuática de las palmeras amazónicas. 287-308. In: Las plantas vasculares en las aguas continentales del Perú. Khan , F.; León, B.; Young, K.R. (comp). IFEA. Lima Perú. 357 p.
87
Mather, A. S. (1992). The forest transition. Area, 367-379.
Minang PA, van Noordwijk M. 2013. Design challenges for Reduced Emissions from Deforestation and forest Degradation through conservation: Leveraging multiple paradigms at the tropical forest margins. Land Use Policy
Minang PA, Duguma LA, Bernard F, Mertz O, van Noordwijk M. 2013. Prospects for Agroforestry in REDD+ landscapes in Africa. Current Opinion in Environmental Sustainability 2014, 6: DOI 10.1016/j.cosust.2013.10.015.
Minang PA, Bernard F, van Noordwijk M, Kahurani E. 2011. Agroforestry in REDD+: Opportunities and Challenges. ASB Policy Brief No. 26, ASB Partnership for the Tropical Forest Margins, Nairobi, Kenya
Minang et al. (in review). REDD+ readiness progress across countries: time for reconsideration. Submitted to Climate Policy.
Murdiyarso, D., K. Hergoualch, and L.V. Verchot. 2010. Opportunities for reducing greenhouse gas emissions in tropical peatlands. PNAS (www.pnas.org/cgi/doi/10.1073/, November 16, 2010) 107:19655-19660.
Nguyen Trong Khiem, 1985. Potential of peatlands for energy development in Vietnam. Coal Industry Group - Minerals of Vietnam.
Page, S.E., J.O. Rieley, and R.A.J. Wüst. 2006. Lowland tropical peatlands of Southeast Asia, p. 145-172, In P. Martini, et al., eds. Peatlands: basin evolution and depository of records on global environmental and climatic changes. Elsevier (Developments in Earth Surface Processes series), Amsterdam.
Page, S.E., R.A.J. Wüst, D. Weiss, J.O. Rieley, W. Shotyk, and S.H. Limin. 2004. A record of Late Pleistocene and Holocene carbon accumulation and climate change from an equatorial peat bog (Kalimantan, Indonesia): implications for past, present and future carbon dynamics. Journal of Quaternary Science 19:625-635.
Peters, C.; Balick, M.; Khan , F.; Anderson, H. 1989. Oligarchic forests of economic plans in Amazonia: utilization and conservation of an important tropical resource. Conservation Biology. (3)4: 341-349.
88
Rieley, J.O., R.A.J. Wüst, J. Jauhiainen, S.E. Page, H. Wösten, A. Hooijer, F. Siegert, S.H. Limin, H. Vasander, and M. Stahlhut. 2008. Tropical peatlands, carbon stores, carbon gas emissions and contribution to climate change processes, p. 123-148, In Maria Strack, ed. Peatlands and climate change. International Peat Society.
Robiglio, V., Silva, C., White, D., Hyman, G., Donovan, J., Cornelius, J.. 2012. An Assessment of REALU Feasibility in smallholder colonist farmers context in PADRE ABAD (Ucayali-Peru). World Agroforestry Centre – ICRAF Peru, Lima.
Samek, J.H., Skole, D.L. and Khoa, P.V. 2012. unpublished. Global Observatory for Ecosystem Services, Forestry, Michigan State University.
SDSR (2006). Stratégie de Développement du Secteur Rural (SDSR): Synthèse du volet Agriculture et Développement Rural. Ministère de l’Agriculture et du Développement Rural -MINADER Cameroun.
Silva, C., Robiglio, V., Donovan, J., Paino, B. 2013. Incentives for carbon stock enhancements , a study of cocoa producers and cooperatives in Padre Abad, Peru: World Agroforestry Centre (ICRAF), Lima, Peru.
Simula Ardo, M. (2010). Analysis of REDD+ financing gaps and overlaps. REDD+ Partnership Report.
Suyanto, Ekadinata, A., Sofiyuddin, M. and Rahmanullah, A. In Press. Opportunity Costs of Emissions Caused by Land-Use Changes.
Tchienkoua, M.Y., Nyobe, T., Njomgang, R. 2011. Characterization of peatlands in the upper Nyong river basin (Central Southern Cameroon). Institute of Agricultural Research for Development (IRAD)
United Nations Environment Programme Financing Initiative. (2011). REDDY, set, grow. Part II: Private sector suggestions for international climate change negotiators. UNEP Finance Initiative Biodiversity and Ecosystems Workstream (BEWS) and Climate Change Working Group (CCWG).
van Noordwijk M and Minang PA. 2009. “If we cannot define it, we cannot save it” ASB Policy Brief No. 15. ASB Partnership for the Tropical Forest Margins, Nairobi, Kenya. Available at: www.asb.cgiar.org
89
van Noordwijk, M.; Minang, P.A.; Dewi, S.; Hall, J.; Rantala, S. 2009. Reducing Emissions from All Land Uses: The case for a whole landscape approach. ASB Policy Brief No. 13, ASB Partnership for the Tropical Forest Margins, Nairobi, Kenya
van Noordwijk, M.; Agus, F.; Dewi, S.; Purnomo, H. 2013. Reducing emissions from land use in Indonesia: motivation, policy instruments and expected funding streams. Mitigation and Adaptation Strategies for Global Change DOI 10.1007/s11027-013-9502-y
von Eye A, Schuster C, Rogers WM (1998) Modelling synergy using manifest categorical variables. Int J Behav Dev 22 (3):537-557.
Vu Tan Phuong, Do Dinh Sam & Tran Thi Thu Anh. 2011. Report on potential for emission reduction through peatlands management in Vietnam. Research Centre for Forest Ecology and Environment (RCFEE)
Widayati, A., Suyanto, van Noordwijk, M. 2011. Towards Reduced Emissions in a High-Stake District. REALU Project Design for Tanjung Jabung Barat (Tanjabar), Jambi, Indonesia. (Version 1.0). World Agroforestry Centre – ICRAF Indonesia, Bogor.
Widayati, A. and Suyanto (eds). Substantive Report of REALU II- Indonesia. Version 1.0. 2013. World Agroforestry Centre – ICRAF Southeast Asia. Indonesia, Bogor – August 2013
Yemefack, M., Alemagi, D., Duguma, L.A., Minang, P.A. 2013. Linking development pathways and emission reduction at local levels: An analysis of feasibility in the Efoulan municipality, Cameroon. ASB Policybrief. ASB Partnership for the Tropical Forest Margins, Nairobi, Kenya

IAARD
ISBN 978-92-9059-355-3
The ASB Partnership for the Tropical Forest Margins is working to raise productivity and income of rural households in the humid tropics without increasing deforestation or undermining essential environmental services. ASB is a consortium of over 90 international and national-level partners with an ecoregional focus on the forest agriculture margins in the humid tropics, with learning landscapes in the western Amazon basin of Brazil and Peru, the Congo forest in Cameroon and the Democratic Republic of Congo, southern Philippines, northern Thailand, northern Vietnam and the island of Sumatra in Indonesia.
This work was undertaken as part of Reducing Emissions from All Land Uses (REALU) with generous funding by NORAD, the Norwegian Agency for Development Cooperation. The views in this report are not those of the funder.
© 2013 ASB
The World Agroforestry Centre is a member of the CGIAR Consortium