Embed Size (px)
Citation preview
Towards a global epidemiological database for helminth
infections
Pia Heino
Bachelor of Medicine
Intern
World Health Organization
Helsinki 29.10.2008
Dissertation
Supervisors: Dirk Engels, M.D., Ph.D., World Health Organization
Sakari Jokiranta, M.D., Ph.D., University of Helsinki
Seppo Meri, M.D., Ph.D., University of Helsinki
WORLD HEALTH ORGANIZATION
Department of Control of Neglected Tropical Diseases
UNIVERSITY OF HELSINKI
Faculty of Medicine
1
1 Introduction
Helminth infections such as schistosomiasis, soil-transmitted helminthiasis (STH),
onchocerciasis and lymphatic filariasis (LF) impose a great burden on the developing
world. They are known to represent a major public health problem in tropical and
subtropical countries, especially in Sub-Saharan Africa and South-East Asia, affecting
thousands of millions of people worldwide. The burden is caused not only by the
immediate and direct consequences of the infection itself, but especially by the associated
long-term and more subtle morbidity. Due to the chronic nature and small mortality
associated with these diseases, their significance has for long been underestimated.
The burden caused by schistosomiasis, STH, onchocerciasis and LF is mainly due to
chronic exposure to the infectious agents leading to re-infection episodes. Subsequent re-
infection episodes lead to accumulation of worms in the human body, which is directly
related to morbidity1,2.
Approximately 200 million people worldwide are infected by schistosomiasis and 85% of
them live in Sub-Saharan Africa3. Schistosoma mansoni and Schistosoma japonicum are the
main causative organisms of intestinal schistosomiasis, while Schistosoma haematobium
gives rise to urinary schistosomiasis. Schistosoma mekongi and Schistosoma intercalatum
also cause intestinal schistosomiasis, but are of less importance. Chronic intestinal
schistosomiasis can lead to liver enlargement, ascites and other signs of increased portal
pressure. Common chronic manifestations of urinary schistosomiasis include bladder and
urethral fibrosis, hydronephrosis and bladder cancer. Urinary schistosomiasis can also
develop into genital schistosomiasis, which has an impact on fertility4.
STH is caused either by Ascaris lumbricoides, Trichuris trichiura and the hookworms
Necator americanus and Ancylostoma duodenale, as well as by a combination of such
worms (polyparasitism). STH causes, in addition to acute manifestations such as intestinal
2
obstruction, a wide range of nutritional disorders. Chronic bleeding, which mainly occurs in
hookworm infection but also in trichuriasis2, leads to iron-deficiency anaemia.
Lymphatic filariasis affects an estimated 120 million people in at least 80 endemic
countries5. The disease is characterized by the development of chronic manifestations,
which are a consequence of damage to the lymphatic system. These manifestations include
lymphedema (elephantiasis) of the limbs and damage to the genitalia with occasionally seen
massive hydrocele.6 The ongoing Global Programme to Eliminate Lymphatic Filariasis
(GPELF) carries out mass administration of anthelminthic drugs in countries in which LF is
endemic7,8.
Onchocerciasis, also known as ‘river blindness’ is an eye and skin disease caused by
Onchocerca volvulus. The disease symptoms include skin symptoms such as itching, skin
depigmentation, and lymphadenitis, which may lead to genital swelling. Microfilariae
produced by the female worms migrate inside the internal tissues of the eye causing
inflammation, bleeding and eventually blindness. There are several control programs
treating individuals against onchocerciasis, including the African Programme for
Onchocerciasis Control (APOC)9,10,11, the Onchocerciasis Elimination Program for the
Americas (OEPA)11,12 and the Onchocerciasis Control Program (OCP)9,11, which was
officially closed in 2002, but is still working in special intervention zones (SIZ) in a
number of countries in West Africa13.
In addition to overt morbidity as stated above, helminth infections are responsible for a
series of more subtle pathological conditions, which are known to influence the general
health status of affected individuals. These conditions are determined by the chronic
inflammation status associated with infection, thus include weakness, exercise intolerance
and pain; such status of general "non-well-being" produces a negative impact on growth
and learning capacities in children14,15 and limits the social and working capacities of
adults2. According to recent evidence, helminthiasis might also variously increase the risk
of transmission as well as severity of HIV/AIDS16,17, malaria18,19 and tuberculosis17,20.
3
Helminth infections not only have an effect on the health of affected individuals, but from a
more general perspective, represent a significant burden to the health systems of the
endemic countries, and hinder their economic and social development. They should
therefore be considered as a substantial public health problem.
In 2006, the World Health Organization (WHO) launched a new strategy against helminth
infections, based on the concept of preventive chemotherapy21. According to this
recommendation, anthelminthic drugs should be distributed to all individuals at risk of
infection, with the aim of reducing the intensity of infection and, as such, to prevent or
reduce morbidity associated with the infection. In large-scale preventive chemotherapy
interventions, drugs are administered to the entire population in a given endemic
administrative setting (state, region, province, district, etc.), or to groups at highest risk, at
regular intervals. Anthelminthic drugs can be administered alone or in combination
according to the disease or the diseases targeted. To treat the three types of helminth
infections discussed here the following drugs are used: praziquantel against
schistosomiasis, albendazole (or mebendazole) against STH and a combination of
ivermectin and albendazole or ivermectin and di-ethyl-carbamazine citrate (DEC) against
LF. Considering that the three diseases are frequently co-endemic, praziquantel,
albendazole and ivermectin can also be co-administered to the same individual at the same
time22. Anthelminthic drugs have beneficial effects beyond the diseases targeted:
ivermectin for example can also treat ectoparasite infections such as lice and scabies23,24,
thus expanding the beneficial effect and compliance linked to its large-scale distribution.
The WHO recommendation aims at reaching all individuals at risk of helminth infection in
an endemic area without carrying out individual diagnosis. Identification of target areas is
based on population-based assessment of the endemic status of such area. Information
about prevalence of a given infection in a given district is the key indicator in making the
decision whether large-scale preventive chemotherapy should be carried out against that
disease or not. While a standard interval of re-treatment is recommended for preventive
chemotherapy interventions against LF and onchocerciasis, in drug distribution activities
4
directed against schistosomiasis and STH, prevalence is also used to determine the
appropriate frequency of drug administration. This is based on the fact that re-infection
rates will be higher where the prevalence of infection is higher. Therefore a less-frequent
treatment is warranted in order to keep the worm burden in infected individuals low.
Monitoring changes in prevalence are an important tool for evaluation of mass-drug
administration programs, and are used as an indicator to measure the impact of preventive
chemotherapy interventions on morbidity and transmission.
An assessment of the prevalence of infection is instrumental in determining who has to be
treated (high-risk groups or entire communities); and information about the number of
people at-risk to be treated is needed to appropriately implement preventive chemotherapy
interventions. For many countries, however, no systematic source of data exists.
Information is frequently scattered across literature, and often only estimates of prevalence
are available. The situation is, however, different between one disease and another.
The quality and quantity of information are more satisfactory for LF and onchocerciasis,
than for schistosomiasis and STH.
When the OCP was launched in 1974, the main control strategy adopted against
onchocerciasis was vector control using aerial larvicidal spraying13. As a consequence, a
process aiming at identifying the blackfly (Simulium spp.) breeding sites was implemented.
This resulted in large-scale collection of information on geographical distribution of
endemic areas. When ivermectin became available for the treatment of onchocerciasis in
1987 and it's distribution based on a donation from Merck & Co., Inc. started, identification
of communities to be targeted by mass drug administration proved equally necessary, and
was conducted by using techniques such as the Rapid epidemiological mapping of
onchocerciasis (REMO) and software such as the Geographical Information System (GIS).
Data on LF have also been widely gathered in the context of the Global Programme to
Eliminate Lymphatic Filariasis, that was launched in 2001. Seeing that two of the three
5
drugs used against lymphatic filariasis by countries implementing GPELF are donated by
the producers (Merck & Co., Inc. for ivermectin and GlaxoSmithKline for albendazole),
epidemiological data gathered since the inception of mass-drug administartion activities by
donor institutions were requested. This was done in order to estimate tablets needed and
justify the donation itself. As a consequence, a major mapping exercise was started and is
still ongoing, an effort that has made prevalence data for LF widely available.
On the contrary, for schistosomiasis and STH, mapping exercises are more gradual. There
have ,indeed, been previous attempts to gather information on infection prevalence for
helminth infections; among these is the Atlas of the Global Distribution of
Schistosomiasis25 published in 1987 by the University of Bordeaux (France) in
collaboration with the World Health Organization, which mapped transmission of
schistosomiasis in 76 countries. Although an important source of data, the Atlas was
conceived as a compilation of existing information rather than as an exercise aiming at
establishing where the disease was transmitted, and is indeed now more than 20 years old.
Other attempts, such as the estimates of Utroska et al.26, provided insight on number of
people infected by schistosomiasis and on those at risk of infection without information
about prevalence. Available data are even scarcer for STH, for which no systematic effort
of data generation or collection can be registered.
Irrespective of the quality and quantity of data available, existing databases only provide
information about the prevalence of a single type of helminth infection without addressing
other human helminth infections. Therefore they are of limited use in a context where
WHO recommends to tackle such diseases in a coordinated and integrated fashion,
following the principles of preventive chemotherapy21.
In order to address the problem represented by the lack of information on distribution and
burden of helminth infections, and more specifically to support planning of co-
administration of different anthelminthic drugs in countries where two or more helminth
6
diseases are transmitted, a single database that gathers together all available information is
needed.
Here, I describe the process of constructing and contributing to such epidemiological
database, which attempts to incorporate all information available on the global prevalence
of STH, schistosomiasis, LF and onchocerciasis. The objective is to develop a single source
of epidemiological information on which decisions on the implementation of large-scale
anthelminthic drug administration can be based. The aim is to establish a database with
information on prevalence by implementation unit (i.e. the smallest administrative area in
which the same disease control strategy is applied). This database can then be used as a tool
to make a decision whether the population of a given district is to be treated, with which
drug and at what frequency. Therefore the database will have a considerable importance in
the work of reducing morbidity associated with helminth infections. My goal is also to
gather information on the availability of epidemiological data on helminth infections by
district level and to find out where further data collection should be carried out.
2 Materials and methods
The work presented in this thesis focuses on schistosomiasis and STH. The aim is that of
complementing epidemiological data on lymphatic filariasis and onchocerciasis which, as
stated above, is more widely available from a number of countries. The spirit of my work is
that of contributing towards the construction of a global epidemiological database for
helminth infections, which should include all information available on the other diseases
currently targeted by preventive chemotherapy interventions, namely lymphatic filariasis
and onchocerciasis.
Most of the data for the new database was extracted from a pre-existing database: the
World Health Organization's global database for schistosomiasis and STH27. Because of the
7
fact that the latest information of the WHO database dates back to 2005, data from this
source was complemented by computer-aided literature searches. Data for India was
obtained, in addition to the Medline search for recent studies, from a dataset received from
the Sabin Vaccine Institute (Washington DC, USA). The Sabin dataset contains prevalence
numbers from several published studies conducted between 1992 and 2001 and data
gathered by the National Institute of Communicable Diseases in India.
Data on schistosomiasis and STH was gathered for each of the helminth species
individually, except for the hookworms Necator americanus and Ancylostoma duodenale
for which the data were gathered together.
2.1 Inclusion criteria
According to some recent reassessments, the burden of disease attributable to helminth
infections - including schistosomiasis and STH - is underestimated28,29,30. For these two
diseases, part of the problem lies with the incorrectness of data on prevalence of infection
currently available. The challenge therefore is to establish a database with up-to-date
epidemiological data that contains accurate and extensive information on such indicator. In
order to construct the database with up-to-date epidemiological information, only data from
1991 onwards was included in the database. For data obtained between 2000 and 2008, for
a given area, only the most recent data were included in the database. If there was no data
available from this period, the highest prevalence found between years 1991-1999 was
chosen. The year of survey for each chosen prevalence figure was included in the database.
If information on number of study population (sample size) was available, only studies
carried out with a minimum of 20 people were included. For STH, the sample size was
limited to 20 for ascariasis, trichuriasis and hookworm disease each.
The prevalence of infection was chosen as the key indicator for the database, and searches
were directed towards finding prevalence figures for each helminth species taken into
8
account. The prevalence of infection is defined as the proportion of individuals infected
with a given helminth at the time of the survey. The prevalence in a given zone is obtained
by diagnosing helminth infection on a number of sampled individuals. For the sake of
standardization, only data obtained by using parasitological diagnostic techniques or a
questionnaire were included in the database. In other words, studies which calculated
prevalence by using clinical diagnosis or immunodiagnosis were excluded.
Parasitological techniques are based on the identification of parasite eggs in biological
samples (urine and stool). For urine samples, identification of eggs of S. haematobium is
carried out by performing the urine filtration technique31. On stool samples, identification
of eggs of S. mansoni, S. japonicum, S. mekongi and S. intercalatum, as well as of A.
lumbricoides, T. trichiura and the hookworms is carried out by performing the Kato-Katz
thick smear technique32,33,34.
In some cases, prevalence data for S. haematobium obtained from rapid assessment surveys
was included in the database. In such surveys, prevalence data is gathered by distributing a
questionnaire to primary-school children in an endemic area. Diagnosis is based on self-
observed macrohematuria (visible haematuria).35 Calculation of the prevalence of infection
based on questionnaire for macrohaematuria is known to underestimate by 20% prevalence
obtained by parasitological methods36 as only individuals with a morbidity burden
sufficient to produce blood loss in the urinary tract will be identified as positive. However,
the questionnaire has been proven to be effective for determining prevalence in high risk
areas37,38,39.
9
2.2 Data abstraction from the WHO global database for schistosomiasisand STH
In 2001, the World Health Assembly requested that implementation of activities directed
against schistosomiasis and soil-transmitted helminthiasis be associated with a monitoring
system aiming at tracking progress made at a global level40. This led to the establishment of
the WHO Global Databank for schistosomiasis and soil-transmitted helminthiasis27. In
addition to epidemiological data, the WHO databank contains information on the number of
people treated each year against schistosomiasis and soil-transmitted helminthiasis.
Epidemiological data constituting the WHO Global Databank for schistosomiasis and soil-
transmitted helminthiasis had been gathered by conducting Medline searches for endemic
countries. Such information had been integrated with data obtained from grey literature and
unpublished studies collected and compiled by WHO headquarters, regional and country
offices through contacts established with officers in the Ministries of Health and other
implementing institutions at country level.
For the WHO South East Asia Region and Eastern Mediterranean Region, searches had
been done from year 2000 onwards. For WHO African Region some of the data had been
extracted from an earlier dataset and some of the data dated back to 1962.
The WHO databank contains 996 references for epidemiological data. The Medline
searches were conducted mainly in 2004, and the newest study available in the databank
was from 2005. For this reason, the data-abstraction was complemented by doing a new
literature search.
10
2.3 Literature search
In order to find the most updated epidemiological data, computerized searches were
performed using Ovid Medline (date of publication from 1950 to July 2008). For data
related to schistosomiasis, the search term 'schistosomiasis' was used with the keyword
'prevalence' or with the subheading 'epidemiology'. Separate searches for each of the soil-
transmitted helminth infections were conducted using search terms 'ascariasis', 'trichuriasis'
and 'hookworm infection' also combined with the keyword 'prevalence' and subheading
'epidemiology'. All searches were limited to humans and to years 2004-2008. The results
were collected as abstracts, and reviewed. All studies conducted with animals, people other
than original inhabitants of the zone in question, as well as studies conducted in non-
endemic countries and studies not containing epidemiological data were excluded in this
phase. Also studies containing only data at the level of the whole country were excluded.
Studies written in languages other than English were excluded if they did not have an
abstract in English or the abstract did not contain information about infection prevalence.
For schistosomiasis, after a preliminary screening of studies for eligibility, 70 out of the
251 studies identified were chosen for further evaluation. One study could not be located
and therefore was not included in the preliminary evaluation. Prevalence data were
abstracted for the database from 36 of the studies.
A total of 125 studies for STH were identified. 48 of them were chosen for further abstract
review, and data from 37 studies was incorporated in the database.
Out of the studies chosen for further evaluation, 16 and 11 surveys were excluded for
schistosomiasis and STH respectively, because it was not possible to relate them to a
specific district. This was mainly due to lack of information on the study area or the data
were grouped in some other way than implementation unit level. For example, some studies
were carried out nation-wide or in several districts without separating the data on district
level. For many countries, several surveys were available for the same few districts. Only
11
the highest prevalence for studies conducted in 1991-1999 or the most recent prevalence
from studies conducted from 2000 on was included in the database.
Most of the identified studies had been carried out in one or few villages in a given district.
To obtain data for the whole administrative unit, data extracted from village-level studies
was generalized to the entire district.
2.4 Information included in the database
All countries included in the database are divided into implementation units for conducting
large-scale drug distribution interventions. For schistosomiasis and STH, an
implementation unit corresponds to the largest administrative setting below the national
level (e.g. a region or a province) in a given country. For LF, instead, provinces are further
divided into smaller implementation units that correspond to districts, while for
onchocerciasis each endemic community is considered as an implementation unit on its
own. For the database, all data were recorded for each administrative unit separately.
A standardized database was constructed using Microsoft Office Excel 2003. Data for
schistosomiasis and STH were laid out on separate sheets.
The data were provided individually for the helminth species S. haematobium, S. mansoni,
S. intercalatum, S. japonicum, S. mekongi, A. lumbricoides, T. trichiura and the
hookworms. The following information was included, if available: (1) infection prevalence;
(2) year of the survey; and (3) extrapolated number of people infected. If the survey had
been conducted on a special population group (e.g. a selected age group, schoolchildren,
pregnant women) this was recorded. If information on infection intensity was available, the
source of the information was added in the database. Source of the information was
12
recorded for all data. If the source was a published survey, information on authors, title and
journal of publication was added.
The data for STH was provided for each helminth species separately, and if available, also
information on total prevalence of soil-transmitted helminths infections was added. For
countries in which cumulative prevalence of soil-transmitted helminths was not available,
the highest prevalence figure among the three helminths, Ascaris, Trichuris and hookworm
was chosen as the representative STH prevalence.
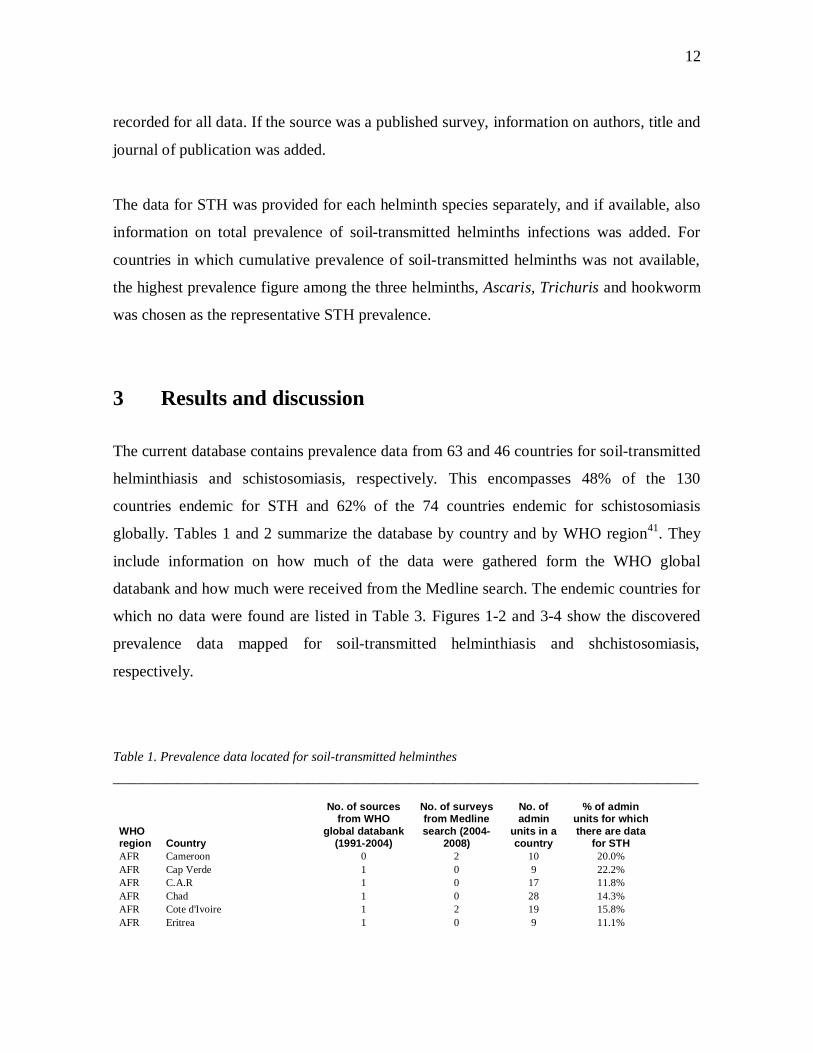
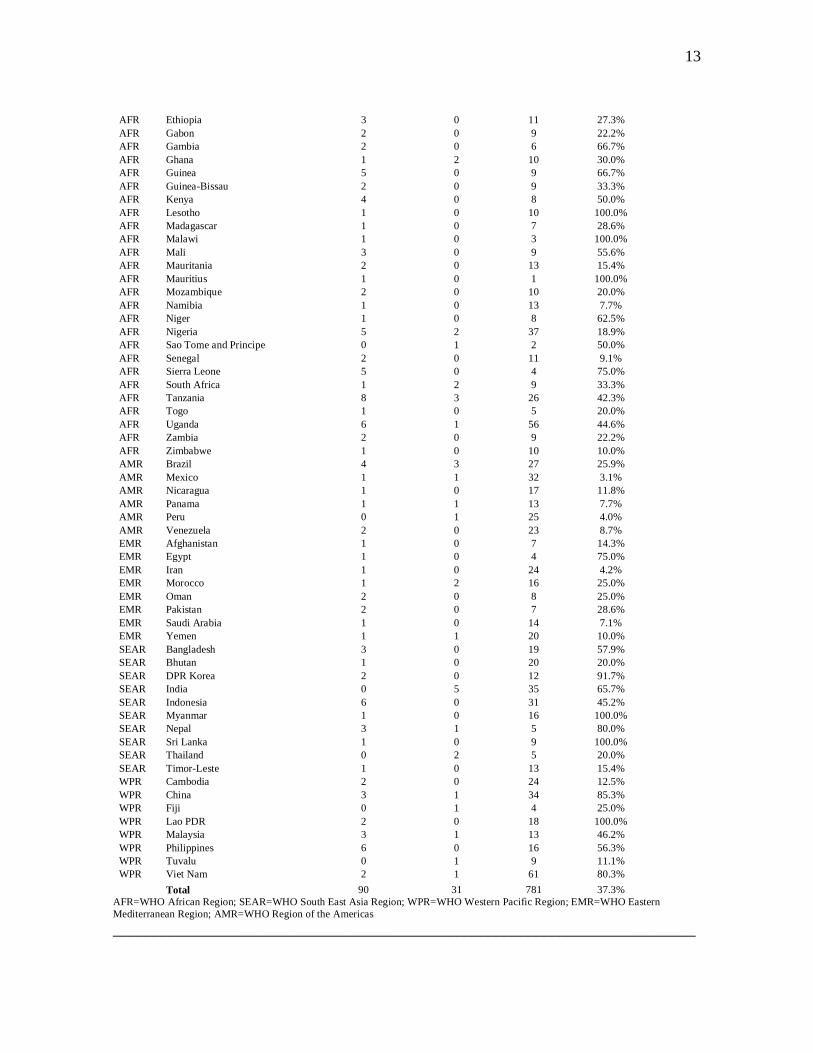
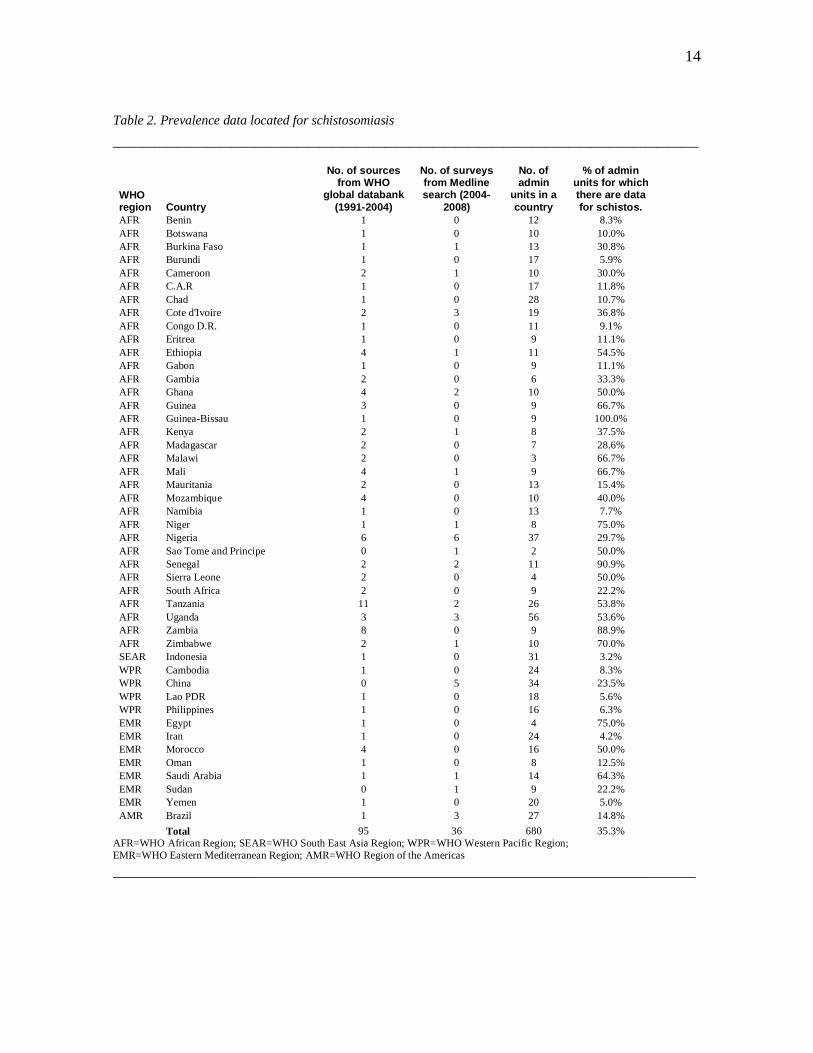
3 Results and discussion
The current database contains prevalence data from 63 and 46 countries for soil-transmitted
helminthiasis and schistosomiasis, respectively. This encompasses 48% of the 130
countries endemic for STH and 62% of the 74 countries endemic for schistosomiasis
globally. Tables 1 and 2 summarize the database by country and by WHO region41. They
include information on how much of the data were gathered form the WHO global
databank and how much were received from the Medline search. The endemic countries for
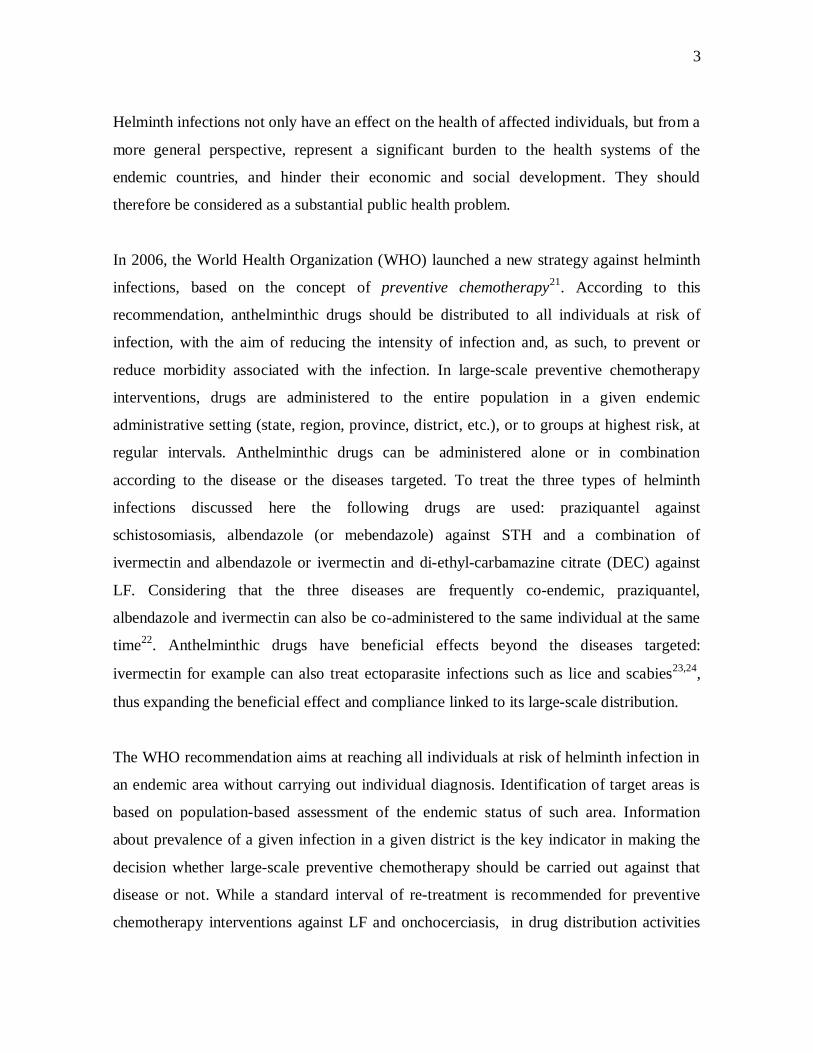
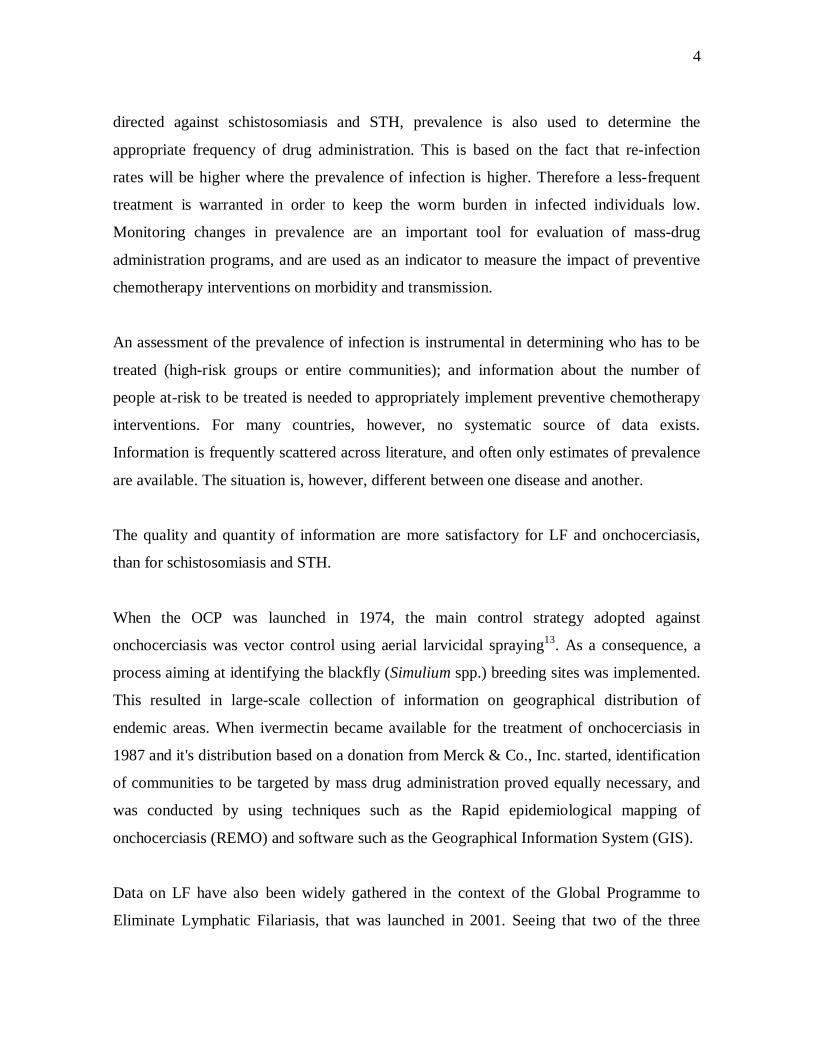
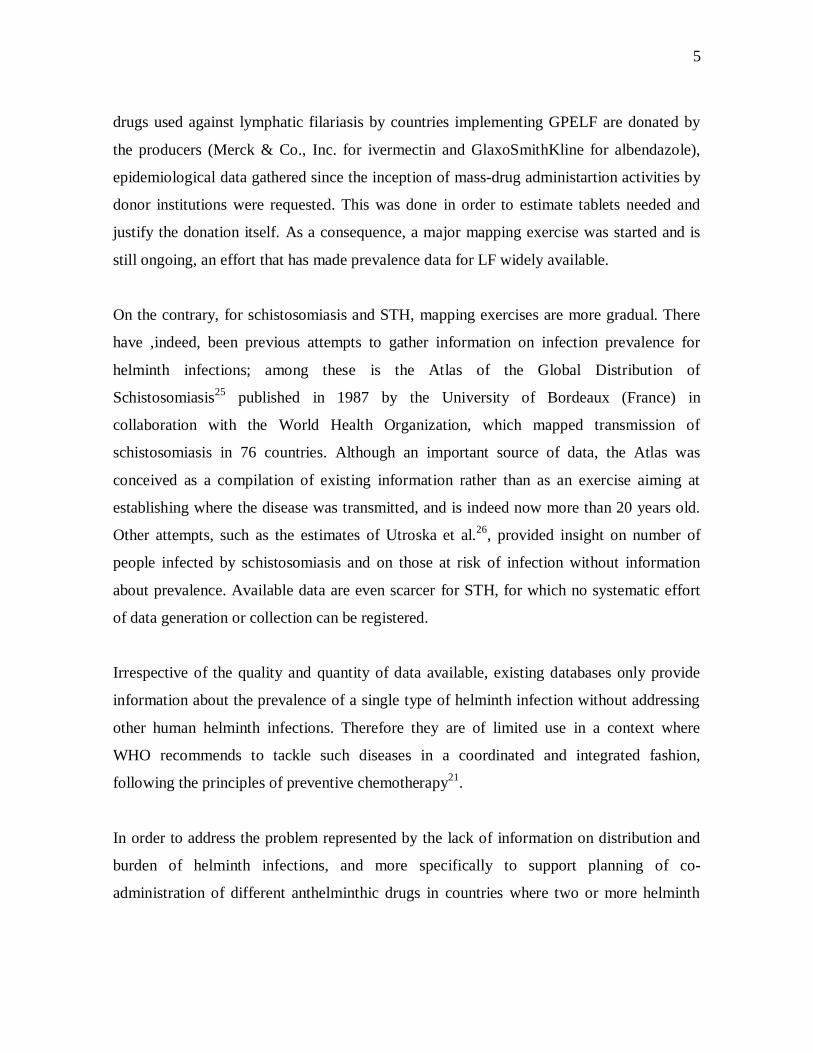
which no data were found are listed in Table 3. Figures 1-2 and 3-4 show the discovered
prevalence data mapped for soil-transmitted helminthiasis and shchistosomiasis,
respectively.
Table 1. Prevalence data located for soil-transmitted helminthes___________________________________________________________________________________________________
WHOregion Country
No. of sourcesfrom WHO
global databank(1991-2004)
No. of surveysfrom Medlinesearch (2004-
2008)
No. ofadmin
units in acountry
% of adminunits for whichthere are data
for STHAFR Cameroon 0 2 10 20.0%AFR Cap Verde 1 0 9 22.2%AFR C.A.R 1 0 17 11.8%AFR Chad 1 0 28 14.3%AFR Cote d'Ivoire 1 2 19 15.8%AFR Eritrea 1 0 9 11.1%
13
AFR Ethiopia 3 0 11 27.3%AFR Gabon 2 0 9 22.2%AFR Gambia 2 0 6 66.7%AFR Ghana 1 2 10 30.0%AFR Guinea 5 0 9 66.7%AFR Guinea-Bissau 2 0 9 33.3%AFR Kenya 4 0 8 50.0%AFR Lesotho 1 0 10 100.0%AFR Madagascar 1 0 7 28.6%AFR Malawi 1 0 3 100.0%AFR Mali 3 0 9 55.6%AFR Mauritania 2 0 13 15.4%AFR Mauritius 1 0 1 100.0%AFR Mozambique 2 0 10 20.0%AFR Namibia 1 0 13 7.7%AFR Niger 1 0 8 62.5%AFR Nigeria 5 2 37 18.9%AFR Sao Tome and Principe 0 1 2 50.0%AFR Senegal 2 0 11 9.1%AFR Sierra Leone 5 0 4 75.0%AFR South Africa 1 2 9 33.3%AFR Tanzania 8 3 26 42.3%AFR Togo 1 0 5 20.0%AFR Uganda 6 1 56 44.6%AFR Zambia 2 0 9 22.2%AFR Zimbabwe 1 0 10 10.0%AMR Brazil 4 3 27 25.9%AMR Mexico 1 1 32 3.1%AMR Nicaragua 1 0 17 11.8%AMR Panama 1 1 13 7.7%AMR Peru 0 1 25 4.0%AMR Venezuela 2 0 23 8.7%EMR Afghanistan 1 0 7 14.3%EMR Egypt 1 0 4 75.0%EMR Iran 1 0 24 4.2%EMR Morocco 1 2 16 25.0%EMR Oman 2 0 8 25.0%EMR Pakistan 2 0 7 28.6%EMR Saudi Arabia 1 0 14 7.1%EMR Yemen 1 1 20 10.0%SEAR Bangladesh 3 0 19 57.9%SEAR Bhutan 1 0 20 20.0%SEAR DPR Korea 2 0 12 91.7%SEAR India 0 5 35 65.7%SEAR Indonesia 6 0 31 45.2%SEAR Myanmar 1 0 16 100.0%SEAR Nepal 3 1 5 80.0%SEAR Sri Lanka 1 0 9 100.0%SEAR Thailand 0 2 5 20.0%SEAR Timor-Leste 1 0 13 15.4%WPR Cambodia 2 0 24 12.5%WPR China 3 1 34 85.3%WPR Fiji 0 1 4 25.0%WPR Lao PDR 2 0 18 100.0%WPR Malaysia 3 1 13 46.2%WPR Philippines 6 0 16 56.3%WPR Tuvalu 0 1 9 11.1%WPR Viet Nam 2 1 61 80.3%
Total 90 31 781 37.3%AFR=WHO African Region; SEAR=WHO South East Asia Region; WPR=WHO Western Pacific Region; EMR=WHO EasternMediterranean Region; AMR=WHO Region of the Americas_________________________________________________________________________
14
Table 2. Prevalence data located for schistosomiasis___________________________________________________________________________________________________
WHOregion Country
No. of sourcesfrom WHO
global databank(1991-2004)
No. of surveysfrom Medlinesearch (2004-
2008)
No. ofadmin
units in acountry
% of adminunits for whichthere are datafor schistos.
AFR Benin 1 0 12 8.3%AFR Botswana 1 0 10 10.0%AFR Burkina Faso 1 1 13 30.8%AFR Burundi 1 0 17 5.9%AFR Cameroon 2 1 10 30.0%AFR C.A.R 1 0 17 11.8%AFR Chad 1 0 28 10.7%AFR Cote d'Ivoire 2 3 19 36.8%AFR Congo D.R. 1 0 11 9.1%AFR Eritrea 1 0 9 11.1%AFR Ethiopia 4 1 11 54.5%AFR Gabon 1 0 9 11.1%AFR Gambia 2 0 6 33.3%AFR Ghana 4 2 10 50.0%AFR Guinea 3 0 9 66.7%AFR Guinea-Bissau 1 0 9 100.0%AFR Kenya 2 1 8 37.5%AFR Madagascar 2 0 7 28.6%AFR Malawi 2 0 3 66.7%AFR Mali 4 1 9 66.7%AFR Mauritania 2 0 13 15.4%AFR Mozambique 4 0 10 40.0%AFR Namibia 1 0 13 7.7%AFR Niger 1 1 8 75.0%AFR Nigeria 6 6 37 29.7%AFR Sao Tome and Principe 0 1 2 50.0%AFR Senegal 2 2 11 90.9%AFR Sierra Leone 2 0 4 50.0%AFR South Africa 2 0 9 22.2%AFR Tanzania 11 2 26 53.8%AFR Uganda 3 3 56 53.6%AFR Zambia 8 0 9 88.9%AFR Zimbabwe 2 1 10 70.0%SEAR Indonesia 1 0 31 3.2%WPR Cambodia 1 0 24 8.3%WPR China 0 5 34 23.5%WPR Lao PDR 1 0 18 5.6%WPR Philippines 1 0 16 6.3%EMR Egypt 1 0 4 75.0%EMR Iran 1 0 24 4.2%EMR Morocco 4 0 16 50.0%EMR Oman 1 0 8 12.5%EMR Saudi Arabia 1 1 14 64.3%EMR Sudan 0 1 9 22.2%EMR Yemen 1 0 20 5.0%AMR Brazil 1 3 27 14.8%
Total 95 36 680 35.3%AFR=WHO African Region; SEAR=WHO South East Asia Region; WPR=WHO Western Pacific Region;EMR=WHO Eastern Mediterranean Region; AMR=WHO Region of the Americas_________________________________________________________________________
15
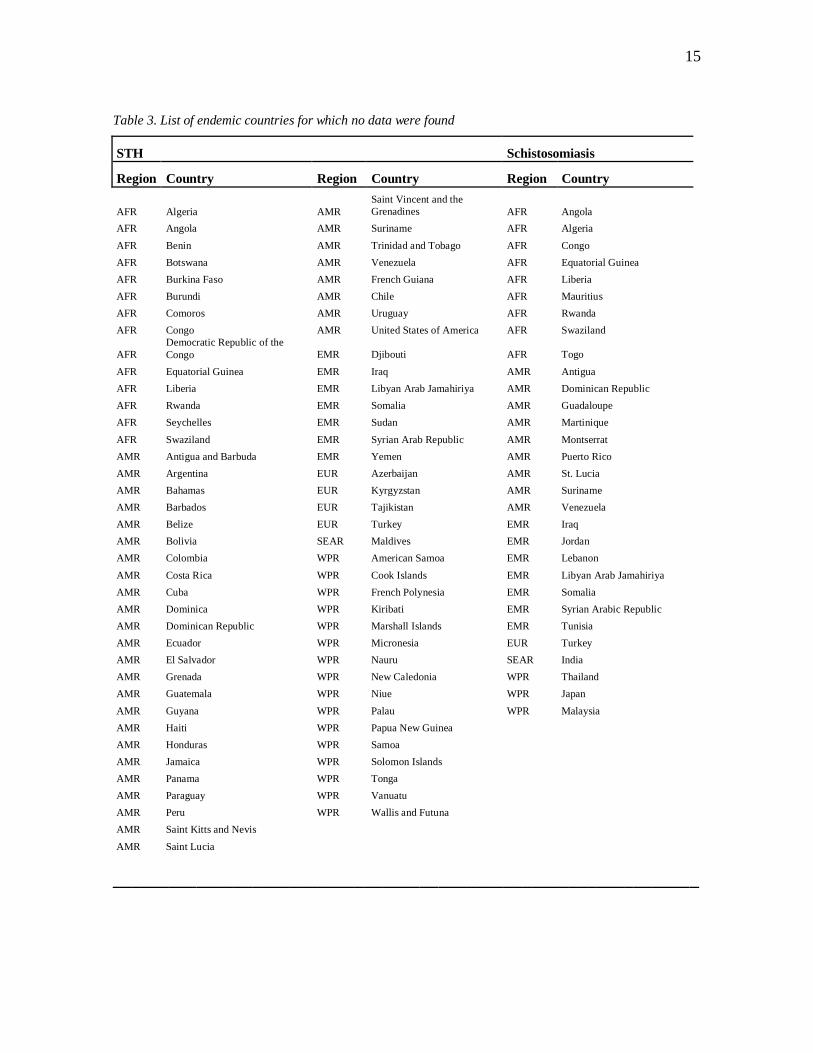
Table 3. List of endemic countries for which no data were found
STH Schistosomiasis
Region Country Region Country Region Country
AFR Algeria AMRSaint Vincent and theGrenadines AFR Angola
AFR Angola AMR Suriname AFR AlgeriaAFR Benin AMR Trinidad and Tobago AFR CongoAFR Botswana AMR Venezuela AFR Equatorial GuineaAFR Burkina Faso AMR French Guiana AFR LiberiaAFR Burundi AMR Chile AFR MauritiusAFR Comoros AMR Uruguay AFR RwandaAFR Congo AMR United States of America AFR Swaziland
AFRDemocratic Republic of theCongo EMR Djibouti AFR Togo
AFR Equatorial Guinea EMR Iraq AMR AntiguaAFR Liberia EMR Libyan Arab Jamahiriya AMR Dominican RepublicAFR Rwanda EMR Somalia AMR GuadaloupeAFR Seychelles EMR Sudan AMR MartiniqueAFR Swaziland EMR Syrian Arab Republic AMR MontserratAMR Antigua and Barbuda EMR Yemen AMR Puerto RicoAMR Argentina EUR Azerbaijan AMR St. LuciaAMR Bahamas EUR Kyrgyzstan AMR SurinameAMR Barbados EUR Tajikistan AMR VenezuelaAMR Belize EUR Turkey EMR IraqAMR Bolivia SEAR Maldives EMR JordanAMR Colombia WPR American Samoa EMR LebanonAMR Costa Rica WPR Cook Islands EMR Libyan Arab JamahiriyaAMR Cuba WPR French Polynesia EMR SomaliaAMR Dominica WPR Kiribati EMR Syrian Arabic RepublicAMR Dominican Republic WPR Marshall Islands EMR TunisiaAMR Ecuador WPR Micronesia EUR TurkeyAMR El Salvador WPR Nauru SEAR IndiaAMR Grenada WPR New Caledonia WPR ThailandAMR Guatemala WPR Niue WPR JapanAMR Guyana WPR Palau WPR MalaysiaAMR Haiti WPR Papua New GuineaAMR Honduras WPR SamoaAMR Jamaica WPR Solomon IslandsAMR Panama WPR TongaAMR Paraguay WPR VanuatuAMR Peru WPR Wallis and FutunaAMR Saint Kitts and NevisAMR Saint Lucia
_______________________________________________________________
16
3.1 Results for soil-transmitted helminthiasis
The average percentage of administrative units for which data were found for STH was
38.7%. For countries in the WHO African Region42, which is mainly composed of
countries in Sub-Saharan Africa, the percentage was 37.7%, while for the WHO South East
Asia43, Western Pacific44, Eastern Mediterranean Regions45 and Region of the Americas46
the values are 59.6%, 52.1%, 22.9% and 10.2%, respectively.
All countries in the African Region are considered to be endemic for STH. However data
was found for 32 out of 46 countries only. For South-East Asia, data were found for 10 out
of 11 endemic countries and for Western Pacific for 8 out of 24 countries. For the
Americas, data were found for 5 out of 31 and for the Eastern Mediterranean Region for 7
out of 11 endemic countries.
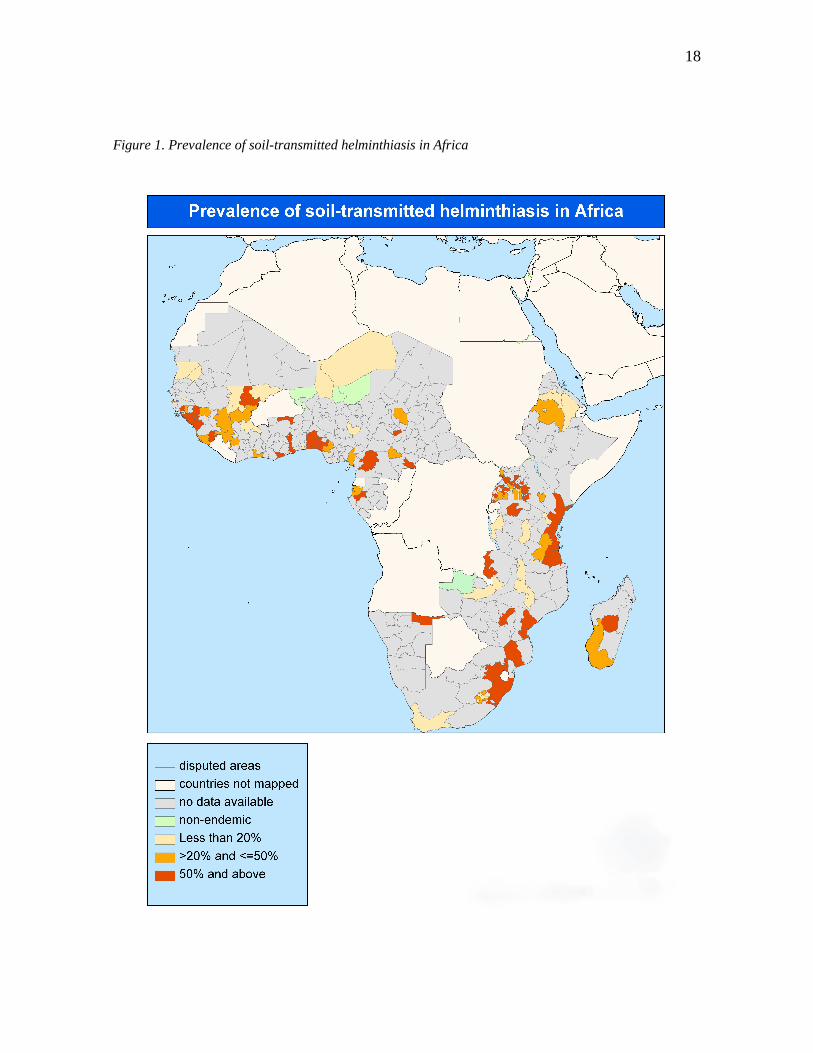
The data seems to be particularly sparse for Africa, the Americas and the Eastern
Mediterranean Region. For 15 countries of the African region, data for less than 25% of the
administrative units were found. No data were found for 14 endemic countries in the
African Region, while for the South East Asia region no data were found only for one
country, the Maldives. For the Western Pacific region no data were found for 16 countries,
however apart from Papua New Guinea, they are all very small island states in the Pacific
Ocean.
For South East Asia, relatively large amounts of data were found. For 4 out of 11 endemic
countries, data for more than 75% of the country was found. Data 100% of the
administrative units were found for Myanmar and Sri Lanka.
Infection levels of STH are directly related to sanitation conditions and their transmission
therefore mainly occurs in poor communities. The lack of data for the Americas and the
Eastern Mediterranean Regions can therefore be misleading because these countries,
although endemic, belong to a group of countries with higher income level. Most of the
17
people infected by soil-transmitted helminths reside in Africa and Asia. Soil-transmitted
helminthiasis is therefore of lesser importance in America and the Eastern Mediterranean
region as a public health problem from a global point of view.47
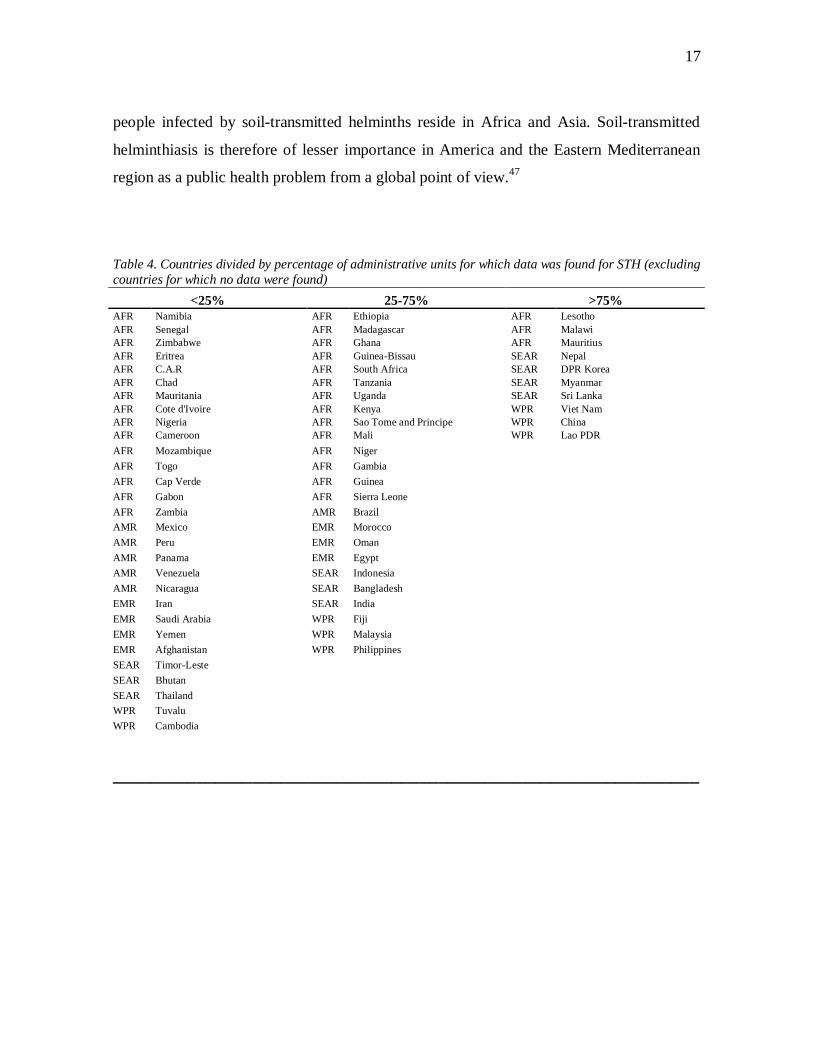
Table 4. Countries divided by percentage of administrative units for which data was found for STH (excludingcountries for which no data were found)
<25% 25-75% >75%AFR Namibia AFR Ethiopia AFR LesothoAFR Senegal AFR Madagascar AFR MalawiAFR Zimbabwe AFR Ghana AFR MauritiusAFR Eritrea AFR Guinea-Bissau SEAR NepalAFR C.A.R AFR South Africa SEAR DPR KoreaAFR Chad AFR Tanzania SEAR MyanmarAFR Mauritania AFR Uganda SEAR Sri LankaAFR Cote d'Ivoire AFR Kenya WPR Viet NamAFR Nigeria AFR Sao Tome and Principe WPR ChinaAFR Cameroon AFR Mali WPR Lao PDRAFR Mozambique AFR NigerAFR Togo AFR GambiaAFR Cap Verde AFR GuineaAFR Gabon AFR Sierra LeoneAFR Zambia AMR BrazilAMR Mexico EMR MoroccoAMR Peru EMR OmanAMR Panama EMR EgyptAMR Venezuela SEAR IndonesiaAMR Nicaragua SEAR BangladeshEMR Iran SEAR IndiaEMR Saudi Arabia WPR FijiEMR Yemen WPR MalaysiaEMR Afghanistan WPR PhilippinesSEAR Timor-LesteSEAR BhutanSEAR ThailandWPR TuvaluWPR Cambodia
_______________________________________________________________
18
Figure 1. Prevalence of soil-transmitted helminthiasis in Africa
19
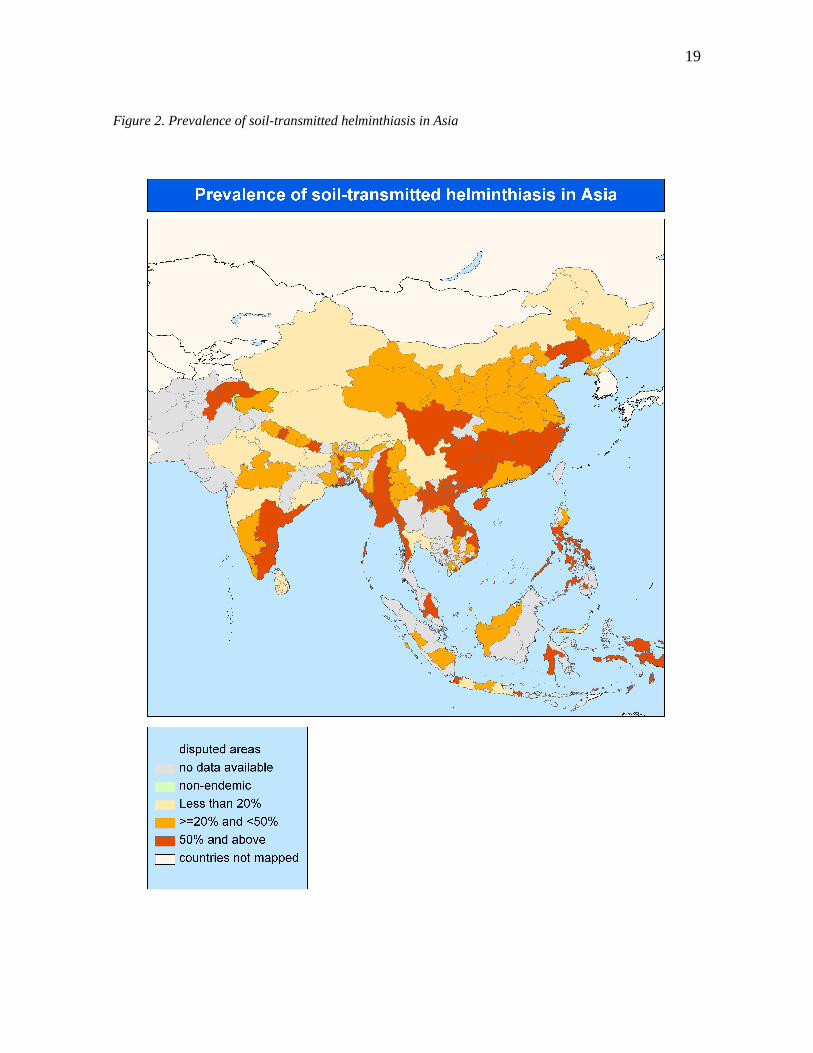
Figure 2. Prevalence of soil-transmitted helminthiasis in Asia
20
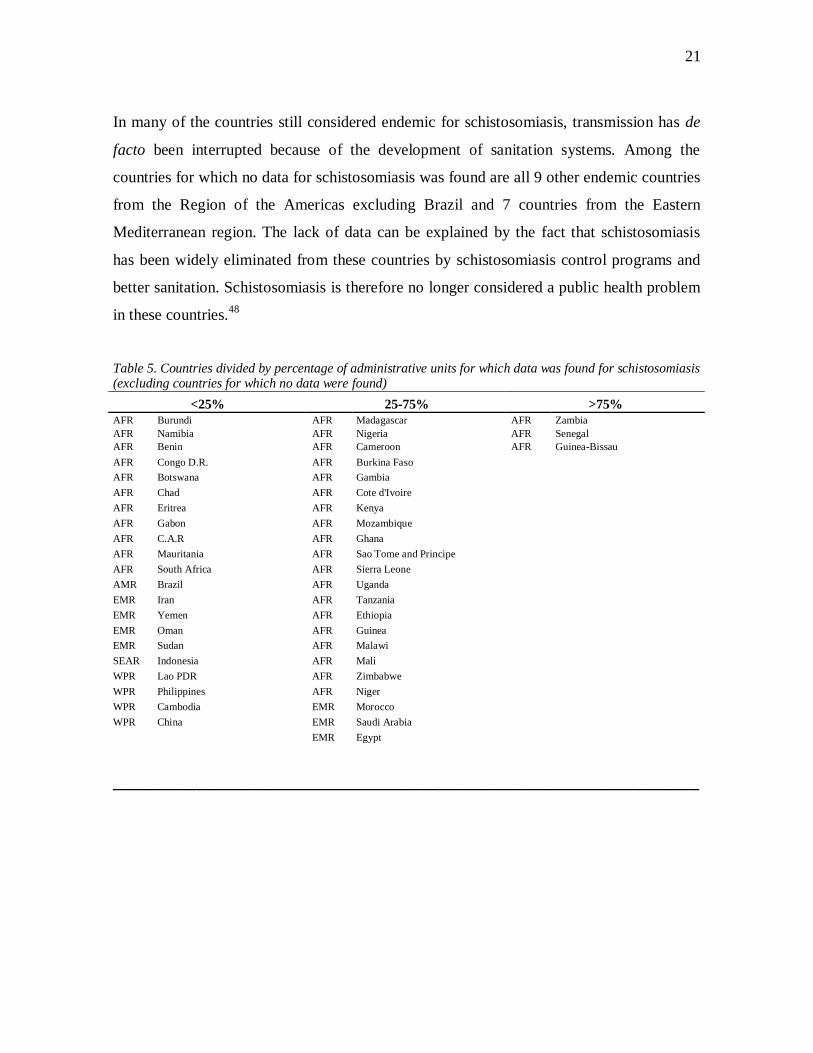
3.2 Results for schistosomiasis
For schistosomiasis, the situation seems to be opposite of that of STH: the lack of data
seems to be biased towards WHO South East Asia and Western Pacific Region, which
reflects the fact that schistosomiasis is much less widespread in Asia than in Africa.. For
the Eastern Mediterranean Region data were mostly found for less than 25% of the country.
Countries for which data were found for more than 75% of the country are all African.
Data for S. haematobium were found for 128 districts of which 83.6% are in Africa. Also
out of the 141 districts, for which data for S. mansoni were found, the majority (87.9%) are
in the African region. This reflects the fact that 42 of the 74 countries endemic for
schistosomiasis worldwide are in the African Region. All 54 countries endemic for
Schistosoma haematobium and most of the 53 countries endemic for Schistosoma mansoni
are in the African and Eastern Mediterranean Regions. In the Eastern Mediterranean
Region schistosomiasis is of public health importance only in Egypt, Somalia, Sudan and
Yemen, while the rest of the countries can be considered as low-endemic, with very low
overall prevalences.
Schistosoma japonicum is only endemic in China, Indonesia and the Philippines and S.
mekongi in Cambodia and Laos. This is apparent also in the results for the data collection
for the database. Prevalence data for S. japonicum were found for 8 districts in China and
one district in the Philippines. For S. mekongi data were found for the 2 districts in
Cambodia and 1 in Lao People's Democratic Republic in which schistosomiasis is endemic
in these countries.
Because of the unequal distribution of different schistosomiasis species globally, the
amount of data found can not be compared between regions as directly as for STH. The
prevalence of schistosomiasis can also vary within a country because of the uneven
distribution of host snail species and the population's contact with water. Generalizations
about schistosomiasis are therefore difficult to make.
21
In many of the countries still considered endemic for schistosomiasis, transmission has de
facto been interrupted because of the development of sanitation systems. Among the
countries for which no data for schistosomiasis was found are all 9 other endemic countries
from the Region of the Americas excluding Brazil and 7 countries from the Eastern
Mediterranean region. The lack of data can be explained by the fact that schistosomiasis
has been widely eliminated from these countries by schistosomiasis control programs and
better sanitation. Schistosomiasis is therefore no longer considered a public health problem
in these countries.48
Table 5. Countries divided by percentage of administrative units for which data was found for schistosomiasis(excluding countries for which no data were found)
<25% 25-75% >75%AFR Burundi AFR Madagascar AFR ZambiaAFR Namibia AFR Nigeria AFR SenegalAFR Benin AFR Cameroon AFR Guinea-BissauAFR Congo D.R. AFR Burkina FasoAFR Botswana AFR GambiaAFR Chad AFR Cote d'IvoireAFR Eritrea AFR KenyaAFR Gabon AFR MozambiqueAFR C.A.R AFR GhanaAFR Mauritania AFR Sao Tome and PrincipeAFR South Africa AFR Sierra LeoneAMR Brazil AFR UgandaEMR Iran AFR TanzaniaEMR Yemen AFR EthiopiaEMR Oman AFR GuineaEMR Sudan AFR MalawiSEAR Indonesia AFR MaliWPR Lao PDR AFR ZimbabweWPR Philippines AFR NigerWPR Cambodia EMR MoroccoWPR China EMR Saudi Arabia
EMR Egypt
_______________________________________________________________
22
Picture 3. Prevalence of schistosomiasis in Africa
23
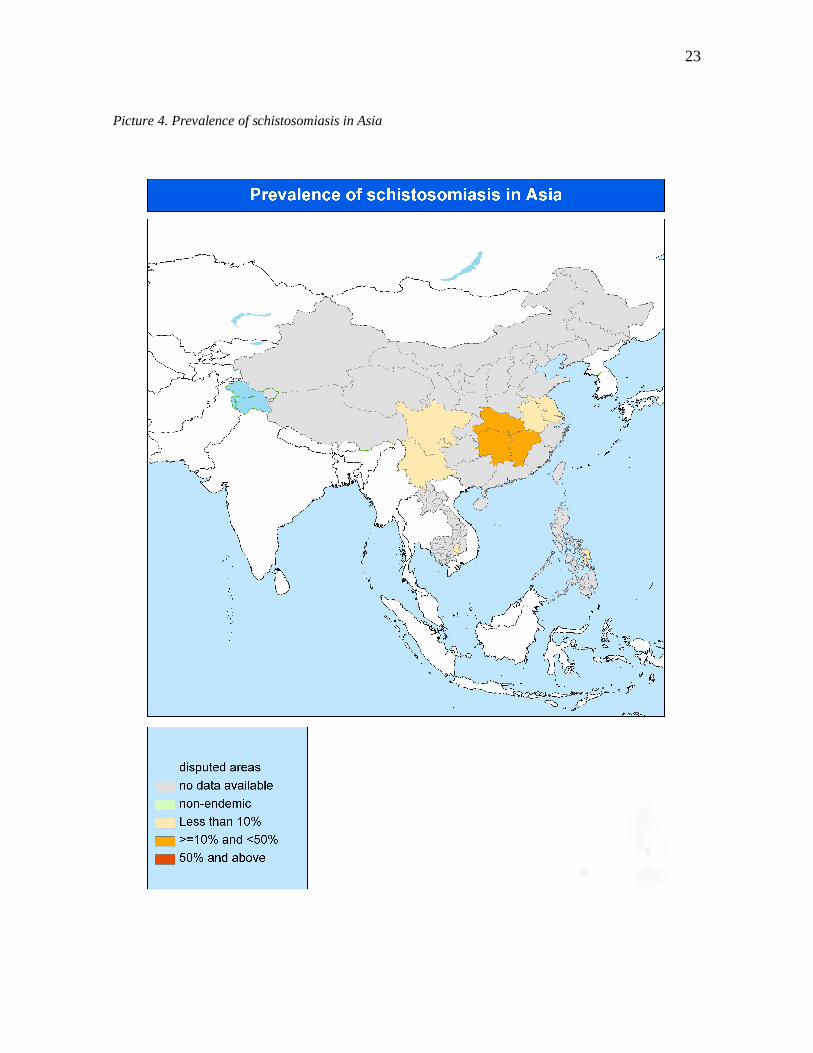
Picture 4. Prevalence of schistosomiasis in Asia
24
3.3 Sources of variability
Prevalence figures determined by using different techniques, as well as data from surveys
carried out in different years were incorporated into the same database. For S. haematobium
infection, both prevalence figures defined by parasitological diagnosis or diagnosis by
questionnaire were included in the database. This can reduce the comparability of the data.
However, several studies have shown that prevalence numbers defined by using these two
tecniques are, although not completely comparable, similar enough to define prevalence
figures in areas of high infection intensities for the implementation of preventive
chemotherapy37,38,39.
Incorporating prevalence figures from studies conducted with different age groups can also
reduce the comparability of data between different countries and districts. Prevalence of
infection is known to vary between age groups for each helminth species, and this may also
be a potential source of variation between figures. However, the risk of infection for both
STH and schistosomiasis is known to be highest among school-aged children49,50 and
approximately half of the studies (48.7% and 50.2% for STH and schistosomiasis,
respectively) from which data were abstracted had been carried out among school-aged
children. This improves the comparability of the data.
The districts for which there is no information are often areas of low population density.
This means that comparisons of data between regions from which data is lacking are
subject to error. There are large areas of very low population density in the Eastern
Mediterranean region and in the region of the Americas, which are not priority areas for
epidemiological studies or control programs. The distribution of soil-transmitted
helminthiasis and schistosomiasis depends on the geographical setting, some areas (deserts)
are known to be of low prevalence and studies have therefore not been carried out there.
25
3.4 Data on infection prevalence among school-aged children
It was possible to incorporate only little data in the database for pre-school-age children
because of the apparent lack of studies carried out in this age group. 50.4% of all studies for
schistosomiasis and 48.7% of the studies for schistosomiasis were conducted in school-age
children. Only 1.53% of the studies for schistosomiasis and 3.16% of the studies for STH
were conducted on pre-school-age children. However, the data on prevalence of infection
among school-age children can be used to extrapolate the prevalence in pre-school-age
children51.
4 Conclusions
Looking at tables 1, 2 and 3 it becomes apparent that there is a notable lack of data for both
STH and schistosomiasis in Sub-Saharan Africa. In addition to the 14 countries for which
no data were found on schistosomiasis and the 9 countries for which no data were found on
STH, there are several countries in the African Region for which data only in a few districts
were recovered. For six countries in the African Region (Algeria, Angola, Congo, Liberia,
Rwanda and Equatorial Guinea) no data were found for either of the two infections.
Schistosomiasis is also a public health problem in a few countries in the WHO Eastern
Mediterranean Region, but sufficient amounts of data are only reported for Egypt, while
there is no data available for Somalia and little data available for Yemen and Sudan.
The figures 1 and 3 and the list of countries in table 3 show that more data is lacking in
Africa for soil-transmitted helminthiasis than for schistosomiasis. When comparing pictures
3 and 4 it may at first seem that a conciderable amount of data is missing for
schistosomiasis in Asia. This is however not the case. The prevalence map in figure 4
simply reflects the fact that only a few species of schistosomiasis are endemic in Asian
countries and they can be found only in a few countries. On the contrary, a comparison of
26
figures 1 and 2 renders obvious the fact that the situation for endemic data for soil-
transmitted helminths is far better for countries in Asia than in Africa.
There is also an apparent lack of current, up-to-date data for helminth infections in the
African Region. The availability of data is in clear imbalance with the magnitude of the
problem in Sub-Saharan Africa. 50.8% of the districts in the African Region for which data
were found on STH prevalence had data from year 2000 onwards in contrast to South East
Asia and Western Pacific Regions, in which 81.5% and 67.1% of the districts had data from
year 2000 onwards. This reflects the fact that most territories in South East Asia and
Western Pacific have ongoing STH anthelminthic drug distribution programs and report
data on prevalence regularly52. Attempts on retrieving epidemiological data on soil-
transmitted helminthiasis should therefore focus on Sub-Saharan Africa.
It should, however, be noted that the actual knowledge on the epidemiological status of
schistosomiasis and STH across the world might be less incomplete than data presented
here might suggest, and this for two main reasons. The first reason is that additional data
might be available at country level, but the fact that they have never been published or have
never been communicated to WHO (for example as reports) prevents their inclusion in the
database. Experience shows that this finding is not uncommon53 and can be attributed to the
lack of a formal system of data report concerning schistosomiasis and STH. The second
reason is that geographical areas with missing data can actually be areas without
transmission of schistosomiasis or STH. Since it is improbable that surveys are conducted
in areas where disease is unlikely to be transmitted, these areas result as unmapped, while
actually they are known to be free of transmission (because for example, cases have never
been reported from there, or simply because no human populations live in that area). A
clear definition of these regions would simplify the mapping process. As we stated above,
there is more knowledge on the disease at country level than is captured by a data reporting
system that is only based on epidemiological surveys. The consequence of this mechanism
is that all areas that have not been "properly" mapped are considered as potential endemic
areas, which is not always the case.
27
Whatever the reason, the absence of data has an effect on the interpretation of the
prevalence figures found here. The lack of prevalence numbers reduces the comparability
of the data and may give misleading prevalence figures for a region. The more data are
lacking, the more a generalization of such data has to be applied. If generalization is
acceptable for STH, which are known to be epidemiologically very widespread, it is less
acceptable for schistosomiasis, which is a disease with a distinct focal pattern. The
geographical setting (presence of water) has an important effect on infection prevalence for
schistosomiasis, and infection prevalence in one village in a region may not correspond
only to the prevalence in the region as a whole, but even to the prevalence of another
village only a few kilometers away.
The more we generalise, the more we give an inaccurate picture of the epidemiological
situation of schistosomiasis and STH in a country. This fact has important operational
implications: if the prevalence found in a small geographical area is applied to the entire
country, then we shall apply to the entire country the disease control strategy that is
relevant to that small area only. This means that drugs are procured and interventions are
implemented which might not be warranted, with the consequent expenditure of financial
resources which could otherwise be allocated to other priorities.
The biggest problem I encountered during my data search was that several countries have
no ongoing programs to collect information on infection prevalence. In the absence of data
from country officials, I had to find prevalence numbers from several non-epidemiological
studies carried out in endemic countries. Data from this kind of studies was often collected
from a small sample population and may not reflect the true infection prevalence.
The lessons that I learnt from conducting this work would therefore be that of intensifying
as much as possible data collection in order to "fill the gaps" and provide an
epidemiological picture of the country close to the reality, and at the same time that of
complementing such data with local knowledge and experience, which could result in a
better characterization of the unmapped areas. The WHO databank on helminth infections
28
should be further developed into a complete database by enhancing the communication
between WHO and endemic countries. At the moment data collection is passive: the World
Health Organization receives information rather than gathers it actively. A large amount of
the current data has also not been specifically collected for the use of preventive
chemotherapy and therefore does not always represent the real epidemiological situation in
an edemic setting. For this database, many prevalence figures were retrieved from non-
epidemiologcal studies where prevalence figures were defined in the process. More
resources should be guided towards active data collection for example in the form of
nation-wide data collection campaigns. Data should be gathered from several parts of an
implementation unit and the data collection should be distributed evenly. Creating a
common data collection form that would be sent to health ministeries of endemic countries
could facilitate data collection. Time and resources spent in the effort of avoiding
generalization of data might well be compensated by more accurate plans of action against
schistosomiasis and STH, and by a consequent more rational usage of drugs and
implementation of disease control activities.
29
References
1 Crompton, DWT, Savioli, L. Handbook of Helminthiasis for Public Health. Boca Raton: CRC Press; 2007.p. 183-187.
2 Crompton, DWT, Savioli, L. Handbook of Helminthiasis for Public Health. Boca Raton: CRC Press; 2007.p. 218-232.
3 Crompton, DWT, Savioli, L. Handbook of Helminthiasis for Public Health. Boca Raton: CRC Press; 2007. p179.
4 Muller, R. Worms and Human Disease. Oxon: CAB International; 2002. p.17-23.
5 Crompton, DWT, Savioli, L. Handbook of Helminthiasis for Public Health. Boca Raton: CRC Press; 2007. p136.
6 Muller, R. Worms and Human Disease. Oxon: CAB International; 2002. p. 194-196.
7 World Health Organization [Online]. 2008 [cited Aug 20 2008]; Available from: URL:http://www.who.int/lymphatic_filariasis/disease/en/
8 Global Programme to Eliminate Lymphatic Filariasis. Wkly Epidemiol Rec. 2006 ;81:221-32.
9 Alleman MM, Twum-Danso NA, Thylefors BI. The Mectizan Donation Program - highlights from 2005.Filaria J. 2006;5:11.
10 Sékétéli A, Adeoye G, Eyamba A, Nnoruka E, Drameh P, Amazigo UV, Noma M, Agboton F, Aholou Y,Kale OO, Dadzie KY. The achievements and challenges of the African Programme for OnchocerciasisControl (APOC). Ann Trop Med Parasitol. 2002;Suppl 1:S15-28.
11 Thylefors B, Alleman M. Towards the elimination of onchocerciasis. Ann Trop Med Parasitol. 2006Dec;100:733-46.
12 Blanks J, Richards F, Beltrán F, Collins R, Alvarez E, Zea Flores G, Bauler B, Cedillos R, Heisler M,Brandling-Bennett D, Baldwin W, Bayona M, Klein R, Jacox M. The Onchocerciasis Elimination Programfor the Americas: a history of partnership. Rev Panam Salud Publica. 1998;3:367-74.
13 Hodgkin C, Molyneux DH, Abiose A, Philippon B, Reich MR, Remme JH, Thylefors B, Traoré M, GrepinK. The future of onchocerciasis control in Africa. PLoS Negl Trop Dis. 2007;1:74
14 Sakti H, Nokes C, Hertanto WS, Hendratno S, Hall A, Bundy DA, Satoto. Evidence for an associationbetween hookworm infection and cognitive function in Indonesian school children. Trop Med Int Health.1999;4:322-34
15 de Clercq D, Sacko M, Behnke J, Gilbert F, Vercruysse J. The relationship between Schistosomahaematobium infection and school performance and attendance in Bamako, Mali. Ann Trop Med Parasitol.1998;92:851-8.
16 Kjetland EF, Ndhlovu PD, Gomo E, Mduluza T, Midzi N, Gwanzura L, Mason PR, Sandvik L, Friis H,Gundersen SG. Association between genital schistosomiasis and HIV in rural Zimbabwean women. AIDS.2006;20:593-600.
30
17 Fincham JE, Markus MB, Adams VJ. Could control of soil-transmitted helminthic infection influence theHIV/AIDS pandemic. Acta Trop. 2003;86:315-33.
18 Spiegel A, Tall A, Raphenon G, Trape JF, Druilhe P. Increased frequency of malaria attacks in subjects co-infected by intestinal worms and Plasmodium falciparum malaria. Trans R Soc Trop Med Hyg. 2003;97:198-199.
19 Druilhe P, Tall A, Sokhna C. Worms can worsen malaria: towards a new means to roll back malaria?Trends Parasitol. 2005;21:359-62.
20 Sacco R, Hagen M, Sandor M, Weinstock JV, Lynch RG. Established T(H1) granulomatous responsesinduced by active Mycobacterium avium infection switch to T(H2) following challenge with Schistosomamansoni. Clin Immunol. 2002;104:274-81.
21 World Health Organization. Preventive chemotherapy in human helminthiasis: coordinated use ofanthelminthic drugs in control interventions: a manual for health professionals and programme managers.Geneva: World Health Organization; 2006.
22 Mohammed KA, Haji HJ, Gabrielli AF, Mubila L, Biswas G, Chitsulo L, Bradley MH, Engels D, Savioli L,Molyneux DH. Triple co-administration of ivermectin, albendazole and praziquantel in zanzibar: a safetystudy. PLoS Negl Trop Dis. 2008;2:e171.
23 del Giudice P, Chosidow O, Caumes E. Ivermectin in dermatology. J Drugs Dermatol.2003;2:13-21.
24 Dourmishev AL, Dourmishev LA, Schwartz RA. Ivermectin: pharmacology and application indermatology. Int J Dermatol. 2005;44:981-8.
25 Doumenge JP, Mott KE, Cheung C, Villenave D, Chapuis O, Perrin MF, Reaud-Thomas G. Atlas of theglobal distribution of schistosomiasis. Bordeaux: Universite de Bordeaux; 1987.
26 Utroska JA, Chen MG, Dixon H, Yoon S, Helling-Borda M, Hogerzeil HV, Mott KE. An estimate forglobal needs for praziquantel within schistosomiasis control programmes. Geneva; World HealthOrganization; 1989.
27 World Health Organization [Online]. 2008 [cited 2008 Aug 6]; Available from: URL:http://www.who.int/wormcontrol/databank/en/
28 King CH, Dangerfield-Cha M. The unacknowledged impact of chronic schistosomiasis. Chronic Illn.2008;4:65-79.
29 Mascie-Taylor CG, Karim E. The burden of chronic disease. Science. 2003;302:1921-2.
30 WHO Expert Committee. Prevention and control of schistosomiasis and soil-transmitted helminthiasis.World Health Organ Tech Rep Ser. 2002;912:1-57.
31 Plouvier, S, Leroy JC, and Colette J. A propos d’une technique simple de filtration des urines dans lediagnostic de la bilharziose urinaire en enquête de masse. Med. Trop. 1975;35:229-230.
32 Kato K, Miura M. Comparative examinations. Japanese Journal of Parasitology. 1954;3:35.
33 Katz N, Chaves A & Pellegrino J. A simple device for quantitative stool thick smear technique inSchistosomiasis mansoni. Revista Do Instituto de Medicina Tropical de Sao Paulo. 1972;14:397-400.
31
34 Feldmeier H & Poggensee G. Diagnostic techniques in schistosomiasis control. Acta Tropica. 1993;52:205-220.
35 Crompton, DWT, Savioli, L. Handbook of Helminthiasis for Public Health. Boca Raton: CRC Press; 2007.p. 177.
36 Ansell J, Guyatt H, Hall A, Kihamia C, Kivugo J, Ntimbwa P, Bundy D. The reliability of self-reportedblood in urine and schistosomiasis as indicators of Schistosoma haematobium infection in school children: astudy in Muheza District, Tanzania. Trop Med Int Health. 1997;2:1180-9.
37 Nduka FO, Nwosu EC. Validation of the World Health Organization's Rapid Assessment method forurinary schistosomiasis in southeastern Nigeria. J Parasitol. 2008;94:533-6.
38 Lengeler C. Makwala J. Ngimbi D. Utzinger J. Simple school questionnaires can map both Schistosomamansoni and Schistosoma haematobium in the Democratic Republic of Congo. Acta Trop. 2000;74:77-87.
39 Ndamba J, Makura O, Gwatirisa PR, Makaza N, Kaondera KC. A cost effective two step rapid diagnosis ofurinary schistosomiasis in Zimbabwe. Cent Afr J Med. 1998;44:167-71.
40 World Health Organisation [Online]. 2008 [cited 2008 Aug 14]http://www.who.int/wormcontrol/about_us/en/ea54r19.pdf
41 World Health Organisation [Online]. 2008 [cited 2008 Sep 1] http://www.who.int/about/regions/en/
42 World Health Organisation [Online]. 2008 [cited 2008 Sep 1]http://www.who.int/about/regions/afro/en/index.html
43 World Health Organisation [Online]. 2008 [cited 2008 Sep 1]http://www.who.int/about/regions/searo/en/index.html
44 World Health Organisation [Online]. 2008 [cited 2008 Sep 1]http://www.who.int/about/regions/wpro/en/index.html
45 World Health Organisation [Online]. 2008 [cited 2008 Sep 1]http://www.who.int/about/regions/emro/en/index.html
46 World Health Organisation [Online]. 2008 [cited 2008 Sep 1]http://www.who.int/about/regions/amro/en/index.html
47 de Silva NR, Brooker S, Hotez PJ, Montresor A, Engels D, Savioli L. Soil-transmitted helminth infections:updating the global picture. Trends Parasitol. 2003;19:547-51.
48 Engels D, Chitsulo L, Montresor A, Savioli L. The global epidemiological situation of schistosomiasis andnew approaches to control and research. Acta Trop. 2002; 82: 139-46.
49 Jordan P, Webbe G. Epidemiology. In Human schistosomiasis. Edited by: Jordan P, Webbe G and SturrockRF. Wallingford, UK, CAB International; 1993:87-158.
50Awasthi S, Bundy DA, Savioli L. Helminthic infections. BMJ 327(7412):431-3.
32
51 Guyatt HL, Brooker S, Donnelly CA. Can prevalence of infection in school-aged children be used as anindex for assessing community prevalence? Parasitology. 1999;118:257-68.
52 World Health Organization. Soil-transmitted helminthiasis. Progress report on number of children treatedwith anthelminthic drugs: an update towards the 2010 global target. Wkly Epidemiol Rec. 2008 Jul4;82(27/28):237-52.
53 Dirk Engels, personal communication.


![HELMINTH PARASITES IN MAMMALS - Australian …parasite.org.au/para-site/text/helminth.pdf · HELMINTH PARASITES IN MAMMALS ... Subclass: EUTHERIA [placental mammals] ... NEM:Asc Ascaris](https://img.pdfslide.us/doc/110x75/5b78c38f7f8b9a331e8c41aa/helminth-parasites-in-mammals-australian-helminth-parasites-in-mammals-.jpg)