Embed Size (px)
DESCRIPTION
Towards a Global Carbon Observing System: Progresses and Challenges Geneva , 1-2 October 2013. Precision and accuracy of in situ tower-based carbon cycle concentration networks required for detection of the effects of extreme climate events on regional carbon cycling Ankur R Desai - PowerPoint PPT Presentation
Citation preview
Precision and accuracy of in situ tower-based carbon cycle concentration networks required
for detection of the effects of extreme climate events on
regional carbon cycling
Ankur R DesaiUniversity of Wisconsin-Madison
Towards a Global Carbon Observing System: Progresses and Challenges
Geneva, 1-2 October 2013
International Conference "Towards a Global Carbon Observing System: Progresses and Challenges", Geneva, 1-2 October 2013
Precision and accuracy of in situ tower based carbon cycle concentration networks required
for detection of the effects of extreme climate events on
regional carbon cyclingAnkur R Desai, Arlyn
Andrews, Britt Stephens, Bjorn Brooks, Dong Hua, and many other collaborators…
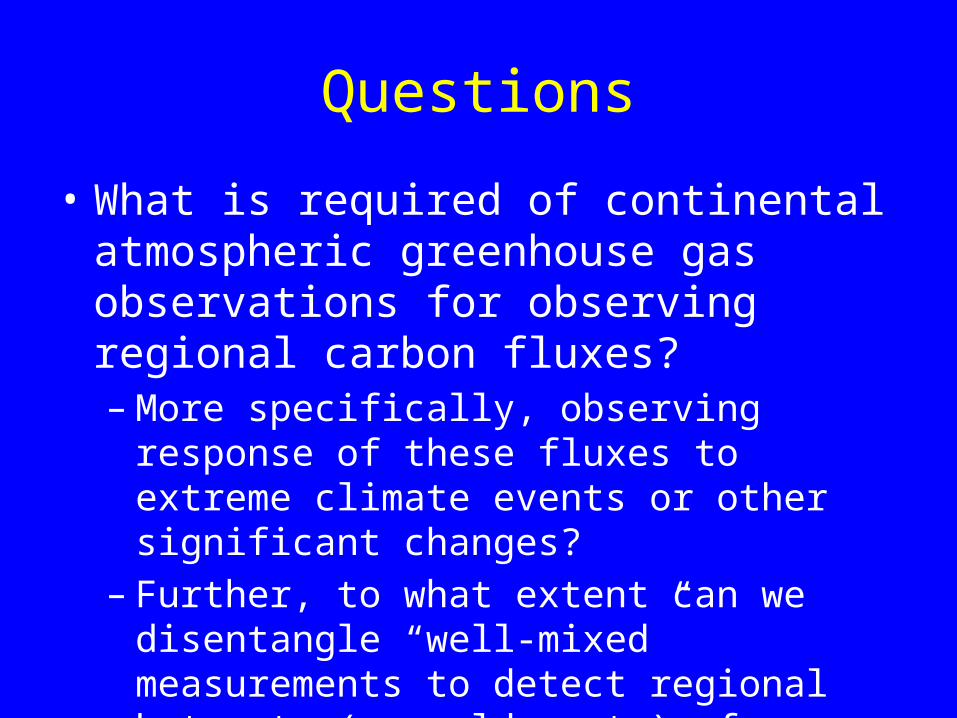
Questions
• What is required of continental atmospheric greenhouse gas observations for observing regional carbon fluxes?– More specifically, observing response of these
fluxes to extreme climate events or other significant changes?
– Further, to what extent can we disentangle “well-mixed” measurements to detect regional hotspots (or cold spots) of terrestrial sinks and sources?
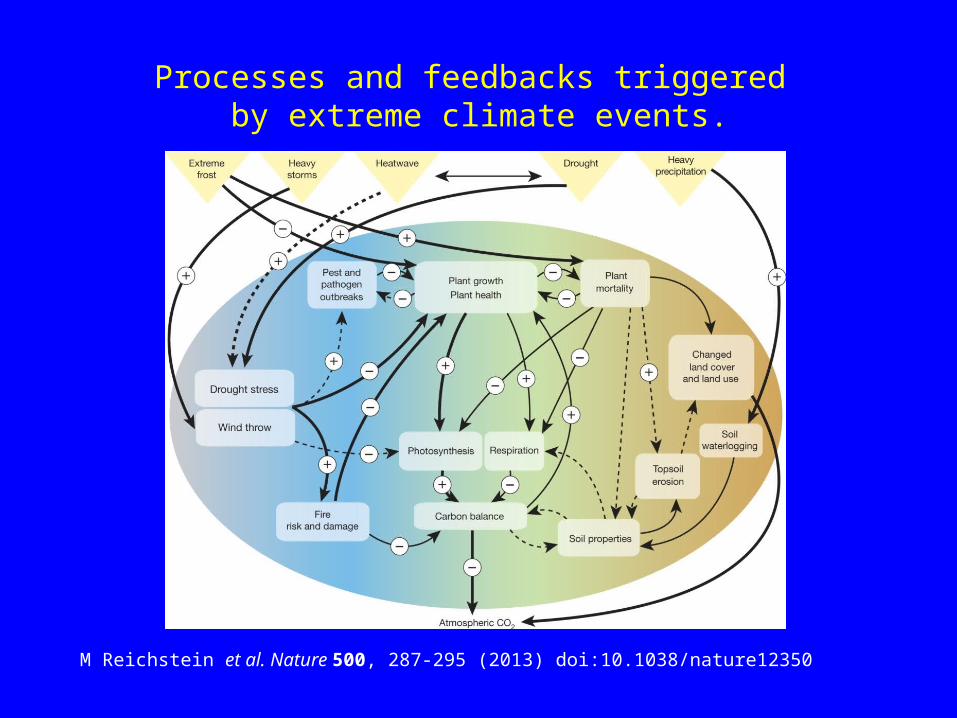
M Reichstein et al. Nature 500, 287-295 (2013) doi:10.1038/nature12350
Processes and feedbacks triggered by extreme climate events.
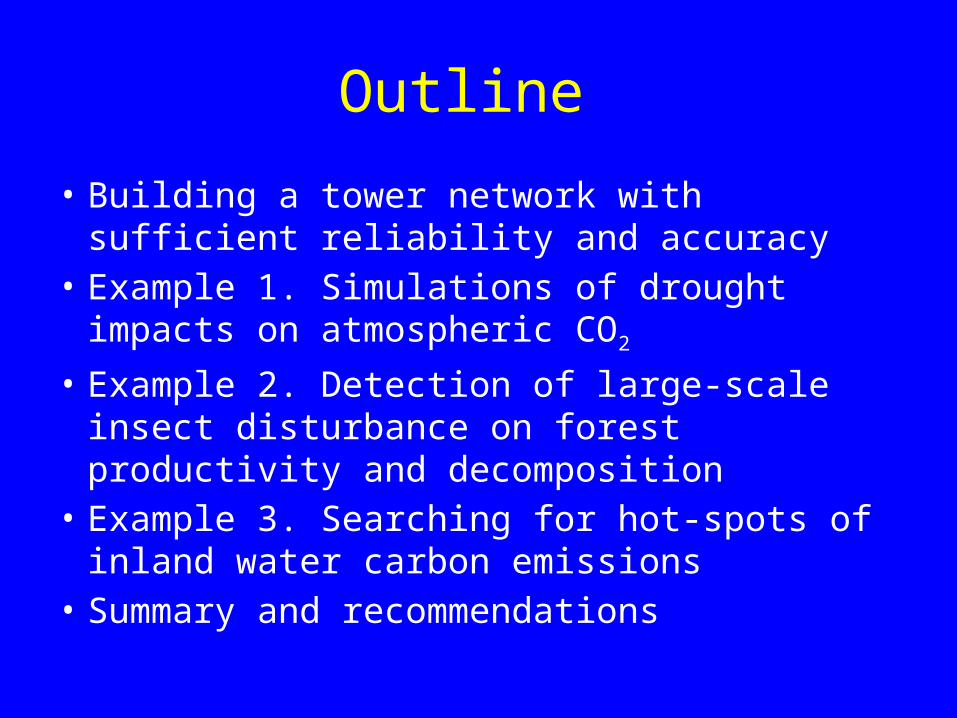
Outline
• Building a tower network with sufficient reliability and accuracy
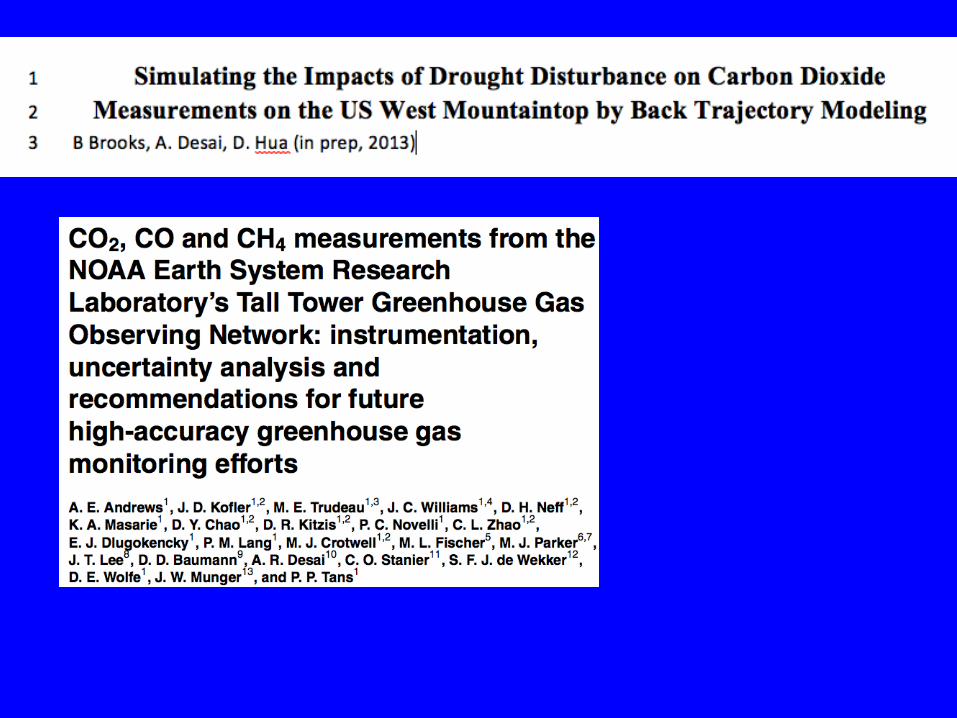
• Example 1. Simulations of drought impacts on atmospheric CO2
• Example 2. Detection of large-scale insect disturbance on forest productivity and decomposition
• Example 3. Searching for hot-spots of inland water carbon emissions
• Summary and recommendations
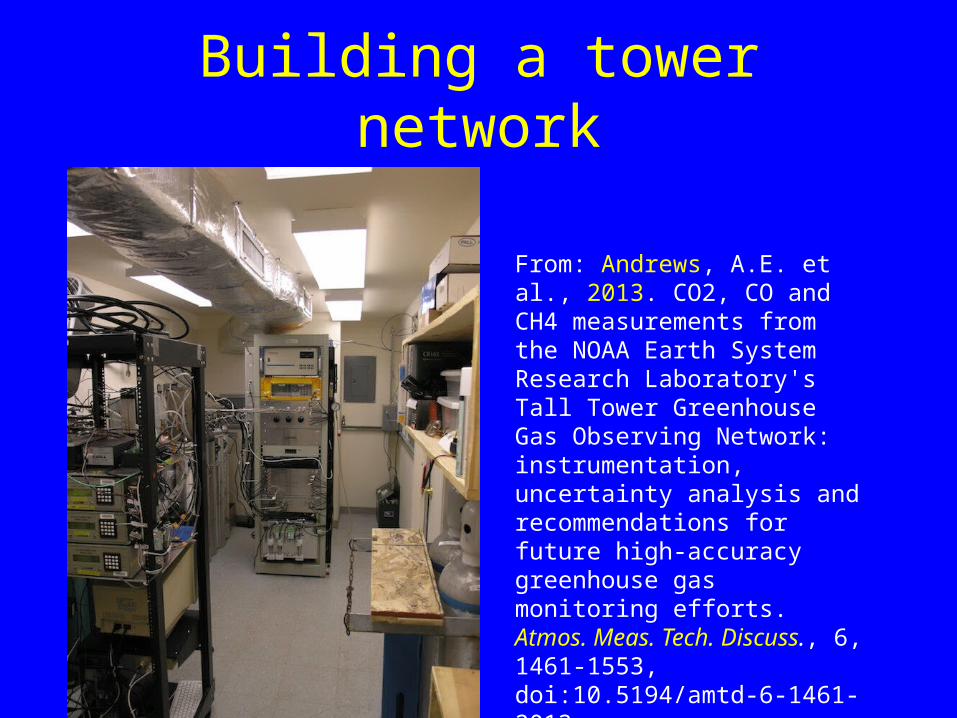
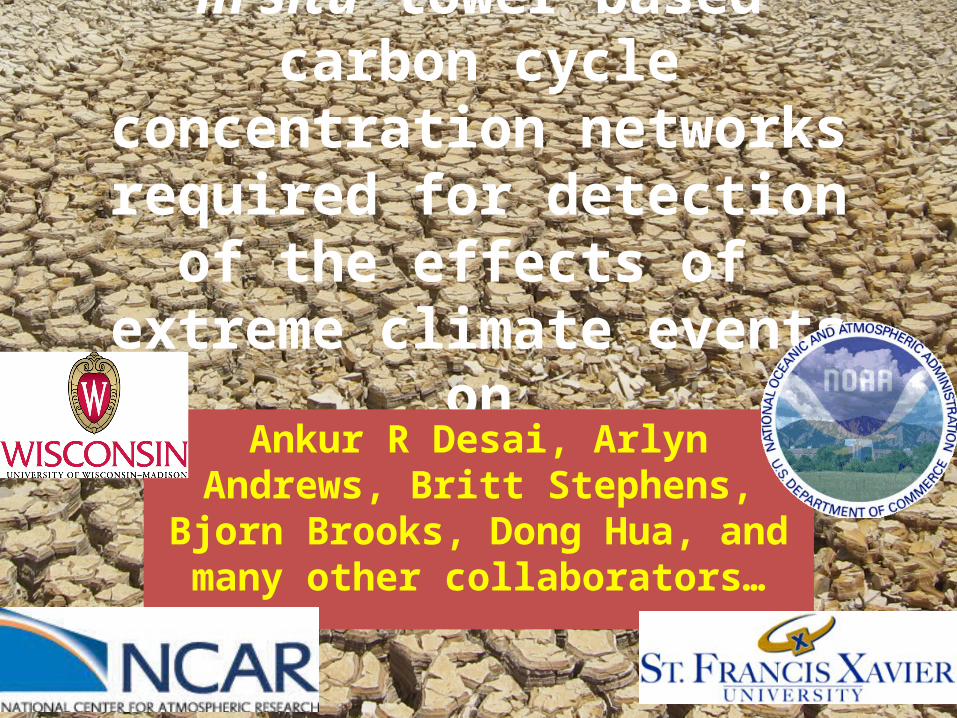
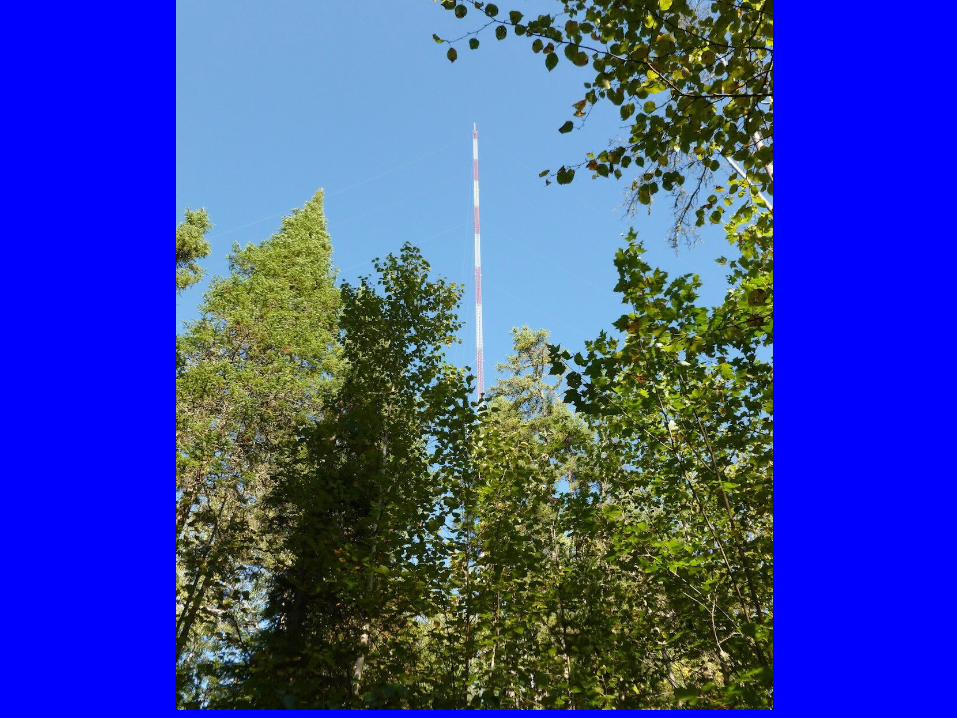
Building a tower network
From: Andrews, A.E. et al., 2013. CO2, CO and CH4 measurements from the NOAA Earth System Research Laboratory's Tall Tower Greenhouse Gas Observing Network: instrumentation, uncertainty analysis and recommendations for future high-accuracy greenhouse gas monitoring efforts. Atmos. Meas. Tech. Discuss., 6, 1461-1553, doi:10.5194/amtd-6-1461-2013.
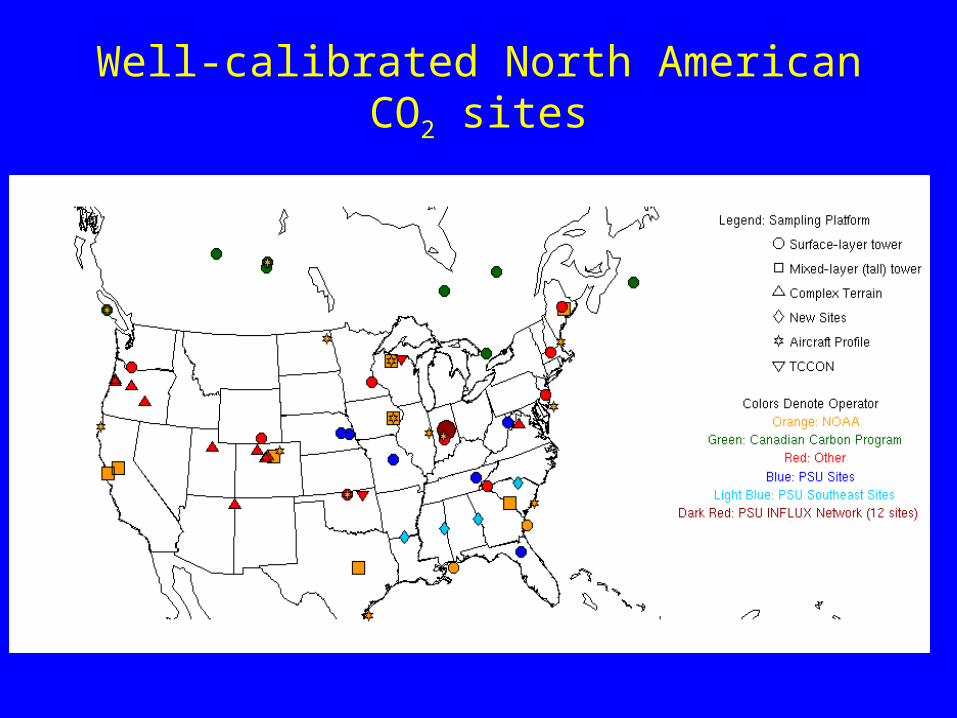
Well-calibrated North American CO2 sites
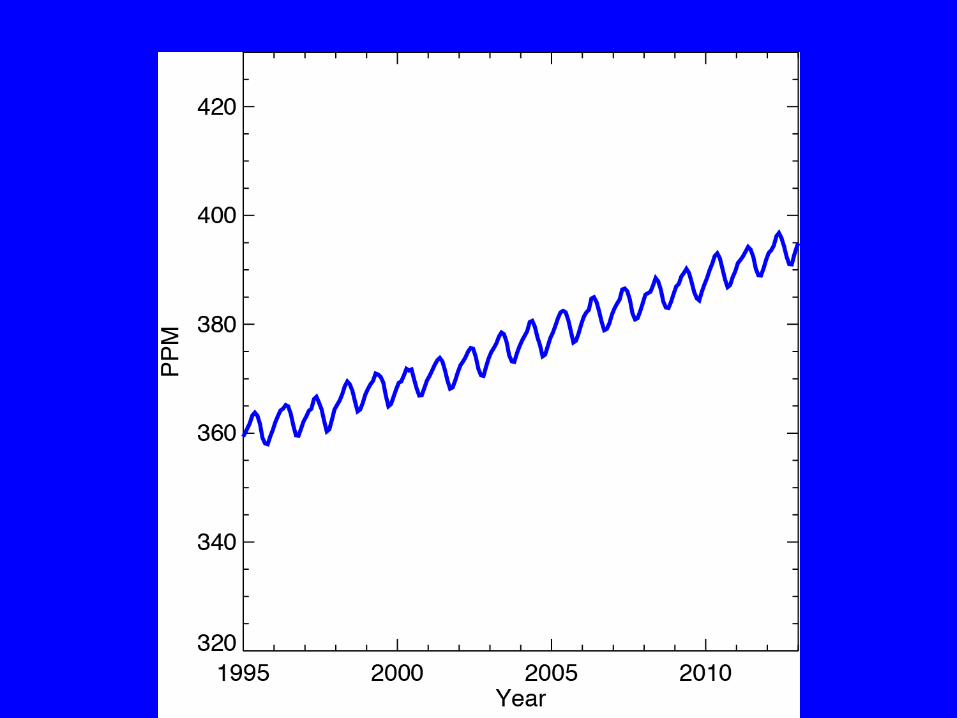
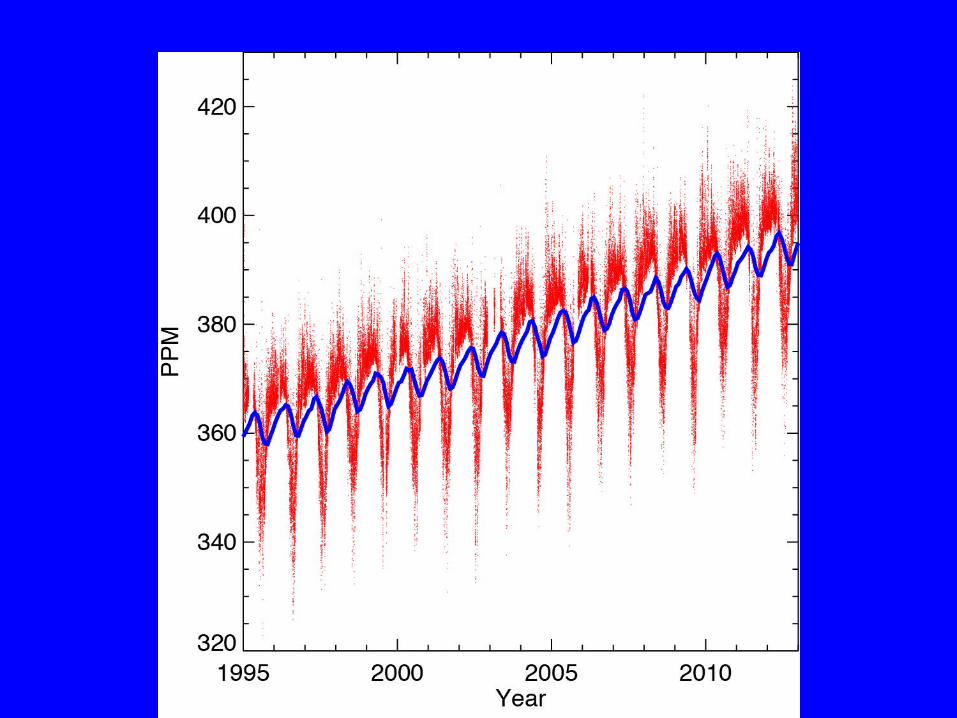
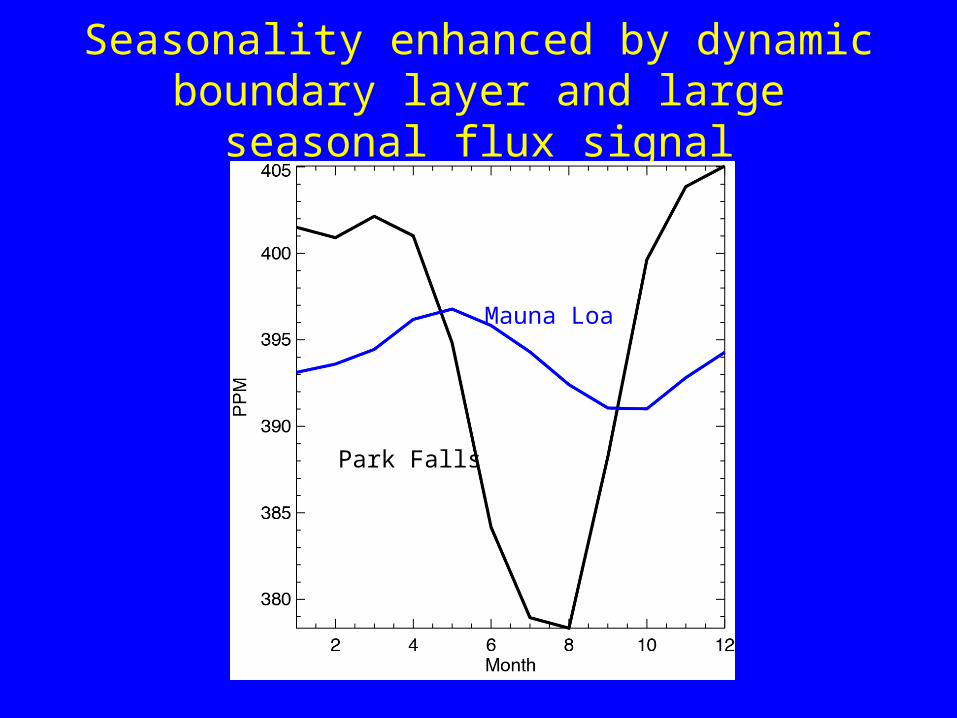
Seasonality enhanced by dynamic boundary layer and large seasonal flux signal
Mauna Loa
Park Falls
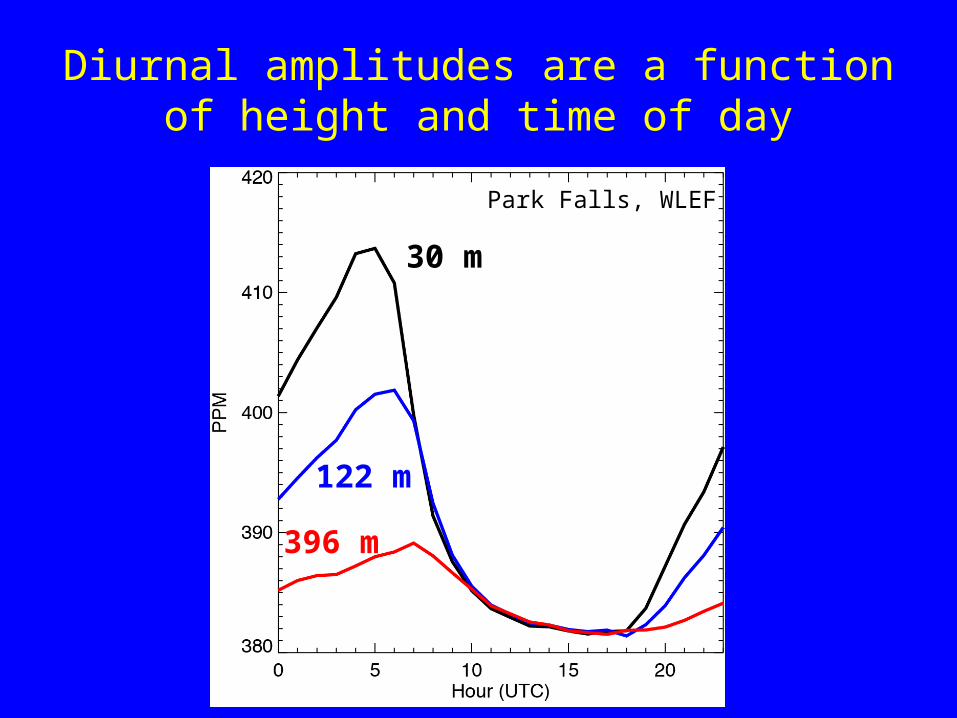
Diurnal amplitudes are a function of height and time of day
30 m
122 m
396 m
Park Falls, WLEF
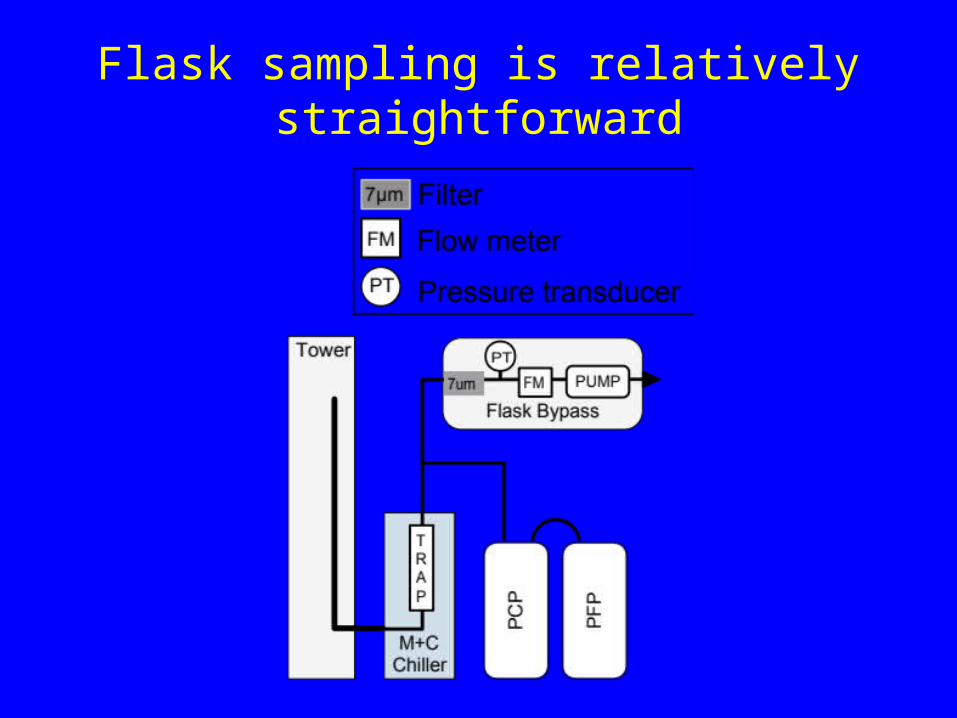
Flask sampling is relatively straightforward
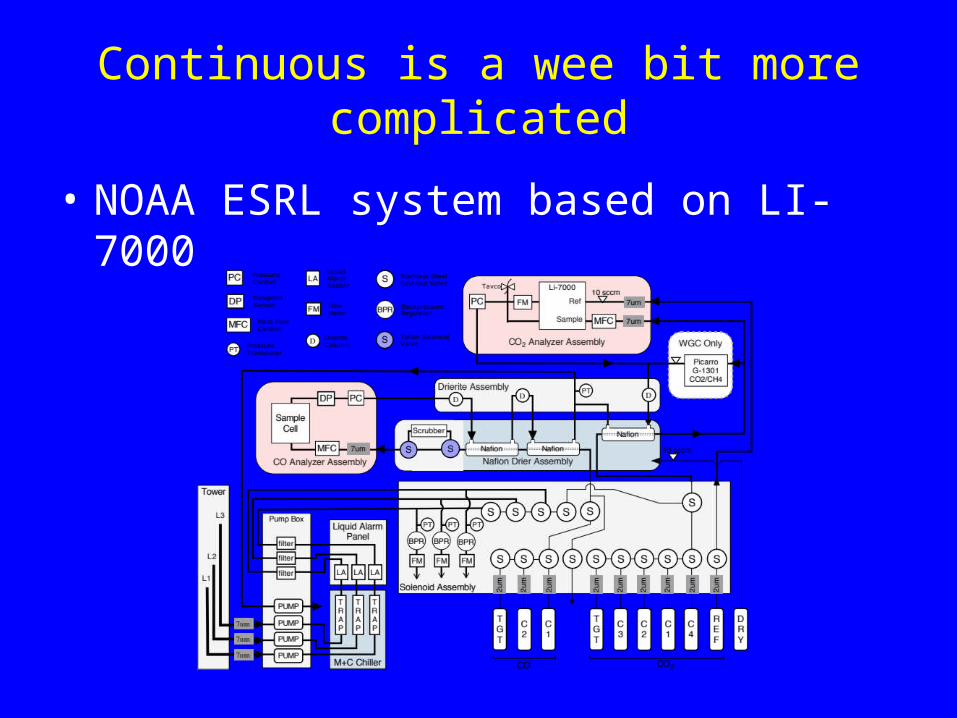
Continuous is a wee bit more complicated
• NOAA ESRL system based on LI-7000
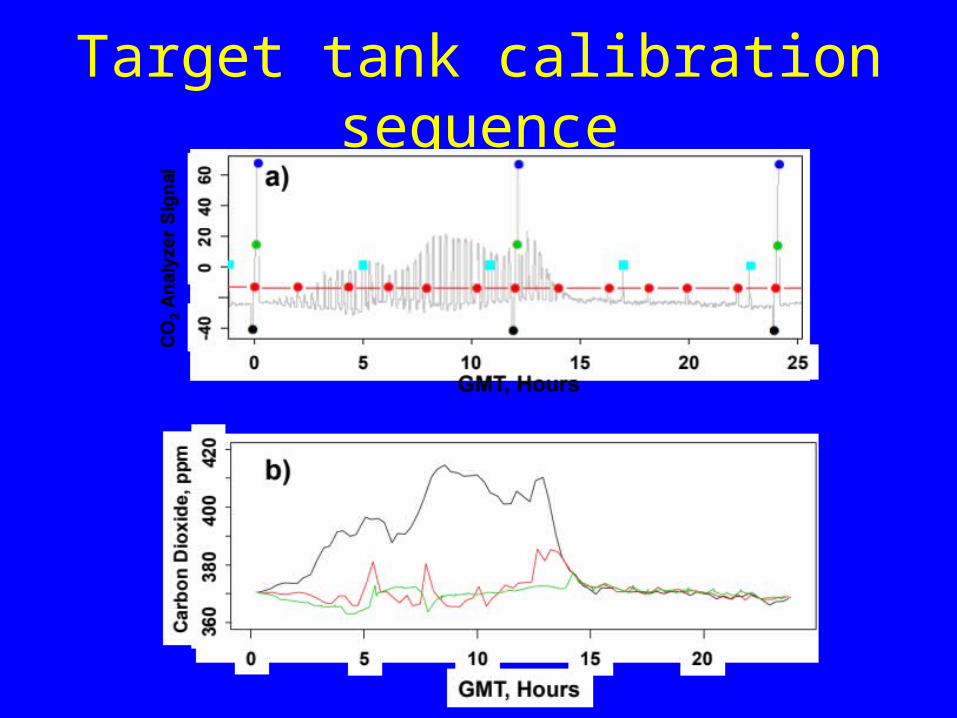
Target tank calibration sequence
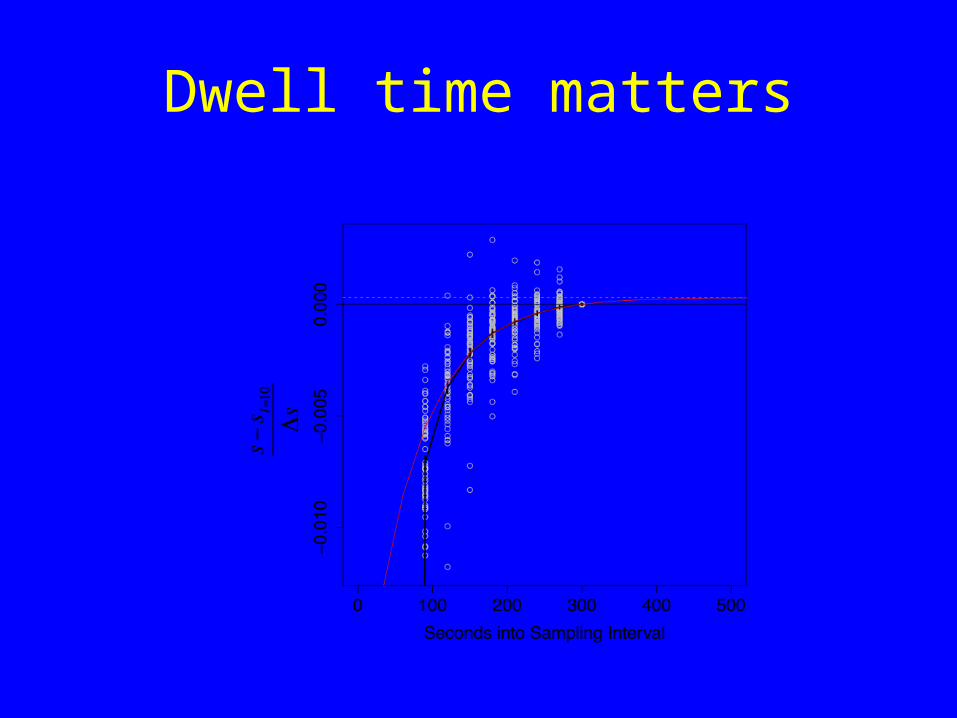
Dwell time matters
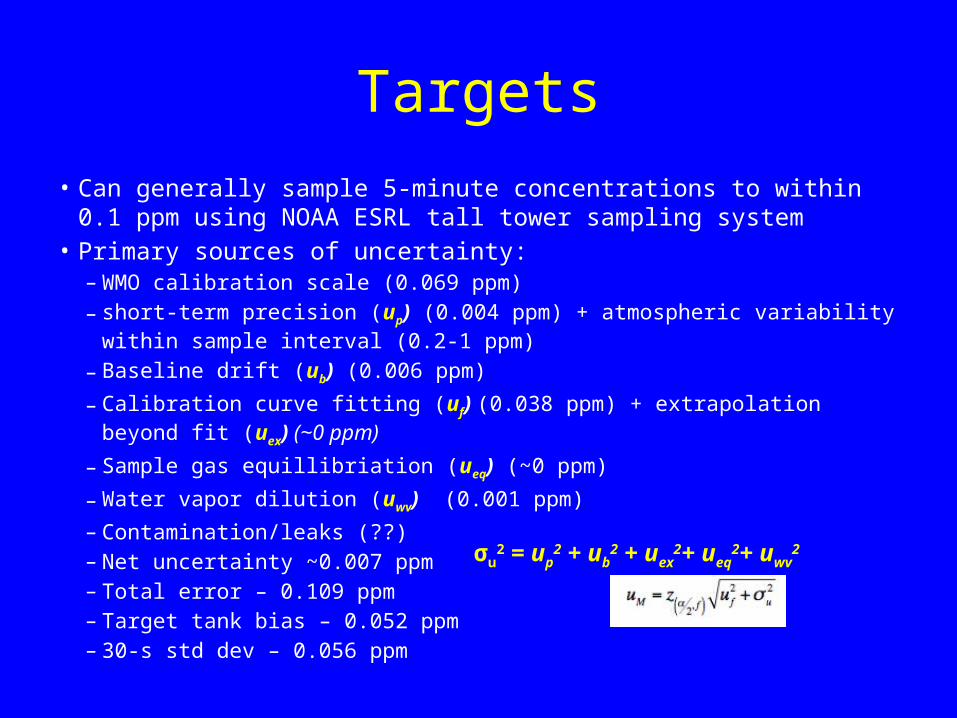
Targets• Can generally sample 5-minute concentrations to within 0.1 ppm using
NOAA ESRL tall tower sampling system• Primary sources of uncertainty:
– WMO calibration scale (0.069 ppm)– short-term precision (up) (0.004 ppm) + atmospheric variability within sample
interval (0.2-1 ppm)– Baseline drift (ub) (0.006 ppm)
– Calibration curve fitting (uf) (0.038 ppm) + extrapolation beyond fit (uex) (~0 ppm)
– Sample gas equillibriation (ueq) (~0 ppm)
– Water vapor dilution (uwv) (0.001 ppm)– Contamination/leaks (??)– Net uncertainty ~0.007 ppm– Total error – 0.109 ppm– Target tank bias – 0.052 ppm– 30-s std dev – 0.056 ppm
σu2 = up
2 + ub2 + uex
2+ ueq2+ uwv
2
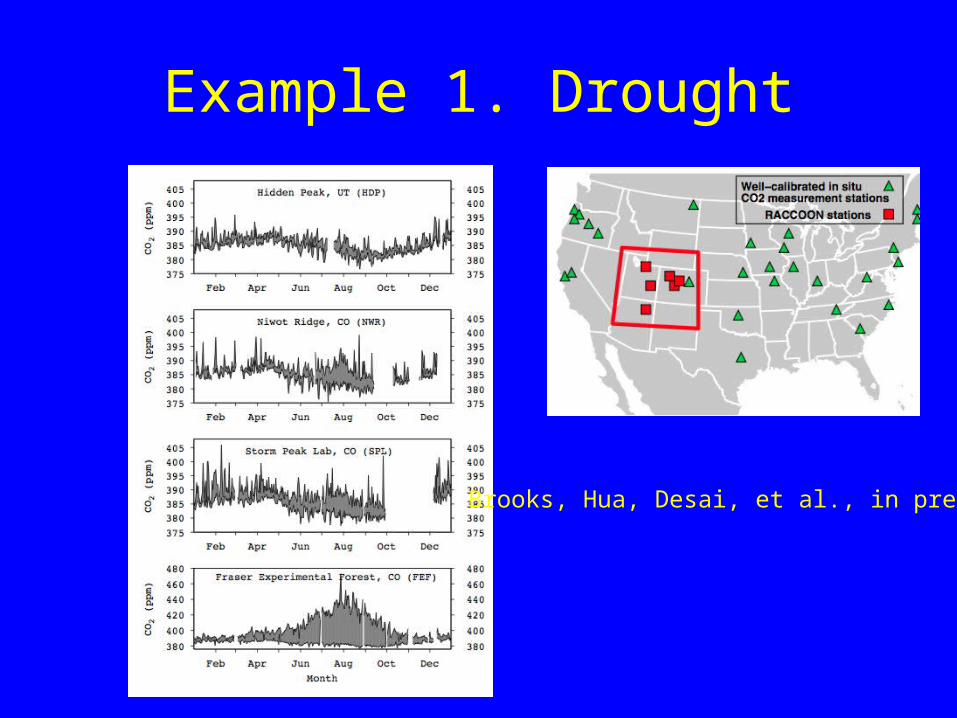
Example 1. Drought
Brooks, Hua, Desai, et al., in prep
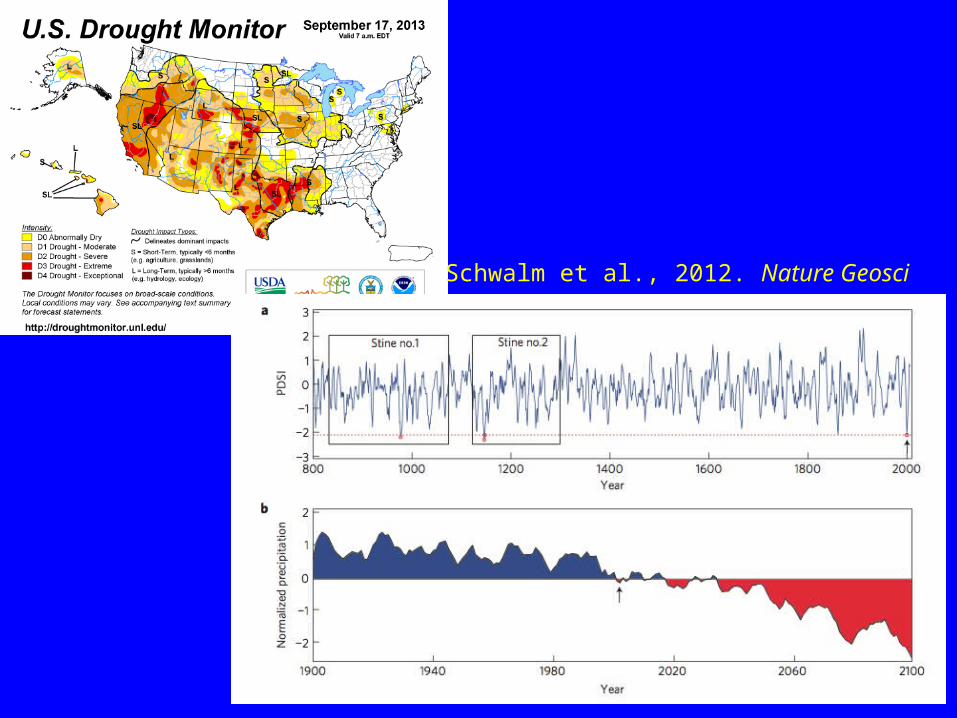
Schwalm et al., 2012. Nature Geosci
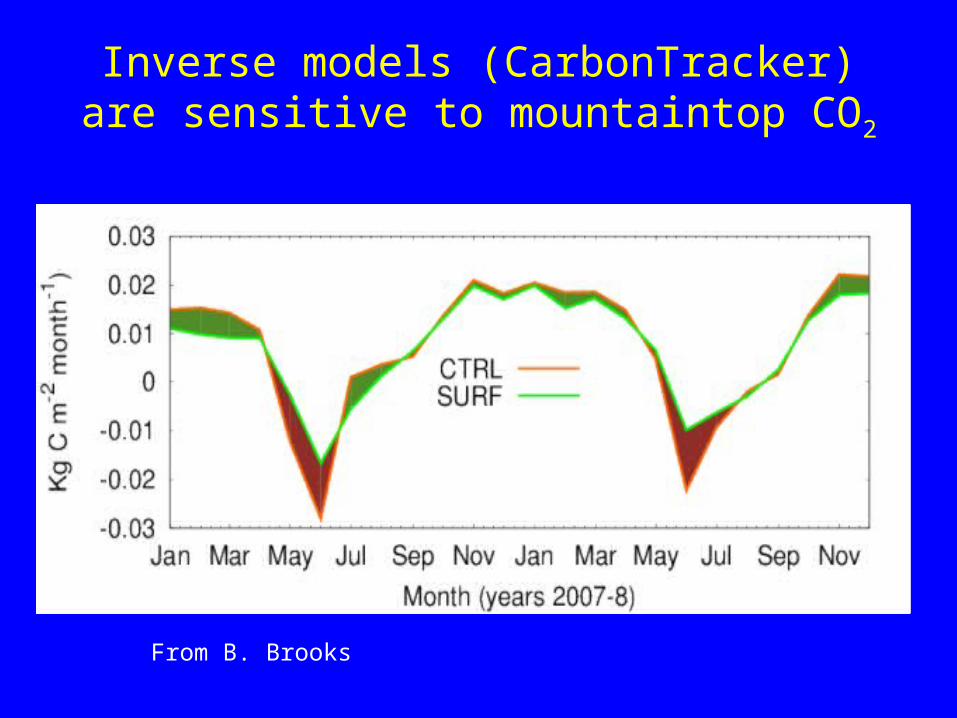
Inverse models (CarbonTracker) are sensitive to mountaintop CO2
From B. Brooks
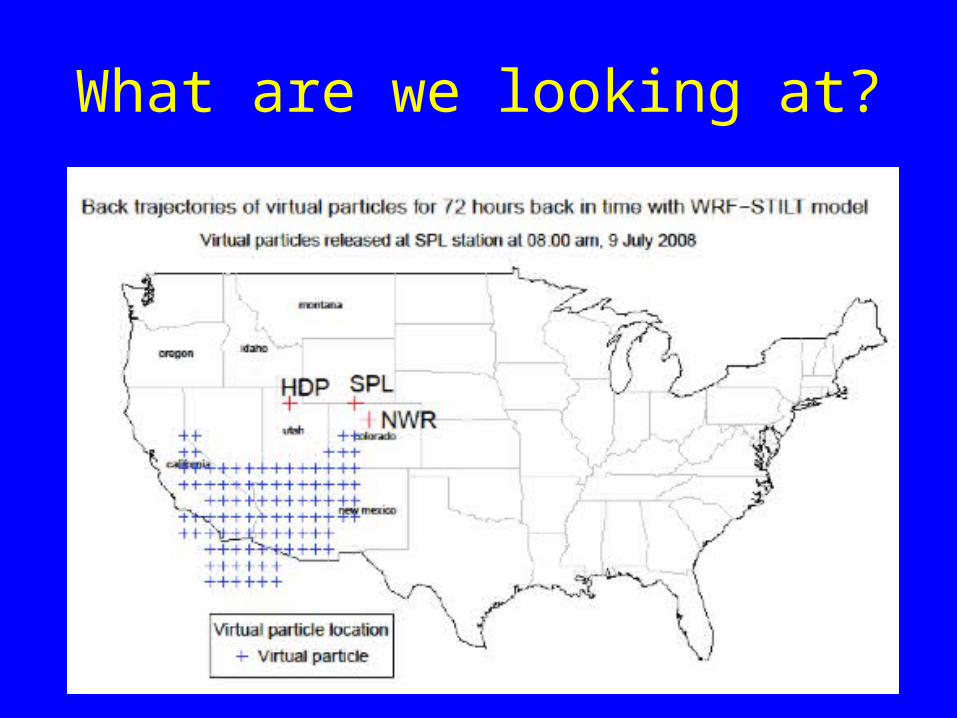
What are we looking at?
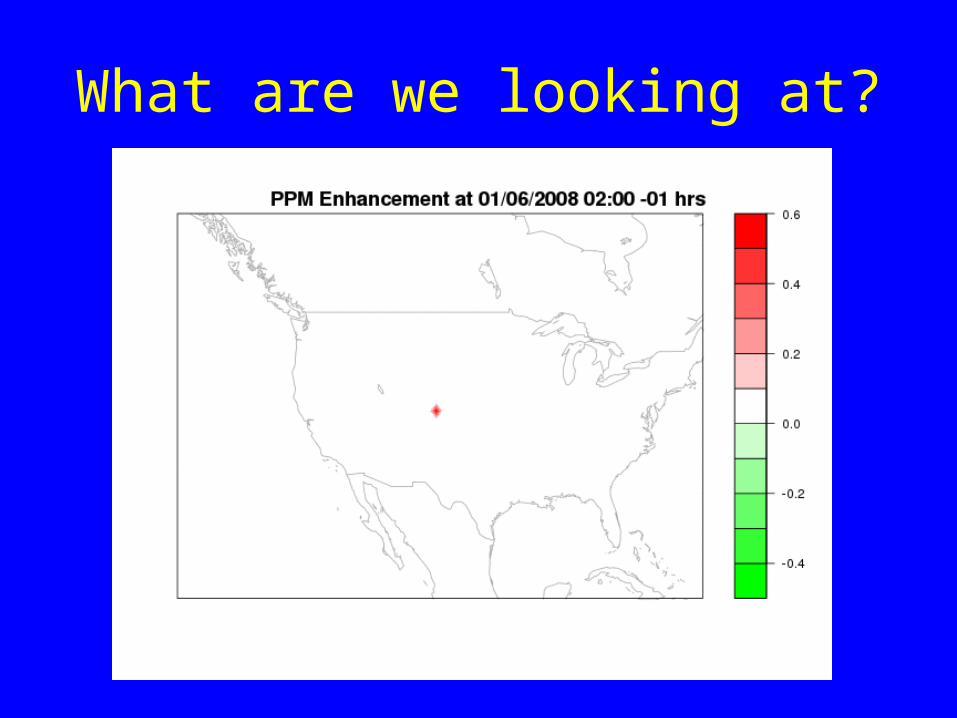
What are we looking at?
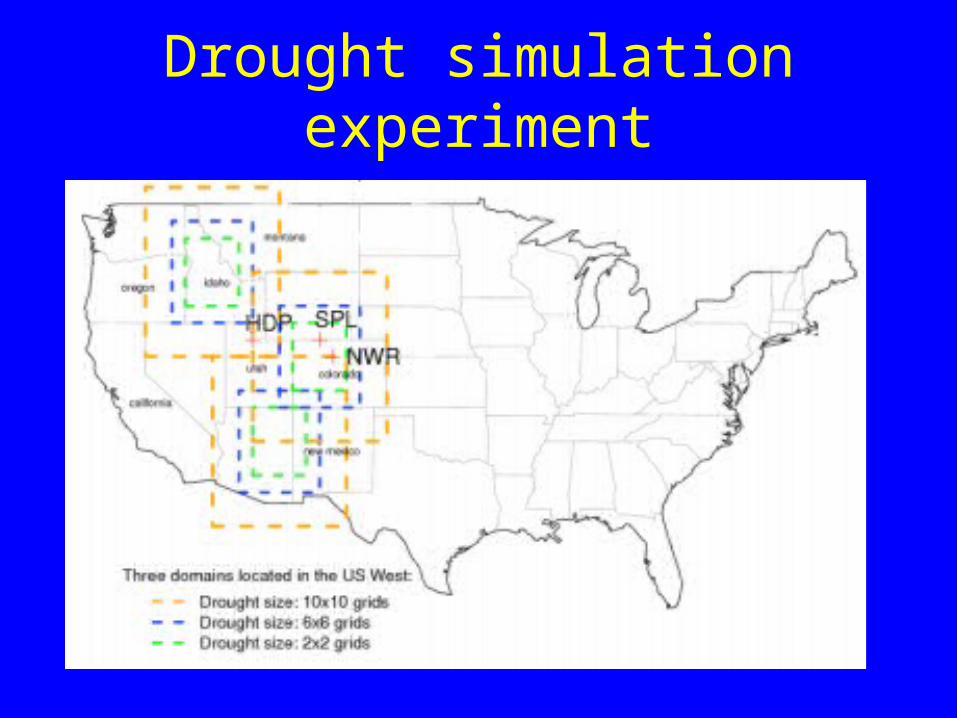
Drought simulation experiment
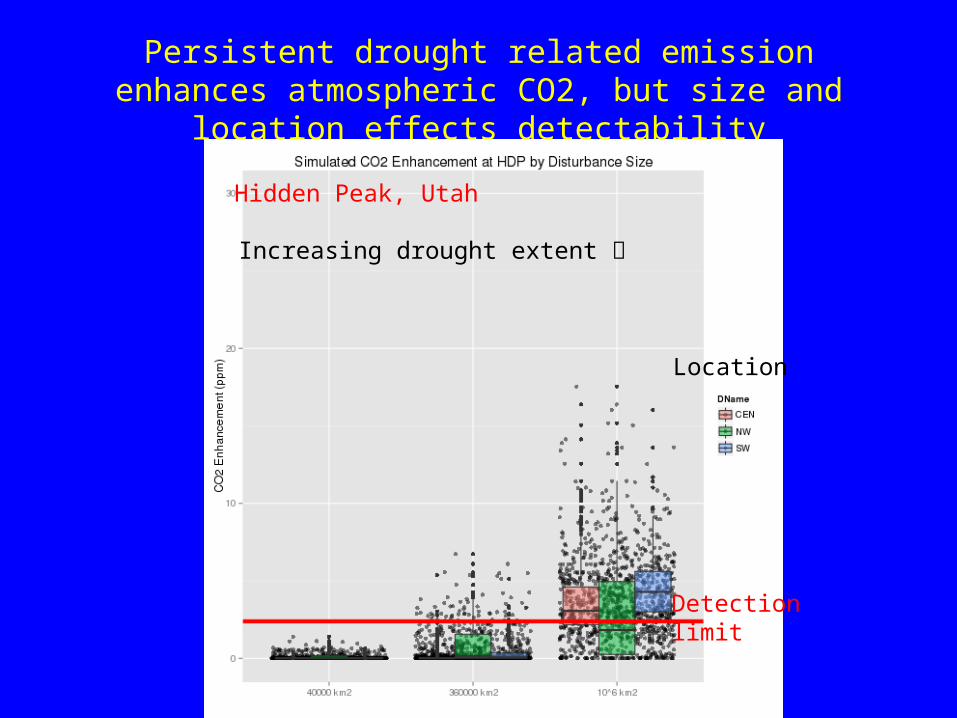
Persistent drought related emission enhances atmospheric CO2, but size and location effects detectability
Increasing drought extent
Location
Detectionlimit
Hidden Peak, Utah
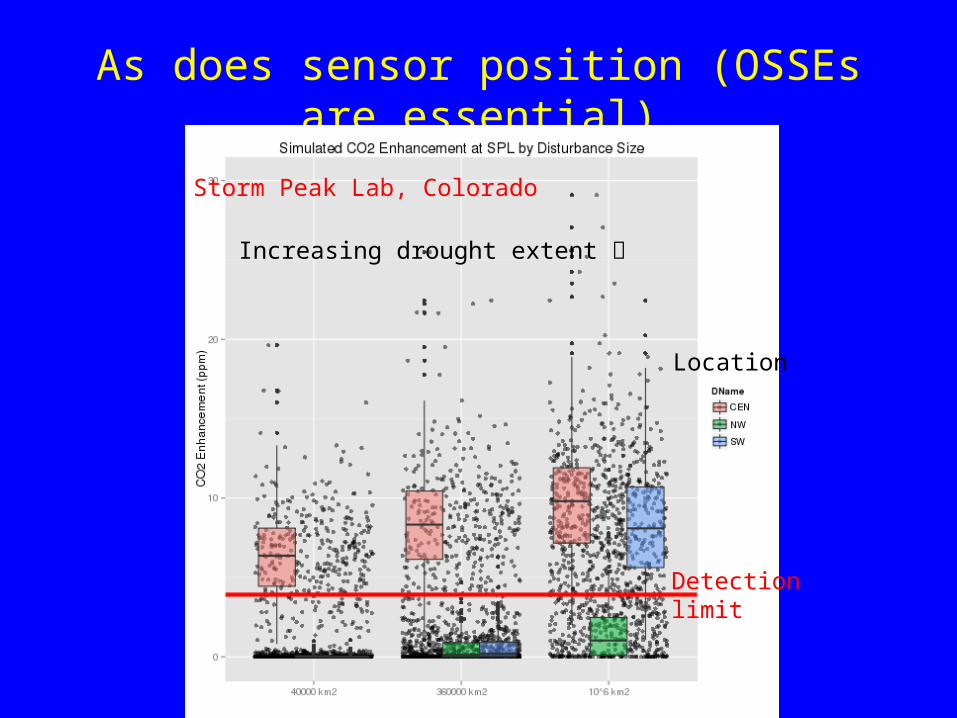
As does sensor position (OSSEs are essential)
Increasing drought extent
Location
Detectionlimit
Storm Peak Lab, Colorado
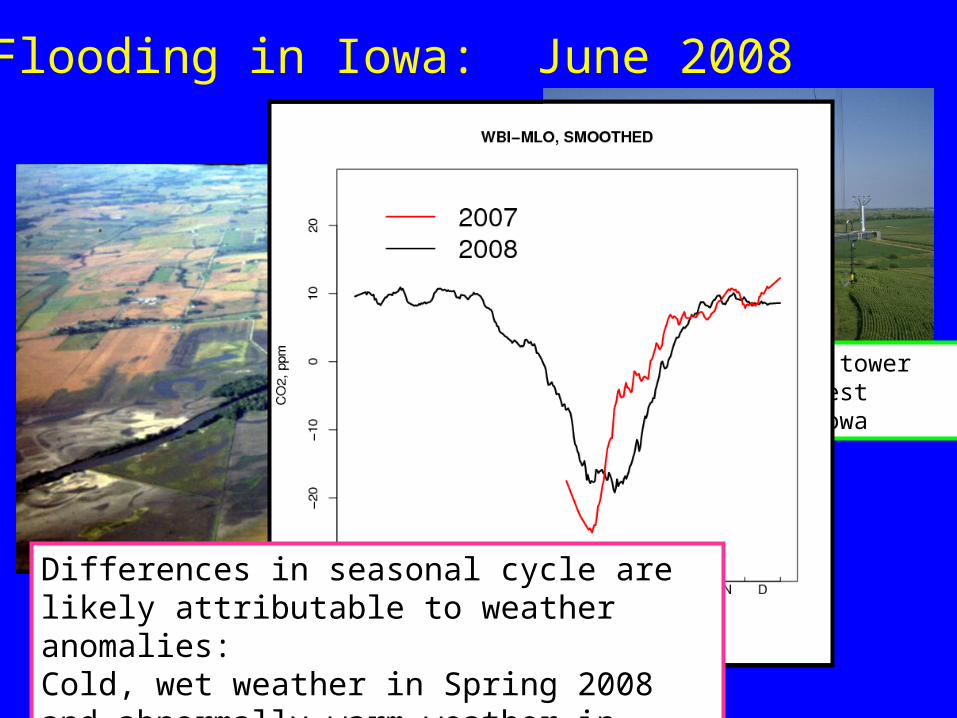
Flooding in Iowa: June 2008
ESRL tall tower site in West Branch, Iowa
Differences in seasonal cycle are likely attributable to weather anomalies:Cold, wet weather in Spring 2008 and abnormally warm weather in Spring 2007.
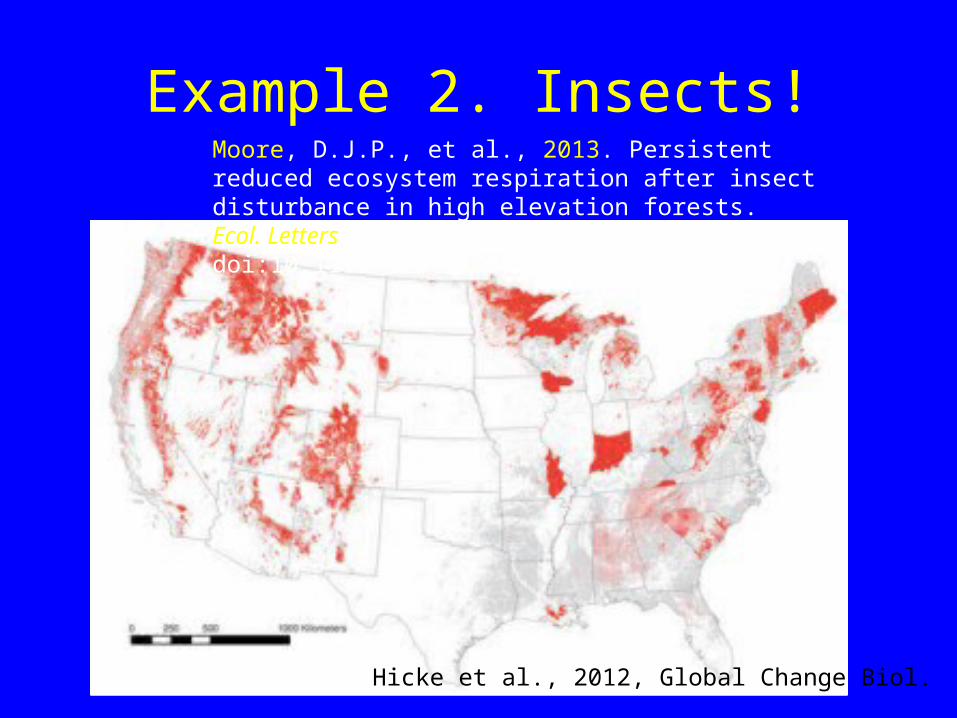
Example 2. Insects!
Hicke et al., 2012, Global Change Biol.
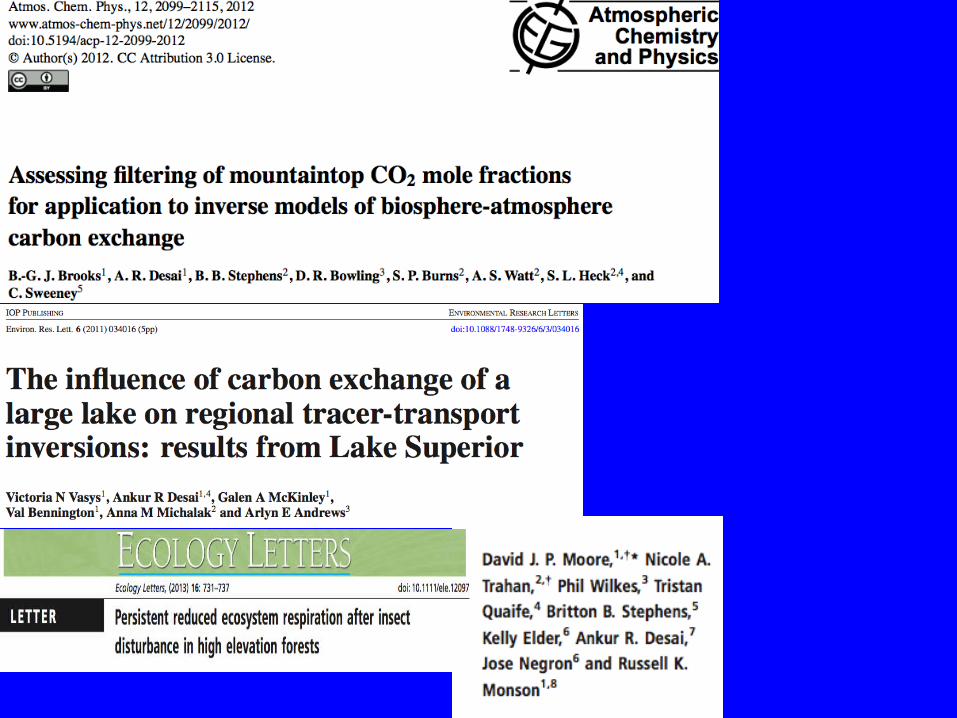
Moore, D.J.P., et al., 2013. Persistent reduced ecosystem respiration after insect disturbance in high elevation forests. Ecol. Letters, 16, 731–737, doi:10.1111/ele.12097.
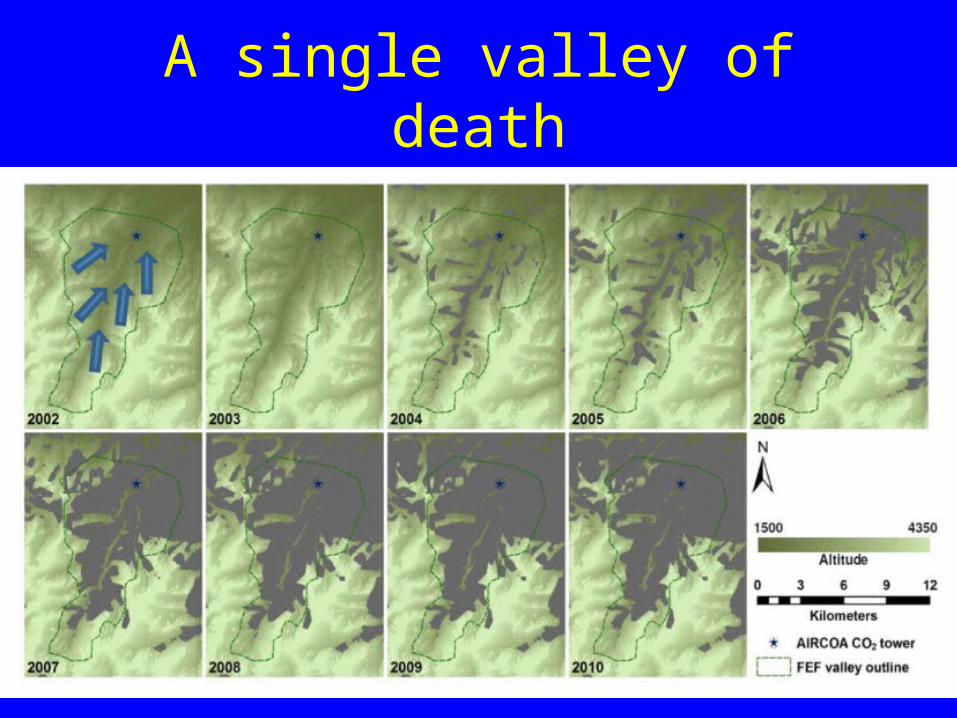
A single valley of death
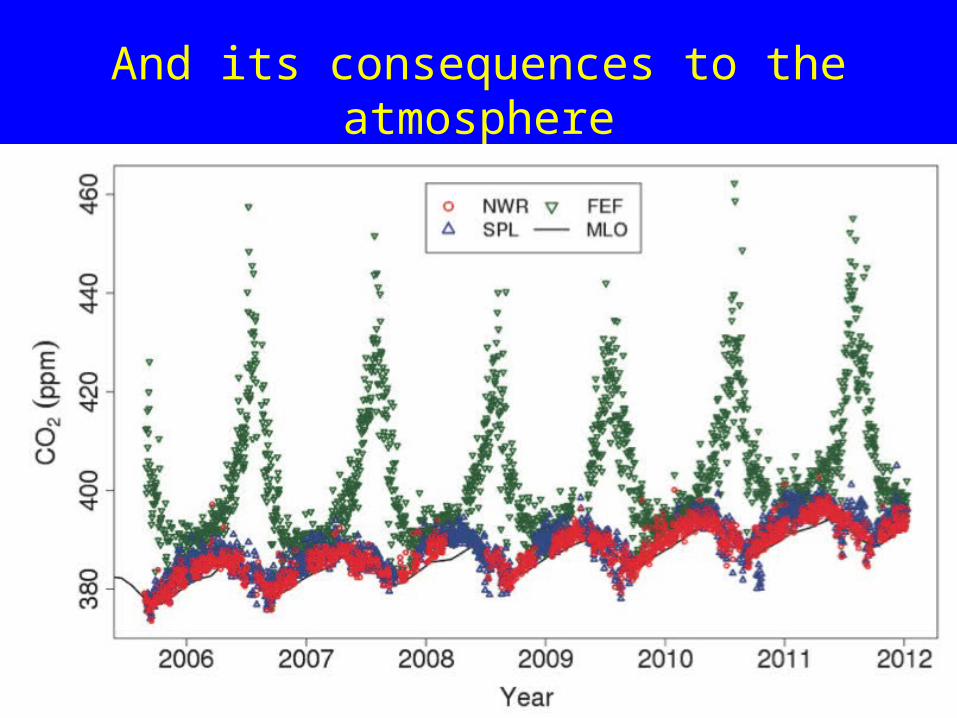
And its consequences to the atmosphere
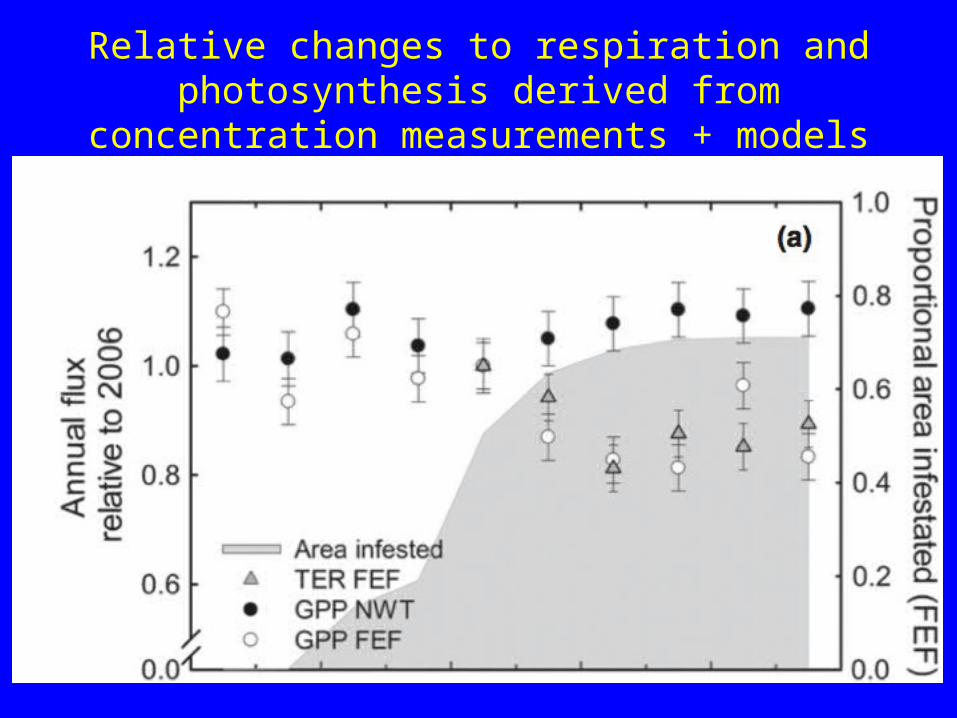
Relative changes to respiration and photosynthesis derived from concentration measurements + models
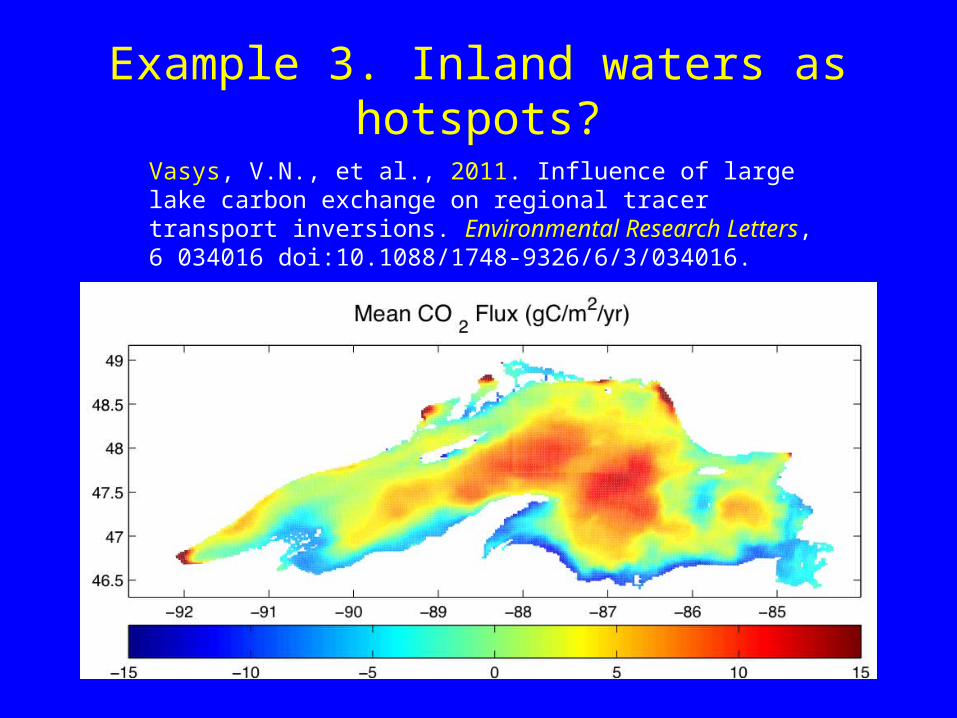
Example 3. Inland waters as hotspots?Vasys, V.N., et al., 2011. Influence of large lake carbon exchange on regional tracer transport inversions. Environmental Research Letters, 6 034016 doi:10.1088/1748-9326/6/3/034016.
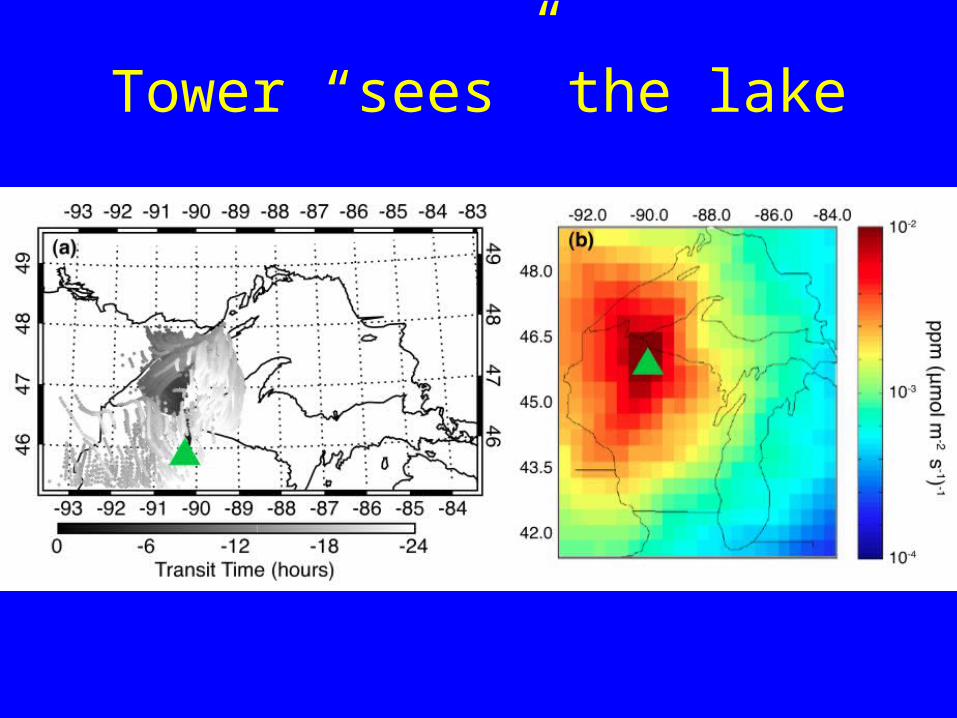
Tower “sees” the lake
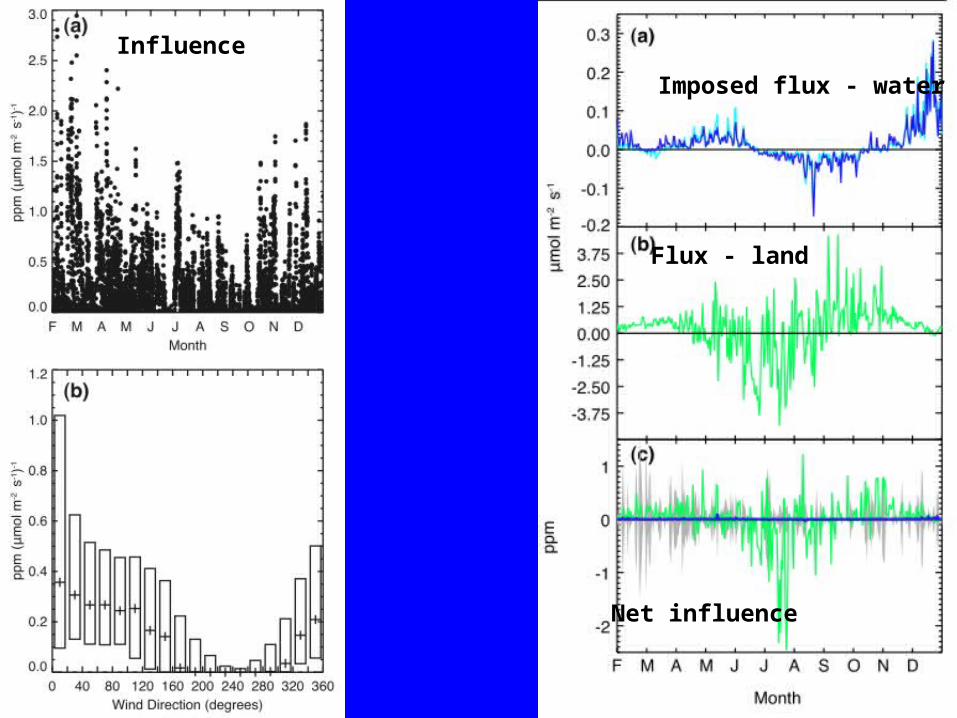
Imposed flux - water
Influence
Flux - land
Net influence
Summary and recommendations
• Calibration is essential for continuous monitoring as is profiling. 0.1 ppm accuracy of CO2 at 5 minute intervals with near zero drift is now feasible and about the level needed for regional flux quantification
• Detection of effect of extreme events on fluxes may be easier than capturing only mean fluxes
• Not every location needs to sample only well-mixed continental air masses
• Hotspot detection can lead to surprising results and provide clarity for setting inversion priors
• Transport may be the limiting factor more than observation!
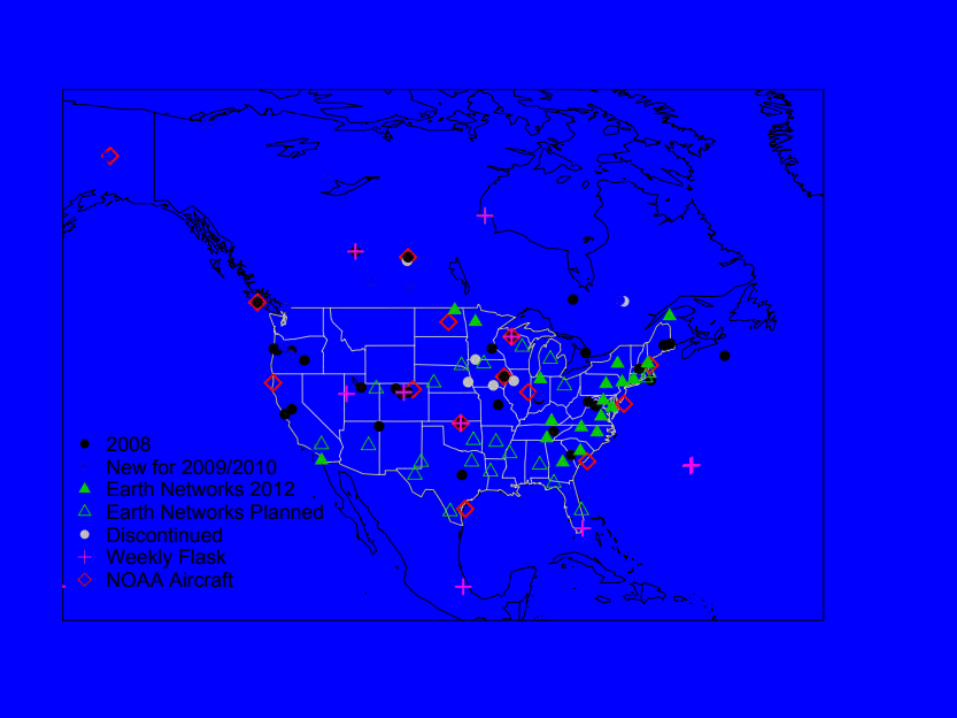
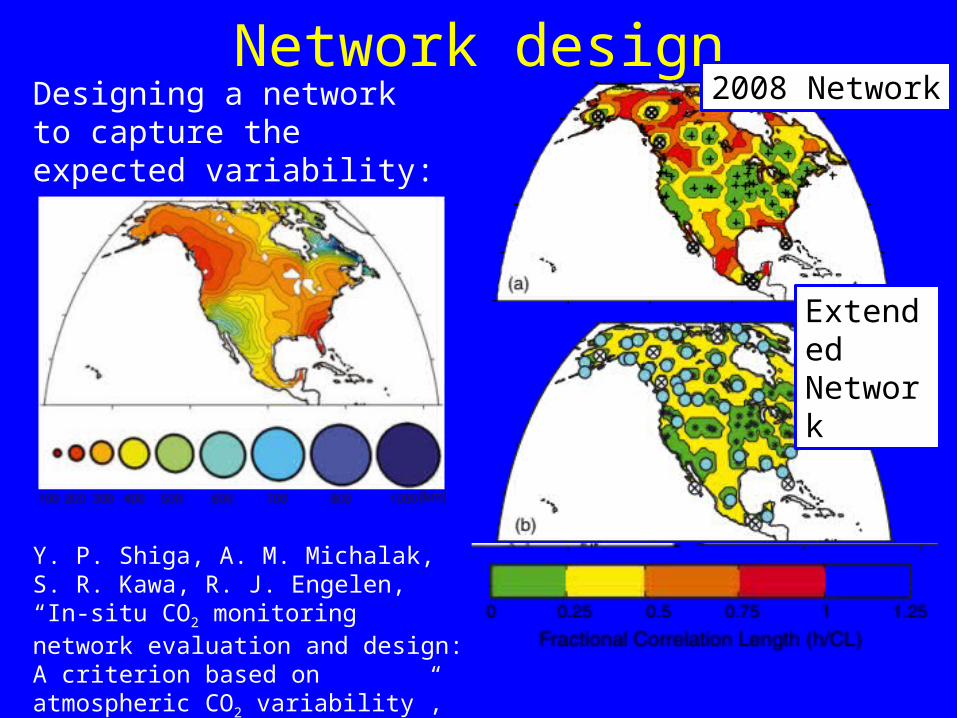
Network design2008 Network
Extended Network
Y. P. Shiga, A. M. Michalak, S. R. Kawa, R. J. Engelen, “In-situ CO2 monitoring network evaluation and design: A criterion based on atmospheric CO2 variability”, JGR, 2012
Designing a network to capture the expected variability:
Thank you
• Collaborators: J. Kofler (NOAA), J. Thom (UW), A. Michalak (Carnegie Inst), K. Davis (Penn State), D. Moore (U Arizona), D. Huntzinger (NAU), A. Watt (NCAR), V. Vasys, tower monkeys, spectroscopy wizards, inversion gurus
• Funding: NOAA (CPO NA09OAR4310065 and NA080AR4310533), NSF (DEB 0845166), DOE ‐(TES #ER65077)
Policy relevant recommendations
• Don’t eat your seed corn!– Baseline atmospheric greenhouse gas observatories are
under significant funding pressure and require a long-term plan for operation and calibration. Degradation in coverage, accuracy, and lack of group cooperation on inter-calibration and data sharing are real concerns
– These observations are our only direct link to verifying changes to atmosphere’s greenhouse gas budget
– Don’t neglect continuous tower based observations, which can now be made with high accuracy and provide a very rich picture of response of regional carbon cycle to climate change