Embed Size (px)
Citation preview
Towards a
Financial Statement Based Approach to Modeling Systemic Risk in
Insurance and Banking
Iyengar, Luo, Rajgopal*, Srinivasan, Venkatasubramanian, Wu and Zhang
October 28, 2016
Workshop on Systemic Risk in Insurance
Columbia University, New York
For the case study contained herein, we have consulted with Prudential Financial. This project was supported in part by the Center for the Management of Systemic Risk of which Prudential Financial is a member. Prudential Financial does not necessarily endorse the results or details of this research.
1
Outline
2
• Critique of SRISK as a measure of systemic risk
• Propose CRISK – an alternative financial statement-based measure of an institution’s vulnerability
• Case study: Prudential Financial, Inc.
Background
3
• CMSR studies systemic risk in several areas (e.g., chemical systems)
• SRISK has received significant attention recently, both academically and in the news • E.g. Danielsson et al (2014)
• This research is a cooperative project between CMSR and the B-school • Fundamental analysis is a focus area at the B-school
• SRISK is predominantly stock market based measure of systemic risk
• CRISK is an attempt to validate it with fundamentals
NYU Stern SRISK – Formulation
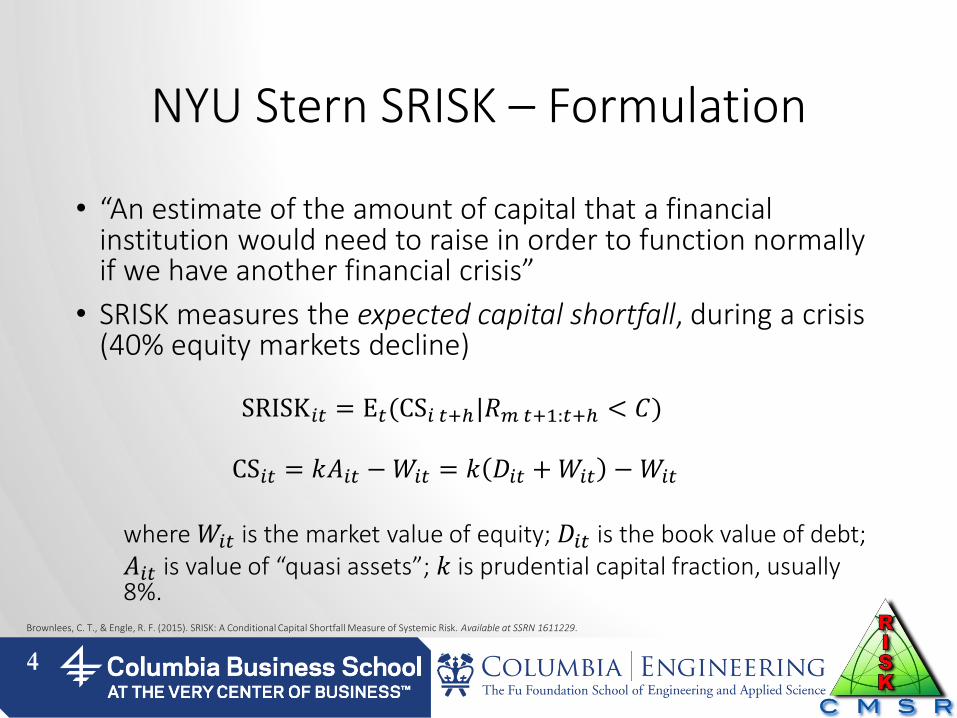
• “An estimate of the amount of capital that a financial institution would need to raise in order to function normally if we have another financial crisis”
• SRISK measures the expected capital shortfall, during a crisis (40% equity markets decline)
SRISK𝑖𝑡 = E𝑡(CS𝑖 𝑡+ℎ|𝑅𝑚 𝑡+1:𝑡+ℎ < 𝐶)
CS𝑖𝑡 = 𝑘𝐴𝑖𝑡 − 𝑊𝑖𝑡 = 𝑘 𝐷𝑖𝑡 + 𝑊𝑖𝑡 − 𝑊𝑖𝑡
where 𝑊𝑖𝑡 is the market value of equity; 𝐷𝑖𝑡 is the book value of debt; 𝐴𝑖𝑡 is value of “quasi assets”; 𝑘 is prudential capital fraction, usually 8%.
4
Brownlees, C. T., & Engle, R. F. (2015). SRISK: A Conditional Capital Shortfall Measure of Systemic Risk. Available at SSRN 1611229.
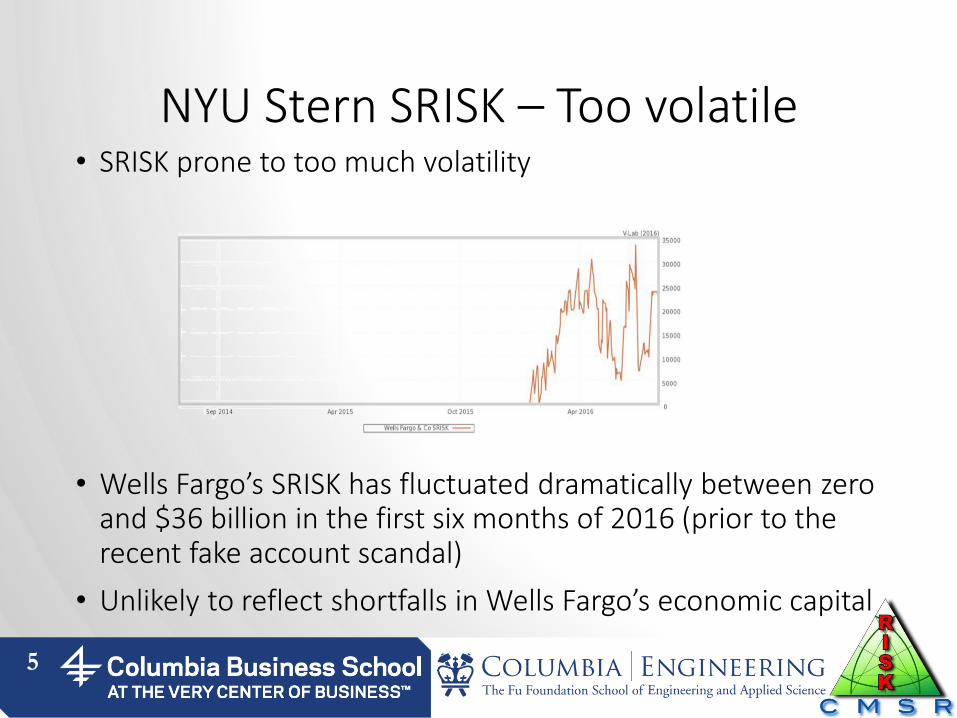
NYU Stern SRISK – Too volatile • SRISK prone to too much volatility
• Wells Fargo’s SRISK has fluctuated dramatically between zero and $36 billion in the first six months of 2016 (prior to the recent fake account scandal)
• Unlikely to reflect shortfalls in Wells Fargo’s economic capital
5
NYU Stern SRISK – Critiques • Capital shortfalls under SRISK represent a black box and are
not tailored to specific business models • SRISK does not isolate “at risk” liabilities of each business model
• “At risk” liabilities are those which are callable at par value and on which the company bears the risk (i.e. short term repos at a bank)
• For a life insurer, consider separate accounts, closed block, future policy benefits, and policyholders’ account balances
• 8% capital requirement is based on Basel capital standards and is not applicable to insurers (RBC)
• Market risk may not be the most important systemic risk for an insurer • A hurricane, not a 40% decline in the market, could be a systemic
event for a P&C insurer
• A pandemic for a life insurer
6
NYU Stern SRISK – Best for “at risk” liabilities
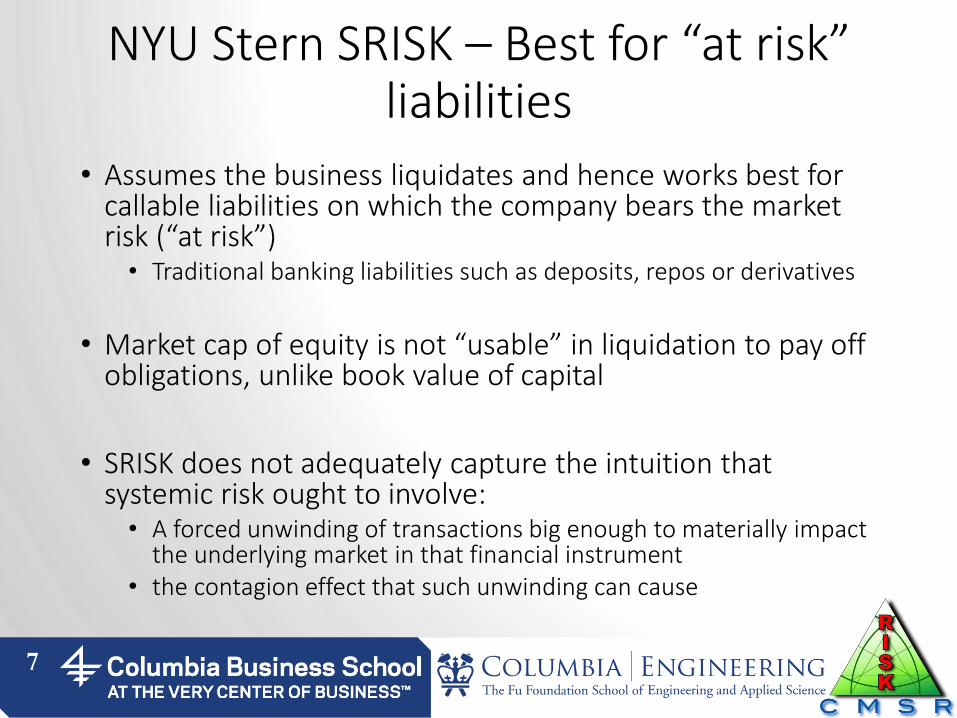
• Assumes the business liquidates and hence works best for callable liabilities on which the company bears the market risk (“at risk”) • Traditional banking liabilities such as deposits, repos or derivatives
• Market cap of equity is not “usable” in liquidation to pay off obligations, unlike book value of capital
• SRISK does not adequately capture the intuition that systemic risk ought to involve: • A forced unwinding of transactions big enough to materially impact
the underlying market in that financial instrument • the contagion effect that such unwinding can cause
7
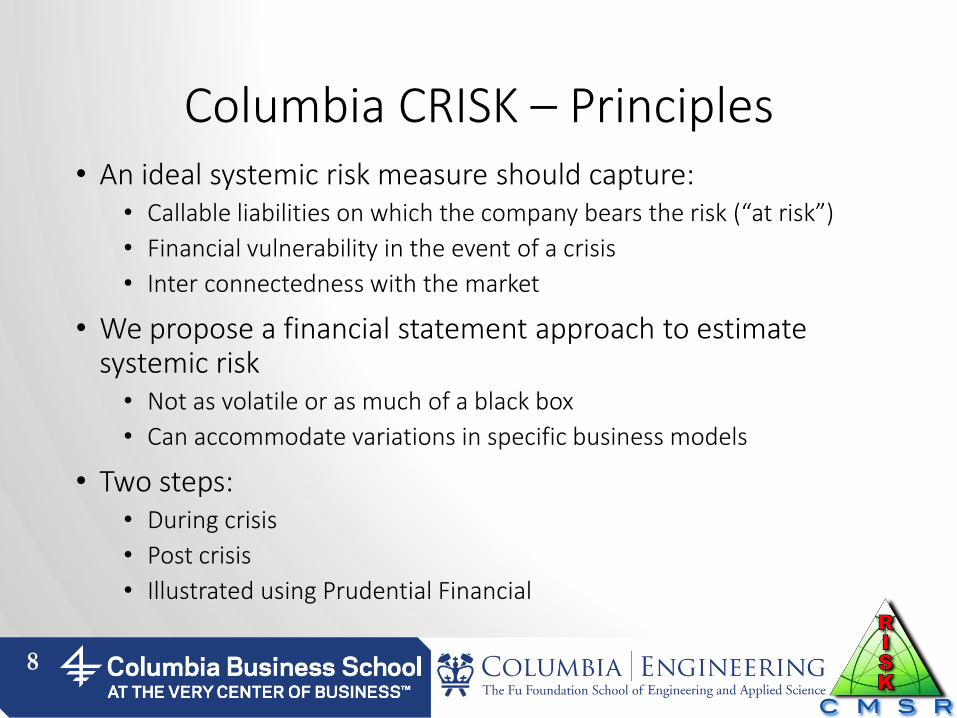
Columbia CRISK – Principles • An ideal systemic risk measure should capture:
• Callable liabilities on which the company bears the risk (“at risk”)
• Financial vulnerability in the event of a crisis
• Inter connectedness with the market
• We propose a financial statement approach to estimate systemic risk • Not as volatile or as much of a black box
• Can accommodate variations in specific business models
• Two steps: • During crisis
• Post crisis
• Illustrated using Prudential Financial
8
Prudential: CRISK Two-Step Procedure
9
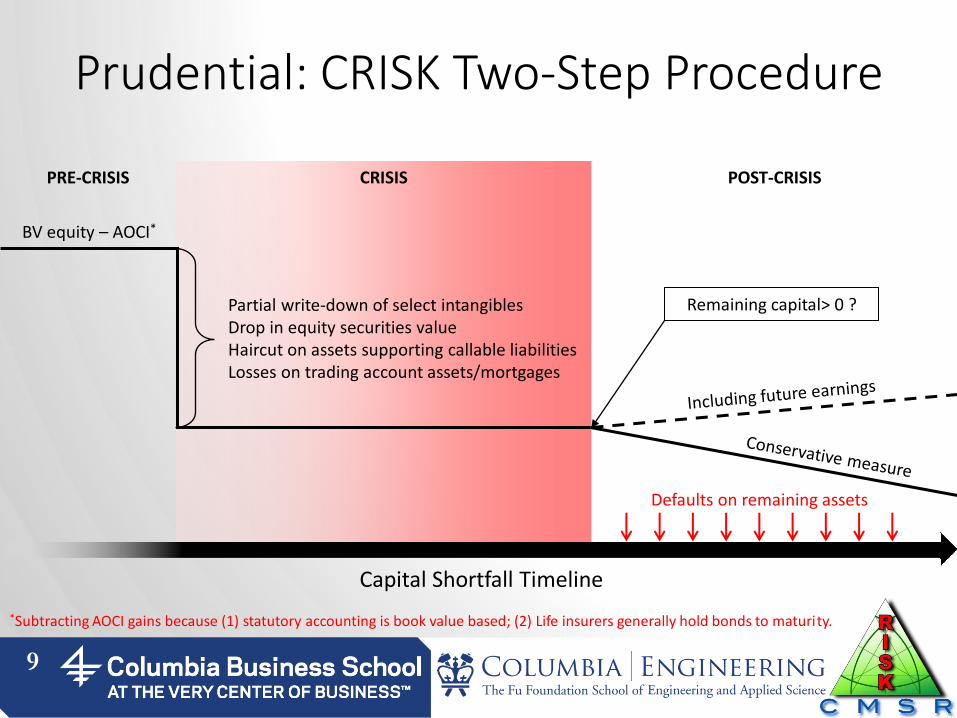
PRE-CRISIS CRISIS POST-CRISIS
BV equity – AOCI*
Partial write-down of select intangibles Drop in equity securities value Haircut on assets supporting callable liabilities Losses on trading account assets/mortgages
Remaining capital> 0 ?
Defaults on remaining assets
Capital Shortfall Timeline
*Subtracting AOCI gains because (1) statutory accounting is book value based; (2) Life insurers generally hold bonds to maturity.
Columbia CRISK – During Crisis
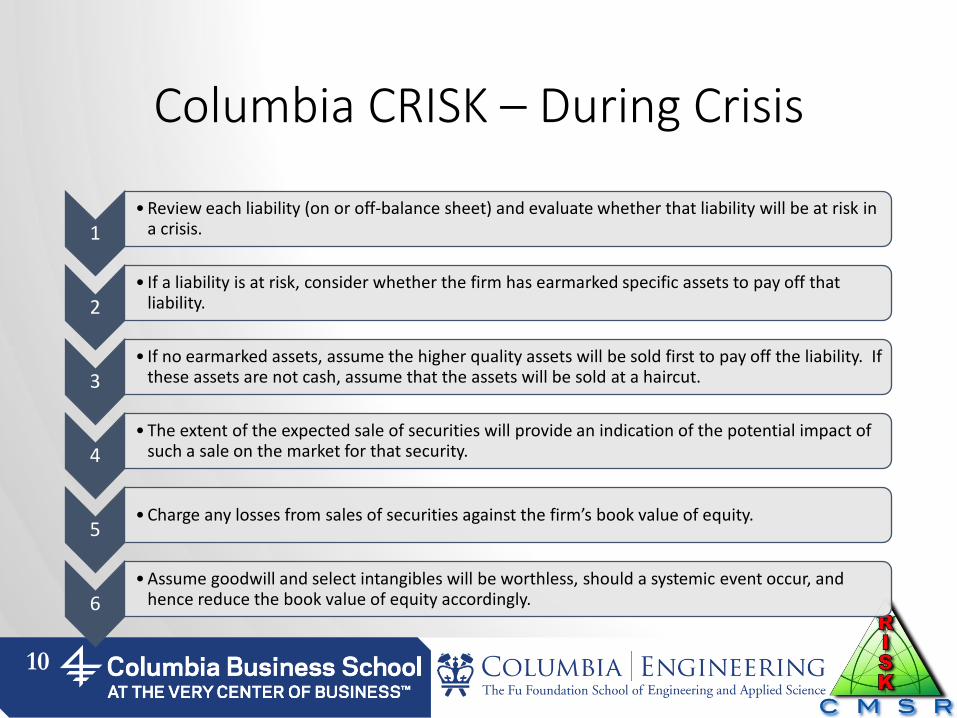
1 • Review each liability (on or off-balance sheet) and evaluate whether that liability will be at risk in
a crisis.
2 • If a liability is at risk, consider whether the firm has earmarked specific assets to pay off that
liability.
3 • If no earmarked assets, assume the higher quality assets will be sold first to pay off the liability. If
these assets are not cash, assume that the assets will be sold at a haircut.
4 • The extent of the expected sale of securities will provide an indication of the potential impact of
such a sale on the market for that security.
5 • Charge any losses from sales of securities against the firm’s book value of equity.
6 • Assume goodwill and select intangibles will be worthless, should a systemic event occur, and
hence reduce the book value of equity accordingly.
10
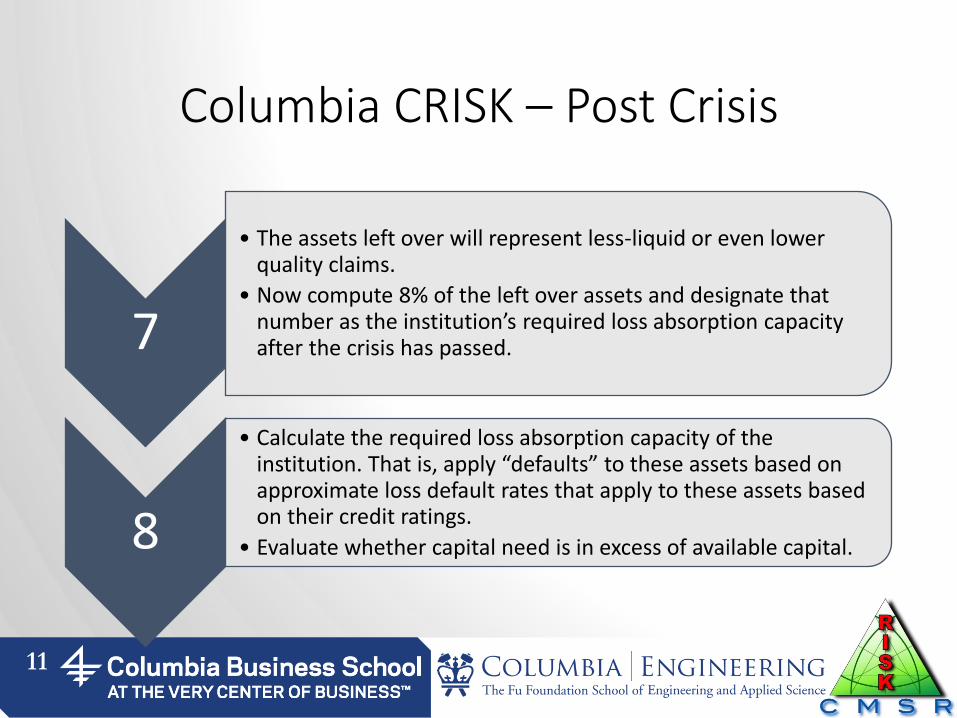
Columbia CRISK – Post Crisis
7
• The assets left over will represent less-liquid or even lower quality claims.
• Now compute 8% of the left over assets and designate that number as the institution’s required loss absorption capacity after the crisis has passed.
8
• Calculate the required loss absorption capacity of the institution. That is, apply “defaults” to these assets based on approximate loss default rates that apply to these assets based on their credit ratings.
• Evaluate whether capital need is in excess of available capital.
11

Case Study – Prudential
12
13
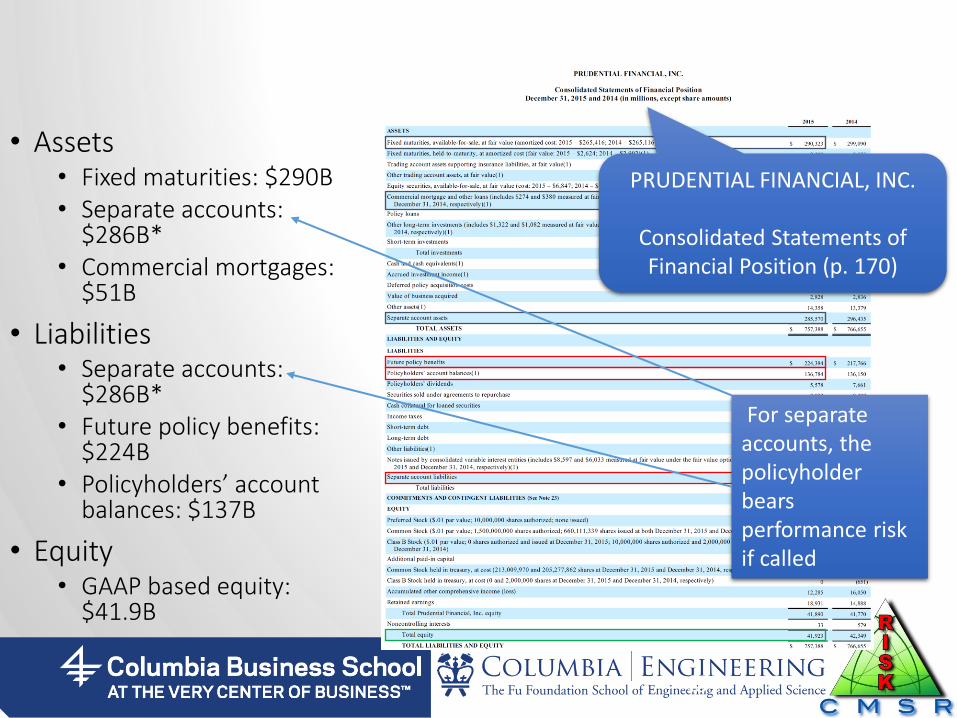
• Assets • Fixed maturities: $290B • Separate accounts:
$286B* • Commercial mortgages:
$51B
• Liabilities • Separate accounts:
$286B* • Future policy benefits:
$224B • Policyholders’ account
balances: $137B
• Equity • GAAP based equity:
$41.9B
PRUDENTIAL FINANCIAL, INC.
Consolidated Statements of Financial Position (p. 170)
For separate accounts, the policyholder bears performance risk if called
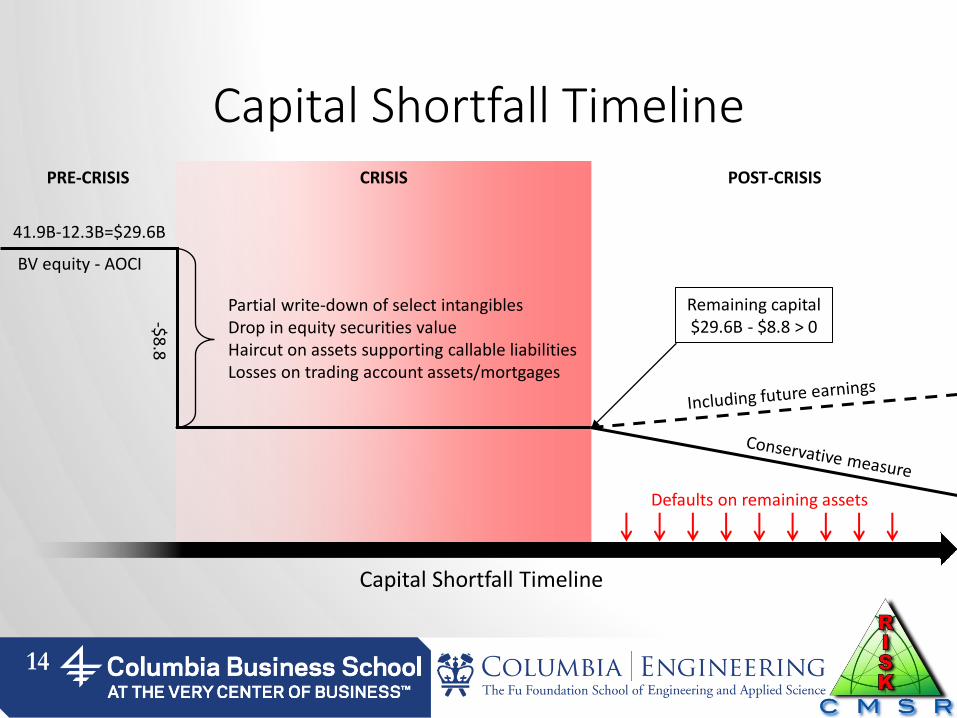
Capital Shortfall Timeline
14
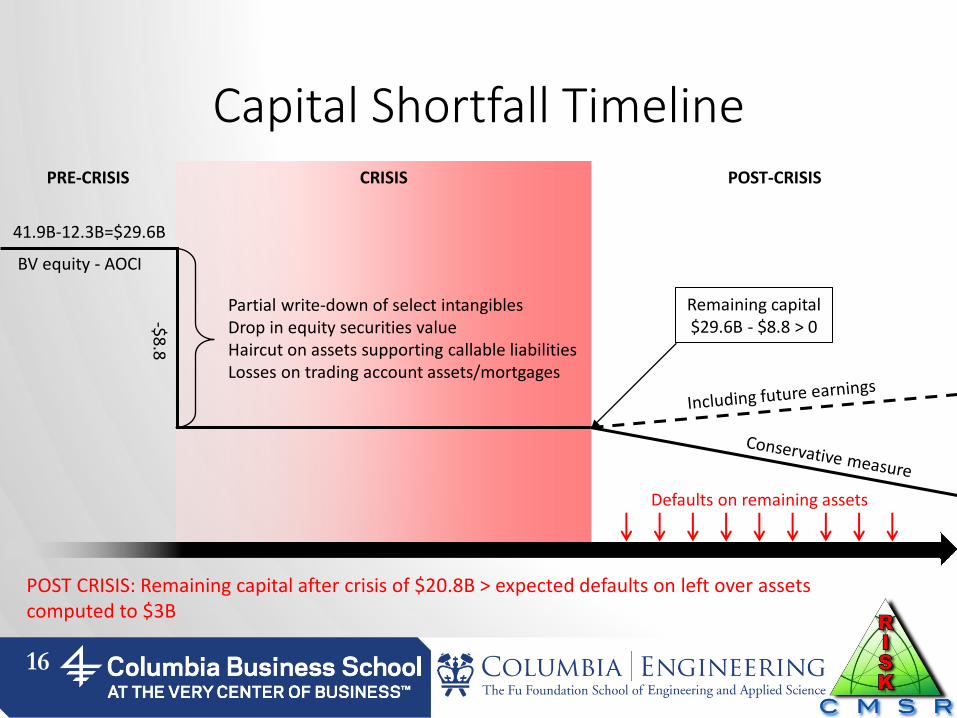
PRE-CRISIS CRISIS POST-CRISIS
41.9B-12.3B=$29.6B
Partial write-down of select intangibles Drop in equity securities value Haircut on assets supporting callable liabilities Losses on trading account assets/mortgages
Defaults on remaining assets
Capital Shortfall Timeline
BV equity - AOCI
-$8.8
Remaining capital $29.6B - $8.8 > 0
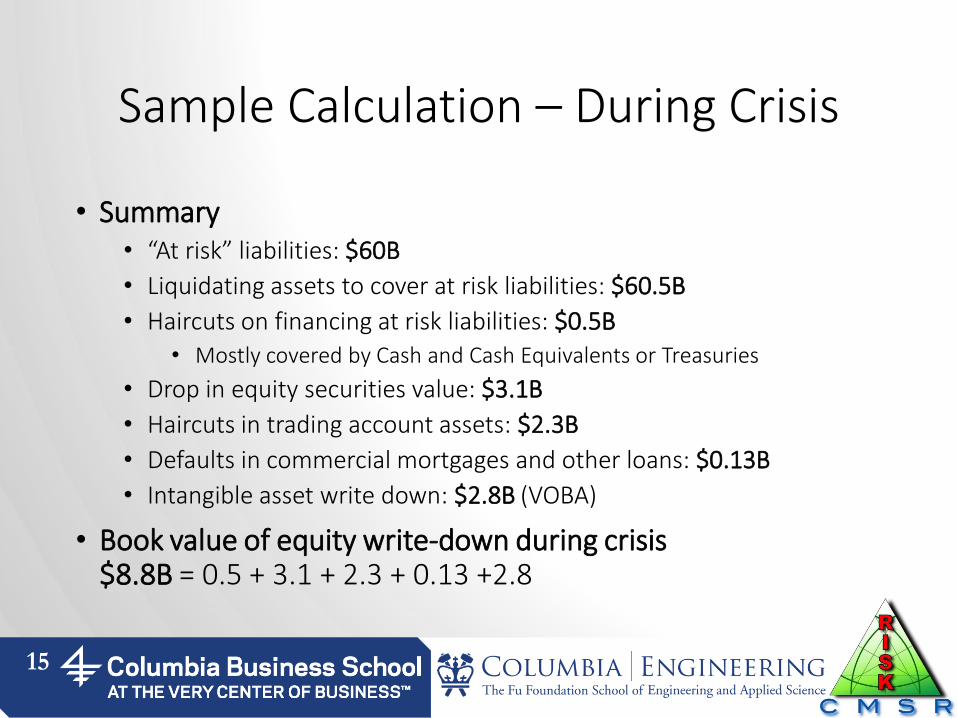
Sample Calculation – During Crisis
• Summary • “At risk” liabilities: $60B
• Liquidating assets to cover at risk liabilities: $60.5B
• Haircuts on financing at risk liabilities: $0.5B • Mostly covered by Cash and Cash Equivalents or Treasuries
• Drop in equity securities value: $3.1B
• Haircuts in trading account assets: $2.3B
• Defaults in commercial mortgages and other loans: $0.13B
• Intangible asset write down: $2.8B (VOBA)
• Book value of equity write-down during crisis $8.8B = 0.5 + 3.1 + 2.3 + 0.13 +2.8
15
Capital Shortfall Timeline
16
POST CRISIS: Remaining capital after crisis of $20.8B > expected defaults on left over assets computed to $3B
PRE-CRISIS CRISIS POST-CRISIS
41.9B-12.3B=$29.6B
Partial write-down of select intangibles Drop in equity securities value Haircut on assets supporting callable liabilities Losses on trading account assets/mortgages
Defaults on remaining assets
BV equity - AOCI
-$8.8
Remaining capital $29.6B - $8.8 > 0
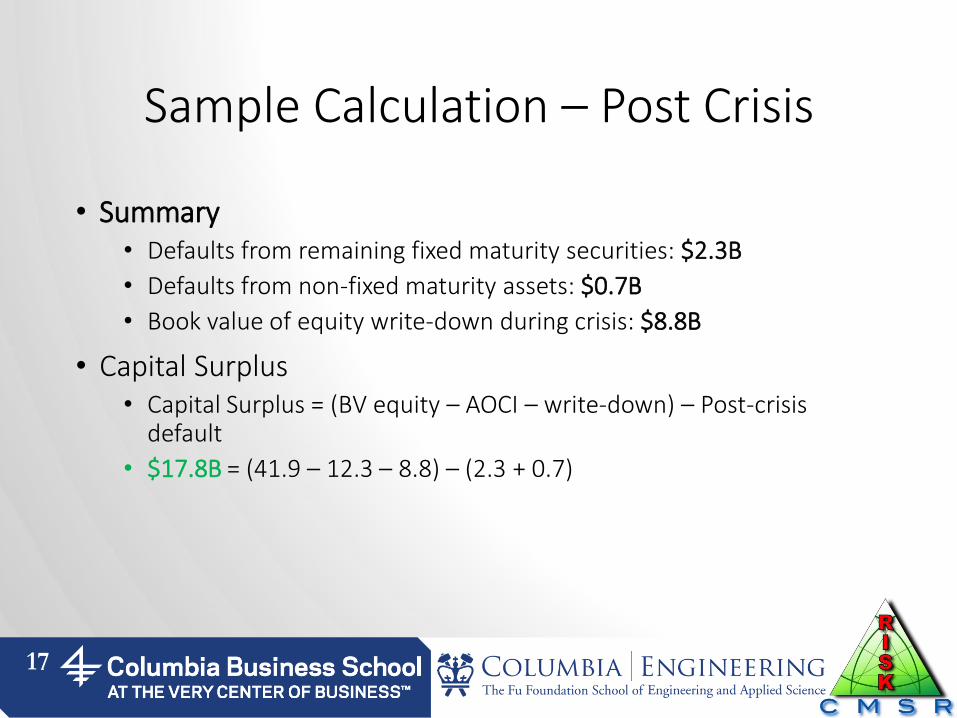
Sample Calculation – Post Crisis
• Summary • Defaults from remaining fixed maturity securities: $2.3B
• Defaults from non-fixed maturity assets: $0.7B
• Book value of equity write-down during crisis: $8.8B
• Capital Surplus • Capital Surplus = (BV equity – AOCI – write-down) – Post-crisis
default
• $17.8B = (41.9 – 12.3 – 8.8) – (2.3 + 0.7)
17
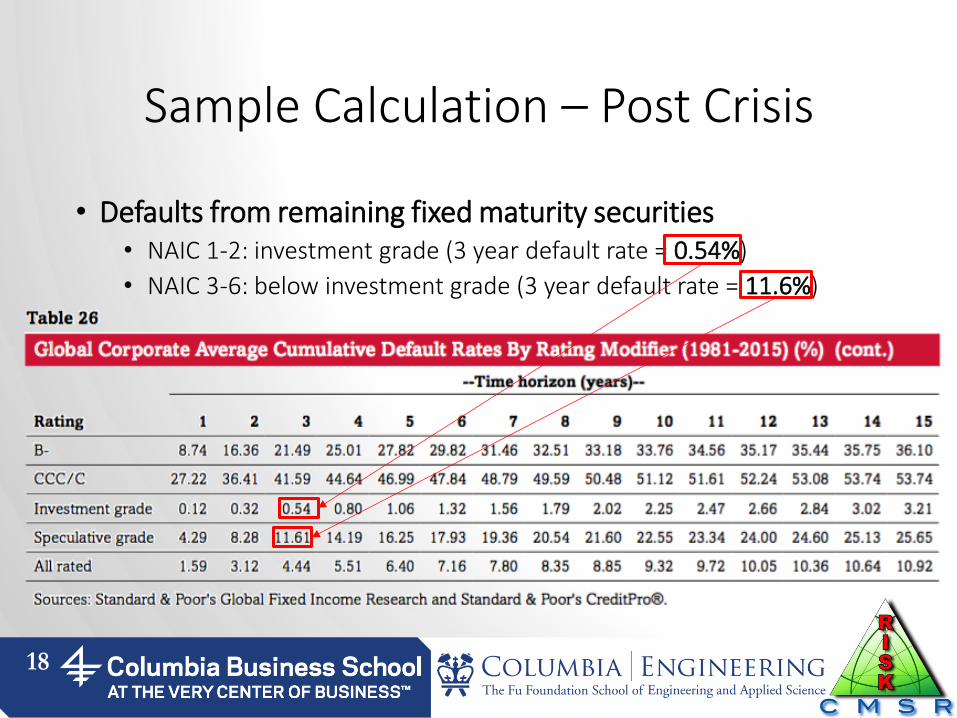
Sample Calculation – Post Crisis
• Defaults from remaining fixed maturity securities • NAIC 1-2: investment grade (3 year default rate = 0.54%)
• NAIC 3-6: below investment grade (3 year default rate = 11.6%)
18
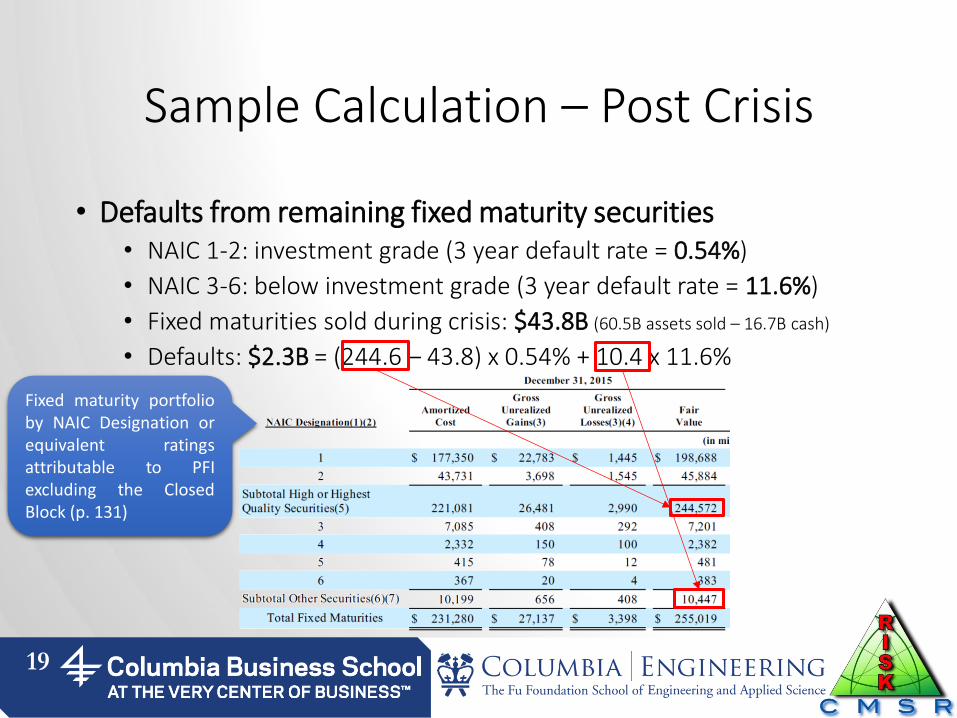
Sample Calculation – Post Crisis
• Defaults from remaining fixed maturity securities • NAIC 1-2: investment grade (3 year default rate = 0.54%)
• NAIC 3-6: below investment grade (3 year default rate = 11.6%)
• Fixed maturities sold during crisis: $43.8B (60.5B assets sold – 16.7B cash)
• Defaults: $2.3B = (244.6 – 43.8) x 0.54% + 10.4 x 11.6%
19
Fixed maturity portfolio by NAIC Designation or equivalent ratings attributable to PFI excluding the Closed Block (p. 131)
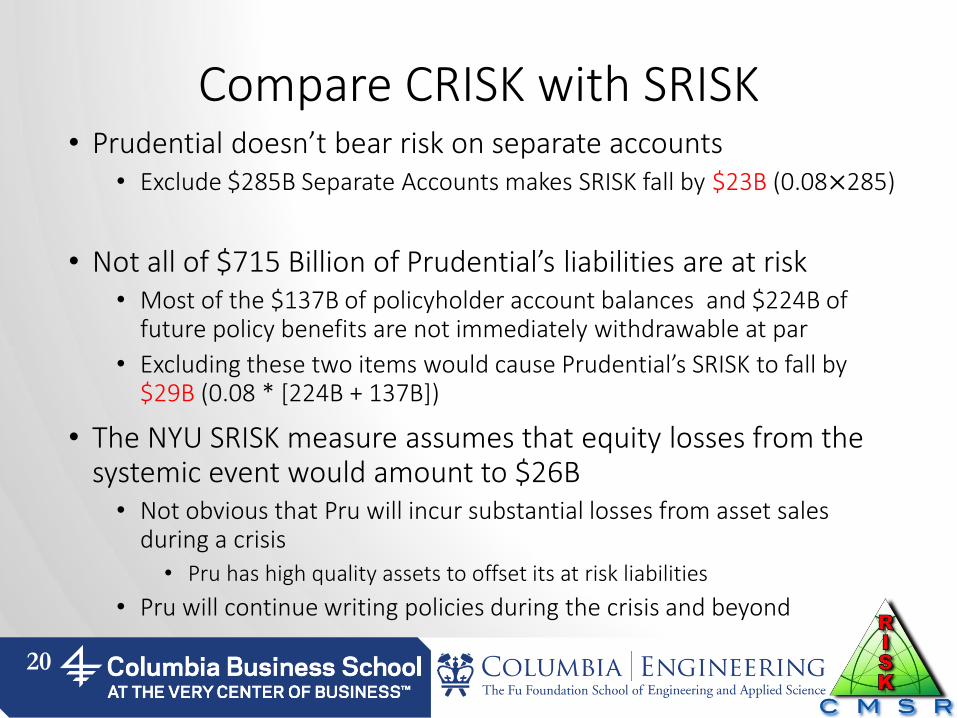
Compare CRISK with SRISK • Prudential doesn’t bear risk on separate accounts
• Exclude $285B Separate Accounts makes SRISK fall by $23B (0.08×285)
• Not all of $715 Billion of Prudential’s liabilities are at risk • Most of the $137B of policyholder account balances and $224B of
future policy benefits are not immediately withdrawable at par
• Excluding these two items would cause Prudential’s SRISK to fall by $29B (0.08 * [224B + 137B])
• The NYU SRISK measure assumes that equity losses from the systemic event would amount to $26B • Not obvious that Pru will incur substantial losses from asset sales
during a crisis
• Pru has high quality assets to offset its at risk liabilities
• Pru will continue writing policies during the crisis and beyond
20
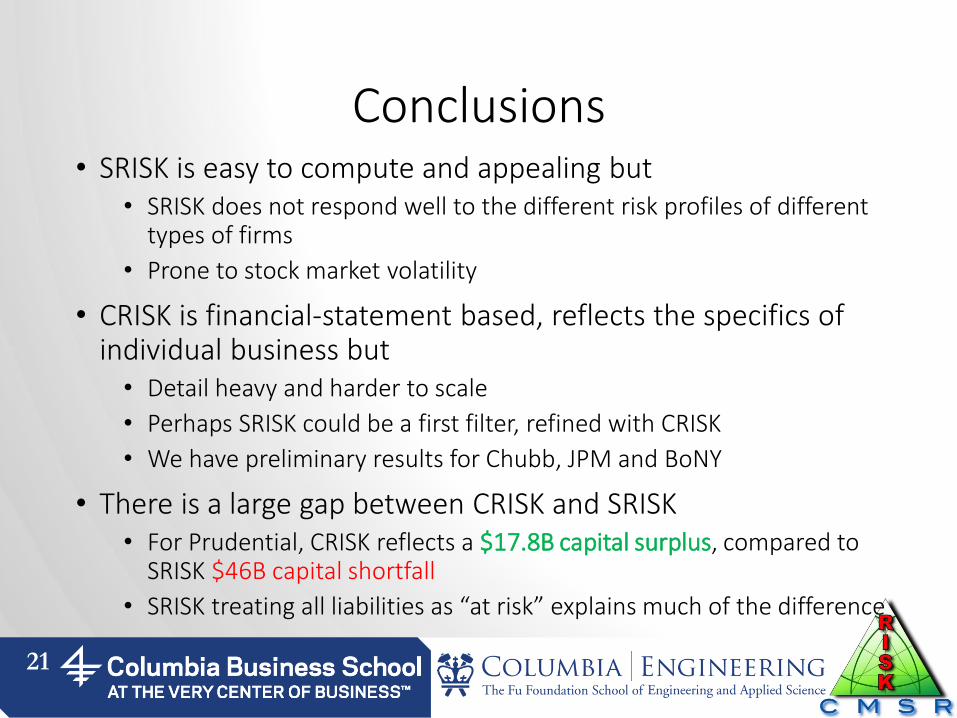
Conclusions • SRISK is easy to compute and appealing but
• SRISK does not respond well to the different risk profiles of different types of firms
• Prone to stock market volatility
• CRISK is financial-statement based, reflects the specifics of individual business but • Detail heavy and harder to scale
• Perhaps SRISK could be a first filter, refined with CRISK
• We have preliminary results for Chubb, JPM and BoNY
• There is a large gap between CRISK and SRISK • For Prudential, CRISK reflects a $17.8B capital surplus, compared to
SRISK $46B capital shortfall
• SRISK treating all liabilities as “at risk” explains much of the difference
21

Thanks and discussion!
22