Embed Size (px)
Citation preview
TOWARDS A COMPUTATIONAL DEFINITION OF THE TRESILLORHYTHM AND ITS TRACING IN POPULAR MUSIC
Pushkar JajoriaEPFL† & USI
Florian KrennEPFL
Aurel MäderEPFL
ABSTRACT
This paper discusses the use and popularity of a rhythm,which henceforth is referred to as “Tresillo rhythm”. Thuswe first define and formalizes the Tresillo rhythm. Givena mathematical representation of the rhythm, the rhythmis then traced in the US Billboard Top 20 Charts of thelast 20 years. To detect and determine the use of theTresillo rhythm in a song, similarities are calculated be-tween a given formalization of the rhythm and a givensong. The calculated similarity, then indicate how similarthe rhythm of a pop song is compared to the prior definedTresillo rhythm. To assert and cross-validate the computedrhythm similarity, two different formalizations of the Tre-sillo rhythm have been compiled and several different ap-proaches to calculated rhythm similarities have been testedand compared. This similarity measure is then used to doan empirical study on the usage of the Tresillo rhythm inthe US Billboard Top 20 Charts of the past 20 years (1999-2019). Finally, we argue about some of the possible rea-sons for the observed trend.
Keywords: Tresillo, Rhythm similarity, Pop music,Billboard Charts.
1. RESEARCH QUESTION
Can it be computed to which extent the Tresillo rhythm isused in a given pop song and if so how has the intensityof Tresillo rhythm use in the US Billboard Top 20 Chartschanged over time?
2. INTRODUCTION
The Tresillo is a rhythm that originated in Africa and wasbrought to the Caribbeans during the Atlantic Slave Tradeperiod. Made popular in Cuba, the rhythm spread all overthe world from there [1,4], and can be found in many musicgenres.
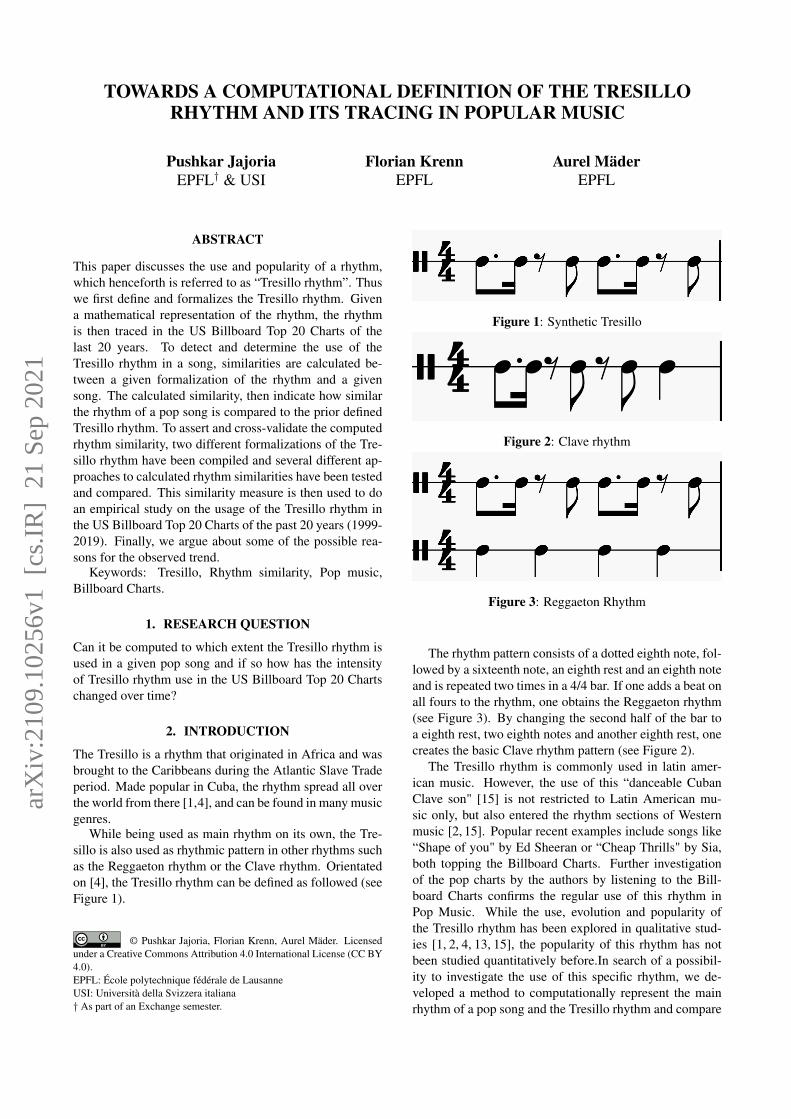
While being used as main rhythm on its own, the Tre-sillo is also used as rhythmic pattern in other rhythms suchas the Reggaeton rhythm or the Clave rhythm. Orientatedon [4], the Tresillo rhythm can be defined as followed (seeFigure 1).
© Pushkar Jajoria, Florian Krenn, Aurel Mäder. Licensedunder a Creative Commons Attribution 4.0 International License (CC BY4.0).EPFL: École polytechnique fédérale de LausanneUSI: Università della Svizzera italiana† As part of an Exchange semester.
Figure 1: Synthetic Tresillo
Figure 2: Clave rhythm
Figure 3: Reggaeton Rhythm
The rhythm pattern consists of a dotted eighth note, fol-lowed by a sixteenth note, an eighth rest and an eighth noteand is repeated two times in a 4/4 bar. If one adds a beat onall fours to the rhythm, one obtains the Reggaeton rhythm(see Figure 3). By changing the second half of the bar toa eighth rest, two eighth notes and another eighth rest, onecreates the basic Clave rhythm pattern (see Figure 2).
The Tresillo rhythm is commonly used in latin amer-ican music. However, the use of this “danceable CubanClave son" [15] is not restricted to Latin American mu-sic only, but also entered the rhythm sections of Westernmusic [2, 15]. Popular recent examples include songs like“Shape of you" by Ed Sheeran or “Cheap Thrills" by Sia,both topping the Billboard Charts. Further investigationof the pop charts by the authors by listening to the Bill-board Charts confirms the regular use of this rhythm inPop Music. While the use, evolution and popularity ofthe Tresillo rhythm has been explored in qualitative stud-ies [1, 2, 4, 13, 15], the popularity of this rhythm has notbeen studied quantitatively before.In search of a possibil-ity to investigate the use of this specific rhythm, we de-veloped a method to computationally represent the mainrhythm of a pop song and the Tresillo rhythm and compare
arX
iv:2
109.
1025
6v1
[cs
.IR
] 2
1 Se
p 20
21
both with different similarity measurements. Given thesesimilarity measures, a distinct time trend in Tresillo usecan be found in the US Billboard Top 20 Charts of the last20 years (1999-2019).
This paper proceeds as follows: First, the secondary lit-erature of several different fields, which are relevant to thispaper, will be discussed. Then several assumptions neces-sary to conduct the presented analysis will be stated in theproblem statement section. The Data section discusses thechosen data sources and data format for the analysis. Inthe method section, the final data representation, the pro-posed rhythm similarity measures and evaluation metricsare presented and explained. In the results section, the dif-ferent rhythm similarity measures are evaluated and com-pared. The results section also comprises a description andanalysis of the time trend. The paper concludes with a dis-cussion of the chosen methods and obtained results. Fur-thermore, a possible interpretation of the produced resultsis presented. Lastly, we suggest possible extensions of thepresented work.
3. SECONDARY LITERATURE
This paper touches upon different scientific fields such asmusicology, audio retrieval and digital musicology.
Prior works have already investigated the evolution andspread of the Tresillo and Clave rhythm patterns and thusprovide a clear definition and formalization of those rhyth-mic patterns from a theoretical view point [1, 4, 13]. Weheavily rely on those theoretical accounts to define theTresillo rhythm used in this project. Music scholar fur-thermore investigated the diffusion of the Tresillo rhythmfrom Africa to Latin America and then to United Statesfrom a cultural perspective [1, 4]. More generally, therealso have been several works discussing the rise in popu-larity of Latin American music and its influence onto U.S.mainstream music [11,14]. However, the mentioned musi-cology research is predicated upon qualitative analyses ofmusicology books, sheet music, recordings and interviewswith specialists and practitioners. This paper in contrastchooses to employ computational methods to draw con-clusion about the influence and popularity of the Tresillorhythm in US popular music.
Another research area that is deeply connected to thediscussed topics in this paper is concerned with the formal-ization of rhythm and the statistical corpus studies of rhyth-mic patterns. While theoretical formulations of rhythm[7,12] help us to assess the posed problem and possible pit-falls of the chosen methodology, this paper mainly refers torhythm representations, which were used for corpus stud-ies [6] or more generally the study of onset frequency dis-tributions [8]. To represent rhythm in this project we willthus employ rhythm histograms as used and described inprior works [6, 8].
A last field of research that is highly relevant for thispaper is concerned with computing rhythmic similarity be-tween different songs. Such techniques are often used foraudio retrieval tasks [5] or music genre classification tasks[3, 10]. More generally, this literature is concerned with
measuring similarity and dissimilarity of audio signals orsignals in general [16]. This literature provides valuablemetrics and techniques to compare the rhythmical struc-ture of two songs, however, is mainly based on using rawaudio files to extract signal features and more specificallyrhythm features [3,5,9,10]. Thus the methods proposed inthose papers, have been adjusted to work with our alreadydiscretized data representation.
This paper extends on the discussed secondary litera-ture by using computational methods to trace the usage ofa specific rhythm, which is associated to Latin Americanmusical culture, in US popular music.
4. PROBLEM STATEMENT
To answer the research questions, a way of defining themain rhythm of a pop song is necessary. The vast major-ity of pop songs consist of a simple melodic and rhyth-mic structure. We, therefore, assume that one can identifyone dominant rhythm per song. This rhythm is repeatedlyplayed throughout the song and therefore can be charac-terised by counting the onsets and comparing the onsetscounts for every bar position. To present the music in a us-able format, quantification is needed. 16th notes are cho-sen as the smallest unit. Assuming that all songs used forour analysis are in a 4/4 meter, this gives 16 possible eventsper bar. All songs in the data which are found not to be in4/4 are excluded from the analysis. Aggregating all baronsets of a song to one bar results in one bar which can bedescribed as a 16-dimensional vector, where every valuerepresents the number of onsets on a given bar position.The Tresillo rhythm is used as a rhythm on its own or aspart of other more complex rhythms. For our definition ofclean Tresillo rhythm, we use the notation in Figure 1.
5. DATA
To answer the posed research question four different kindsof data sets from different sources are needed.
First, to evaluate the proposed methodology which aimsto compute a similarity between a defined Tresillo rhythmand a given song, two validation data sets have been col-lected. Of which the first data set consists of Tresillo songsand the second of songs that do not contain the Tresillorhythm. Both data sets have been evaluated and hand-selected by the authors them self, by listening to spotifysongs and choosing suitable examples. More specifically,to obtain songs which contain the Tresillo rhythm, a pre-compiled spotify play list was evaluated, which claimed tocontain Tresillo songs 1 . After obtaining artist and songnames of suitable validation set songs, appropriated MIDIfiles were searched on MIDIdb 2 and downloaded.
To trace the Tresillo rhythm in the popular music of thepast 20 years a publicly available data set which containsthe song names and artist names of the Hot 100 US Bill-board Charts (1999-2019) was used 3 . However to reduce
1 https://open.spotify.com/playlist/17Na5AMmlLwY7OTsw6ovsS2 https://www.mididb.com/3 https://www.kaggle.com/danield2255/data-on-songs-from-
billboard-19992019
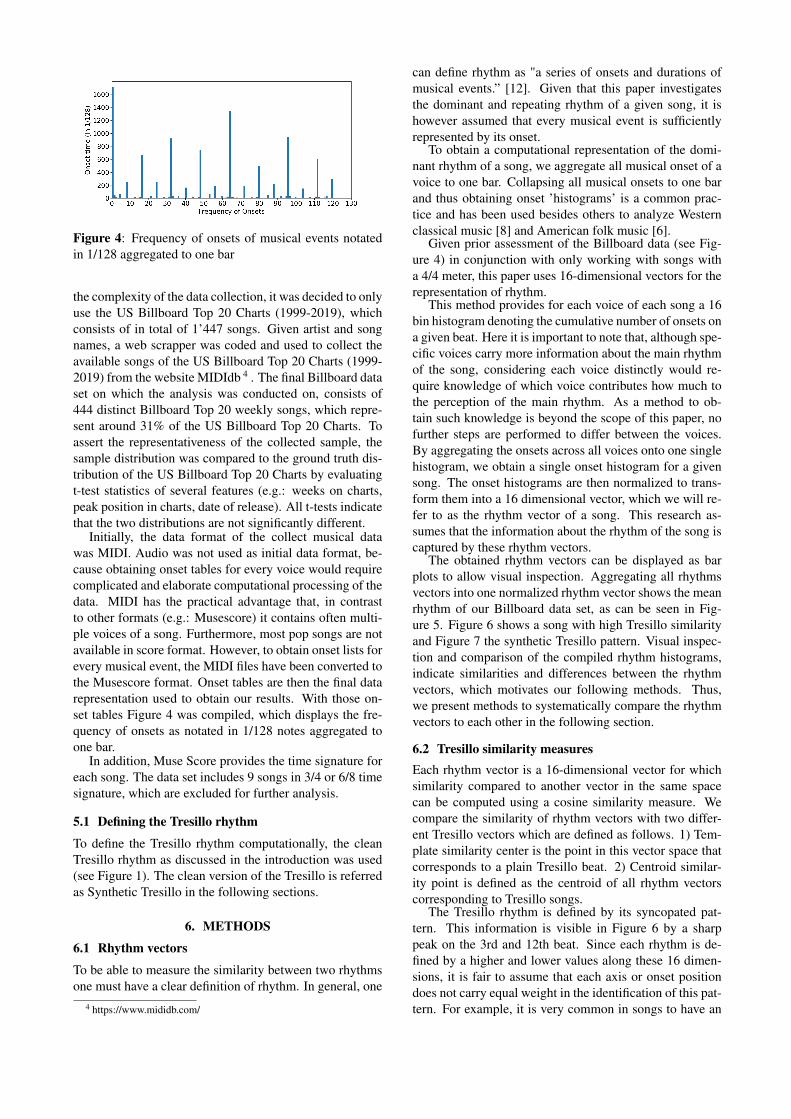
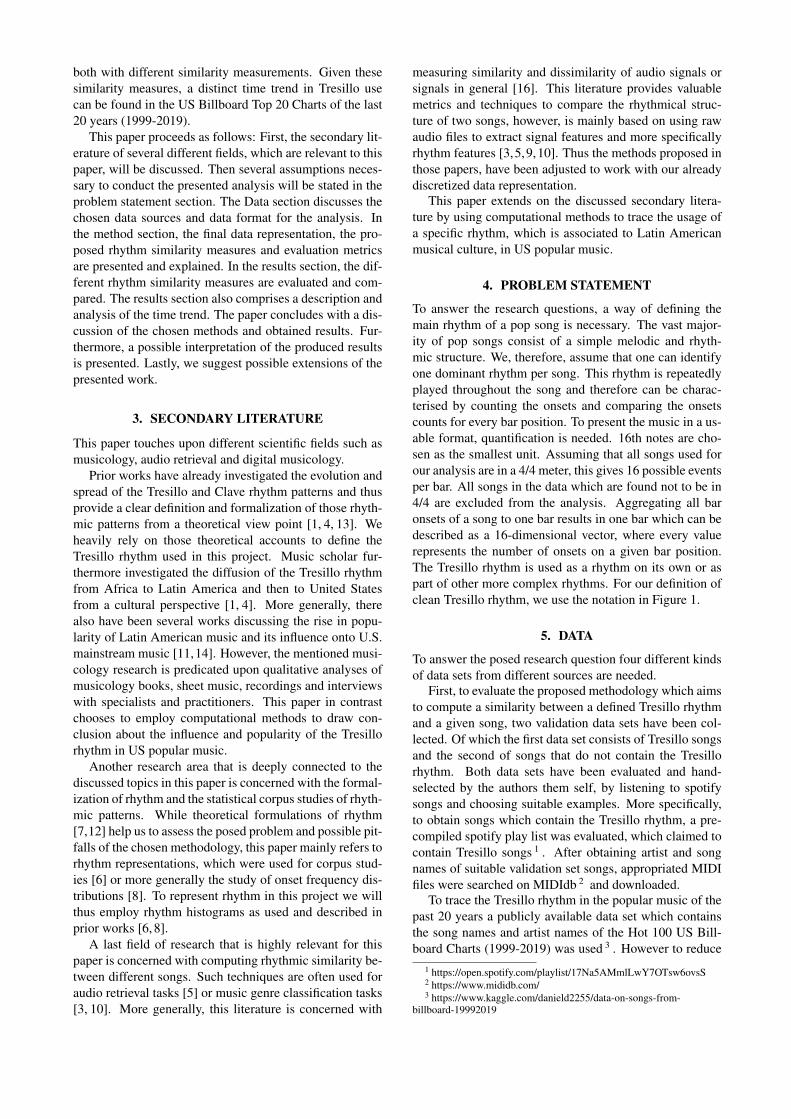
Figure 4: Frequency of onsets of musical events notatedin 1/128 aggregated to one bar
the complexity of the data collection, it was decided to onlyuse the US Billboard Top 20 Charts (1999-2019), whichconsists of in total of 1’447 songs. Given artist and songnames, a web scrapper was coded and used to collect theavailable songs of the US Billboard Top 20 Charts (1999-2019) from the website MIDIdb 4 . The final Billboard dataset on which the analysis was conducted on, consists of444 distinct Billboard Top 20 weekly songs, which repre-sent around 31% of the US Billboard Top 20 Charts. Toassert the representativeness of the collected sample, thesample distribution was compared to the ground truth dis-tribution of the US Billboard Top 20 Charts by evaluatingt-test statistics of several features (e.g.: weeks on charts,peak position in charts, date of release). All t-tests indicatethat the two distributions are not significantly different.
Initially, the data format of the collect musical datawas MIDI. Audio was not used as initial data format, be-cause obtaining onset tables for every voice would requirecomplicated and elaborate computational processing of thedata. MIDI has the practical advantage that, in contrastto other formats (e.g.: Musescore) it contains often multi-ple voices of a song. Furthermore, most pop songs are notavailable in score format. However, to obtain onset lists forevery musical event, the MIDI files have been converted tothe Musescore format. Onset tables are then the final datarepresentation used to obtain our results. With those on-set tables Figure 4 was compiled, which displays the fre-quency of onsets as notated in 1/128 notes aggregated toone bar.
In addition, Muse Score provides the time signature foreach song. The data set includes 9 songs in 3/4 or 6/8 timesignature, which are excluded for further analysis.
5.1 Defining the Tresillo rhythm
To define the Tresillo rhythm computationally, the cleanTresillo rhythm as discussed in the introduction was used(see Figure 1). The clean version of the Tresillo is referredas Synthetic Tresillo in the following sections.
6. METHODS
6.1 Rhythm vectors
To be able to measure the similarity between two rhythmsone must have a clear definition of rhythm. In general, one
4 https://www.mididb.com/
can define rhythm as "a series of onsets and durations ofmusical events.” [12]. Given that this paper investigatesthe dominant and repeating rhythm of a given song, it ishowever assumed that every musical event is sufficientlyrepresented by its onset.
To obtain a computational representation of the domi-nant rhythm of a song, we aggregate all musical onset of avoice to one bar. Collapsing all musical onsets to one barand thus obtaining onset ’histograms’ is a common prac-tice and has been used besides others to analyze Westernclassical music [8] and American folk music [6].
Given prior assessment of the Billboard data (see Fig-ure 4) in conjunction with only working with songs witha 4/4 meter, this paper uses 16-dimensional vectors for therepresentation of rhythm.
This method provides for each voice of each song a 16bin histogram denoting the cumulative number of onsets ona given beat. Here it is important to note that, although spe-cific voices carry more information about the main rhythmof the song, considering each voice distinctly would re-quire knowledge of which voice contributes how much tothe perception of the main rhythm. As a method to ob-tain such knowledge is beyond the scope of this paper, nofurther steps are performed to differ between the voices.By aggregating the onsets across all voices onto one singlehistogram, we obtain a single onset histogram for a givensong. The onset histograms are then normalized to trans-form them into a 16 dimensional vector, which we will re-fer to as the rhythm vector of a song. This research as-sumes that the information about the rhythm of the song iscaptured by these rhythm vectors.
The obtained rhythm vectors can be displayed as barplots to allow visual inspection. Aggregating all rhythmsvectors into one normalized rhythm vector shows the meanrhythm of our Billboard data set, as can be seen in Fig-ure 5. Figure 6 shows a song with high Tresillo similarityand Figure 7 the synthetic Tresillo pattern. Visual inspec-tion and comparison of the compiled rhythm histograms,indicate similarities and differences between the rhythmvectors, which motivates our following methods. Thus,we present methods to systematically compare the rhythmvectors to each other in the following section.
6.2 Tresillo similarity measuresEach rhythm vector is a 16-dimensional vector for whichsimilarity compared to another vector in the same spacecan be computed using a cosine similarity measure. Wecompare the similarity of rhythm vectors with two differ-ent Tresillo vectors which are defined as follows. 1) Tem-plate similarity center is the point in this vector space thatcorresponds to a plain Tresillo beat. 2) Centroid similar-ity point is defined as the centroid of all rhythm vectorscorresponding to Tresillo songs.
The Tresillo rhythm is defined by its syncopated pat-tern. This information is visible in Figure 6 by a sharppeak on the 3rd and 12th beat. Since each rhythm is de-fined by a higher and lower values along these 16 dimen-sions, it is fair to assume that each axis or onset positiondoes not carry equal weight in the identification of this pat-tern. For example, it is very common in songs to have an
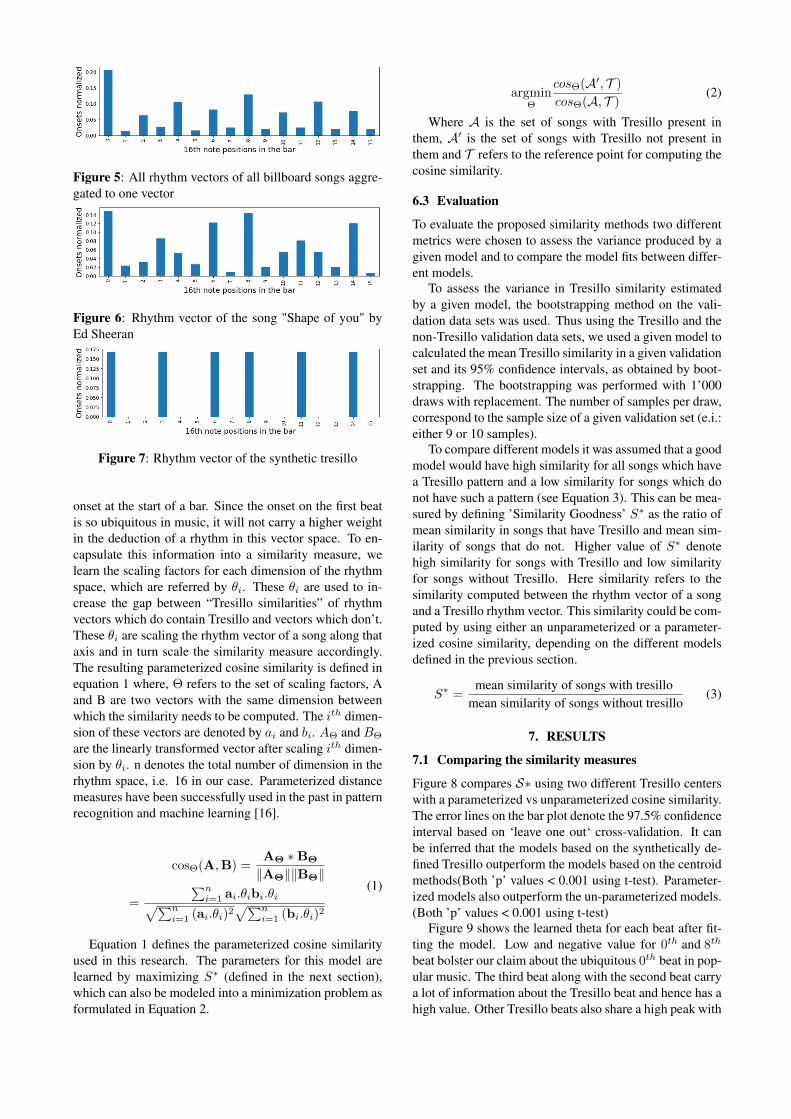
Figure 5: All rhythm vectors of all billboard songs aggre-gated to one vector
Figure 6: Rhythm vector of the song "Shape of you" byEd Sheeran
Figure 7: Rhythm vector of the synthetic tresillo
onset at the start of a bar. Since the onset on the first beatis so ubiquitous in music, it will not carry a higher weightin the deduction of a rhythm in this vector space. To en-capsulate this information into a similarity measure, welearn the scaling factors for each dimension of the rhythmspace, which are referred by θi. These θi are used to in-crease the gap between “Tresillo similarities” of rhythmvectors which do contain Tresillo and vectors which don’t.These θi are scaling the rhythm vector of a song along thataxis and in turn scale the similarity measure accordingly.The resulting parameterized cosine similarity is defined inequation 1 where, Θ refers to the set of scaling factors, Aand B are two vectors with the same dimension betweenwhich the similarity needs to be computed. The ith dimen-sion of these vectors are denoted by ai and bi. AΘ and BΘ
are the linearly transformed vector after scaling ith dimen-sion by θi. n denotes the total number of dimension in therhythm space, i.e. 16 in our case. Parameterized distancemeasures have been successfully used in the past in patternrecognition and machine learning [16].
cosΘ(A,B) =AΘ ∗BΘ
‖AΘ‖‖BΘ‖
=
∑ni=1 ai.θibi.θi√∑n
i=1 (ai.θi)2√∑n
i=1 (bi.θi)2
(1)
Equation 1 defines the parameterized cosine similarityused in this research. The parameters for this model arelearned by maximizing S∗ (defined in the next section),which can also be modeled into a minimization problem asformulated in Equation 2.
argminΘ
cosΘ(A′, T )
cosΘ(A, T )(2)
Where A is the set of songs with Tresillo present inthem, A′ is the set of songs with Tresillo not present inthem and T refers to the reference point for computing thecosine similarity.
6.3 Evaluation
To evaluate the proposed similarity methods two differentmetrics were chosen to assess the variance produced by agiven model and to compare the model fits between differ-ent models.
To assess the variance in Tresillo similarity estimatedby a given model, the bootstrapping method on the vali-dation data sets was used. Thus using the Tresillo and thenon-Tresillo validation data sets, we used a given model tocalculated the mean Tresillo similarity in a given validationset and its 95% confidence intervals, as obtained by boot-strapping. The bootstrapping was performed with 1’000draws with replacement. The number of samples per draw,correspond to the sample size of a given validation set (e.i.:either 9 or 10 samples).
To compare different models it was assumed that a goodmodel would have high similarity for all songs which havea Tresillo pattern and a low similarity for songs which donot have such a pattern (see Equation 3). This can be mea-sured by defining ’Similarity Goodness’ S∗ as the ratio ofmean similarity in songs that have Tresillo and mean sim-ilarity of songs that do not. Higher value of S∗ denotehigh similarity for songs with Tresillo and low similarityfor songs without Tresillo. Here similarity refers to thesimilarity computed between the rhythm vector of a songand a Tresillo rhythm vector. This similarity could be com-puted by using either an unparameterized or a parameter-ized cosine similarity, depending on the different modelsdefined in the previous section.
S∗ =mean similarity of songs with tresillo
mean similarity of songs without tresillo(3)
7. RESULTS
7.1 Comparing the similarity measures
Figure 8 compares S∗ using two different Tresillo centerswith a parameterized vs unparameterized cosine similarity.The error lines on the bar plot denote the 97.5% confidenceinterval based on ‘leave one out‘ cross-validation. It canbe inferred that the models based on the synthetically de-fined Tresillo outperform the models based on the centroidmethods(Both ’p’ values < 0.001 using t-test). Parameter-ized models also outperform the un-parameterized models.(Both ’p’ values < 0.001 using t-test)
Figure 9 shows the learned theta for each beat after fit-ting the model. Low and negative value for 0th and 8th
beat bolster our claim about the ubiquitous 0th beat in pop-ular music. The third beat along with the second beat carrya lot of information about the Tresillo beat and hence has ahigh value. Other Tresillo beats also share a high peak with
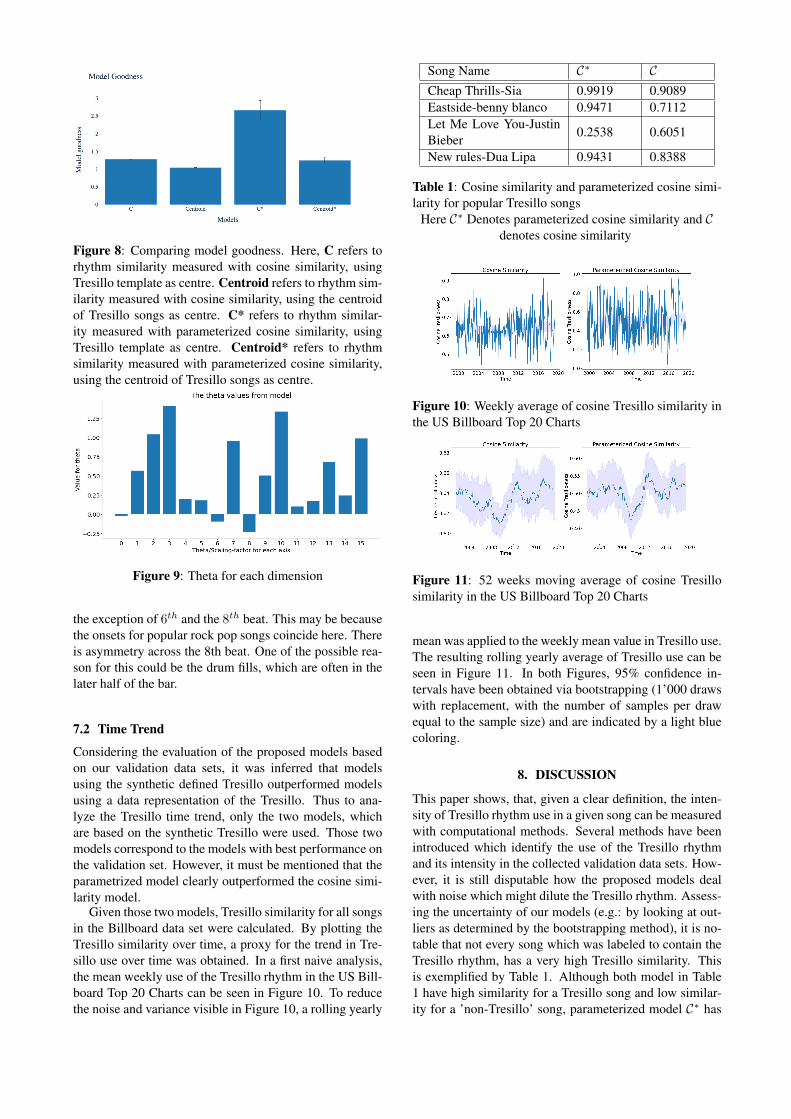
Figure 8: Comparing model goodness. Here, C refers torhythm similarity measured with cosine similarity, usingTresillo template as centre. Centroid refers to rhythm sim-ilarity measured with cosine similarity, using the centroidof Tresillo songs as centre. C* refers to rhythm similar-ity measured with parameterized cosine similarity, usingTresillo template as centre. Centroid* refers to rhythmsimilarity measured with parameterized cosine similarity,using the centroid of Tresillo songs as centre.
Figure 9: Theta for each dimension
the exception of 6th and the 8th beat. This may be becausethe onsets for popular rock pop songs coincide here. Thereis asymmetry across the 8th beat. One of the possible rea-son for this could be the drum fills, which are often in thelater half of the bar.
7.2 Time Trend
Considering the evaluation of the proposed models basedon our validation data sets, it was inferred that modelsusing the synthetic defined Tresillo outperformed modelsusing a data representation of the Tresillo. Thus to ana-lyze the Tresillo time trend, only the two models, whichare based on the synthetic Tresillo were used. Those twomodels correspond to the models with best performance onthe validation set. However, it must be mentioned that theparametrized model clearly outperformed the cosine simi-larity model.
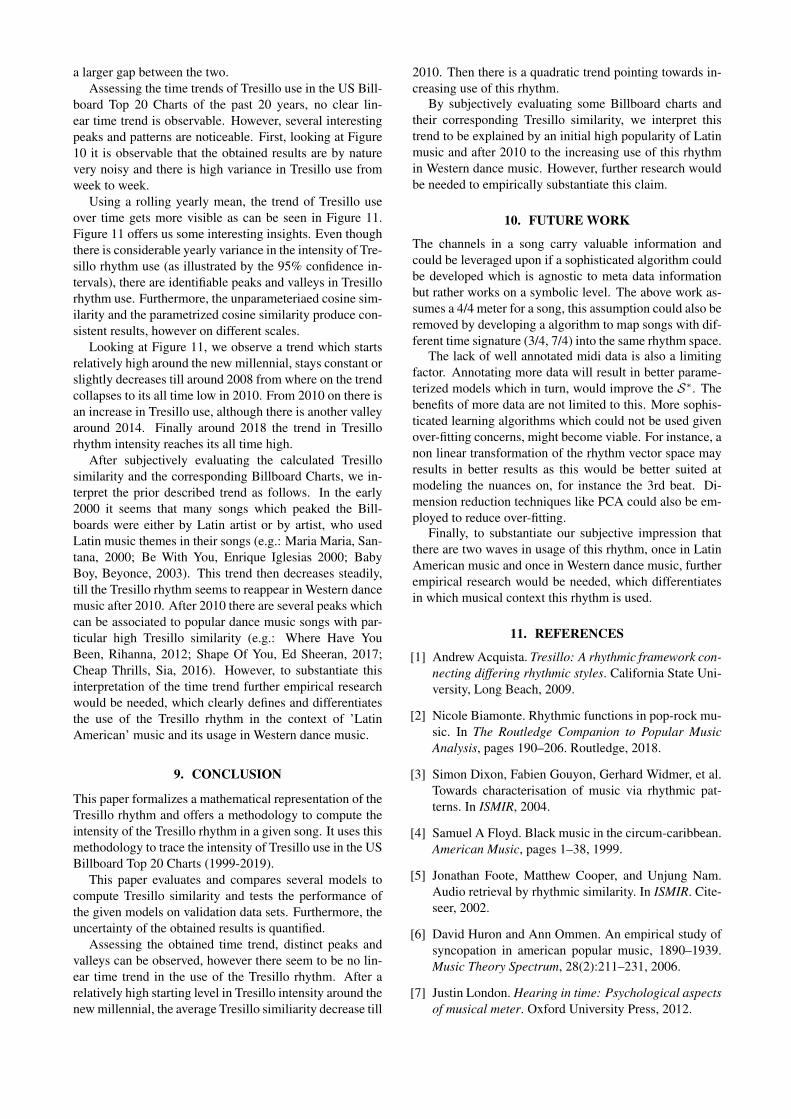
Given those two models, Tresillo similarity for all songsin the Billboard data set were calculated. By plotting theTresillo similarity over time, a proxy for the trend in Tre-sillo use over time was obtained. In a first naive analysis,the mean weekly use of the Tresillo rhythm in the US Bill-board Top 20 Charts can be seen in Figure 10. To reducethe noise and variance visible in Figure 10, a rolling yearly
Song Name C∗ CCheap Thrills-Sia 0.9919 0.9089Eastside-benny blanco 0.9471 0.7112Let Me Love You-JustinBieber
0.2538 0.6051
New rules-Dua Lipa 0.9431 0.8388
Table 1: Cosine similarity and parameterized cosine simi-larity for popular Tresillo songs
Here C∗ Denotes parameterized cosine similarity and Cdenotes cosine similarity
Figure 10: Weekly average of cosine Tresillo similarity inthe US Billboard Top 20 Charts
Figure 11: 52 weeks moving average of cosine Tresillosimilarity in the US Billboard Top 20 Charts
mean was applied to the weekly mean value in Tresillo use.The resulting rolling yearly average of Tresillo use can beseen in Figure 11. In both Figures, 95% confidence in-tervals have been obtained via bootstrapping (1’000 drawswith replacement, with the number of samples per drawequal to the sample size) and are indicated by a light bluecoloring.
8. DISCUSSION
This paper shows, that, given a clear definition, the inten-sity of Tresillo rhythm use in a given song can be measuredwith computational methods. Several methods have beenintroduced which identify the use of the Tresillo rhythmand its intensity in the collected validation data sets. How-ever, it is still disputable how the proposed models dealwith noise which might dilute the Tresillo rhythm. Assess-ing the uncertainty of our models (e.g.: by looking at out-liers as determined by the bootstrapping method), it is no-table that not every song which was labeled to contain theTresillo rhythm, has a very high Tresillo similarity. Thisis exemplified by Table 1. Although both model in Table1 have high similarity for a Tresillo song and low similar-ity for a ’non-Tresillo’ song, parameterized model C∗ has
a larger gap between the two.Assessing the time trends of Tresillo use in the US Bill-
board Top 20 Charts of the past 20 years, no clear lin-ear time trend is observable. However, several interestingpeaks and patterns are noticeable. First, looking at Figure10 it is observable that the obtained results are by naturevery noisy and there is high variance in Tresillo use fromweek to week.
Using a rolling yearly mean, the trend of Tresillo useover time gets more visible as can be seen in Figure 11.Figure 11 offers us some interesting insights. Even thoughthere is considerable yearly variance in the intensity of Tre-sillo rhythm use (as illustrated by the 95% confidence in-tervals), there are identifiable peaks and valleys in Tresillorhythm use. Furthermore, the unparameteriaed cosine sim-ilarity and the parametrized cosine similarity produce con-sistent results, however on different scales.
Looking at Figure 11, we observe a trend which startsrelatively high around the new millennial, stays constant orslightly decreases till around 2008 from where on the trendcollapses to its all time low in 2010. From 2010 on there isan increase in Tresillo use, although there is another valleyaround 2014. Finally around 2018 the trend in Tresillorhythm intensity reaches its all time high.
After subjectively evaluating the calculated Tresillosimilarity and the corresponding Billboard Charts, we in-terpret the prior described trend as follows. In the early2000 it seems that many songs which peaked the Bill-boards were either by Latin artist or by artist, who usedLatin music themes in their songs (e.g.: Maria Maria, San-tana, 2000; Be With You, Enrique Iglesias 2000; BabyBoy, Beyonce, 2003). This trend then decreases steadily,till the Tresillo rhythm seems to reappear in Western dancemusic after 2010. After 2010 there are several peaks whichcan be associated to popular dance music songs with par-ticular high Tresillo similarity (e.g.: Where Have YouBeen, Rihanna, 2012; Shape Of You, Ed Sheeran, 2017;Cheap Thrills, Sia, 2016). However, to substantiate thisinterpretation of the time trend further empirical researchwould be needed, which clearly defines and differentiatesthe use of the Tresillo rhythm in the context of ’LatinAmerican’ music and its usage in Western dance music.
9. CONCLUSION
This paper formalizes a mathematical representation of theTresillo rhythm and offers a methodology to compute theintensity of the Tresillo rhythm in a given song. It uses thismethodology to trace the intensity of Tresillo use in the USBillboard Top 20 Charts (1999-2019).
This paper evaluates and compares several models tocompute Tresillo similarity and tests the performance ofthe given models on validation data sets. Furthermore, theuncertainty of the obtained results is quantified.
Assessing the obtained time trend, distinct peaks andvalleys can be observed, however there seem to be no lin-ear time trend in the use of the Tresillo rhythm. After arelatively high starting level in Tresillo intensity around thenew millennial, the average Tresillo similiarity decrease till
2010. Then there is a quadratic trend pointing towards in-creasing use of this rhythm.
By subjectively evaluating some Billboard charts andtheir corresponding Tresillo similarity, we interpret thistrend to be explained by an initial high popularity of Latinmusic and after 2010 to the increasing use of this rhythmin Western dance music. However, further research wouldbe needed to empirically substantiate this claim.
10. FUTURE WORK
The channels in a song carry valuable information andcould be leveraged upon if a sophisticated algorithm couldbe developed which is agnostic to meta data informationbut rather works on a symbolic level. The above work as-sumes a 4/4 meter for a song, this assumption could also beremoved by developing a algorithm to map songs with dif-ferent time signature (3/4, 7/4) into the same rhythm space.
The lack of well annotated midi data is also a limitingfactor. Annotating more data will result in better parame-terized models which in turn, would improve the S∗. Thebenefits of more data are not limited to this. More sophis-ticated learning algorithms which could not be used givenover-fitting concerns, might become viable. For instance, anon linear transformation of the rhythm vector space mayresults in better results as this would be better suited atmodeling the nuances on, for instance the 3rd beat. Di-mension reduction techniques like PCA could also be em-ployed to reduce over-fitting.
Finally, to substantiate our subjective impression thatthere are two waves in usage of this rhythm, once in LatinAmerican music and once in Western dance music, furtherempirical research would be needed, which differentiatesin which musical context this rhythm is used.
11. REFERENCES
[1] Andrew Acquista. Tresillo: A rhythmic framework con-necting differing rhythmic styles. California State Uni-versity, Long Beach, 2009.
[2] Nicole Biamonte. Rhythmic functions in pop-rock mu-sic. In The Routledge Companion to Popular MusicAnalysis, pages 190–206. Routledge, 2018.
[3] Simon Dixon, Fabien Gouyon, Gerhard Widmer, et al.Towards characterisation of music via rhythmic pat-terns. In ISMIR, 2004.
[4] Samuel A Floyd. Black music in the circum-caribbean.American Music, pages 1–38, 1999.
[5] Jonathan Foote, Matthew Cooper, and Unjung Nam.Audio retrieval by rhythmic similarity. In ISMIR. Cite-seer, 2002.
[6] David Huron and Ann Ommen. An empirical study ofsyncopation in american popular music, 1890–1939.Music Theory Spectrum, 28(2):211–231, 2006.
[7] Justin London. Hearing in time: Psychological aspectsof musical meter. Oxford University Press, 2012.
[8] Caroline Palmer and Carol L Krumhansl. Mental rep-resentations for musical meter. Journal of Experimen-tal Psychology: Human Perception and Performance,16(4):728, 1990.
[9] Maria Panteli, Niels Bogaards, Aline K Honingh, et al.Modeling rhythm similarity for electronic dance music.In ISMIR, pages 537–542, 2014.
[10] Geoffroy Peeters. Rhythm classification using spectralrhythm patterns. In ISMIR, pages 644–647, 2005.
[11] John Storm Roberts. The latin tinge: the impact of latinamerican music on the united states. Oxford UniversityPress, 1999.
[12] Martin Rohrmeier. Towards a formalization of musicalrhythm. In Proc. of the 21st Int. Society for Music In-formation Retrieval Conf, 2020.
[13] Carlos Sandroni. Le Tresillo rythme et «métis-sage» dans la musique populaire latino-américaineimprimée au XIXe siècle. Infolio Editeur/Ateliersd’ethnomusicologie, 2001.
[14] Pollyanna T Schroeder. The growth of latin americanpop music in the united states. In College Music Sym-posium, volume 18, pages 124–129. JSTOR, 1978.
[15] William A Sethares. The geometry of musical rhythm:what makes a “good” rhythm good?, 2014.
[16] Zhihua Zhang, James Kwok, and Dit-Yan Yeung. Para-metric distance metric learning with label information.Proc International Joint Conference on Artificial Intel-ligence, 05 2003.