Embed Size (px)
Citation preview

TOWARDS A CHROMATIC PUPILLOMETRY PROTOCOL FOR ASSESSING MELANOPSIN-DRIVEN
POST-ILLUMINATION PUPIL RESPONSE IN BASIC SCIENCE AND CLINICAL INVESTIGATIONS
by
Shaobo Lei
A thesis submitted in conformity with the requirements for the degree of Master of Science
Institute of Medical Science University of Toronto
© Copyright by Shaobo Lei 2016

ii
Towards a Chromatic Pupillometry Protocol for Assessing
Melanopsin-Driven Post-Illumination Pupil Response in Basic
Science and Clinical Investigations
Shaobo Lei
Master of Science
Institute of Medical Science
University of Toronto
2016
Abstract
The pupillary light reflex (PLR) is mediated by intrinsically photosensitive retinal ganglions cells
(ipRGCs), a sub-group of retinal ganglion cells that contain photopigment melanopsin.
Melanopsin activation drives a sustained pupil constriction after the offset of light stimulus, this
so-called post-illumination pupil response (PIPR) is an in vivo index of melanopsin-driven
ipRGC photoactivity. PIPR can be assessed by chromatic pupillometry, but consensus on a
standardized PIPR testing protocol has not been reached yet. The purpose of this thesis is to
develop an optimized PIPR testing methodology, and to use it to investigate clinical and basic
science questions related to melanopsin and ipRGCs. Based on previous pilot work on full-field
chromatic pupillometry, a new and repeatable method was developed to measure PIPR induced
by hemifield, central-field and full-field light stimulation. This chromatic pupillometry system
was then used to investigate a series of basic science and clinical questions related to melanopsin
and ipRGCs.

iii
Acknowledgments
I would like to take this opportunity to express my gratitude to a number of people who
have helped me to see through this thesis project. Without their contributions, support, advice
and encouragement, this thesis would not be possible.
First of all, my deepest gratitude is extended to my supervisor, Dr. Agnes Wong, for
offering me this amazing opportunity to study in Canada. This research project has greatly
expanded my academic horizon, and opened up many opportunities for my future career.
My sincere appreciation is also extended to my co-supervisor, Dr. Herbert Goltz. Thank
you for your guidance throughout the process. If it was not for your contributions, support and
advice, this thesis would not be what it is today.
Next, I would like to express my gratitude to members of my program advisory committee,
Dr. Graham Trope and Dr. John Flanagan, for their invaluable input and support in this project.
Special thanks to Manokaraananthan Chandrakumar, Jaime Sklar, Alan Blakeman, Luke
Gane and Arham Raashid for their technical support.
Last, but certainly not least, I would like to thank all of my family for supporting me over
the years. Of course, a special mention has to go to my lovely wife Jingwen, and our daughter
Sophia. Thank you for being with me and giving me unconditional love and unwavering support.
This is for all of you who have made this thesis a reality. Thank you again.

iv
Contributions
Author and degree candidate, Dr. Shaobo Lei, made primary contributions to the
conception and design of the study, acquisition, analysis and interpretation of data, drafting the
thesis and revising it.
Program supervisors, Dr. Agnes Wong and Dr. Herbert Goltz made contributions in this
thesis by providing experimental apparatus, participating study designing and thesis editing.
Ms. Jaime Sklar and Mr. Manokaraananthan Chandrakumar participated in data
acquisition and analysis.
Mr. Alan Blakeman and Mr. Luke Gane provided technical support in the setup of the
experimental apparatus; Mr. Gane also wrote the computer script that was used to analyze data.
Mr. Arham Raashid provided support for statistical analysis
v
Table of Contents
Acknowledgments .......................................................................................................................... iii
Table of Contents ............................................................................................................................ v
List of Tables ................................................................................................................................. ix
List of Figures ................................................................................................................................. x
Chapter 1 ......................................................................................................................................... 1
1 Literature Review ....................................................................................................................... 1
1.1 General introduction ........................................................................................................... 1
1.2 Discovery and history of melanopsin-containing intrinsically photosensitive retinal
ganglion cells ...................................................................................................................... 3
1.2.1 Early behavioral observations in non-rod, non-cone animals ................................. 3
1.2.2 The discovery of a non-visual photopigment: melanopsin ..................................... 4
1.2.3 The discovery of intrinsically photosensitive retinal ganglion cells ....................... 5
1.2.4 Summary ................................................................................................................. 6
1.3 Anatomical and morphological features of ipRGCs ........................................................... 7
1.3.1 ipRGCs population and distribution ....................................................................... 7
1.3.2 Morphological features of typical ipRGCs: M1 cells ............................................. 7
1.3.3 Morphological features of atypical ipRGCs: M2-M5 ............................................. 8
1.3.4 Central projections of ipRGCs ................................................................................ 9
1.3.5 Summary ............................................................................................................... 10
1.4 Physiological properties of ipRGCs .................................................................................. 11
1.4.1 Light absorption of melanopsin ............................................................................ 11
1.4.2 Menalopsin-driven phototransduction .................................................................. 12
1.4.3 Electrophysiology of ipRGCs ............................................................................... 15
1.5 Functions of melanopsin and the ipRGC system .............................................................. 21
1.5.1 Melanopsin and ipRGC function in non-image-forming photosensation ............. 21

vi
1.5.2 Melanopsin and ipRGC functions in image-forming vision ................................. 26
1.6 Chromatic Pupillometry: in vivo assessment of melanopsin-driven ipRGC
photoactivity ..................................................................................................................... 28
1.7 Preparation technical development: full-field chromatic pupillometry assessment of
the melanopsin-driven post-illumination pupil response .................................................. 32
1.7.1 Rationale for developing full-field chromatic pupillometry ................................. 32
1.7.2 Apparatus and experiment protocols .................................................................... 33
1.7.3 Results: full-field vs central field PIPR in intensity and duration trials ............... 34
1.7.4 Discussions ........................................................................................................... 40
Chapter 2 ....................................................................................................................................... 45
2 Aims and Hypothesis ............................................................................................................... 45
2.1 Introduction ....................................................................................................................... 45
2.2 Hemifield, Central-Field and Full-Field Chromatic Pupillometry for Assessing the
Melanopsin-driven Post-illumination Pupil Response: A Methodological Study ............ 46
2.3 The effect of red light exposure on pre-existing PIPR: Implementing PIPR as an in-
vivo index of melanopsin photoactivity in basic science research ................................... 47
Chapter 3 ....................................................................................................................................... 49
3 Hemifield, Central-Field and Full-Field Chromatic Pupillometry for Assessing the
Melanopsin-driven Post-illumination Pupil Response ............................................................. 49
3.1 Introduction ....................................................................................................................... 49
3.2 Methods ............................................................................................................................. 51
3.2.1 Participants ............................................................................................................ 51
3.2.2 Apparatus .............................................................................................................. 51
3.2.3 Experimental Conditions and Procedure .............................................................. 55
3.2.4 Data Analysis ........................................................................................................ 56
3.3 Results ............................................................................................................................... 58
3.3.1 Post-Illumination Pupil Response (PIPR) ............................................................. 58
3.3.2 Maximal Pupil Constriction (MPC). ..................................................................... 63

vii
3.4 Discussion ......................................................................................................................... 67
Chapter 4 ....................................................................................................................................... 70
4 The Effect of Red light Exposure on Pre-existing Melanopsin-Driven Post-illumination
Pupil Response ......................................................................................................................... 70
4.1 Introduction ....................................................................................................................... 70
4.2 Methods ............................................................................................................................. 74
4.2.1 Participants ............................................................................................................ 74
4.2.2 Apparatus .............................................................................................................. 74
4.2.3 Testing conditions and protocols .......................................................................... 74
4.2.4 Data Analysis ........................................................................................................ 76
4.3 Results ............................................................................................................................... 78
4.3.1 Experiment 1 ......................................................................................................... 78
4.3.2 Experiment 2 ......................................................................................................... 80
4.4 Discussion ......................................................................................................................... 87
Chapter 5 ....................................................................................................................................... 91
5 General discussion ................................................................................................................... 91
5.1 Refinements of chromatic pupillometry PIPR testing ...................................................... 91
5.2 Characteristics of melanopsin-driven post-illumination pupil response ........................... 94
5.3 Applications of hemifield, central-field and full-field chromatic pupillometry induced
PIPR .................................................................................................................................. 96
Chapter 6 ..................................................................................................................................... 100
6 Conclusions ............................................................................................................................ 100
Chapter 7 ..................................................................................................................................... 102
7 Future directions ..................................................................................................................... 102
7.1 Using hemifield, central field and full-field chromatic pupillometry to investigate
melanopsin-driven post-illumination pupil response in glaucoma patients .................... 102
7.1.1 Introduction ......................................................................................................... 102

viii
7.1.2 Methods ............................................................................................................... 104
7.1.3 Preliminary testing data ...................................................................................... 105
7.2 Using chromatic pupillometry to investigate retinal dystrophies ................................... 107
References ................................................................................................................................... 110

ix
List of Tables
Table 1. Properties of Three Types of Photoreceptors: Cones, Rods and IPRGCs ...................... 18
Table 2. Summary of Post-illumination Pupil Response (PIPR) Testing Conditions Published in
Literature ....................................................................................................................................... 30
Table 3. PIPR values of each test trial from the 5 stimulation conditions. ................................... 60
Table 4. Mean PIPR and p values for pairwise comparisons during the 5 testing conditions. ..... 61
Table 5. Test-retest reliability of PIPR measured during hemifield, central-field and full-field
stimulation. .................................................................................................................................... 62
Table 6. MPC values for each test trial from the 5 stimulation conditions. ................................. 64
Table 7. Mean MPC and p values for pairwise comparisons during the 5 testing conditions. ..... 65
Table 8. Test-retest reliability of MPC measured during hemifield, central-field and full-field
stimulation ..................................................................................................................................... 66

x
List of Figures
Figure 1. Mean normalized PIPR tracings to 1 s stimuli of varying intensity, Data from 10
visually-normal participants. ......................................................................................................... 35
Figure 2. Comparison of PIPR induced using 400 cd/m2 central-field stimuli vs 100-400 cd/m
2
full-field stimuli ............................................................................................................................ 36
Figure 3. Mean normalized pupil size from 10 to 30 s post-stimulation offset (PIPR(10-30 s)) and
pupil size at 6 s post-stimulation offset (PIPR(6 s)). ....................................................................... 38
Figure 4. Mean PIPR to 100 cd/m2 and 400 cd/m
2 full-field stimulation of varying duration from
10 visually-normal observers. ....................................................................................................... 39
Figure 5. PIPR(10-30 s) as a function of stimulus duration.. ............................................................. 40
Figure 6. Full-field chromatic pupillometry system ..................................................................... 53
Figure 7. The shutter panel apparatus. .......................................................................................... 54
Figure 8. Mean hemifields, central-field and full-field PIPR from 10 visually-normal subjects. 59
Figure 9. Mean pupil responses from 10 visually-normal subjects in Experiment 1 ................... 79
Figure 10. Mean pupil responses to “red only” reference stimulations from 10 visually-normal
subjects. ......................................................................................................................................... 81
Figure 11. Mean pupil responses from 10 visually-normal subjects in Experiment 2. ................ 82
Figure 12. Comparisons of PIPR tracings of “blue+red” conditions vs. “blue only” control from
10 visually normal participants ..................................................................................................... 83
Figure 13. Mean pupil responses from 7 visually-normal subjects in Experiment 2 ................... 84
Figure 14. Comparisons of PIPR tracings from “blue+red” conditions vs. “blue only” controls
from 7 visually normal participants .............................................................................................. 85

xi
Figure 15. Comparisons of maximum pupil constriction (MPC) induced by “red only” stimuli vs.
red stimuli presented on top of blue-light-induced PIPR (“Red on PIPR”) ................................. 86
Figure 16. Individual PIPR testing results from visually normal participants and participants with
glaucoma. .................................................................................................................................... 106
Figure 17. Waveforms of comprehensive chromatic pupillometry testing. ................................ 109

1
Chapter 1
1 Literature Review
1.1 General introduction
Vision, a perception of the environment by interpreting information that is contained in
light, is the primary source of sensory information for humans. As the only light-sensing neuro-
tissue of our body (Nelson and Zucker 1981; Foster, Provencio et al. 1991), the retina contains
two types of photoreceptor: rods and cones. For the last 150 years, these two types of
photoreceptors were assumed to code all visual information. Rods are responsible for scotopic
and mesopic vision, owing to their high sensitivity to dim light. Cones have three sub-types that
are sensitive to long (L-cone), medium (M-cone) and short wavelength (S-cone) visible light.
Distributed in high density in the posterior pole of retina, cones are responsible for photopic
central vision and color vision. The information coded by the rods and cones is further processed
in the inner retina that is then transmitted to the midbrain and then visual cortex, creating a real
time image representation of our surroundings, integrating light brightness, contrast, color, object
shape, size and movement (Demb 2008; Gollisch and Meister 2010). The amount and
complexity of information our eyes extract from light is so enormous and our awareness of the
world is so dominated by our sense of vision that it is difficult to comprehend the emerging
evidence that our retina carries light sensory information that is separate from conscious vision.
About a decade ago, scientists made a major discovery that there is a parallel, sub-
conscious, non-imaging-forming retinal photo sensing pathway mediated by a non-rod, non-cone
photoreceptor (Berson, Dunn et al. 2002; Hattar, Liao et al. 2002; Berson 2003): a small subset
of retinal ganglion cells that response to light stimulation on their own with depolarizing action
potential. These so-called intrinsically photosensitive retinal ganglion cells (ipRGCs) utilize a
novel photopigment called melanopsin (Berson, Dunn et al. 2002; Hattar, Liao et al. 2002). The

2
melanopsin-driven intrinsic photo-activity of ipRGCs represent as tonic signal of ambient light
irradiance (Dacey, Liao et al. 2005), which is the primary afferent sensory input for circadian
rhythm photoentrainment and some subconscious light reflexes, such as the pupillary light reflex
(PLR). The decade following this major discovery has seen rapid expansion of literature on
melanopsin and the ipRGC-mediated non-visual photoperception pathway, yet little is known
about the involvement of melanopsin and ipRGCs in retinal diseases (Feigl and Zele 2014).
Based on updated understanding of the ipRGC-mediated PLR pathway, a technique using
monochromatic light called “chromatic pupillometry” to selectively induce pupil response driven
by rods, cones and ipRGCs has emerged (Gamlin, McDougal et al. 2007). The melanopsin-
driven intrinsic ipRGCs photoactivity can be assessed in vivo by using chromatic pupillometry to
measure the sustained pupil constriction after the offset of high intensity blue light stimulation.
This so-called post-illumination pupil response (PIPR) is a promising objective tool to evaluate
this novel aspect of retinal function. However, consensus has not yet been reached on a
standardized chromatic pupillometry protocol to test PIPR. The overarching purpose of this
thesis is to refine the current PIPR testing methodologies and use them to investigate
melanopsin/ipRGC-related basic science and clinical questions.
In this chapter, the history of the discovery of melanopsin and ipRGC, and the literature
on cellular morphology, anatomy and physiology of this inner retina light-sensing pathway are
reviewed.The functional properties of melanopsin/ipRGC system in mammals will be reviewed
with emphasis on using PIPR as an in vivo index of the melanopsin-driven intrinsic photoactivity
of ipRGCs in mammalian animals and humans in healthy and diseased states.

3
1.2 Discovery and history of melanopsin-containing intrinsically photosensitive retinal ganglion cells
1.2.1 Early behavioral observations in non-rod, non-cone animals
The first literature that indicates the presence of a photoreceptor in the inner retina can be
traced back to 1927. Clyde Keeler, who was then a graduate student in Harvard University,
observed seemingly paradoxical preservation of pupillary light reflex in mice lacking rods and
cones due to outer retinal degeneration (Keeler 1927). Based on this observation, Keeler
speculated on the presence of an unknown type of light-sensing cells in the inner retina. In a
paper entitled ‘Iris movements in blind mice’ (Keeler 1927), Keeler wrote “…we may suppose
that a rodless mouse will not see in the ordinary sense. Nevertheless, we can imagine the
possibility of other forms of stimulation by light, such as through absorption by pigment cells,
the contraction of the iris, or direct stimulation of the internal nuclear or ganglionic cells in the
case of absence or faulty development of the external nuclear layer or of the rods.’’
Over some 70 years following Keeler’s remarkable paper, it was noted by many other
investigators that mice lacking functional rods and cones maintained a normal 24-hour day/night
activity cycle and their circadian rhythm could still be phase-shifted by artificially adjusting the
ambient lighting cycle, a phenomenon called circadian photoentrainment (Ebihara and Tsuji
1980; Foster, Provencio et al. 1991; Freedman, Lucas et al. 1999; Lucas, Freedman et al. 2001).
Yet when mice’s eye balls were surgically removed, the animal’s circadian rhythms could no
longer be photoentrained (Yamazaki, Goto et al. 1999). By the end of 20th century, it became
clear that neither rods nor cones are required for circadian photoentrainment, and that the
mammalian circadian clock is regulated by additional photoreceptors in retina (Freedman, Lucas
et al. 1999). Furthermore, by carefully analyzing the pupil light response in mice lacking rods
and cones (rodless+coneless), Lucas et al. revealed that the response kinetics and spectral
sensitivity of the residual retinal photo activity differed from those of rods and cones(Lucas,
Douglas et al. 2001). The evidence of non-rod, non-cone photoreceptors in experimental rodent
animals reconciled well with the clinical observation that some blind patients with photoreceptor

4
diseases still have well synchronized circadian rhythms, relatively preserved pupillary light
response and photophobia (Klerman, Shanahan et al. 2002; Zaidi, Hull et al. 2007).
1.2.2 The discovery of a non-visual photopigment: melanopsin
The hunt for the putative photoreceptor responsible for preserved circadian clock and
pupillary light reflexes in mammals lacking rods and cones was assisted by the parallel
photobiology and genetic studies of extra-ocular photopigments in non-mammalian vertebrates.
Unlike mammals, where the eye ball is the only site of photoperception (Nelson and Zucker
1981; Foster, Provencio et al. 1991), non-mammalian vertebrates like birds, fishes and
amphibians possess a large variety of extra-ocular photoreceptive sites, such as the pineal gland,
deep-brain photoreceptors and dermal photoreceptors (Shand and Foster 1999). All novel
photopigments isolated from these non-visual photosensing sites/tissues consist of an opsin
protein bound to a vitamin-A chromophore, which is structurally similar to the well-studied
visual opsin of rods and cones (Peirson, Halford et al. 2009). However, up until 1998, none of
the identified non-visual photopigment genes were found to be expressed in the mammalian
genome. In 1998, Provencio at al. isolated a non-visual photopigment from the photosensitive
dermal melanophores of Xenopus laevis (African clawed frog) (Provencio, Jiang et al. 1998). It
was then given the name melanopsin. The coding messenger RNA of melanopsin was
subsequently found in both mouse and human genomes by the same research team (Provencio,
Rodriguez et al. 2000). The study also found that in humans melanopsin is expressed only in the
eye. In situ hybridization histochemistry showed that melanopsin expression is exclusive to cells
within the inner retina (Provencio, Rodriguez et al. 2000). The presence of melanopsin in human
inner retina indicated that some retinal ganglion cells may contain melanopsin and carry the task
of non-image-forming photosensing. Shortly afterward, it was collectively demonstrated by
multiple teams that the retinohypothalamic tract, the fiber bundle that connects retina to the
suprachiasmatic nuclei (SCN, the site of mammalian circadian rhythm centre), was exclusively
formed by axons of melanopsin-containing retinal ganglion cells (Gooley, Lu et al. 2001;
Hannibal, Hindersson et al. 2002). These findings strongly suggested that these ganglion cells
were the mysterious third photoreceptor predicted by Keeler almost 80 years ago. The last piece
of the puzzle was whether these retinal ganglion cells were indeed intrinsically photosensitive.

5
1.2.3 The discovery of intrinsically photosensitive retinal ganglion cells
The final piece of the puzzle was put in place in 2002 by two papers published in the
journal Science (Berson, Dunn et al. 2002; Hattar, Liao et al. 2002). Berson and colleagues
employed retrograde tracer to label the small group of giant retinal ganglion cells that innervate
SCN (Berson, Dunn et al. 2002). Patch clamp recording revealed that all these SCN-innervating
retinal ganglion cells were intrinsically photosensitive: even when the rod and cone
photoreceptors were pharmaceutically blocked or mechanically removed, they still responded to
light stimulation with a depolarizing action potential, confirming that these retinal ganglion cells
were indeed a third class of photoreceptors (Berson, Dunn et al. 2002). Therefore they were
termed intrinsically photosensitive retinal ganglion cells (ipRGCs). Berson et al. (Berson, Dunn
et al. 2002) also reported the sensitivity, spectral tuning, and kinetics of the light response of
ipRGCs. When isolated from rods and cones’ influence, the ipRGCs were selectively sensitive to
short wavelength light, with a peak absorption rate at around 480nm (blue light). They had a high
threshold intensity and long integration time; it took long exposure to bright light to stimulate
them. Most remarkably, ipRGCs responded to steady illumination with sustained tonic
depolarization over a long period of time, a unique sensory property that is suitable for their
hypothesized purpose of detecting ambient light irradiance for circadian rhythm
photoentrainment and pupil size regulation. These photobiology characteristics were also
consistent with the behavioral responses previously described in rodless+coneless mice (Lucas,
Douglas et al. 2001). Berson and colleagues’ elegant work was complemented by an associated
paper published in the same issue of Science. Hattar and colleagues (Hattar, Liao et al. 2002)
identified ipRGCs using the same combination of retrograde tracing and single cell recording
technique as described by Berson et al. (Berson, Dunn et al. 2002). By staining the flat mount
preparation of retina for melanopsin immunoreactivity, they confirmed that all ipRGCs were
invariably melanopsin-positive, whereas conventional ganglion cells lacking intrinsic light
responses were all melanopsin-negative. They also employed a transgenic mouse model to
demonstrate the projections of melanopsin-containing retinal ganglion cells. In this animal model,
β-galactosidase, a marker enzyme, was targeted to the melanopsin gene locus so that all
melanopsin-containing ipRGCs would express β-galactosidase. Histochemical staining showed

6
that β-galactosidase–positive RGC axons projected primarily to the SCN and the olivary
pretectal nucleus (OPN, the pupillary light reflex centre), (Sun and May 2014) Stained fibers also
“sparsely innervated the ventral lateral geniculate (vLGN) but did not innervate the dorsal lateral
geniculate (dLGN)” (Hattar, Liao et al. 2002), as the LGN is the primary relay for the image-
forming visual pathway, it seemed that ipRGCs did not have the functional properties for direct
image formation. The authors concluded therefore that melanopsin-containing ipRGCs are
“generally involved in non–image-forming visual function” (Hattar, Liao et al. 2002).
1.2.4 Summary
The discovery of melanopsin and melanopsin-containing intrinsically photosensitive
retinal ganglion cells provides clear evidence that rods and cones are not the only types of
photoreceptors in our retina, light information is also coded by a class of non-rod and non-cone
inner retina photoreceptors, and transmitted to the brain in a parallel pathway from that of the
image-forming visual system. This marked the beginning of a new line of research in visual
science.

7
1.3 Anatomical and morphological features of ipRGCs
1.3.1 IpRGCs population and distribution
Intrinsically photosensitive retinal ganglion cells represent a small subset of highly
specialized retinal ganglion cells. Hattar et al.’s study revealed an ipRGC count of only 2300-
2600 in rat retina (Hattar, Liao et al. 2002). With a total population of 100,000 retinal ganglion
cells in the rat retina, (Crespo, O'Leary et al. 1985) these number accounted for 2-3% of the total
retinal ganglion cell population in rats. In human retina, the proportion of ipRGCs in the total
population of retinal ganglion cells is much lower: Dacey et al. reported about 3000 melanopsin-
positive retinal ganglion cells within a human retina flat mount preparation. Assuming 1.5
million ganglion cells in the human retina (Wässle, Grünert et al. 1990). the melanopsin-positive
cells represent only 0.2% of the total. (Dacey, Liao et al. 2005) The distribution of ipRGCs in
rodent retina is asymmetric, with slightly higher density in superior and temporal quadrants than
in the rest of retina (Hattar, Liao et al. 2002; Berson, Castrucci et al. 2010). In human retina,
however, ipRGCs are more evenly distributed within the four quadrants, with higher density
around the macular area except the foveola, where ipRGCs are almost absent. This is presumably
to avoid interfering the acuity of central vision (Dacey, Liao et al. 2005).
1.3.2 Morphological features of typical ipRGCs: M1 cells
IpRGCs were initially described as a uniform, morphologically distinct subtype of retinal
ganglion cells. The morphological features revealed in the early years of ipRGCs research
include “a big cell body and long, sparse dendritic processes narrowly monostratified at the
outermost lamina (OFF sublamina) of the inner plexiform layer (IPL) of the retina”(Hattar, Liao
et al. 2002; Provencio, Rollag et al. 2002; Berson 2003). Most of the cell bodies (95%) are
located in the ganglion cell layer (GCL) of retina, with remainder being in the inner nucleus
layer (INL) (Dacey, Liao et al. 2005). Their dendritic fields are large, spanning about 500 µm
(by far the largest dentritic field diameter of any retinal ganglion cells identified so far) (Dacey,
Peterson et al. 2003; Dacey, Liao et al. 2005), forming an extensively overlapping meshwork
within IPL. These cells invariably show intense melanopsin-immunoreactivity and strong
intrinsic photosensitivity (Berson, Dunn et al. 2002; Hattar, Liao et al. 2002; Dacey, Liao et al.

8
2004; Dacey, Liao et al. 2005; Schmidt, Taniguchi et al. 2008; Do, Kang et al. 2009). Their
axons project to the SCN as well as other circadian rhythm related areas, and the pupil motion
centre OPN as well(Berson, Dunn et al. 2002; Hattar, Liao et al. 2002; Morin, Blanchard et al.
2003; Sollars, Smeraski et al. 2003; Hattar, Kumar et al. 2006).
Since the original description of ipRGCs, their anatomical features and diversity have
been under constant refinement. Now it is clear that they are not a homogeneous population of
cells, but instead consist of numerous morphologically and functionally distinct cell types. The
most “classical” ipRGCs as described above have now been classified as M1 cells (Hattar,
Kumar et al. 2006).
1.3.3 Morphological features of atypical ipRGCs: M2-M5
Soon after the description of the M1-type, two new cell types, M2 and M3, were
characterized. M2 ipRGCs are distinct from M1 by the fact that their processes stratify in the
inner sublamina (ON sublamina) instead of outer sublamina (OFF sublamina) of the IPL. Besides
the differences in dendritic stratification, M2 ipRGCs have even “larger cell body sizes and
larger, more branched dendritic arbors than M1 cells” (Warren, Allen et al. 2003; Viney, Balint
et al. 2007; Baver, Pickard et al. 2008; Schmidt, Taniguchi et al. 2008; Schmidt and Kofuji 2009;
Berson, Castrucci et al. 2010; Schmidt, Chen et al. 2011; Schmidt, Do et al. 2011). M3 cells are
bistratified and have dendrites located in both the OFF and ON sublamina of the IP;otherwise,
M3 cells are similar to M2 cells in terms of cell body size and dendritic tree complexity (Schmidt
and Kofuji 2011). Most recently, using a transgenic melanopsin reporter mouse line,
investigators identified two more new ipRGCs types: M4 and M5. The melanopsin level of M4
and M5 is so low that it was not detectable by even by the most sensitive melanopsin
immunohistochemistry procedure (Lin, Wang et al. 2004; Ecker, Dumitrescu et al. 2010; Estevez,
Fogerson et al. 2012). Yet they did consistently show weak melanopsin-dependent intrinsic
photosensitivity (Estevez, Fogerson et al. 2012). M4 cells have the largest cell bodies of all
ipRGC subtypes. They stratify in the ON sublamina of IPL, and have slightly larger and more
highly branched dendritic arbors than M2. In contrast, M5 ipRGCs also stratify in the ON

9
sublamina of IPL and they have small, bushy dendritic arbors branched uniformly around the cell
body (Ecker, Dumitrescu et al. 2010).
1.3.4 Central projections of ipRGCs
Identifying the photoreceptors that set the circadian clock was the initial motivation for
ipRGC research, so many early studies chose the circadian rhythm centre, the suprachiasmatic
nucleus SCN of hypothalamus, as their starting point. Gooley and colleagues were the first to
demonstrate that the retinohypothalamic tract was exclusively formed by axons of melanopsin-
positive retinal ganglion cells (Gooley, Lu et al. 2001). Soon afterwards, ipRGCs were shown to
send “dense projections to the SCN and other brain areas” that are related to circadian rhythm
regulation, such as the intergeniculate leaflet (IGL) and the ventral lateral geniculate nucleus
(vLGN) (Hattar, Liao et al. 2002). IpRGCs also provide primary innervation to the pupil motion
centre, the olivary pretectal nucleus (OPN), then complete the loop of the pupillary light reflex
through the Edinger-Westfal nucleus-ciliary ganglion-iris sphincter pathway (Berson 2003;
Hattar, Kumar et al. 2006). Scattered fibers reach lateral and ventrolateral preoptic areas,
influencing the secretion of reproductive hormones from the pituitary (Hattar, Kumar et al. 2006).
A number of fibers reach medial amygdala, an area that plays a key role in innate emotional
behaviors (Keshavarzi, Sullivan et al. 2014). Other regions receiving ipRGC input include the
supraoptic nucleus, the ventral subparaventricular zone, and the lateral habenula (Gooley, Lu et
al. 2003; Hattar, Kumar et al. 2006). Noseda et al. demonstrated that there is a connection
between ipRGCs projections and the trigeminal system through the posterior hypothalamus.
(Noseda, Kainz et al. 2009) The authors suggested that this could explain pain and photophobia
in migraine patients who lack pattern vision (Noseda, Kainz et al. 2009).
All the above-mentioned central projections were contributed by typical ipRGCs (M1
cells), while M2-M5 cells provide substantial synaptic input to regions involved in image-
forming vision, such as the dorsal lateral geniculate nucleus (dLGN) and the superior colliculus
(SC) (Ecker, Dumitrescu et al. 2010), suggesting melanopsin’s influence on image-forming
vision. In contrast, M1 cells only provide sparse fibers to the dLGN and the SC.
10
1.3.5 Summary
IpRGCs are spread across the retina. The morphological diversity of melanopsin-
containing ipRGC implies diverse functional properties. Although the properties of responses
elicited by each subtype remain to be further elucidated, it is generally accepted that typical
ipRGCs (M1) form a retinal irradiance detecting “network”, and provide a primary afferent
signal for most “classical” non-image-forming photo responses, such as circadian rhythm
photoentrainment and pupil size regulation, while atypical ipRGCs (M2-M5) have significant
influences on the conventional visual pathway, and may play regulating roles in image-forming
vision (Dacey, Peterson et al. 2003; Dacey, Liao et al. 2004; Dacey, Liao et al. 2005; Ecker,
Dumitrescu et al. 2010; Schmidt, Chen et al. 2011; Schmidt, Do et al. 2011; Estevez, Fogerson et
al. 2012).

11
1.4 Physiological properties of ipRGCs
1.4.1 Light absorption of melanopsin
Much like the opsins in rods and cones, melanopsin is a transmembrane G-protein-
coupled receptor that binds 11-cis retinal as its chromophore at resting state (Walker, Brown et al.
2008). After absorbing a photon, 11-cis retinal transforms into all-trans retinal, which
subsequently drives conformational changes and eventually an activated state of melanopsin. The
spectral sensitivity of mammalian melanopsin has an absorption peak at around 480 nm, within
the range of short wavelength blue light, which has been demonstrated consistently in studies of
purified rat melanopsin, the spectral tuning of ipRGCs, the behavioral response of animal models,
and also in physiological measurements from human subjects (Berson, Dunn et al. 2002; Dacey,
Liao et al. 2005; Gamlin, McDougal et al. 2007; Do, Kang et al. 2009; Mure, Cornut et al. 2009;
Do and Yau 2010).
Once being activated, the opsin’s chromophore conformation needs to be converted from
all-trans back to 11-cis again to regain its photosensitivity. In many vertebrate photoreceptors
(e.g. rods and cones) located in close proximity to underlying retinal epithelial cells (RPE), the
thermally unstable all-trans retinal disassociates from the photoreceptor and is transported to the
RPE. Subsequently, the all-trans retinal is converted to 11-cis in RPE through a multi-enzymatic
biochemical cascade called the “visual cycle”. Taking advantage of ample 11-cis retinal supply
from RPE, the bare opsin simply binds another 11-cis retinal and becomes photosensitive once
again. In contrast, the melanopsin-containing retinal ganglion cells are located on the other side
of the retina away from the RPE supply of 11-cis retinal, which raises an intriguing question
about the regenerating mechanism of melanopsin. There is growing evidence that melanopsin is
capable of functioning as a “bistable” opsin (Lucas 2006; Mure, Rieux et al. 2007; Rollag 2008;
Mure, Cornut et al. 2009; Matsuyama, Yamashita et al. 2012; Sexton, Golczak et al. 2012),
meaning that the photoisomerized chromophore does not dissociate from the opsin. Instead, the
stable active (“meta”) state of the chromophore is reversed to a stable resting state through
subsequent absorption of light. This property of the opsin is referred as “bistability”, a common
opsin regenerating mechanism employed by many invertebrate photoreceptors (Koyanagi,
12
Kubokawa et al. 2005). The reversing absorption wavelength of bistable opsin is usually longer
than the activating wavelength. Mure and colleagues (Mure, Rieux et al. 2007; Mure, Cornut et
al. 2009) demonstrated in vivo melanopsin bistability by measuring long-wavelength light
potentiation of the pupil response to blue light. They also demonstrated that the spectrum of the
reversing reaction of melanopsin was distinct from that of the forward reaction, and has its
absorption peak at 587 nm, within the range of orange-red light (Mure, Cornut et al. 2009).
However, the long-wavelength light potentiation of ipRGC firing was not observed in vitro
(Mawad and Van Gelder 2008). More recently, a photochemistry study on purified rat
melanopsin provided conflicting evidence, namely that the backward and forward spectra may
overlap, with both peaking within the blue light range (467 nm vs. 476 nm) (Matsuyama,
Yamashita et al. 2012). Therefore, the bistability property of melanopsin and its physiological
consequences remain to be further elucidated.
1.4.2 Menalopsin-driven phototransduction
Phototransduction is the process by which light stimulation is converted to an electrical
signal by the photoreceptor. Based on differences in the phototransduction cascade,
photoreceptors can be divided into two broad categories: ciliary photoreceptors (usually found in
vertebrate retina, with rods and cones being the most extensively studied) and rhabdomeric
photoreceptors (found in invertebrate animals) (Hardie 2001; Arendt 2003; Arendt, Tessmar-
Raible et al. 2004; Hardie and Postma 2008). The photoreceptor cascade in ciliary photoreceptor
rods and cones has been well characterized: absorption of light causes isomerization (11-cis to
all-trans) of the vitamin A chromophore bound to opsin protein, which leads to activation of the
G-protein transducin (a member of the G i/o family of G-proteins), resulting in phosphodiesterase
activation and hydrolysis of cGMP to GMP (Arendt, Tessmar-Raible et al. 2004). Decreasing
cGMP concentration results in closure of cyclic nucleotide-gated cation channels, leading to a
hyperpolarizing receptor potential (Arendt 2003; Fu and Yau 2007). In comparison, the
phototransduction cascade of rhabdomeric photoreceptor classically starts with G q/11-type G-
protein activation, leading to the activation of phospholipase C (PLC) and the generation of 1,2-
diacylglycerol (DAG) and inositol 1,4,5-trisphosphate (IP3) following the breakdown of
phosphatidylinositol 4,5-bisphosphate (PIP2), subsequently resulting in the influx of Ca2+

13
through transient receptor potential (TRP) ion channels in the cell membrane, eventually the
occurrence of depolarizing action potentials (Hardie 2001).
Melanopsin protein is structurally similar to invertebrate opsins, and it mediates a
depolarizing photo response (Yau and Hardie 2009; Fain, Hardie et al. 2010). Therefore, initial
studies on the phototransduction cascade of ipRGCs were based on the hypothesis that ipRGCs
use a G q/11-type G-protein signaling pathway as described in rhabdomeric photoreceptors
(Provencio, Jiang et al. 1998). Using pharmacological and transgenic approaches, investigators
have since identified some key components in the melanopsin phototransduction cascade. (see
discussion below)
1.4.2.1 Activation of G-proteins
G-proteins, also known as guanine nucleotide-binding proteins, are a family of proteins
that function as intracellular molecular switches. All opsins are coupled to a specific member of
the G-protein family to convert external light stimulation into intracellular signals. There have
been over 20 subtypes of G-proteins identified so far, they are categorized into 4 groups: G s, G
i/o, G q/11 ad G 12/13 based on the biochemical cascade they trigger (Davignon, Barnard et al. 1996).
As discussed above, due to high homology to invertebrate opsin and the fact that melanopsin-
containing cells respond to light with a depolarizing potential, it was assumed that melanopsin is
coupled with G q/11-type protein (Provencio, Jiang et al. 1998). The most compelling evidence
came from Graham and colleagues’ study (Graham, Wong et al. 2008), where ipRGCs’ intrinsic
photo response was completely abolished by application of GPant-2a, a specific inhibitor of the
G q/11 class of G-proteins, but not by peptide GPant-2, a specific inhibitor of the G i/o class,
confirming that phototransduction of ipRGCs is G q/11 dependent (Graham, Wong et al. 2008).
The G q/11 class itself consists of 4 members: Gαq, Gα11, Gα14, and Gα15 (Davignon, Barnard et al.
1996). mRNA of the first three sub-units were expressed in ipRGC (with Gα14 being the most
commonly detected), but G α15 was not (Peirson, Oster et al. 2007; Graham, Wong et al. 2008).
The exact G-protein sub-type that mediates melanopsin phototransduction in ipRGC remains to
be determined.

14
1.4.2.2 Activation of phospholipase C
The next step in the classic G q/11 signaling pathway is the activation of PLCβ isoforms,
which subsequently generate 1,2-diacylglycerol (DAG) and inositol 1,4,5-trisphosphate (IP3) by
breaking down phosphatidylinositol 4,5-bisphosphate (PIP2) (Hubbard and Hepler 2006). By
administrating the PLC inhibitor U73122, Graham and colleagues (Graham, Wong et al. 2008)
completely abolished the melanopsin-driven ipRGC photoactivity, indicating that PLC is a key
effector enzyme in the melanopsin phototransduction cascade. Among four identified PLCβ
subtypes (PLCβ1, 2, 3, 4), PLCβ4 is most retina-specific. In PLCβ4 -/-
gene knockout mouse line,
the intrinsic photosensitivity of ipRGCs was almost completely diminished (Xue, Do et al. 2011).
This finding further expands our knowledge of PLCβ subtype involved in melanopsin signaling.
There is also a growing body of literature about the downstream effectors following the
activation of PLCβ4. Strong evidence indicates that DAG and IP3, two products of PIP2
hydrolysis, are not essential in the melanopsin phototransduction cascade (Graham, Wong et al.
2008). Investigators hypothesize that it is the breakdown of PIP2 itself that controls the opening
of several ion channels, and subsequently leads to an action potential. When PIP2 is replenished,
the post-stimulus potential will return to its resting state. To test this hypothesis, Graham and co-
workers (Graham, Wong et al. 2008) use a drug called wortmannin to block the synthesis of PIP2.
According to their hypothesis, when the rate of PIP2 restoration is reduced, the termination of
post-stimulus potential would be delayed. Indeed, when wortmannin was added to the pipette
solution, ipRGCs showed a prolonged photo response. However, more work is needed to
determine the exact mechanism of how PIP2 controls the gating of ion channels.
1.4.2.3 Activation of transient receptor potential channel
The transient receptor potential (TRP) channel is a group of cation channels that exist
widely on the plasma membrane of numerous animal cell types. TRPC (“C” for canonical) is a
TRP subfamily first described in Drosophila fruit fly photoreceptors (Montell 2005). TRPC is
permeable for all cations, with selectivity for calcium over sodium. Because melanopsin’s
structure and phototransduction cascade highly resemble those of drosophila opsin, it was
speculated that TRPC is responsible for mediating the initial influx of depolarizing current.

15
Findings of subsequent studies indeed supported this hypothesis: electrophysiological studies of
ipRGC showed that light-induced current reverses at around 0 mV (Do, Kang et al. 2009;
Schmidt and Kofuji 2009), suggesting a nonspecific cationic channel involvement. There is also
evidence that calcium is the main carrier of light-induced current in ipRGC (Warren, Allen et al.
2006). Pharmaceutical studies showed that many drugs known to suppress TRPC channels can
block the ipRGC photo response (Warren, Allen et al. 2006; Hartwick, Bramley et al. 2007). The
most compelling evidence once again came from a genetic knockout animal line: Xue and
colleagues (Xue, Do et al. 2011) showed that in double knockout mice lacking both TRPC6 and
TRPC7 (two members of the TRPC subfamily expressed in retina), the photo response of the
M1-type ipRGC was abolished. Single-knockout of TRPC6, TRPC7 or other members of the
TRPC subfamily did not appear to alter the intrinsic photosensitivity of M1-ipRGCs. The
identification of TRPC subfamily members that mediate the melanopsin-driven photoactivity is a
major breakthrough in our understanding of melanopsin phototransduction. However, many key
components in his cascade, such as the mechanism by which PLCβ activation triggers that
opening of TRPC channels, and downstream action of other ion channels following the opening
of TRPC channels, remain to be further elucidated.
1.4.3 Electrophysiology of ipRGCs
1.4.3.1 Intrinsic photo response of ipRGCs
Unlike rod and cone photoreceptors that respond to light with hyperpolarizing potentials
in an analog manner, ipRGCs code digitally via action potential spikes. It has been demonstrated
that the melanopsin-driven ipRGC phototransduction has a remarkably high gain: absorption of a
single photon is sufficient to result in a recordable increase in spike firing (Do, Kang et al. 2009).
This feature is brought about by some unique electrophysiological properties of ipRGCs. First,
the photo current of the single photo response is relatively high, around 1-2.3 pA at body
temperature, which is larger than that of that of rods and 100 times that of cones (Do, Kang et al.
2009; Schmidt and Kofuji 2009). Second, the single-photo-response is slow and long lasting,
with an integration time of about 8 s, which is much longer than that of rods/cones and most
other invertebrate photoreceptors (Do, Kang et al. 2009; Do and Yau 2010). The long integration

16
time of the single-photo-response may prevent it from being filtered by the membrane time
constant, and also prolongs the after-stimulus effect (Do, Kang et al. 2009). Last but not least,
ipRGCs exhibit a low spontaneous spiking rate in darkness (Wong, Dunn et al. 2007; Do, Kang
et al. 2009), indicating that ipRGCs are operating at a membrane potential near the spiking
threshold, so that a small depolarization caused by single photon absorption is sufficient to make
the cells spike more frequently. It has been suggested that this high amplification is a
compensating mechanism for the very low density of melanopsin in the retina (Do, Kang et al.
2009; Do and Yau 2010). In addition to the sparse distribution of ipRGCs, the density of
melanopsin within ipRGCs is also low, with only a few molecules per square micron, compared
to ~25,000 per square micron for rods and cones, which employ a specialized folded outer
segment membrane to store a large amount of photopigment (Belenky, Smeraski et al. 2003; Do,
Kang et al. 2009; Do and Yau 2010). The low density of melanopsin is thought to avoid
interference with the photon absorption of image-forming photoreceptor rods and cones, which
lie deeper in the retina (Lucas 2013). Therefore, even under bright illumination, ipRGCs capture
very few photons, thus a high photo response gain is required in order to signal ambient light
irradiance.
Despite the high gain in melanopsin phototransduction, the extremely low density of
melanopsin molecules causes low sensitivity of the ipRGC intrinsic photo response. It was
shown that half-saturation of the ipRGC response to flashes at their maximum absorption
wavelength requires an intensity of 107 photons/μm
2, ~10
6-fold higher than that for rods and
~104-fold higher than for cones at their corresponding maximum absorption wavelengths (Do,
Kang et al. 2009; Do and Yau 2010), which makes ipRGCs much less sensitive photoreceptors
than rods and cones.
Another remarkable feature of ipRGC electrophysiology is the ability to faithfully encode
light energy over a prolonged period of time. When stimulated with long duration stimuli, the
spiking rate builds relatively slowly (3s to 200 ms depending on the stimulation intensity) (Do,
Kang et al. 2009) and reaches a maximal sustained firing rate that is “linearly proportional to
light intensity” (Berson 2003; Dacey, Liao et al. 2005; Fu, Liao et al. 2005; Wong, Dunn et al.

17
2005; Do, Kang et al. 2009). When the bright light is left on, the firing rate of ipRGCs is
“remarkably steady and sustained, without fatigue or adaptation to the continuous light
stimulation” (Fu, Liao et al. 2005). When the light is turned off, ipRGCs do not immediately stop
firing, but show a prolonged post-stimulus potential that lasts for tens of seconds to minutes
(Berson 2003; Fu, Liao et al. 2005). A linear relation can also be found between the total number
of ipRGCs spiking and the total amount of light energy that the ipRGCs are exposed to (Dacey,
Liao et al. 2005). This unique “photon-counting” ability is ideal for the functional role of
ipRGCs as an ambient light irradiance detectors for circadian rhythm and tonic pupil size
regulation. The electrophysiological properties of ipRGCs, in comparison to rods and cones, are
summarized in Table 1.

18
CONE ROD ipRGC
Functions photopic, central
vision
scotopic, peripheral
vision
pupillary response,
circadian rhythm, and
other non-visual
functions
Number 5 million 120 million 4000-12000
Location inner segment: outer
nuclear layer
outer segment:
photoreceptor layer
inner segment: outer
nuclear layer
outer segment:
photoreceptor layer
ganglion cell/inner
plexiform layers
Photopigment lodopsins Rhodopsin Melanopsin
Photosensitivity low extremely high Low
Receptive field Very small Small Very large
Peak absorption
wavelength (nm)
420 (S), 534(M), 564
(L)
498 482
Patterns of light
pupillary response
Rapid onset, early
adaptation
Rapid onset,
sustained on
continuous exposure
Delayed onset and
prolonged firing
Table 1. Properties of Three Types of Photoreceptors: Cones, Rods and IPRGCs

19
1.4.3.2 Extrinsic synaptic input to ipRGCs
Beside their melanopsin-driven intrinsic photosensitivity, all ipRGCs also receive
extensive extrinsic synaptic input that originates from rods and cones, and which is mediated via
bipolar cells and amacrine cells (Wong, Dunn et al. 2007). As discussed above, rods and cones
respond to light increments with hyperpolarizing potentials, resulting in a reduced release of the
neurotransmitter glutamate. The second-order neurons, the bipolar cells, can be divided into two
sub-groups depending on the glutamate receptor they employ. The bipolar cells that employ the
metabotropic receptor harness glutamate as an inhibitory signal, so they reverse the signal of
rods and cones, and show a depolarizing response on light incrementation. Therefore they are
called ON bipolar cells. The remaining bipolar cells employ an ionotropic receptor that utilizes
glutamate as an excitatory neurotransmitter. They hyperpolarize at light increment and
depolarize at decrement, so they are called OFF bipolar cells (Kolb and Nelson 1995).
Conventionally, the axons of ON bipolar cells terminate and make synaptic contact with the
dendrites of ON retinal ganglion cells in the innermost sublamina (ON-sublamina) of IPL.
Similarly, OFF bipolar cells stratify and contact OFF-RGCs in the outermost sublamina (OFF-
sublamina) of IPL.
The classic ipRGCs (M1-cells) arborize in the OFF-sublamina, but paradoxically, they
receive mostly ON bipolar cells input (Wong, Dunn et al. 2007; Schmidt and Kofuji
2010).IpRGCs also receive weak input from OFF cone bipolar cells (Wong, Dunn et al. 2007).
Under physiological conditions, this minor extrinsic OFF response (spiking at the offset of light)
of ipRGCs is buried by the withdrawal of the ON response, and is only observable after
pharmacological blockage of amacrine cells and ON bipolar cells (Wong, Dunn et al. 2007). The
physiological importance of the extrinsic OFF input to ipRGCs is still unclear. Dacey and
colleagues reported a primate ipRGC with a prominent L+M-cone ON/S-cone OFF pattern of
synaptic input. (Dacey, Liao et al. 2005). Although this feature may not be universal for all
ipRGCs, it indicates that some ipRGCs may play a role in coding color opponency and
modulating color perception (Dacey, Liao et al. 2005).

20
Putting all the evidence together, ipRGCs receive net excitatory synaptic input
predominantly through ON bipolar cells. Interestingly, the synaptic input to ipRGCs is quite
sustained compared to the synaptic input to the conventional RGCs (although not as sustained
and long-lasting as compared to the melanopsin-driven response) (Wong, Dunn et al. 2007; Do
and Yau 2010). IpRGCs can thus use both their extrinsic and intrinsic photo activity to signal
light irradiance for long periods of time. In addition, rod/cone-driven extrinsic ipRGC
photoactivity are faster and more sensitive than the melanopsin-driven intrinsic ipRGC
photoactivity(Wong, Dunn et al. 2007), It has been suggested that combining the rod/cone-driven
extrinsic photoactivity and melanopsin-driven intrinsic photoactivity expand the dynamic range
of ipRGCs to steadily encode dim light and rapid change in light intensity (Lucas 2013).

21
1.5 Functions of melanopsin and the ipRGC system
1.5.1 Melanopsin and ipRGC function in non-image-forming photosensation
IpRGCs integrate the photo activity of all three known retinal photoreceptors (rod, cones
and melanopsin-driven intrinsic ipRGC photo responses) to provide an afferent signal for a wide
range of reflex and sub-conscious photo bio-responses responsible for many aspects of
physiological and behavioral statuses, collectively referred as “non-image-forming visual
functions”. Using genetically modified animal lines, investigators have gradually detailed the
functional roles of melanopsin and melanopsin-containing ipRGCs.
1.5.1.1 Circadian rhythm photoentrainment
Most organisms living on earth (except some cave animals) are exposed to a 24-hour
day/night cycle. The endogenous circadian clock has evolved to regulate their physiology and
behaviours according to the varying demands throughout the day. Needless to say, these internal
clocks are useless if they are not synchronized with the 24-hour day/night cycle of the real world.
(A compelling example is jetlag, where our internal circadian clock is desynchronised and acting
against our behavioural needs). Not surprisingly, the primary environmental synchronizing cue
of circadian rhythm is the natural cycle of ambient light. Since the internal circadian cycle is not
exactly 24 hours, this photo-induced synchronizing process known as photoentrainment is
occurring constantly. Unlike non-mammalian vertebrates such as fish, birds, and reptiles that
have extra-ocular circadian photoreceptors (Shand and Foster 1999; Helfrich-Förster, Winter et
al. 2001; Vigh, Manzano et al. 2002), photoentrainment of mammalian animals originates solely
from the retina of the eyes, this is confirmed by the fact that eye removal completely abolishes
circadian photoentrainment (Freedman, Lucas et al. 1999; Yamazaki, Goto et al. 1999). It is now
clear that the retinohypothalamic tract that connects retina to the superior chiasmatic nucleus, the
endogenous circadian centre, is predominantly formed by axons of ipRGCs (Hattar, Liao et al.
2002; Hannibal, Hindersson et al. 2004). In order to demonstrate the functional roles of ipRGC
cells, selective in vivo ipRGC ablation was induced by administration of diphtheria toxin to a
transgenic mouse model where the diphtheria toxin receptors are expressed on ipRGCs, or by

22
intraocular injection of melanopsin antibody linked to saporin toxin (Göz, Studholme et al. 2008;
Güler, Ecker et al. 2008; Hatori, Le et al. 2008). Photoentrainment is lost after these induced
selective lesions in ipRGCs, meaning that ipRGCs are important generators and primary conduits
for the photoentrainment afferent signal to the circadian clock. IpRGCs do not perform the task
alone, but rather they receive synaptic input from conventional rod/cone circuits within the retina.
Therefore, the light response of ipRGCs in the real world is a summation of rod/cone-mediated
activities and intrinsic melanopsin-driven activity. How rods, cones and melanopsin work
together to provide photoentrainment has been the subject of extensive study.
The fact that even extremely dim light near the threshold intensity of vision has
significant influence on circadian rhythm indicates an important contribution from rods (Lall,
Revell et al. 2010). There is also evidence that photoentrainment of rods is not restricted to very
dim light. Genetically engineered “rod only” mice (lacking cones and melanopsin, but with an
intact relay function of ipRGCs) entrain well to artificial dark/light cycles with the light portion
set at 500 photopic lux (equivalent to normal indoor lighting levels), indicating that rods are a
reliable source of irradiance coding over a moderate range of light intensities (Altimus, Güler et
al. 2010). But what would happen if the lighting level was above the saturation point of rods?
Under such conditions, cones are responsible for our vision; can they replace rods as irradiance
detectors under high intensity lighting? It appears that cones are not up to this task: “cones only”
mice (lacking both rods and melanopsin, preserved ipRGCs) failed to entrain reliably to
dark/light cycles in the laboratory (Lall, Revell et al. 2010). When presented with a bright light
pulse, both ipRGCs (Berson, Dunn et al. 2002; Dacey, Liao et al. 2005) and neurons in SCN
(Brown, Wynne et al. 2011) show a rapid increase in cell firing that subsides quickly to a lower
level of sustained excitation. Pharmaceutical and genetic manipulation (Berson, Dunn et al. 2002;
Dacey, Liao et al. 2005; Wong, Dunn et al. 2007) suggested that the rapid phase of the response
is driven by rods/cones, and the sustained cell response under constant bright light exposure and
after the offset of light is driven by melanopsin. Light wavelengths that can activate cones but
not melanopsin induced strong firing at lights on, but drove very little sustained firing under
continuous light exposure (Brown, Wynne et al. 2011). These data indicate that cones adapt to
bright light too quickly to provide sustained irradiance coding for photoentrainment. On the other

23
hand, melanopsin-driven ipRGC activity has a high threshold and sustainable excitability under
bright light, providing a good compensation for the functional disadvantage of rods and cones.
As discussed earlier, it has been long observed that a retina lacking rods and cones can still
photoentrain (Ebihara and Tsuji 1980; Foster, Provencio et al. 1991; Freedman, Lucas et al. 1999;
Lucas, Freedman et al. 2001), while melanopsin knock-out mice can entrain but the magnitude of
behaviour response is substantially reduced (Panda, Sato et al. 2002; Ruby, Brennan et al. 2002;
Hattar, Lucas et al. 2003). Putting all this evidence together, it is safe to conclude that cones,
rods and ipRGCs all participate in non-image-forming irradiance detection for photoentrainment,
with ipRGCs being the primary afferent signal relay. Each known photoreceptor contributes a
different quality of information about the dynamic environmental lighting. Cones encode sudden
increases in light intensity, leaving rods and ipRGC to act at low and high intensity levels
respectively, allowing the circadian clock to respond to gradual changes in environmental
lighting over a wide range of irradiance levels.
1.5.1.2 Pupillary light reflex
Intrinsically photosensitive retinal ganglion cells also project to the olivary pretectal
nucleus (OPN), forming the afferent limb of the pupillary light reflex (Hattar, Liao et al. 2002).
This direct connection to the midbrain pupil movement centre by ipRGCs explains why
genetically manipulated rodless+coneless mice (Lucas, Freedman et al. 2001) and blind human
patients due to severe photoreceptor disease can still have a preserved pupil light reflex (PLR) to
high irradiance stimuli. Subsequent work by Hatori (Hatori, Le et al. 2008) and colleagues
showed that ablation of ipRGCs almost completely eliminates photoentrainment and PLR in
mice, revealing the central role of ipRGCs in PLR pathway.
It has been known for many decades that PLR has transient as well as sustained steady-
state components (Young and Kennish 1993). For example, a 10 s long bright light stimulus will
induce a rapid pupil constriction until it reaches a minimum pupil size (usually taking just a few
seconds). This rapid phase response is followed by a gradual pupil re-dilation (a phenomenon
called “pupil escape”) to a steady state of tonic pupil constriction that continues until the end of
the light illumination (Kawasaki and Kardon 2007). Under certain circumstances, the steady-

24
state pupil constriction can even persist beyond the offset of light stimulus, which is called the
post-illumination pupil response (PIPR) (Young and Kennish 1993). Historically, due to lack of
knowledge of melanopsin and ipRGCs, the origin of differential PLR components has been the
subject of debate. Ever since the discovery of ipRGCs and their role in the PLR pathway,
numerous investigators have made attempts to elucidate the relative contributions of rods, cones
and melanopsin to PLR. A growing body of evidence (Gooley, Lu et al. 2001; Dacey, Liao et al.
2005; Gamlin, McDougal et al. 2007; McDougal and Gamlin 2010) suggests that under photopic
conditions, melanopsin is primarily responsible for maintaining the tonic pupil constriction; rods
and cones contribute mostly to the transient phase of PLR for scotopic and photopic conditions
respectively, the cone-driven pupil constriction adapts to light considerably and contributes little
after prolonged exposure, while the rod-driven response adapts less and contributes significantly
to the maintenance of tonic pupil size under steady illumination when the irradiance level is
below the threshold of melanopsin (McDougal and Gamlin 2010). Study involving
pharmaceutical blockage of rods/cones and pupillometry recording demonstrated that the PIPR
after the offset of light stimulus is driven by melanopsin-mediated phototransduction of ipRGCs
in both macaques and humans(Gamlin, McDougal et al. 2007). Interestingly, the model of the
photoreceptors’ influence on PLR is very similar to that of circadian photoentrainment described
earlier: cones encode the dynamic increase in irradiance and cause strong rapid pupil constriction,
then they adapt to light causing a pupil escape, while rods and melanopsin provide long term
steady regulation of pupil size at low and high irradiance level respectively.
Besides sustained pupil constriction under constant illumination and PIPR, melanopsin
also makes a significant contribution to the maximum constriction of the rapid phase pupil
response. In a wild-type mouse stimulated with flashing light of increasing intensity, the pupil
reaches maximum constriction over about 6 log units of intensity. In melanopsin knock-out
animals, however, pupil reacts normally until it reaches 80% of maximum constriction, further
increases in intensity do not make the pupil constrict more (Lucas, Hattar et al. 2003; Panda,
Provencio et al. 2003; Semo, Peirson et al. 2003; Barnard, Appleford et al. 2004). On the other
hand, in mice lacking rods and cones, the threshold intensity of PLR is much higher than that of
wild-type, but the pupil can constrict fully to bright light (Lucas, Hattar et al. 2003). These

25
findings indicate that melanopsin’s contribution to pupil constriction only starts at relatively high
intensity levels, but it is required for the pupil to fully constrict.
1.5.1.3 Light suppression of activity
Mice and many other nocturnal rodents show reduced levels of activity and locomotion
under bright light illumination, a phenomenon called “negative masking” (Mrosovsky 1999).
Mice lacking melanopsin show reduced negative masking compared to wild-type, although the
masking effect starts at normal intensity thresholds, but it fades away after prolonged
illumination, as animals gradually adapt to the masking and resume normal activity, indicating
that negative masking is not sustainable without the contribution from melanopsin (Mrosovsky
and Hattar 2003). In contrast, in mice lacking rods/cones, negative masking shows an action
spectrum similar to that of ipRGCs, appearing at a higher intensity threshold, and reaching the
same end-point as wild-type in response to bright light (Thompson, Blaner et al. 2001).
In summary, rods, cones and ipRGCs all participate in mediating negative masking in
nocturnal animals. The melanopsin-driven photo response is mandatory for maximal and
sustained negative masking.
1.5.1.4 Light suppression of pineal melatonin
Melatonin is a neuro-hormone regulating a wide range of physiological responses. In
mammals, circulating melatonin is predominantly released by the pineal gland of the brain. The
release of melatonin is regulated by ambient light. In both nocturnal and diurnal animals,
circulating melatonin begins to rise after sunset, reaching its peak during the night. Bright light
exposure as short as several minutes can suppress pineal melatonin production. In humans, the
spectral sensitivity of this response is distinct from those of rod/cone photoreceptors, and is
rather consistent with that of the melanopsin photo response, which has peak absorption at 480
nm. Under constant illumination with melanopsin-activating blue light, the suppression of pineal
melatonin last for hours, while melanopsin-silent red light only induced transient suppression
(Thapan, Arendt et al. 2001; Lockley, Brainard et al. 2003). Mice with outer retinal degeneration
are visually blind but light suppression of pineal melatonin appears to be normal (Lucas,

26
Freedman et al. 2001). These findings collectively suggest a major contribution from melanopsin
in mediating light suppression of pineal melatonin synthesis.
1.5.1.5 Light regulation of sleep
Light has a profound effect on sleeping in both nocturnal and diurnal animals. In wild-
type mice under a 12 hr:12 hr light:dark cycle, a pulse of light illumination in the dark period
induces sleeping, while a period of dark in the light phase induces awakening. These effects are
diminished in melanopsin knock-out mice. The melanopsin knock-out mice also show
perturbations in sleep, and sleep approximately 1 hour less than wild-type (Tsai, Hannibal et al.
2009) , suggesting a sleep-modulating role for melanopsin. These patterns of sleep photo-
regulation may apply to diurnal animals like humans in an opposite manner. It has been
suggested that a “sign inversion” mechanism exists in hypothalamus such that light enhances
wakefulness while dark promotes sleep (Brown and Piggins 2007).
1.5.2 Melanopsin and ipRGC functions in image-forming vision
It was conventionally believed that melanopsin and ipRGCs play little if any role in
image-forming vision. Following the discovery of this novel photoreceptor, the concept of “non-
image-forming vision” was introduced to summarize the major functions of this cell class.
However, the boundaries between “non-image forming vision” and “image forming vision” have
never been clear-cut.
As discussed earlier in this thesis, ipRGCs are morphologically and functionally diverse.
Several subtypes of ipRGCs project directly and heavily to LGN and SC, brain areas that provide
important relays for conventional image-forming vision (Ecker, Dumitrescu et al. 2010). This is
further supported by electrophysiological evidence that melanopsin photoperception drives the
responses in a large proportion of neurons in the mouse dLGN. A direct LGN projection of
ipRGC encoding color opponency and light irradiance had also been observed in non-human
primates (Dacey, Liao et al. 2004; Dacey, Liao et al. 2005). It was initially suggested that the
melanopsin/ipRGC system may play a modulating role in pattern vision (Kawasaki and Kardon
2007), however recent evidence indicates that the contribution of melanopsin and ipRGC in

27
pattern vision may be more direct and more important than initially thought. Ecker and
colleagues showed that mice lacking rod/cone phototransduction, and thus entirely dependent on
melanopsin for light detection, have profoundly reduced but still measurable visual acuity, and
can perform tasks that require pattern vision (Ecker, Dumitrescu et al. 2010). Schmidt and co-
workers (Schmidt, Alam et al. 2014) employed an ultra-sensitive melanopsin assay to show that
the well-known alpha ON ganglion cells capable of contrast detection contain low levels of
melanopsin, and have intrinsic photosensitivity. These alpha ON ganglion cells were further
identified as M4 ipRGCs that had been described previously (Schmidt, Alam et al. 2014). Their
experiment further showed that melanopsin knock-out mice have reduced contrast sensitivity
compared to wild-type, indicating melanopsin’s influence in contrast detection. Interestingly,
intrinsically photosensitive alpha ON ganglion cells are also found in non-mammalian
vertebrates, this finding can be viewed as evidence of evolutionary conservation (Rajaraman
2012).
In summary, exciting new evidence has gradually revealed a concept of “melanopsin-
based vision”, and raised many intriguing questions: What exactly does melanopsin contribute to
vision? Can patients with outer retinal degeneration see with the melanopsin pathways alone?
How are ipRGCs affected in disease? Investigations are underway to address these questions.

28
1.6 Chromatic Pupillometry: in vivo assessment of melanopsin-driven ipRGC photoactivity
Among many photo responses and bio-effects mediated by melanopsin and ipRGCs, the
pupillary light reflex is the most fast-acting and most observable one. PLR thus provide an easily
accessible assessment of the ipRGC-mediated non-visual photoperception pathway. However,
the ipRGC-mediated afferent signal for PLR is a mixture of photo responses from rods, cones
and melanopsin (see discussion in 1.5.1.2), and so the real challenge is to isolate melanopsin-
driven photoactivity from the influence of rods and cones. The spectral sensitivity of intrinsic
melanopsin-mediated phototransduction is relatively narrow with a peak at around 480 nm (short
wavelength light) (Brainard, Hanifin et al. 2001; Dacey, Liao et al. 2005). The intrinsic
melanopsin-driven photo transduction has lower sensitivity compared with rod-mediated and
cone-mediated photo transduction. However, once activated, melanopsin drives a sustained
ipRGC firing that lasts well beyond the offset of light stimulus. Given its central role in
mediating the pupillary reflex, the ipRGCs’ unique electrophysiological property reconciles very
well with the long-observed phenomenon that pupil is able to tonically maintain constriction
under constant light exposure and stay constricted after the cessation of a short wavelength high
intensity light stimulus (Young and Kennish 1993). Gamlin and colleagues were the first team to
provide in vivo evidence that the sustained component of the pupillary light response is indeed
primarily driven by melanopsin (Gamlin, McDougal et al. 2007). They reported that after
pharmacological blockade of rods and cones’ signaling in monkey eyes, continuous light induced
sustained pupil constriction that slowly decayed after the offset of light. The pupil response’s
spectral sensitivity, slow kinetics and irradiance coding properties matched the known
electrophysiological features of ipRGCs. They further reported pupil responses to chromatic light
stimuli in normal human eyes. When stimulated with luminance-matched red and blue light for
10 seconds, rapid pupil constriction was induced by both red and blue stimuli, but the maximum
amplitude of pupil constriction was greater and more sustained under continuous blue light
exposure. The authors suggested that the pupil response to red light was presumably driven by
cones (mediated by ipRGCs), while the greater and more sustained pupil constriction to blue
light compared to red light represented the melanopsin-driven intrinsic photoactivity of ipRGCs

29
superimposed on cone-driven extrinsic activity. Interestingly, the persistent pupil constriction
after the offset of light, namely the post-illumination pupil response (PIPR), was observed after
blue light but not subsequent to red light. The PIPR was largely unchanged after blockage of
rods and cones. The authors therefore suggested using PIPR as an index of the melanopsin-
driven ipRGC contribution to PLR.
Gamlin and colleague’s experiment (Gamlin, McDougal et al. 2007) laid the foundation
of a novel technique called “chromatic pupillometry”, which utilizes light stimuli of different
wavelengths, intensities and durations to selectively assess the contributions of the rod, cone and
melanopsin responses to PLR, based on their differential spectral sensitivities and kinetics of
photo responses. This technique’s ability to assess the newly discovered melanopsin-driven
intrinsic photoactivity of ipRGC was particularly attractive to both vision science researchers and
ophthalmologists.
In the early years of chromatic pupillometry development, Kardon and coworkers
(Kardon, Anderson et al. 2009) described using a Ganzfeld bowl positioned 75 mm away from
the subject to present 100 cd/m2 red and blue central field chromatic stimulation of 60° × 90°
viewing angle. They took the difference in pupil size at the end of 13 s of red and blue light
exposure as their index of the melanopsin response. This protocol, however, did not induce
substantial PIPR. It is questionable whether this protocol stimulates melanopsin adequately.
Park and coworkers (Park, Moura et al. 2011) used the same chromatic pupillometry system and
refined the protocol. They provided evidence in favor of using dim blue stimuli (0.01 cd/m2) to
induce the rod-driven pupil response, bright red stimuli (398 cd/m2) to induce the cone-driven
pupil response, and bright blue stimuli (398 cd/m2) of 1 s duration to induce a sustained PIPR as
an index of the melanopsin-driven intrinsic activity of the ipRGCs. This apparatus and protocol
have since been adopted by a few other groups (Kawasaki, Crippa et al. 2012; Kawasaki, Munier
et al. 2012; Münch, Léon et al. 2012). Several other research teams have devised their own
chromatic pupillometry apparatus and protocols to measure the melanopsin photo response in
both healthy and diseased populations (Kankipati, Girkin et al. 2010; Feigl, Mattes et al. 2011;
Herbst, Sander et al. 2011; Kankipati, Girkin et al. 2011; Nissen, Sander et al. 2011; Herbst,

30
Sander et al. 2012; Herbst, Sander et al. 2013; Roecklein, Wong et al. 2013; Nissen, Sander et al.
2014). The parameters of chromatic pupillometry methodologies in the literature are summarized
in Table 2.
.
Stimulation
Author(year) Color (wavelength) Size Intensity Duration Main Index of Melanopsin Activity
Gamlin (2007) Multiple steps, from Blue (492 nm) to Red (613 nm)
Central 36° 9-15 log quanta/cm2/s
10 s PIPR during 15-30 s after offset of stimuli
Kardon (2009,2011) Blue (467±17 nm) Red (640±10 nm)
Central 60° × 90 ° (V × H)
1, 10, 100 cd/m2
(continuous steps of increment)
13 s per intensity step, 39 s in total
Sustained pupil constriction at 13 s after constant illumination
Kankipati (2010) Blue (470 nm) Red (623 nm)
Central 60° 13 log quanta/cm2/s 10 s PIPR during 10-40 s after offset of stimuli
Fiegl (2011) Blue (488 nm) Red (610 nm)
Central 7.15° 14.2 log quanta/cm2/s
10 s exponential function of PIPR
Herbst (2011, 2012, 2013), Nissen (2012, 2014)
Blue (470 nm) Red (660 nm)
Not clearly described, presumably full-field or near full-field
300 cd/m2 20 s PIPR during 10-30 s after offset of stimuli
Park (2011), Kawasaki (2012)
Same as Kardon (2009,2011) 398 cd/m2 1 s PIPR at 6 s after offset of stimuli
Munch (2012) Same as Kardon (2009,2011) 14 log quanta/cm2/s 1 s and 30 s PIPR at 6 s after offset of stimuli
Roeckleina (2013) Blue (467.7 nm) Red (632.9 nm)
Central 29° 13.7 log quanta/cm2/s
30 s PIPR during 10-40 s after offset of stimuli
Table 2. Summary of Post-illumination Pupil Response (PIPR) Testing Conditions
Published in Literature
Among disease populations tested with chromatic pupillometry, patients with outer
retinal degeneration such as retinitis pigmentosa, Leber’s congenital amaurosis (LCA) and
achromatopsia show a reduced rod or cone-driven pupil response, but their melanopsin-driven
PIPR can be well preserved (Kardon, Anderson et al. 2009; Kardon, Anderson et al. 2011; Park,
Moura et al. 2011; Kawasaki, Crippa et al. 2012; Kawasaki, Munier et al. 2012), while patients
with inner retinal disease, such as glaucoma and optic neuropathy, may show impaired PIPR
(Feigl, Mattes et al. 2011; Kankipati, Girkin et al. 2011; Herbst, Sander et al. 2013; Nissen,
Sander et al. 2014). It is noteworthy that impaired PIPR was only observed in advanced
glaucoma but not in early glaucoma, indicating that melanopsin-containing ipRGCs are initially

31
relatively resilient to glaucomatous damage (Feigl, Mattes et al. 2011; Kankipati, Girkin et al.
2011). Roecklein and coworkers (Roecklein, Wong et al. 2013) reported that PIPR is reduced in
patients with seasonal affective disorder (SAD), a disease closely related to sun light exposure,
indicating an important role for melanopsin phototransduction in the genesis of SAD.
Chromatic pupillometry measurement of PIPR has also been used in basic science
research as an index of in vivo melanopsin activity. Roecklein and colleagues showed that certain
single nucleotide polymorphism (SNP) genotypes of melanopsin are associated with reduced
PIPR. This suggests that the genetic variations of melanopsin may have a functional impact on
melanopsin phototransduction (Roecklein, Wong et al. 2013). Mure and coworkers reported that
long duration pre-exposure to red light enhances the sustained pupil response and PIPR to blue
light in visually healthy human subjects. They claimed that the enhancing effect of red light on
PIPR was in vivo evidence of melanopsin bistability (Mure, Cornut et al. 2009).
Collectively, these data strongly suggest that chromatic pupillometry measurement of
PIPR has important applications for clinical and basic science research as an in vivo index of
melanopsin-driven intrinsic ipRGC photoactivity, which represents a novel aspect of inner retinal
function. However, the PIPR testing conditions reported in literature are highly variable: most of
the reported protocols employ a bright blue light stimulus of 10 s duration or longer presented to
dark-adapted eyes. This is obviously not patient-friendly for clinical use. Efforts to standardize
and optimize the methodology used for PIPR testing may further expand the application of the
chromatic pupillometry technique in basic science and clinical investigation.
32
1.7 Technical development: full-field chromatic pupillometry assessment of the melanopsin-driven post-illumination pupil response
1.7.1 Rationale for developing full-field chromatic pupillometry
Using chromatic pupillometry to measure PIPR holds promise as a new diagnostic and
therapeutic outcome measurement tool to assess the melanopsin-driven intrinsic photoactivity of
ipRGCs, which represents a whole new aspect of inner retinal function; however, the testing
conditions for PIPR have not been fully optimized. All existing studies (Gamlin, McDougal et al.
2007; Kardon, Anderson et al. 2009; Kankipati, Girkin et al. 2010; Kankipati, Girkin et al. 2011;
Kardon, Anderson et al. 2011; Nissen, Sander et al. 2011; Kawasaki, Crippa et al. 2012; Münch,
Léon et al. 2012) have used central-field blue-light stimulation of high intensity and long
duration to induce PIPR. The visual angle of the central-field stimuli ranged from 7.5° to
60°×90°, which is not ideal because it does not stimulate all ipRGCs, which are distributed
across the entire retina (Hattar, Liao et al. 2002). Given the photon-counting property of ipRGCs
to measure the retinal irradiance (Dacey, Liao et al. 2005), inadequate stimulation of the
peripheral retina may be a reason why all existing studies using central-field stimuli required
long duration stimulation (10-30 s) to induce a recordable PIPR. Although one protocol (Park,
Moura et al. 2011) reduced the duration of stimulation to 1 s, in our experience, most participants
still found it difficult to tolerate the stimulus especially at higher intensities, and they had
difficulties keeping their eyes open. While stimulus intensity and duration can be adjusted easily
in most of the previously described chromatic pupillometry systems, adjusting the stimulus
area/location has not been investigated. Such a methodology may potentially have important
clinical implications in diseases with localized inner retina damage such as glaucoma, branch
retina vein occlusion, maculopathy, and anterior ischemic optic neuropathy, among others.
Before I began my graduate study, I led a project as a research fellow in my current
supervisor’s lab to refine the existing PIPR testing methodologies by devising a reliable and
subject-friendly chromatic pupillometry protocol, where the intensity, duration and stimulus
area/location can be adjusted for investigations of clinical and basic science questions related to

33
melanopsin and ipRGCs. We sought to develop a full-field chromatic pupillometry apparatus,
and test this apparatus with a series of experiments on visually normal human subjects to
understand the characteristics of PIPR under full-field stimulation, and to address the hypothesis
that full-field stimulation can induce PIPR more efficiently than a previously described (Kardon,
Anderson et al. 2009) 60° × 90° central field stimulation. We also compared the single time point
post-illumination pupil measurement technique (Park, Moura et al. 2011) with prolonged
measurement as an index of PIPR. (Lei, Goltz et al. 2014)
1.7.2 Apparatus and experiment protocols
We modified a Ganzfeld screen originally designed for full-field ERG testing to present
monochromatic light stimuli (Blue: 467±17 nm, Red: 640±10 nm), and an infrared video eye
tracker (ViewPoint EyeTracker ® system, Arrington Research, Scottsdale, AZ) to monitor the
pupil response. This chromatic pupillometry apparatus was identical to that described in Kardon
and co-workers (Kardon, Anderson et al. 2009, Kardon, Anderson et al. 2011) and Park and
colleagues (Park, Moura et al. 2011) except for some modifications to our eye tracker. The scene
camera was removed to allow the participants to place their foreheads against the edge of the
Ganzfeld screen for full-field stimulation. To increase the quality of the eye tracking, an extra
miniature near-infrared illumination diode was added in front of each camera (peak wavelength
940 nm, radiant intensity 40 mW, 18° angle of emitted light; Fairchild Semiconductor, San Jose,
CA) to provide additional infrared illumination to each eye. The study consisted of two
experiments. Experiment 1 (intensity trials) compared the PIPR in response to full-field
stimulation of increasing intensities from 0.1 to 400 cd/m2 at a fixed 1 s duration. For
comparison, PIPR was also induced using a 60°×90° central-field blue stimulus of 400 cd/m2 as
used by Park and co-workers. (Park, Moura et al. 2011). Experiment 2 (duration trials) was
conducted on two separate days testing two specific flash intensities (100 cd/m2 red and blue
stimuli on one day and 400 cd/m2 red and blue stimuli on the second day) with ten different
durations from 4-1000 ms. The PIPR at various durations was compared for the two specific
intensities. All experiments were conducted during the day between 8 am and 2 pm.

34
1.7.3 Full-field vs. central field PIPR in intensity and duration trials
Ten visually-normal subjects were tested in each experiment. The results of experiment 1
(Figure 1) show that at all tested intensity steps, a melanopsin-silent red stimulus of 1 s duration
induced a rapid constriction of the pupil, which rapidly re-dilated to reach baseline about 10 s
after stimulus offset. In contrast, the blue stimulus of photopically-matched luminance induced
greater and more sustained pupil constriction overall. When the intensity of the stimulus was low
(0.1-1 cd/m2), however, the difference in the PIPR tracings between red and blue stimuli was
minimal, indicating that melanopsin is not adequately stimulated in this intensity range. As
intensity increased from 3.16 to 400 cd/m2, the PIPR were increasingly more sustained. When
central-field stimulation was compared with full-field stimulation, the PIPR induced by the 400
cd/m2 blue central-field stimuli (Figure 1l) was less sustained than the responses induced by 200
and 400 cd/m2 blue full-field stimuli (Figure 1j and 1k). The response induced by the 400 cd/m
2
blue central-field stimulation was comparable to those induced by the 100 and150 cd/m2 blue
full-field stimuli (Figure 2).

35
Figure 1. Mean normalized PIPR tracings from 1 s stimuli of varying intensity, Data from
10 visually-normal participants. Panels a-k show PIPRs to full-field red and blue stimuli at
11 intensity levels from 0.1 to 400 cd/m2. Panel l shows PIPRs to 400 cd/m
2 central-field
stimulation.

36
Figure 2. Comparison of PIPR induced using 400 cd/m2 central-field stimuli (dashed line)
vs 100-400 cd/m2 full-field stimuli. The response induced by the 400 cd/m
2 blue central-field
stimulation (dashed line) was comparable to those induced by the 100 and 150 cd/m2 blue
full-field stimuli (solid lines).
Using averaged pupil size from a 20 s interval from 10-30 s after the offset of stimulus as
PIPR index (PIPR(10-30s)), the greatest PIPR was induced with 400 cd/m2
blue full-field stimulus,
which was significantly greater than the PIPR induced by the 400 cd/m2 blue central-field
stimulus as shown in Figure 3. In contrast, during red stimulation (full and central-field), the
induced PIPR was small and did not differ significantly across all the stimulus intensities.

37
After the intensity trials, we conducted a duration trial at 100 cd/m2
and 400 cd/m2
intensity levels. With 400 cd/m2
blue stimuli, pupil constriction was increasingly sustained when
duration increased from 4 ms to 400 ms; however, further increases in duration (greater than 400
ms) did not result in a more sustained pupil response, as shown in Figure 4. This is verified
quantitatively by the mean PIPR(10-30 s), which increased gradually until the duration reached the
200 ms step, with last 5 duration steps (200 ms, 400 ms, 600 ms, 800 ms and 1000 ms) not
differing significantly among one another. The PIPR (10-30 s) induced by the last 4 duration steps
(400 ms, 600 ms, 800 ms and 1000 ms) of 400 cd/m2 full-field blue stimuli were significantly
greater than the PIPR (10-30 s) induced by 1000 ms central field blue stimulus. In contrast, with
100 cd/m2 blue stimulation, PIPR(10-30 s) increased monotonically with increased duration,
indicating that 100 cd/m2 blue stimuli were not strong enough to induce saturated PIPR for
durations between 4 to 1000 ms. The 100 and 400 cd/m2 red stimuli induced no or very little
PIPR(10-30 s) that did not change significantly with increased duration (Figure 5).

38
Figure 3. Mean normalized pupil size from 10 to 30 s post-stimulation offset (PIPR(10-30 s))
and pupil size at 6 s post-stimulation offset (PIPR(6 s)). The highest PIPR(10-30 s) was induced
by 1 s, 400 cd/m2 blue full-field stimuli, which was significantly greater than the mean
PIPR(10-30 s) induced by the 1 s, 400 cd/m2 blue central-field stimulus (far right column
indicated by the arrow). Bars represent ± SE.

39
Figure 4. Mean PIPR to 100 cd/m2 and 400 cd/m
2 full-field stimulation of varying duration
from 10 visually-normal observers.

40
Figure 5. PIPR(10-30 s) as a function of stimulus duration. Error bars represent ± 1 SE. Full-
field blue stimulation at 400 cd/m2 for 400-1000 ms induced significantly greater PIPR(10-30s)
than the central-field 400 cd/m2 stimulation for 1000 ms.
1.7.4 Implications: Relation between PIPR and stimulus intensity, duration and area
One of the major findings of this body of work is that a strong PIPR can be induced using
full-field stimulation of lower intensity and shorter duration than existing central-field protocols
(Park, Moura et al. 2011), confirming our prediction that full-field stimulation is more effective
in inducing PIPR. We used a modified eye tracker configuration to allow participants to be
positioned optimally for full-field stimulation. Although subjects were closer to the ColorDome

41
Ganzfeld screen when the eyes were simulated with full-field stimuli vs. central-field stimuli, the
difference in viewing distance between these conditions was only 75 mm. The physical
attenuation of light intensity over this distance is negligible, thus the stimulus light projected
onto the central part of the retina can be considered equally intense under both conditions. The
difference in PIPR induced by full-field vs. central-field conditions is most likely attributable to
additional retinal recruitment.
Our preliminary work is the first to demonstrate that a significant PIPR recordable 10-30
seconds after the offset of the stimulus can be induced in vivo with a strong blue flash of only a
few hundred milliseconds. Specifically, we found that PIPR from 10-30 seconds after stimulus
cessation became saturated at around 200-400 ms with 400 cd/m2 blue full-field stimuli.
Because 400 cd/m2 is the maximum intensity our apparatus can generate, it remains unknown
whether similarly strong PIPR can be induced with even shorter exposure if higher light
intensities were used, although higher light intensity will be more uncomfortable for the subjects,
particularly for photophobic patients.
In our experiment, detectable PIPR(10-30 s) emerged at around 3.16 cd/m2 (approximately
equivalent to 12 log quanta/cm2/s [Pianta and Kalloniatis 2000; Park, Moura et al. 2011] ) given
a mean resting pupil diameter of 6.4 mm in our subjects), and increased steadily with increasing
stimulus intensity up to 400 cd/m2 ( 14.3 log quanta/cm
2/s). The action spectrum of these
responses reconcile well with the observed dynamic range of melanopsin for 470 nm light in
vitro (Berson, Dunn et al. 2002; Dacey, Liao et al. 2005), and matches the response range of
PIPR induced with 10 s blue light stimulation in human subjects (approximately 12-15 log
quanta/cm2/s) (Gamlin, McDougal et al. 2007). In addition, the PIPR recorded in this pilot work
is selectively sensitive to short wavelength light; so both the sensitivity and kinetics are
consistent with the known features of the melanopsin-driven photoresponse in vitro (Berson,
Dunn et al. 2002; Dacey, Liao et al. 2005). These findings indicate that the PIPR induced with
our short duration testing conditions is most likely mediated by melanopsin-driven intrinsic
ipRGC activity.

42
Previous studies (Gamlin, McDougal et al. 2007; Kardon, Anderson et al. 2009;
Kankipati, Girkin et al. 2010; Feigl, Mattes et al. 2011; Kankipati, Girkin et al. 2011; Kardon,
Anderson et al. 2011; Münch, Léon et al. 2012) using central-field bright blue light stimuli of 10-
20 s duration induced a response profile characterized by a rapid pupil constriction upon stimulus
onset, followed by a sustained component of pupil constriction under constant illumination, then
a rapid dilation at stimulus offset, followed by a sustained post-illumination pupil constriction of
lesser magnitude. It is noteworthy that the characteristics of the pupillary responses to a short
bright blue flash used in the current study are fundamentally different: the response is
characterized by a rapid constriction that is sustained well after the offset, and lacking a rapid
dilation upon stimulus offset. The rapid dilation upon stimulus offset is likely due to the
photoreceptors’ (rods and cones) OFF pathway response being superimposed on the intrinsic
melanopsin-driven activity. This is supported by Gamlin’s study (Gamlin, McDougal et al. 2007)
where the OFF effect was recorded by both pupillometry and intracellular recording from
ipRGCs. When the synaptic input from the image-forming photoreceptors was blocked
pharmacologically, the OFF effect was absent (Berson, Dunn et al. 2002; Dacey, Liao et al. 2005;
Gamlin, McDougal et al. 2007). We hypothesize that under our testing conditions, the spikes of
intrinsic melanopsin-driven ipRGC firing occur after the offset of the blue flash, so that the
intrinsic firing can carry on without being affected by the activity of the OFF pathway. If this
hypothesis is true, PIPR induced by a short flash of blue light would represent a “pure” intrinsic
ipRGC activity that is not being “contaminated” by the image-forming photoreceptor OFF effect.
The data in these experiments also show that PIPR is a function of stimulus intensity,
duration and retinal area: higher intensity, longer duration and a larger stimulated retinal area all
contribute to a larger and more sustained PIPR. This phenomenon was expected considering the
precise photon-counting ability of ipRGCs that was first described in Dacey and colleagues’
study (Dacey, Liao et al. 2005), where a highly linear relation between the total number of cell
firing spikes and intensity (in log quanta/cm2/s) was demonstrated by intracellular recording. It
has been suggested that ipRGCs’ long, sparsely branching dendrites form a largely overlapping
network that cover the entire retina as an irradiance detector (Dacey, Liao et al. 2005). The
relation between PIPR and stimulus intensity, duration and retinal area delineated in our study

43
supports the idea that the ipRGC network codes intensity-dependent spatial and temporal
summation of retinal irradiance.
The ability of our protocol to induce a large PIPR with full-field stimulation of only 200-
400 ms is of considerable clinical significance. First, a short flash greatly decreases participants’
discomfort compared to long duration bright light stimulation in darkness. Second, a short flash
enhances the consistency of the amount light exposure, since it is practically impossible for
participants to keep their eyes open throughout a 10-20 s duration of bright light exposure. Eye
blinking and squinting causes inconsistent light exposure, and both can be largely avoided with
our protocol using a 200 to 400 ms short “flash”. The pupil constriction during light stimulation
is also minimized with a short flash, so the retinal irradiance during exposure is more consistent.
The shorter the exposure, the less likely it is that the pupillary response will be affected by other
factors such as attention, accommodation and fatigue (Kahneman and Beatty 1966; Kahneman
1973). Third, compared to central-field stimulation, full-field stimulation provides stimulation to
the entire retina, and may be useful in assessing ipRGC activity as an input signal to other
biological functions such as circadian rhythm regulation, or as an index of remaining inner
retinal function in end-stage diseases. The full-field saturating response may not be suitable for
all clinical or research applications, however, with an updated understanding of the relation
between PIPR and stimulus intensity, duration and area, investigators may also be able to tailor
their PIPR testing paradigm to target a particular basic research or clinical question.
In this pilot study, besides PIPR(10-30 s), we also evaluated another measurement interval as
an indicator of the post illumination pupil response: PIPR(6 s) which is defined as pupil size at 6 s
after the offset of light stimulus as previously described and recommended by Park and
coworkers (Park, Moura et al. 2011). The results showed that in both experiments, PIPR(6 s)
responses to blue stimuli of varying intensity and duration are less linear and plateaued much
earlier than those of PIPR(10-30 s). In contrast, red light stimulation, which primarily induces a
cone response, generated a slow increase in PIPR(6 s) with increasing intensity and duration. We
observed that the pupil response to red light stimulation subsided to a plateau near baseline levels
after 10 s post illumination. In addition, it has been well established that the response latency of
44
the melanopsin-driven ipRGC activity is typically several hundred milliseconds to several
seconds (Berson, Dunn et al. 2002; Dacey, Liao et al. 2005; Johnson, Wu et al. 2010) (negatively
associated with stimulus intensity), so at 6 seconds after the offset of light, the melanopsin may
not be fully activated yet, especially when the stimulus intensity is low. These results suggest
that at 6 s post illumination, there is still a significant proportion of cone-driven responses
contributing to the pupillary light response. In contrast, the PIPR(10-30 s) to red stimulation was
minimal at all stimulation levels. Furthermore, as discussed earlier, PIPR(10-30 s) induced in our
experiment closely matches the action range of melanopsin. Therefore we conclude that PIPR(10-
30 s) is the more appropriate index of the ipRGC-driven post illumination pupil responses tested.
In summary, compared to the existing protocols that used central-field stimulation, full-
field stimulation induces a large PIPR with lower stimulus intensities and dramatically shorter
durations, indicating that PIPR represents the information of an intensity-dependent spatial and
temporal summation of retinal irradiance coded by melanopsin-driven ipRGC activity. This
updated information about the relation between PIPR and stimulus intensity, duration and area
will allow us to tailor our PIPR testing paradigm to target a particular investigation question, and
greatly facilitate the development of a convenient and comfortable technique to assess ipRGC
function for emerging basic science and clinical investigations.

45
Chapter 2
2 Aims and Hypothesis
2.1 Introduction
This thesis consists of two separate studies. The first study (Chapter 3) is a
methodological study on the development of a novel chromatic pupillometry protocol to induce,
record and compare melanopsin-driven PIPR by stimulating different areas/locations of retina.
The second study (Chapter 4) implements the new PIPR testing protocol to investigate the in
vivo mechanism of melanopsin bistability.

46
2.2 Hemifield, Central-Field and Full-Field Chromatic Pupillometry for Assessing the Melanopsin-driven Post-illumination Pupil Response: A Methodological Study
Chromatic pupillometry testing of PIPR is an objective tool for assessing melanopsin-
containing retinal ganglion cell function (Gamlin, McDougal et al. 2007; Kardon, Anderson et al.
2009; Kardon, Anderson et al. 2011; Park, Moura et al. 2011), however, an optimal PIPR testing
protocol has not been developed yet. While stimulus intensity and duration can be adjusted easily
in most of the previously described chromatic pupillometry systems (Gamlin, McDougal et al.
2007; Kardon, Anderson et al. 2009; Mure, Cornut et al. 2009; Kankipati, Girkin et al. 2010;
Feigl, Mattes et al. 2011; Kankipati, Girkin et al. 2011; Nissen, Sander et al. 2011; Roecklein,
Wong et al. 2013; Nissen, Sander et al. 2014), adjusting the stimulus area/location has not been
investigated. Such a methodology may potentially have important clinical implications. Based on
a full-field, high intensity, short duration PIPR testing protocol determined previously, (Lei,
Goltz et al. 2014) this study aims to further develop a novel chromatic pupillometry device,
where a monochromatic light stimulus can be directed to specific areas/regions of the retina to
induce melanopsin-driven PIPR. This device will be evaluated by testing upper and lower
hemifield, central-field, and full-field PIPR in a group of visually normal subjects. Given that
melanopsin-driven ipRGC intrinsic photoactivity is responsible for detecting light irradiance,
(Berson 2003; Dacey, Liao et al. 2005; Fu, Liao et al. 2005; Wong, Dunn et al. 2005; Do, Kang
et al. 2009) We hypothesize that hemifields, central field and full-field stimulation will induce
increasingly larger PIPR, and that upper and lower hemifield PIPR will be symmetric in normal
subjects. The test-retest reliability of hemifields, central-field and full-fields PIPR will also be
evaluated.

47
2.3 The effect of red light exposure on pre-existing PIPR: Implementing PIPR as an in-vivo index of melanopsin photoactivity in basic science research
Melanopsin is a vitamin A-based opsin employing 11-cis-retinal as its chromophore
(Provencio, Jiang et al. 1998). After absorbing a photon, 11-cis-retinal is photoisomerized into
all-trans-retinal, causing conformational changes in the melanopsin which lead to the formation
of “meta-melanopsin” (the activated iso-form of melanopsin) and subsequently trigger
phototransduction cascade in the melanopsin-containing ipRGCs (Walker, Brown et al. 2008).
Subsequently, the all-trans-retinal chromophore of melanopsin has to be converted back to 11-
cis-retinal in order to maintain ipRGC photosensitivity. Unlike rod and cone photoreceptors that
rely on the visual cycle in RPE cells to regenerate 11-cis-retinal, melanopsin containing ipRGCs
are located in the inner retina; it is still unclear how ipRGCs regenerate their melanopsin
chromophore in vivo without easy access to the supply of 11-cis-retinal from RPE. A growing
body of literature (Lucas 2006; Mure, Rieux et al. 2007; Rollag 2008; Mure, Cornut et al. 2009;
Matsuyama, Yamashita et al. 2012; Sexton, Golczak et al. 2012) suggests that the activated all-
trans-retinal could be photoisomerized back to 11-cis-retinal by absorbing photon energy at a
different wavelength. This photo-driven switchable state of chromophore is call “opsin
bistability”.
While there is consensus that melanopsin activation (forward reaction) is selectively
sensitive to short wavelength light, with maximum absorption being at around 480 nm (Berson,
Dunn et al. 2002; Dacey, Liao et al. 2005; Gamlin, McDougal et al. 2007; Do, Kang et al. 2009;
Mure, Cornut et al. 2009; Do and Yau 2010), conflicting evidence exists regarding the spectral
sensitivity of melanopsin photo-regeneration (backward reaction) (Mure, Rieux et al. 2007;
Mawad and Van Gelder 2008; Rollag 2008; Mure, Cornut et al. 2009; Matsuyama, Yamashita et
al. 2012). Mure and co-workers (Mure, Rieux et al. 2007; Mure, Cornut et al. 2009) provided in
vivo evidence that pre-exposure to long-wavelength red light potentiates the photo response to
short-wavelength light (as measured by spiking of SCN neurons, the pupillary light reflex and
the negative masking effect), a feature of bistable opsin. By computing the spectral tuning of red
light potentiation of the sustained pupil response to blue light, they reported that the putative

48
spectral sensitivity of meta-melanopsin is red-shifted, with maximal absorption at 587 nm (Mure,
Cornut et al. 2009). However, a similar paradigm failed to induce potentiation in ipRGCs cells
firing in an in vitro experiment (Mawad and Van Gelder 2008), which argues against this “blue
forward, red backward” hypothesis. Furthermore, a recent photochemical study on purified rat
melanopsin protein showed that melanopsin and meta-melanopsin have essentially overlapping
spectral sensitivity, with both peaking in the range of blue light (467 vs. 476 nm), (Matsuyama,
Yamashita et al. 2012) but so far there is no in vivo evidence to support this “blue-forward, blue-
backward” theory.
The activation of melanopsin drives a persistent firing of ipRGCs resulting in a pro-
longed PIPR (Gamlin, McDougal et al. 2007), which is an in vivo index of melanopsin
photoactivity (Kankipati, Girkin et al. 2010; Feigl, Mattes et al. 2011; Herbst, Sander et al. 2011;
Kankipati, Girkin et al. 2011; Nissen, Sander et al. 2011; Park, Moura et al. 2011; Herbst, Sander
et al. 2012; Kawasaki, Crippa et al. 2012; Kawasaki, Munier et al. 2012; Münch, Léon et al.
2012; Herbst, Sander et al. 2013; Roecklein, Wong et al. 2013; Lei, Goltz et al. 2014; Nissen,
Sander et al. 2014; Lei, Goltz et al. 2015). In order to provide in vivo evidence for the
mechanism of melanopsin chromophore photo-regeneration, this study employs a blue-red
“double flash” experimental chromatic pupillometry paradigm to investigate the effect of red
light exposure on pre-existing PIPR induced by blue light. Based on the assumption that
subsequent absorption of light energy converts the activated melanopsin back to its resting state
resulting in attenuated PIPR, it is predicted that if the “red-light-reversing” theory is true, red
light exposure presented after a melanopsin-activating blue light stimulus will attenuate the blue-
light-induced PIPR.
49
Chapter 3
3 Hemifield, Central-Field and Full-Field Chromatic Pupillometry for Assessing the Melanopsin-driven Post-illumination Pupil Response
3.1 Introduction
While measuring PIPR using chromatic pupillometry holds promise as an objective
means of assessing melanopsin-containing retinal ganglion cell function independent of
photoreceptors, (Kawasaki and Kardon 2007; Kardon, Anderson et al. 2009; Kankipati, Girkin et
al. 2010; Feigl, Mattes et al. 2011; Kankipati, Girkin et al. 2011; Kardon, Anderson et al. 2011;
Park, Moura et al. 2011; Kawasaki, Crippa et al. 2012; Kawasaki, Munier et al. 2012; Roecklein,
Wong et al. 2013; Lei, Goltz et al. 2014; Nissen, Sander et al. 2014), consensus has not yet been
reached on a standardized clinical protocol. Originally, PIPR was induced with prolonged
exposure to high intensity short wavelength light (duration ranging from a few seconds to a few
minutes) (Gamlin, McDougal et al. 2007; Kardon, Anderson et al. 2009; Mure, Cornut et al.
2009; Kankipati, Girkin et al. 2010; Feigl, Mattes et al. 2011; Kankipati, Girkin et al. 2011;
Nissen, Sander et al. 2011; Roecklein, Wong et al. 2013; Nissen, Sander et al. 2014), which is
not practical as a clinical test. Recently, we described a chromatic pupillometry apparatus and
testing conditions that can induce a large PIPR with a full-field blue light flash of only a few
hundred milliseconds, and we found that PIPR is a function of stimulus intensity, duration and
retinal area stimulated. (Lei, Goltz et al. 2014) While stimulus intensity and duration can be
adjusted easily in most of the previously described chromatic pupillometry systems, adjusting the
stimulus area/location has not been investigated. Such a methodology may potentially have
important clinical implication in diseases with localized inner retina damage such as glaucoma,
branch retina vein occlusion, maculopathy, and anterior ischemic optic neuropathy, among others.
The first goal of this study was to develop a PIPR testing method in which stimulation
area/location can be adjusted to present hemifield, central-field and full-field stimulation. It is
predicted that hemifields, central field and full-field stimulation will induce increasingly larger

50
PIPR, and that upper and lower hemifield PIPR will be symmetric in normal subjects. The
second goal was to validate this PIPR testing method by evaluating the test-retest reliability of
hemifield, central-field and full-field PIPR in visually normal subjects.

51
3.2 Methods
3.2.1 Participants
Ten visually-normal subjects who had normal or corrected-to-normal vision (20/20
Snellen visual acuity or better) participated in the study (6 females, mean age 30 years, age range
19-56 years). All participants underwent a screening ophthalmology exam, which include visual
acuity, contrast sensitivity, eye position and movement tests, colour vision assessment (HRR test,
Richmond Products, NM, USA), intraocular pressure assessment using slit-lamp tonometry, slit-
lamp assessment of iris structures, anterior chamber angle and non-dilated fundus exam.
Inclusion criteria include: 1). Age from 17 to 70 years; 2). Corrected visual acuity of 20/20 or
better; 3). Refractive error between +5.00D to -5.00D spherical equivalent; 4). No known visual
abnormalities. Exclusion criteria include:
1. Intraocular surgery
2. Eye trauma
3. Optic neuropathy
4. Glaucoma
5. Shallow anterior chamber
6. Narrow angle
7. Uveitis
8. Diabetic neuropathy
9. Retinal detachment
10. Myopia greater than -5.00D
11. Hyperopia greater than +5.00D
12. Any other conditions that may compromise the integrity of the pupillary light
reflex pathway upstream of the retina
The experiments were conducted monocularly, with the right eye being stimulated and
recorded. The left eye was patched. The study was approved by the Research Ethics Board at
The Hospital for Sick Children. All the procedures adhered to the guidelines of the Declaration
of Helsinki. Informed consent was obtained from each participant.
3.2.2 Apparatus
The chromatic pupillometry system consisted of two components, a Ganzfeld screen and
an infrared video-based spectacle frame-mounted eye tracker. The Ganzfeld screen (Espion V5
system with the ColorDome LED full-field stimulator; Diagnosys LLC, Lowell, MA) that was

52
originally designed for full-field ERG testing was used to present full-field light stimulation.
This Ganzfeld screen can generate a wide range of flash intensities from 0.0001 to 400 cd/m2 (-4
to 2.6 log) for blue (467±17 nm) light and 0.0001 to >400 cd/m2 (-4 to >2.6 log) for red (640±10
nm) light. The binocular eye-tracking camera system used near-infrared (940 nm) illuminating
diodes (Arrington Research, Scottsdale, AZ) to record the changes in pupil diameter at a
sampling rate of 60 Hz. The chromatic pupillometry hardware was identical to that described in
Kardon and co-workers (Kardon, Anderson et al. 2009; Kardon, Anderson et al. 2011) and Park
and colleagues (Park, Moura et al. 2011) except for some modifications to our eye tracker: the
scene camera was removed to allow the participants to place their forehead against the edge of
the Ganzfeld screen for full-field stimulation. (Figure 6)
An additional shutter panel was custom-built to present central-field and hemifield
stimuli. The shutter panel has a back plate with a round opening of 50 mm in diameter (the size
of the opening can be changed by changing the back plate), which resulted in 30° central field
stimulation when positioned 95 mm away from the subject’s eye. A removable rectangular

53
Figure 6. Full-field chromatic pupillometry system. (A) Author wearing the Arrington eye
tracker with miniature infrared LEDs and cameras. (B) Pupil size is monitored with a
video-based eye tracker at a sample rate of 60 Hz. (C, D) Full-field blue and red light
stimulation presented with the Colordome Ganzfeld screen.
hemifield occluder can be inserted in the front of the shutter panel to block the upper or lower
half of the 30° central field (Figure 7). In order to ensure the hemifield stimulation was aligned

54
Figure 7. The shutter panel apparatus. The shutter panel comprises 3 components: (1)
main frame; (2) back plate with 50 mm diameter opening; and (3) hemifield occluder with
2 horizontally-aligned red LEDs on both the upper and lower edges. When hemifield
stimulation is presented, the shutter panel is attached to the opening of Ganzfeld dome. The
participant is instructed to align the center fixation LED in the back of the Ganzfeld dome
in the middle between the 2 horizontally-aligned LEDs on the edge of the hemifield
occluder. The illumination of the occluder LEDs is controlled by a toggle switch. For full-
field stimulation, the shutter device is removed and the forehead of the subject rests against
the edge of the Ganzfeld dome.
accurately, two red mini LED lights (3 mm in diameter) were installed on the upper and lower
edge of the hemifield occluder. For example, to stimulate the upper hemifield, the hemifield

55
occluder was positioned at the bottom of the panel to block the lower half of the central opening.
Two red LED lights on the upper edge of the hemifield occluder flanked the central fixation red
LED light in the Ganzfeld screen. The subject was instructed to align all three lights while
maintaining fixation on the central one, thereby ensuring that only one half of the 30° central
field was stimulated.
3.2.3 Experimental Conditions and Procedure
Prior to the experiment, subjects were exposed to an indoor laboratory environment with
ambient lighting levels ranging from 80-400 lux for at least 2 hours. During the pupillometry
recordings, participants were seated in a darkened room (0 lux) with their head rested on a
chinrest. The Ganzfeld was positioned 95 mm away from the participant’s eyes (measured from
the shutter panel) during the presentation of blue light (467±17 nm) for lower hemifield, upper
hemifield and 30° central-field stimulation. The order of the three conditions was randomized.
The shutter panel was then removed and the subject was repositioned closer to the Ganzfeld
screen, with the forehead touching the upper edge of the Ganzfeld screen opening, then full-field
red (640±10 nm) and blue stimulation was presented. Experimental trials were always initiated
with 10 s of dim amber light (590 ± 7 nm, 0.3 cd/m2) pre-exposure (to ensure precisely 90 s of
dark adaptation before each light stimulation), followed by 90 s of dark adaptation, which was
then followed by red or blue light stimulation (400 cd/m2, 400 ms) in darkness. The pupillary
response was recorded in real-time at 60 Hz, starting from 5 s prior to the onset of light
stimulation until 35 s after its offset. The overhead room lighting (200 lux) was turned on
afterwards and the participants were allowed to take a short break (30 s to 2 minutes) before
starting another trial to prevent carry-over effects and fatigue. Each condition was repeated 3
times in experiment session 1. Within one month of the first session, a second session was
carried out during which all subjects were tested with lower and upper hemifield stimulation only,
with each condition repeated 3 times in randomized order. All experiments were conducted
during the day between 8 am and 2 pm.
56
3.2.4 Data Analysis
Data from the eye tracker were analyzed offline using a custom-written script (MatLab;
MathWorks Inc., Natick, MA). A median (window length of 0.5 s) and low-pass filter (fourth-
order, zero-phase Butterworth) with a cut-off frequency of 5 Hz were applied to remove eye
blink artifacts. The filtered data were inspected visually in a graphical user interface (GUI) to
ensure data quality and detect artifacts. The filtered data were then normalized to the baseline
pupil size calculated from the mean pupil size during a 5 s period before the onset of each
stimulus (i.e., Normalized pupil size = Absolute pupil size / Baseline pupil size). Two parameters
were measured: (1) PIPR—mean pupil size over a 20 s interval from 10-30 s after the offset of
light stimulation. Our previous work found that the cone-driven pupil responses subsided within
10 s after the offset of light stimuli, so this measurement is expected to represent “pure”
melanopsin activity. (2) Maximal Pupil Constriction (MPC)—the smallest pupil size following
light stimulation. This parameter primarily represents the rapid phase pupil constriction driven
by rods and cones, but may receive melanopsin influence under certain conditions (Lucas, Hattar
et al. 2003; Panda, Provencio et al. 2003; McDougal and Gamlin 2010). For both parameters, a
smaller value represents greater pupil constriction.
Statistical analyses were performed using SPSS 19.0 (IBM Corporation. Armonk, NY).
Differences in mean PIPR and MPC were compared using separate one-way repeated measures
ANOVAs across 5 different testing conditions: (1) lower hemifield (lower half of the central 30°
field) stimulation using blue light (400ms, 400cd/m2); (2) upper hemifield (upper half of the
central 30° field) stimulation using blue light (400ms, 400cd/m2); (3) central-field (both halves
of the central 30° field) stimulation using blue light (400ms, 400cd/m2); (4) full-field stimulation
using blue light (400ms, 400cd/m2); and (5) full-field stimulation using red light (400ms,
400cd/m2). Within each condition, the means of each repeated test were also compared using
one-way repeated measures ANOVA. All post hoc pairwise comparisons were adjusted for
multiple comparisons using the Bonferroni method. A p value of <0.05 was considered
statistically significant.

57
The hemifield PIPR and MPC measurements of the two recording sessions (session 1:
tests 1-3 vs. session 2: tests 4-6) were compared using paired sample t tests and Pearson
correlation.
The intra-subject coefficient of variation (CV) for PIPR and MPC were calculated for
each subject, then the median and range of CV from all 10 subjects were reported for each
condition. The CV is analogous to the signal-to-noise ratio, and is defined in this context as the
ratio of the standard deviation (SD) of the repeated measures of PIPR (or MPC) to the mean
changes of pupil diameter: CV (PIPR) = SD/ (1- mean PIPR) and CV (MPC)= SD/ (1- mean
MPC). The correlation between repeated tests was reported as the intra-class correlation
coefficient (ICC) along with its 95% confidence interval. The ICC assesses measurement
reliability by comparing the variability of different measures on the same subject to the total
variation across all measures and all subjects. (Vincent and Weir 1994; Shand and Foster 1999;
Barrett 2001) The formula for the ICC is: Var (B)-Var (W)/Var (B) + Var (W), where Var (W) is
the pooled variance within subjects, and Var (B) is the variance of the measurements between
subjects. Three different models of ICC were calculated for PIPR and MPC from all conditions:
(MacLennan 1993) (1) ICC(1,1)—one-way random single measure i.e., measures were randomly
repeated on each subject with reliability calculated from a single measurement; (2) ICC(1,3)—as
above, but with reliability calculated by taking the average of 3 random measurements; and (3)
ICC(1,6)—for the hemifield conditions, the extra 3 repeated measurements from the second
session were combined with the first 3 repeated measurement to calculate ICC(1,6) with
reliability calculated by taking the average of 6 random measurements.

58
3.3 Results
3.3.1 Post-Illumination Pupil Response (PIPR)
PIPR values for each test trial and mean pupil responses from the 5 stimulation
conditions are shown in Table 3 and Figure 8 respectively. There were significant differences in
mean PIPR between the 5 conditions (F(4, 36) =62.68, p<0.001). Post-hoc analysis revealed no
statistically significant difference in PIPR between the mean of upper and lower hemifield
stimulation (p=0.996), the waveforms of which were largely overlapping. The hemifield PIPR
measures from the two sessions (session 1: tests 1-3 vs. session 2: tests 4-6) were highly
correlated—there was no statistically significant difference between the hemifield PIPR from
session 1 and session 2: the lower hemifield PIPR from session 1 was 0.91±0.05 (mean±SD) and
0.90±0.04 from session 2 (p=0.55, Pearson’s r = 0.81); the upper hemifield PIPR from session 1
was 0.90±0.04 and 0.90±0.05 from session 2 (p=0.63, Pearson’s r = 0.79). Full-field blue PIPR
was significantly greater than that of central-field and hemifield responses (p<0.001); however,
the differences between central-field PIPR and upper/lower hemifield PIPRs did not reach
statistical significance (p=0.069 and 0.078 respectively). Full-field red stimulation induced
significantly smaller PIPR than the blue stimulation across all conditions. All p values of
pairwise comparisons of PIPR are summarized in Table 4.
The coefficient of variation and intra-class correlation coefficient data for each condition
are shown in Table 5. The first three repetitions of PIPR for the upper and lower hemifield
stimulations had ICC(1,3) means of 0.63 and 0.77 respectively. To test if more repetitions would
increase the mean ICC, we repeated upper and lower hemifield stimulation 3 additional times in
a second experimental session. After combining 6 repeated hemifield tests, the ICC(1,6)
increased to 0.87 for the lower hemifield and 0.88 for the upper hemifield.

59
Figure 8. Mean hemifield, central-field and full-field PIPR from 10 visually-normal
subjects. Pupil diameter data were normalized to the mean of 5 s of baseline recording
prior to the onset of blue or red light stimulation (400ms, 400cd/m2). Figure 2a, mean pupil
response tracings for the 5 stimulation conditions; Figure 2b and 2c, mean PIPR pupil size
changes (1-PIPR) and mean MPC pupil size changes (1-MPC). The 2 sessions of hemifield
recording are plotted separately, designated as “#1” and “#2”. Error bars represent
standard error (SE). LHF, Lower Hemifield; UHF, Upper Hemifield; CF, Central-field;
and FF, Full-field.
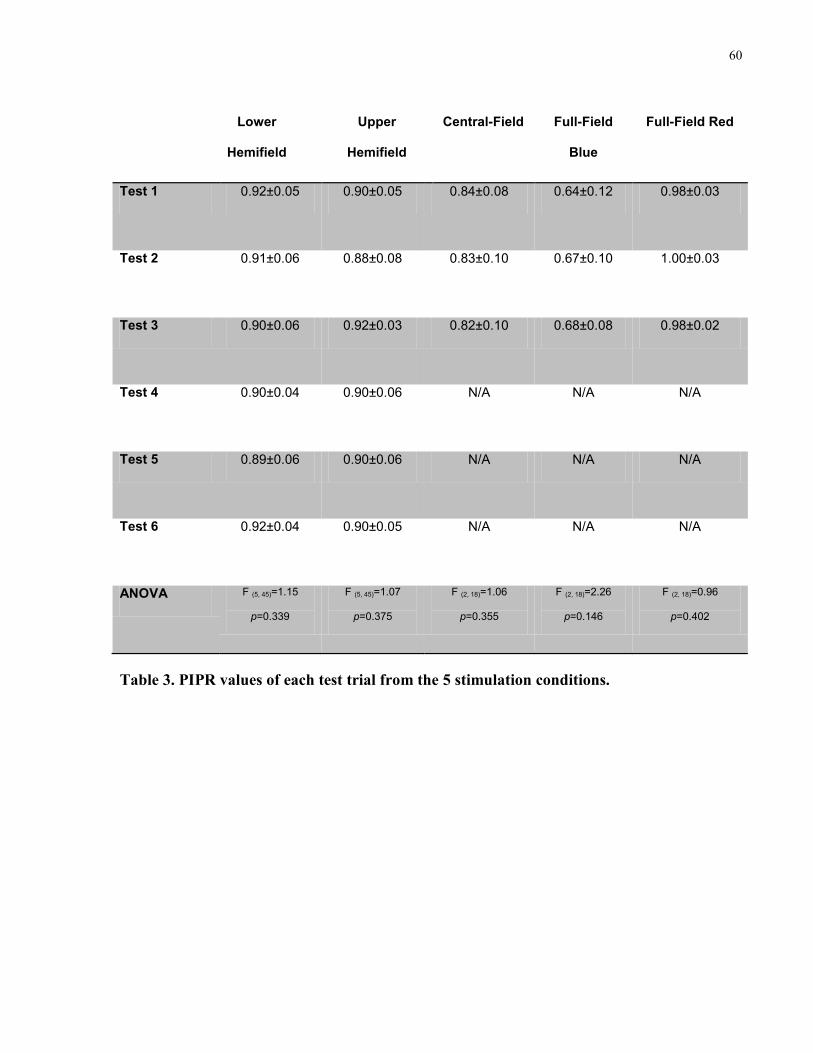
60
Lower
Hemifield
Upper
Hemifield
Central-Field Full-Field
Blue
Full-Field Red
Test 1 0.92±0.05 0.90±0.05 0.84±0.08 0.64±0.12 0.98±0.03
Test 2 0.91±0.06 0.88±0.08 0.83±0.10 0.67±0.10 1.00±0.03
Test 3 0.90±0.06 0.92±0.03 0.82±0.10 0.68±0.08 0.98±0.02
Test 4 0.90±0.04 0.90±0.06 N/A N/A N/A
Test 5 0.89±0.06 0.90±0.06 N/A N/A N/A
Test 6 0.92±0.04 0.90±0.05 N/A N/A N/A
ANOVA F (5, 45)=1.15
p=0.339
F (5, 45)=1.07
p=0.375
F (2, 18)=1.06
p=0.355
F (2, 18)=2.26
p=0.146
F (2, 18)=0.96
p=0.402
Table 3. PIPR values of each test trial from the 5 stimulation conditions.

61
Lower Hemifield
PIPR = 0.91±0.04
Upper Hemifield
PIPR = 0.90±0.04
Central-field
PIPR = 0.83±0.09
Full-field Blue
PIPR = 0.66±0.09
Upper Hemifield
PIPR = 0.90±0.04
p=0.996
Central-field
PIPR = 0.83±0.09
p=0.078 p=0.069
Full-field Blue
PIPR = 0.66±0.09
p<0.001 p<0.001 p<0.001
Full-field Red
PIPR = 0.99±0.01
p=0.003 p=0.004 p=0.004 p<0.001
Table 4. Mean PIPR and p values for pairwise comparisons during the 5 testing conditions.
Mean PIPR ± standard deviation from 10 individual participants’ data obtained by
averaging 6 repeated tests from each hemifield condition and 3 repetitions for central-field
and full-field conditions. p values (in italics) were obtained by post-hoc analysis of one-way
repeated measures ANOVA, adjusted for multiple comparisons by Bonferroni correction.
Significant p values are denoted in bold.

62
Lower
Hemifield
Upper
Hemifield
Central-Field Full-Field
Blue
Full-Field Red
Median CV
(range)
0.38
(0.06, 0.62)
0.30
(0.04, 0.57)
0.16
(0.02, 0.27)
0.10
(0.04,0.23)
0.87
(-809.30, 3.36)
ICC(1,1)
(CI 95%)
0.53
(0.14, 0.83)
0.36
(0.01, 0.74)
0.87
(0.69, 0.96)
0.84
(0.60,0.95)
-0.26
(-0.42, 0.15)
ICC(1,3)
(CI 95%)
0.77
(0.32, 0.94)
0.63
(0.02, 0.90)
0.95
(0.87, 0.99)
0.94
(0.83,0.98)
-0.44
(-1.68, 0.48)
ICC(1,6)
(CI 95%)
0.87
(0.69, 0.96)
0.88
(0.71, 0.97)
N/A N/A
N/A
Table 5. Test-retest reliability of PIPR measured during hemifield, central-field and full-
field stimulation. Intra-subject coefficient of variation (CV) = SD/(1- mean PIPR). This
measure was calculated using 6 trial repetitions for hemifield conditions and 3 repetitions
for central-field and full-field conditions. The median and range for 10 individual subjects
are reported. ICC(1,1) and ICC(1,3) were calculated from 3 repetitions. ICC(1,6) for the
hemifield conditions was calculated by combining 6 repetitions across 2 sessions. (CI, 95%
confidence interval)

63
3.3.2 Maximal Pupil Constriction (MPC).
Similar to hemifield PIPR, the hemifield MPC measures from the two sessions were also
highly correlated—there was no statistically significant difference between the hemifield MPCs
from session 1 and session 2: the lower hemifield MPC of session 1 was 0.60±0.04 and
0.60±0.05 for session 2 (p=0.88, Pearson’s r = 0.85); the upper hemifield PIPRs from session 1
were 0.59±0.05 and 0.60±0.04 for session 2 (p=0.59, Pearson’s r = 0.82).
MPC values for each test trial are shown in Table 6. There was a significant difference
between the five conditions for mean MPC (F(4, 36) =68.24, p<0.001). The differences in mean
MPC in all pairwise comparisons were statistically significant except for upper hemifield vs.
lower hemifield (p=0.998) and lower hemifield vs. full-field red stimulation (p=0.104). All p
values for the pairwise comparisons of MPC are summarized in Table 7. The coefficient of
variation and intra-class correlation coefficient data for each condition are shown in Table 8.
The first three repetitions of MPC for the lower and upper hemifield stimulations had mean
ICC(1,3) of 0.92 and 0.93 respectively. After combining 6 repeated hemifield tests, the ICC(1,6)
increased to 0.95 for the lower hemifield and 0.94 for the upper hemifield.
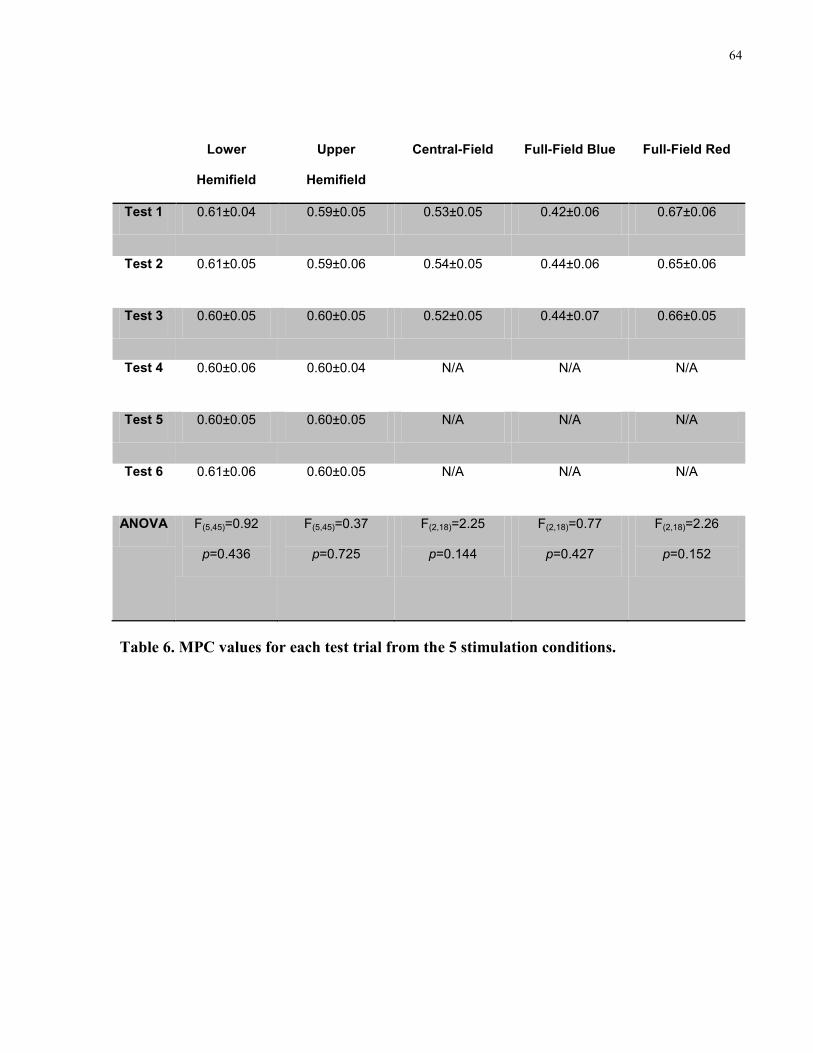
64
Lower
Hemifield
Upper
Hemifield
Central-Field Full-Field Blue Full-Field Red
Test 1 0.61±0.04 0.59±0.05 0.53±0.05 0.42±0.06 0.67±0.06
Test 2 0.61±0.05 0.59±0.06 0.54±0.05 0.44±0.06 0.65±0.06
Test 3 0.60±0.05 0.60±0.05 0.52±0.05 0.44±0.07 0.66±0.05
Test 4 0.60±0.06 0.60±0.04 N/A N/A N/A
Test 5 0.60±0.05 0.60±0.05 N/A N/A N/A
Test 6 0.61±0.06 0.60±0.05 N/A N/A N/A
ANOVA F(5,45)=0.92
p=0.436
F(5,45)=0.37
p=0.725
F(2,18)=2.25
p=0.144
F(2,18)=0.77
p=0.427
F(2,18)=2.26
p=0.152
Table 6. MPC values for each test trial from the 5 stimulation conditions.

65
Lower Hemifield
MPC = 0.60±0.05
Upper Hemifield
MPC = 0.60±0.04
Central-field
MPC = 0.33±0.04
Full-field Blue
MPC = 0.43±0.06
Upper Hemifield
MPC = 0.60±0.04
p=0.998
Central-field
MPC = 0.33±0.04
p=0.001 p=0.001
Full-field Blue
MPC = 0.43±0.06
p<0.001 p=0.001 p<0.001
Full-field Red
MPC = 0.66±0.05
p=0.104 p=0.042 p=0.001 p<0.001
Table 7. Mean MPC and p values for pairwise comparisons during the 5 testing conditions.
Mean MPC ± standard deviation from 10 individual participants’ data obtained by
averaging 6 repeated tests from the individual hemifield conditions and 3 repetitions for
central-field and full-field conditions. p values (in italics) were obtained by post-hoc
analysis of one-way repeated measures ANOVA, adjusted for multiple comparisons by
Bonferroni correction. Significant p values are denoted in bold.

66
Lower
Hemifield
Upper
Hemifield
Central-Field Full-Field
Blue
Full-Field Red
Median CV
(range)
0.06
(0.10, 0.04)
0.05
(0.11, 0.02)
0.05
(0.11, 0.01)
0.02
(0.04, 0.01)
0.04
(0.11, 0.01)
ICC(1.1)
(CI95%)
0.79
(0.51, 0.94)
0.86
(0.66, 0.96)
0.70
(0.38, 0.90)
0.76
(0.46, 0.92)
0.88
(0.70, 0.97)
ICC(1.3)
(CI95%)
0.92
(0.76, 0.98)
0.93
(0.85, 0.97)
0.88
(0.64, 0.97)
0.90
(0.72, 0.97)
0.90
(0.72, 0.97)
ICC(1.6)
(CI95%)
0.95
(0.89, 0.99)
0.94
(0.86, 0.98)
N/A N/A N/A
Table 8. Test-retest reliability of MPC measured during hemifield, central-field and full-
field stimulation. Intra-subject coefficient of variation (CV) = SD/(1- mean MPC). This
measure was calculated using 6 trial repetitions for the hemifield conditions and 3
repetitions for the central-field and full-field conditions. The median and range for 10
individual subjects are reported. ICC(1.1) and ICC(1.3) were calculated from 3 repetitions.
ICC(1.6) for the hemifield conditions was calculated by combining 6 repetitions across 2
sessions. (CI, 95% confidence interval)

67
3.4 Discussion
This study described a simple device designed and constructed to work with a
commercially available Ganzfeld stimulator to induce hemifield, central-field and full-field PIPR.
This device is easy to install and remove without alteration to the structure or function of the
Ganzfeld stimulator itself. The test is well tolerated by the participants. With 400 cd/m2, 400 ms
blue light stimuli, we recorded differentiable PIPR and MPC from 10 visually normal subjects
and found that the hemifield, 30° central-field and full-field stimuli induced increasingly larger
PIPR and MPC. These findings are consistent with our previous observation that PIPR is a
function of stimulus intensity, duration, and in particular, retinal area stimulated (Lei, Goltz et al.
2014). As we expected, mean responses of upper and lower hemifield stimulation are highly
symmetric, indicating that there is no systematic bias in our hemifield stimulation apparatus nor
in our normal subjects.
In this study, we used intra-class correlation coefficient (ICC) as our assessment measure
of test-retest reliability. ICC describes how closely a set of repeated measurements resemble each
other. It quantifies the direction (+/-) and the strength of the relation between test-retest scores by
estimating their linear relation, yielding a value between +1 and -1.24. It has been suggested that,
as a general rule, a value of over 0.90 is considered high, between 0.80 and 0.90 as moderate,
and under 0.80 as low reliability for using an instrument for individual decision-making (Shrout
and Fleiss 1979; Vincent and Weir 1994; Lei, Goltz et al. 2014). Herbst and co-workers (Herbst,
Sander et al. 2011) described a custom-built chromatic pupillometry system using 20 s of
continuous bright blue light (300 cd/m2) to induce PIPR, but the area of stimulation was not
specified. After analyzing 2 repeated measurements of PIPR, they reported an ICC of 0.80. In
this study, for full-field stimulation, we achieved single measure PIPR reliability of 0.84 and
excellent reliability of 0.94 after averaging 3 measures. Similarly, for 30° central-field
stimulation, we obtained single measure PIPR reliability of 0.87 and excellent reliability of 0.95
after averaging 3 measures. The better reliability we observed may be attributed to the properties
of our testing method. First, the duration of the light stimuli we used was substantially shorter
(400 ms vs. 20 s), which minimizes the effect of eye blinking and squinting, resulting in more

68
consistent light exposure between trials. Second, the intensity of the light stimuli we used was
higher (400 cd/m2 vs. 300 cd/m
2), which induced a larger and more reliable PIPR.
For hemifield stimulation, however, not only is the PIPR amplitude smaller, the test-
retest reliability is also substantially lower than that during central-field and full-field stimulation.
Given the fixed intensity and duration of stimuli we used, as well as the smaller area of
stimulation, the PIPR amplitude from either hemifield is expected to be smaller than that from
central-field or full-field stimulation. The smaller amplitude of pupil constriction during the 10 to
30 s post-illumination interval following hemifield stimulation makes it more susceptible to
changes induced by loss of mental engagement and other natural fluctuations of pupil
contractility (Kahneman and Beatty 1966; Kahneman 1973; McLaren, Erie et al. 1992), which
may lead to a reduced signal-to-noise ratio. To test whether using more repeated measures would
achieve acceptable test-retest reliability, we added 3 more trials for upper and lower hemifield
stimulation. The ICC for 6 averaged measures increased to 0.87 (from 0.63 for 3 measures) for
lower hemifield and to 0.88 (from 0.77 for 3 measures) for upper hemifield, which is considered
moderate reliability and is generally acceptable for clinical use (Shrout and Fleiss 1979; Vincent
and Weir 1994). These findings emphasize the need to use the mean of multiple trials as the
index when the PIPR values are expected to be small.
Measuring PIPR as an index of melanopsin-driven ipRGC activity is a promising new
tool to assess inner retinal function independent of conventional photoreceptors (rods and cones).
Using predominately central field focal chromatic stimulation, Kardon and coworkers provided
evidence that a clinical chromatic pupillometry protocol could assess differentially the rod and
cone-driven rapid phase responses and melanopsin-driven steady state and post-illumination
response (Kardon, Anderson et al. 2009; Kardon, Anderson et al. 2011; Park, Moura et al. 2011;
Kawasaki, Crippa et al. 2012). The central-field PIPR testing method has also been used by other
groups (Kankipati, Girkin et al. 2010; Feigl, Mattes et al. 2011; Kankipati, Girkin et al. 2011;
Nissen, Sander et al. 2011; Kawasaki, Crippa et al. 2012; Kawasaki, Munier et al. 2012; Münch,
Léon et al. 2012; Feigl and Zele 2014; Nissen, Sander et al. 2014), including investigations into
diseases such as retinitis pigmentosa (Kardon, Anderson et al. 2011; Kawasaki, Crippa et al.

69
2012), Leber's hereditary optic neuropathy (Park, Moura et al. 2011), glaucoma (Feigl, Mattes et
al. 2011; Kankipati, Girkin et al. 2011) as well as the circadian rhythm of ipRGC activity
(Münch, Léon et al. 2012). Our previous work further refined the testing protocol for PIPR using
full-field stimulation (Lei, Goltz et al. 2014). We induced consistent PIPR with a full-field
stimulus of only a few hundred milliseconds. To the best of knowledge, all previous studies
regarding melanopsin-driven PIPR testing used either central or full-field stimulation, but within
subject comparison of PIPR from different sub-regions of retina has not been investigated.
Although a multi focal “perimetry-like” pupillography technique has also been developed
(Maddess, Ho et al. 2011; Chang, Arora et al. 2013), the induced pupil responses are usually
small and transient, and it is still unclear whether multi focal pupillography can adequately
induce the melanopsin-driven response in a consistently detectable manner. The ability of our
method to induce and compare full-field, central-field and hemifield PIPR is of considerable
clinical significance. While full-field stimulation can be used to assess PIPR as an index of
generalized melanopsin-driven ipRGC function across the whole retina, central-field stimulation
is more appropriate in diseases confined to the posterior pole such as maculopathy (Augood,
Vingerling et al. 2006). Differential hemifield responses are particularly useful in conditions
where retinal ganglion cell damage is topographically asymmetric, e.g., early glaucoma and
anterior ischemic optic neuropathy (Hart and Becker 1982; DeLeón-Ortega, Carroll et al. 2007).
Analyzing differential PIPR responses from full-field, central-field and hemifield stimulation
may also facilitate the localization of retinal damage and further expand the clinical utility of
PIPR testing.
In summary, we have described a practical method to induce full-field, central-field and
hemifield PIPR as indices of melanopsin-containing retinal ganglion cell function. Full-field and
central-field PIPR have good test-retest reliability with either a single measure or an average of
multiple measures. For hemifield PIPR, however, the reliability of single measure estimates are
low; accordingly, we recommended using the average of multiple measures to attain acceptable
reliability. Investigators may use this information when interpreting their PIPR test results.

70
Chapter 4
4 The Effect of Red light Exposure on Pre-existing Melanopsin-Driven Post-illumination Pupil Response
4.1 Introduction
Intrinsically photosensitive retinal ganglion cells (ipRGCs) are a third photoreceptor class
in the retina. (Berson, Dunn et al. 2002; Hattar, Liao et al. 2002) They contain a novel
photopigment, melanopsin, which was first described as a non-visual opsin in the dermal
melanophores of African clawed frogs (xenopus laevis) (Provencio, Jiang et al. 1998; Provencio,
Rodriguez et al. 2000). Melanopsin mediates a depolarizing phototransduction cascade in
ipRGCs, allowing these cells to fire action potentials on their own upon light stimulation (Berson,
Dunn et al. 2002; Hattar, Liao et al. 2002). IpRGCs also receive synaptic input originating from
rods and cones, mainly via the ON bipolar cell pathway (Wong, Dunn et al. 2007). The primary
physiological function of the ipRGC pathway is to signal ambient light irradiance (Lucas 2013).
It has been demonstrated that melanopsin-driven intrinsic ipRGC photoactivity has a unique
“photo-counting” ability that can provide sustained tonic coding under constant illumination.
This feature was thought to compensate for the fast-adapting rod/cone photoresponse (Dacey,
Liao et al. 2004; Dacey, Liao et al. 2005). IpRGCs integrate melanopsin-driven intrinsic
photoactivity and rod/cone-driven extrinsic photoactivity to provide the afferent signal for non-
image-forming visual functions, such as circadian rhythm photoentrainment and the pupillary
light response (Do and Yau 2010; Lucas 2013). There is growing evidence that melanopsin
phototransduction may have a significant influence on conventional image-forming visual
perception as well (Ecker, Dumitrescu et al. 2010; Schmidt, Chen et al. 2011; Schmidt, Do et al.
2011; Schmidt, Alam et al. 2014).
Much like rhodopsin in rods and photopsins in cones, melanopsin is also a vitamin A-
based photopigment that employs 11-cis-retinal as its chromophore (Provencio, Jiang et al. 1998).
After absorbing a photon, 11-cis-retinal is photoisomerized into all-trans-retinal, causing
conformational changes in the opsin and subsequently triggering the phototransduction cascade

71
in the photoreceptor (Ebrey and Koutalos 2001). The activated opsin has to re-bind 11-cis-
retinal for the photoreceptor to regain its photosensitivity. Benefiting from close proximity to
underlying retinal pigmented epithelium (RPE), rods and cones rely on RPE cells to recycle their
all-trans-retinal and supply them with 11-cis-retinal: the all-trans-retinal is dissociated from the
photoreceptor and transferred to RPE cells, in which the all-trans-retinal is converted back to 11-
cis conformation and made available for rods and cones through a multi-enzymatic chemical
reaction cascade called the “visual cycle” (Ebrey and Koutalos 2001). IpRGCs, however, are
located in the inner retina, far away from the RPE layer, which raises an intriguing question: how
does melanopsin maintain its photosensitivity without ample supply of 11-cis-retinal?
There is growing evidence (Lucas 2006; Mure, Rieux et al. 2007; Rollag 2008; Mure,
Cornut et al. 2009; Matsuyama, Yamashita et al. 2012; Sexton, Golczak et al. 2012) suggesting
that melanopsin’s chromophore regeneration is at least partially light-dependent: the isomerized
chromophore (all-trans-retinal) does not leave the ipRGC; instead, it remains stably attached to
activated melanopsin (meta-melanopsin), and is converted back to 11-cis conformation by
absorbing light energy at a different wavelength. This inter-switchable state of chromophore is
call “opsin bistability”. This opsin regeneration mechanism is commonly found in photoreceptors
in invertebrates animals, such as Limulus and Drosophila (Koyanagi, Kubokawa et al. 2005).
While there is consensus that melanopsin activation (the forward reaction) is selectively
sensitive to short wavelength light, with maximum absorption being at about 480 nm (Berson,
Dunn et al. 2002; Dacey, Liao et al. 2005; Gamlin, McDougal et al. 2007; Do, Kang et al. 2009;
Mure, Cornut et al. 2009; Do and Yau 2010), conflicting evidence exists regarding the spectral
sensitivity of melanopsin photo-regeneration (the backward reaction) (Mure, Rieux et al. 2007;
Mawad and Van Gelder 2008; Rollag 2008; Mure, Cornut et al. 2009; Matsuyama, Yamashita et
al. 2012). Mure and co-workers (Mure, Rieux et al. 2007; Mure, Cornut et al. 2009) showed that
pre-exposure to long-wavelength red light potentiates the photoresponse to short-wavelength
light (as measured by spiking of SCN neurons, the pupillary light reflex and negative masking
effect), a feature of bistable opsin. They reported that the putative spectral sensitivity of meta-
melanopsin is red-shifted, with maximal absorption at 587 nm (Mure, Cornut et al. 2009).

72
However, a similar paradigm failed to induce potentiation in ipRGCs cell firing in an in vitro
experiment, which argues against this “blue forward, red backward” hypothesis (Mawad and Van
Gelder 2008). Furthermore, a recent photochemical study on purified rat melanopsin protein
showed that melanopsin and meta-melanopsin have essentially overlapping spectral sensitivity,
with both peaking in the range of blue light (467 vs. 476 nm) (Matsuyama, Yamashita et al.
2012), but so far there is no in vivo evidence to support this “blue-forward, blue-backward”
theory yet.
Since the recovery of bistable opsin is light-dependent, after being activated with an
intense light exposure near its maximum absorption, a photoreceptor that employs a bistable
opsin often shows pro-longed response in the dark, which reflects an insufficient down-stream
deactivating mechanism and a long half-life of the activated bistable opsin in the absence of
subsequent stimulation (Hillman, Hochstein et al. 1983; Wang and Montell 2007; Hardie and
Postma 2008). This electrophysiological property gives rise to another classic experimental
paradigm to investigate opsin bistability: a prolonged post-stimulation potential is induced first
by stimulating the photoreceptor with a pulse of intense light near the optimal excitation
wavelength, then a second intense light exposure at a longer wavelength can be used to see if the
prolonged response can be quenched (Hillman, Hochstein et al. 1983; Qiu and Berson 2007).
This paradigm has been used extensively in investigating opsin bistability in invertebrate
photoreceptors (Hillman, Hochstein et al. 1983). A number of studies have demonstrated that
melanopsin-containing ipRGCs indeed show a prolonged depolarizing post-stimulation potential
after intense exposure to melanopsin-activating blue light, which is consistent with the features
of a bistable-opsin-driven photoresponse (Berson, Dunn et al. 2002; Hattar, Liao et al. 2002;
Dacey, Liao et al. 2004; Dacey, Liao et al. 2005). This prolonged post-stimulation potential leads
to a sustained pupil constriction beyond the offset of the light stimulus (Gamlin, McDougal et al.
2007). This so-called post-illumination pupil response (PIPR) has been widely accepted as an in
vivo index of the melanopsin-driven intrinsic ipRGC photo response (Kankipati, Girkin et al.
2010; Feigl, Mattes et al. 2011; Herbst, Sander et al. 2011; Kankipati, Girkin et al. 2011; Nissen,
Sander et al. 2011; Park, Moura et al. 2011; Herbst, Sander et al. 2012; Kawasaki, Crippa et al.
2012; Kawasaki, Munier et al. 2012; Münch, Léon et al. 2012; Herbst, Sander et al. 2013;

73
Roecklein, Wong et al. 2013; Lei, Goltz et al. 2014; Nissen, Sander et al. 2014; Lei, Goltz et al.
2015).
In order to provide evidence regarding the in vivo recovery mechanism of melanopsin, we
conducted two experiments to investigate the effect of long wavelength red light exposure on
pre-existing PIPR by presenting red light stimuli of variable intensity and duration at different
time points of blue light-induced PIPR. We predicted that if the spectral sensitivity of meta-
melanopsin is red-shifted, red light exposure will attenuate the pre-existing PIPR, and if the
spectral sensitivity of meta-melanopsin is essentially overlapping with that of melanopsin, red
light exposure will have no effect on PIPR.

74
4.2 Methods
4.2.1 Participants
Ten visually-normal subjects who had normal or corrected-to-normal vision (20/20
Snellen visual acuity or better) participated in the experiment 1 and 2 respectively (not every
subject participated in both experiments). All participants underwent a screening ophthalmology
exam, which include visual acuity, contrast sensitivity, eye alignment and movement tests,
colour vision assessment (HRR test, Richmond Products, NM, USA), intraocular pressure
assessment using slit-lamp tonometry, slit-lamp assessment of iris structures, anterior chamber
angle and non-dilated fundus exam. Inclusion and exclusion criteria were previously described in
Chapter 3 (section 3.2). The study was approved by the Research Ethics Board at The Hospital
for Sick Children. All the procedures adhered to the guidelines of the Declaration of Helsinki.
Written informed consent was obtained from each participant.
4.2.2 Apparatus
The technical specifications of our chromatic pupillometry apparatus have been.
described earlier in this thesis (3.2.2). Only full-field stimulation was used in this study.
4.2.3 Testing conditions and protocols
All subjects were exposed to an indoor laboratory environment with ambient lighting
levels ranging from 80-400 lux for at least 2 hours prior to the experiment. During the
pupillometry recordings, participants were seated in a quiet darkened room (0 lux) with their
head resting on a chinrest, with the forehead touching the upper edge of the Ganzfeld screen
opening to receive full-field chromatic stimulation
4.2.3.1 Experiment 1
Experiment 1 was conducted monocularly, with one eye patched, and the fellow eye
stimulated and recorded. The pupillary light response was induced with light stimuli under 4
conditions:
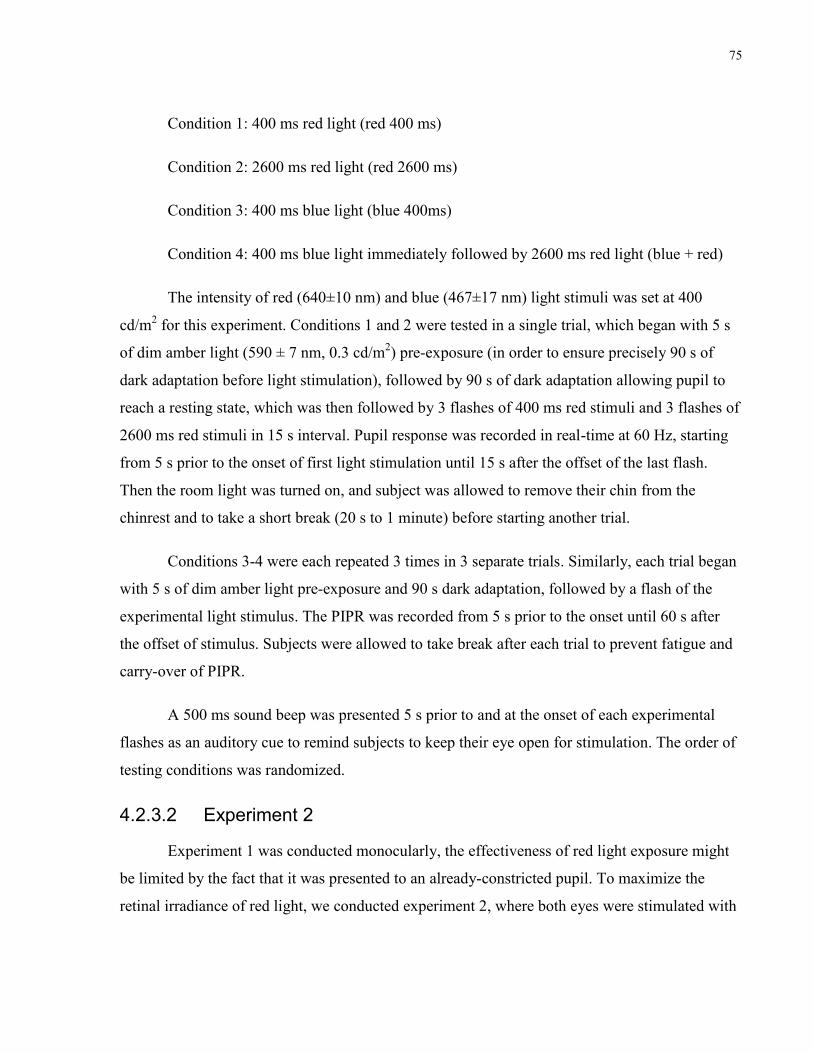
75
Condition 1: 400 ms red light (red 400 ms)
Condition 2: 2600 ms red light (red 2600 ms)
Condition 3: 400 ms blue light (blue 400ms)
Condition 4: 400 ms blue light immediately followed by 2600 ms red light (blue + red)
The intensity of red (640±10 nm) and blue (467±17 nm) light stimuli was set at 400
cd/m2 for this experiment. Conditions 1 and 2 were tested in a single trial, which began with 5 s
of dim amber light (590 ± 7 nm, 0.3 cd/m2) pre-exposure (in order to ensure precisely 90 s of
dark adaptation before light stimulation), followed by 90 s of dark adaptation allowing pupil to
reach a resting state, which was then followed by 3 flashes of 400 ms red stimuli and 3 flashes of
2600 ms red stimuli in 15 s interval. Pupil response was recorded in real-time at 60 Hz, starting
from 5 s prior to the onset of first light stimulation until 15 s after the offset of the last flash.
Then the room light was turned on, and subject was allowed to remove their chin from the
chinrest and to take a short break (20 s to 1 minute) before starting another trial.
Conditions 3-4 were each repeated 3 times in 3 separate trials. Similarly, each trial began
with 5 s of dim amber light pre-exposure and 90 s dark adaptation, followed by a flash of the
experimental light stimulus. The PIPR was recorded from 5 s prior to the onset until 60 s after
the offset of stimulus. Subjects were allowed to take break after each trial to prevent fatigue and
carry-over of PIPR.
A 500 ms sound beep was presented 5 s prior to and at the onset of each experimental
flashes as an auditory cue to remind subjects to keep their eye open for stimulation. The order of
testing conditions was randomized.
4.2.3.2 Experiment 2
Experiment 1 was conducted monocularly, the effectiveness of red light exposure might
be limited by the fact that it was presented to an already-constricted pupil. To maximize the
retinal irradiance of red light, we conducted experiment 2, where both eyes were stimulated with

76
one eye being pharmaceutically dilated, with the pupil response recorded from the non-dilated
eye. The pupil of non-dominant eye was dilated with topical 1% tropicamide and 2.5%
phenylephrine ophthalmic solution. Both eyes were stimulated simultaneously, while pupil
response was recorded from the non-dilated dominant eye.
Experiment 2 started with a red-light-only reference trial, where 9 flashes of red light
stimuli of increasing intensity and duration (1, 3.16, 10, 31.6, 100, 316, 1000 cd/m2 for 1 s, 1000
cd/m2 for 5 s and 1000 cd/m
2 for 10 s) were presented in 15 s intervals. The red light-only
control trial was followed by 9 double-flash (blue+red) trials and a blue-only single-flash trial
tested in randomized order. For the double-flash conditions, a blue stimulus of 400 cd/m2
intensity was presented for 200 ms to induce PIPR, then red stimuli of increasing intensity and
duration (1, 3.16, 10, 31.6, 100, 316, 1000 cd/m2 for 1 s, 1000 cd/m
2 for 5 s and 1000 cd/m
2 for
10 s, 9 steps) were presented at 9 s after the offset of each PIPR-inducing blue stimulus. For the
single-flash trial, only a 400 cd/m2, 200 ms blue flash was presented. Similar to experiment 1, all
trials started with 5 s of dim amber light pre-exposure followed by precisely 90 s dark adaptation
to make sure that the pupils were in the same resting state when the first flash was presented.
Auditory cues were also given in the same fashion as experiment 1.
4.2.4 Data Analysis
Data from the eye tracker were filtered and inspected using a custom-written processing
program as described in Chapter 3 (session 3.2.4). The filtered data were then normalized to the
baseline pupil size calculated from the mean pupil size during a 5 s period before the onset of
each stimulus (i.e., Normalized pupil size = Absolute pupil size / Baseline pupil size). It was
anticipated that the putative red light attenuating effect would alter the long-term recovery
tendency of PIPR, therefore the PIPR measurement was defined as the average normalized pupil
size over a 20 second period from 10 to 30 seconds after the offset of blue light stimuli in
experiment 1, and over a 35 second period from 25 to 60 second after the offset of the first blue
light stimuli in experiment 2 (smaller value means greater PIPR). We did not anticipate “red only”
control conditions to produce significant PIPR, therefore, PIPR was not measured from these

77
trials. Maximum pupil constriction (MPC) after light stimulation was also measured and
compared.
Statistical analyses were performed using SPSS 19.0 (IBM Corporation. Armonk, NY).
Differences in mean PIPR between “blue-red” and “blue only” conditions were compared using
one-way repeated measures ANOVAs with post hoc pairwise comparisons adjusted for multiple
comparisons using the Bonferroni method. A value of p<0.05 was considered statistically
significant.

78
4.3 Results
4.3.1 Experiment 1
Mean pupil responses from all tested conditions from 10 visually normal participants (6
females, mean age 31.5 years, age range 20-57 years) are summarized in Figure 9: as expected,
while the reference “red only” stimulations did not induce sustained PIPR, a 400 cd/m2, 400 ms
blue flash induced rapid pupil constriction followed by slow-decaying PIPR, which is consistent
with the pattern of the melanopsin-driven pupil response. (Park, Moura et al. 2011; Lei, Goltz et
al. 2014; Lei, Goltz et al. 2015) Interestingly, the PIPR induced by combined “blue+red”
stimulation (400 ms blue flash followed by 2,600 ms red light exposure, M=0.698, SD=0.079)
was not statistically different from “blue only” stimulation (M=0.707, SD=0.071, t(9)=0.619,
p=0.551). The pupil tracings of these two conditions were substantially overlapping, except that
the rapid constriction in response to the “blue+red” stimulus reached an MPC end-point that was
greater than for the 400 ms blue light and 2,600 ms red light alone, there was a significant effect
on MPC as confirmed by one-way repeated measures ANOVA: Wilks’ Lambda=0.022,
F(3,6)=87.339, p<0.001, with post-hoc pairwise comparison on MPC of “blue only” (M=0.431,
SD=0.053) and “blue+red” condition (M=0.350, SD=0.037, p=0.006), and that the rapid re-
dilation phase after the offset of “blue+red” stimulus briefly fell below the blue-light induced
PIPR. In a further examination of the trough of the re-dilation phase, we sampled pupil size data
over a 1 s interval centred at 3.5 s after the offset of “blue+red” stimulus, and compared with the
data of “blue only” PIPR. (Figure 10) The results showed that in this time-window, “blue+red”
PIPR (M=0.555, SD=0.053) was significantly lower than “blue only” PIPR (M=0.502,
SD=0.043, t(9)=-4.743, p=0.001), confirming a transient reduction in PIPR after the offset of red
light.
79
Figure 9. Mean pupil responses from 10 visually-normal subjects in Experiment 1, Pupil
diameter data were normalized to the mean of 5 s of baseline recording prior to the onset of
stimuli. Note the PIPR tracing of the “blue only” condition (400 ms blue flash) and
“blue+red” condition (400 ms blue flash followed by 2,600 ms red light exposure) are
highly overlapping; magnified box: comparing pupil size data over a 1 s interval centred at
3.5 s after the offset of “blue+red” stimuli to “blue only” condition, values represent
mean±SD, p=0.001. Figure 9b, comparison of “blue only” and “blue+red” PIPR
measurements, there is no significant difference. Figure 9c, comparison of MPC among all
tested conditions, “b-lue+red” stimulus induced significant greater MPC than “red only”

80
and “blue only” stimuli (one-way repeated measure ANOVA, p<0.006). Error bars
represent standard deviation.
4.3.2 Experiment 2
Experiment 1 was conducted monocularly, but the effectiveness of the red light exposure
might have been limited by the fact that it was presented to an already-constricted pupil. To
maximize the retinal irradiance of red light, we conducted experiment 2, where both eyes were
stimulated with one eye being pharmaceutically dilated, with the pupil response recorded from
the non-dilated eye. We presented red light of variable intensity and duration at 9 s after the
offset of a 400 cd/m2
, 200 ms melanopsin-activating blue flash.
Ten visually normal subjects (7 females, mean age 32.1 years, age range 20-57 years)
participated in experiment 2. All participants successfully completed the “red-only” and “blue-
only” reference trials. Mean pupil tracings for the “red only” reference conditions are
summarized in Figure 10: no significant PIPR was induced even with the most intense red light
(1000 cd/m2) presented for 10 s, indicating that the red light exposure in this experiment did not
activate melanopsin. When red light exposure was presented after the blue flash, 3 participants
had significant eye squinting, although none of these 3 photophobic participants closed their eyes
during red light exposure, the narrowing palpebral fissures caused artifact in the pupil tracings
when the red light was turned on, but the PIPR measurements were not affected because of the
time delay between stimulation and PIPR measurement. Therefore, the data from these 3 subjects
were included for PIPR comparison. As shown in Figure 11 and Figure 12, mean PIPR tracings
of “blue-red” trials are essentially overlapping with “blue only” control. There was no
statistically significant difference in PIPR measurements among tested “blue-red” and “blue only”
conditions (F(9,81)= 0.976, p=0.466, one-way repeated measure ANOVA).
The pupil response tracings were inspected further by excluding the 3 individuals who
produced artifacts (Figure 13 and Figure 14). The PIPR measurements still did not differ from
each other (F(6, 54)= 1.075, p=0.378, one-way repeated measure ANOVA). Similar to the results
of experiment 1, compared to the “red only” reference, red light exposures presented after the

81
melanopsin-activating blue light induced greater MPC, all pair-wise comparisons of MPC (red
light reference vs. red light presented on blue light PIPR) reached statistical significance (Figure
15). A transient reduction in PIPR following the offset of red light was also observed in most of
the “blue-red” double flash conditions, but the PIPR difference at 3.5 s after the offset of red
light (“blue-red” vs “blue” only) did not reach statistical significance (p>0.1).
Figure 10. Mean pupil responses to “red only” reference stimulations from 10 visually-
normal subjects.

82
Figure 11. Mean pupil responses from 10 visually-normal subjects in Experiment 2. Pupil
diameter data were normalized to the mean of 5 s of baseline recording prior to the onset of
stimuli. PIPR was induced with a 400 cd/m2, 200 ms full-field blue light stimulus presented
to both eyes simultaneously; red light exposure of variable intensity and duration was
presented at 9 s after the offset of the blue flash. Artifacts were mainly from 3 individuals
who had difficulty keeping their eyes open during the red light exposure. Grey area: PIPR
measurement was defined as mean normalized pupil size over a 35 second period from 25
to 60 seconds after the offset of the blue flash. Mean±SD of PIPR for all 10 conditions is
represented in the inset bar graph.

83
Figure 12. Comparisons of PIPR tracings of “blue+red” conditions vs. “blue only” control
from 10 visually normal participants. Pupil diameter data were normalized to the mean of
5 s of baseline recording prior to the onset of stimuli. PIPR was induced with a 400 cd/m2,
200 ms full-field blue light stimulus presented to both eyes simultaneously; red light
exposure of variable intensity and duration was presented at 9 s after the offset of the blue
flash. Text underneath the curves indicates intensity and duration the red light exposure in
“Blue+Red” conditions.

84
Figure 13. Mean pupil responses from 7 visually-normal subjects in Experiment 2. Data
from 3 photophobic individuals who produced pupil tracing artifacts were deleted in order
to reveal the waveform of rapid phase pupil response during and immediately after the red
light exposure. Pupil diameter data were normalized to the mean of 5 s of baseline
recording prior to the onset of stimuli. PIPR was induced with a 400 cd/m2, 200 ms full-
field blue light stimulus presented to both eyes simultaneously; red light exposure of
variable intensity and duration was presented at 9 s after the offset of the blue flash. Grey
area: PIPR measurement was defined as mean normalized pupil size of a 35 second period
from 25 to 60 seconds after the offset of the blue flash. Mean±SD of PIPR was represented
in the inset bar graph.

85
Figure 14. Comparisons of PIPR tracings from “blue+red” conditions vs. “blue only”
controls from 7 visually normal participants. Data from 3 photophobic individuals who
produced artifacts were deleted in order to reveal the waveform of the rapid phase pupil
response during and immediately after the red light exposure. Pupil diameter data were
normalized to the mean of 5 s of baseline recording prior to the onset of stimulation. PIPR
was induced with a 400 cd/m2, 200 ms full-field blue light stimulus presented to both eyes
simultaneously; red light exposure of variable intensity and duration was presented at 9 s
after the offset of the blue flash. Legends underneath the curves indicate the intensity and
duration the red light exposure in “Blue+Red” conditions.

86
Figure 15. Comparisons of maximum pupil constriction (MPC) induced by “red only”
stimuli vs. red stimuli presented on top of blue-light-induced PIPR (“Red on PIPR”).
Smaller values represent greater pupil constriction. Error bars represent standard
deviation. (n=7, 3 individuals who produced artifacts during the red light exposure were
excluded from this analysis). Compared to the “red only” reference, red light exposure
presented after the melanopsin-activating blue light induced greater MPC, all pair-wise
comparisons reached statistical significance (p<0.001, paired sample t-test).

87
4.4 Discussion
The primary goal of this study was to investigate whether blue light-induced pre-existing
PIPR can be cut short by subsequent exposure to long wavelength red light. By presenting red
light stimuli of a wide range of intensities (1-1000 cd/m2) and duration (1-10 s) at two different
time points in the blue light-induced PIPR (immediately after the blue light exposure in
experiment 1 vs. 9 s after blue light in experiment 2), we found no significant difference in PIPR
between “blue-red” double-flash conditions and the blue-only control. Our findings argue against
the previous assertion that long wavelength red light converts activated melanopsin back to its
resting state (Mure, Rieux et al. 2007; Mure, Cornut et al. 2009). It is a general feature
demonstrated in many invertebrate bistable opsins that the maximum absorption wavelength of
the backward reaction is usually longer than that of the forward reaction (Ritter, Zimmermann et
al. 2004; Wang and Montell 2007; Hardie and Postma 2008). Therefore, early investigations into
melanopsin bistability were based on the assumption that the maximum absorption wavelength
for meta-melanopsin is red-shifted from that of melanopsin. Mure and co-workers (Mure, Rieux
et al. 2007; Mure, Cornut et al. 2009) previously conducted a series of experiments to show that
pre-exposure using 620 nm long-wavelength red light potentiates many in vivo photo responses
to melanopsin-activating blue light, including the spiking of SCN neurons, sustained pupil
constriction and the negative masking effect. The authors suggested that these findings are in
vivo evidence of melanopsin bistability based on the principle that pre-exposure to red light
drives more meta-melanopsin back to its resting state, thus enhancing the sensitivity of the
melanopsin-driven response. By computing the spectral tuning of red light potentiation of the
sustained pupil response to blue light, they reported a putative spectral sensitivity of meta-
melanopsin that peaks at 587 nm (Mure, Cornut et al. 2009). If this “blue forward, red backward”
hypothesis for melanopsin bistability is true, the red light stimuli from the current study
(maximum 1000 cd/m2 for 10 s) should convert a significant proportion of meta-melanopsin
induced by the 400 cd/m2 blue flash of 200-400 ms, and thus quench the PIPR mediated by the
previous melanopsin-driven post-stimulus ipRGC potential. However, such an attenuating effect
was not observed in any of the double-flash conditions in our experiment. Even after the most
intense red light exposure (1000 cd/m2
, approximately equivalent to 15 log quanta/cm2/s, for

88
10s), pupil tracings quickly returned to the PIPR trajectory pre-determined by previous blue
light stimulation, and remaining very similar for up to 60 s. The absence of a red light
attenuating effect on PIPR echoes the findings of Mawad and co-workers’ study, namely that red
light pre-exposure did not induce potentiating on ipRGCs cell firing in an in vitro experiment
(Mawad and Van Gelder 2008), which suggested that the in vivo potentiating effect that was
observed by Mure et al. (Mure, Rieux et al. 2007; Mure, Cornut et al. 2009) may be a
downstream effect rather than a consequence of melanopsin bistability (Mawad and Van Gelder
2008; Rollag 2008).
The absence of a red light attenuating effect on blue light-induced PIPR rather supports
the idea emerging from a previous study, namely that the spectral sensitivity of melanopsin and
meta-melanopsin being close to one other. In a study by Matsuyama and colleagues (Matsuyama,
Yamashita et al. 2012), spectroscopic measurements on a large amount of purified rat
melanopsin revealed that the maximum absorption wavelength of meta-melanopsin was only
minimally longer than that of melanopsin (476 vs. 467 nm); it could be argued that the spectral
sensitivities of melanopsin activation and regeneration are essentially overlapping, with both
peaking in the range of blue light, which effectively explains our observation that long-
wavelength red light neither induces nor suppresses the melanopsin-driven PIPR. With constant
blue light exposure, Matsuyama and colleagues (Matsuyama, Yamashita et al. 2012) were able to
generate a steady mixture of melanopsin (11-cis) and meta-melanopsin (all-trans), indicating that
melanopsin activation and regeneration reactions are likely happening concurrently, the resultant
11-cis:all-transretinal ratio following constant illumination will be dependent on the relative
conversion rates between forward and backward reactions (Rollag 2008; Matsuyama, Yamashita
et al. 2012). If these photochemical findings can be translated directly into functional
physiological properties, the melanopsin-containing ipRGCs would become “self-regenerating”
blue light sensors, no matter how long the ipRGCs are stimulated, there will always be a certain
amount of 11-cis-retinal-binding melanopsin available for subsequent photo stimulation. This
putative property of melanopsin thus provides a convenient explanation for the fact that
melanopsin is highly resilient to photo bleaching in vivo (Sexton, Golczak et al. 2012), and that

89
ipRGCs can provide sustained irradiance coding even under prolonged illumination near the
maximum absorption wavelength (Dacey, Liao et al. 2004; Dacey, Liao et al. 2005).
By presenting red light stimuli during the PIPR activity, our experimental paradigm
inevitably induced a rapid phase cone-driven extrinsic ipRGC response superimposed on the pre-
existing melanopsin-driven intrinsic ipRGC activity. Therefore, our data should also be
interpreted from the perspective of integration of ipRGC extrinsic/intrinsic photo activity. In
both experiments, red stimuli superimposed on the melanopsin-driven PIPR induced further
pupil constriction to a point that would not be reached by red light stimulation alone; this
phenomenon is most clearly demonstrated by the comparison between 1000cd/m2, 10 s red light
on PIPR vs. 1000cd/m2, 10 s red light alone. It was previously demonstrated in a growing body
of literature that melanopsin activity is required for the pupil to reach maximal constriction;
without the contribution from melanopsin, cone activity alone would not drive the pupil
constriction beyond 80% of its maximum (Lucas, Hattar et al. 2003; Panda, Provencio et al. 2003;
Semo, Peirson et al. 2003; Barnard, Appleford et al. 2004). Our findings clearly demonstrate the
ability of the ipRGCs to temporally summate the cone-driven extrinsic photoactivity and
melanopsin-driven intrinsic photoactivity to provide pupil size regulation. It is also noteworthy
that immediately after the offset of red stimuli, the pupil briefly re-dilates to an extent below the
PIPR before returning to the PIPR trajectory. This phenomenon was consistently observed in the
averaged responses to most of the blue-red double flash conditions, it lasts only a few seconds,
with the greatest disparity being at around 3-4 seconds after the offset of red light. By sampling
this part of the data and comparing it to the blue-only PIPR, the difference was statistically
significant in some of the double flash conditions. Considering the transient nature of this effect,
it is very unlikely that this can be attributed to melanopsin bistability. We hypothesize that the
transient suppression of pre-existing PIPR after the offset of red light stimulation is due to
overshoot of iris dilator muscle or due to disaffiliation of the ipRGC pathway caused by the
removal of cone input via ON bipolar cells. The physiological significance of this effect remains
to be elucidated.

90
In summary, using a novel blue-red double flash chromatic pupillometry paradigm, we
found a transient suppression of PIPR immediately after the withdrawal of red light stimuli, but
no sustained attenuating effect of red light exposure on the pre-existing PIPR. This in vivo
evidence argues against the previous hypothesis that melanopsin employs a long wavelength
light-dependent mechanism to regenerate its 11-cis retinal chromophore. Rather it supports the
idea that melanopsin activation and regeneration have overlapping spectral sensitivity, with both
peaking in the range of blue light. The experimental paradigm described in this study may be
useful for investigating the interaction between rod/cone-driven intrinsic ipRGC activity and
melanopsin-driven intrinsic ipRGC activity.

91
Chapter 5
5 General discussion
The primary goal of this thesis was to develop a chromatic pupillometry system
measuring the post-illumination pupil response as a convenient, reliable and objective tool to
assess the newly discovered melanopsin-driven intrinsic ipRGC photoactivity in vivo, and to use
this tool to answer clinical and basic science questions related to the melanopsin/ipRGC system.
The experimental work consists of two parts: first, a clinically-oriented methodological study on
hemifield, central-field and full-field PIPR testing. The results showed that upper and lower
hemifield PIPRs in normal subjects are symmetric, and that hemifield, central-field, full-field
stimulation induced increasingly greater PIPR, findings that are expected based on the current
understanding of melanopsin photoactivity. Good test-retest reliability was demonstrated in
hemifield, central-field and full-field PIPR. In effect, these findings validate this chromatic
pupillometry system as a tool to test melanopsin-driven PIPR. The usefulness of this tool was
subsequently demonstrated in a basic-science-oriented experiment implementing PIPR testing as
an in vivo index of melanopsin photoactivity to investigate the effect of red light exposure on
pre-existing PIPR. The results showed that red light exposure has no long term PIPR-attenuating
effect; the withdrawal of red light exposure, however, causes transient suppression of PIPR,
which provided insights into the chromophore regeneration mechanism of melanopsin and the
interaction between extrinsic and intrinsic ipRGC activity.
5.1 Refinements of chromatic pupillometry PIPR testing
We successfully combined two commercially available devices into a chromatic
pupillometry system: chromatic light stimuli were presented with a Ganzfeld screen stimulator
originally designed as part of a electrophysiology system for full-field ERG and EOG testing
(ColorDome LED full-field stimulator with the Espion V5 operating system; Diagnosys LLC,
Lowell, MA); pupil reaction was monitored with a binocular head-mounted eye-tracking camera
system (Arrington Research, Scottsdale, AZ). The Ganzfeld stimulator integrates a xenon light

92
bulb and monochromic LEDs: red (640±10 nm), amber (590±7 nm), green (535 ±15 nm ), blue
(467±17 nm) as light sources to generate full-spectrum (white) and monochromatic light stimuli
over a wide range of intensities and durations (technical documents from Diagnosys LLC,
Lowell, MA). The blue light of the Colordome (467±17 nm) matches the peak absorption of
melanopsin (~480 nm), the red light spectrum is narrow and well-distanced from the absorption
spectrum of melanopsin. Therefore, blue light was chosen to stimulate the melanopsin-driven
pupil response and red light was used as a melanopsin-silent reference condition. The eye tracker
employs miniature near-infrared (940 nm) illuminating diodes and infrared cameras mounted on
a light-weight spectacle frame to record changes in pupil diameter binocularly at a sampling rate
of 60 Hz. The Ganzfeld stimulator and eye tracker were connected through a synchronizing
circuit (Arrington Research, Scottsdale, AZ).
This combination of hardware as a chromatic pupillometry system was first described by
Kardon and his colleagues (Kardon, Anderson et al. 2009). In their initial study, the Ganzfeld
screen was positioned 75 mm away from the subject to present light stimuli of approximately 60°
× 90° viewing angle (Kardon, Anderson et al. 2009). The reason for this unusual positioning of
Ganzfeld screen was not clearly described in the paper; we presumed that it was due to the bulky
forehead scene camera on the eye tracker frame which prevented the subjects from positioning
their faces closer to the opening of the bowl-shaped Ganzfeld screen. In an effort to enhance this
chromatic pupillometry setup, we removed the scene camera that was of no use in pupil
recording -- a simple modification allowing the subject place their forehead against the edge of
the Ganzfeld screen for full-field stimulation – the way the screen was designed to be used. In
our earlier work (Lei, Goltz et al. 2014) on full-field chromatic pupillometry measuring PIPR,
we found that full-field stimulation induced significantly greater PIPR than 60° × 90° central-
field stimulation of the same intensity and duration. We showed that a sustained PIPR of more
than 30 seconds can be induced with an intense full-field blue light stimulation of only a few
hundred milliseconds duration. This “brief flash” PIPR stimulation protocol minimizes
participant’s discomfort compared to previously described 10-30 seconds long duration bright
light stimulation in darkness (Kankipati, Girkin et al. 2010; Feigl, Mattes et al. 2011; Herbst,
Sander et al. 2011; Kankipati, Girkin et al. 2011; Nissen, Sander et al. 2011; Herbst, Sander et al.

93
2012; Herbst, Sander et al. 2013; Roecklein, Wong et al. 2013; Nissen, Sander et al. 2014). It
also avoids the inconsistency in light exposure caused by eye blinking and squinting (See
discussion in 1.7.4). More importantly, the offset of the long duration stimulation causes a rapid
pupil redilation before the steady state PIPR, which is presumably caused by the withdrawal of
the cone-driven extrinsic ipRGC activity. As shown in our experiment in Chapter 4, this rapid
pupil redilation can cause transient suppression of melanopsin-driven PIPR, and may be
problematic depending on how the PIPR measurement is sampled. This potential confounding
effect can be eliminated by using a brief blue flash with duration less than 1 s that does not cause
rapid pupil redilation at the offset of stimulation. The “brief flash” PIPR stimulating protocol
was subsequently used and was well-tolerated by participants in the experiments described in
chapters 3 and 4 of this thesis.
As a test of retinal function, it is clinically useful to induce and compare PIPRs from
different retinal regions. However, previously published chromatic pupillometry papers either
used central-field or full-field stimuli; a “regional PIPR” testing protocol has not been developed
(Gamlin, McDougal et al. 2007; Kardon, Anderson et al. 2009; Mure, Cornut et al. 2009;
Kankipati, Girkin et al. 2010; Feigl, Mattes et al. 2011; Kankipati, Girkin et al. 2011; Nissen,
Sander et al. 2011; Roecklein, Wong et al. 2013; Nissen, Sander et al. 2014). To further refine
the PIPR testing protocol, we designed and constructed a novel occluder to regulate the exposed
area of the Ganzfeld stimulator, this add-on device is easy to install and remove without
structural or functional changes to the Ganzfeld stimulator itself, so that intra-subject hemifield,
central-field and full-field PIPR can be induced in a convenient manner. With 400 cd/m2, 400 ms
brief blue flash stimuli, we recorded differentiable PIPR from 10 visually normal subjects with
good test-retest reliability. We found that the hemifields, 30° central-field and full-field stimuli
induced increasingly larger PIPR. These findings are consistent with our previous observation
that PIPR is a function of stimulus intensity, duration, and in particular, retinal area stimulated
(Lei, Goltz et al. 2014). As we expected, the mean responses to upper and lower hemifield
stimulation are highly symmetric, indicating that there is no systematic bias in our hemifield
stimulation apparatus nor in our normal subjects. The clinical applications of the hemifield,
central-field and full-field PIPR testing will be further discussed in sections 5.3 and 7.2.

94
In chapter 4, we described a novel “blue-red” double flash protocol to study the effect of
red light exposure on blue light–induced PIPR. In addition to providing in vivo evidence to
support the hypothesis that melanopsin chromophore regeneration is not dependent on long
wavelength light, this paradigm effectively produced cone-driven extrinsic ipRGC activity
superimposed on pre-existing melanopsin-driven intrinsic ipRGC activity. Interestingly, we
noted the summation effect of extrinsic/intrinsic ipRGC activity when the red light was ON, and
a transient inhibition effect immediately after the red light OFF response (see discussion in
section 4.4). The results indicate that this protocol may have important application in
investigating the interaction between extrinsic and intrinsic ipRGC activity.
Besides the above-mentioned major refinements in the PIPR testing protocols, we also
made multiple minor modifications and improvements to the current PIPR testing methodology,
such as adding extra infrared LEDs to enhance the pupil tracking quality, a custom-built circuit
producing auditory cues to help participants maintaining mental engagement and attention during
pupillometry recording, and a period of pre-exposure to ensure the same duration of dark
adaptation before each trials. Although the benefit of these minor changes were not directly
evaluated in our experiments, after extensive testing in both normal subjects and in pilot studies
of participants with ocular disease, we are confident that they are useful refinements to PIPR
testing, and should be included in future development of chromatic pupillometry.
In summary, many novel modifications and refinements to multiple aspects of current
PIPR testing methodology have been devised in the making of this thesis. From a knowledge
translation perspective, these refinements are practical and easily implemented; therefore, they
may have wide-spread positive impact on melanopsin/ipRGC related research.
5.2 Characteristics of melanopsin-driven post-illumination pupil response
It has been generally accepted that melanopsin-driven intrinsic ipRGC photoactivity
provides steady irradiance coding at high intensity level with selective sensitivity to short
wavelength light (Berson, Dunn et al. 2002; Dacey, Liao et al. 2005; Gamlin, McDougal et al.

95
2007; Do, Kang et al. 2009; Mure, Cornut et al. 2009; Do and Yau 2010). A remarkable “photon-
counting” ability of melanopsin has been demonstrated by a number of studies, where the spikes
in individual melanopsin-driven ipRGC activity showed a precise linear relation to the amount of
light energy that they had been exposed to (Berson 2003; Dacey, Liao et al. 2005; Fu, Liao et al.
2005; Wong, Dunn et al. 2005; Do, Kang et al. 2009). These electrophysiological properties of
melanopsin are well reflected in the melanopsin-driven PIPR. Data from our initial experimental
work on full-field PIPR showed that when the stimulus intensity was low, PIPR was minimal,
and the pupil responses to red and blue light were similar to each other. Sustained blue light-
induced PIPR appeared when the intensity reached 10 cd/m2, a threshold much higher than that
for rod or cone photoactivity. Further increase in stimulation intensity caused a linear increase in
PIPR up to 400 cd/m2. It is noteworthy that 400 cd/m
2 was the highest intensity our apparatus
could produce using blue light, and to our knowledge, blue light with intensity higher than 400
cd/m2
has not been tested in human subjects. Linearity also exists in the duration-response
relation over a large span of duration steps. This dual-linearity relationship (intensity-response
and duration-response) is consistent with the “photo-counting” properties of melanopsin-driven
ipRGC activity, and indicates that light intensity and duration can be interchanged proportionally
to produce PIPR of similar amplitude or kinetics, facilitating the prediction regarding and the
quantitative analysis of PIPR responses.
Considering the irradiance detecting property of melanopsin phototransduction in
ipRGCs, and the fact that full-field stimulation induced greater PIPR than 60° × 90° central-field
stimulation, it was not surprising to see in the experiment described in Chapter 3 that
increasingly larger PIPR was induced with upper/lower hemifields, central-field and full-field
stimulation, with the two hemifield conditions inducing essentially overlapping PIPR. More
interestingly, the waveforms of the pupil tracing from hemifield, central-field and full-field
stimulation are essentially parallel to each other, suggesting that these responses have a similar
proportion of melanopsin’s influence; the ipRGC-mediated pupillary light reflex pathway may
employ a simple linear spatial summation of melanopsin photoactivity. When the stimulated
retinal area increases, the amplitude of the melanopsin-driven pupil response increases, but the
waveform remains the same. Apparently this relationship would be limited by the endpoint of

96
maximum pupil constriction: once the full pupil constriction is reached, further increase of
spatial summation of melanopsin activity will appear as a more sustained PIPR.
The experiments in Chapter 4 further reveal some characteristics of the interaction
between cone-driven extrinsic ipRGC activity and melanopsin-driven PIPR: when presented on a
pedestal of blue-light induced PIPR, red light exposure induced further pupil constriction to a
level that would not be reached by red light stimulation alone, which reflects the cone-driven
extrinsic ipRGC activity superimposed on the melanopsin-driven intrinsic ipRGC activity.
Under these circumstances, the cessation of this cone-driven extrinsic influence led to a transient
minor suppression of PIPR that lasted only a few seconds; the mechanism and physiological
significance of this phenomenon remain to be elucidated. Most importantly, our data show that
red light exposure did not cause a long-term attenuating effect on PIPR. It was quite remarkable
to see that even after 10 s of 1000 cd/m2 red light exposure, the pupil quickly returned to the
prior PIPR trajectory that was determined by the melanopsin-activating blue light presented over
9 seconds prior to the onset of the red light. This PIPR behavioural pattern supports the idea that
melanopsin-driven ipRGC activity may confer a form of “photic memory” that faithfully encodes
short wavelength light irradiance that the eye has been exposed to, which leads to a sustained
component of pupil response that is largely unmodifiable by subsequent extrinsic ipRGC
photoactivity.
In summary, the experimental work of this thesis has provided valuable information
about the kinetic characteristics of melanopsin-driven PIPR, allowing investigators to tailor the
PIPR testing paradigm to target a particular investigation question. It may also be used as a
reference when predicting or interpreting PIPR test results.
5.3 Applications of hemifield, central-field and full-field chromatic pupillometry induced PIPR
Ever since the discovery of melanopsin and melanopsin-containing ipRGCs, there has
been a fast growing interest in testing the melanopsin-driven PIPR in health and disease as an
objective in vivo assessment of inner retinal function. This idea is attractive to visual

97
physiologists and ophthalmologists for many reasons: firstly and most obviously, the
melanopsin-mediated retinal light-sensing pathway represents a novel aspect of inner retinal
function, and we are still in the early stages of understanding the basic mechanisms of this
system.How important this pathway is to the performance of our visual system, and how it is
affected in retinal diseases remains largely unknown. PIPR as an objective and relatively
convenient assessment of melanopsin photoactivity is particularly useful in providing in vivo
evidence to address melanopsin/ipRGC-related clinical questions. Secondly, clinical
observations indicate that ipRGCs may be relatively spared in the advanced stages of many
retinal diseases. For example, early chromatic pupillometry studies also showed that impaired
PIPR was observed in advanced glaucoma, but not in early glaucoma, which is consistent with
the evidence from experimental animal glaucoma models that melanopsin-containing ipRGCs
are relatively resilient to glaucomatous damage compared to conventional retinal ganglions cells.
It has also been observed that in patients with severe retinitis pigmentosa, despite non-recordable
ERG, the pupillary light reflex is still well preserved. In fact, a preserved pupil reaction to light
in blind patients was one of the earliest clues that eventually led to the discovery of melanopsin-
containing ipRGCs (Klerman, Shanahan et al. 2002; Zaidi, Hull et al. 2007). This evidence
hinted at a potentially important clinical application of chromatic pupillometry--to monitor
disease progression and the efficacy of therapeutic intervention in the end-stage of retinal
diseases, where the other conventional functional indices, such as ERG and visual fields, are
diminished. Last but not least, while conventional functional assessments including visual acuity,
contrast sensitivity, visual field and ERG are all dependent on phototransduction of rods and
cones, melanopsin-driven PIPR is purely an index of inner retinal function independent of rods
and cones, as evidenced by the fact that PIPR remained largely unchanged even when the
synaptic input from outer retinal was pharmaceutically blocked or mechanically removed
(Gamlin, McDougal et al. 2007). This unique property may be very useful in certain clinical
circumstances. For example, a 65 year-old completely blind man with end-stage outer retinal
degeneration wanted to know if he would benefit from the newly approved retinal implants that
restore vision by using a microelectrode array to stimulate retinal ganglion cells. In this clinical
scenario, ERG and visual fields are not useful because of the lack of rod and cone function.
However, melanopsin-driven PIPR may provide critical information to objectively and

98
quantitatively determine how much retinal ganglion cell function is preserved, provided that the
functional status of ipRGCs can serve as a proxy of the overall health of retinal ganglion cells.
The knowledge generated in this thesis facilitates the application of PIPR testing as a
functional assessment of melanopsin/ipRGC in both clinical and basic science research setting.
In Chapter 3, we described a methodology to induce and compare differential PIPR using upper
and lower hemifield, central-field and full-field stimulation. The results showed that hemifield,
central-field and full-field stimuli induce increasingly greater maximum pupil constriction and
PIPR, indicating that melanopsin-driven pupil response may have a linear spatial summation
property. As expected, upper and lower hemifield blue light stimuli induced similar maximum
pupil constriction and PIPR, with the pupil tracings being essentially overlapping. Being able to
adjust the stimulation area and induce PIPR from different regions of retina using one
pupillometry setup may facilitate the localization of retinal damage and expand the clinical
utility of PIPR testing. Because full-field PIPR assesses the melanopsin-driven ipRGC function
across the whole retina, it can be used when the involvement of ipRGC is expected to be
generalized, such as end-stage glaucoma or retinal dystrophies, or in conditions where
melanopsin-driven photo-sensing function is considered as a whole, such as seasonal affective
disorder or circadian rhythm-related investigations. Central-field stimulation is more appropriate
when retina disease is confined to the posterior pole such as maculopathy (Augood, Vingerling et
al. 2006). Comparing upper and lower hemifield responses are particularly useful in conditions
where retinal ganglion cell damage is topographically asymmetric, e.g. early glaucoma and
anterior ischemic optic neuropathy (Hart and Becker 1982; DeLeón-Ortega, Carroll et al. 2007).
Besides clinical applications, PIPR testing obviously has important applications in basic
science research as well. In Chapter 4, we investigated the effect of red light exposure on blue-
light induced PIPR in an effort to provide in vivo evidence of the mechanism of melanopsin in
vivo chromophore regeneration and the interaction between extrinsic/intrinsic ipRGC activities.
The ability of our full-field chromatic pupillometry protocol to induce large PIPR that lasts tens
of seconds with a brief blue flash makes it a convenient platform to conduct a novel experimental
“double flash” paradigm: A brief melanopsin-activating blue light flash was employed to induce
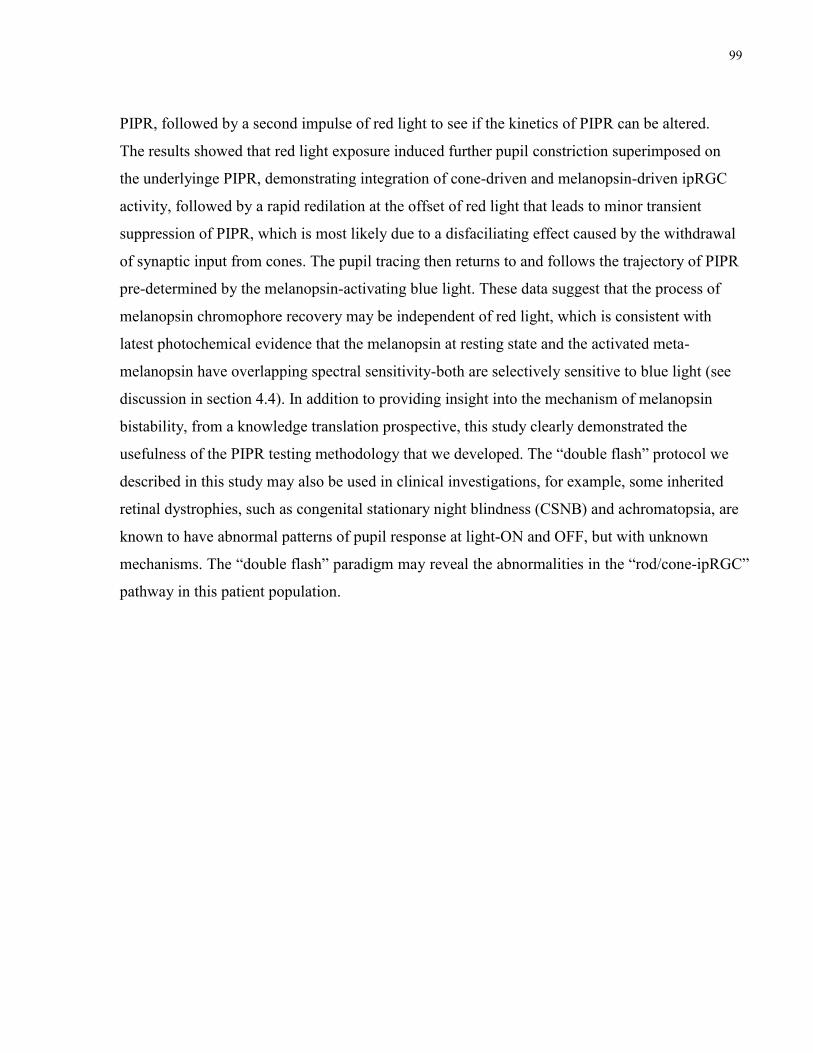
99
PIPR, followed by a second impulse of red light to see if the kinetics of PIPR can be altered.
The results showed that red light exposure induced further pupil constriction superimposed on
the underlyinge PIPR, demonstrating integration of cone-driven and melanopsin-driven ipRGC
activity, followed by a rapid redilation at the offset of red light that leads to minor transient
suppression of PIPR, which is most likely due to a disfaciliating effect caused by the withdrawal
of synaptic input from cones. The pupil tracing then returns to and follows the trajectory of PIPR
pre-determined by the melanopsin-activating blue light. These data suggest that the process of
melanopsin chromophore recovery may be independent of red light, which is consistent with
latest photochemical evidence that the melanopsin at resting state and the activated meta-
melanopsin have overlapping spectral sensitivity-both are selectively sensitive to blue light (see
discussion in section 4.4). In addition to providing insight into the mechanism of melanopsin
bistability, from a knowledge translation prospective, this study clearly demonstrated the
usefulness of the PIPR testing methodology that we developed. The “double flash” protocol we
described in this study may also be used in clinical investigations, for example, some inherited
retinal dystrophies, such as congenital stationary night blindness (CSNB) and achromatopsia, are
known to have abnormal patterns of pupil response at light-ON and OFF, but with unknown
mechanisms. The “double flash” paradigm may reveal the abnormalities in the “rod/cone-ipRGC”
pathway in this patient population.

100
Chapter 6
6 Conclusions
In conclusion, the experimental work of this thesis developed a novel chromatic
pupillometry system where the stimulation area can be adjusted to induce melanopsin-driven
PIPR from upper and lower hemifield, central-field and full-field stimulation. The results showed
that upper/lower hemifields, central-field and full-field stimulation induced increasingly larger
PIPR, with the upper and lower hemifield PIPR being symmetric and highly overlapping. Full-
field and central-field PIPR have good test-retest reliability with either a single measure or an
average of multiple measures. Acceptable test-retest reliability of hemifield PIPR can be
obtained by using the average of multiple measures.
The full-field PIPR testing protocol was then used to investigate the effect of red light
exposure on pre-existing PIPR. It was demonstrated that impulses of red light exposure presented
over a large range of intensities, durations and at two different time points in the PIPR time
course induced further pupil constriction superimposed on the pre-existing PIPR, demonstrating
integration of cone-driven and melanopsin-driven ipRGC activity, followed by a rapid re-dilation
at the offset of red light that leads to minor transient suppression of PIPR, which is most likely
due to iris dilator muscle overshoot or brief suppression of ipRGC caused by the withdrawal of
cone-driven input to ipRGC. The pupil tracing then returns to and follows the trajectory of PIPR
pre-determined by the melanopsin-activating blue light. The absence of a red light attenuating
effect on PIPR argues against the idea that the melanopsin chromophore regeneration may be
dependent on red light, rather it is consistent with latest photochemical evidence that the
melanopsin at resting state and the activated meta-melanopsin are both selectively sensitive to
blue light.
The experimental apparatus and paradigm described in this thesis represent refinements
to the current methodology of using chromatic pupillometry to investigate melanopsin-driven
intrinsic ipRGC photoactivity. The results enhance the understanding of the characteristics of

101
melanopsin-driven PIPR, and may have important applications in both clinical and basic visual
science research.

102
Chapter 7
7 Future directions
Knowledge and experience of using chromatic pupillometry to measure PIPR as an in
vivo index of melanopsin-driven intrinsic ipRGC photoactivity has been accumulating, and
intriguing questions have been emerging during the course of the above-described thesis projects,
paving the road for further investigation. As part of my graduate studies, I have directly
contributed to the initiation of several projects using chromatic pupillometry to investigate ocular
diseases. Although these on-going projects have not produced enough data for them to be
included as separate chapters in this thesis due to the pace of patient recruitment, I would like to
briefly describe them here as future directions.
7.1 Using hemifield, central field and full-field chromatic pupillometry to investigate melanopsin-driven post-illumination pupil response in glaucoma patients
7.1.1 Introduction
Glaucoma is a grouping of eye diseases that result in loss of retinal ganglion cells in a
characteristic pattern, with increased intraocular pressure (IOP) being the most important and
only modifiable risk factor. The functional assessment of glaucoma has long relied on automated
perimetry for detection of the glaucomatous visual field damage, which is a time-consuming and
subjective test. The clinical application of visual field testing in glaucoma is limited by the fact
that the relation between the proportional losses of ganglion cells and visual field function is
nonlinear: 30%-50% percent of retinal ganglion cells may have died before the earliest visual
field changes can be detected (Harwerth, Carter-Dawson et al. 1999). In late stage disease, it may
be difficult to monitor disease progression in advanced glaucoma when patients’ visual function
becomes too poor to perform perimetry testing. There is a need to improve the functional
assessment of retinal ganglion cell loss in glaucoma.

103
PIPR is an in vivo index of melanopsin-driven intrinsic photoactivity of ipRGCs.
Chromatic pupillometry measurement of PIPR may offer a new objective assessment of a novel
aspect of retinal ganglion cell function in glaucoma. However, very little is known about the
ipRGC involvement in glaucoma. Evidence from flat-mounted rat retinas indicated that
surgically induced ocular hypertension for 12 weeks does not cause significant ipRGC
morphologic changes or cell loss, whereas non–melanopsin-labeled superior colliculus-
projecting retinal ganglion cells do exhibit significant loss (Li, Chen et al. 2006). It was inferred
that ipRGCs are more resistant to hypertension injury (Li, Chen et al. 2006). In another similar
study, reduced ipRGC density was observed, but there was no change in soma size and dendritic
morphology in the remaining ipRGCs (Wang, Lu et al. 2008). There is, however, anecdotal
evidence showing no immunoreactivity of the ipRGC photopigment melanopsin in one patient
with longstanding glaucoma (Hannibal, Hindersson et al. 2004). Moreover, patients with
advanced glaucoma show reduced melatonin suppression, indicating that ipRGC function may be
affected (Pérez-Rico, de la Villa et al. 2010). Recently Kankipati et al. (Kankipati, Girkin et al.
2011) demonstrated reduced ipRGC-mediated PIPR in advanced glaucoma using chromatic
pupillometry. In a separate study, Feigl et al (Feigl, Mattes et al. 2011) also showed that PIPR
was reduced in advanced glaucoma, but not in early glaucoma. These studies indicated that PIPR
has potential to become a clinical indicator of progressive changes in glaucoma.
Glaucoma does not result in uniform loss of ganglion cells across the retina, rather the
damage is often asymmetric, with the lower half of the retina more severely affected than the
upper half (Jakobs, Libby et al. 2005). Glaucoma hemifield analysis that tests for asymmetry
between the superior and inferior visual fields is a commonly used perimetry test that enhances
early detection of the disease (Asman and Heijl 1992). However, hemifield comparison of
ipRGC photosensitivity has not been investigated in glaucoma patients. In this ongoing study, we
are investigating the melanopsin-driven PIPR in normal controls and patients with glaucoma of
variable severity using the optimized hemifield, central-field and full-field PIPR testing protocols
developed in Chapter 3 of this thesis. We hypothesize that early glaucoma will show asymmetric
hemifield PIPR, thus allowing early detection of ipRGC impairment in glaucoma. We predict
reduced central-field and full-field PIPR will be seen in intermediate and advanced glaucoma.

104
We will also investigate the correlation between PIPR and conventional structural and functional
assessments in glaucoma, such as the thickness of the retinal ganglion cell layer and visual field
function.
7.1.2 Methods
Clinical records and perimetry databases from a glaucoma clinic are being reviewed to
identify patients ranging in age from 17-70 with an established diagnosis of primary open angle
glaucoma (POAG), low tension glaucoma (LTG), normal tension glaucoma (NTG) or juvenile
open angle glaucoma (JOAG). Normal adult control participants are being recruited through
advertising flyers. Information including age, gender, refractive error and ocular history are
recorded for each participant. For patients, their visual fields are also being obtained from the
perimetry database. All participants undergo an ocular examination, where visual acuity,
intraocular pressure, iris structures, status of lens and retina are assessed. Any individual who has
any of the following conditions in one or both eyes is excluded:
1. Intraocular surgery except uncomplicated cataract extraction and IOL implant,
uncomplicated trabeculectomy or glaucoma valve implant > 1 year
2. Glaucoma suspect or ocular hypertension
3. Currently use of tamsulosin
4. Currently use of mydriatic or miotic eye drops
5. Refractive error > 5 diopters
6. Eye trauma
7. Optic neuropathy unrelated to glaucoma
8. Secondary glaucoma (pseudoexfoliation, pigment dispersion glaucoma, neovascular
glaucoma)
9. Shallow anterior chamber
10. Angle closure glaucoma
11. Uveitis
12. Diabetic retinopathy
13. Retinal detachment
14. Lens opacity score>2 (for nuclear, subcapsular, and cortical cataracts)

105
15. History of CNVM/injections, or geographic atrophy causing <20/200 vision
16. Any other conditions that may compromise the integrity of the pupillary light reflex
pathway upstream of the retina
Glaucoma patients are sub-stratified into 4 sub-groups according to the severity of their
glaucomatous visual field damage as measured by mean deviation (MD) on Humphrey perimetry.
Early Glaucoma: MD < -6.00 dB
Moderate Glaucoma: MD of -6.00 to -12.00 dB
Advanced Glaucoma: MD of -12.01 to -20.00 dB
End-Stage Glaucoma: Unable to perform Humphrey visual fields attributable to central
scotoma or visual acuity of 20/200 or worse, attributable to primary open-angle
glaucoma.
We aim to recruit 20 patients from each of the 4 sub-groups and 20 age-matched control
participants. PIPR from upper and lower hemifield, central-field and full-field is being measured
using the apparatus and protocols described in Chapter 3.
7.1.3 Preliminary testing data
Despite that the number of tested subjects in this on-going study is still too small to draw
any scientific conclusions, preliminary individual data have demonstrated some interesting
patterns of PIPR changes in glaucoma. Sample data from glaucoma patients are demonstrated in
comparison to normal controls in Figure 16. The data show that PIPR waveforms in a patient
with early glaucoma are similar to that of the normal control, suggesting normal ipRGC
photoactivity in early glaucoma; Hemifield and central-field PIPR is severely reduced in a
patient with advanced glaucoma, but full-field PIPR is much less impacted. Interestingly, the
maximum pupil constriction to red stimulation is normal, indicating non-linear relation between
intrinsic and extrinsic ipRGC photoactivity. Diminished PIPR was recorded in a patient with
106
end-stage glaucoma, suggesting that both intrinsic and extrinsic ipRGC photoactivity are
severely impaired.
These data were sampled from a few individual patients, so they should be interpreted
with caution. More subjects are needed to properly evaluate the utility of PIPR testing as an
objective functional assessment for glaucoma.
Figure 16. Individual PIPR testing results from visually normal participants and
participants with glaucoma. (a) Hemifield, central-field and full-field PIPR in a normal

107
participant. (b) PIPR waveforms in a patient with early glaucoma are similar to those of
the normal control, suggesting normal ipRGC photoactivity in early glaucoma. (c)
Hemifield and central-field PIPR is severely reduced in a patient with advanced glaucoma,
but full-field PIPR is much less impacted. Interestingly, the maximum pupil constriction to
red stimulation is normal, indicating non-linear relation between intrinsic and extrinsic
ipRGC photoactivity. (d) Diminished PIPR in a patient with end-stage glaucoma,
suggesting that both intrinsic and extrinsic ipRGC photoactivity are severely impaired.
7.2 Using chromatic pupillometry to investigate retinal dystrophies
Besides inducing and measuring melanopsin-driven PIPR, chromatic pupillometry can
also evaluate rod and cone input to the ipRGC pathway (Park, Moura et al. 2011). It can
potentially be an adjunct to ERG testing in the diagnosis and monitoring of inherited retinal
dystrophies (Park, Moura et al. 2011; Kawasaki, Crippa et al. 2012). As an objective assessment
of retinal function in these disease populations, chromatic pupillometry may be particularly
useful in the two following situations. Firstly, in the advanced stage of progressive degenerative
outer retinal dystrophies, such as retinitis pigmentosa, ERG is non-recordable despite that
patients may still have a moderate number of functioning rods/cones and preserved ipRGCs
(Kardon, Anderson et al. 2011; Kawasaki, Crippa et al. 2012; Kawasaki, Munier et al. 2012). In
this situation, chromatic pupillometry evaluating rod, cone and melanopsin contributions to the
pupillary light reflex could serve as a substitute for ERG to monitor disease progression into the
end stage. Secondly, there are many clinical phenomena suggesting that certain subtypes of
congenital retinal dystrophies may have an abnormal pattern of circuitry in the ipRGC pathway.
For example, a paradoxical pupil constriction at the offset of light stimulation is observed
clinically in patients with congenital stationary night blindness (CSNB) and achromatopsia
(Barricks, Flynn et al. 1977; Flynn, Kazarian et al. 1981; Price, Thompson et al. 1985; Simon,
Abraham et al. 2004). The mechanism for this strange pupillary light reflex is still unclear. Based
on the updated knowledge that the afferent signal for the pupillary light reflex is mediated by

108
ipRGCs integrating rod/cone-driven extrinsic photoactivity and their own melanopsin-driven
intrinsic photoactivity, this paradoxical pupil response may suggest abnormally enhanced rod or
cone input via the OFF-bipolar cells to ipRGCs. Furthermore, photophobia is a prominent
clinical feature in many retinal dystrophies (Digre and Brennan 2012) such as achromatopsia,
(Simon, Abraham et al. 2004) bradyopsia (Kuburas, Thompson et al. 2014) and Leber’s
congenital amaurosis (Weleber, Francis et al. 2013). There is growing evidence suggesting that
the ipRGC-mediated irradiance measuring pathway consists of the afferent limb of photophobic
sensation (Noseda, Kainz et al. 2009; Noseda and Burstein 2011; Digre and Brennan 2012).
Meanwhile, abnormally enhanced and prolonged rod or cone-driven pupil responses have also
been reported in patients with achromatopsia (Lisowska, Lisowski et al. 2015) and in an animal
model of bradyopsia (Kuburas, Thompson et al. 2014). Collectively, these findings suggest that
abnormally enhanced rod/cone input to the ipRGC pathway may cause photophobia in congenital
retinal dystrophies. Chromatic pupillometry may be a useful tool to reveal the putative abnormal
retinal circuitry in the ipRGC irradiance measuring pathway in these disease populations.
In preparation for investigating retinal dystrophies, we have created a comprehensive
chromatic pupillometry protocol to investigate the contributions of rod/cone-driven extrinsic
ipRGC activity and melanopsin-driven intrinsic ipRGC activity to the pupillary light reflex:
After 30 minutes of dark adaptation, alternating dim blue and red flashes (0.1 cd/m2, 4 ms) will
be presented in 15 seconds intervals to induce dark-adapted (scotopic) rod and cone-driven pupil
responses, followed by 15 s of exposure to alternating red and blue light of increasing intensity
(0.1, 1, 10, 100 cd/m2) to assess the light-ON and light-OFF pupil responses, then bright red and
blue flashes (400 cd/m2, 400 ms) will be used to induce the light-adapted (photopic) cone
response and melanopsin-driven PIPR. (Figure 17) This study is currently in the pilot-testing
stage to characterize the chromatic pupil response in patients with retinal dystrophies.

109
Figure 17. Waveforms of comprehensive chromatic pupillometry testing. (a) pupil
responses induced by 0.1 cd/m2, 400 ms dim blue and red light stimuli presented to dark-
adapted eyes, assessing the scotopic rod and cone-driven responses. (b) Pupil responses
stimulated by 400 cd/m2, 400 ms bright red and blue flashes to light-adapted eyes, assessing
the photopic cone-driven response and the melanopsin-driven PIPR. (c) Step-wise long
exposures to alternating red and blue light inducing the light-ON and light-OFF pupil
responses.

110
References
Altimus, C. M., A. D. Güler, et al. (2010). "Rod photoreceptors drive circadian photoentrainment
across a wide range of light intensities." Nature neuroscience 13(9): 1107-1112.
Arendt, D. (2003). "Evolution of eyes and photoreceptor cell types." International Journal of
Developmental Biology 47(7/8): 563-572.
Arendt, D., K. Tessmar-Raible, et al. (2004). "Ciliary photoreceptors with a vertebrate-type opsin
in an invertebrate brain." Science 306(5697): 869-871.
Asman, P. and A. Heijl (1992). "Glaucoma Hemifield Test. Automated visual field evaluation."
Archives of ophthalmology 110(6): 812-819.
Augood, C. A., J. R. Vingerling, et al. (2006). "Prevalence of age-related maculopathy in older
Europeans: the European Eye Study (EUREYE)." Archives of ophthalmology 124(4): 529-535.
Barnard, A. R., J. M. Appleford, et al. (2004). "Residual photosensitivity in mice lacking both
rod opsin and cone photoreceptor cyclic nucleotide gated channel 3 [alpha] subunit." Visual
neuroscience 21(05): 675-683.
Barrett, P. (2001). "Assessing the reliability of rating data." Retrieved March 25: 2002.
Barricks, M. E., J. T. Flynn, et al. (1977). "Paradoxical pupillary responses in congenital
stationary night blindness." Archives of ophthalmology 95(10): 1800-1804.

111
Baver, S. B., G. E. Pickard, et al. (2008). "Two types of melanopsin retinal ganglion cell
differentially innervate the hypothalamic suprachiasmatic nucleus and the olivary pretectal
nucleus." European Journal of Neuroscience 27(7): 1763-1770.
Belenky, M. A., C. A. Smeraski, et al. (2003). "Melanopsin retinal ganglion cells receive bipolar
and amacrine cell synapses." Journal of Comparative Neurology 460(3): 380-393.
Berson, D. M. (2003). "Strange vision: ganglion cells as circadian photoreceptors." Trends in
neurosciences 26(6): 314-320.
Berson, D. M., A. M. Castrucci, et al. (2010). "Morphology and mosaics of melanopsin‐expressing retinal ganglion cell types in mice." Journal of Comparative Neurology 518(13):
2405-2422.
Berson, D. M., F. A. Dunn, et al. (2002). "Phototransduction by retinal ganglion cells that set the
circadian clock." Science 295(5557): 1070-1073.
Brainard, G. C., J. P. Hanifin, et al. (2001). "Action spectrum for melatonin regulation in
humans: evidence for a novel circadian photoreceptor." The journal of Neuroscience 21(16):
6405-6412.
Brown, T. M. and H. D. Piggins (2007). "Electrophysiology of the suprachiasmatic circadian
clock." Progress in neurobiology 82(5): 229-255.
Brown, T. M., J. Wynne, et al. (2011). "Multiple hypothalamic cell populations encoding distinct
visual information." The Journal of physiology 589(5): 1173-1194.
Chang, D. S., K. S. Arora, et al. (2013). "Development and Validation of an Associative Model
for the Detection of Glaucoma Using Pupillography." American journal of ophthalmology
156(6): 1285-1296. e1282.

112
Crespo, D., D. D. O'Leary, et al. (1985). "Changes in the numbers of optic nerve fibers during
late prenatal and postnatal development in the albino rat." Developmental Brain Research 19(1):
129-134.
Dacey, D. M., H.-W. Liao, et al. (2004). "Melanopsin-expressing ganglion cells in primate retina
project to the LGN and signal both color and irradiance." Journal of Vision 4(11): 19-19.
Dacey, D. M., H.-W. Liao, et al. (2005). "Melanopsin-expressing ganglion cells in primate retina
signal colour and irradiance and project to the LGN." Nature 433(7027): 749-754.
Dacey, D. M., B. B. Peterson, et al. (2003). "Fireworks in the primate retina: in vitro
photodynamics reveals diverse LGN-projecting ganglion cell types." Neuron 37(1): 15-27.
Davignon, I., M. Barnard, et al. (1996). "Gene Structure of MurineGna11andGna15: Tandemly
Duplicated Gq Class G Protein α Subunit Genes." Genomics 31(3): 359-366.
DeLeón-Ortega, J., K. E. Carroll, et al. (2007). "Correlations between retinal nerve fiber layer
and visual field in eyes with nonarteritic anterior ischemic optic neuropathy." American journal
of ophthalmology 143(2): 288-294. e282.
Demb, J. B. (2008). "Functional circuitry of visual adaptation in the retina." The Journal of
physiology 586(18): 4377-4384.
Digre, K. B. and K. Brennan (2012). "Shedding light on photophobia." Journal of neuro-
ophthalmology: the official journal of the North American Neuro-Ophthalmology Society 32(1):
68.

113
Do, M. T. H., S. H. Kang, et al. (2009). "Photon capture and signalling by melanopsin retinal
ganglion cells." Nature 457(7227): 281-287.
Do, M. T. H. and K.-W. Yau (2010). "Intrinsically photosensitive retinal ganglion cells."
Physiological reviews 90(4): 1547-1581.
Dumitrescu, O. N., F. G. Pucci, et al. (2009). "Ectopic retinal ON bipolar cell synapses in the
OFF inner plexiform layer: contacts with dopaminergic amacrine cells and melanopsin ganglion
cells." Journal of Comparative Neurology 517(2): 226-244.
Ebihara, S. and K. Tsuji (1980). "Entrainment of the circadian activity rhythm to the light cycle:
effective light intensity for a Zeitgeber in the retinal degenerate C3H mouse and the normal
C57BL mouse." Physiology & behavior 24(3): 523-527.
Ebrey, T. and Y. Koutalos (2001). "Vertebrate photoreceptors." Progress in retinal and eye
research 20(1): 49-94.
Ecker, J. L., O. N. Dumitrescu, et al. (2010). "Melanopsin-expressing retinal ganglion-cell
photoreceptors: cellular diversity and role in pattern vision." Neuron 67(1): 49-60.
Estevez, M. E., P. M. Fogerson, et al. (2012). "Form and function of the M4 cell, an intrinsically
photosensitive retinal ganglion cell type contributing to geniculocortical vision." The Journal of
Neuroscience 32(39): 13608-13620.
Fain, G. L., R. Hardie, et al. (2010). "Phototransduction and the evolution of photoreceptors."
Current Biology 20(3): R114-R124.
Feigl, B., D. Mattes, et al. (2011). "Intrinsically photosensitive (melanopsin) retinal ganglion cell
function in glaucoma." Investigative ophthalmology & visual science 52(7): 4362-4367.
114
Feigl, B. and A. J. Zele (2014). "Melanopsin-expressing intrinsically photosensitive retinal
ganglion cells in retinal disease." Optometry & Vision Science 91(8): 894-903.
Flynn, J. T., E. Kazarian, et al. (1981). "Paradoxical pupil in congenital achromatopsia."
International ophthalmology 3(2): 91-96.
Foster, R., I. Provencio, et al. (1991). "Circadian photoreception in the retinally degenerate
mouse (rd/rd)." Journal of Comparative Physiology A 169(1): 39-50.
Freedman, M. S., R. J. Lucas, et al. (1999). "Regulation of mammalian circadian behavior by
non-rod, non-cone, ocular photoreceptors." Science 284(5413): 502-504.
Fu, Y., H.-W. Liao, et al. (2005). "Non-image-forming ocular photoreception in vertebrates."
Current opinion in neurobiology 15(4): 415-422.
Fu, Y. and K.-W. Yau (2007). "Phototransduction in mouse rods and cones." Pflügers Archiv-
European Journal of Physiology 454(5): 805-819.
Gamlin, P. D., D. H. McDougal, et al. (2007). "Human and macaque pupil responses driven by
melanopsin-containing retinal ganglion cells." Vision research 47(7): 946-954.
Gollisch, T. and M. Meister (2010). "Eye smarter than scientists believed: neural computations in
circuits of the retina." Neuron 65(2): 150-164.
Gooley, J. J., J. Lu, et al. (2001). "Melanopsin in cells of origin of the retinohypothalamic tract."
Nature neuroscience 4(12): 1165-1165.

115
Gooley, J. J., J. Lu, et al. (2003). "A broad role for melanopsin in nonvisual photoreception." The
Journal of Neuroscience 23(18): 7093-7106.
Göz, D., K. Studholme, et al. (2008). "Targeted destruction of photosensitive retinal ganglion
cells with a saporin conjugate alters the effects of light on mouse circadian rhythms." PloS one
3(9): e3153.
Graham, D. M., K. Y. Wong, et al. (2008). "Melanopsin ganglion cells use a membrane-
associated rhabdomeric phototransduction cascade." Journal of neurophysiology 99(5): 2522-
2532.
Güler, A. D., J. L. Ecker, et al. (2008). "Melanopsin cells are the principal conduits for rod–cone
input to non-image-forming vision." Nature 453(7191): 102-105.
Hannibal, J., P. Hindersson, et al. (2002). "The photopigment melanopsin is exclusively present
in pituitary adenylate cyclase-activating polypeptide-containing retinal ganglion cells of the
retinohypothalamic tract." The Journal of neuroscience: the official journal of the Society for
Neuroscience 22(1): RC191-RC191.
Hannibal, J., P. Hindersson, et al. (2004). "Melanopsin is expressed in PACAP-containing retinal
ganglion cells of the human retinohypothalamic tract." Investigative ophthalmology & visual
science 45(11): 4202-4209.
Hardie, R. and M. Postma (2008). "1.05 Phototransduction in Microvillar Photoreceptors of
Drosophila and Other Invertebrates."
Hardie, R. C. (2001). "Phototransduction in Drosophila melanogaster." Journal of Experimental
Biology 204(20): 3403-3409.

116
Hart, W. M. and B. Becker (1982). "The onset and evolution of glaucomatous visual field
defects." Ophthalmology 89(3): 268-279.
Hartwick, A. T., J. R. Bramley, et al. (2007). "Light-evoked calcium responses of isolated
melanopsin-expressing retinal ganglion cells." The Journal of Neuroscience 27(49): 13468-
13480.
Harwerth, R. S., L. Carter-Dawson, et al. (1999). "Ganglion cell losses underlying visual field
defects from experimental glaucoma." Investigative ophthalmology & visual science 40(10):
2242-2250.
Hatori, M., H. Le, et al. (2008). "Inducible ablation of melanopsin-expressing retinal ganglion
cells reveals their central role in non-image forming visual responses." PloS one 3(6): e2451.
Hattar, S., M. Kumar, et al. (2006). "Central projections of melanopsin‐expressing retinal
ganglion cells in the mouse." Journal of Comparative Neurology 497(3): 326-349.
Hattar, S., H.-W. Liao, et al. (2002). "Melanopsin-containing retinal ganglion cells: architecture,
projections, and intrinsic photosensitivity." Science 295(5557): 1065-1070.
Hattar, S., R. J. Lucas, et al. (2003). "Melanopsin and rod–cone photoreceptive systems account
for all major accessory visual functions in mice." Nature 424(6944): 75-81.
Helfrich-Förster, C., C. Winter, et al. (2001). "The circadian clock of fruit flies is blind after
elimination of all known photoreceptors." Neuron 30(1): 249-261.
Herbst, K., B. Sander, et al. (2012). "Intrinsically photosensitive retinal ganglion cell function in
relation to age: a pupillometric study in humans with special reference to the age-related optic
properties of the lens." BMC ophthalmology 12(1): 4.
117
Herbst, K., B. Sander, et al. (2013). "Unilateral anterior ischemic optic neuropathy: chromatic
pupillometry in affected, fellow non-affected and healthy control eyes." Frontiers in neurology 4.
Herbst, K., B. Sander, et al. (2011). "Test–retest repeatability of the pupil light response to blue
and red light stimuli in normal human eyes using a novel pupillometer." Frontiers in neurology 2.
Hillman, P., S. Hochstein, et al. (1983). "Transduction in invertebrate photoreceptors: role of
pigment bistability." Physiol Rev 63(2): 668-772.
Hoshi, H., W.-L. Liu, et al. (2009). "ON inputs to the OFF layer: bipolar cells that break the
stratification rules of the retina." The Journal of Neuroscience 29(28): 8875-8883.
Hubbard, K. B. and J. R. Hepler (2006). "Cell signalling diversity of the Gqα family of
heterotrimeric G proteins." Cellular signalling 18(2): 135-150.
Jakobs, T. C., R. T. Libby, et al. (2005). "Retinal ganglion cell degeneration is topological but
not cell type specific in DBA/2J mice." The Journal of cell biology 171(2): 313-325.
Johnson, J., V. Wu, et al. (2010). "Melanopsin-dependent light avoidance in neonatal mice."
Proceedings of the National Academy of Sciences 107(40): 17374-17378.
Kahneman, D. (1973). Attention and effort, Citeseer.
Kahneman, D. and J. Beatty (1966). "Pupil diameter and load on memory." Science 154(3756):
1583-1585.

118
Kankipati, L., C. A. Girkin, et al. (2010). "Post-illumination pupil response in subjects without
ocular disease." Investigative ophthalmology & visual science 51(5): 2764.
Kankipati, L., C. A. Girkin, et al. (2011). "The post-illumination pupil response is reduced in
glaucoma patients." Investigative ophthalmology & visual science 52(5): 2287.
Kardon, R., S. C. Anderson, et al. (2009). "Chromatic pupil responses: preferential activation of
the melanopsin-mediated versus outer photoreceptor-mediated pupil light reflex."
Ophthalmology 116(8): 1564-1573.
Kardon, R., S. C. Anderson, et al. (2011). "Chromatic pupillometry in patients with retinitis
pigmentosa." Ophthalmology 118(2): 376-381.
Kawasaki, A., S. V. Crippa, et al. (2012). "Characterization of pupil responses to blue and red
light stimuli in autosomal dominant retinitis pigmentosa due to NR2E3 mutation." Investigative
ophthalmology & visual science 53(9): 5562-5569.
Kawasaki, A., S. V. Crippa, et al. (2012). "Characterization of pupil responses to blue and red
light stimuli in autosomal dominant retinitis pigmentosa due to NR2E3 mutation." Investigative
Ophthalmology and Visual Science 53(9): 5562-5569.
Kawasaki, A. and R. H. Kardon (2007). "Intrinsically photosensitive retinal ganglion cells."
Journal of Neuro-ophthalmology 27(3): 195-204.
Kawasaki, A., F. L. Munier, et al. (2012). "Pupillometric quantification of residual rod and cone
activity in leber congenital amaurosis." Archives of ophthalmology 130(6): 798-800.
Keeler, C. E. (1927). "Iris movements in blind mice." American Journal of Physiology--Legacy
Content 81(1): 107-112.

119
Keshavarzi, S., R. K. Sullivan, et al. (2014). "Functional properties and projections of neurons in
the medial amygdala." The Journal of Neuroscience 34(26): 8699-8715.
Klerman, E., T. Shanahan, et al. (2002). "Photic resetting of the human circadian pacemaker in
the absence of conscious vision." Journal of biological rhythms 17(6): 548-555.
Kolb, H. and R. Nelson (1995). The organization of photoreceptor to bipolar synapses in the
outer plexiform layer. Neurobiology and clinical aspects of the outer retina, Springer: 273-296.
Koyanagi, M., K. Kubokawa, et al. (2005). "Cephalochordate melanopsin: evolutionary linkage
between invertebrate visual cells and vertebrate photosensitive retinal ganglion cells." Current
Biology 15(11): 1065-1069.
Kuburas, A., S. Thompson, et al. (2014). "Photophobia and Abnormally Sustained Pupil
Responses in a Mouse Model of Bradyopsia." Investigative ophthalmology & visual science
55(10): 6878.
Lall, G. S., V. L. Revell, et al. (2010). "Distinct contributions of rod, cone, and melanopsin
photoreceptors to encoding irradiance." Neuron 66(3): 417-428.
Lei, S., H. C. Goltz, et al. (2014). "Full-field Chromatic Pupillometry for the Assessment of the
Postillumination Pupil Response Driven by Melanopsin-Containing Retinal Ganglion Cells."
Investigative ophthalmology & visual science 55(7): 4496-4503.
Lei, S., H. C. Goltz, et al. (2015). "Test–retest reliability of hemifield, central-field, and full-field
chromatic pupillometry for assessing the function of melanopsin-containing retinal ganglion
cells." Invest Ophthalmol Vis Sci 56: 1267-1273.

120
Li, R. S., B.-Y. Chen, et al. (2006). "Melanopsin-expressing retinal ganglion cells are more
injury-resistant in a chronic ocular hypertension model." Investigative ophthalmology & visual
science 47(7): 2951-2958.
Lin, B., S. W. Wang, et al. (2004). "Retinal ganglion cell type, size, and spacing can be specified
independent of homotypic dendritic contacts." Neuron 43(4): 475-485.
Lisowska, J., L. Lisowski, et al. (2015). "Chromatic pupillography in patients with
Achromatopsia." Investigative ophthalmology & visual science 56(7): 575-575.
Lockley, S. W., G. C. Brainard, et al. (2003). "High sensitivity of the human circadian melatonin
rhythm to resetting by short wavelength light." J Clin Endocrinol Metab 88(9): 4502-4505.
Lucas, R., S. Hattar, et al. (2003). "Diminished pupillary light reflex at high irradiances in
melanopsin-knockout mice." Science 299(5604): 245-247.
Lucas, R. J. (2006). "Chromophore regeneration: melanopsin does its own thing." Proceedings of
the National Academy of Sciences 103(27): 10153-10154.
Lucas, R. J. (2013). "Mammalian inner retinal photoreception." Current Biology 23(3): R125-
R133.
Lucas, R. J., R. H. Douglas, et al. (2001). "Characterization of an ocular photopigment capable
of driving pupillary constriction in mice." Nature neuroscience 4(6): 621-626.
Lucas, R. J., M. S. Freedman, et al. (2001). "Identifying the photoreceptive inputs to the
mammalian circadian system using transgenic and retinally degenerate mice." Behavioural brain
research 125(1): 97-102.

121
MacLennan, R. N. (1993). "Interrater reliability with SPSS for Windows 5.0." The American
Statistician 47(4): 292-296.
Maddess, T., Y.-L. Ho, et al. (2011). "Multifocal pupillographic perimetry with white and
colored stimuli." Journal of glaucoma 20(6): 336-343.
Matsuyama, T., T. Yamashita, et al. (2012). "Photochemical properties of mammalian
melanopsin." Biochemistry 51(27): 5454-5462.
Mawad, K. and R. N. Van Gelder (2008). "Absence of long-wavelength photic potentiation of
murine intrinsically photosensitive retinal ganglion cell firing in vitro." Journal of biological
rhythms 23(5): 387-391.
McDougal, D. H. and P. D. Gamlin (2010). "The influence of intrinsically-photosensitive retinal
ganglion cells on the spectral sensitivity and response dynamics of the human pupillary light
reflex." Vision research 50(1): 72-87.
McLaren, J. W., J. C. Erie, et al. (1992). "Computerized analysis of pupillograms in studies of
alertness." Invest. Ophthalmol. Vis. Sci 33(3): 671-676.
Montell, C. (2005). "The TRP superfamily of cation channels." Science Signaling 2005(272):
re3-re3.
Morin, L. P., J. H. Blanchard, et al. (2003). "Retinal ganglion cell projections to the hamster
suprachiasmatic nucleus, intergeniculate leaflet, and visual midbrain: bifurcation and melanopsin
immunoreactivity." Journal of Comparative Neurology 465(3): 401-416.
Mrosovsky, N. (1999). "Masking: history, definitions, and measurement." Chronobiology
international 16(4): 415-429.

122
Mrosovsky, N. and S. Hattar (2003). "Impaired masking responses to light in melanopsin-
knockout mice." Chronobiology international 20(6): 989-999.
Münch, M., L. Léon, et al. (2012). "Circadian and wake-dependent effects on the pupil light
reflex in response to narrow-bandwidth light pulses." Investigative ophthalmology & visual
science 53(8): 4546-4555.
Münch, M., L. Léon, et al. (2012). "Circadian and wake-dependent effects on the pupil light
reflex in response to narrow-bandwidth light pulses." Investigative Ophthalmology and Visual
Science 53(8): 4546-4555.
Mure, L. S., P.-L. Cornut, et al. (2009). "Melanopsin bistability: a fly's eye technology in the
human retina." PLoS One 4(6): e5991.
Mure, L. S., C. Rieux, et al. (2007). "Melanopsin-dependent nonvisual responses: evidence for
photopigment bistability in vivo." Journal of biological rhythms 22(5): 411-424.
Nelson, R. J. and I. Zucker (1981). "Absence of extraocular photoreception in diurnal and
nocturnal rodents exposed to direct sunlight." Comparative Biochemistry and Physiology Part A:
Physiology 69(1): 145-148.
Nissen, C., B. Sander, et al. (2011). "The effect of pupil size on stimulation of the melanopsin
containing retinal ganglion cells, as evaluated by monochromatic pupillometry." Frontiers in
neurology 2.
Nissen, C., B. Sander, et al. (2014). "Monochromatic pupillometry in unilateral glaucoma
discloses no adaptive changes subserved by the ipRGCs." Frontiers in neurology 5.

123
Noseda, R. and R. Burstein (2011). "Advances in understanding the mechanisms of migraine-
type photophobia." Current opinion in neurology 24(3): 197-202.
Noseda, R., V. Kainz, et al. (2009). A retinal-thalamic pathway for photophobia during migraine.
Cephalalgia, WILEY-BLACKWELL PUBLISHING, INC COMMERCE PLACE, 350 MAIN
ST, MALDEN 02148, MA USA.
Østergaard, J., J. Hannibal, et al. (2007). "Synaptic contact between melanopsin-containing
retinal ganglion cells and rod bipolar cells." Investigative ophthalmology & visual science 48(8):
3812-3820.
Panda, S., I. Provencio, et al. (2003). "Melanopsin is required for non-image-forming photic
responses in blind mice." Science 301(5632): 525-527.
Panda, S., T. K. Sato, et al. (2002). "Melanopsin (Opn4) requirement for normal light-induced
circadian phase shifting." Science 298(5601): 2213-2216.
Park, J. C., A. L. Moura, et al. (2011). "Toward a clinical protocol for assessing rod, cone, and
melanopsin contributions to the human pupil response." Investigative ophthalmology & visual
science 52(9): 6624.
Peirson, S. N., S. Halford, et al. (2009). "The evolution of irradiance detection: melanopsin and
the non-visual opsins." Philosophical Transactions of the Royal Society B: Biological Sciences
364(1531): 2849-2865.
Peirson, S. N., H. Oster, et al. (2007). "Microarray analysis and functional genomics identify
novel components of melanopsin signaling." Current Biology 17(16): 1363-1372.

124
Pérez-Rico, C., P. de la Villa, et al. (2010). "Evaluation of functional integrity of the
retinohypothalamic tract in advanced glaucoma using multifocal electroretinography and light-
induced melatonin suppression." Experimental eye research 91(5): 578-583.
Pianta, M. J. and M. Kalloniatis (2000). "Characterisation of dark adaptation in human cone
pathways: an application of the equivalent background hypothesis." The Journal of physiology
528(3): 591-608.
Price, M. J., H. S. Thompson, et al. (1985). "Pupillary constriction to darkness." British journal
of ophthalmology 69(3): 205-211.
Provencio, I., G. Jiang, et al. (1998). "Melanopsin: An opsin in melanophores, brain, and eye."
Proceedings of the National Academy of Sciences 95(1): 340-345.
Provencio, I., I. R. Rodriguez, et al. (2000). "A novel human opsin in the inner retina." The
journal of Neuroscience 20(2): 600-605.
Provencio, I., M. D. Rollag, et al. (2002). "Anatomy: Photoreceptive net in the mammalian
retina." Nature 415(6871): 493-493.
Qiu, X. and D. Berson (2007). "Melanopsin bistability in ganglion-cell photoreceptors." Invest
Ophthalmol Vis Sci 48: 612.
Rajaraman, K. (2012). "ON ganglion cells are intrinsically photosensitive in the tiger salamander
retina." Journal of Comparative Neurology 520(1): 200-210.
Ritter, E., K. Zimmermann, et al. (2004). "Transition of rhodopsin into the active metarhodopsin
II state opens a new light-induced pathway linked to Schiff base isomerization." Journal of
Biological Chemistry 279(46): 48102-48111.

125
Roecklein, K., P. Wong, et al. (2013). "The post illumination pupil response is reduced in
seasonal affective disorder." Psychiatry research 210(1): 150-158.
Rollag, M. D. (2008). "Does melanopsin bistability have physiological consequences?" Journal
of biological rhythms 23(5): 396-399.
Ruby, N. F., T. J. Brennan, et al. (2002). "Role of melanopsin in circadian responses to light."
Science 298(5601): 2211-2213.
Schmidt, T. M., N. M. Alam, et al. (2014). "A role for melanopsin in alpha retinal ganglion cells
and contrast detection." Neuron 82(4): 781-788.
Schmidt, T. M., S.-K. Chen, et al. (2011). "Intrinsically photosensitive retinal ganglion cells:
many subtypes, diverse functions." Trends in neurosciences 34(11): 572-580.
Schmidt, T. M., M. T. H. Do, et al. (2011). "Melanopsin-positive intrinsically photosensitive
retinal ganglion cells: from form to function." The Journal of Neuroscience 31(45): 16094-
16101.
Schmidt, T. M. and P. Kofuji (2009). "Functional and morphological differences among
intrinsically photosensitive retinal ganglion cells." The Journal of neuroscience 29(2): 476-482.
Schmidt, T. M. and P. Kofuji (2010). "Differential cone pathway influence on intrinsically
photosensitive retinal ganglion cell subtypes." The Journal of neuroscience 30(48): 16262-
16271.

126
Schmidt, T. M. and P. Kofuji (2011). "Structure and function of bistratified intrinsically
photosensitive retinal ganglion cells in the mouse." Journal of Comparative Neurology 519(8):
1492-1504.
Schmidt, T. M., K. Taniguchi, et al. (2008). "Intrinsic and extrinsic light responses in
melanopsin-expressing ganglion cells during mouse development." Journal of neurophysiology
100(1): 371-384.
Semo, M. a., S. Peirson, et al. (2003). "Melanopsin retinal ganglion cells and the maintenance of
circadian and pupillary responses to light in aged rodless/coneless (rd/rd cl) mice." European
Journal of Neuroscience 17(9): 1793-1801.
Sexton, T. J., M. Golczak, et al. (2012). "Melanopsin is highly resistant to light and chemical
bleaching in vivo." Journal of Biological Chemistry 287(25): 20888-20897.
Shand, J. and R. Foster (1999). The extraretinal photoreceptors of non-mammalian vertebrates.
Adaptive mechanisms in the ecology of vision, Springer: 197-222.
Shrout, P. E. and J. L. Fleiss (1979). "Intraclass correlations: uses in assessing rater reliability."
Psychological bulletin 86(2): 420.
Simon, G. B., F. Abraham, et al. (2004). "Pingelapese achromatopsia: correlation between
paradoxical pupillary response and clinical features." British journal of ophthalmology 88(2):
223-225.
Sollars, P. J., C. A. Smeraski, et al. (2003). "Melanopsin and non-melanopsin expressing retinal
ganglion cells innervate the hypothalamic suprachiasmatic nucleus." Visual neuroscience 20(06):
601-610.

127
Sun, W. and P. J. May (2014). "Central pupillary light reflex circuits in the cat: I. The olivary
pretectal nucleus." Journal of Comparative Neurology 522(18): 3960-3977.
Thapan, K., J. Arendt, et al. (2001). "An action spectrum for melatonin suppression: evidence for
a novel non‐rod, non‐cone photoreceptor system in humans." The Journal of physiology
535(1): 261-267.
Thompson, C. L., W. S. Blaner, et al. (2001). "Preservation of light signaling to the
suprachiasmatic nucleus in vitamin A-deficient mice." Proceedings of the National Academy of
Sciences 98(20): 11708-11713.
Tsai, J. W., J. Hannibal, et al. (2009). "Melanopsin as a sleep modulator: circadian gating of the
direct effects of light on sleep and altered sleep homeostasis in Opn4−/− mice." PLoS biology
7(6): e1000125.
Vigh, B., M. Manzano, et al. (2002). "Nonvisual photoreceptors of the deep brain, pineal organs
and retina." Histology and histopathology 17(2): 555-590.
Vincent, W. and J. Weir (1994). Statistics in kinesiology, Human Kinetics.
Viney, T. J., K. Balint, et al. (2007). "Local retinal circuits of melanopsin-containing ganglion
cells identified by transsynaptic viral tracing." Current Biology 17(11): 981-988.
Walker, M. T., R. L. Brown, et al. (2008). "Photochemistry of retinal chromophore in mouse
melanopsin." Proceedings of the National Academy of Sciences 105(26): 8861-8865.
Wang, H.-z., Q.-j. Lu, et al. (2008). "Loss of melanopsin-containing retinal ganglion cells in a rat
glaucoma model." Chinese Medical Journal (English Edition) 121(11): 1015.

128
Wang, T. and C. Montell (2007). "Phototransduction and retinal degeneration in Drosophila."
Pflügers Archiv-European Journal of Physiology 454(5): 821-847.
Warren, E. J., C. N. Allen, et al. (2003). "Intrinsic light responses of retinal ganglion cells
projecting to the circadian system." European Journal of Neuroscience 17(9): 1727-1735.
Warren, E. J., C. N. Allen, et al. (2006). "The light‐activated signaling pathway in SCN‐projecting rat retinal ganglion cells." European Journal of Neuroscience 23(9): 2477-2487.
Wässle, H., U. Grünert, et al. (1990). "Retinal ganglion cell density and cortical magnification
factor in the primate." Vision research 30(11): 1897-1911.
Weleber, R. G., P. J. Francis, et al. (2013). "Leber congenital amaurosis."
Wong, K. Y., F. A. Dunn, et al. (2005). "Photoreceptor adaptation in intrinsically photosensitive
retinal ganglion cells." Neuron 48(6): 1001-1010.
Wong, K. Y., F. A. Dunn, et al. (2007). "Synaptic influences on rat ganglion‐cell
photoreceptors." The Journal of physiology 582(1): 279-296.
Xue, T., M. Do, et al. (2011). "Melanopsin signalling in mammalian iris and retina." Nature
479(7371): 67-73.
Yamazaki, S., M. Goto, et al. (1999). "No evidence for extraocular photoreceptors in the
circadian system of the Syrian hamster." Journal of biological rhythms 14(3): 197-201.
Yau, K.-W. and R. C. Hardie (2009). "Phototransduction motifs and variations." Cell 139(2):
246-264.

129
Yoshimura, T. and S. Ebihara (1996). "Spectral sensitivity of photoreceptors mediating phase-
shifts of circadian rhythms in retinally degenerate CBA/J (rd/rd) and normal CBA/N (+/+) mice."
Journal of Comparative Physiology A 178(6): 797-802.
Young, R. S. and J. Kennish (1993). "Transient and sustained components of the pupil response
evoked by achromatic spatial patterns." Vision research 33(16): 2239-2252.
Zaidi, F. H., J. T. Hull, et al. (2007). "Short-wavelength light sensitivity of circadian, pupillary,
and visual awareness in humans lacking an outer retina." Current Biology 17(24): 2122-2128.