Embed Size (px)
Citation preview
Toward understanding the genetics of alcoholdrinking through transcriptome meta-analysisMegan K. Mulligan*†‡, Igor Ponomarev*†‡, Robert J. Hitzemann§, John K. Belknap§, Boris Tabakoff¶, R. Adron Harris*†,John C. Crabbe§, Yuri A. Blednov*†, Nicholas J. Grahame�, Tamara J. Phillips§, Deborah A. Finn§, Paula L. Hoffman¶,Vishwanath R. Iyer*,**, George F. Koob††, and Susan E. Bergeson*†‡‡
*Waggoner Center for Alcohol and Addiction Research and Sections of †Neurobiology and **Molecular Genetics and Microbiology, University of Texas,Austin, TX 78712; §Department of Veterans Affairs Medical Center, Portland Alcohol Research Center, and Department of Behavioral Neuroscience, OregonHealth and Science University, Portland, OR 97239; ¶University of Colorado Health Sciences Center, Aurora, CO 80045; �Indiana University School ofMedicine, Indianapolis, IN 46202; and ††The Scripps Research Institute, La Jolla, CA 92037
Edited by Floyd E. Bloom, The Scripps Research Institute, La Jolla, CA, and approved February 9, 2006 (received for review November 30, 2005)
Much evidence from studies in humans and animals supports thehypothesis that alcohol addiction is a complex disease with bothhereditary and environmental influences. Molecular determinantsof excessive alcohol consumption are difficult to study in humans.However, several rodent models show a high or low degree ofalcohol preference, which provides a unique opportunity to ap-proach the molecular complexities underlying the genetic predis-position to drink alcohol. Microarray analyses of brain gene ex-pression in three selected lines, and six isogenic strains of miceknown to differ markedly in voluntary alcohol consumption pro-vided >4.5 million data points for a meta-analysis. A total of 107arrays were obtained and arranged into six experimental data sets,allowing the identification of 3,800 unique genes significantly andconsistently changed between all models of high or low amountsof alcohol consumption. Several functional groups, includingmitogen-activated protein kinase signaling and transcription reg-ulation pathways, were found to be significantly overrepresentedand may play an important role in establishing a high level ofvoluntary alcohol drinking in these mouse models. Data from thegeneral meta-analysis was further filtered by a congenic strainmicroarray set, from which cis-regulated candidate genes for analcohol preference quantitative trait locus on chromosome 9 wereidentified: Arhgef12, Carm1, Cryab, Cox5a, Dlat, Fxyd6, Limd1,Nicn1, Nmnat3, Pknox2, Rbp1, Sc5d, Scn4b, Tcf12, Vps11, andZfp291 and four ESTs. The present study demonstrates the use of(i) a microarray meta-analysis to analyze a behavioral phenotype(in this case, alcohol preference) and (ii) a congenic strain foridentification of cis regulation.
alcoholism � gene expression � microarray
An understanding of the molecular mechanisms underlying thegenetic propensity toward excessive alcohol consumption is
crucial for the development of new treatments for alcoholism.Animal models for alcohol-related traits provide an importantopportunity to explore mechanisms responsible for different as-pects of the uniquely human disease (1). In particular, selected linesand inbred strains of mice with a divergence in voluntary alcoholdrinking represent valuable tools to dissect the genetic componentsof alcoholism (2, 6, 8, 9, §§). However, each model has differentadvantages. Inbred strains are homogeneous at all alleles, andgenetic (allelic) differences between strains lead to observed phe-notypic differences. Several inbred strains have been well charac-terized for numerous alcohol-related traits, but any two strains willdiffer for numerous other phenotypes (including gene expression),making identification of the specific genes for a given trait difficult.Selected lines exploit homozygosity for large-effect and somesmall-effect allelic variants that contribute to the divergent prefer-ence for drinking. Although the resulting genome remains relativelypolymorphic, as selection continues, fixation of genes unrelated tothe selected phenotype occurs because of drift.
We propose to identify candidate genes that contribute to thegenetic propensity to drink by combining whole-brain gene expres-sion databases of genetic mouse models with differences in volun-tary alcohol consumption. Most importantly, our approach shouldallow identification of small- or moderate-effect genes. Threedifferent sets of oppositely selected lines bred for high and lowamounts of alcohol drinking, five inbred strains known to differ involuntary alcohol consumption, and a hybrid strain recently shownto have the greatest degree of voluntary alcohol consumption of anyknown mouse genotype (4) were used (Table 1). Global measure-ment of brain gene expression in each of the mouse models allowedus to explore which transcripts are consistently changed in differentgenetic models of high and low amounts of alcohol intake. It isimportant to note that the mice used for array analysis were notexposed to alcohol; thus, we are defining the transcriptional sig-natures of genetic predisposition to high and low levels of alcoholconsumption. Expression analysis of an additional mouse linecongenic for a section of chromosome 9, which is known to containgenes that regulate alcohol consumption (3), allowed us to definecandidate quantitative trait genes (QTGs) for this quantitative traitlocus (QTL).
Analysis across data sets for common changes in expressionprovides more statistical power to detect small and reliable changesthan analysis of any one or two of the data sets. Meta-analyses ofdiverse gene expression data sets were recently used to successfullyuncover genes related to carcinogenic phenotypes (10), but a similarapproach has not been used for a neurobehavioral trait (for a reviewof meta-analyses of microarray data, see ref. 11). In this study, weemploy a meta-analysis of microarray data from different geneticmodels of high and low levels of alcohol consumption to definefunctional pathways and individual genes that may determine apredisposition for a high degree of alcohol intake.
Results and DiscussionUse of Cohen’s d as an Effect-Size Measure Allows Comparison ofMicroarray Experiments from Diverse Sources. Five experimentalmicroarray (Affymetrix and custom cDNA) data sets of micegenetically divergent in voluntary alcohol consumption were ana-lyzed for differential gene expression with the Cohen’s d statistic(12). The initial meta-analysis comprised 13 individual data setsfrom three groups of selected lines and one group of six isogenic
Conflict of interest statement: No conflicts declared.
This paper was submitted directly (Track II) to the PNAS office.
Abbreviations: B6, C57BL�6J; D2, DBA�2J; QTG, quantitative trait gene; QTL, quantitativetrait locus; TF, transcription factor; TFBS, TF binding site(s).
‡M.K.M. and I.P. contributed equally to this work.
‡‡To whom correspondence should be addressed at: Waggoner Center for Alcohol andAddiction Research and Section of Neurobiology, University of Texas, A4800,MBB1.138AA, 1 University Station, Austin, TX 78712. E-mail: [email protected].
§§Behm, A. L. L., Li, T. K. & Grahame, N. (2003) Alcohol. Clin. Exp. Res. 27, 49A, abstr.
© 2006 by The National Academy of Sciences of the USA
6368–6373 � PNAS � April 18, 2006 � vol. 103 � no. 16 www.pnas.org�cgi�doi�10.1073�pnas.0510188103
strains (Table 1). (A data set consisting of C57BL�6J (B6).DBA�2J(D2) congenic 9 animals is used later as a filter for the initialmeta-analysis.) Two advantages of the Cohen’s d approach areimportant. First, data from different platforms and laboratories canbe combined without the use of normalization. Second, smalldifferences that are consistent in direction of change can bedetected, even though these changes might not be detected in anysingle data set.
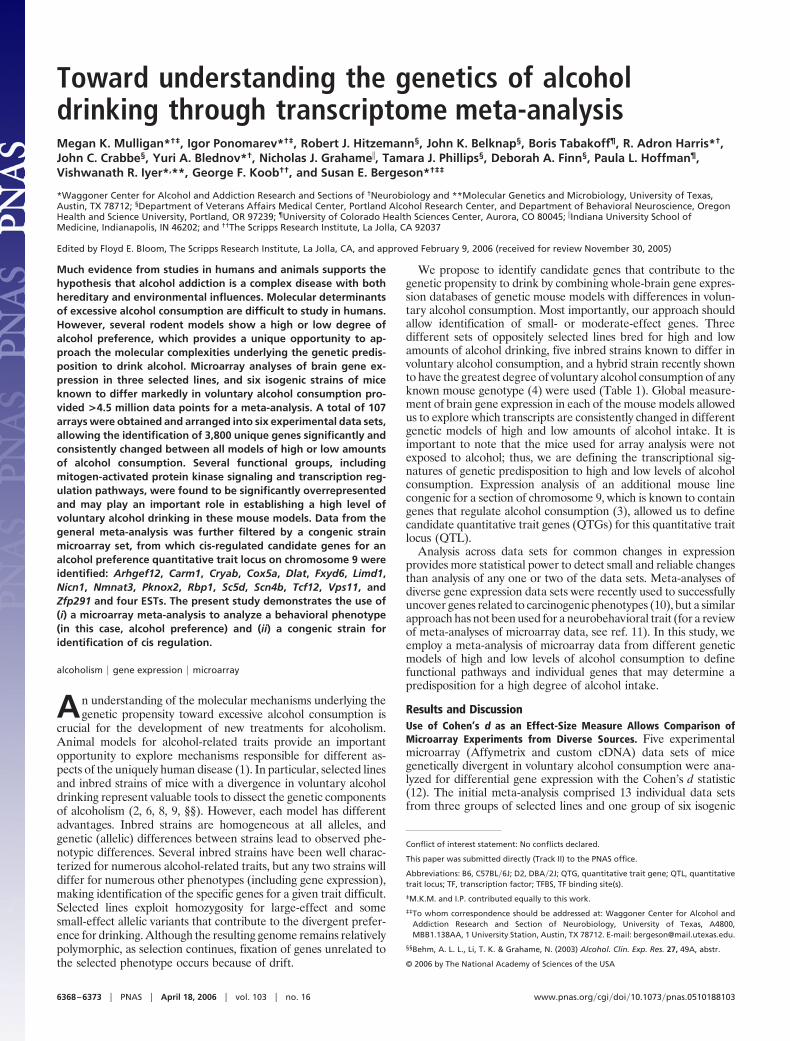
After calculating Cohen’s d for each data set (Fig. 1A), a pairwisecomparison of common changes was applied to test the compati-bility of the four data sets. The number of transcripts regulated inthe same direction between each pair of data sets is significantlygreater than the number ascribed to chance for five of six pairs.When all four data sets are compared, the number of transcriptsregulated in the same direction is nearly 2-fold over the chance level(P � 0.00001, �2). The lower similarity seen between selected lines
and inbred strains, compared with the pairs of selected lines, likelyreflects differences in genetic background, an enrichment of alleleslinked to alcohol preference in selected lines, and a relativerandomness of such alleles in inbred strains.
An overlap in regulation between mouse models sharing thesame alcohol phenotype is readily detectable despite the use of datasets from different animal models and platforms. The distributionof z test P values for the meta-analysis of the four data sets is skewedto the left, indicating a high number of significantly coexpressedgenes detected by the meta-analysis (Fig. 1B) and suggesting a lowincidence of false positives consistent with the measured Q values.Thus, the use of Cohen’s d in our meta-analysis allows for thedetection of transcripts significantly divergent between geneticallydistinct mouse models displaying opposite levels of alcoholconsumption.
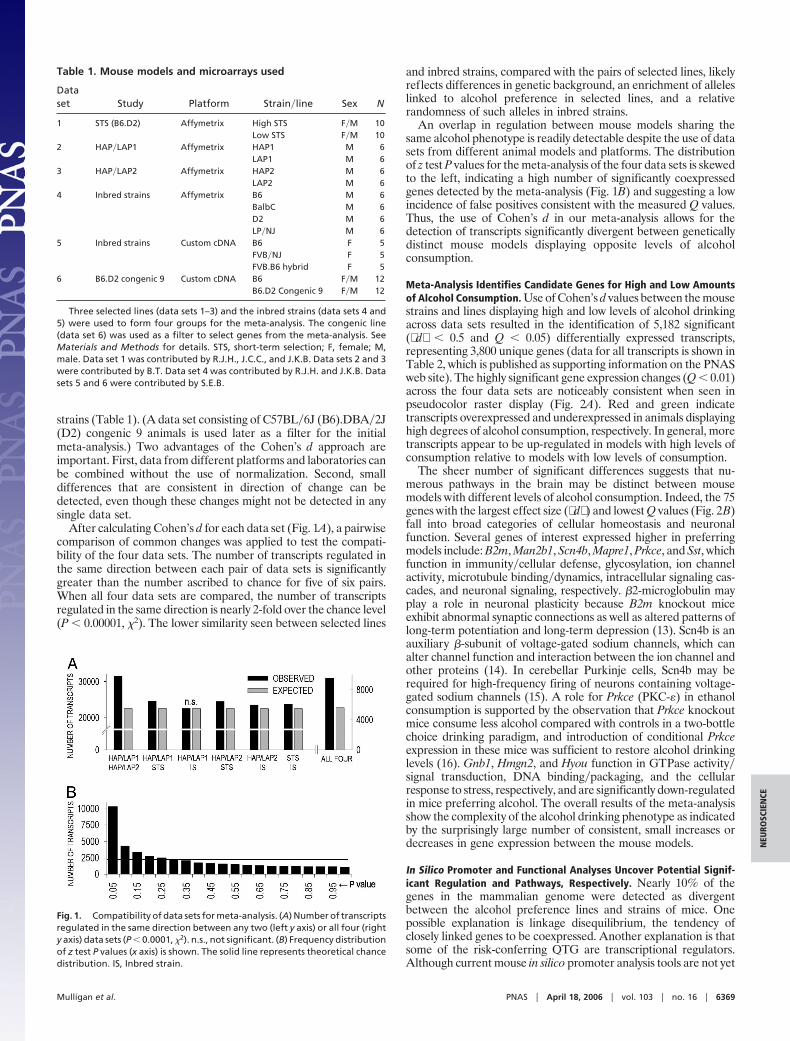
Meta-Analysis Identifies Candidate Genes for High and Low Amountsof Alcohol Consumption. Use of Cohen’s d values between the mousestrains and lines displaying high and low levels of alcohol drinkingacross data sets resulted in the identification of 5,182 significant( d � 0.5 and Q � 0.05) differentially expressed transcripts,representing 3,800 unique genes (data for all transcripts is shown inTable 2, which is published as supporting information on the PNASweb site). The highly significant gene expression changes (Q � 0.01)across the four data sets are noticeably consistent when seen inpseudocolor raster display (Fig. 2A). Red and green indicatetranscripts overexpressed and underexpressed in animals displayinghigh degrees of alcohol consumption, respectively. In general, moretranscripts appear to be up-regulated in models with high levels ofconsumption relative to models with low levels of consumption.
The sheer number of significant differences suggests that nu-merous pathways in the brain may be distinct between mousemodels with different levels of alcohol consumption. Indeed, the 75genes with the largest effect size ( d ) and lowest Q values (Fig. 2B)fall into broad categories of cellular homeostasis and neuronalfunction. Several genes of interest expressed higher in preferringmodels include: B2m, Man2b1, Scn4b, Mapre1, Prkce, and Sst, whichfunction in immunity�cellular defense, glycosylation, ion channelactivity, microtubule binding�dynamics, intracellular signaling cas-cades, and neuronal signaling, respectively. �2-microglobulin mayplay a role in neuronal plasticity because B2m knockout miceexhibit abnormal synaptic connections as well as altered patterns oflong-term potentiation and long-term depression (13). Scn4b is anauxiliary �-subunit of voltage-gated sodium channels, which canalter channel function and interaction between the ion channel andother proteins (14). In cerebellar Purkinje cells, Scn4b may berequired for high-frequency firing of neurons containing voltage-gated sodium channels (15). A role for Prkce (PKC-�) in ethanolconsumption is supported by the observation that Prkce knockoutmice consume less alcohol compared with controls in a two-bottlechoice drinking paradigm, and introduction of conditional Prkceexpression in these mice was sufficient to restore alcohol drinkinglevels (16). Gnb1, Hmgn2, and Hyou function in GTPase activity�signal transduction, DNA binding�packaging, and the cellularresponse to stress, respectively, and are significantly down-regulatedin mice preferring alcohol. The overall results of the meta-analysisshow the complexity of the alcohol drinking phenotype as indicatedby the surprisingly large number of consistent, small increases ordecreases in gene expression between the mouse models.
In Silico Promoter and Functional Analyses Uncover Potential Signif-icant Regulation and Pathways, Respectively. Nearly 10% of thegenes in the mammalian genome were detected as divergentbetween the alcohol preference lines and strains of mice. Onepossible explanation is linkage disequilibrium, the tendency ofclosely linked genes to be coexpressed. Another explanation is thatsome of the risk-conferring QTG are transcriptional regulators.Although current mouse in silico promoter analysis tools are not yet
Table 1. Mouse models and microarrays used
Dataset Study Platform Strain�line Sex N
1 STS (B6.D2) Affymetrix High STS F�M 10Low STS F�M 10
2 HAP�LAP1 Affymetrix HAP1 M 6LAP1 M 6
3 HAP�LAP2 Affymetrix HAP2 M 6LAP2 M 6
4 Inbred strains Affymetrix B6 M 6BalbC M 6D2 M 6LP�NJ M 6
5 Inbred strains Custom cDNA B6 F 5FVB�NJ F 5FVB.B6 hybrid F 5
6 B6.D2 congenic 9 Custom cDNA B6 F�M 12B6.D2 Congenic 9 F�M 12
Three selected lines (data sets 1–3) and the inbred strains (data sets 4 and5) were used to form four groups for the meta-analysis. The congenic line(data set 6) was used as a filter to select genes from the meta-analysis. SeeMaterials and Methods for details. STS, short-term selection; F, female; M,male. Data set 1 was contributed by R.J.H., J.C.C., and J.K.B. Data sets 2 and 3were contributed by B.T. Data set 4 was contributed by R.J.H. and J.K.B. Datasets 5 and 6 were contributed by S.E.B.
Fig. 1. Compatibility of data sets for meta-analysis. (A) Number of transcriptsregulated in the same direction between any two (left y axis) or all four (righty axis) data sets (P � 0.0001, �2). n.s., not significant. (B) Frequency distributionof z test P values (x axis) is shown. The solid line represents theoretical chancedistribution. IS, Inbred strain.
Mulligan et al. PNAS � April 18, 2006 � vol. 103 � no. 16 � 6369
NEU
ROSC
IEN
CE
comprehensive on a genomic scale, the oPOSSUM database (17)is a valuable tool for identifying overrepresented transcriptionfactor (TF) binding sites (TFBS) in promoter regions near a gene’stranscription start site. oPOSSUM analysis is very conservative andhas strict requirements; simulation studies have suggested that itdetects few false positives (17).
TFBS for Zfp143 (Staf, selenorysteine RNA gene transcriptionactivating factor) were identified as overrepresented in the up-regulated genes (for high amounts of alcohol drinking). The StafTFBS was present in the upstream (2,000 bp) promoter regions of64 genes. Importantly, Zfp143 expression was also found to besignificantly up-regulated across the models with high drinkinglevels. Similarly, the TFBS for the fork-head box TF Foxa2 (HNF-3�, hepatocyte nuclear factor 3�) was detected as overrepresentedacross the down-regulated gene group and present in 146 genes, andFoxa2 was found to be significantly down-regulated in the meta-analysis. In both cases, the overrepresented TF has the same patternof expression as its target genes. It is easy to imagine, as evidencedby the number of gene targets for Zfp143 and Foxa2, how smallchanges in the levels of a TF could cause profound differences inthe brain transcriptome and may account for the large number ofgene expression changes (3,800 genes) detected in this meta-analysis. Although neither Zfp143 or Foxa2 were identified ascis-regulated and are not primary candidate genes for alcoholpreference, an understanding of how changes in the expression leveland�or activity of transcriptional regulators affects the predisposi-tion toward alcohol consumption phenotypes warrants furtherinvestigation.
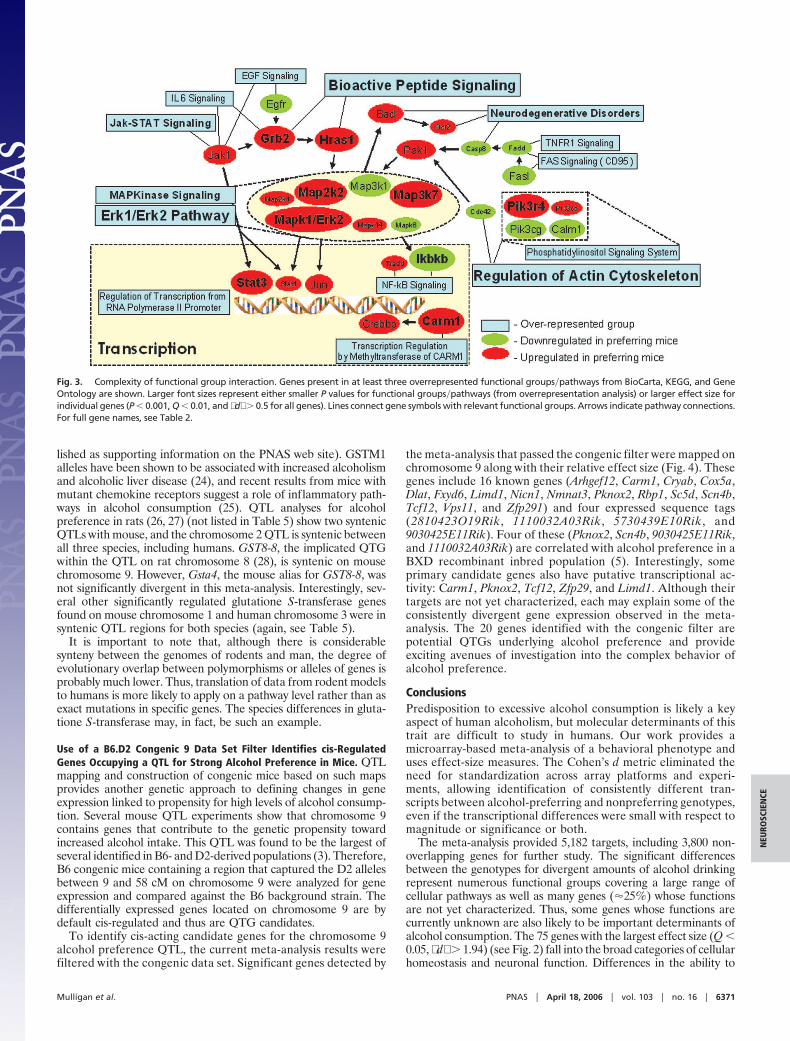
To better understand possible global interactions of the divergentgenes, overrepresentation analyses for function were completed.Such analyses apply statistical methods to estimate whether somebiological function�pathway is represented in a given data set morethan expected by chance. Using the WEBGESTALT search engine,which queries different databases, including KEGG, BioCarta, andGO (Gene Ontology) (18–20), functional group analysis revealedthat kinase and signaling pathways were overrepresented in genesdivergent between alcohol-preferring and nonpreferring genotypes.The result supports previous suggestions that the mitogen-activatedprotein kinase, NF-�B, and IL-6 signaling pathways (andCREBBP) are sensitive to alcohol (21). Known functional inter-actions (summarized in Fig. 3) show that gene transcription path-ways predominant in the overrepresented categories and apopto-sis�antiapoptosis, neurodegeneration, and neuroplasticity pathwayswere also functionally overrepresented (for all results, see Fig. 5 andTable 3, which are published as supporting information on thePNAS web site). In silico functional analyses are powerful tools forhypothesis generation, especially for complex phenotypes, such aspredisposition toward alcohol drinking. It should now be feasible,for example, to test the effect of candidate genes in Fig. 3 for theirimpact on alcohol consumption.
Several Genes Identified in the Meta-Analysis Are Located Within QTLsfor Human Alcoholism Susceptibility. A two-pronged approach wastaken to use known QTLs in both human and rodent research. First,the list of �3,800 significant genes was annotated using SOURCE(22) for mouse and human chromosomal location. Two separatelists were created by using Feighner, DSM-III-R, and ICD-10criteria (23): one list for genes found within the boundaries ofmouse QTLs for preference drinking (3) and another for geneswithin the boundaries of alcoholism susceptibility QTLs in humans.The lists were used as filters to identify overlap of significant genesfrom the meta-analysis with QTLs between the two species (Table4, which is published as supporting information on the PNAS website). Thirty-six genes met criteria as candidate genes with 11(Gstm1, Gstm2, Gstm5, Il1f5, Il1f6, Il1f8, Il1rn, S100a1, S100a10,and S100a13) belonging to only three gene families: GSTM (glu-tatione S-transferase activity), S100 class calcium-binding, andcytokine�proinflammatory activity (IL-1) (Table 5, which is pub-
Fig. 2. Visual representation of microarray data. Columns represent microar-ray databases used in the meta-analysis, and rows represent transcripts. Thefiltered criterion was Q � 0.01, and genes were sorted by effect size. (A)Transcripts (2,697) are listed from positive to negative Cohen’s d values (effectsize). Red indicates a positive effect size and higher expression in preferringmice, and green indicates a negative effect size and lower expression inpreferring mice. Black indicates an effect size near zero. (B) The 75 uniquetranscripts with the highest absolute average effect size (Q � 0.05, d � 1.94).STS, short-term selection; IS, Inbred strains.
6370 � www.pnas.org�cgi�doi�10.1073�pnas.0510188103 Mulligan et al.
lished as supporting information on the PNAS web site). GSTM1alleles have been shown to be associated with increased alcoholismand alcoholic liver disease (24), and recent results from mice withmutant chemokine receptors suggest a role of inflammatory path-ways in alcohol consumption (25). QTL analyses for alcoholpreference in rats (26, 27) (not listed in Table 5) show two syntenicQTLs with mouse, and the chromosome 2 QTL is syntenic betweenall three species, including humans. GST8-8, the implicated QTGwithin the QTL on rat chromosome 8 (28), is syntenic on mousechromosome 9. However, Gsta4, the mouse alias for GST8-8, wasnot significantly divergent in this meta-analysis. Interestingly, sev-eral other significantly regulated glutatione S-transferase genesfound on mouse chromosome 1 and human chromosome 3 were insyntenic QTL regions for both species (again, see Table 5).
It is important to note that, although there is considerablesynteny between the genomes of rodents and man, the degree ofevolutionary overlap between polymorphisms or alleles of genes isprobably much lower. Thus, translation of data from rodent modelsto humans is more likely to apply on a pathway level rather than asexact mutations in specific genes. The species differences in gluta-tione S-transferase may, in fact, be such an example.
Use of a B6.D2 Congenic 9 Data Set Filter Identifies cis-RegulatedGenes Occupying a QTL for Strong Alcohol Preference in Mice. QTLmapping and construction of congenic mice based on such mapsprovides another genetic approach to defining changes in geneexpression linked to propensity for high levels of alcohol consump-tion. Several mouse QTL experiments show that chromosome 9contains genes that contribute to the genetic propensity towardincreased alcohol intake. This QTL was found to be the largest ofseveral identified in B6- and D2-derived populations (3). Therefore,B6 congenic mice containing a region that captured the D2 allelesbetween 9 and 58 cM on chromosome 9 were analyzed for geneexpression and compared against the B6 background strain. Thedifferentially expressed genes located on chromosome 9 are bydefault cis-regulated and thus are QTG candidates.
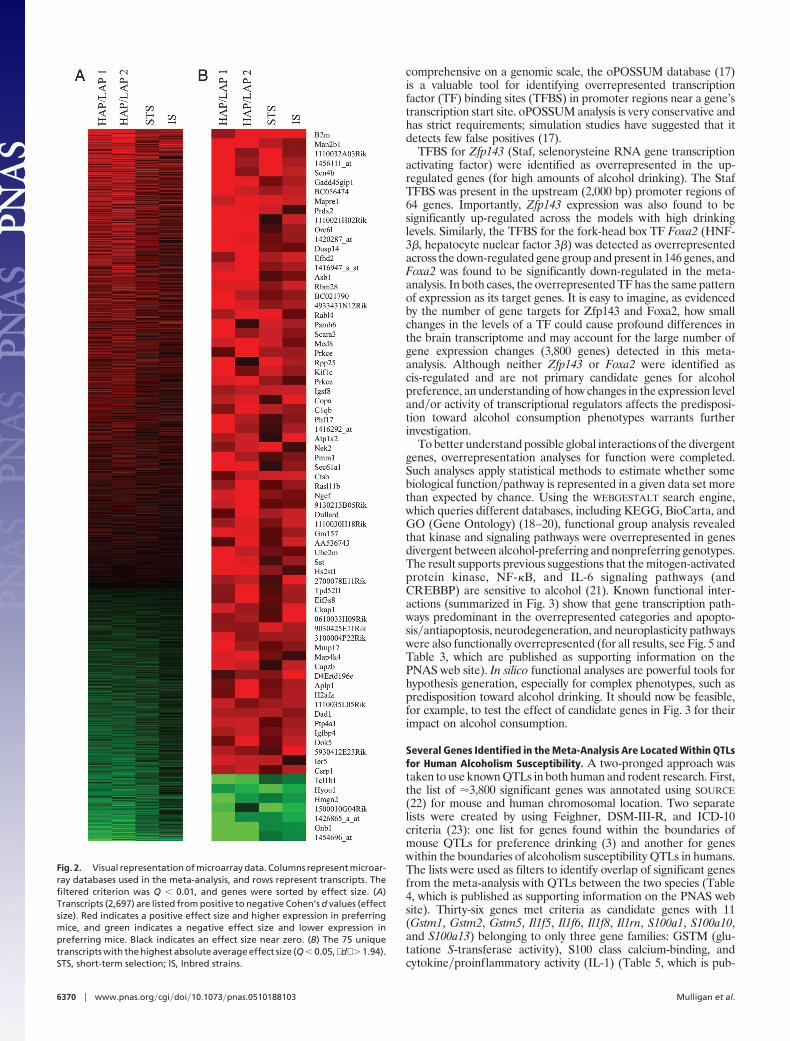
To identify cis-acting candidate genes for the chromosome 9alcohol preference QTL, the current meta-analysis results werefiltered with the congenic data set. Significant genes detected by
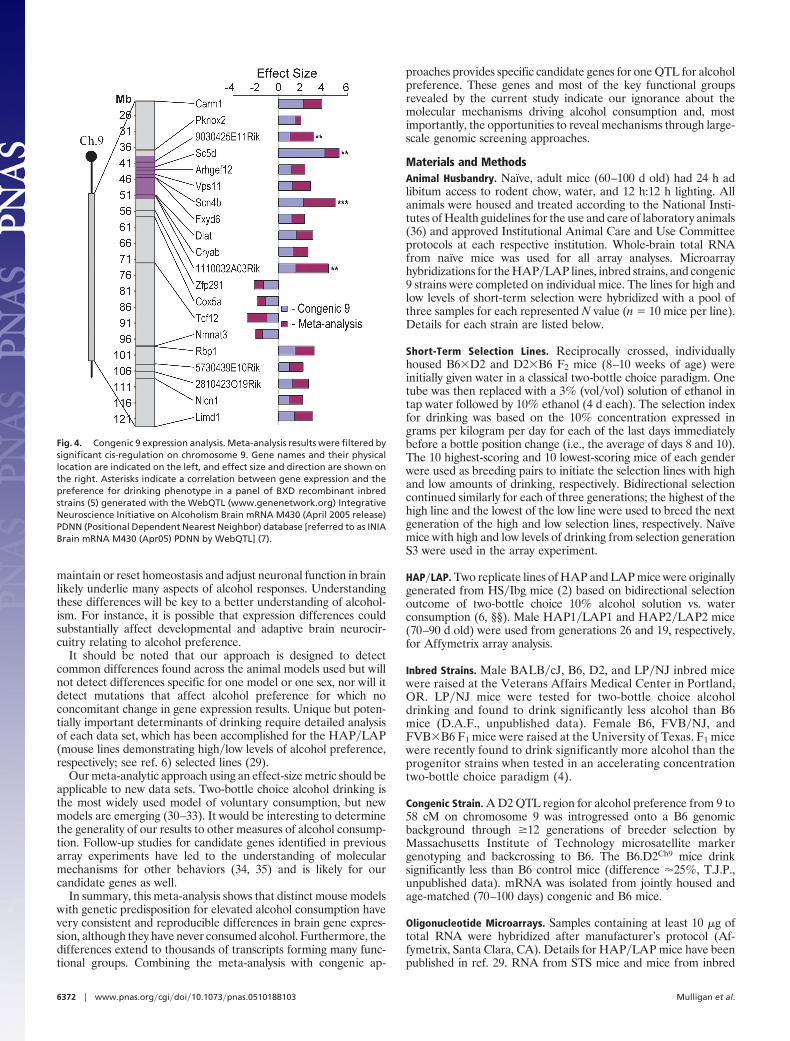
the meta-analysis that passed the congenic filter were mapped onchromosome 9 along with their relative effect size (Fig. 4). Thesegenes include 16 known genes (Arhgef12, Carm1, Cryab, Cox5a,Dlat, Fxyd6, Limd1, Nicn1, Nmnat3, Pknox2, Rbp1, Sc5d, Scn4b,Tcf12, Vps11, and Zfp291) and four expressed sequence tags(2810423O19Rik, 1110032A03Rik, 5730439E10Rik, and9030425E11Rik). Four of these (Pknox2, Scn4b, 9030425E11Rik,and 1110032A03Rik) are correlated with alcohol preference in aBXD recombinant inbred population (5). Interestingly, someprimary candidate genes also have putative transcriptional ac-tivity: Carm1, Pknox2, Tcf12, Zfp29, and Limd1. Although theirtargets are not yet characterized, each may explain some of theconsistently divergent gene expression observed in the meta-analysis. The 20 genes identified with the congenic filter arepotential QTGs underlying alcohol preference and provideexciting avenues of investigation into the complex behavior ofalcohol preference.
ConclusionsPredisposition to excessive alcohol consumption is likely a keyaspect of human alcoholism, but molecular determinants of thistrait are difficult to study in humans. Our work provides amicroarray-based meta-analysis of a behavioral phenotype anduses effect-size measures. The Cohen’s d metric eliminated theneed for standardization across array platforms and experi-ments, allowing identification of consistently different tran-scripts between alcohol-preferring and nonpreferring genotypes,even if the transcriptional differences were small with respect tomagnitude or significance or both.
The meta-analysis provided 5,182 targets, including 3,800 non-overlapping genes for further study. The significant differencesbetween the genotypes for divergent amounts of alcohol drinkingrepresent numerous functional groups covering a large range ofcellular pathways as well as many genes (�25%) whose functionsare not yet characterized. Thus, some genes whose functions arecurrently unknown are also likely to be important determinants ofalcohol consumption. The 75 genes with the largest effect size (Q �0.05, d � 1.94) (see Fig. 2) fall into the broad categories of cellularhomeostasis and neuronal function. Differences in the ability to
Fig. 3. Complexity of functional group interaction. Genes present in at least three overrepresented functional groups�pathways from BioCarta, KEGG, and GeneOntology are shown. Larger font sizes represent either smaller P values for functional groups�pathways (from overrepresentation analysis) or larger effect size forindividual genes (P � 0.001, Q � 0.01, and d � 0.5 for all genes). Lines connect gene symbols with relevant functional groups. Arrows indicate pathway connections.For full gene names, see Table 2.
Mulligan et al. PNAS � April 18, 2006 � vol. 103 � no. 16 � 6371
NEU
ROSC
IEN
CE
maintain or reset homeostasis and adjust neuronal function in brainlikely underlie many aspects of alcohol responses. Understandingthese differences will be key to a better understanding of alcohol-ism. For instance, it is possible that expression differences couldsubstantially affect developmental and adaptive brain neurocir-cuitry relating to alcohol preference.
It should be noted that our approach is designed to detectcommon differences found across the animal models used but willnot detect differences specific for one model or one sex, nor will itdetect mutations that affect alcohol preference for which noconcomitant change in gene expression results. Unique but poten-tially important determinants of drinking require detailed analysisof each data set, which has been accomplished for the HAP�LAP(mouse lines demonstrating high�low levels of alcohol preference,respectively; see ref. 6) selected lines (29).
Our meta-analytic approach using an effect-size metric should beapplicable to new data sets. Two-bottle choice alcohol drinking isthe most widely used model of voluntary consumption, but newmodels are emerging (30–33). It would be interesting to determinethe generality of our results to other measures of alcohol consump-tion. Follow-up studies for candidate genes identified in previousarray experiments have led to the understanding of molecularmechanisms for other behaviors (34, 35) and is likely for ourcandidate genes as well.
In summary, this meta-analysis shows that distinct mouse modelswith genetic predisposition for elevated alcohol consumption havevery consistent and reproducible differences in brain gene expres-sion, although they have never consumed alcohol. Furthermore, thedifferences extend to thousands of transcripts forming many func-tional groups. Combining the meta-analysis with congenic ap-
proaches provides specific candidate genes for one QTL for alcoholpreference. These genes and most of the key functional groupsrevealed by the current study indicate our ignorance about themolecular mechanisms driving alcohol consumption and, mostimportantly, the opportunities to reveal mechanisms through large-scale genomic screening approaches.
Materials and MethodsAnimal Husbandry. Naı̈ve, adult mice (60–100 d old) had 24 h adlibitum access to rodent chow, water, and 12 h:12 h lighting. Allanimals were housed and treated according to the National Insti-tutes of Health guidelines for the use and care of laboratory animals(36) and approved Institutional Animal Care and Use Committeeprotocols at each respective institution. Whole-brain total RNAfrom naı̈ve mice was used for all array analyses. Microarrayhybridizations for the HAP�LAP lines, inbred strains, and congenic9 strains were completed on individual mice. The lines for high andlow levels of short-term selection were hybridized with a pool ofthree samples for each represented N value (n � 10 mice per line).Details for each strain are listed below.
Short-Term Selection Lines. Reciprocally crossed, individuallyhoused B6�D2 and D2�B6 F2 mice (8–10 weeks of age) wereinitially given water in a classical two-bottle choice paradigm. Onetube was then replaced with a 3% (vol�vol) solution of ethanol intap water followed by 10% ethanol (4 d each). The selection indexfor drinking was based on the 10% concentration expressed ingrams per kilogram per day for each of the last days immediatelybefore a bottle position change (i.e., the average of days 8 and 10).The 10 highest-scoring and 10 lowest-scoring mice of each genderwere used as breeding pairs to initiate the selection lines with highand low amounts of drinking, respectively. Bidirectional selectioncontinued similarly for each of three generations; the highest of thehigh line and the lowest of the low line were used to breed the nextgeneration of the high and low selection lines, respectively. Naı̈vemice with high and low levels of drinking from selection generationS3 were used in the array experiment.
HAP�LAP. Two replicate lines of HAP and LAP mice were originallygenerated from HS�Ibg mice (2) based on bidirectional selectionoutcome of two-bottle choice 10% alcohol solution vs. waterconsumption (6, §§). Male HAP1�LAP1 and HAP2�LAP2 mice(70–90 d old) were used from generations 26 and 19, respectively,for Affymetrix array analysis.
Inbred Strains. Male BALB�cJ, B6, D2, and LP�NJ inbred micewere raised at the Veterans Affairs Medical Center in Portland,OR. LP�NJ mice were tested for two-bottle choice alcoholdrinking and found to drink significantly less alcohol than B6mice (D.A.F., unpublished data). Female B6, FVB�NJ, andFVB�B6 F1 mice were raised at the University of Texas. F1 micewere recently found to drink significantly more alcohol than theprogenitor strains when tested in an accelerating concentrationtwo-bottle choice paradigm (4).
Congenic Strain. A D2 QTL region for alcohol preference from 9 to58 cM on chromosome 9 was introgressed onto a B6 genomicbackground through �12 generations of breeder selection byMassachusetts Institute of Technology microsatellite markergenotyping and backcrossing to B6. The B6.D2Ch9 mice drinksignificantly less than B6 control mice (difference �25%, T.J.P.,unpublished data). mRNA was isolated from jointly housed andage-matched (70–100 days) congenic and B6 mice.
Oligonucleotide Microarrays. Samples containing at least 10 �g oftotal RNA were hybridized after manufacturer’s protocol (Af-fymetrix, Santa Clara, CA). Details for HAP�LAP mice have beenpublished in ref. 29. RNA from STS mice and mice from inbred
Fig. 4. Congenic 9 expression analysis. Meta-analysis results were filtered bysignificant cis-regulation on chromosome 9. Gene names and their physicallocation are indicated on the left, and effect size and direction are shown onthe right. Asterisks indicate a correlation between gene expression and thepreference for drinking phenotype in a panel of BXD recombinant inbredstrains (5) generated with the WebQTL (www.genenetwork.org) IntegrativeNeuroscience Initiative on Alcoholism Brain mRNA M430 (April 2005 release)PDNN (Positional Dependent Nearest Neighbor) database [referred to as INIABrain mRNA M430 (Apr05) PDNN by WebQTL] (7).
6372 � www.pnas.org�cgi�doi�10.1073�pnas.0510188103 Mulligan et al.
strains BALB�cJ, B6, D2, and LP�NJ arrays was hybridized toAffymetrix 430 A and B chips and analyzed at the Oregon Healthand Science University Gene Microarray Shared Resource Facility(for more details, see Supporting Materials and Methods, which ispublished as supporting information on the PNAS web site).
Custom cDNA Microarrays. PCR products of clones from severalcDNA libraries (see Supporting Materials and Methods for details)were printed in the University of Texas array core facility onpoly-L-lysine-coated (Sigma) microscope slides (Erie Scientific,Portsmouth, NH) using a custom-built robotic arrayer as describedin ref. 37. Microarray hybridizations were performed with the Array350 microarray labeling kit according to the manufacturer’s pro-tocol (Genisphere, Hatfield, PA).
Meta-Analysis. Five data sets listed 1–5 in Table 1 were used formeta-analysis. Alcohol-preferring and nonpreferring mice werefirst compared by using a parametric statistical test. Student’s t testfor independent samples was used to compare high and low selectedlines (studies 1–3). Both sets of inbred strains (studies 4 and 5) wereanalyzed independently by an F test using single contrasts (seeSupporting Materials and Methods for additional details). Theresulting t and F values for each transcript were then used toestimate effect size by calculating a Cohen’s d statistic, which is thedifference between the groups expressed in pooled within-groupSD units (12). The following formulas were applied: d � 2t��df �2�(F�df), where df represents the degrees of freedom. Thedirection of change was coded in the resulting Cohen’s d values so,that �positive� values indicated an up-regulation and �negative�values indicated a down-regulation of transcripts in alcohol-preferring genotypes compared with nonpreferring genotypes.
Data from the two inbred strain studies (studies 4 and 5 in Table1) were collapsed by averaging Cohen’s d values for each transcript(for rationale, see Supporting Materials and Methods). To minimizeany outlier effects, extremely deviant effect sizes were adjusted toa maximum absolute value of d � 4. Finally, the Cohen’s d valuesgenerated for the three pairs of selected lines and the combined setof inbred strains were averaged, and a z test was used to test thesignificance of deviation of the mean effect size from zero. QVALUEsoftware was used to estimate the false discovery rate (Q) for themeta-analysis results (38, 39), which estimates the proportion of alldeclared significant results that are expected to be false positives.
Congenic 9 Data Filter. We used microarray data obtained from theB6.D2Ch9 congenic strain to filter transcripts detected by meta-analysis as regulated significantly between ethanol-preferringand nonpreferring genotypes and located within the introgressedregion containing known ethanol preference QTLs on mousechromosome 9. Specifically, chromosome 9 transcripts signifi-cantly regulated between the congenic and control lines (P �0.05, t test) were identified and matched for direction of changewith data from the meta-analysis. Only genes detected by bothapproaches were selected as putative candidates for cis-regulation of alcohol preference.
TFBS Overrepresentation Analysis. The oPOSSUM database (www.cisreg.ca�cgi-bin�oPOSSUM�opossum) (17) was used to analyzeTFBS in genes that were significantly (Q � 0.05 and d � 0.5) up-or down-regulated in alcohol-preferring vs. nonpreferring mice.The two lists had 2,388 and 1,580 genes with 1,011 and 546recognized as orthologs in oPOSSUM for up- vs. down-regulationrespectively. TFBS overrepresentation was determined based onone-tailed Fisher exact probabilities and the ranking of z scores.After the initial analysis, the genes for the TFs themselves wereindividually checked to see whether (i) they were present on thearrays and (ii) transcription differences were consistent with thepromoter TFBS analysis.
Functional Overrepresentation Analysis. Transcripts passing statisti-cal thresholds (Q � 0.05, d � 0.5) were functionally annotatedwith WEBGESTALT (web-based gene set analysis toolkit, http:��genereg.ornl.gov.webgestalt) (19). A hypergeometric test was usedto detect functional groups overrepresented in a selected gene set(meta-regulated genes) compared with a reference set (all genes inmeta-analysis). See Supporting Materials and Methods for additionaldetails.
This study was a collaborative effort by investigators affiliated with theIntegrative Neuroscience Initiative on Alcoholism Consortium and wassupported by National Institute on Alcohol Abuse and AlcoholismGrants AA013182 and AA013404 (to S.E.B.); AA013475, AA006243,and AA010760 (to J.K.B.); AA013520 (to Y.A.B.); AA013519 (toJ.C.C.); AA013483 (to N.J.G.); AA013518 (to R.A.H.); AA013484 andAA11034 (to R.J.H.); AA013517 (to G.F.K.); and AA013489 (to B.T.);and by five Merit Review Programs from the Department of VeteransAffairs (to J.K.B., J.C.C., D.A.F., R.J.H., and T.J.P.).
1. Crabbe, J. C. (2002) Am. J. Med. Genet. 114, 969–974.2. McClearn, G., Wilson, J. & Meredith, W. (1970) The Use of Isogenic and Heterogenic Mouse
Stocks in Behavioral Research (Appleton–Century–Crofts, New York).3. Belknap, J. K. & Atkins, A. L. (2001) Mamm. Genome 12, 893–899.4. Blednov, Y. A., Metten, P., Finn, D. A., Rhodes, J. S., Bergeson, S. E., Harris, R. A. &
Crabbe, J. C. (2005) Alcohol. Clin. Exp. Res. 29, 1949–1958.5. Phillips, T. J., Crabbe, J. C., Metten, P. & Belknap, J. K. (1994) Alcohol. Clin. Exp. Res. 18,
931–941.6. Grahame, N. J., Li, T. K. & Lumeng, L. (1999) Behav. Genet. 29, 47–57.7. Wang, J., Williams, R. W. & Manly, K. F. (2003) Neuroinformatics 1, 299–308.8. Phillips, T. J., Terdal, E. S. & Crabbe, J. C. (1990) Behav. Genet. 20, 473–480.9. Phillips, T. J., Belknap, J. K., Hitzemann, R. J., Buck, K. J., Cunningham, C. L. & Crabbe,
J. C. (2002) Genes Brain Behav. 1, 14–26.10. Rhodes, D. R., Yu, J., Shanker, K., Deshpande, N., Varambally, R., Ghosh, D., Barrette, T.,
Pandey, A. & Chinnaiyan, A. M. (2004) Proc. Natl. Acad. Sci. USA 101, 9309–9314.11. Moreau, Y., Aerts, S., De Moor, B., De Strooper, B. & Dabrowski, M. (2003) Trends Genet.
19, 570–577.12. Rosenthal, D. (1994) Parametric Measures of Effect Size (Russell Sage Found., New York).13. Huh, G. S., Boulanger, L. M., Du, H., Riquelme, P. A., Brotz, T. M. & Shatz, C. J. (2000)
Science 290, 2155–2159.14. Yu, F. H., Westenbroek, R. E., Silos-Santiago, I., McCormick, K. A., Lawson, D., Ge, P.,
Ferriera, H., Lilly, J., DiStefano, P. S., Catterall, W. A., et al. (2003) J. Neurosci. 23, 7577–7585.15. Grieco, T. M., Malhotra, J. D., Chen, C., Isom, L. L. & Raman, I. M. (2005) Neuron 45, 233–244.16. Hodge, C. W., Mehmert, K. K., Kelley, S. P., McMahon, T., Haywood, A., Olive, M. F.,
Wang, D., Sanchez-Perez, A. M. & Messing, R. O. (1999) Nat. Neurosci. 2, 997–1002.17. Ho Sui, S. J., Mortimer, J. R., Arenillas, D. J., Brumm, J., Walsh, C. J., Kennedy, B. P. &
Wasserman, W. W. (2005) Nucleic Acids Res. 33, 3154–3164.18. Harris, M. A., Clark, J., Ireland, A., Lomax, J., Ashburner, M., Foulger, R., Eilbeck, K.,
Lewis, S., Marshall, B., Mungall, C., et al. (2004) Nucleic Acids Res. 32, D258–D261.19. Zhang, B., Kirov, S. & Snoddy, J. (2005) Nucleic Acids Res. 33, W741–W748.20. Ogata, H., Goto, S., Sato, K., Fujibuchi, W., Bono, H. & Kanehisa, M. (1999) Nucleic Acids
Res. 27, 29–34.21. Jeong, H. J., Hong, S. H., Park, R. K., An, N. H. & Kim, H. M. (2005) Life Sci. 77, 2179–2192.
22. Diehn, M., Sherlock, G., Binkley, G., Jin, H., Matese, J. C., Hernandez-Boussard, T., Rees,C. A., Cherry, J. M., Botstein, D., Brown, P. O. & Alizadeh, A. A. (2003) Nucleic Acids Res.31, 219–223.
23. Foroud, T., Edenberg, H. J., Goate, A., Rice, J., Flury, L., Koller, D. L., Bierut, L. J.,Conneally, P. M., Nurnberger, J. I., Bucholz, K. K., et al. (2000) Alcohol. Clin. Exp. Res. 24,933–945.
24. Engracia, V., Leite, M. M., Pagotto, R. C., Zucoloto, S., Barbosa, C. A. & Mestriner, M. A.(2003) Am. J. Med. Genet. 123, 257–260.
25. Blednov, Y. A., Bergeson, S. E., Walker, D., Ferreira, V. M., Kuziel, W. A. & Harris, R. A.(2005) Behav. Brain Res. 165, 110–125.
26. Carr, L. G., Habegger, K., Spence, J., Ritchotte, A., Liu, L., Lumeng, L., Li, T. K. & Foroud,T. (2003) Alcohol. Clin. Exp. Res. 27, 1710–1717.
27. Bice, P., Foroud, T., Bo, R., Castelluccio, P., Lumeng, L., Li, T. K. & Carr, L. G. (1998)Mamm. Genome 9, 949–955.
28. Liang, T., Habegger, K., Spence, J. P., Foroud, T., Ellison, J. A., Lumeng, L., Li, T. K. &Carr, L. G. (2004) Alcohol. Clin. Exp. Res. 28, 1622–1628.
29. Saba, L., Bhave, S., Lapadat, R., Hoffman, P. L., Belknap, J. K. & Tabakoff, B. (2006)Mamm. Genome, in press.
30. Finn, D. A., Belknap, J. K., Cronise, K., Yoneyama, N., Murillo, A. & Crabbe, J. C. (2005)Psychopharmacology 178, 471–480.
31. Rhodes, J. S., Best, K., Belknap, J. K., Finn, D. A. & Crabbe, J. C. (2005) Physiol. Behav. 84, 53–63.32. O’Dell, L. E., Roberts, A. J., Smith, R. T. & Koob, G. F. (2004) Alcohol. Clin. Exp. Res. 28,
1676–1682.33. Roberts, A. J., Heyser, C. J., Cole, M., Griffin, P. & Koob, G. F. (2000) Neuropsychophar-
macology 22, 581–594.34. McClung, C. A. & Nestler, E. J. (2003) Nat. Neurosci. 6, 1208–1215.35. Yao, W. D., Gainetdinov, R. R., Arbuckle, M. I., Sotnikova, T. D., Cyr, M., Beaulieu, J. M.,
Torres, G. E., Grant, S. G. & Caron, M. G. (2004) Neuron 41, 625–638.36. National Research Council (1996) Guide for the Care and Use of Laboratory Animals (Nat.
Res. Council, Washington, DC).37. DeRisi, J. L., Iyer, V. R. & Brown, P. O. (1997) Science 278, 680–686.38. Storey, J. D. & Tibshirani, R. (2003) Proc. Natl. Acad. Sci. USA 100, 9440–9445.39. Storey, J. D. & Tibshirani, R. (2003) Methods Mol. Biol. 224, 149–157.
Mulligan et al. PNAS � April 18, 2006 � vol. 103 � no. 16 � 6373
NEU
ROSC
IEN
CE