Embed Size (px)
Citation preview
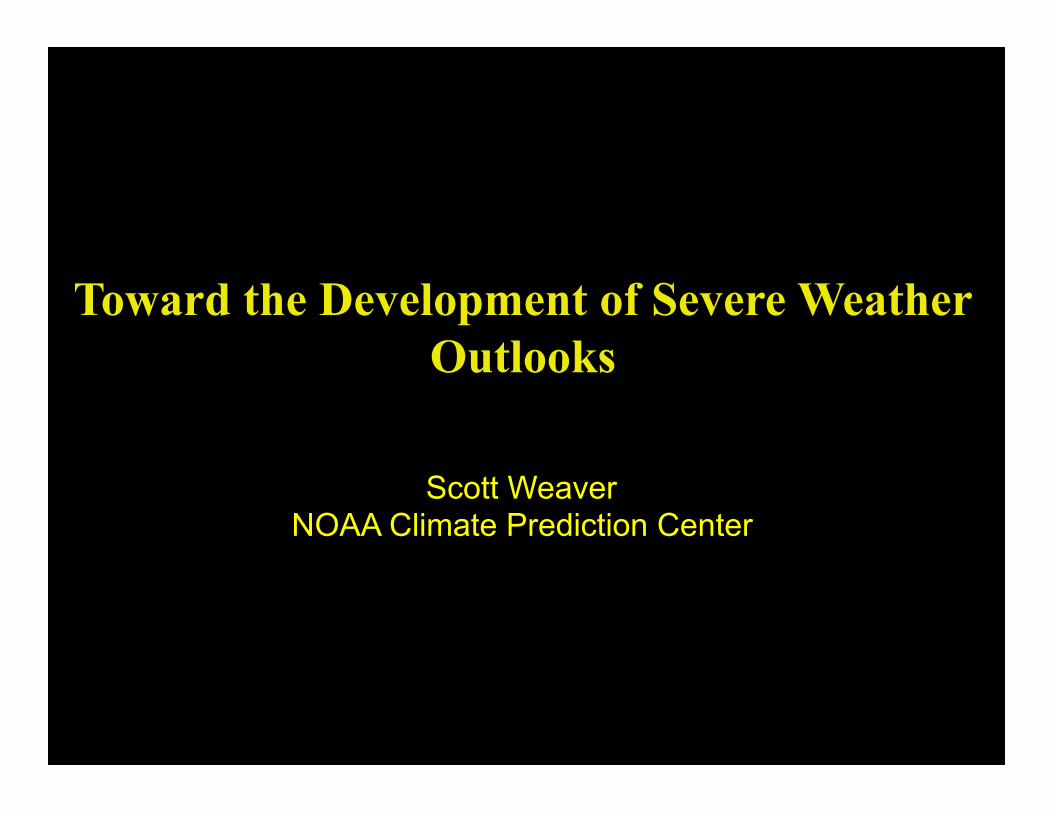
Toward the Development of Severe Weather Outlooks
Scott Weaver NOAA Climate Prediction Center
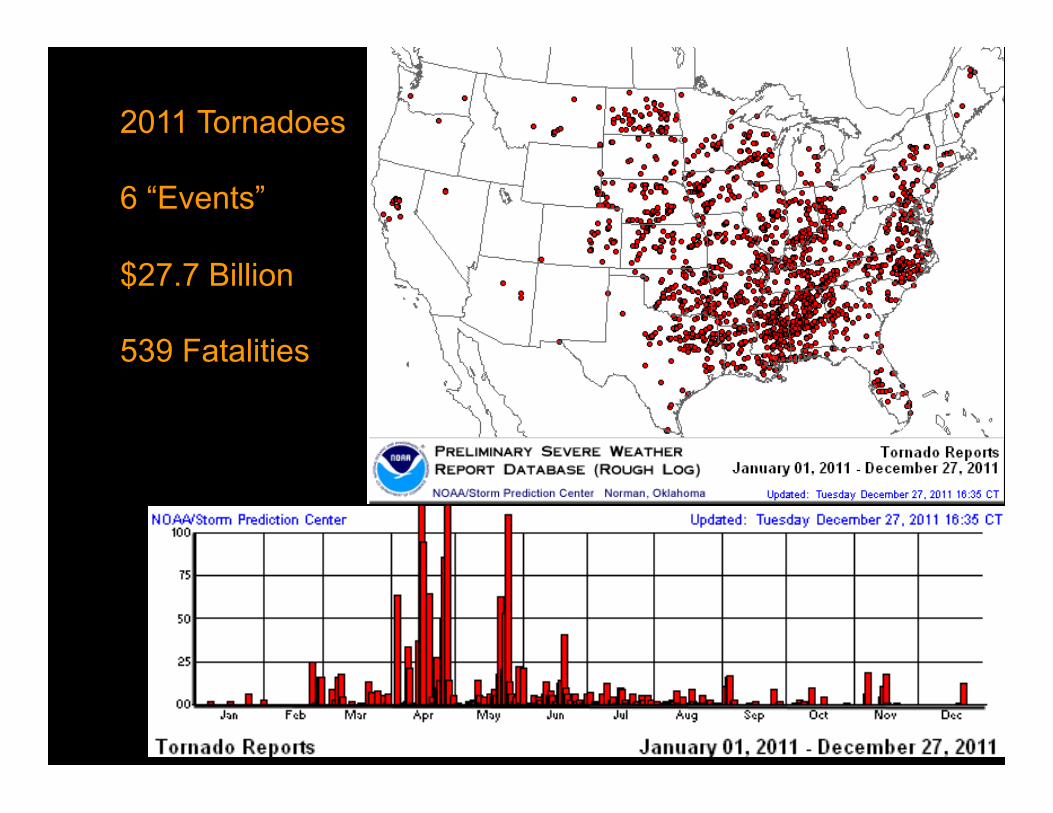
2011 Tornadoes 6 “Events” $27.7 Billion 539 Fatalities
Advancing the Nation’s capability to anticipate tornado and severe weather risk!Scott Weaver (NOAA/CPC), Jeff Trapp (Purdue University), Michael K. Tippett (IRI), Russell Schneider (NOAA/SPC), Phil Pegion (NOAA/ESRL,CIRES), Sang-Ki Lee (NOAA/AOML), Wayne Higgins (NOAA/CPC), Andy Dean (NOAA/SPC), Greg Carbin (NOAA/SPC), Harold Brooks (NOAA/NSSL), Mike Baldwin (Purdue University), Francisco Alvarez (Saint Louis University)
Abstract This white paper summarizes existing US tornado and severe weather prediction capability, outlines desired capabilities and presents an implementation plan combining research and institutional strategies for achieving those goals. At present, tornado and severe weather outlooks do not extend beyond one week. Recent tornado outbreaks have been accompanied by increased demand for more information provided with greater antecedence. The latest science gives evidence that tornado activity can be predicted further in advance than was previously believed and provides improved understanding of the links between large-scale climate variability and tornado activity. A focused effort building on current science and available model and data resources would have immediate benefits and represent a substantial step toward desired capabilities. Complementary to the development of new severe weather information is the need to determine how public and private stakeholders can effectively use such information. We recommend a strategy providing resources for research integrated with enhancement of operational capacity.! 1. Motivation/Background Billion dollar weather and climate disasters are on the rise in the US. In 2011 there were a record number (14), six of which were related to tornado outbreaks. Currently, there is no national capacity to provide skillful long-range severe weather outlooks. In response, a workshop was held in May 2012 at the National Weather Center in Norman, Oklahoma to assess the current state of the science and to identify what is required to develop long-range severe weather outlook and attribution products that span the intraseasonal-to-seasonal timescales, incorporate state-of-the-art science and technology, and achieve needs for regional information. At present the NOAA Storm Prediction Center (SPC) provides severe weather outlooks to 8 days. The recent call for extending the range of extreme weather and climate information, highlighted by the NWS Weather Ready Nation initiative, necessitates that we move toward advancing the science and operational capabilities to expand the severe weather outlooks to the extended (i.e. weeks 2-6) and seasonal (3 months) time horizons. Such information is useful for federal and state government agencies, private industry, emergency planners, and other stakeholders to incorporate into their operational decision making capabilities. Nascent efforts toward this goal are already underway and have demonstrated potential for advancing our long range prediction capabilities. Notwithstanding these recent advances, there are still significant gaps in understanding, and a need for resources to continue advancing the science toward skillful long range severe weather prediction. This white paper outlines a bold vision from the climate and weather science communities with a roadmap on how to
forecast models; their ongoing work similarly demonstrates the viability of using global climate models, including the CFS, in such a dynamical downscaling approach. The forecast model – Weather Research and Forecasting (WRF) model – is configured such that convective clouds and storms are explicitly represented over the entire domain. The output of such convection-permitting WRF-model integrations over months and seasons is then mined to determine the spatial distribution and frequency of convective storms by type and severity. Figure 3 shows an example of a predicted severe storm occurrence over the period April through June of 2012, generated by WRF-enabled downscaling of the CFS model. Observational Databases Underpinning our current understanding of the severe weather environment and its climate connections is a long term (1950-present) historical database of F-scale tornado counts. Since this database was not intended to be a consistent homogenous long-term climate record of tornadic and severe weather parameters, there are inherent inconsistencies as a result of public awareness, tornado reporting practices, NWS guidelines, and other sources of inhomogeneity. These issues may introduce spurious trends in the long-term tornado data. However, it has been demonstrated that much of this trend can be ameliorated by focusing on the F1-F5 tornado counts only (Verbout et al. 2006) as demonstrated in Figure 4 which shows that much of the trend can be explained through the timeseries evolution of the F0 tornado counts. Nevertheless, it is necessary to explore other novel ways to further homogenize the long–term historical tornado database while simultaneously taking
Fig!3.!Example!of!predicted!storm!occurrence!(simulated!radar!reflectivity!>!40!dBZ)!over!the!period!April,!May,!Jun,!2012,!generated!by!WRF!enabled!downscaling!of!the!CFS!model.!
Fig!4.!Time!series!of!F0!(blue)!and!F1!nd!greater!(red)!annual!tornado!counts!for!195092010.!
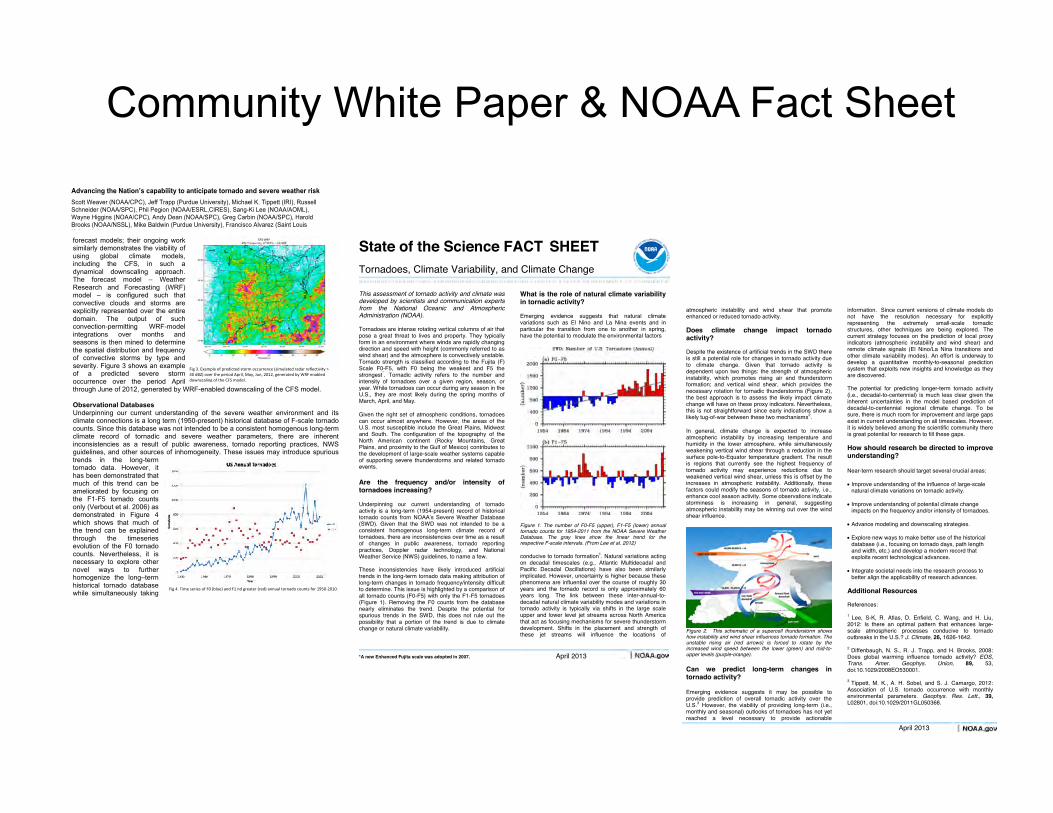
Community White Paper & NOAA Fact Sheet
*A new Enhanced Fujita scale was adopted in 2007. April 2013
State of the Science FACT SHEET
Tornadoes, Climate Variability, and Climate Change
This assessment of tornado activity and climate was developed by scientists and communication experts from the National Oceanic and Atmospheric Administration (NOAA). Tornadoes are intense rotating vertical columns of air that pose a great threat to lives and property. They typically form in an environment where winds are rapidly changing direction and speed with height (commonly referred to as wind shear) and the atmosphere is convectively unstable. Tornado strength is classified according to the Fujita (F) Scale F0-F5, with F0 being the weakest and F5 the strongest*. Tornadic activity refers to the number and intensity of tornadoes over a given region, season, or year. While tornadoes can occur during any season in the U.S., they are most likely during the spring months of March, April, and May. Given the right set of atmospheric conditions, tornadoes can occur almost anywhere. However, the areas of the U.S. most susceptible include the Great Plains, Midwest and South. The configuration of the topography of the North American continent (Rocky Mountains, Great Plains, and proximity to the Gulf of Mexico) contributes to the development of large-scale weather systems capable of supporting severe thunderstorms and related tornado events. Are the frequency and/or intensity of tornadoes increasing? Underpinning our current understanding of tornado activity is a long-term (1954-present) record of historical tornado counts from NOAA’s Severe Weather Database (SWD). Given that the SWD was not intended to be a consistent homogenous long-term climate record of tornadoes, there are inconsistencies over time as a result of changes in public awareness, tornado reporting practices, Doppler radar technology, and National Weather Service (NWS) guidelines, to name a few. These inconsistencies have likely introduced artificial trends in the long-term tornado data making attribution of long-term changes in tornado frequency/intensity difficult to determine. This issue is highlighted by a comparison of all tornado counts (F0-F5) with only the F1-F5 tornadoes (Figure 1). Removing the F0 counts from the database nearly eliminates the trend. Despite the potential for spurious trends in the SWD, this does not rule out the possibility that a portion of the trend is due to climate change or natural climate variability.
What is the role of natural climate variability in tornadic activity? Emerging evidence suggests that natural climate variations such as El Nino and La Nina events and in particular the transition from one to another in spring, have the potential to modulate the environmental factors
Figure 1. The number of F0-F5 (upper), F1-F5 (lower) annual tornado counts for 1954-2011 from the NOAA Severe Weather Database. The gray lines show the linear trend for the respective F-scale intervals. (From Lee et al. 2012) conducive to tornado formation1. Natural variations acting on decadal timescales (e.g., Atlantic Multidecadal and Pacific Decadal Oscillations) have also been similarly implicated. However, uncertainty is higher because these phenomena are influential over the course of roughly 30 years and the tornado record is only approximately 60 years long. The link between these inter-annual-to-decadal natural climate variability modes and variations in tornado activity is typically via shifts in the large scale upper and lower level jet streams across North America that act as focusing mechanisms for severe thunderstorm development. Shifts in the placement and strength of these jet streams will influence the locations of
April 2013
atmospheric instability and wind shear that promote enhanced or reduced tornado activity. Does climate change impact tornado activity? Despite the existence of artificial trends in the SWD there is still a potential role for changes in tornado activity due to climate change. Given that tornado activity is dependent upon two things: the strength of atmospheric instability, which promotes rising air and thunderstorm formation; and vertical wind shear, which provides the necessary rotation for tornadic thunderstorms (Figure 2), the best approach is to assess the likely impact climate change will have on these proxy indicators. Nevertheless, this is not straightforward since early indications show a likely tug-of-war between these two mechanisms2. In general, climate change is expected to increase atmospheric instability by increasing temperature and humidity in the lower atmosphere, while simultaneously weakening vertical wind shear through a reduction in the surface pole-to-Equator temperature gradient. The result is regions that currently see the highest frequency of tornado activity may experience reductions due to weakened vertical wind shear, unless this is offset by the increases in atmospheric instability. Additionally, these factors could modify the seasons of tornado activity, i.e., enhance cool season activity. Some observations indicate storminess is increasing in general, suggesting atmospheric instability may be winning out over the wind shear influence.
Figure 2. This schematic of a supercell thunderstorm shows how instability and wind shear influences tornado formation. The unstable rising air (red arrows) is forced to rotate by the increased wind speed between the lower (green) and mid-to-upper levels (purple-orange). Can we predict long-term changes in tornado activity? Emerging evidence suggests it may be possible to provide prediction of overall tornadic activity over the U.S.3 However, the viability of providing long-term (i.e., monthly and seasonal) outlooks of tornadoes has not yet reached a level necessary to provide actionable
information. Since current versions of climate models do not have the resolution necessary for explicitly representing the extremely small-scale tornadic structures, other techniques are being explored. The current strategy focuses on the prediction of local proxy indicators (atmospheric instability and wind shear) and remote climate signals (El Nino/La Nina transitions and other climate variability modes). An effort is underway to develop a quantitative monthly-to-seasonal prediction system that exploits new insights and knowledge as they are discovered. The potential for predicting longer-term tornado activity (i.e., decadal-to-centennial) is much less clear given the inherent uncertainties in the model based prediction of decadal-to-centennial regional climate change. To be sure, there is much room for improvement and large gaps exist in current understanding on all timescales. However, it is widely believed among the scientific community there is great potential for research to fill these gaps. How should research be directed to improve understanding? Near-term research should target several crucial areas: Improve understanding of the influence of large-scale
natural climate variations on tornadic activity. Improve understanding of potential climate change
impacts on the frequency and/or intensity of tornadoes. Advance modeling and downscaling strategies. Explore new ways to make better use of the historical
database (i.e., focusing on tornado days, path length and width, etc.) and develop a modern record that exploits recent technological advances.
Integrate societal needs into the research process to
better align the applicability of research advances. Additional Resources References: 1 Lee, S-K, R. Atlas, D. Enfield, C. Wang, and H. Liu, 2012: Is there an optimal pattern that enhances large-scale atmospheric processes conducive to tornado outbreaks in the U.S.? J. Climate, 26, 1626-1642. 2 Diffenbaugh, N. S., R. J. Trapp, and H. Brooks, 2008: Does global warming influence tornado activity? EOS, Trans. Amer. Geophys. Union, 89, 53, doi:10.1029/2008EO530001. 3 Tippett, M. K., A. H. Sobel, and S. J. Camargo, 2012: Association of U.S. tornado occurrence with monthly environmental parameters. Geophys. Res. Lett., 39, L02801, doi:10.1029/2011GL050368.
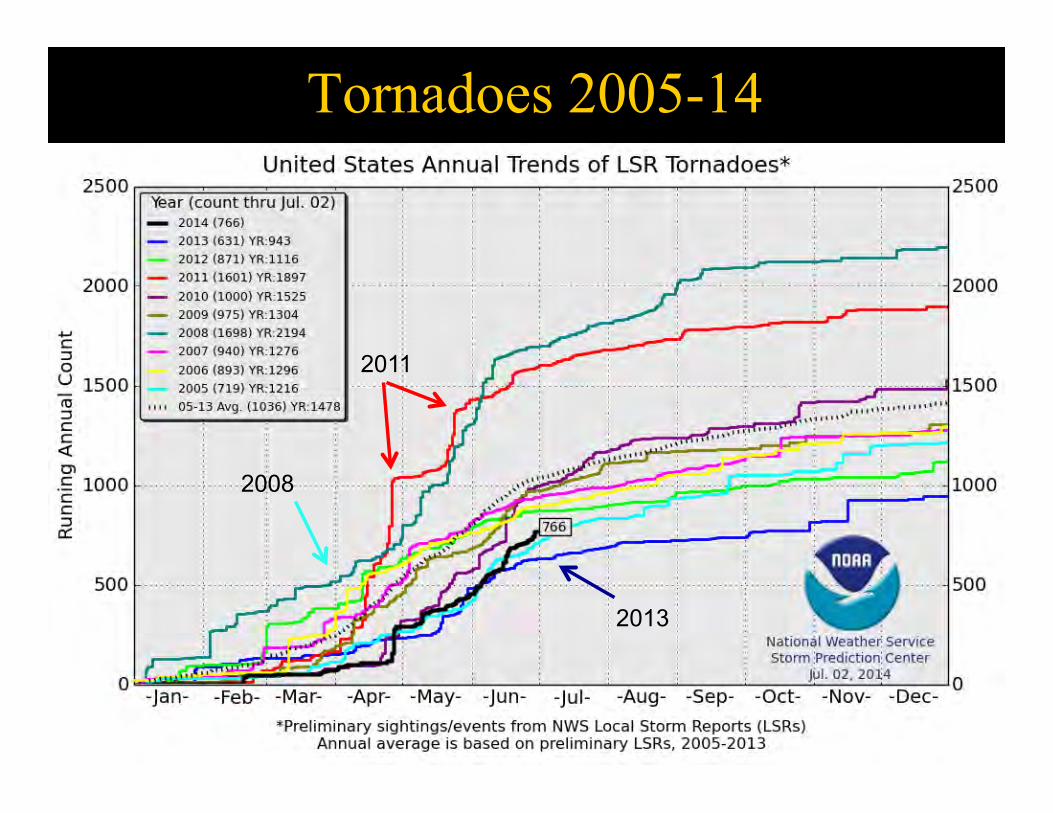
Tornadoes 2005-14
4
2011
2008
2013
How can we improve understanding of long term changes and year-to-
year variability?
5
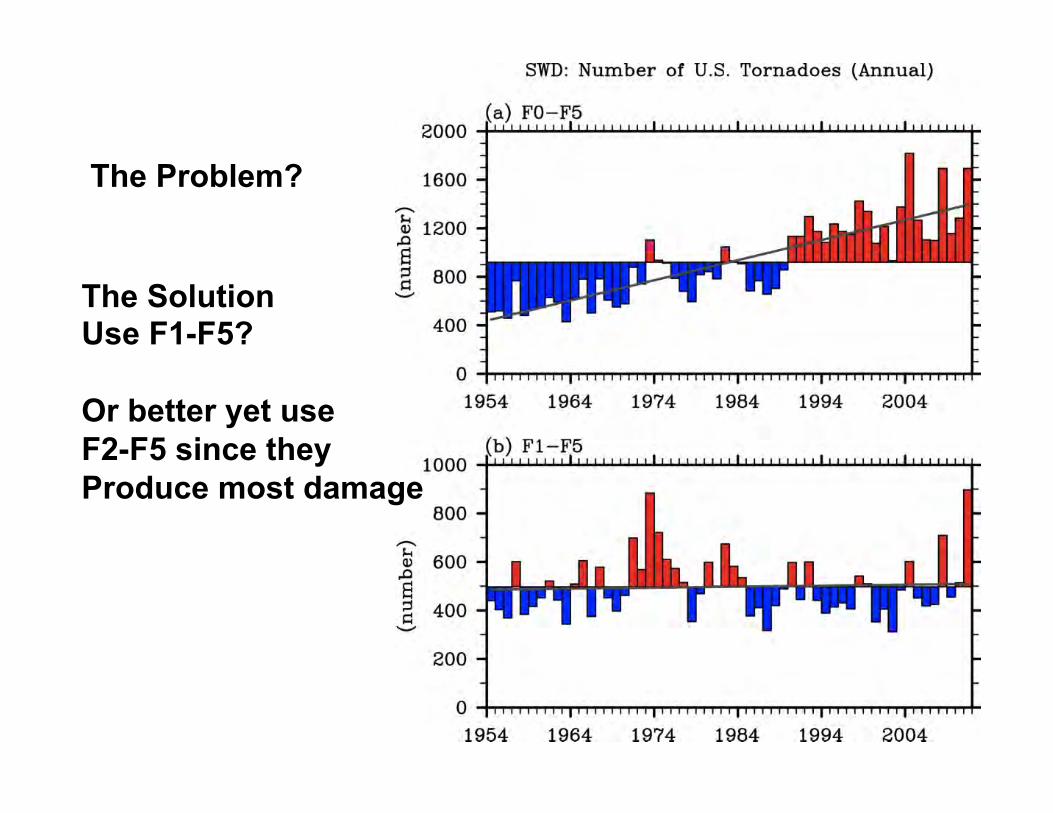
The Problem?
The Solution Use F1-F5? Or better yet use F2-F5 since they Produce most damage
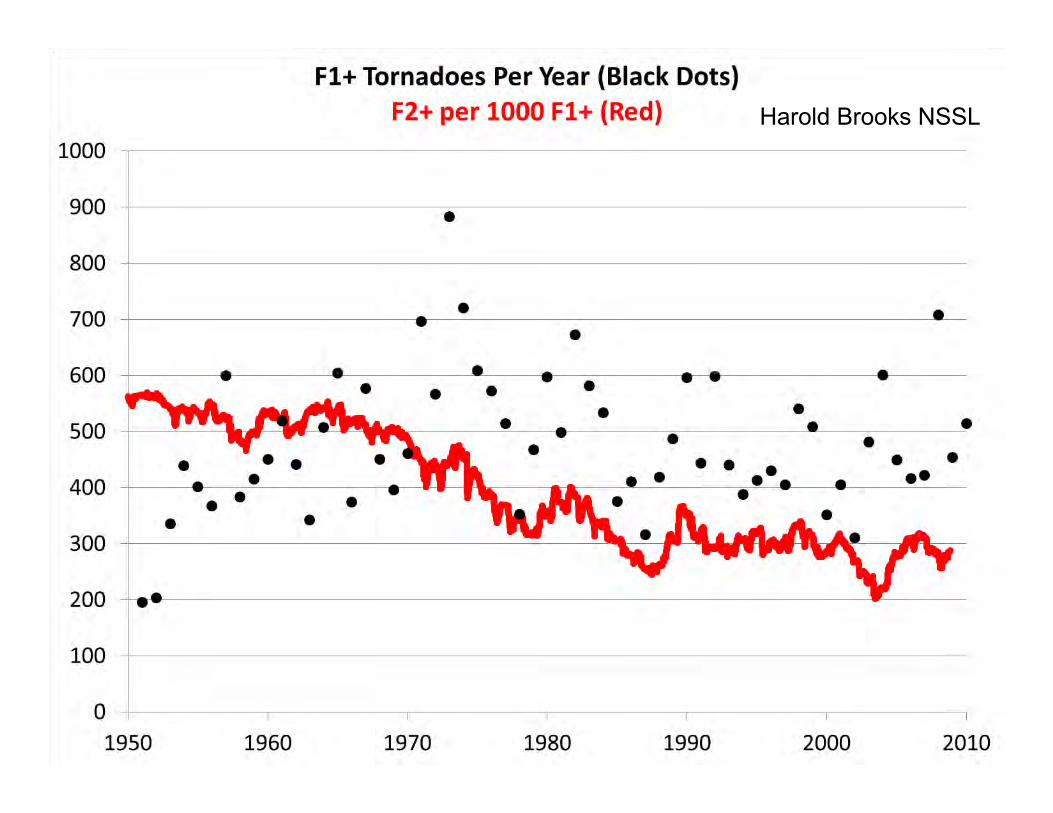
Harold Brooks NSSL
Proxies
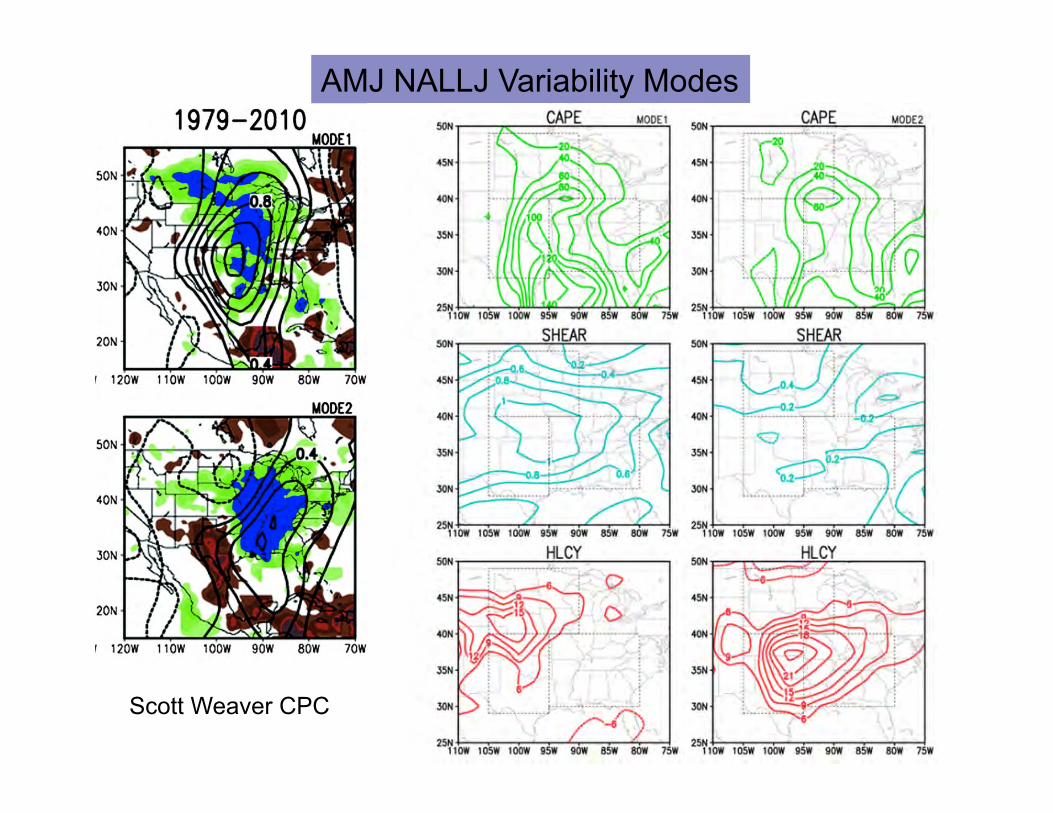
AMJ NALLJ Variability Modes
Scott Weaver CPC
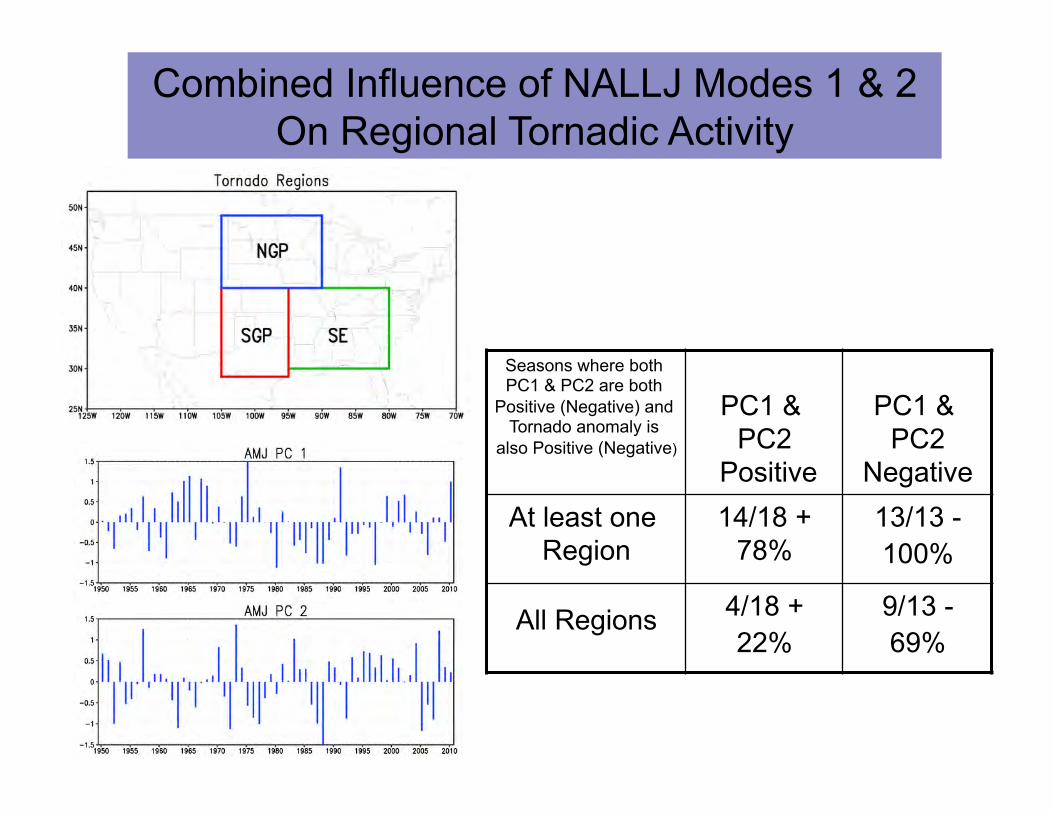
Combined Influence of NALLJ Modes 1 & 2 On Regional Tornadic Activity
Seasons where both PC1 & PC2 are both
Positive (Negative) and Tornado anomaly is
also Positive (Negative)
PC1 &
PC2 Positive
PC1 &
PC2 Negative
At least one Region
14/18 + 78%
13/13 - 100%
All Regions 4/18 + 22%
9/13 - 69%
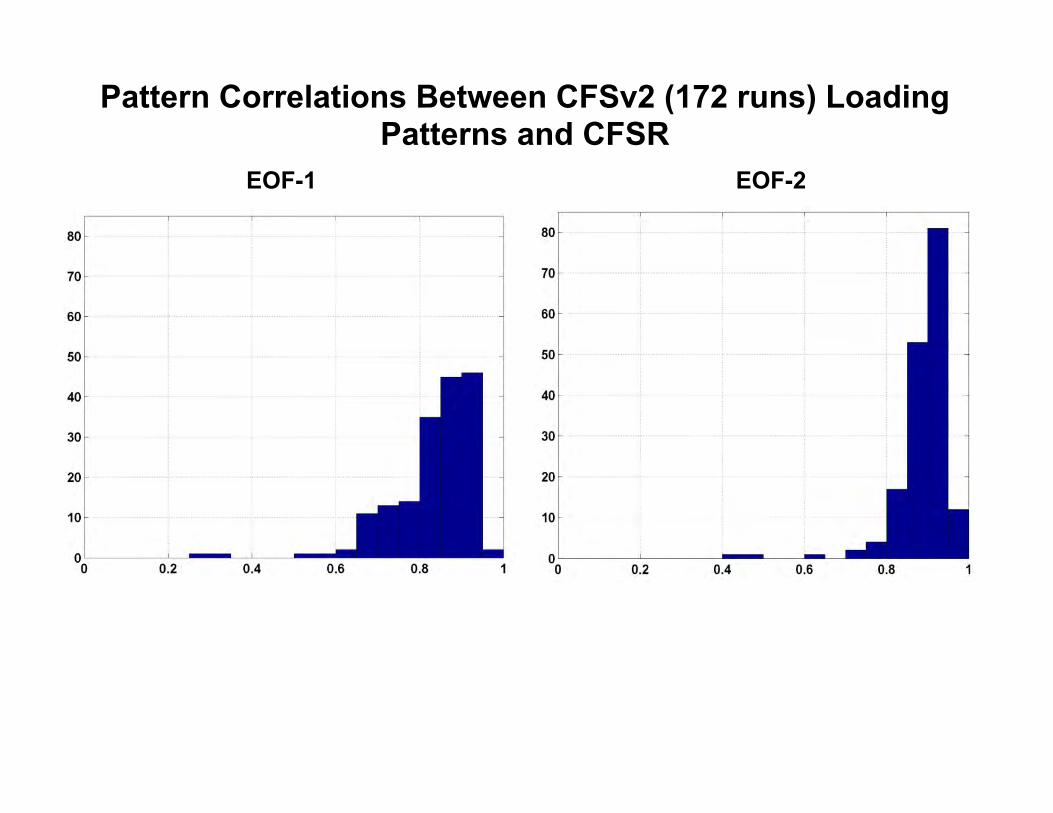
EOF-1 EOF-2
Pattern Correlations Between CFSv2 (172 runs) Loading Patterns and CFSR
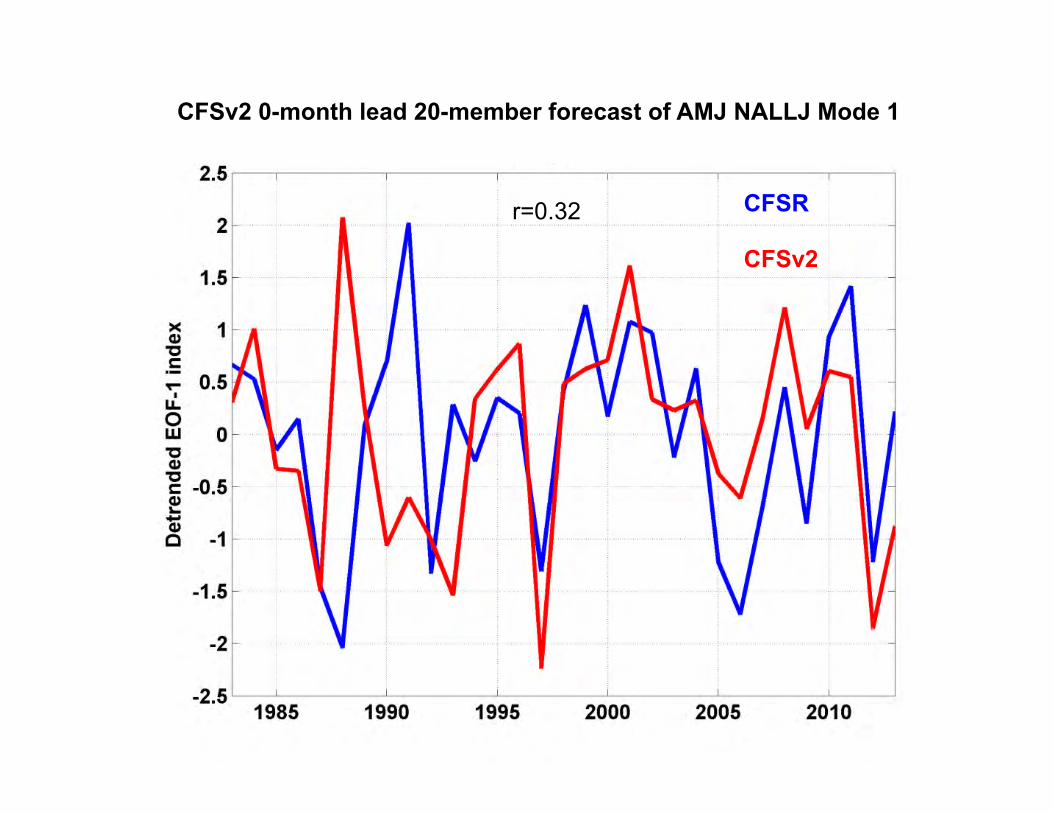
CFSv2 0-month lead 20-member forecast of AMJ NALLJ Mode 1
CFSv2
CFSR r=0.32
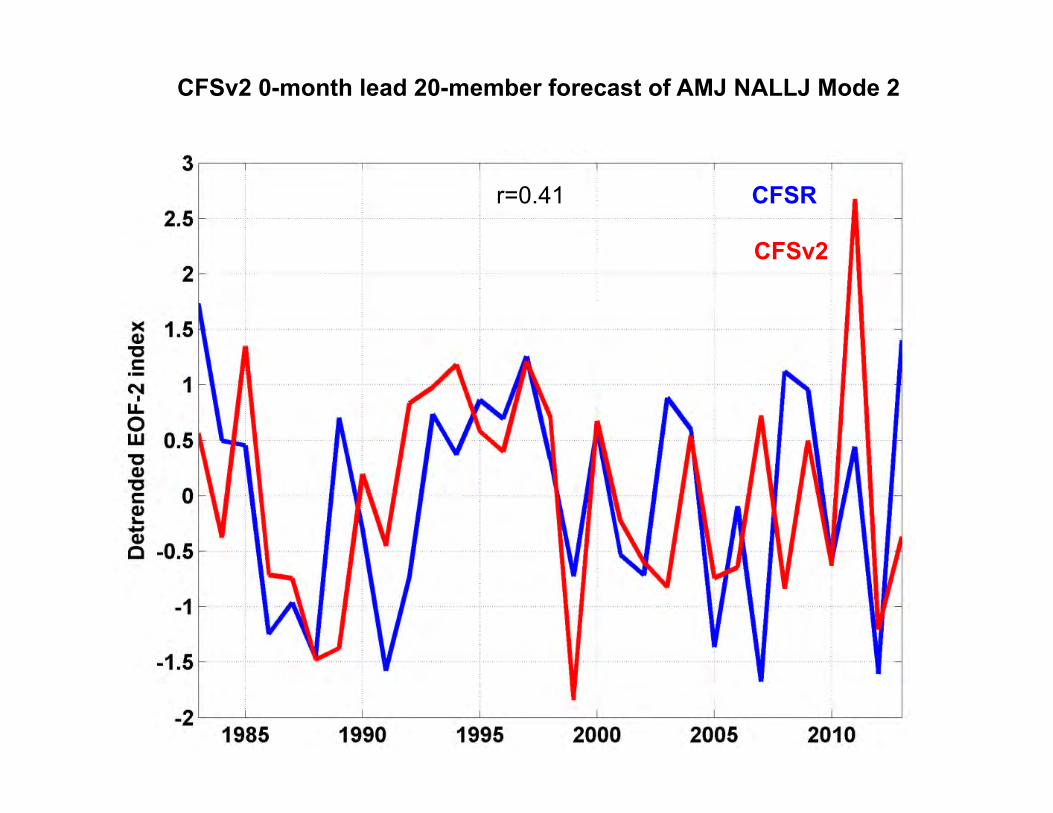
CFSv2 0-month lead 20-member forecast of AMJ NALLJ Mode 2
CFSv2
CFSR r=0.41
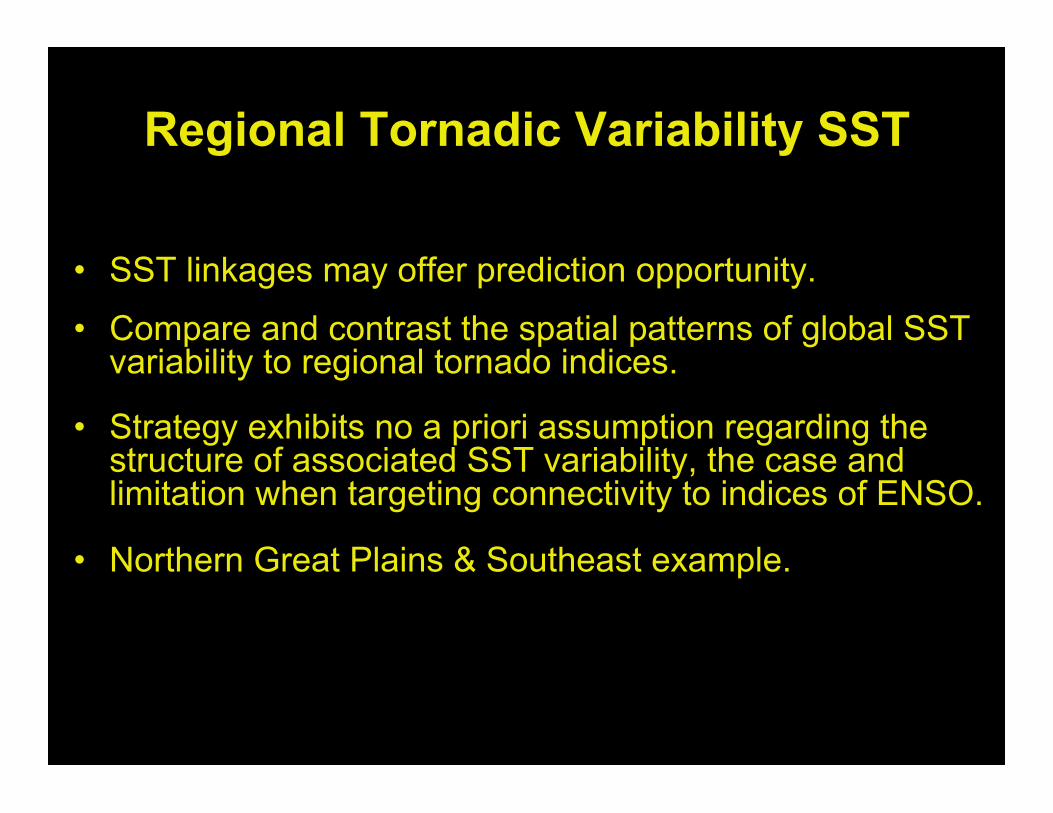
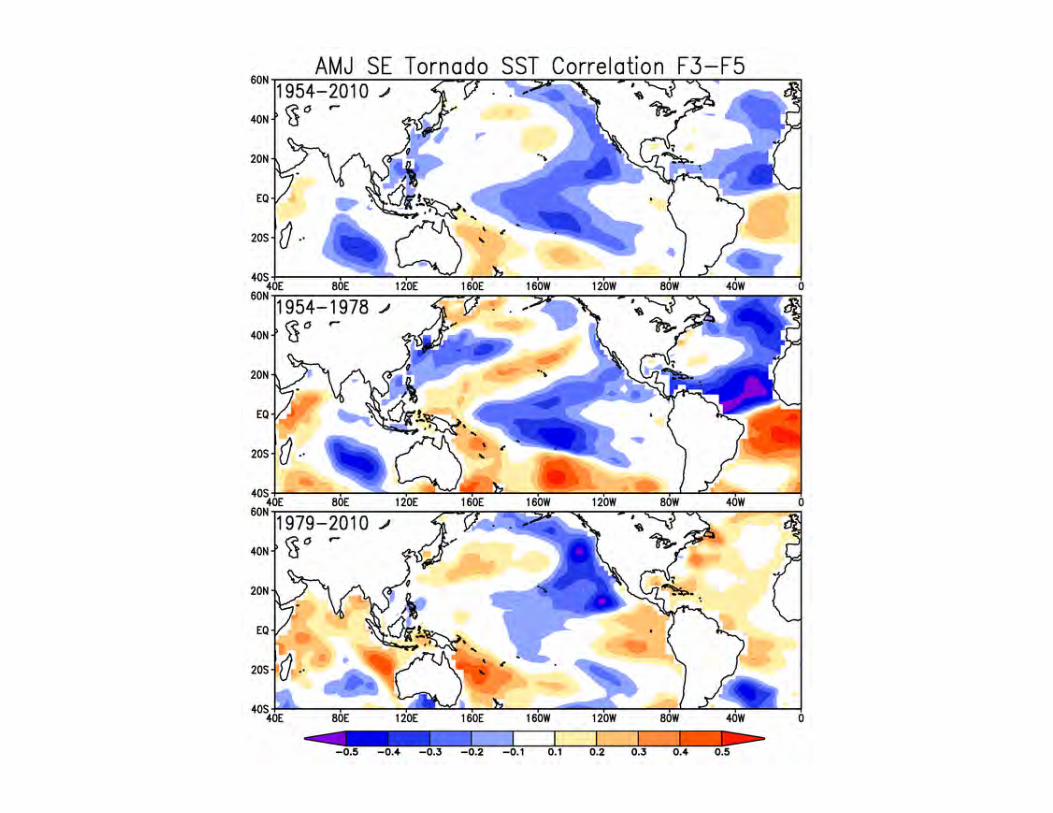
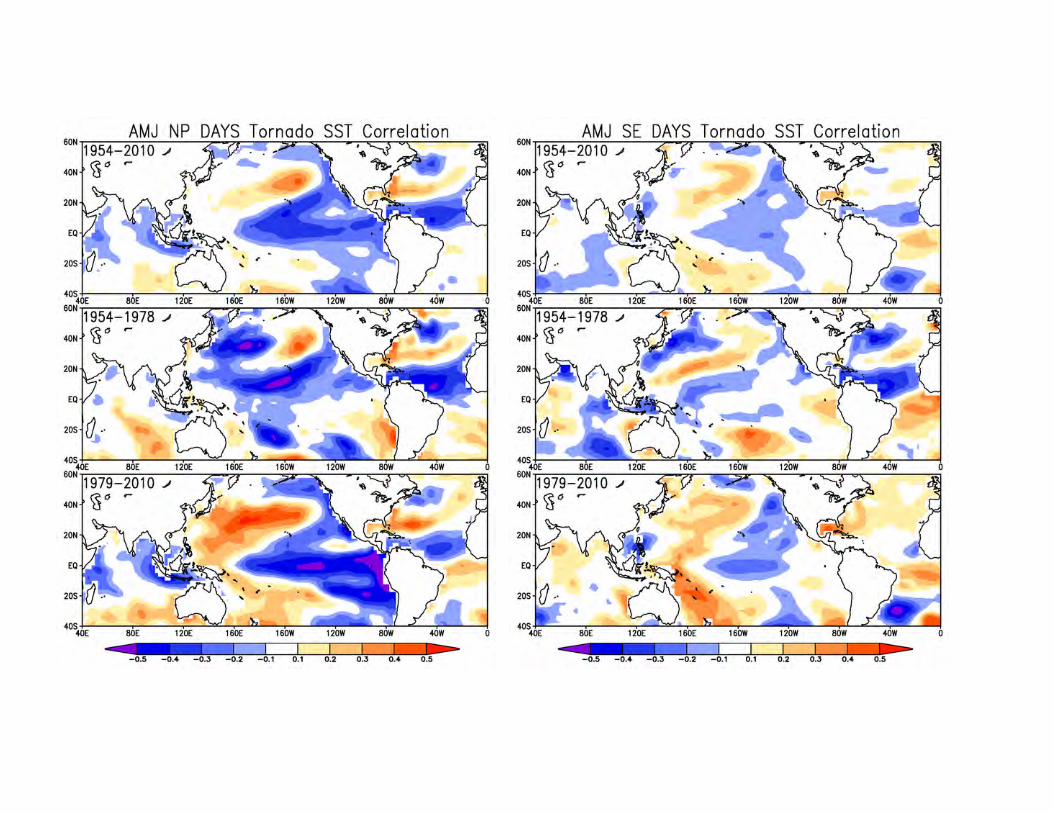
Regional Tornadic Variability SST
• SST linkages may offer prediction opportunity. • Compare and contrast the spatial patterns of global SST
variability to regional tornado indices. • Strategy exhibits no a priori assumption regarding the
structure of associated SST variability, the case and limitation when targeting connectivity to indices of ENSO.
• Northern Great Plains & Southeast example.

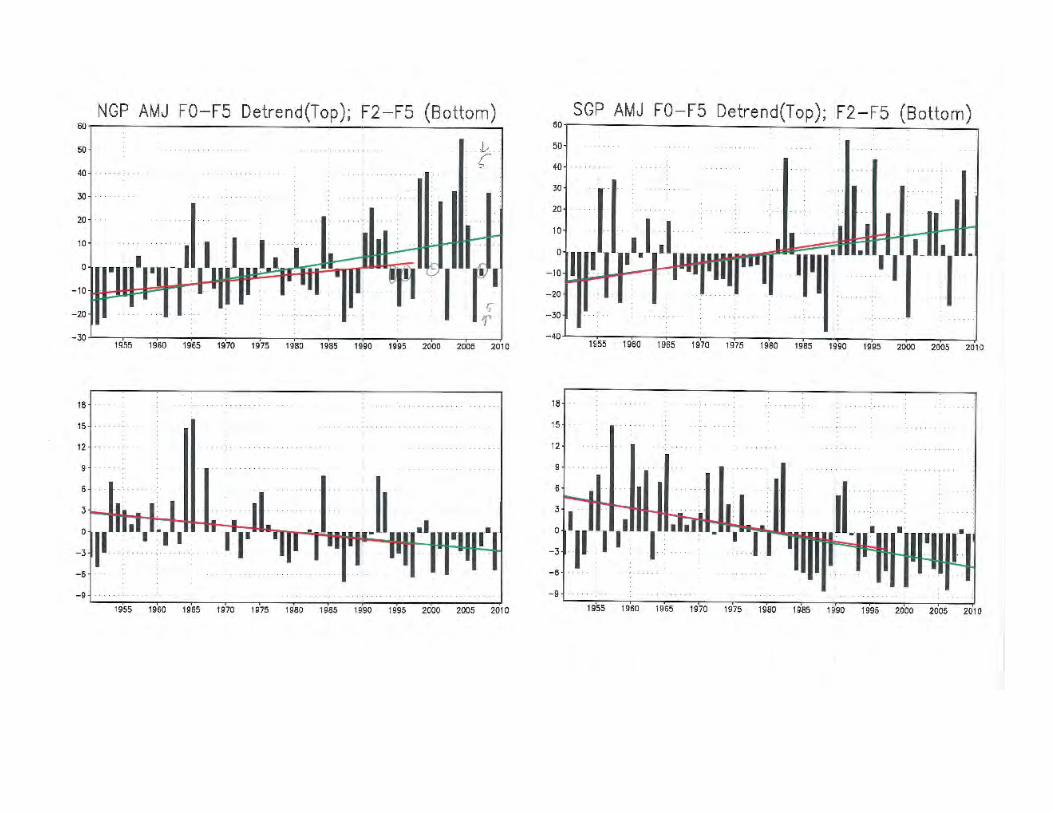
SST warming trend coincident with an increase in weak tornadoes at the expense of the stronger ones.
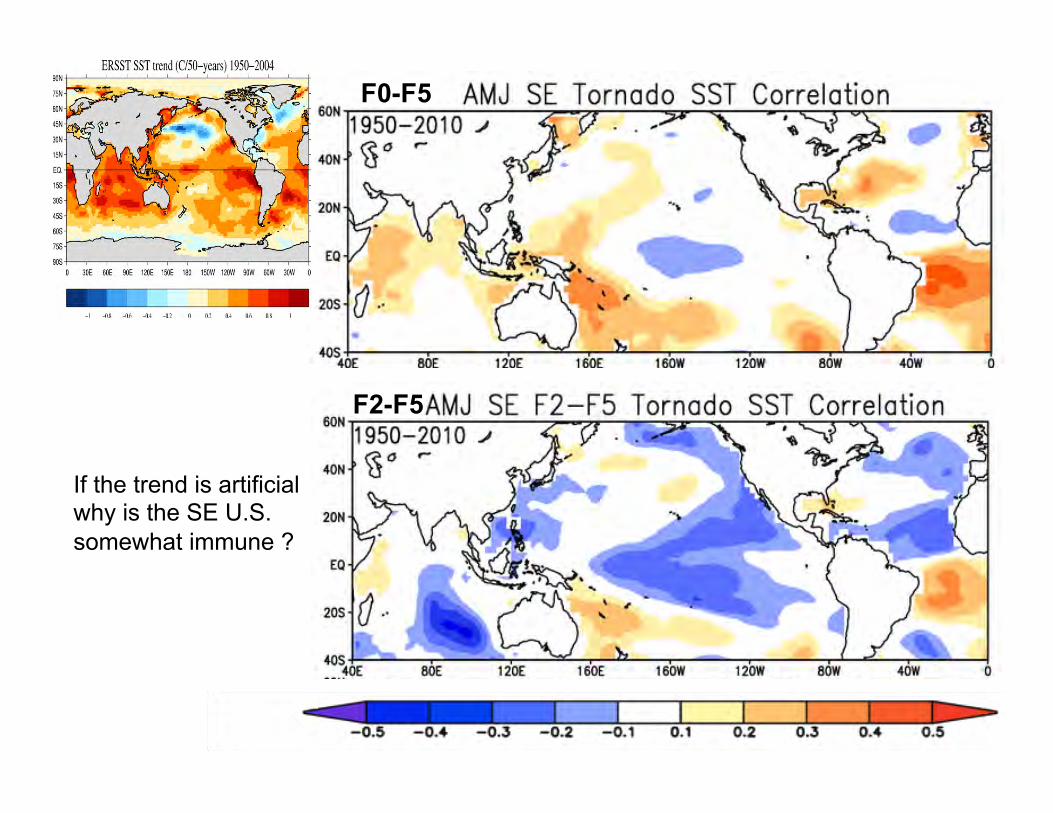
F0-F5
F2-F5
If the trend is artificial why is the SE U.S. somewhat immune ?
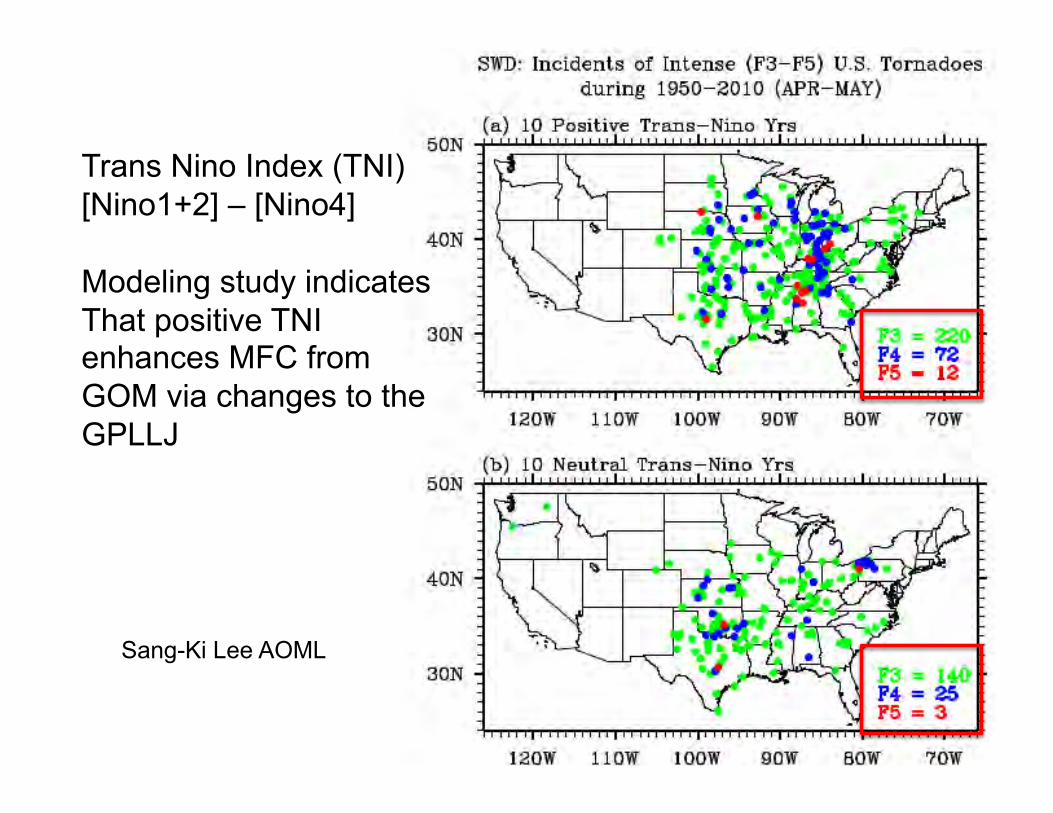
Trans Nino Index (TNI) [Nino1+2] – [Nino4] Modeling study indicates That positive TNI enhances MFC from GOM via changes to the GPLLJ
Sang-Ki Lee AOML
A Prediction Example
Jan Feb Mar Apr May Jun Jul Aug Sep Oct Nov Dec South 0.16 0.36 0.29 0.05 0.28 0.51 0.09 0.34 0.05 0.30 0.29 0.33 Southeast 0.22 0.24 0.00 0.41 0.66 0.25 -0.01 0.00 0.49 0.26 0.45 0.47 Central 0.47 0.50 0.64 0.23 0.37 0.45 0.42 0.05 0.19 0.03 0.24 0.42 Midwest -0.12 0.58 0.15 0.67 0.39 0.42 0.02 0.39 -0.04 Plains 0.12 0.37 0.40 0.50 0.53 0.27 -0.03 0.03 Northeast 0.15 0.05 0.15 0.41 0.18 0.70 0.15 -0.02 Southwest 0.02 -0.10 0.32 0.04 -0.01 -0.44 0.30 Northwest -0.14 0.15 0.30 0.19 West 0.21 0.34 0.13
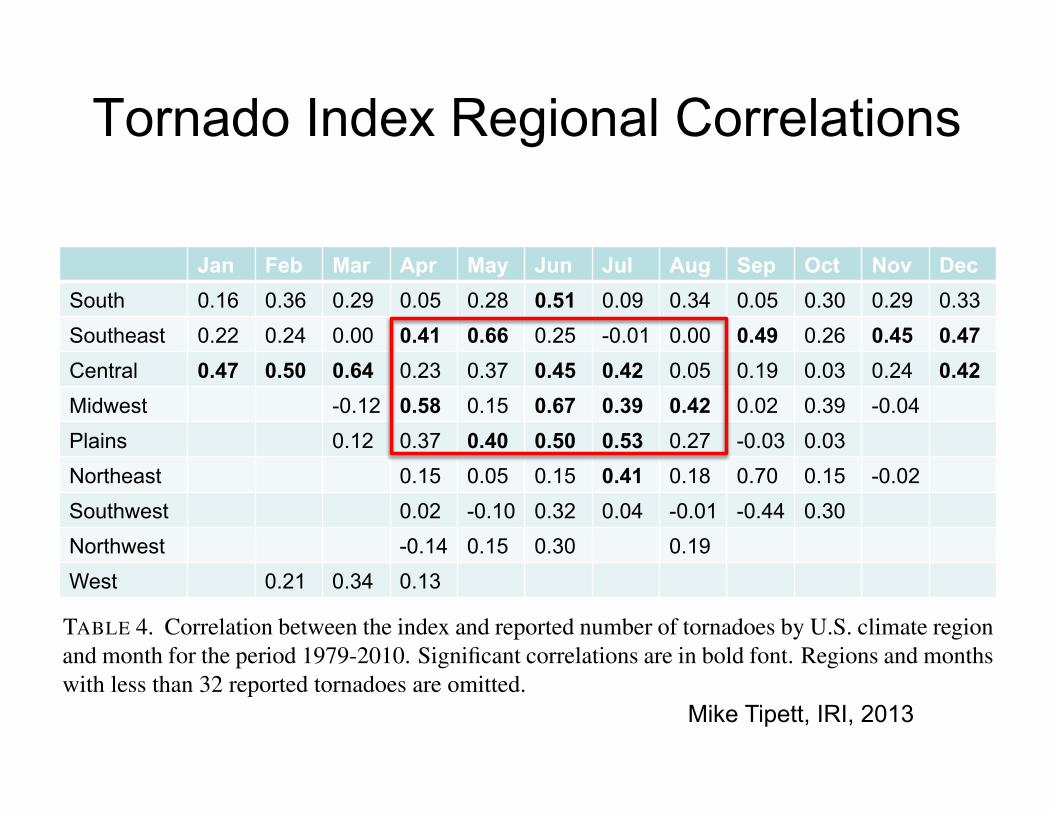
Tornado Index Regional Correlations
Jan Feb Mar Apr May Jun Jul Aug Sep Oct Nov Dec AnnualSouth 0.66 0.51 0.52 0.69 0.50 0.47 0.57 0.31 0.12 0.46 0.60 0.71 0.53Southeast 0.53 0.54 0.36 0.47 0.68 0.46 0.54 0.42 0.67 0.41 0.57 0.69 0.30Central 0.68 0.69 0.65 0.53 0.56 0.73 0.65 0.35 0.42 0.26 0.28 0.73 0.51Upper Midwest - - 0.60 0.55 0.71 0.57 0.56 0.14 0.54 0.56 - - 0.45Plains - - 0.63 0.58 0.80 0.53 0.81 0.49 0.55 0.23 - - 0.51Northeast - - - 0.38 0.13 0.61 0.50 0.41 0.37 0.71 0.29 - 0.36Southwest - - - 0.21 0.13 0.37 0.32 0.40 0.02 0.31 - - 0.22Northwest - - - 0.03 0.44 0.36 - 0.07 - - - - 0.15West - 0.49 0.60 - - - - - - - - - 0.34
TABLE 4. Correlation between the index and reported number of tornadoes by U.S. climate regionand month for the period 1979-2010. Significant correlations are in bold font. Regions and monthswith less than 32 reported tornadoes are omitted.
22
Mike Tipett, IRI, 2013
A Final Word These are just a few vignettes. Other topics include: • Downscaling methodologies. • Intraseasonal variability. Some links to MJO in
spring. • New ways to correct the historical database. • Exploiting modern technology to develop and
maintain a new climate record for the next generation of scientists.
• White Paper available upon request or download at: www.cpc .ncep .noaa .gov /p roduc ts / severe_wea ther /Climate.Severe.Weather.White.Paper.Apr2013.pdf