Embed Size (px)
Citation preview
Toward More Sustainable Infrastructure:Project Evaluation for Planners and
Engineers
Part IBuilding Infrastructure to Serve
the Needs of Society
Martland, Toward More Sustainable Infrastructure, Chapter 2
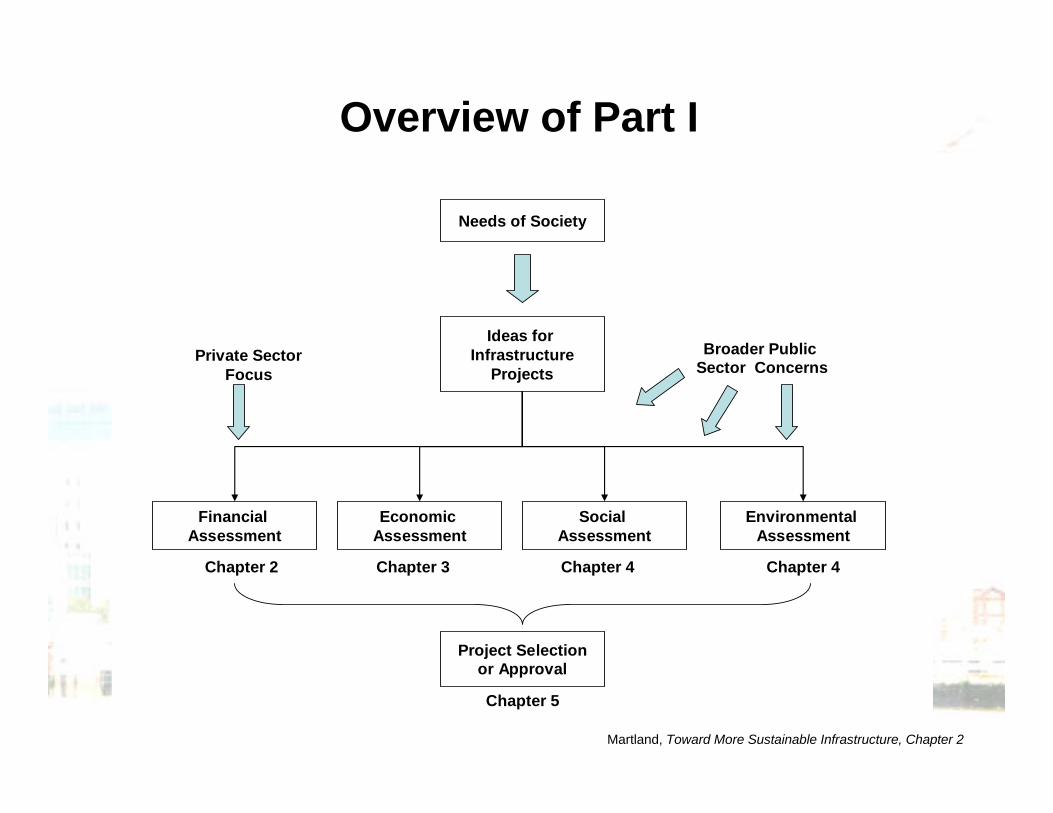
Overview of Part I
Needs of Society
Private Sector Focus
Ideas for Infrastructure
Projects Broader Public
Sector Concerns
Financial Assessment
Chapter 2
Economic Assessment
Chapter 3
Social Assessment
Chapter 4
Environmental Assessment
Chapter 4
Project Selection or Approval
Chapter 5
Martland, Toward More Sustainable Infrastructure, Chapter 2
Chapter 2 System Performance
• Introduction • System Cost • Profitability, Breakeven Volume and
Return on investment • Service • Capacity • Safety, Security, and Risk
Martland, Toward More Sustainable Infrastructure, Chapter 2
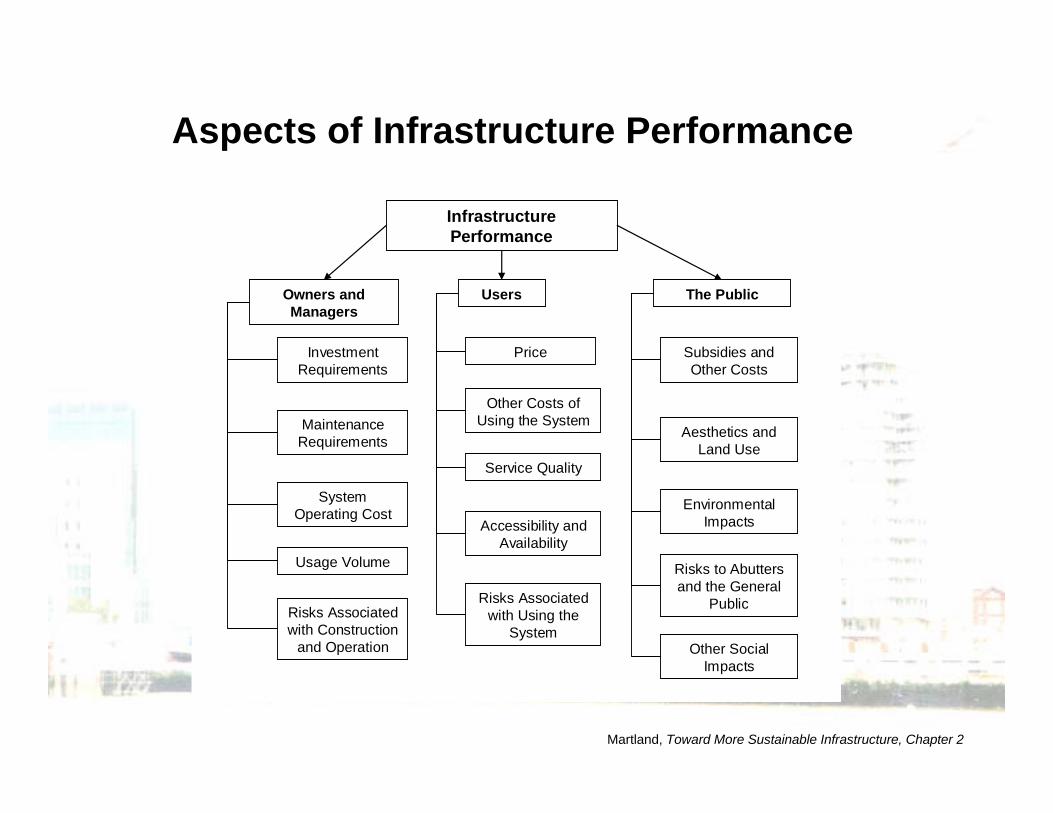
Aspects of Infrastructure Performance
Infrastructure Performance
System Operating Cost
Usage Volume
Maintenance Requirements
Users
Service Quality
Accessibility and Availability
Price
Other Costs of Using the System
Owners and Managers
Investment Requirements
Risks Associated with Construction
and Operation
The Public
Subsidies and Other Costs
Aesthetics and Land Use
EnvironmentalImpacts
Risks to Abutters and the General
Public
Other SocialImpacts
Risks Associated with Using the
System
Martland, Toward More Sustainable Infrastructure, Chapter 2
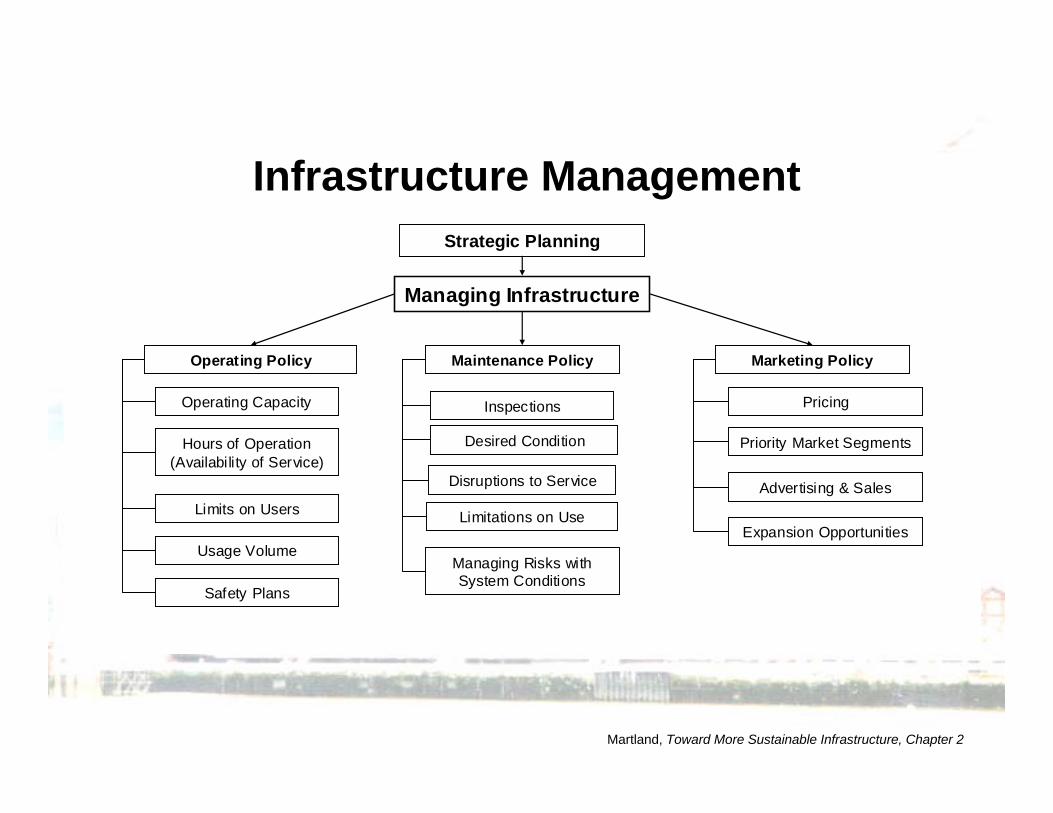
Infrastructure Management
Managing Infrastructure
Strategic Planning
Maintenance Policy Operating Policy
Operating Capacity
Hours of Operation (Availability of Service)
Limits on Users
Usage Volume
Safety Plans
Inspections
Desired Condition
Disruptions to Service
Limitations on Use
Managing Risks withSystem Conditions
Marketing Policy
Pricing
Priority Market Segments
Advertising & Sales
Expansion Opportunities
Martland, Toward More Sustainable Infrastructure, Chapter 2
System PerformanceBasic Cost & Revenue Concepts
1. Cost terminology 2. Breakeven volume and long-run cost
functions 3. Cost, revenue and profitability 4. Present economy
Can we afford to build a project based upon what customers or others are willing to pay?
Martland, Toward More Sustainable Infrastructure, Chapter 2
Martland, Toward More Sustainable Infrastructure, Chapter 2
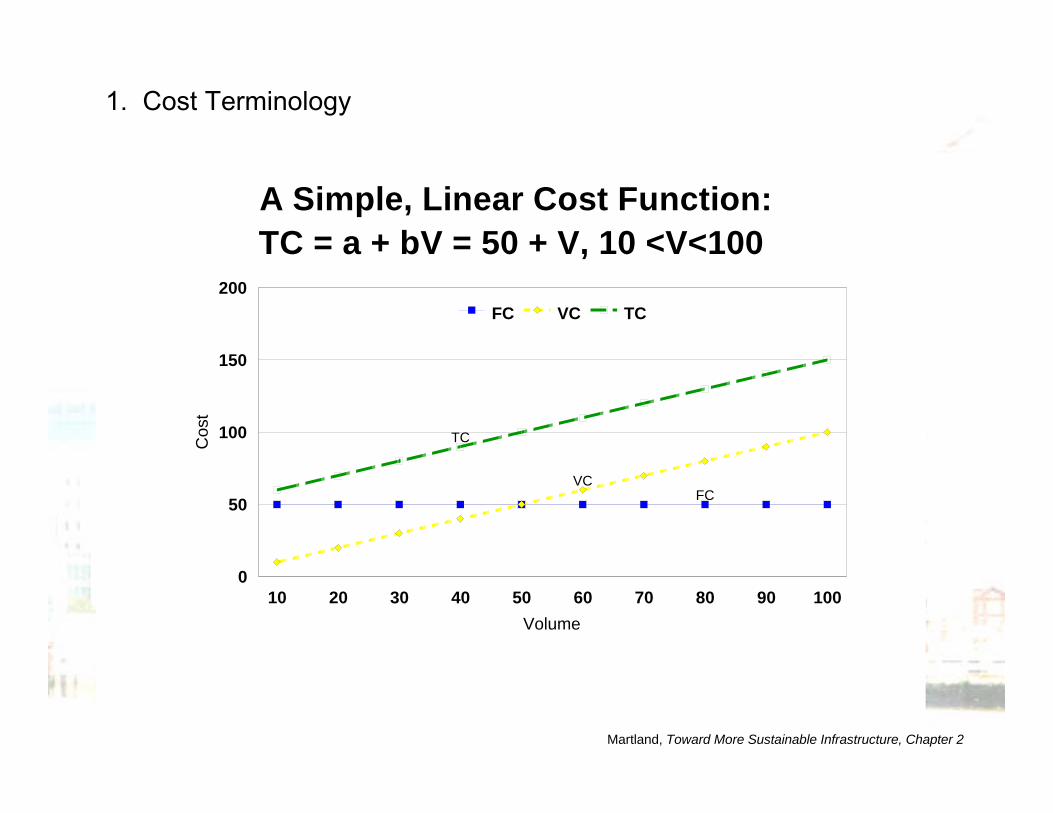
A Simple, Linear Cost Function: TC = a + bV = 50 + V, 10 <V<100
TC
VC FC
10 20 30 40 50 60 70 80 90 100 Volume
0
50
100
150
200
Cos
t
FC VC TC
1. Cost Terminology
Martland, Toward More Sustainable Infrastructure, Chapter 2
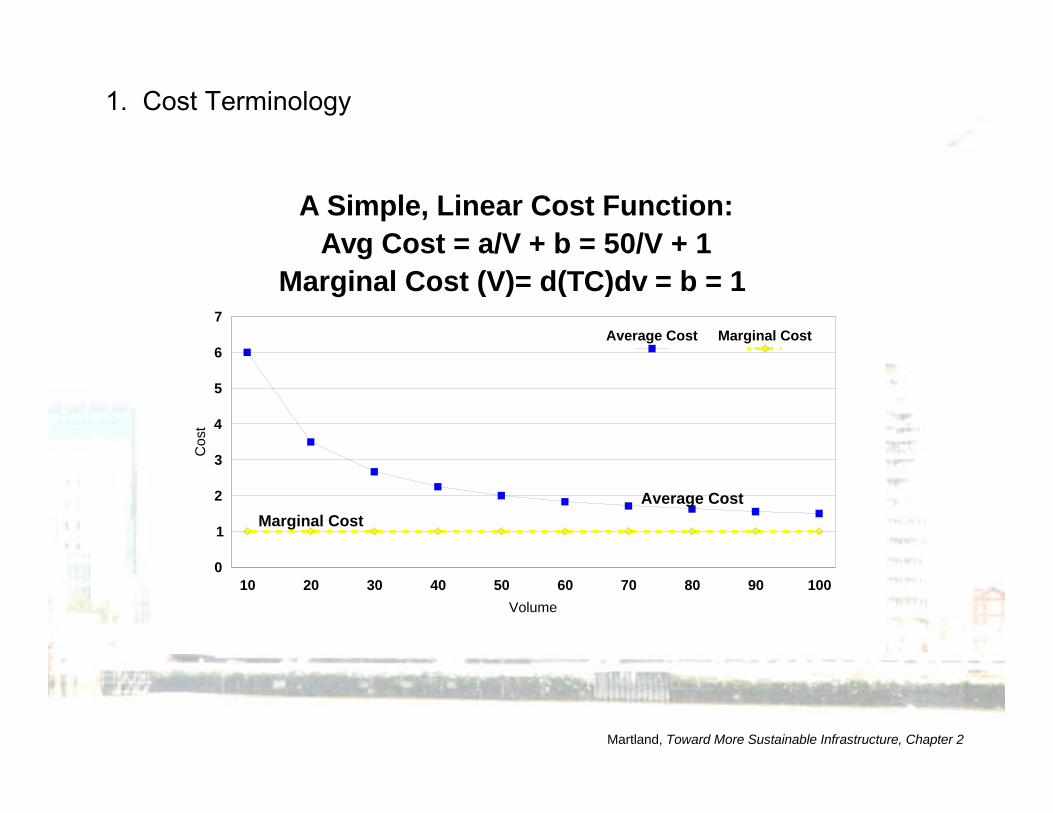
A Simple, Linear Cost Function: Avg Cost = a/V + b = 50/V + 1
Marginal Cost (V)= d(TC)dv = b = 1
Marginal Cost Average Cost
10 20 30 40 50 60 70 80 90 100 Volume
0
1
2
3
4
5
6
7
Cos
t
Average Cost Marginal Cost
1. Cost Terminology
Martland, Toward More Sustainable Infrastructure, Chapter 2
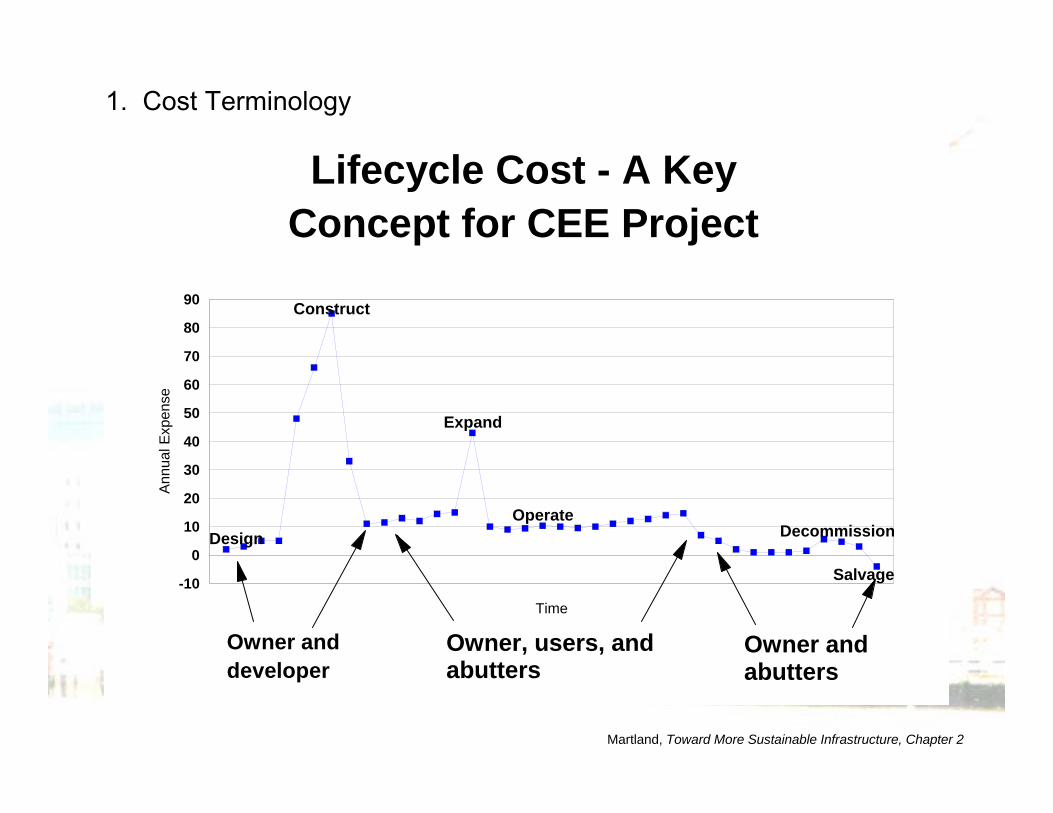
Lifecycle Cost - A Key Concept for CEE Project
Design
Construct
Expand
Operate Decommission
Salvage
Time
-10
0
10
20
30
40
50
60
70
80
90
Ann
ual E
xpen
se
Owner and developer
Owner, users, and abutters
Owner and abutters
1. Cost Terminology
Martland, Toward More Sustainable Infrastructure, Chapter 2
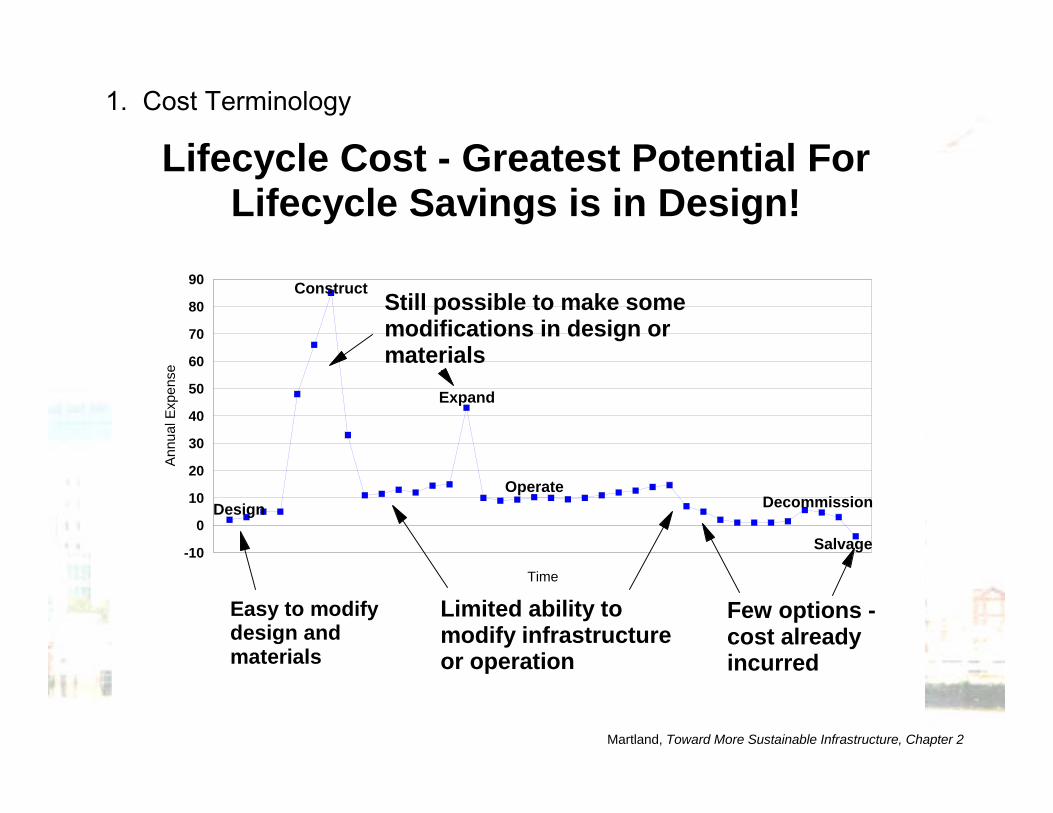
Lifecycle Cost - Greatest Potential For Lifecycle Savings is in Design!
Design
Construct
Expand
Operate Decommission
Salvage
Time
-10
0
10
20
30
40
50
60
70
80
90
Ann
ual E
xpen
se
Easy to modifydesign and materials
Limited ability to modify infrastructure or operation
Few options -cost alreadyincurred
Still possible to make some modifications in design or materials
1. Cost Terminology
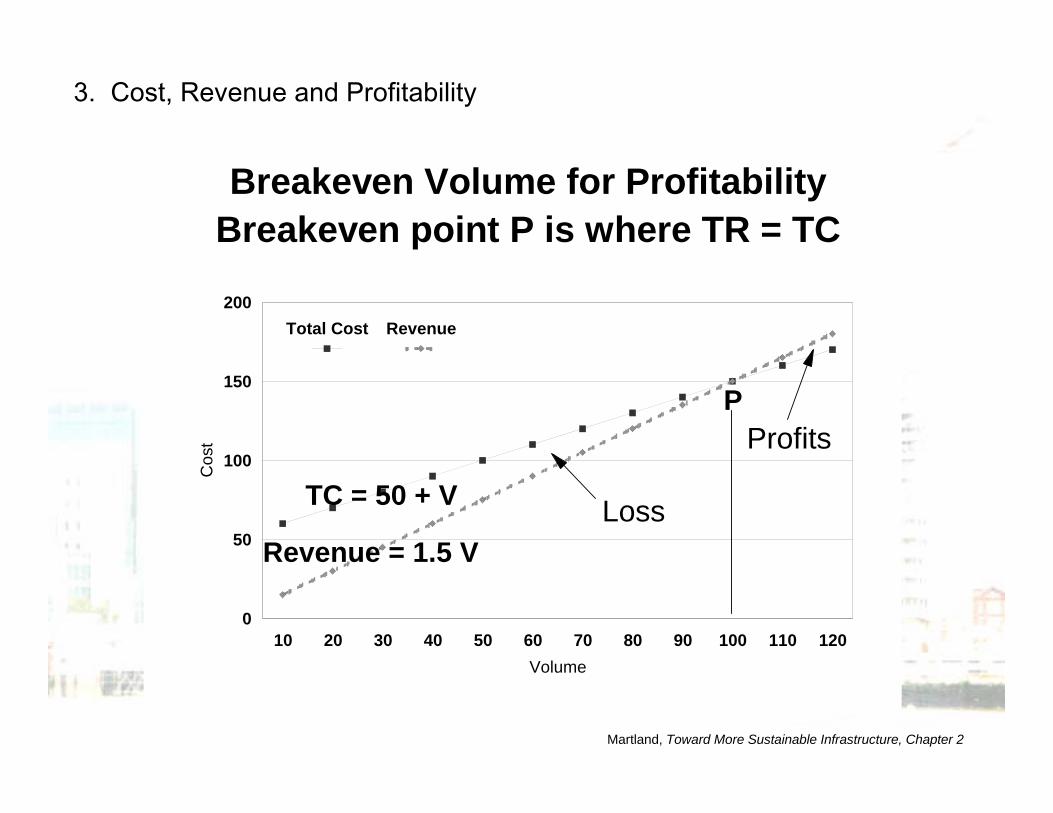
3. Cost, Revenue and Profitability
Breakeven Volume for ProfitabilityBreakeven point P is where TR = TC
Cos
t
200
150
100
50
0
Total Cost Revenue
P Profits
TC = 50 + V Loss Revenue = 1.5 V
10 20 30 40 50 60 70 80 90 100 110 120 Volume
Martland, Toward More Sustainable Infrastructure, Chapter 2
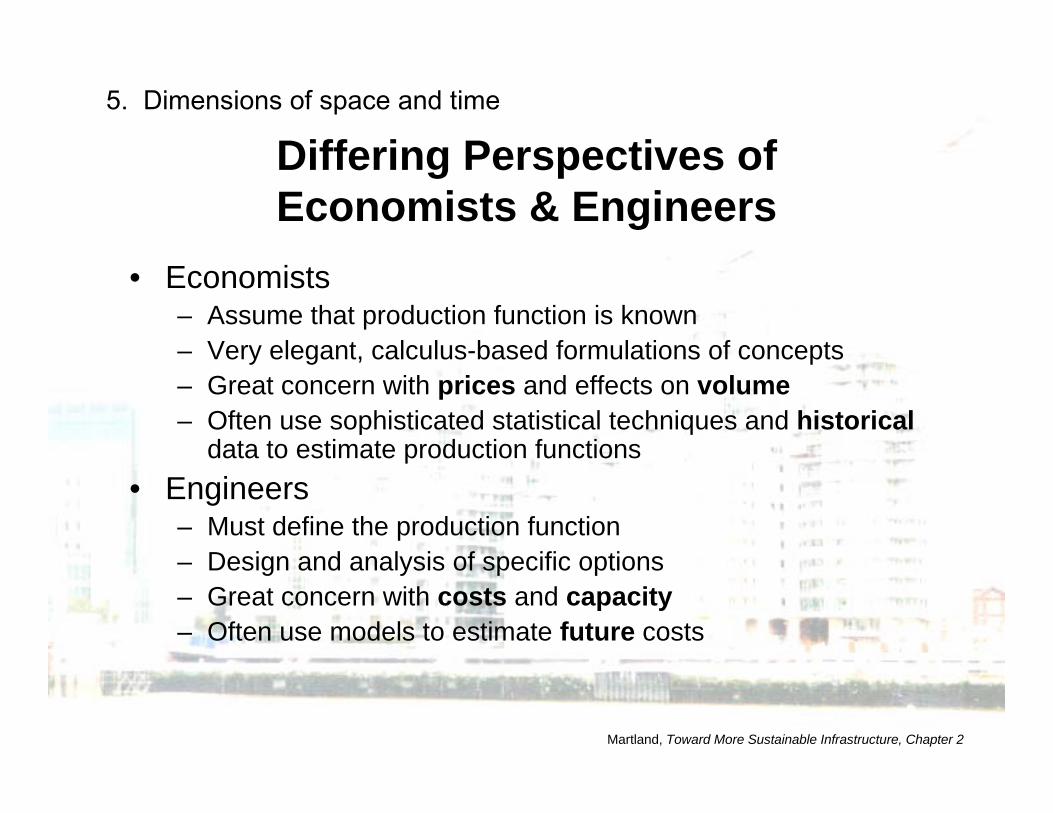
5. Dimensions of space and time
Differing Perspectives of Economists & Engineers
• Economists – Assume that production function is known – Very elegant, calculus-based formulations of concepts – Great concern with prices and effects on volume – Often use sophisticated statistical techniques and historical
data to estimate production functions • Engineers
– Must define the production function – Design and analysis of specific options – Great concern with costs and capacity – Often use models to estimate future costs
Martland, Toward More Sustainable Infrastructure, Chapter 2
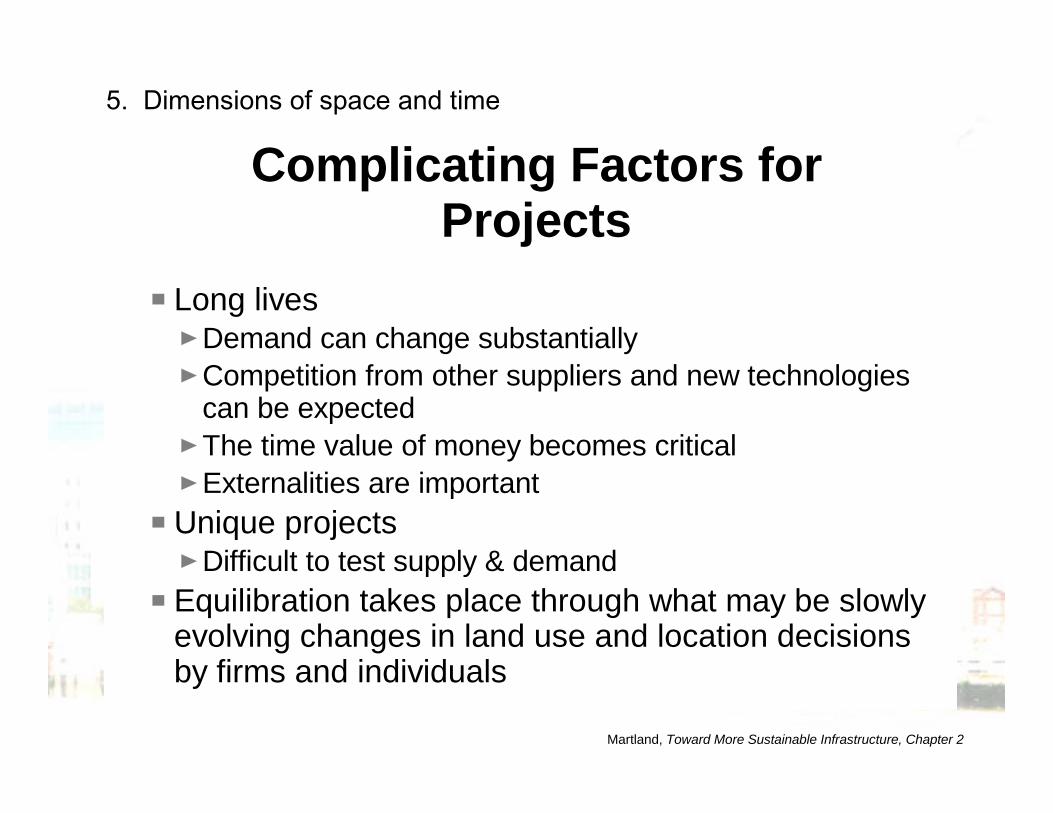
5. Dimensions of space and time
Complicating Factors forProjects
Long lives Demand can change substantially Competition from other suppliers and new technologies can be expected The time value of money becomes critical Externalities are important
Unique projects Difficult to test supply & demand
Equilibration takes place through what may be slowly evolving changes in land use and location decisions by firms and individuals
Martland, Toward More Sustainable Infrastructure, Chapter 2
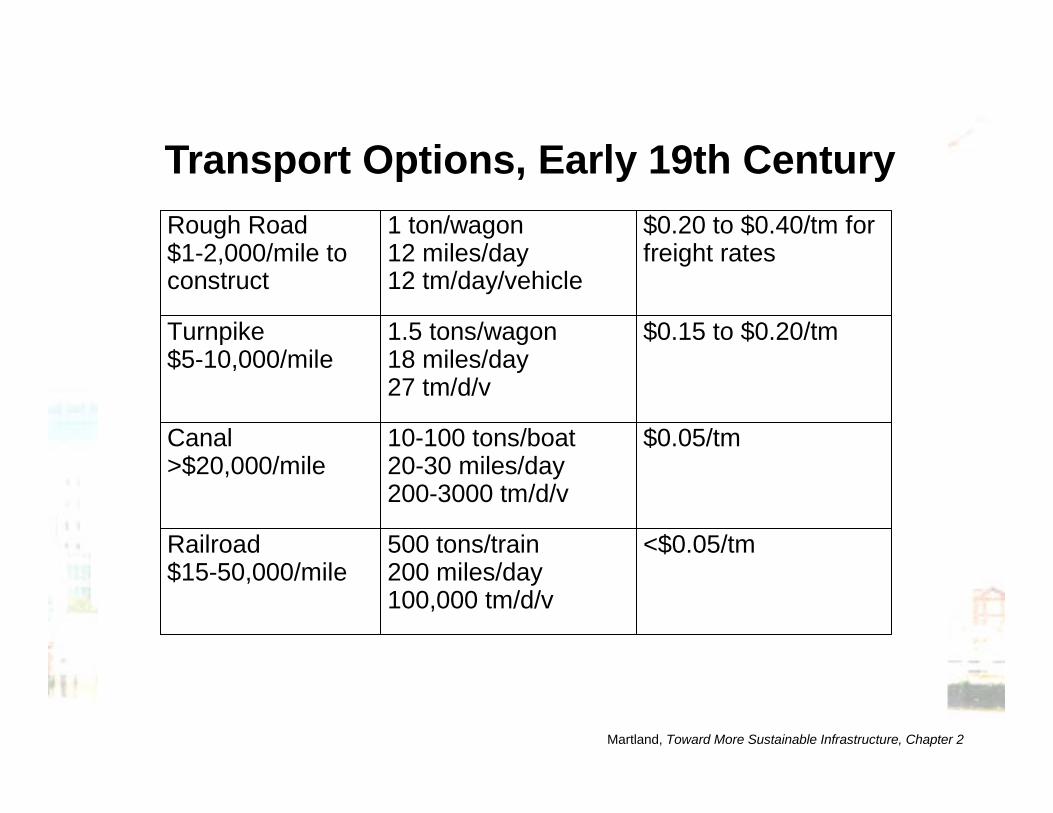
Transport Options, Early 19th Century
Rough Road $1-2,000/mile to construct
1 ton/wagon 12 miles/day 12 tm/day/vehicle
$0.20 to $0.40/tm for freight rates
Turnpike $5-10,000/mile
1.5 tons/wagon 18 miles/day 27 tm/d/v
$0.15 to $0.20/tm
Canal >$20,000/mile
10-100 tons/boat 20-30 miles/day 200-3000 tm/d/v
$0.05/tm
Railroad $15-50,000/mile
500 tons/train 200 miles/day 100,000 tm/d/v
<$0.05/tm
Martland, Toward More Sustainable Infrastructure, Chapter 2
Why Build Canals?
Water is the most economical & efficient way to transport bulky, non-perishable goods
BUT - you need the waterway! High volume of goods so long as speed is not a great factor
Canals are built so that Freight rates decline Food can be delivered to cities Cities can become trade centers
Martland, Toward More Sustainable Infrastructure, Chapter 2
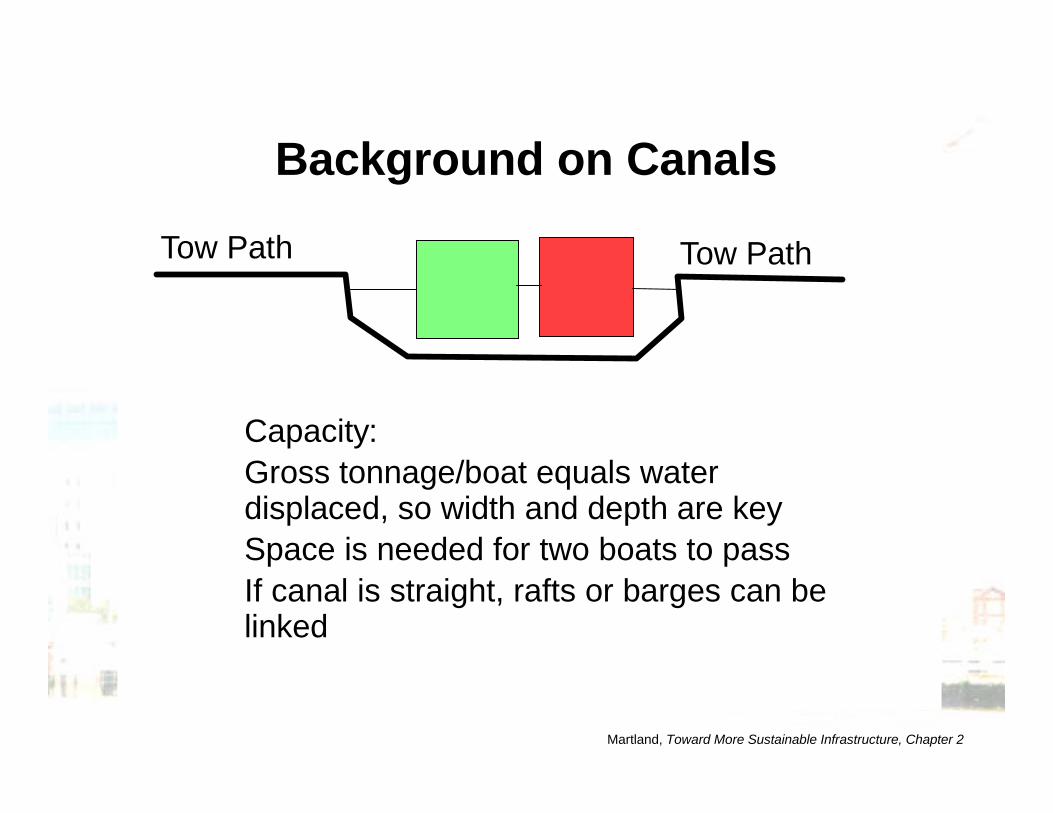
Background on Canals
Tow Path Tow Path
Capacity: Gross tonnage/boat equals water displaced, so width and depth are key Space is needed for two boats to pass If canal is straight, rafts or barges can be linked
Martland, Toward More Sustainable Infrastructure, Chapter 2
Martland, Toward More Sustainable Infrastructure, Chapter 2
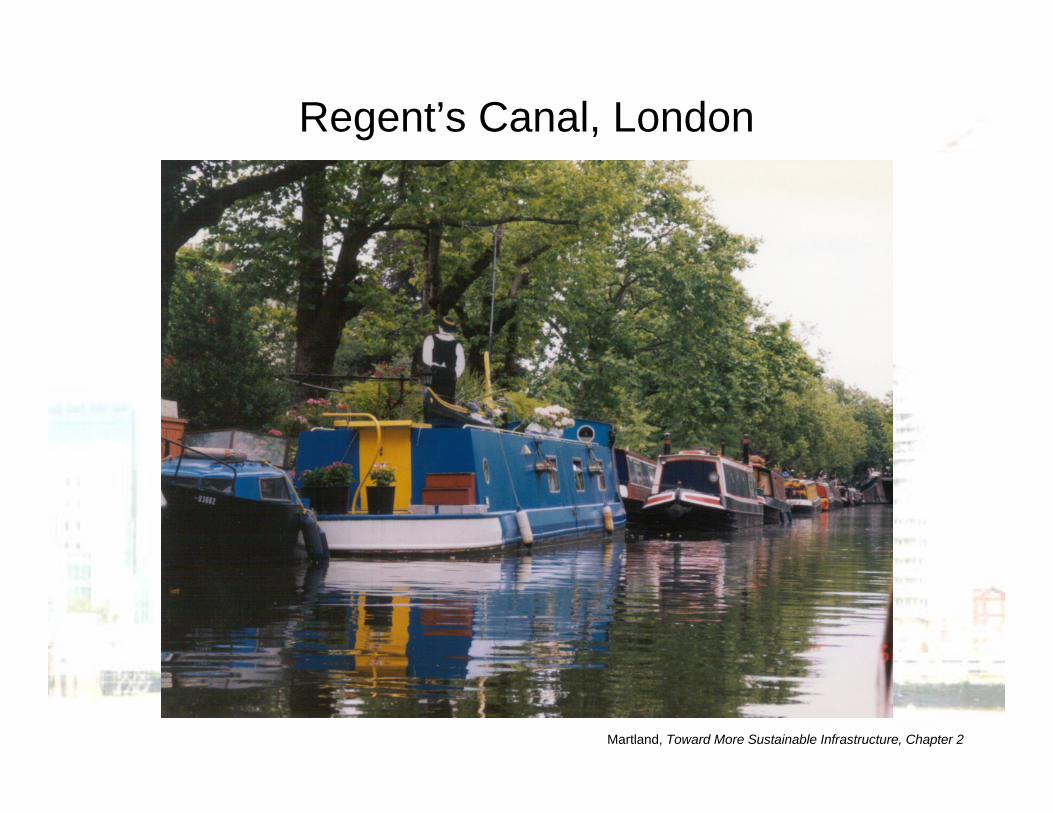
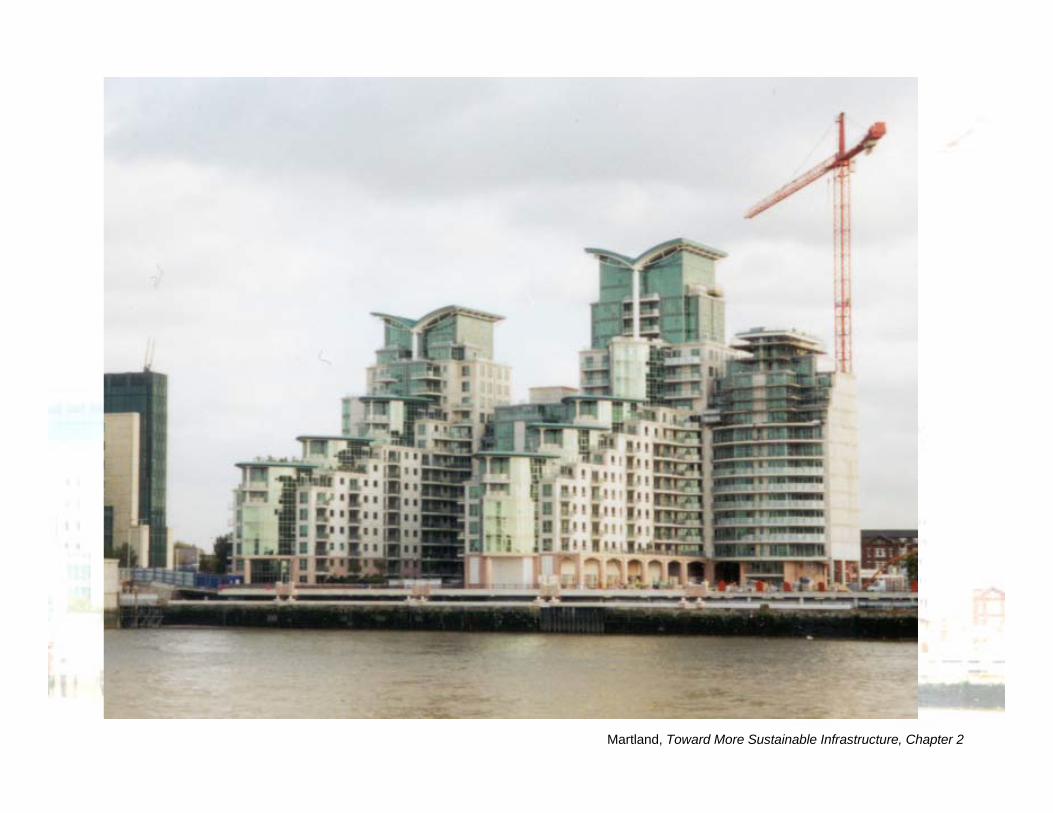
Regent’s Canal, London
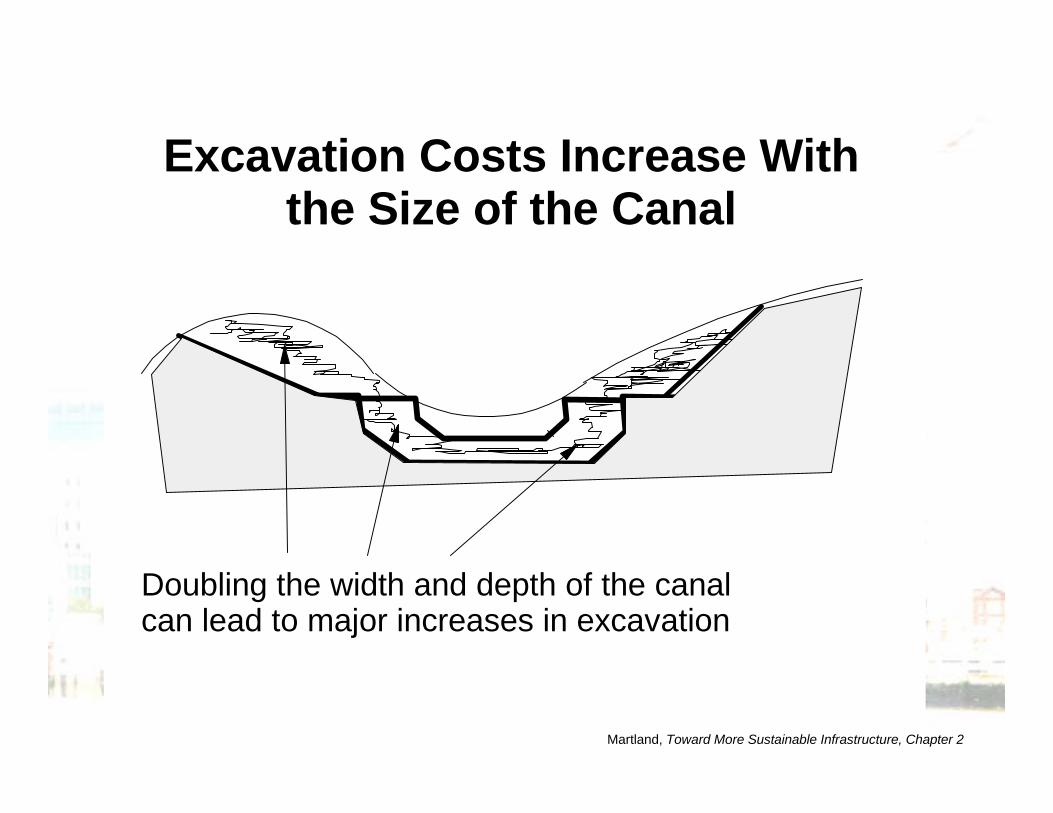
Excavation Costs Increase With the Size of the Canal
Doubling the width and depth of the canal can lead to major increases in excavation
Martland, Toward More Sustainable Infrastructure, Chapter 2
Martland, Toward More Sustainable Infrastructure, Chapter 2
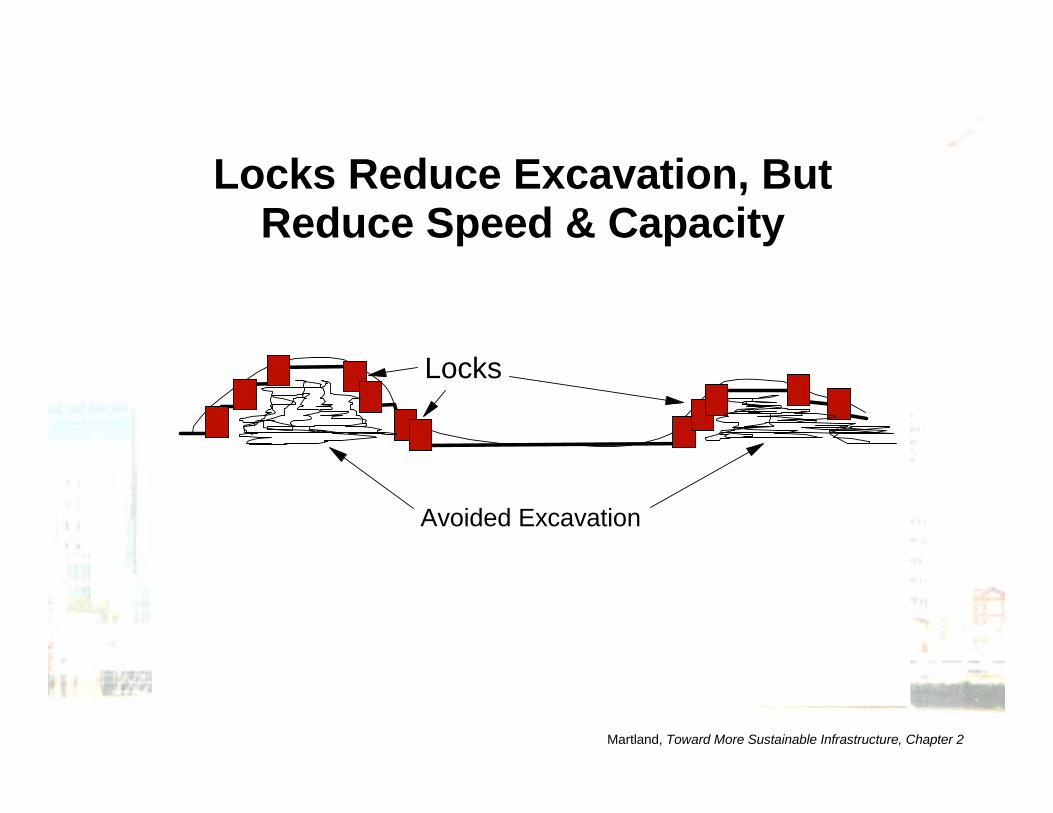
Locks Reduce Excavation, But Reduce Speed & Capacity
Locks
Avoided Excavation
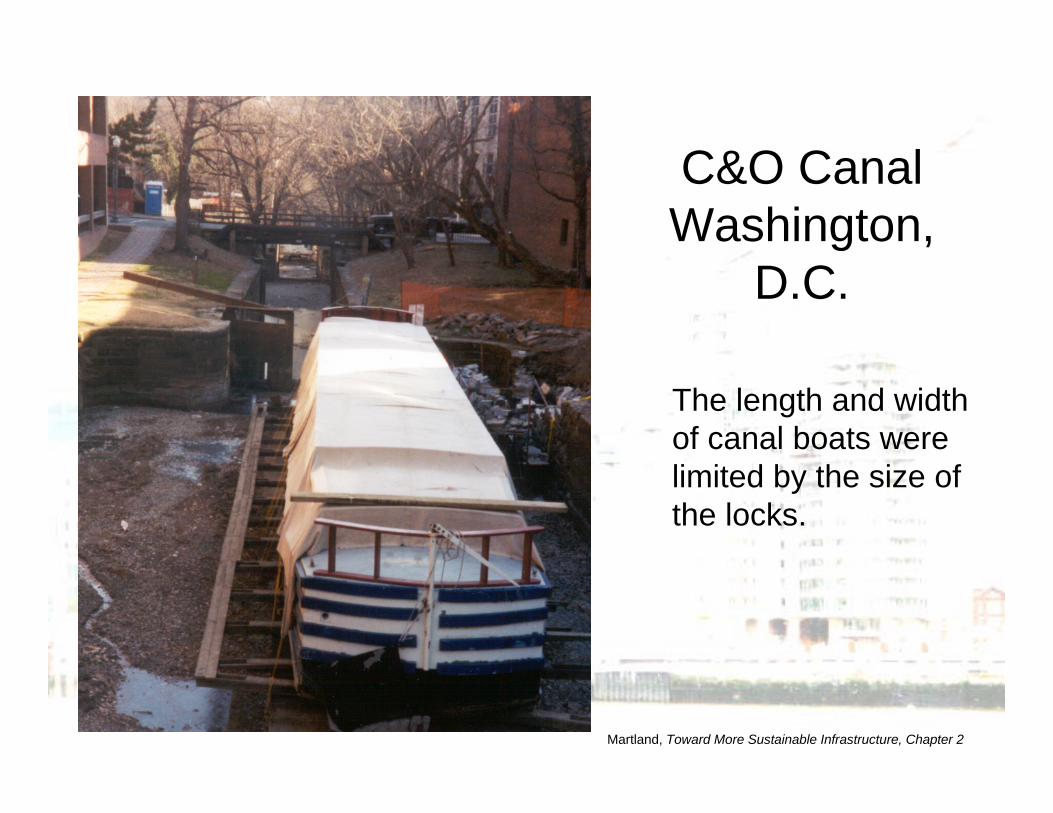
C&O CanalWashington,
D.C.
The length and width of canal boats were limited by the size of the locks.
Martland, Toward More Sustainable Infrastructure, Chapter 2
Martland, Toward More Sustainable Infrastructure, Chapter 2
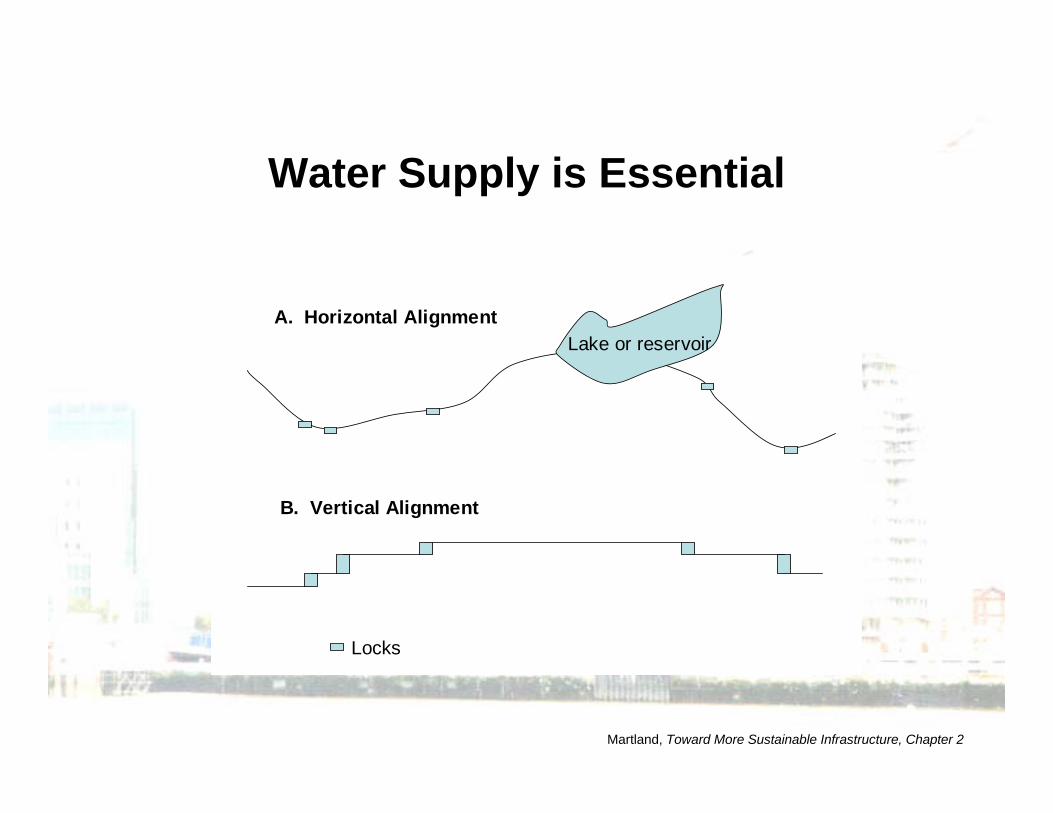
Water Supply is Essential
Locks
Lake or reservoir A. Horizontal Alignment
B. Vertical Alignment
China's Grand Canal
Geography: N-S canal links major rivers Geopolitics: transport improvements help unit the empire Benefits
Steady supply of grain from south to north 300,000 tons of grain per year in 7th century
Costs: 5.5 million laborers worked 6 years on one 1,500 mile stretch (20 man-years per mile)
Martland, Toward More Sustainable Infrastructure, Chapter 2
Bridgewater Canal
Built in 1761 to link Manchester England with coal mines Benefits:
Halved the price of coal in Manchester (a direct benefit of increased efficiency of transport) Helped Manchester become England's leading industrial center (development benefit for the region)
Stimulation of infrastructure development By 1840s, Britain had a network of 5,000 miles of canals & navigable rivers Technological improvements: straighter, deeper, wider canals; aqueducts to cross rivers
Martland, Toward More Sustainable Infrastructure, Chapter 2
Potowmack Canal 1785-1802First extensive system of river navigation in US
George Washington was the "champion" $750,000 investment
Purpose Open up the area west of Appalachia and linking to the Potomac River (current-day Washington DC) Cut freight cost in half (relative to wagon) 185 miles in 3 days with a 16-20 ton payload
Problems Construction: shaky economy; lack of skilled workers, weather Operation: only navigable 3 mo/yr; sediments; wooden locks decayed
Results Spurred canal investment & development of west $175,000 in debt by 1816
Martland, Toward More Sustainable Infrastructure, Chapter 2
Middlesex Canal 1793-1803
Purpose: Improve efficiency of existing system by providing a better link from NH to Boston (chartered by Massachusetts) Reduced transfer from barge to wagon for delivery to Boston (cut costs by 75%)
Costs 50 bridges, 8 aqueducts, 27 locks $528,000 investment = $20,000/mile = 3% of assessed value of Boston (an early Big Dig!)
Problems 1-way freight - and not much of it Disruption of trade (Portsmouth & NH did not like this!)
Martland, Toward More Sustainable Infrastructure, Chapter 2
Erie Canal, 1817-1825
First proposed in 1724; discussed widely in late 1700s and early 1800s
Thomas Jefferson: "A splendid project - for the 20th century." Purpose
Easiest way to cross Appalachian Mountains Constructed 363 miles of canal with 83 locks and 18 major aqueducts from Albany to Buffalo for $8 million Issues
How to finance Which route (avoid Lake Ontario - too close to the British!) Merchants using ground transport were against it Lack of engineers - in fact this project created CE schools at RPI and Union College
Martland, Toward More Sustainable Infrastructure, Chapter 2
Erie Canal - Results
Problems 1000 died from malaria What depth: enough for freight, but no more than they could finance
Results Too many boats almost from day 1 - increased in 1835 to 70 ft wide with 7 ft depth (from 40 and 4) Revenues exceeded all expectations Opening up Lake Erie was "decisive impetus forcommerce to move E-W rather than N-SPopulation growth - Rochester and Buffalo became boom towns
Martland, Toward More Sustainable Infrastructure, Chapter 2
Morris Canal 1824-31
Purpose: link coal fields of Lehigh Valley with NYC Cost was $2.1 million vs. $1 million estimate
Circuity (99 mile canal to go 55 miles) Elevation (up 914 feet then down 750 feet)
Notable Use of rail cars to haul boats up an inclined plane Acted as their own bank to finance canal Interfered with salmon spawning Speeds restricted to < 3 mph to avoid washing out banks Needed to widen for wider boats (increased loads from 25 to 50-75 tons
Results "Immediate and pronounced" - prices of coal and wood fell in NY, business was stimulated, towns grew Peaked 1860-70, then overtaken by RR
Martland, Toward More Sustainable Infrastructure, Chapter 2
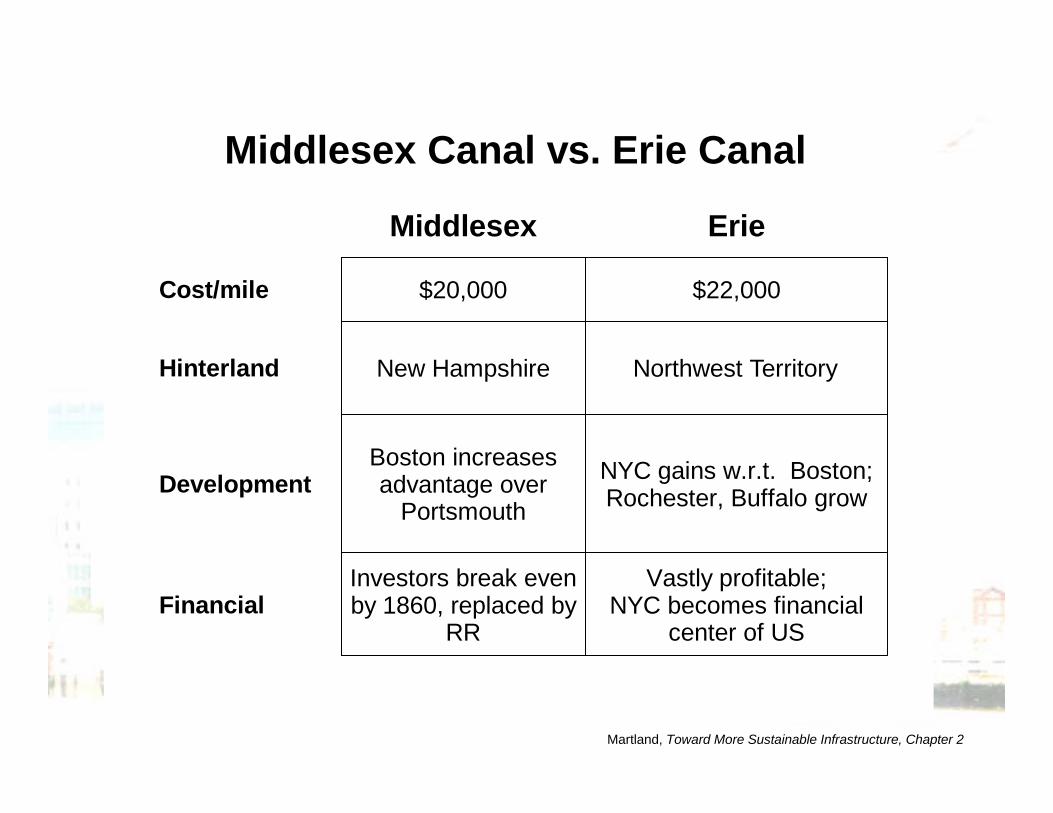
Middlesex Canal vs. Erie Canal
Middlesex Erie
Cost/mile
Hinterland
Development
Financial
$20,000 $22,000
New Hampshire Northwest Territory
Boston increases advantage over
Portsmouth NYC gains w.r.t. Boston; Rochester, Buffalo grow
Investors break even by 1860, replaced by
RR
Vastly profitable; NYC becomes financial
center of US
Martland, Toward More Sustainable Infrastructure, Chapter 2
User's Perspective
Issue: if costs are lower, then we will use the facility Analysis: can we reduce cost/ton-mile by providing an opportunity for larger or better vehicles to operate over a better infrastructure
Compare equipment costs and operating costs for the current and the new options
Martland, Toward More Sustainable Infrastructure, Chapter 2
Owner's Perspective
Issue: should I build the facility? Analysis:
Compare annual revenues to annual costs Cost:
Construction costs can be converted to annual payments on a loan Maintenance costs
Revenue: Tolls must be less than the savings that user gets from using the canal to attract traffic
Martland, Toward More Sustainable Infrastructure, Chapter 2
Investor's Perspective
Issue: if we invest in this, will we be able to recover our investment plus a reasonable return?Analysis:
What will the project cost? How long will it take? How much revenue will it generate (and will the owner be able to repay our loans) Do we have better options for investing?
Martland, Toward More Sustainable Infrastructure, Chapter 2
Contractor's Perspective
Issue: should we agree to build the facilityfor the amount proposed (or what should webid?)Analysis:
Construction costs as a function of technology, methods, labor productivity, availability of materials, and costs Is our estimated cost less than the proposed budget? Is the estimated profit enough for us to accept the risks of construction?
Martland, Toward More Sustainable Infrastructure, Chapter 2
Public Perspective Basic issue: should we assist (or protest) in the project by providing financial or legal support Analysis: what are the public benefits
Land use Development Environmental impact
How can we help, if indeed we want to help?Limit liability Enforce ability to collect tolls Use emminent domain to assemble land Choice of route? scale of project?
Possibly a major political issue!
Martland, Toward More Sustainable Infrastructure, Chapter 2
Summary - What Do We Learn Fromthe Experience With Canals
Ideas and concepts are around long before the means to build the infrastructure are available Major projects can be decisive in directing development and population growth - but it is also possible to spend major resources on projects with modest potential Changes in technology can kill projects (RRs killed both the turnpikes and the canals) or improve them (efficiency gains from larger boats justified enlarging canals) Financing is a major concern
Martland, Toward More Sustainable Infrastructure, Chapter 2
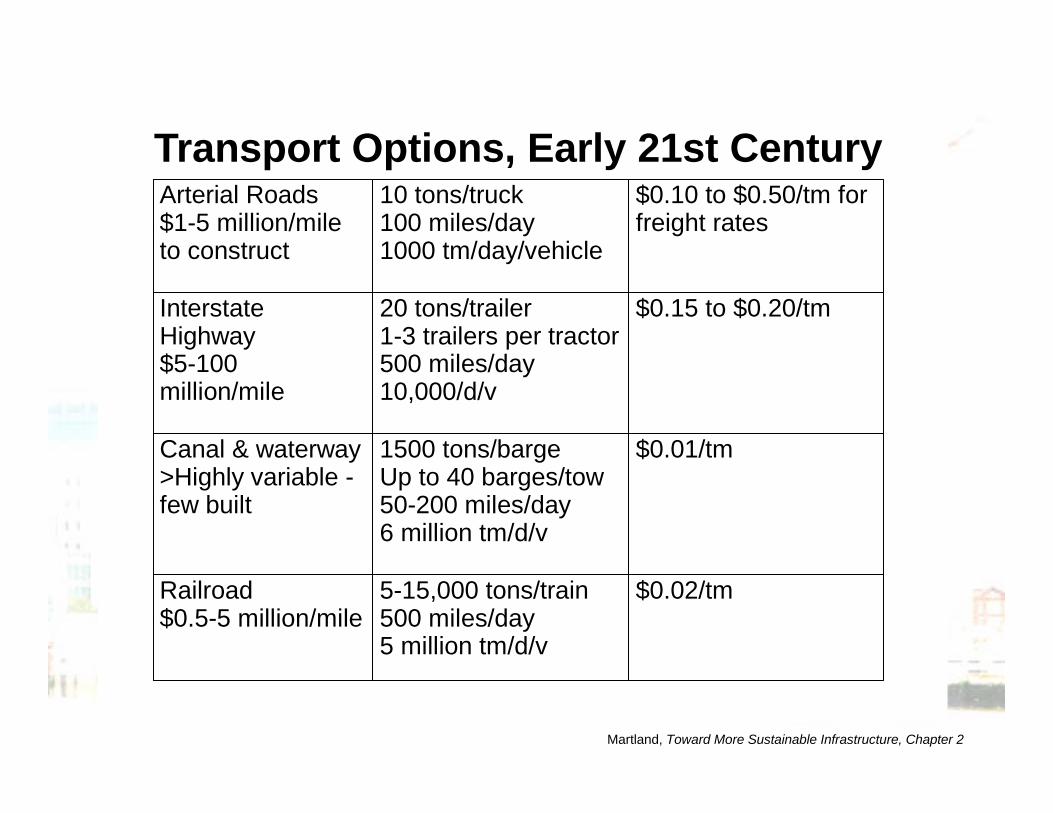
Transport Options, Early 21st CenturyArterial Roads $1-5 million/mile to construct
10 tons/truck 100 miles/day 1000 tm/day/vehicle
$0.10 to $0.50/tm for freight rates
Interstate Highway $5-100 million/mile
20 tons/trailer 1-3 trailers per tractor 500 miles/day 10,000/d/v
$0.15 to $0.20/tm
Canal & waterway >Highly variable - few built
1500 tons/barge Up to 40 barges/tow 50-200 miles/day 6 million tm/d/v
$0.01/tm
Railroad $0.5-5 million/mile
5-15,000 tons/train 500 miles/day 5 million tm/d/v
$0.02/tm
Martland, Toward More Sustainable Infrastructure, Chapter 2
System PerformanceBasic Concepts: Much More Than Cost
1. Service Measures 2. Capacity 3. Safety, Security and Risk 4. Cost Effectiveness
Martland, Toward More Sustainable Infrastructure, Chapter 2
Service Quality in Transportation
• Average trip time • Trip time reliability • Probability of excessive delays • Comfort • Convenience
Martland, Toward More Sustainable Infrastructure, Chapter 2
Engineering-Based Service Functions
• Express service as a function of: – Infrastructure characteristics – Operating characteristics – Level of demand
Martland, Toward More Sustainable Infrastructure, Chapter 2
Estimating Commuting Time: Trip Segments
• Walk to bus stop • Wait for bus (10 minute headways) • Ride bus two miles to subway station • Transfer from bus to subway platform • Wait for subway train (5 minute headways)• Ride train 3 miles (5 intermediate stops) • Exit station and walk to destination
Martland, Toward More Sustainable Infrastructure, Chapter 2
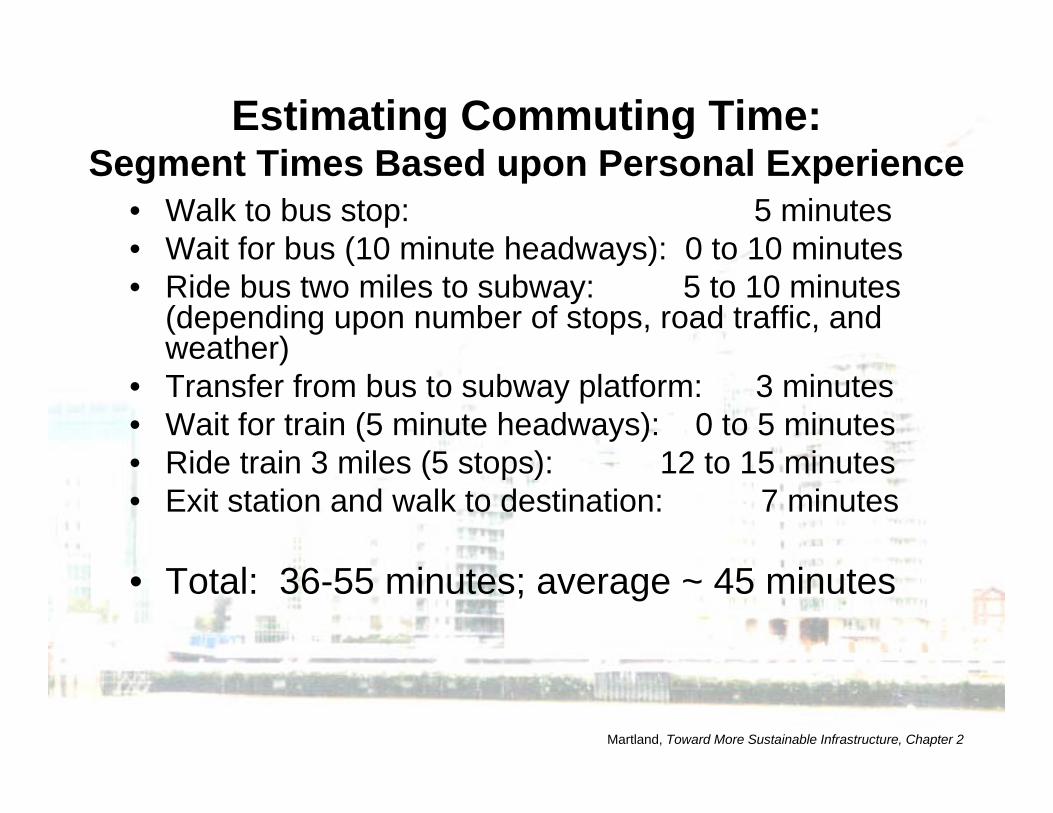
Estimating Commuting Time:Segment Times Based upon Personal Experience
• Walk to bus stop: 5 minutes• Wait for bus (10 minute headways): 0 to 10 minutes• Ride bus two miles to subway: 5 to 10 minutes
(depending upon number of stops, road traffic, and weather)
• Transfer from bus to subway platform: 3 minutes• Wait for train (5 minute headways): 0 to 5 minutes• Ride train 3 miles (5 stops): 12 to 15 minutes• Exit station and walk to destination: 7 minutes
• Total: 36-55 minutes; average ~ 45 minutes
Martland, Toward More Sustainable Infrastructure, Chapter 2
Martland, Toward More Sustainable Infrastructure, Chapter 2
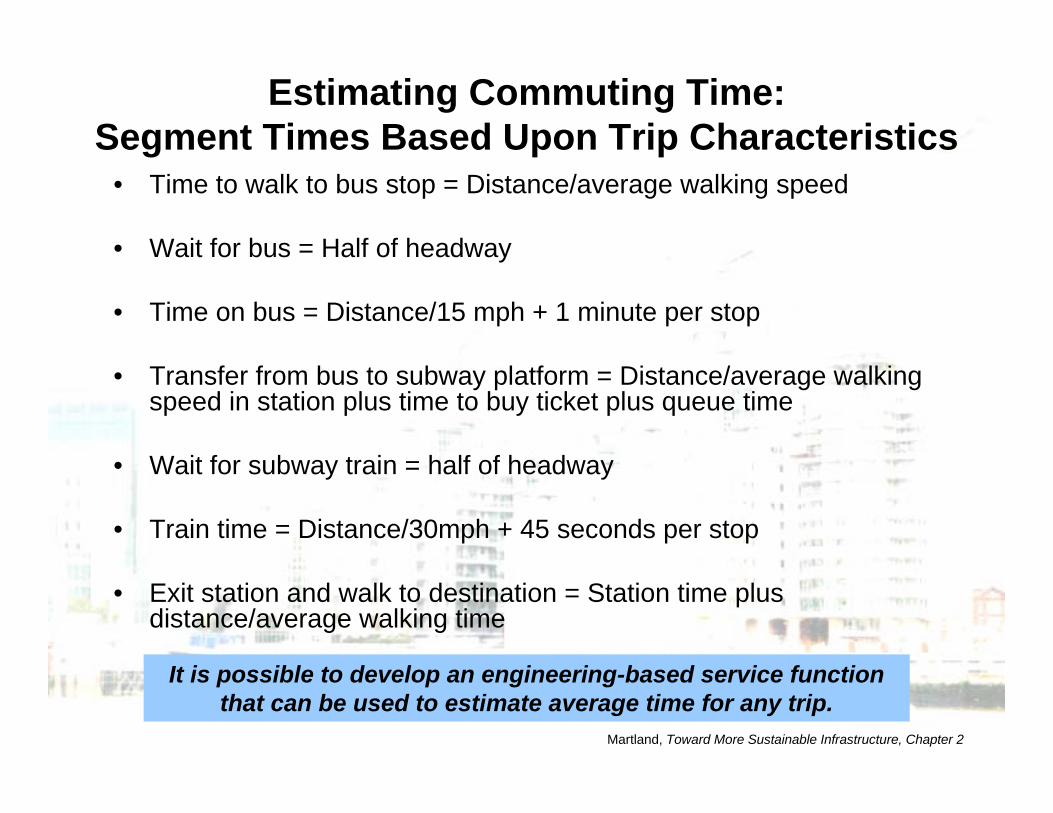
Estimating Commuting Time: Segment Times Based Upon Trip Characteristics
• Time to walk to bus stop = Distance/average walking speed
• Wait for bus = Half of headway
• Time on bus = Distance/15 mph + 1 minute per stop
• Transfer from bus to subway platform = Distance/average walking speed in station plus time to buy ticket plus queue time
• Wait for subway train = half of headway
• Train time = Distance/30mph + 45 seconds per stop
• Exit station and walk to destination = Station time plus distance/average walking time
It is possible to develop an engineering-based service function that can be used to estimate average time for any trip.
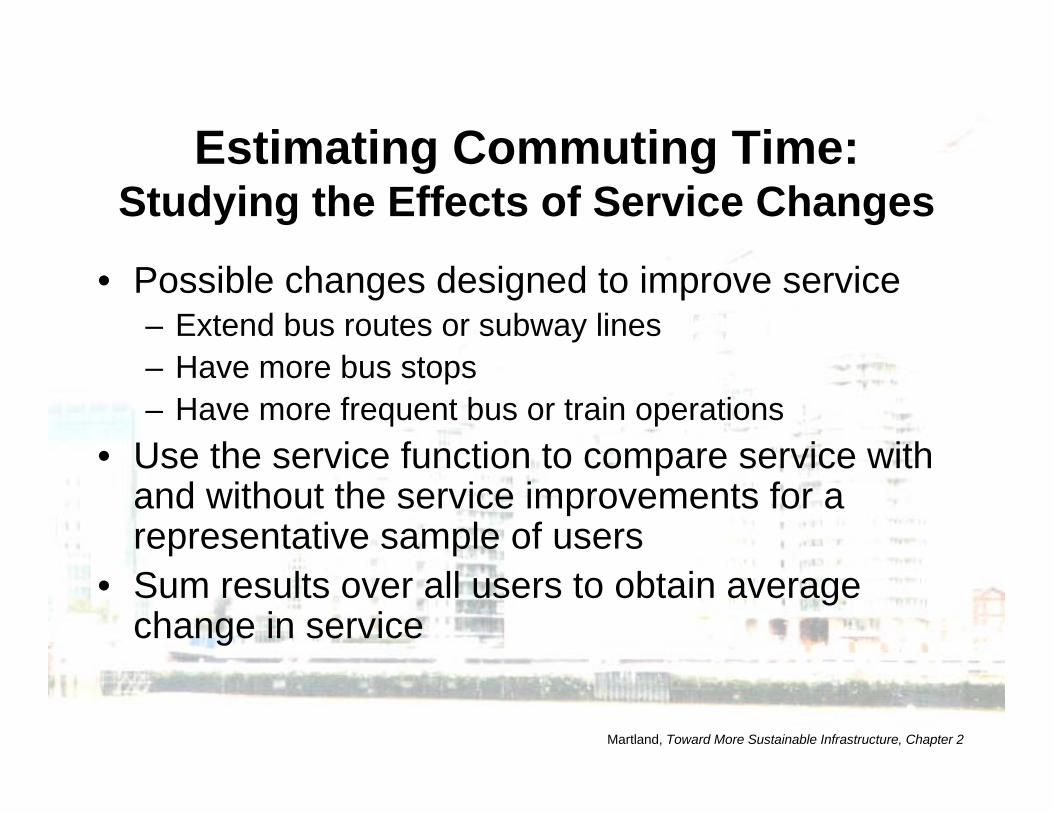
Estimating Commuting Time: Studying the Effects of Service Changes
• Possible changes designed to improve service –Extend bus routes or subway lines –Have more bus stops –Have more frequent bus or train operations
• Use the service function to compare service with and without the service improvements for arepresentative sample of users
• Sum results over all users to obtain average change in service
Martland, Toward More Sustainable Infrastructure, Chapter 2
Capacity
• Multiple measures are possible • Network capacity can be constrained at
bottlenecks • Engineering-based capacity functions
can be developed
Martland, Toward More Sustainable Infrastructure, Chapter 2
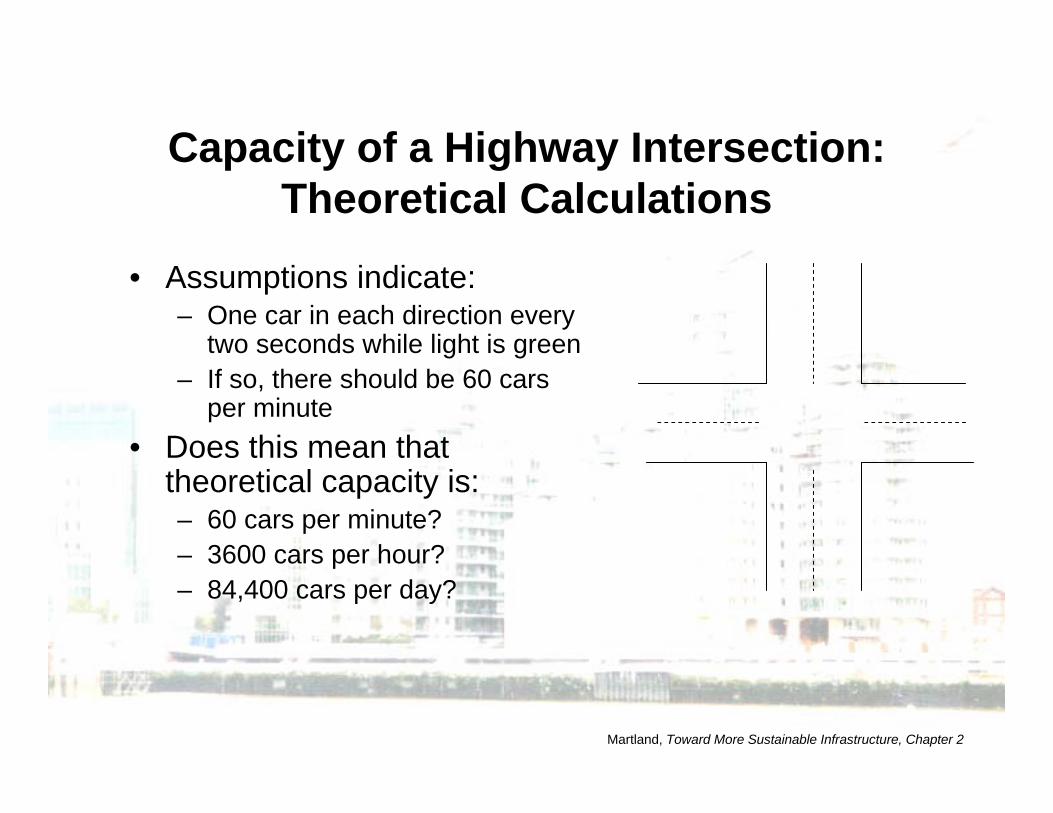
Capacity of a Highway Intersection: Theoretical Calculations
• Assumptions indicate: – One car in each direction every
two seconds while light is green – If so, there should be 60 cars
per minute • Does this mean that
theoretical capacity is: – 60 cars per minute? – 3600 cars per hour? – 84,400 cars per day?
Martland, Toward More Sustainable Infrastructure, Chapter 2
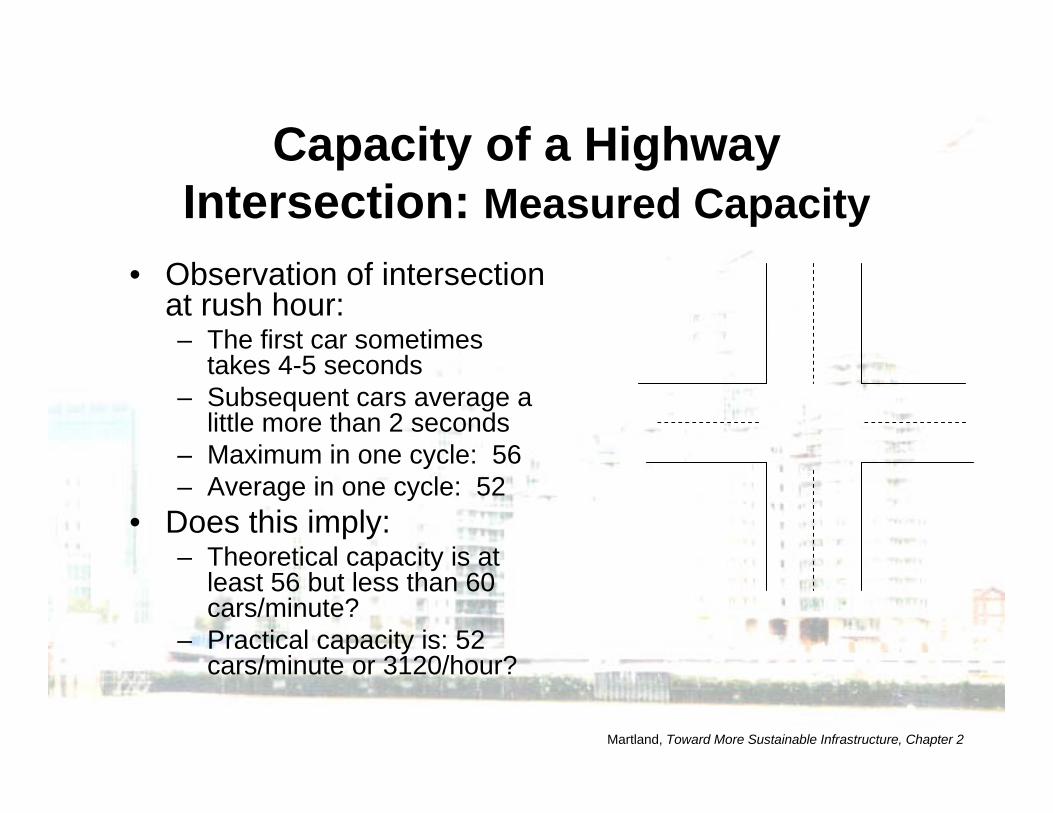
Capacity of a Highway Intersection: Measured Capacity
• Observation of intersection at rush hour: – The first car sometimes
takes 4-5 seconds – Subsequent cars average a
little more than 2 seconds – Maximum in one cycle: 56 – Average in one cycle: 52
• Does this imply: – Theoretical capacity is at
least 56 but less than 60 cars/minute?
– Practical capacity is: 52cars/minute or 3120/hour?
Martland, Toward More Sustainable Infrastructure, Chapter 2
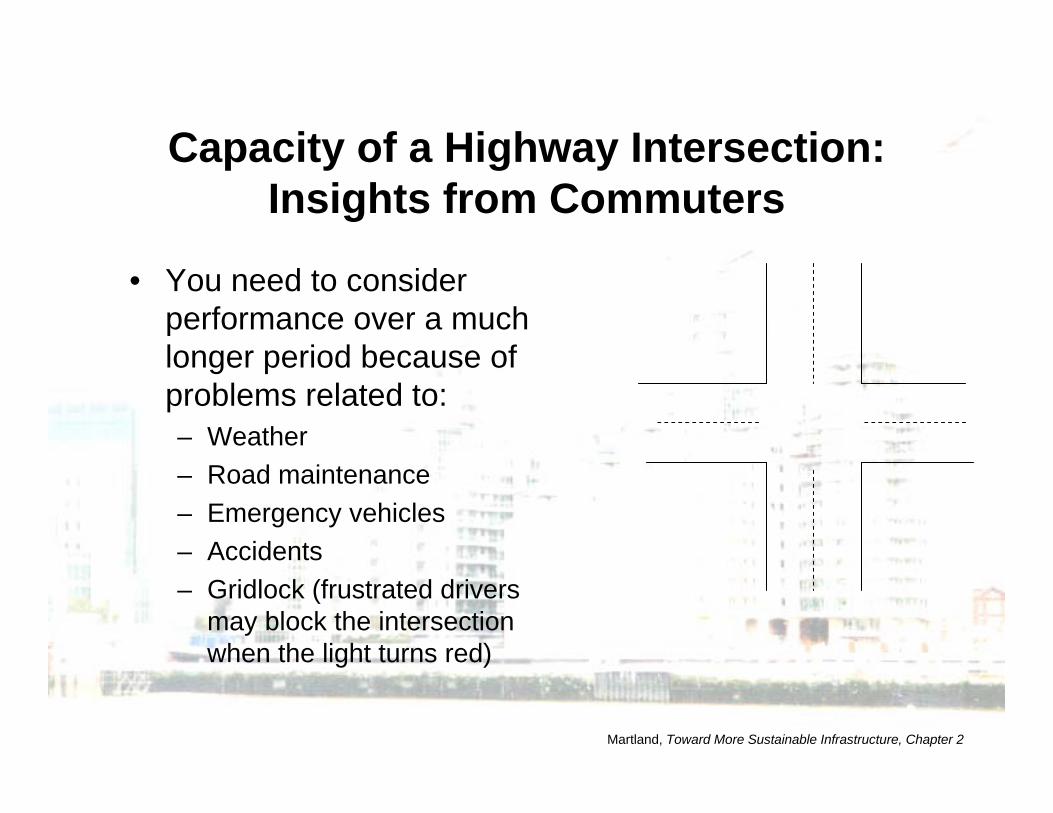
Capacity of a Highway Intersection: Insights from Commuters
• You need to consider performance over a much longer period because of problems related to: – Weather – Road maintenance – Emergency vehicles – Accidents – Gridlock (frustrated drivers
may block the intersection when the light turns red)
Martland, Toward More Sustainable Infrastructure, Chapter 2
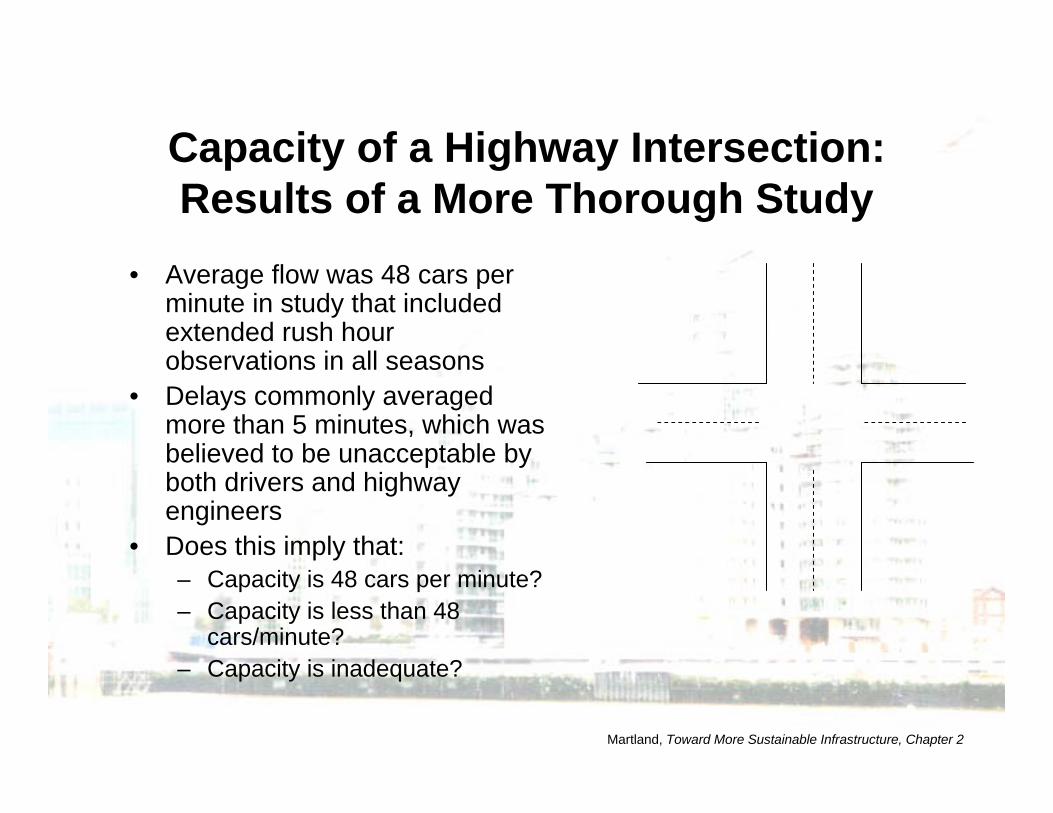
Capacity of a Highway Intersection: Results of a More Thorough Study
• Average flow was 48 cars per minute in study that included extended rush hour observations in all seasons
• Delays commonly averaged more than 5 minutes, which was believed to be unacceptable by both drivers and highwayengineers
• Does this imply that: – Capacity is 48 cars per minute? – Capacity is less than 48
cars/minute? – Capacity is inadequate?
Martland, Toward More Sustainable Infrastructure, Chapter 2
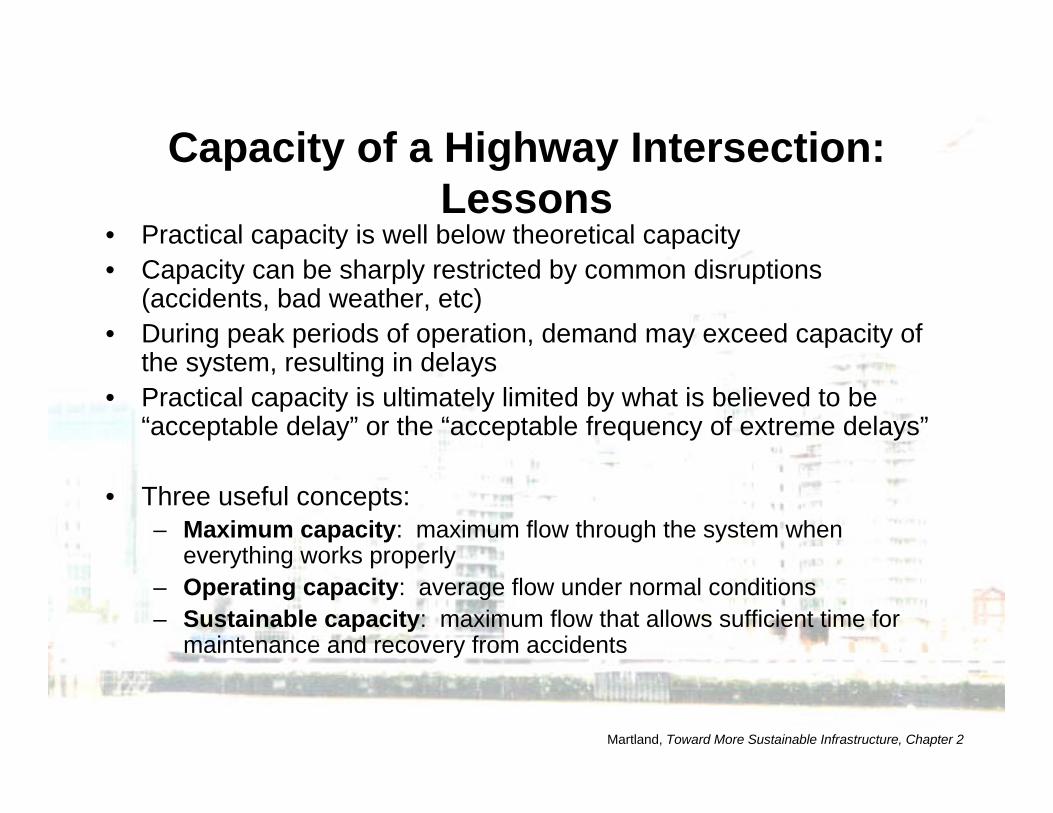
Capacity of a Highway Intersection: Lessons
• Practical capacity is well below theoretical capacity • Capacity can be sharply restricted by common disruptions
(accidents, bad weather, etc) • During peak periods of operation, demand may exceed capacity of
the system, resulting in delays • Practical capacity is ultimately limited by what is believed to be
“acceptable delay” or the “acceptable frequency of extreme delays”
• Three useful concepts: – Maximum capacity: maximum flow through the system when
everything works properly – Operating capacity: average flow under normal conditions – Sustainable capacity: maximum flow that allows sufficient time for
maintenance and recovery from accidents
Martland, Toward More Sustainable Infrastructure, Chapter 2
Martland, Toward More Sustainable Infrastructure, Chapter 2
MIT OpenCourseWarehttp://ocw.mit.edu
1.011 Project Evaluation Spring 2011
For information about citing these materials or our Terms of Use, visit: http://ocw.mit.edu/terms.