Embed Size (px)
Citation preview
1
Electronic Supporting Information
Toward interfacing organic semiconductors with ferromagnetic transition
metal substrates: enhanced stability via carboxylate anchoring
R. Han1, F. Blobner1, J. Bauer1, D. A. Duncan1,‡ J. V. Barth1, P. Feulner1 and F. Allegretti1*
1 Physik-Department E20, Technische Universität München, D-85748 Garching, Germany
E-mail: [email protected]
‡ Present address: Diamond Light Source, Harwell Science and Innovation Campus, Didcot,
OX11 0QX UK
1. Experimental procedures
1.1 Experimental set-up
The spectroscopy experiments were conducted in two separate ultra-high vacuum (UHV) chambers:
1) The custom-designed UHV chamber at the Physics Department E20 of the TU Munich (Garching, Germany) was operated at a base pressure below 5×10-11 mbar and equipped with a Phoibos 100 CCD hemispherical electron analyser and a standard twin-anode X-ray source for Mg Kα and Al Kα radiation. This allowed X-ray photoelectron spectroscopy (XPS) measurements with an energy resolution of about 0.8-0.9 eV. Further characterization of the sample through low-energy electron diffraction (LEED), temperature programmed desorption (TPD) and ultraviolet photoelectron spectroscopy (UPS) was ensured. At the BESSY II storage ring in Berlin (Germany), the same chamber was used to exploit soft X-rays provided by the undulator beamlines UE56/2-PGM-2 and U49/2-PGM-1 for high resolution XPS and near-edge X-ray absorption fine structure (NEXAFS) measurements. Synchrotron radiation impinged at grazing incidence (7°) with respect to the sample surface, and photoelectrons were collected with the electron energy analyser at normal emission. The NEXAFS spectra were recorded with a partial electron yield (PEY) detector accepting a solid angle of π [1]. Retarding voltages of -150 V, -400 V and -560 V were applied for the C, O and F K-edges, respectively. In angle-dependent NEXAFS measurements the sample and the PEY detector were rotated simultaneously around the photon beam, so as to change the direction of the E vector of the linearly polarized light relative to the sample surface without changing the detection geometry. The NEXAFS spectra were further processed by correction for the clean surface contribution to the absorption and for the incident photon flux, and by subsequent normalization of the edge jump to one, according to standard
Electronic Supplementary Material (ESI) for Chemical Communications.This journal is © The Royal Society of Chemistry 2016
2
procedures [2]. The experimental set-up also enabled the use of the so-called core-hole-clock (CHC) method, involving the detection of Auger decay electrons following resonant/non-resonant excitation with soft X-rays, as detailed in section 2.4. Photon beam intensity, sample position and acquisition times were adjusted to minimize photon-induced damaging of the molecular layers, until no effects were observed. In particular, the longer NEXAFS and CHC measurements were performed while scanning continuously the point of probing, and all measurements were typically carried out at low temperature (80-100 K), as this is known to reduce the effect of the beam damage [3-4]. The chamber, mounted off-line in Garching, was also used for 'fast-XPS' (or 'temperature-programmed' XPS) measurements, operating the X-ray source at its maximum power, increasing the analyser pass energy, and acquiring very fast (10 - 20 s) core-level scans while linearly increasing the temperature at constant rate (e.g., 0.5 K/s).
2) The SuperESCA end-station at the ELETTRA synchrotron facility (Trieste, Italy) was used for additional high-resolution XPS, fast-XPS and NEXAFS experiments on Ni(111). The chamber had a base pressure of 1-2 ×10⁻¹⁰ mbar and was equipped with a Phoibos hemispherical analyser (150 mm mean radius) implemented with a custom-made delay line detector.
Both chambers were equipped with all ancillary facilities for preparation of the clean substrates and deposition of the self-assembled monolayers (SAMs) in situ under UHV conditions.
1.2 Sample preparation
The Ni(111) single-crystal was cleaned by repeated cycles of Ne+/Ar+ ion sputtering at 300 K and annealing to 1100 K, until no contamination was detected by XPS, and the LEED pattern showed a sharp (1×1) structure. Co(0001) and Fe(110) surfaces were instead prepared in the form of thin films grown epitaxially on a freshly cleaned W(110) substrate. The pristine W(110) surface was prepared by ion sputtering, heating in oxygen to remove residual atomic carbon contamination, and final annealing in UHV to 2400 K. Cobalt was deposited from a custom-built metal-ribbon evaporator, with the sample kept at 80-180 K; the deposited overlayer was then annealed at 450 K for about 5 min to increase the mobility of the Co atoms on the W(110) surface, so as to achieve smooth (0001)-oriented films of high crystalline quality [5], as monitored by LEED. The very same preparation procedure was adopted for the Fe(110)-oriented films [5]. The film thickness (30-40 Å) was monitored during growth by means of a quartz micro-balance. XPS was used to assess the cleanliness of the deposited films, with no contamination observed. In general, special care was taken to ensure oxygen-free Ni, Co and Fe surfaces prior to deposition of the molecular layers.
Due to its high vapour pressure, 4-fluorobenzoic acid (4-FBA, solid) could be directly deposited onto the transition metal surface via a gate valve and a stainless steel dosing tube from an evacuated reservoir without heating of the molecular powders. In most cases, the substrate was kept cold (80 K - 250 K) when exposed to the molecular vapours; following annealing at 300 K ensured removal of physisorbed layers, leaving a chemisorbed saturated monolayer on the surface. Experiments with deposition of the monolayer directly at 300 K were also performed.
1.3 Reference data
XPS and NEXAFS experiments were previously conducted on an analogous self-assembled monolayer (SAM) of 4-fluorothiophenol (4-FTP) deposited on Ni(111), with our custom-designed UHV chamber mounted at the Bessy II synchrotron facility. The results are detailed in Ref. [6] and were taken under comparable conditions, such that they can serve as a direct reference (in terms of
3
processing temperature, quality of the UHV, experimental acquisition geometry of XPS and NEXAFS, energy resolution etc.) for the data presented here on the carboxylate-bonded SAMs. The 4-FTP SAM was prepared at 80 K, with a following flash to 200 K according to the established protocol of Ref. [6].
2. Supplementary Data
2.1 XPS and NEXAFS for the 4-FBA monolayers on Ni(111) and Co(0001)
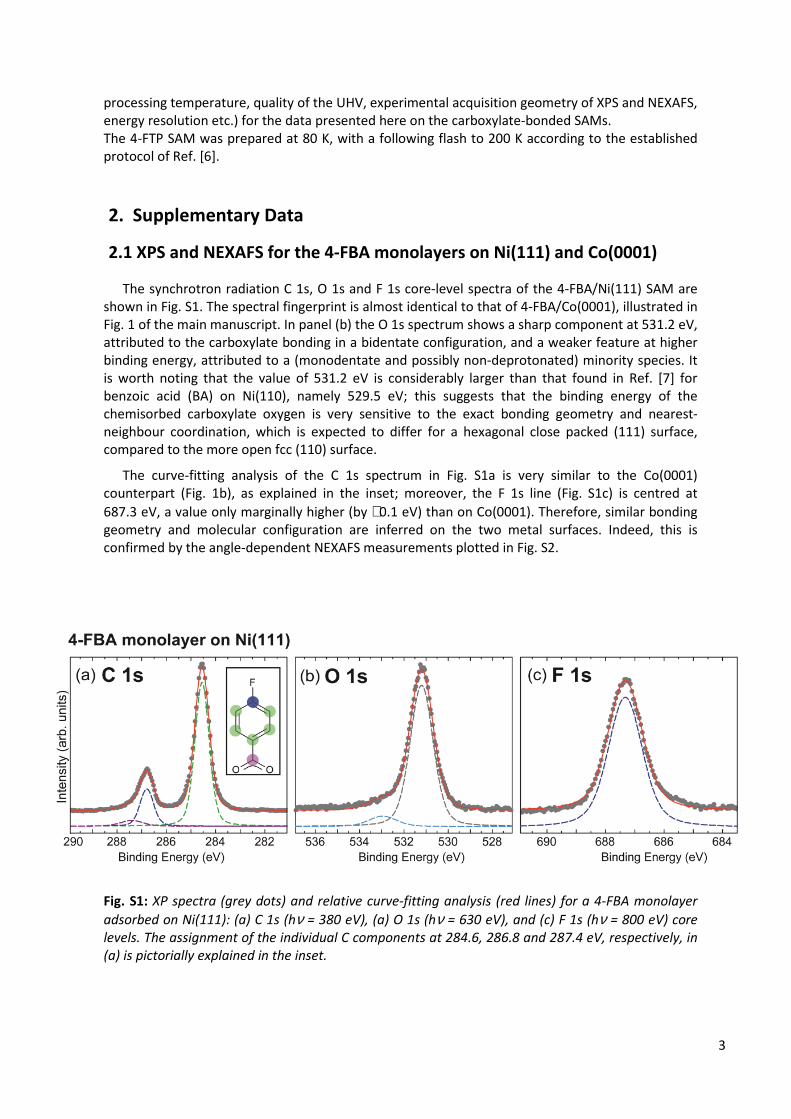
The synchrotron radiation C 1s, O 1s and F 1s core-level spectra of the 4-FBA/Ni(111) SAM are shown in Fig. S1. The spectral fingerprint is almost identical to that of 4-FBA/Co(0001), illustrated in Fig. 1 of the main manuscript. In panel (b) the O 1s spectrum shows a sharp component at 531.2 eV, attributed to the carboxylate bonding in a bidentate configuration, and a weaker feature at higher binding energy, attributed to a (monodentate and possibly non-deprotonated) minority species. It is worth noting that the value of 531.2 eV is considerably larger than that found in Ref. [7] for benzoic acid (BA) on Ni(110), namely 529.5 eV; this suggests that the binding energy of the chemisorbed carboxylate oxygen is very sensitive to the exact bonding geometry and nearest-neighbour coordination, which is expected to differ for a hexagonal close packed (111) surface, compared to the more open fcc (110) surface.
The curve-fitting analysis of the C 1s spectrum in Fig. S1a is very similar to the Co(0001) counterpart (Fig. 1b), as explained in the inset; moreover, the F 1s line (Fig. S1c) is centred at 687.3 eV, a value only marginally higher (by ∼0.1 eV) than on Co(0001). Therefore, similar bonding geometry and molecular configuration are inferred on the two metal surfaces. Indeed, this is confirmed by the angle-dependent NEXAFS measurements plotted in Fig. S2.
Fig. S1: XP spectra (grey dots) and relative curve-fitting analysis (red lines) for a 4-FBA monolayer
adsorbed on Ni(111): (a) C 1s (hν = 380 eV), (a) O 1s (hν = 630 eV), and (c) F 1s (hν = 800 eV) core
levels. The assignment of the individual C components at 284.6, 286.8 and 287.4 eV, respectively, in
(a) is pictorially explained in the inset.
4
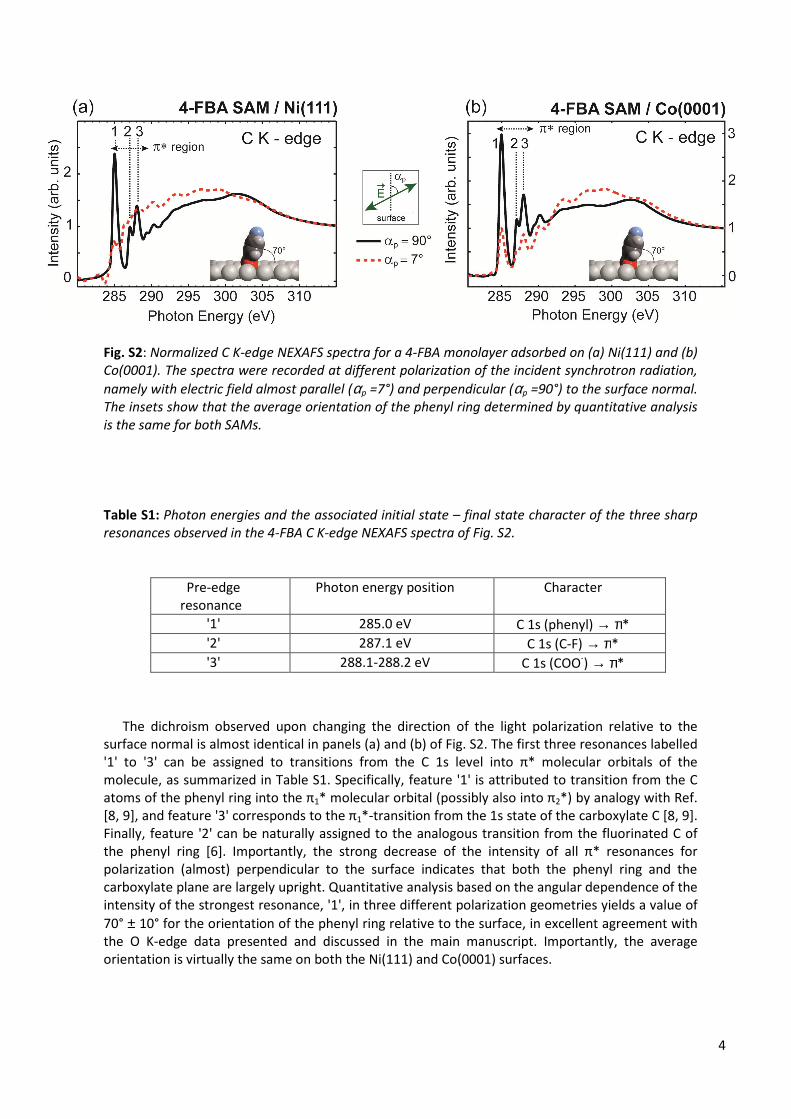
Fig. S2: Normalized C K-edge NEXAFS spectra for a 4-FBA monolayer adsorbed on (a) Ni(111) and (b)
Co(0001). The spectra were recorded at different polarization of the incident synchrotron radiation,
namely with electric field almost parallel (αp =7°) and perpendicular (αp =90°) to the surface normal.
The insets show that the average orientation of the phenyl ring determined by quantitative analysis
is the same for both SAMs.
Table S1: Photon energies and the associated initial state – final state character of the three sharp
resonances observed in the 4-FBA C K-edge NEXAFS spectra of Fig. S2.
Pre-edge resonance
Photon energy position Character
'1' 285.0 eV C 1s (phenyl) → π* '2' 287.1 eV C 1s (C-F) → π* '3' 288.1-288.2 eV C 1s (COO-) → π*
The dichroism observed upon changing the direction of the light polarization relative to the
surface normal is almost identical in panels (a) and (b) of Fig. S2. The first three resonances labelled '1' to '3' can be assigned to transitions from the C 1s level into π* molecular orbitals of the molecule, as summarized in Table S1. Specifically, feature '1' is attributed to transition from the C atoms of the phenyl ring into the π1* molecular orbital (possibly also into π2*) by analogy with Ref. [8, 9], and feature '3' corresponds to the π1*-transition from the 1s state of the carboxylate C [8, 9]. Finally, feature '2' can be naturally assigned to the analogous transition from the fluorinated C of the phenyl ring [6]. Importantly, the strong decrease of the intensity of all π* resonances for polarization (almost) perpendicular to the surface indicates that both the phenyl ring and the carboxylate plane are largely upright. Quantitative analysis based on the angular dependence of the intensity of the strongest resonance, '1', in three different polarization geometries yields a value of 70° ± 10° for the orientation of the phenyl ring relative to the surface, in excellent agreement with the O K-edge data presented and discussed in the main manuscript. Importantly, the average orientation is virtually the same on both the Ni(111) and Co(0001) surfaces.
5
2.2 XPS for the 4-FBA monolayer on Fe(110)
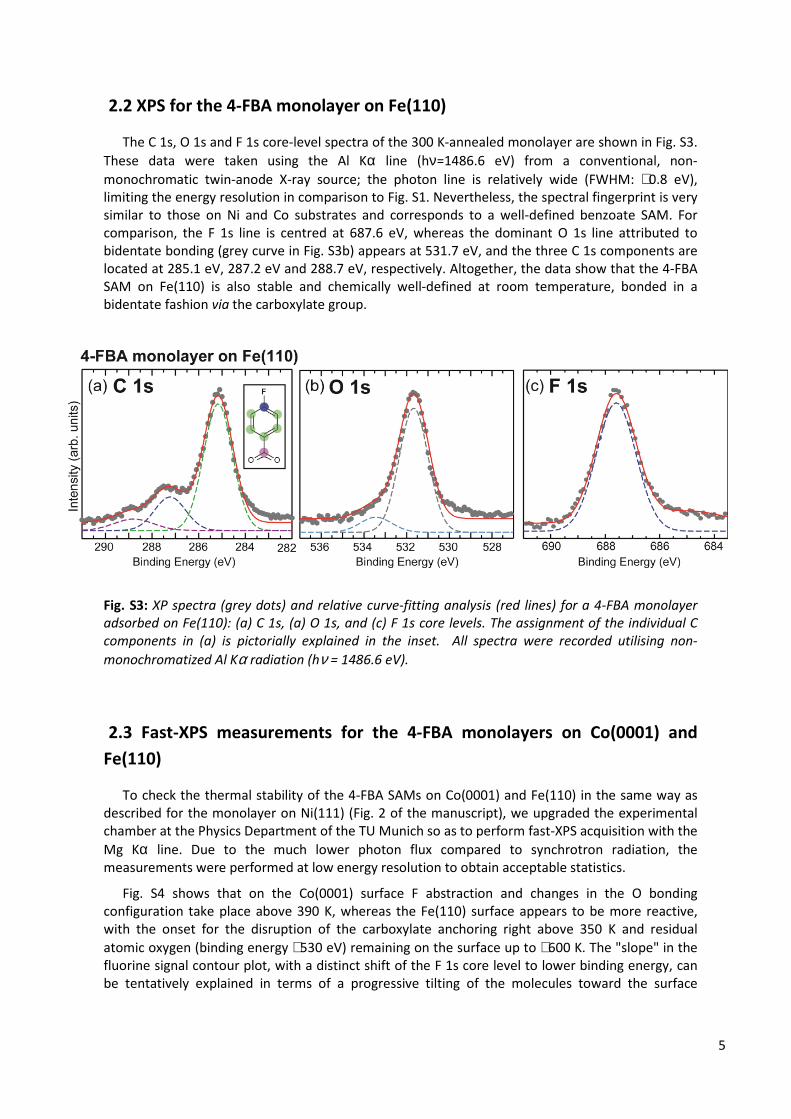
The C 1s, O 1s and F 1s core-level spectra of the 300 K-annealed monolayer are shown in Fig. S3. These data were taken using the Al Kα line (hν=1486.6 eV) from a conventional, non-monochromatic twin-anode X-ray source; the photon line is relatively wide (FWHM: ∼0.8 eV), limiting the energy resolution in comparison to Fig. S1. Nevertheless, the spectral fingerprint is very similar to those on Ni and Co substrates and corresponds to a well-defined benzoate SAM. For comparison, the F 1s line is centred at 687.6 eV, whereas the dominant O 1s line attributed to bidentate bonding (grey curve in Fig. S3b) appears at 531.7 eV, and the three C 1s components are located at 285.1 eV, 287.2 eV and 288.7 eV, respectively. Altogether, the data show that the 4-FBA SAM on Fe(110) is also stable and chemically well-defined at room temperature, bonded in a bidentate fashion via the carboxylate group.
Fig. S3: XP spectra (grey dots) and relative curve-fitting analysis (red lines) for a 4-FBA monolayer
adsorbed on Fe(110): (a) C 1s, (a) O 1s, and (c) F 1s core levels. The assignment of the individual C
components in (a) is pictorially explained in the inset. All spectra were recorded utilising non-
monochromatized Al Kα radiation (hν = 1486.6 eV).
2.3 Fast-XPS measurements for the 4-FBA monolayers on Co(0001) and
Fe(110)
To check the thermal stability of the 4-FBA SAMs on Co(0001) and Fe(110) in the same way as described for the monolayer on Ni(111) (Fig. 2 of the manuscript), we upgraded the experimental chamber at the Physics Department of the TU Munich so as to perform fast-XPS acquisition with the Mg Kα line. Due to the much lower photon flux compared to synchrotron radiation, the measurements were performed at low energy resolution to obtain acceptable statistics.
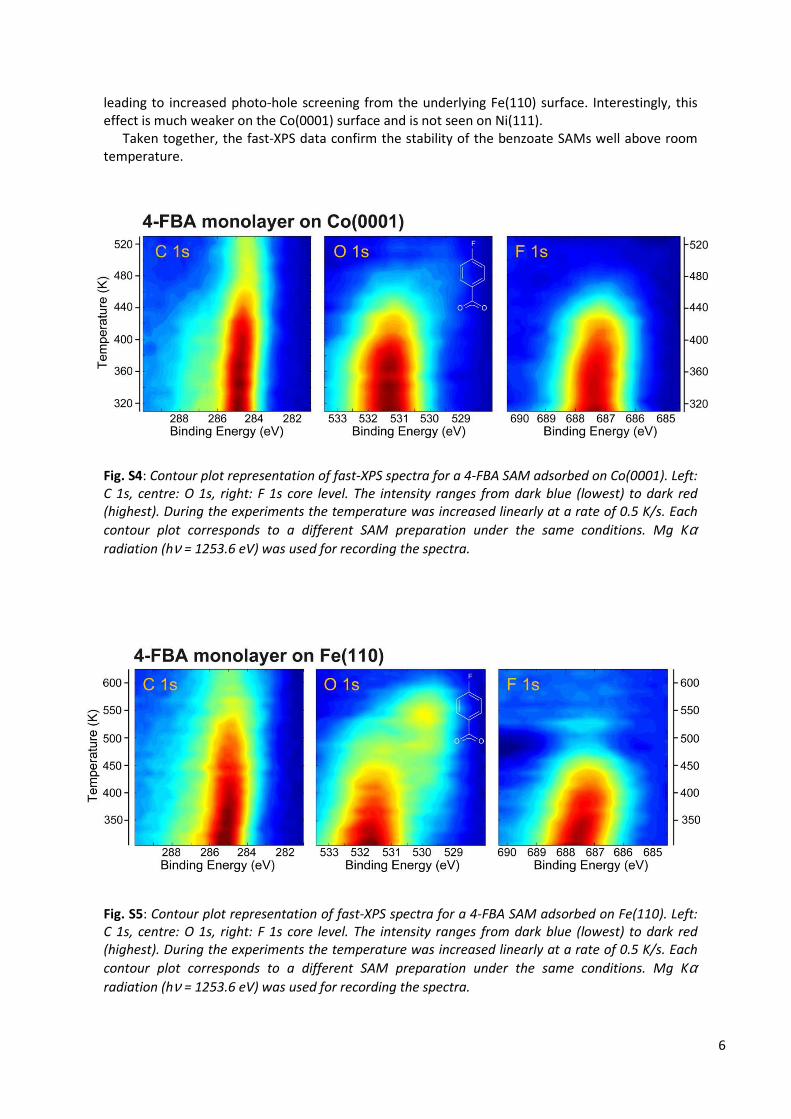
Fig. S4 shows that on the Co(0001) surface F abstraction and changes in the O bonding configuration take place above 390 K, whereas the Fe(110) surface appears to be more reactive, with the onset for the disruption of the carboxylate anchoring right above 350 K and residual atomic oxygen (binding energy ∼530 eV) remaining on the surface up to ∼600 K. The "slope" in the fluorine signal contour plot, with a distinct shift of the F 1s core level to lower binding energy, can be tentatively explained in terms of a progressive tilting of the molecules toward the surface
6
leading to increased photo-hole screening from the underlying Fe(110) surface. Interestingly, this effect is much weaker on the Co(0001) surface and is not seen on Ni(111).
Taken together, the fast-XPS data confirm the stability of the benzoate SAMs well above room temperature.
Fig. S4: Contour plot representation of fast-XPS spectra for a 4-FBA SAM adsorbed on Co(0001). Left:
C 1s, centre: O 1s, right: F 1s core level. The intensity ranges from dark blue (lowest) to dark red
(highest). During the experiments the temperature was increased linearly at a rate of 0.5 K/s. Each
contour plot corresponds to a different SAM preparation under the same conditions. Mg Kα
radiation (hν = 1253.6 eV) was used for recording the spectra.
Fig. S5: Contour plot representation of fast-XPS spectra for a 4-FBA SAM adsorbed on Fe(110). Left:
C 1s, centre: O 1s, right: F 1s core level. The intensity ranges from dark blue (lowest) to dark red
(highest). During the experiments the temperature was increased linearly at a rate of 0.5 K/s. Each
contour plot corresponds to a different SAM preparation under the same conditions. Mg Kα
radiation (hν = 1253.6 eV) was used for recording the spectra.
7
2.4 Application of the core-hole-clock method to study the charge transfer
dynamics in the 4-FBA/Co(0001) SAM.
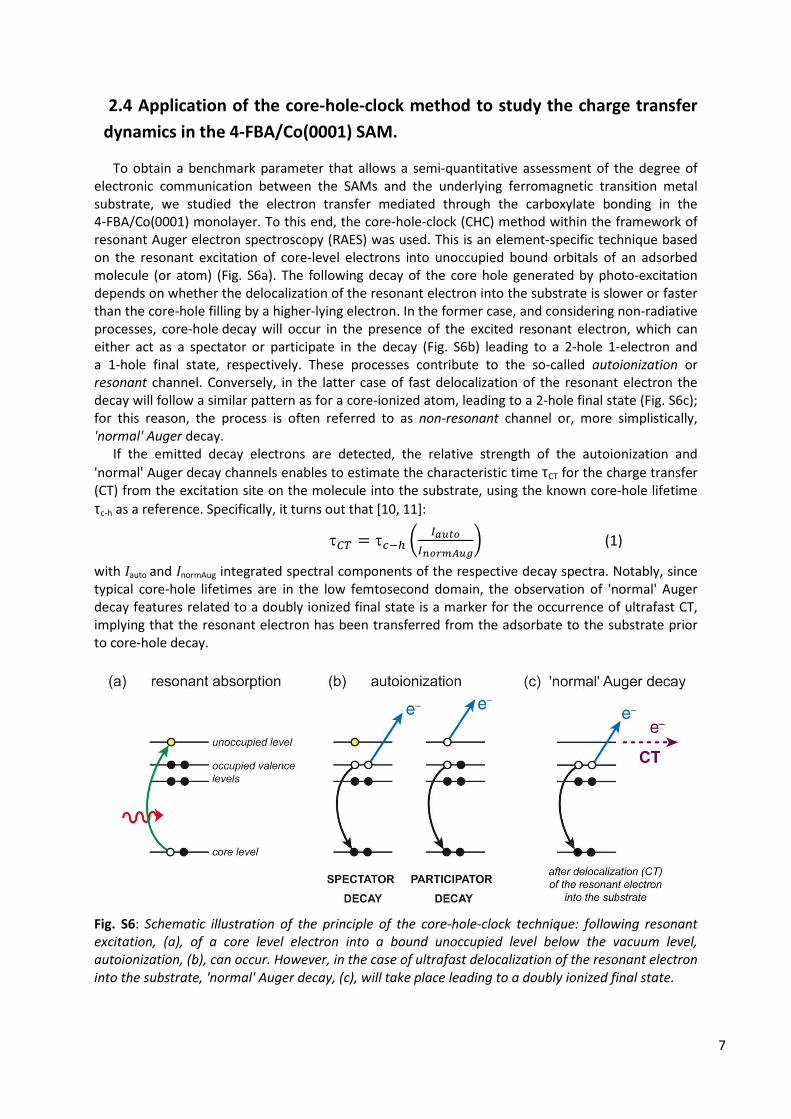
To obtain a benchmark parameter that allows a semi-quantitative assessment of the degree of electronic communication between the SAMs and the underlying ferromagnetic transition metal substrate, we studied the electron transfer mediated through the carboxylate bonding in the 4-FBA/Co(0001) monolayer. To this end, the core-hole-clock (CHC) method within the framework of resonant Auger electron spectroscopy (RAES) was used. This is an element-specific technique based on the resonant excitation of core-level electrons into unoccupied bound orbitals of an adsorbed molecule (or atom) (Fig. S6a). The following decay of the core hole generated by photo-excitation depends on whether the delocalization of the resonant electron into the substrate is slower or faster than the core-hole filling by a higher-lying electron. In the former case, and considering non-radiative processes, core-hole decay will occur in the presence of the excited resonant electron, which can either act as a spectator or participate in the decay (Fig. S6b) leading to a 2-hole 1-electron and a 1-hole final state, respectively. These processes contribute to the so-called autoionization or resonant channel. Conversely, in the latter case of fast delocalization of the resonant electron the decay will follow a similar pattern as for a core-ionized atom, leading to a 2-hole final state (Fig. S6c); for this reason, the process is often referred to as non-resonant channel or, more simplistically, 'normal' Auger decay.
If the emitted decay electrons are detected, the relative strength of the autoionization and 'normal' Auger decay channels enables to estimate the characteristic time τCT for the charge transfer (CT) from the excitation site on the molecule into the substrate, using the known core-hole lifetime τc-h as a reference. Specifically, it turns out that [10, 11]:
τ�� = τ��� � ���� �����
� (1)
with Iauto and InormAug integrated spectral components of the respective decay spectra. Notably, since typical core-hole lifetimes are in the low femtosecond domain, the observation of 'normal' Auger decay features related to a doubly ionized final state is a marker for the occurrence of ultrafast CT, implying that the resonant electron has been transferred from the adsorbate to the substrate prior to core-hole decay.
Fig. S6: Schematic illustration of the principle of the core-hole-clock technique: following resonant
excitation, (a), of a core level electron into a bound unoccupied level below the vacuum level,
autoionization, (b), can occur. However, in the case of ultrafast delocalization of the resonant electron
into the substrate, 'normal' Auger decay, (c), will take place leading to a doubly ionized final state.
8
To be able to perform the quantitative analysis based on Eq. (1), the individual spectra for the resonant and non-resonant channels need to be disentangled. This is generally possible, as the 'normal' Auger decay can be separately measured at a photon energy far above the resonant absorption maximum, whereas the resonant Auger decay can be monitored at each given energy value across the resonance on a similar system not coupled to the continuum, such that the non-resonant contribution is fully suppressed. Note that in general, the 'normal' Auger decay spectrum and the corresponding spectator decay spectrum are separated by the so-called spectator shift, because of the different final state (Fig. S6b, c) and the additional screening by the resonant (or spectator) electron, leading to higher kinetic energy of the ejected decay electron in the spectator decay. The participator spectrum normally appears at even higher kinetic energy, because the high-lying resonant electron is ejected. Another peculiarity, which is observed when scanning the photon energy over the energy region of the resonance, is a linear dispersion [10-12], in kinetic energy, of the autoionization decay electrons (deviations from the linear dispersion can occur in molecules due to vibrational excitations [12]). This dispersion is in striking contrast with the usual (i.e., non-resonant) Auger decay features, for which the electron kinetic energy is independent of the excitation energy. The effect is categorized as Auger Resonant Raman (ARR) conditions and is basically a consequence of the energy conservation in the isolated system [12].
An important limitation of the CHC method is that, in order to reliably separate autoionization and Auger fractions in a measured electron decay spectrum, the charge transfer time should fulfil the condition: 0.1 τc-h ≤ τCT ≤ 10 τc-h. Outside these boundaries, as one of the two fractions is much weaker than the other and its relative intensity cannot be reliably determined, only an upper or lower limit (respectively) for the CT time can be extracted from the CHC measurements.
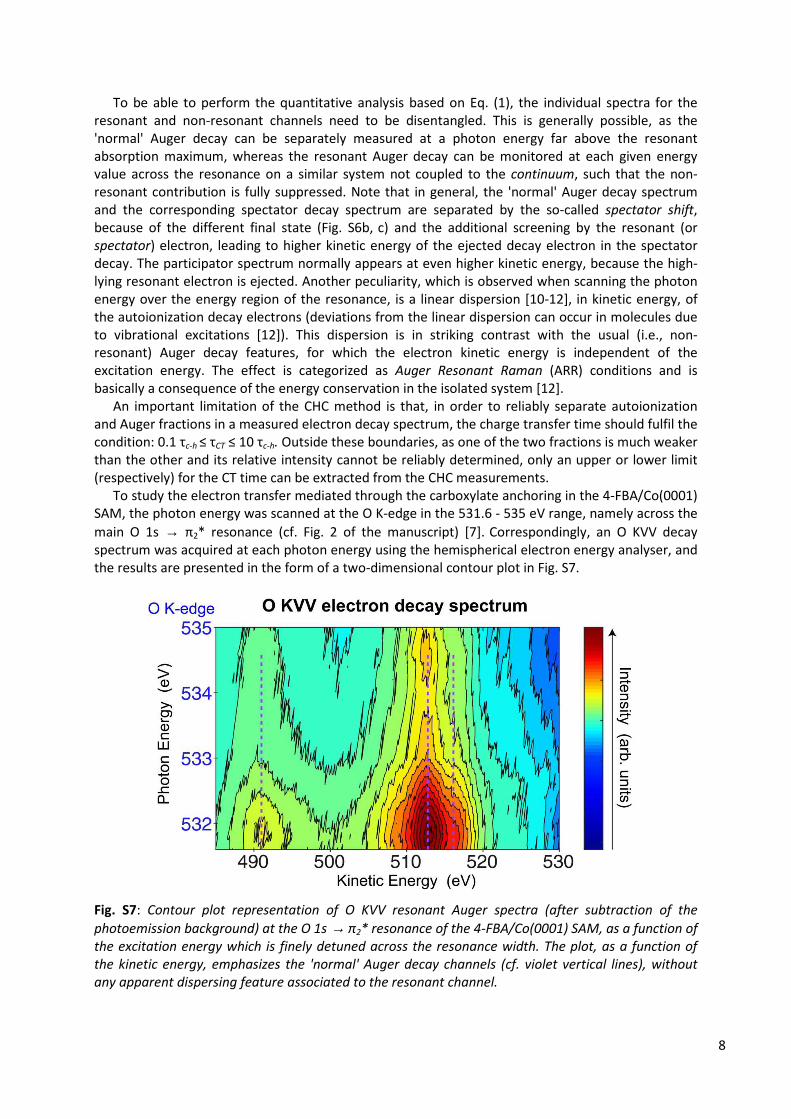
To study the electron transfer mediated through the carboxylate anchoring in the 4-FBA/Co(0001) SAM, the photon energy was scanned at the O K-edge in the 531.6 - 535 eV range, namely across the main O 1s → π2* resonance (cf. Fig. 2 of the manuscript) [7]. Correspondingly, an O KVV decay spectrum was acquired at each photon energy using the hemispherical electron energy analyser, and the results are presented in the form of a two-dimensional contour plot in Fig. S7.
Fig. S7: Contour plot representation of O KVV resonant Auger spectra (after subtraction of the
photoemission background) at the O 1s → π2* resonance of the 4-FBA/Co(0001) SAM, as a function of
the excitation energy which is finely detuned across the resonance width. The plot, as a function of
the kinetic energy, emphasizes the 'normal' Auger decay channels (cf. violet vertical lines), without
any apparent dispersing feature associated to the resonant channel.
9
Fig. S7 graphically demonstrates that the recorded O KVV electron decay lines do not disperse in kinetic energy when varying the excitation energy across the resonance width, thus signalling that at all energies the resonant channel is completely negligible with respect to the non-resonant counterpart. Since the O 1s core-hole lifetime is ∼6 fs [13], it follows from the previous remarks that the CT of the resonantly excited electrons to the cobalt substrate must occur on a time scale faster than 0.6 fs. Such charge transfer in the sub-femtosecond (attosecond) domain has been previously observed for strongly-coupled chemisorbed species on transition metals [13, 14]. Therefore, our present estimate clearly points out that the carboxylate bonding ensures a strong electronic coupling of the benzoate derivatives to the ferromagnetic transition metal surfaces.
References
[1] F. Blobner, S. Neppl and P. Feulner, "A Versatile Partial Electron Yield Detector with Large Acceptance Angle and Well-Defined Threshold Energy and Gain", J. Electron Spectrosc. Relat.
Phenom., 2011, 184, 483.
[2] J. Stöhr, "NEXAFS Spectroscopy", Springer-Verlag, 2003.
[3] P. Feulner, T. Niedermayer, K. Eberle, R. Schneider, D. Menzel, A. Baumer, E. Schmich, A. Shaporenko, Y. Tai and M. Zharnikov, "Strong Temperature Dependence of Irradiation Effects in Organic Layers", Phys. Rev. Lett., 2004, 93, 178302.
[4] A. Shaporenko, M. Zharnikov, P. Feulner and D. Menzel, "Quantitative Analysis of Temperature Effects in Radiation Damage of Thiolate-Based Self-Assembled Monolayers", J. Phys.: Condens.
Matter, 2006, 18, S1677.
[5] F. Blobner, R. Han, A. Kim, W. Wurth and P. Feulner, "Spin-Dependent Electron Transfer Dynamics Probed by Resonant Photoemission Spectroscopy", Phys. Rev. Lett., 2014, 112, 086801, and references therein.
[6] F. Blobner, P. N. Abufager, R. Han, J. Bauer, D. A. Duncan, R. J. Maurer, K. Reuter, P. Feulner and F. Allegretti, "Thiolate-Bonded Self-Assembled Monolayers on Ni(111): Bonding Strength, Structure, and Stability", J. Phys. Chem. C, 2015, 119, 15455.
[7] M. Neuber, M. Zharnikov, J. Walz and M. Grunze, "The Adsorption Geometry of Benzoic Acid on Ni(110)", Surf. Rev. Lett., 1999, 06, 53.
[8] T. Bitzer, N. V. Richardson, S. Reiss, M. Wühn and Ch. Wöll, "Sodium-Induced Ordering of the Benzoate Species on Si(100)-2×1: a Combined HREELS, XPS and NEXAFS Study", Surf. Sci., 2000, 458, 173.
[9] I. Bâldea, B. Schimmelpfennig, M. Plaschke, J. Rothe, J. Schirmer, A. B. Trofimov and T. Fanghänel, "C 1s Near Edge X-Ray Absorption Fine Structure (NEXAFS) of Substituted Benzoic Acids — a Theoretical and Experimental Study", J. Electron Spectrosc. Relat. Phenom., 2007, 154, 109.
[10] P. A. Brühwiler, O. Karis, N. Mårtensson, "Charge-Transfer Dynamics Studied Using Resonant Core Spectroscopies", Rev. Mod. Phys., 2002, 74, 703.
10
[11] D. Menzel, "Ultrafast Charge Transfer at Surfaces Accessed by Core Electron Spectroscopies", Chem. Soc. Rev., 2008, 37, 2212.
[12] M. N. Piancastelli, "Auger Resonant Raman Studies of Atoms and Molecules", J. Electron
Spectrosc. Relat. Phenom., 2000, 107, 1.
[13] C. Keller, M. Stichler, G. Comelli, F. Esch, S. Lizzit, W. Wurth and D. Menzel, "Ultrafast Charge Transfer Times of Chemisorbed Species from Auger Resonant Raman Studies", Phys. Rev.Lett., 1998, 80, 1774.
[14] A. Föhlisch, P. Feulner, F. Hennies, A. Fink, D. Menzel, D. Sanchez-Portal, P. M. Echenique and W. Wurth, "Direct Observation of Electron Dynamics in the Attosecond Domain", Nature, 2005, 436, 373.