Embed Size (px)
Citation preview

Toward Human-like Motion Planning in Urban Environments
Tianyu Gu1 and John M. Dolan2
Abstract— Prior autonomous navigation systems focused onthe demonstration of the technological feasibility. But as thetechnology evolves, improving user experience through learningexpert’s or individual’s driving pattern emerges as a promisingresearch direction. As a first step toward this goal, we inves-tigate methods to learn from human demonstrations in urbanscenarios without any environmental disturbances (traffic-free).We propose a path model that generates a reference path withsmooth and peak-value-reduced curvature, and a parameterizedspeed model to be fitted by human driving data. Modelparameters are then learned through regression methods, andcertain statistical human driving patterns are revealed. Thelearned model is then evaluated by comparing the generatedplan with the collected data by the same human driver.
I. INTRODUCTION
The high cost of car crashes, the trillions of hours squan-dered in traffic jams, and the lost urban space given overto parking lots yield many difficult transportation problems.Autonomous passenger vehicle technology is a promisingsolution to those problems.
Work by Dickmanns [1] and NavLab [2] at CarnegieMellon University demonstrated semi-autonomous drivingwith vision-based nagivation systems in the late 1980s.Since then, many path generation schemes, like arc-line[3], spiral[4] and polynomial spline[5], have been developedfor mobile robots. These path generation methods specifyonly the geometric curve (path), without simultaneouslygenerating the speed plan (trajectory). Trajectory planningwas then studied in many race car projects. [6], [7] and[8] used convex optimization routines to generate trajectoriesthat push the race cars to their limits, accounting for complexvehicle dynamics. These offline methods are computationallyunaffordable for real-time application.
The 2005 Grand Challenge and the 2007 Urban Challengemade further progress in creating fully autonomous vehicles.For both contests, maps were given, on which the entriesused high-accuracy GPS to register the host vehicle. GrandChallenge-winning entry Stanley [9] sampled trajectories inthe control space based on the waypoints corridor from themap. Urban Challenge-winning entry Boss [10] spawnedshort-horizon reactive trajectories by laterally shifting fromthe lane centerline and picking the fastest collision-free onefor execution. The reactive nature of both short-horizon plan-ning methods makes them only applicable for the simplifiedcontest environments.
1Tianyu Gu is with the Department of Electrical & Computer Engineer-ing, Carnegie Mellon University [email protected]
2John M. Dolan is with the Department of Electrical & Computer Engi-neering and the Robotics Institute, School of Computer Science, CarnegieMellon University
A deliberative planning quality was later introduced inseveral lattice-based trajectory sampling methods [11], [12].Reactiveness was maintained through exhaustive samplingand the computation overhead was significant. [13], [14]reduced the computational overhead by performing two-step(coarse and fine) trajectory planning.
These prior works have demonstrated the technologicalfeasibility of achieving vehicle autonomy. They usuallyhad weighted cost terms as the measurement of optimality.Costs were often manually tuned for maximum performance(speed), rather than systematically adjusted for passengercomfort based on human driving patterns. Only a few workshave concerned human driving patterns, for example: [15]investigated the proper speed model that explains a driver’smodulation of speed when entering or exiting a curve. [16]attempted to identify abnormal on-road driving behavior infreeway situations by learning a steering-speed mapping.Both works assumes overly simplified models that werenot expressive in characterizing general curve negotiation,especially for high-curvature turnings.
II. SCOPE OF STUDY
“Human-like” planning is defined as an effort to imitatehuman driving patterns while staying within the bounds ofsafe driving. Individuals are likely to have different drivingstyles; for example, a smooth turning maneuver by an elderlydriver may be too slow for young drivers.
In the high-level view of our motion planner (Fig. 1),traffic-free planning generates a reference trajectory consid-ering only road geometry while other traffic and obstaclesare ignored. Traffic-based planning produces a spatially andtemporally varied reference based on the traffic-free plan toaccount for other traffic and interfering objects. The trackingtrajectory module then generates a dynamically feasible tra-jectory through model-based evaluation for tracking control.
Controller InterfacingReference Planning
Traffic-FreePlanning
Traffic-BasedPlanning
Tracking Trajectory Generation
Fig. 1: Planning Structure. On-road navigation uses two plan-ning phases (traffic-free & traffic-based) and one trajectorygeneration phase for tracking control. The focus of this paperis on the traffic-free reference planning in bold font.
The focus of this paper is to investigate the appropriatemodel and the parameter learning methods for urban traffic-free planning, as illustrated by Fig. 2. The rest of this paperis arranged as follows. Section III proposes the expressive

Traffic-free Path Models
Traffic-free Speed Models
Map Input Reference Trajectory
Parameter Identification
Human Driving Datum
Lear
ning
Com
pone
nt
Planning Component
Fig. 2: Overview of human-like traffic-free model learningand planning. It consists of a planning component thatgenerates the human-like traffic-free reference plan, and alearning component that performs parameter identificationand statistical interpretation.
trajectory models to capture human driving patterns. SectionIV formulates the model identification problems. SectionsV and VI illustrate the results of learning, summarize thecontribution and propose future work.
III. MODEL DESIGN
In this section, models are proposed to fit human maneuverdata and to be efficiently evaluated for regeneration. Toefficiently serve these two purposes, path and speed modelsare devised and explained independently.
A. Path Model
The path model makes use of a pre-stored digital mapto generate a smooth reference path. Road information isrepresented by a sequence of map waypoints in a globaltwo-dimensional plane, augmented with lane width as well asspeed limits. The map waypoints are usually not distributeduniformly, the interval sometimes spanning from 5m to300m. To generate a smooth reference path in a sequenceof dense and uniformly sampled waypoints, the proposedpath model has three steps (Fig. 3).
Interpolation
Smoothing
Curvature Reduction
Map Waypoint
Reference Path
Fig. 3: Path Model. The path model takes three steps togenerate a smooth human-like reference path, includinginterpolation, smoothing and curvature reduction.
The centerline is first generated by connecting 2D mapwaypoints (X,Y ) with interpolation. Neither the x nor the y
coordinates of the map waypoints are necessarily monotone.We create a monotonically increasing variable “station” (s)by (linearly) estimating the longitudinal position of eachwaypoint. Splines interpolate the map waypoints smoothlyby separately generating two spline functions x(s) and y(s),which are then evaluated at uniformly sampled stations torepresent the centerline in a non-parametric form:
{si
, [xi
, y
i
], ✓i
,
i
}
where s
i
, [xi
, y
i
], ✓i
and
i
respectively represent the i
th lon-gitudinal station, global coordinates, global heading and pathcurvature. Note that with the polynomial representations, ✓
i
and
i
can be calculated analytically from their definitions.However, this centerline can easily create high-curvature
bumps near waypoints, which causes un-humanlike jerkysteering with controllers sensitive to the jerky curvature. Notethat experienced drivers do not always stay precisely onthe centerline. We use a local smoothing routine to createa smooth result. Two independent smoothings (quadraticleast-square fitting) are performed locally to get two smoothpolynomial functions x
⇤(s) and y
⇤(s). The size of thesmoothing window is chosen to constrain the maximum shift.Polynomial evaluation is conducted similarly as before toobtain a non-parametric form:
{si
, [x⇤i
, y
⇤i
], ✓⇤i
,
⇤i
}
Experienced drivers also take advantage of lane width toreduce the maximum curvature during tight turn negotiations.The subsequent optimization for curvature reduction providesvisible benefits in such situations. It minimizes the followingcumulative term by laterally nudging the points {p
i
}:
{o⇤i
} = argmin{o
i
}
X| pi � p
i�1
|pi
� p
i�1|� p
i+1 � p
i
|pi+1 � p
i
| | (1)
where
p
i
=
x
⇤i
� o
i
· sin(✓⇤i
)y
⇤i
+ o
i
· cos(✓⇤i
)
�
where o
i
is the lateral nudge distance. Note that this opti-mization is applied over the region whose absolute value ofcurvature is above ⇢ · max, where
max is the maximumcurvature corresponding to the steering angle limit of thevehicle and ⇢ is a percentage threshold.
The optimality criterion has a least-square formulation.The Levenberg-Marquardt algorithm is used to numericallysolve this optimization problem quickly in a local sense. Theoverall output of the path model is the reference path.
B. Speed Model
With the smooth reference path generated, the speed modelspecifies the speed of the vehicle’s motion. Together, theyform a reference trajectory. The trajectory determines manydynamic indicators that are important to a passenger’s expe-rience of comfort, like lateral & longitudinal acceleration.
Speed Generation(Normal)
Speed Generation(Tight-turn)
Smoothing
Reference Path
Reference Trajectory
Fig. 4: Speed Model. The speed model takes three steps(normal & tight-turn speed generation and smoothing) togenerate a smooth human-like reference trajectory.

A three-step speed model is designed to reflect a humandriving pattern (Fig. 4). The first step uses the geometryinformation of the reference path to generate a baselinespeed profile for general urban driving cases. For manyroad segments, speed limits can be obtained from the map.Driving at these speed limits might already yield the optimalspeed model, such as in most highway situations. For situ-ations like driving on many curvy urban roads or traversingintersections, however, a valid nominal speed might not existin the map, so a proper speed profile should be generated inresponse to the path geometry. We use the normal speedmodel Mnormal:
{vi
} = M
normal({i
}, vmax
,P) (2)
such that
v
i
v
max
i
· vi
2 a
lat
v
i
a
lon
v
i
� d
lon
where {i
} is the curvature sequence of the reference path,v
max is the speed limit, and P = [alat
, a
lon
, d
lon
]T are thetunable parameters that consist of preferred lateral accelera-tion, longitudinal acceleration and deceleration, respectively.
An iterative numerical algorithm [14] is used to applyseveral constraint parameters, including speed limit, lateralacceleration and longitudinal acceleration and decelerations.Instead of using the vehicle’s extreme values of these con-straining terms, human-preferred values are identified andapplied. Note that by changing the maximum speed at oneparticular reference point to zero, we can generate stoppingspeed profiles.
M
normal restricts the local curvature peak to correspondto a local speed minimum. While sufficient for most urbandriving, driving behaviors for tight1 turning maneuvers can-not be modeled precisely, since human drivers tend to behavein a cautious manner by decelerating earlier to performcorner negotiation at a lower speed, as shown in Fig. 5. Bothdrivers’ minimum speed is reached prior to the maximumcurvature. The absence of this feature could potentially causepassengers’ anxiety both when entering and exiting the turns.
To model this driving pattern, several path features aremarked first to position the speed profile as shown by theupper plot in Fig. 6, including local peak curvature
peak
, thecenter point s
p
and the length l
p
representing the “principal”turning region of a tight turning maneuver, defined by thesegment whose curvatures are above ⌘ · peak. A tight-turnspecific speed method M
tight is proposed to describe a three-phase piecewise-linear process that consists of decelerate-to-enter, maintain-low-speed, and accelerate-to-exit, as shownby the lower plot in Fig. 6:
{vi
} = M
tight({i
},Q) (3)
1A “tight” turning manuver is defined as a turning process whose peakcurvature is above certain threshold, 0.07 in our setup.
Fig. 5: Tight Turning Maneuver by Human. Human drivingdata of tight turning maneuvers are collected for two individ-ual drivers on the same road segment. Driver 2 has a morecautious driving style than driver 1 by slowing down earlierand more significantly.
where {i
} is the curvature sequence of the reference path,and Q = [v
min
, s�, lv, alon, dlon]T defines the shape of thespeed profile. Another parameter s� = s
p
� s
v
defines thelongitudinal distance from the centerpoint of the “principal”turning region to the local speed minimum point.
Station
Long
itudi
nal S
pped Decelerating
EnterLow-Speed
MaintainAccelerating
Exit
lv
sv
!dlon !alonvmin
StationC
urva
ture
κ peak
η ⋅κ peak lp
spsΔ
Fig. 6: Tight Turn Speed Model. Plot above illustrates thepath features on curvature plot. Plot below shows the three-phase speed model for a tight-turning maneuver.
Note that M tight, as well as M
normal, potentially yieldsspeed profiles with non-smooth (huge longitudinal jerkvalue) transition points connecting linear segments. In orderto improve the speed smoothness, the third step constrains thenumerically interpreted jerk iteratively until the maximumjerk value is below a certain threshold.
|v| j
lon
(4)
IV. MODEL FITTING
The proposed models have multiple parameters to be fittedfrom the human driving data. The path model performssmoothing and optimization with respect to two curvature-related criterias, i.e. smoothness and peak value. We assumethat a natural human driving pattern is to achieve optimalitiesin these two aspects, in which case, path model fitting (andsubsequent learning) becomes unnecessary. The focus of thissection is to identify the parameters of the speed modelsM
normal and M
tight.The parameters P of Mnormal are fitted by performing an
optimization that minimizes the least-square error for model

M
normal and human driving data:
P = argminP
k{vhuman
i
}�M
normal({i
}, vlimit
,P)k (5)
where {vhuman
i
} represents the human driving speed datafor normal urban curves. Note that the parameter a
lat
in Pcan be determined by other methods, as will be shown in thefollowing section. Only the two remaining parameters in Pwill be identified with equation (5).
The parameters Q of model M
tight are fitted with anoptimization via a similar least-square error formulation:
Q = argminQ
k{vhuman
i
}�M
tight({i
},Q)k (6)
where {vhuman
i
} represents the human driving speed dataon tight turns. Note that the parameter v
min
in Q can beobtained simply by scanning the human driving data to fit.Only the four remaining parameters in Q will be identifiedwith equation (6).
In Fig. 7, an example turning maneuver is fitted with theappropriate optimization routine above, in which the speedmodel shows good adaptability to the human driving pattern.
0 5 10 15 20 25 30 350
0.02
0.04
0.06
0.08
0.1
Station(m)
Cur
vatu
re(1
/m)
Human Data by Driver 2
0 5 10 15 20 25 30 354.5
5
5.5
6
6.5
7
7.5
Station(m)
Spee
d(m
/s)
Human Data by Driver 2Fitted Profile by Tight−turn Speed GenerationFitted Profile by Tight−turn Speed Generation with Jerk Smoothing
Fig. 7: Speed Model Fitting Example. The black dashed starcurves represent the human driving. The blue solid circlecurve is the speed profile fitting speed model M tight. The reddashed square curve is after further applying jerk smoothing.
V. EXPERIMENTS AND RESULTS
Two experiments were designed to support the claims ofthis paper. The first explains parameter learning results ofthe proposed speed models. The second evaluates the learnedmodel by comparing the plan with real human driving data.
A. Parameter Learning
1) Data collection: In order to obtain human drivingdata, we set up a differential GPS-based localization systemmounted at the center of the rear axle. An experienced humandriver was required to drive in a comfortable manner in threedistinct scenarios including highway (S1), urban roads (S2)and parking lots with multiple tight turns (S3), as illustratedin Fig. 8. The high-accuracy output data consisting of po-
(a) (b) (c)
Fig. 8: Three experiment scenarios. (a) S1: Highway I376and I79 connecting S2 and S3. (b) S2: Urban driveways nearSchenley Park, Overlook Dr, Pittsburgh, PA, USA. (c) S3:parking lots near Ernie Mashuda Dr, Cranberry, PA, USA.
sition, heading and path curvature, as well as longitudinalspeed and acceleration were recorded:
{[xhuman
i
, y
human
i
, ✓
human
i
,
human
i
, v
human
i
, a
human
i
]}
2) Learning: Learning was performed to distill and dis-cover important characteristics of human driving pattern. Dueto the variations in human behavior, two types of statisticalregression approaches were performed after identifying themodel parameters at the multiple curve negotiation locations.
Three parameters of the speed model M
normal must beidentified. We use an asterisk to represent a statisticallylearned parameter, e.g. P⇤ = [a⇤
lat
, a
⇤lon
, d
⇤lon
]T . The pre-ferred lateral acceleration a
⇤lat
is first learned from the databy creating a state-action mapping, where the “state” isthe curvature of the reference path and the “action” is thevalue of a
lat
. Scattering {[human
i
, v
human
i
]} data pointson the curvature-speed plane (scattered grey circles in Fig.12) makes a clear capping curve visible to characterizethe preferred maximum speed at a given path curvature.However, it is unknown what the analytical expression shouldbe. [17] proposed a computational search method (Fig.9) that performs symbolic regression on the experimentaldata, simultaneously fitting both the symbolic form2 and itsparameters.
Allowed operators:- Constant- Addition- Subtraction- Multiplication- Division- Exponential- Logarithm
Symbolic Regression Software — “eureqa”
Experimental data:- (capping) curvature-speed pairs
Analytical model
Fig. 9: Symbolic Regression. The symbolic regression rou-tine takes the allowed operations to distill an analytical modelthat best explains the experimental data.
In practice, we first find an analytical expression v
⇤max
()that describes the capping curves based on the data pointscollected from all S1, S2 and S3 scenarios with the analytical
2By restricting the allowed operators, we obtain certain control over thecomplexity of this symbolic form.

(a)
0 0.02 0.04 0.06 0.08 0.1 0.12 0.14 0.16 0.18 0.22
2.2
2.4
2.6
2.8
3
3.2
3.4
3.6
3.8
4
g (1/m)
a lat
* (m
/s2 )
(b)
Fig. 10: Symbolic regression result from human driving data.(a) shows the scattered {[human
i
, v
human
i
]} human drivingdatum and the plot of analytical capping curve. (b) showsthe learned curvature!lateral acceleration mapping.
expression (Fig. 10a):
v
⇤max
=0.0348
|| +0.832
0.0515 + || (7)
The mapping of a
lat
⇤ can further be calculated with thefollowing equation, as shown in Fig. 10b:
a
lat
⇤() = · v⇤max
2
=0.6922||
(||+ 0.0515)2+
0.05791
||+ 0.0515+
0.0012
||(8)
For a⇤lon
and d
⇤lon
, multiple parameter values are obtainedby model fitting of different (traffic-free) curve negotiationmaneuvers from scenario S2. A relation can be discoveredby linear regression:
a
⇤lon
(peak) = 0.2453 + 6.7456 · |peak| (9)d
⇤lon
(peak) = 0.1366 + 10.5464 · |peak| (10)
As for the speed model M
tight, five parameters mustbe identified, i.e., Q⇤ = [v⇤
min
, s
⇤�, l
⇤v
, a
⇤lon
, d
⇤lon
]T . Tightturning maneuvers from scenario S3 are used to fit themultiple recorded turns. Similarly, linear regression learnsa statistical mapping of the parameters we are interested in.
v
⇤min
(peak) = 7.5534� 28.4011 · |peak| (11)s
⇤�(
peak) = 1.6591 + 50.0945 · |peak| (12)l
⇤v
(lp
) = 1.1873 + 0.4517 · lp
(13)a
⇤lon
(peak) = 1.3784� 2.2145 · |peak| (14)d
⇤lon
(peak) = 1.3746 + 1.8192 · |peak| (15)
3) Discussion: The symbolic regression discovered a newrelation between a
⇤lat
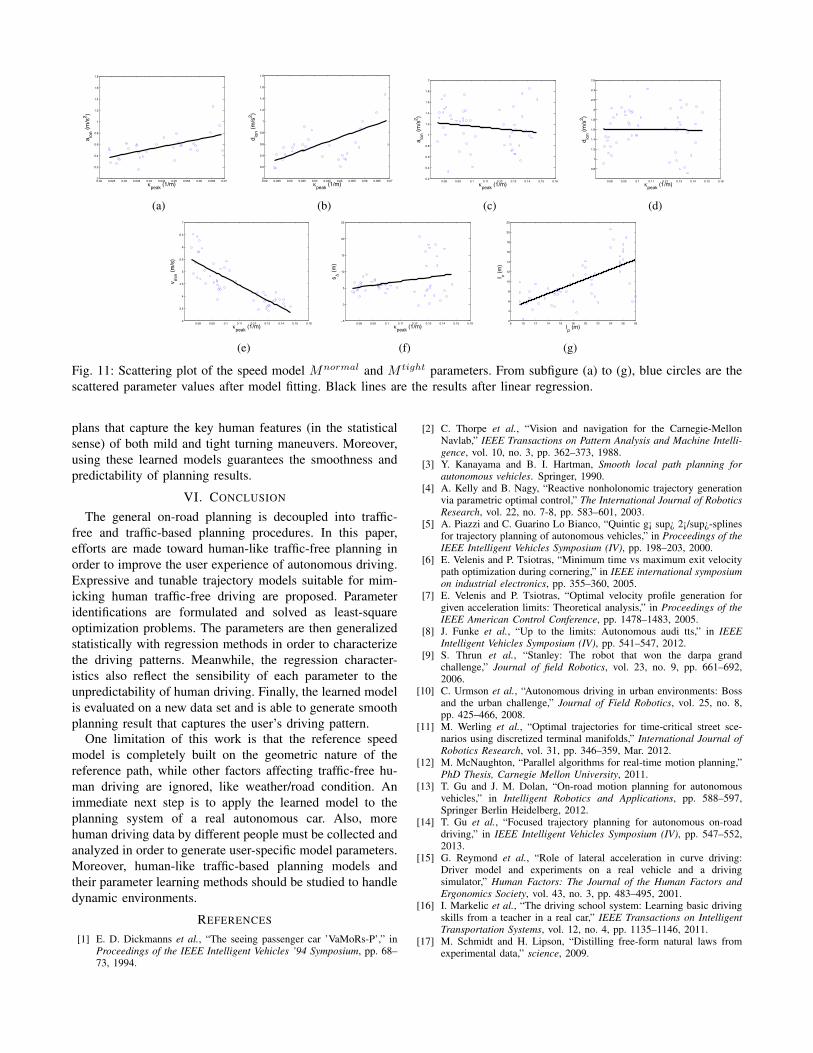
and the path geometry, which poten-tially can be adapted to other human driviers with its threecoefficients. The other parameters showed both strong andweak correlation. The closer their determination coefficients(R2) are to 1, the stronger linearity can be inferred. Basedon Table I and the scattering plots of each parameter (Fig.11), we discover some human driving patterns that can beexplained in a statistical sense:
1) v
⇤min
demonstrates the strongest linearity. It shows thatthe tighter the maximimum curvature of a negotiation,
TABLE I: Determination coefficients of linear models
R2a⇤lon
R2d⇤lon
R2a⇤lon
R2d⇤lon
R2v⇤min
R2s⇤�
R2l⇤v
0.34 0.29 0.02 0.01 0.68 0.08 0.58
the lower the maintaining speed v
min
will be. Thenecessity of speed model M tight is also demonstrated,since the learned maintaining speed v
⇤min
is signifi-cantly lower than the preferred maximum speed v
⇤max
of speed model Mnormal.2) s
⇤� demonstrates a weak linear correlation with
peak
overall. This relation can be interpreted as meaning thatas the maximum curvature of a maneuver increases,the driver tends to behave more cautiously be slowingdown earlier. The linearity is stronger when
peak
issmaller and vice versa, which may also imply thatthe human driver tends to behave more unpredictablyduring high-curvature negotations.
3) The mapping between l
p
and l
v
shows the secondstrongest linearity. This has an intuitive explanation:the longer the “principal” turning process lasts, thelonger the low-speed-maintaining process will be.
4) a
⇤lon
and d
⇤lon
from model M
normal clearly showstronger linearity than a
⇤lon
and d
⇤lon
from modelM
tight, which also reflects that the human driver tendsto behave more unpredictably during high-curvaturenegotations. But overall, they all have rather low de-termination coefficient values, confirming the argumentmade in [16] that the longitudinal accelerations havea great variance depending on hard-to-access variableslike driver mood.
B. Model Evaluation
1) Evaluation: The learned models M
normal
⇤ andM
tight
⇤ are fully specified by parameters P⇤ and Q⇤,respectively. To evaluate the quality of the models, speedplans are generated and compared with two human drivingprocesses.
0 5 10 15 20 25 300.01
0.02
0.03
0.04
0.05
Station (m)
Cur
vatu
re (1
/m)
Curvature Log by Driver 1
0 5 10 15 20 25 309
9.5
10
10.5
Station (m)
Spee
d (m
/s)
Speed Log by Driver 1Speed Plan generated with Mnormal
(a)
0 5 10 15 20 25 30 35 400
0.05
0.1
0.15
0.2
Station (m)
Cur
vatu
re (1
/m)
Curvature Log by Driver 1
0 5 10 15 20 25 30 35 403
4
5
6
7
8
Station (m)
Spee
d (m
/s)
Speed Log by Driver 1Speed Plan generated with Mtight
(b)
Fig. 12: Learned speed model evaluation result. (a) evaluatethe planning output of Mnormal
⇤ on a mild turn. (b) evaluatethe planning output of M tight
⇤ on a tight turn.
2) Discussion: From the evaluation results of bothM
normal
⇤ and M
tight
⇤ speed models, it is illustrated that theplan generated can rarely match perfectly with any one-timehuman data. But we are able to generate traffic-free reference
0.02 0.025 0.03 0.035 0.04 0.045 0.05 0.055 0.06 0.065 0.070
0.2
0.4
0.6
0.8
1
1.2
1.4
1.6
1.8
gpeak (1/m)
a lon (m
/s2 )
(a)
0.02 0.025 0.03 0.035 0.04 0.045 0.05 0.055 0.06 0.065 0.070
0.2
0.4
0.6
0.8
1
1.2
1.4
1.6
1.8
gpeak (1/m)
d lon (m
/s2 )
(b)
0.08 0.09 0.1 0.11 0.12 0.13 0.14 0.15 0.160.2
0.4
0.6
0.8
1
1.2
1.4
1.6
1.8
2
gpeak (1/m)
a lon (m
/s2 )
(c)
0.08 0.09 0.1 0.11 0.12 0.13 0.14 0.15 0.16
0.8
1
1.2
1.4
1.6
1.8
2
2.2
2.4
2.6
gpeak (1/m)
d lon (m
/s2 )
(d)
0.08 0.09 0.1 0.11 0.12 0.13 0.14 0.15 0.163
3.5
4
4.5
5
5.5
6
6.5
7
gpeak (1/m)
v min
(m/s
)
(e)
0.08 0.09 0.1 0.11 0.12 0.13 0.14 0.15 0.16−5
0
5
10
15
20
25
gpeak (1/m)s 6
(m)
(f)
8 10 12 14 16 18 20 22 24 26 282
4
6
8
10
12
14
16
18
20
22
lp (m)
l v (m)
(g)
Fig. 11: Scattering plot of the speed model Mnormal and M
tight parameters. From subfigure (a) to (g), blue circles are thescattered parameter values after model fitting. Black lines are the results after linear regression.
plans that capture the key human features (in the statisticalsense) of both mild and tight turning maneuvers. Moreover,using these learned models guarantees the smoothness andpredictability of planning results.
VI. CONCLUSION
The general on-road planning is decoupled into traffic-free and traffic-based planning procedures. In this paper,efforts are made toward human-like traffic-free planning inorder to improve the user experience of autonomous driving.Expressive and tunable trajectory models suitable for mim-icking human traffic-free driving are proposed. Parameteridentifications are formulated and solved as least-squareoptimization problems. The parameters are then generalizedstatistically with regression methods in order to characterizethe driving patterns. Meanwhile, the regression character-istics also reflect the sensibility of each parameter to theunpredictability of human driving. Finally, the learned modelis evaluated on a new data set and is able to generate smoothplanning result that captures the user’s driving pattern.
One limitation of this work is that the reference speedmodel is completely built on the geometric nature of thereference path, while other factors affecting traffic-free hu-man driving are ignored, like weather/road condition. Animmediate next step is to apply the learned model to theplanning system of a real autonomous car. Also, morehuman driving data by different people must be collected andanalyzed in order to generate user-specific model parameters.Moreover, human-like traffic-based planning models andtheir parameter learning methods should be studied to handledynamic environments.
REFERENCES
[1] E. D. Dickmanns et al., “The seeing passenger car ’VaMoRs-P’,” inProceedings of the IEEE Intelligent Vehicles ’94 Symposium, pp. 68–73, 1994.
[2] C. Thorpe et al., “Vision and navigation for the Carnegie-MellonNavlab,” IEEE Transactions on Pattern Analysis and Machine Intelli-gence, vol. 10, no. 3, pp. 362–373, 1988.
[3] Y. Kanayama and B. I. Hartman, Smooth local path planning forautonomous vehicles. Springer, 1990.
[4] A. Kelly and B. Nagy, “Reactive nonholonomic trajectory generationvia parametric optimal control,” The International Journal of RoboticsResearch, vol. 22, no. 7-8, pp. 583–601, 2003.
[5] A. Piazzi and C. Guarino Lo Bianco, “Quintic g¡ sup¿ 2¡/sup¿-splinesfor trajectory planning of autonomous vehicles,” in Proceedings of theIEEE Intelligent Vehicles Symposium (IV), pp. 198–203, 2000.
[6] E. Velenis and P. Tsiotras, “Minimum time vs maximum exit velocitypath optimization during cornering,” in IEEE international symposiumon industrial electronics, pp. 355–360, 2005.
[7] E. Velenis and P. Tsiotras, “Optimal velocity profile generation forgiven acceleration limits: Theoretical analysis,” in Proceedings of theIEEE American Control Conference, pp. 1478–1483, 2005.
[8] J. Funke et al., “Up to the limits: Autonomous audi tts,” in IEEEIntelligent Vehicles Symposium (IV), pp. 541–547, 2012.
[9] S. Thrun et al., “Stanley: The robot that won the darpa grandchallenge,” Journal of field Robotics, vol. 23, no. 9, pp. 661–692,2006.
[10] C. Urmson et al., “Autonomous driving in urban environments: Bossand the urban challenge,” Journal of Field Robotics, vol. 25, no. 8,pp. 425–466, 2008.
[11] M. Werling et al., “Optimal trajectories for time-critical street sce-narios using discretized terminal manifolds,” International Journal ofRobotics Research, vol. 31, pp. 346–359, Mar. 2012.
[12] M. McNaughton, “Parallel algorithms for real-time motion planning,”PhD Thesis, Carnegie Mellon University, 2011.
[13] T. Gu and J. M. Dolan, “On-road motion planning for autonomousvehicles,” in Intelligent Robotics and Applications, pp. 588–597,Springer Berlin Heidelberg, 2012.
[14] T. Gu et al., “Focused trajectory planning for autonomous on-roaddriving,” in IEEE Intelligent Vehicles Symposium (IV), pp. 547–552,2013.
[15] G. Reymond et al., “Role of lateral acceleration in curve driving:Driver model and experiments on a real vehicle and a drivingsimulator,” Human Factors: The Journal of the Human Factors andErgonomics Society, vol. 43, no. 3, pp. 483–495, 2001.
[16] I. Markelic et al., “The driving school system: Learning basic drivingskills from a teacher in a real car,” IEEE Transactions on IntelligentTransportation Systems, vol. 12, no. 4, pp. 1135–1146, 2011.
[17] M. Schmidt and H. Lipson, “Distilling free-form natural laws fromexperimental data,” science, 2009.