Embed Size (px)
Citation preview
Toward Anticorrosion Electrodes: Site-Selectivity and Self-Acceleration in theElectrochemical Corrosion of Platinum
Ya-Hui Fang and Zhi-Pan Liu*Shanghai Key Laboratory of Molecular Catalysis and InnoVatiVe Materials, Department of Chemistry, MOEKey Laboratory of Computational Physical Science, Fudan UniVersity, Shanghai 200433, China
ReceiVed: NoVember 24, 2009; ReVised Manuscript ReceiVed: January 25, 2010
As an important concern in both science and industry, metal corrosion at solid/liquid interfaces is not wellunderstood at the atomic level. The challenge to investigators lies in the simultaneous consideration of theextended solid surface, the electrochemical potential, and the water solution. The work presented here representsthe first theoretical attempt to elucidate the oxidation mechanism of the Pt electrode under electrochemicalconditions by exploring the oxidation kinetics of differently structured Pt surfaces, including Pt(111), Pt(211),and Pt(100). We show that the most abundant and close-packed (111) surface in Pt metal can be oxidizedbecause of the presence of surface OH. The corrosion is self-accelerated kinetically once the defects arecreated, as demonstrated by the low kinetic barrier of oxidation on Pt(211). By contrast, the open Pt(100)facet is very inert toward surface oxidation. Apart from the revealed surface-structure sensitivity, Pt corrosionis also strongly affected by the local oxygen coverage as pinned by the electrochemical potential. For Pt(111),the subsurface oxygen formation occurs only above 0.5 ML oxygen coverage around 1.1 V. The kineticsmodel for the surface oxidation proposed in this work provides new insights for designing the next generationof anticorrosion electrode materials in fuel cells.
1. Introduction
Platinum as an indispensable electrode material plays a centralrole in modern fuel cell applications.1–4 The surface of Ptparticles can however undergo dramatic change in morphologyduring electrocatalysis, which has a vital impact on fuel cellefficiency.1,5 Notoriously, at elevated potentials above 1 V (vsNHE), as for oxygen reduction reactions, surface Pt atoms arebelieved to exchange with the surface OH or O species fromH2O dissociation, which eventually lead to the corrosion of theelectrode and a remarkable decrease in catalytic activity.6,7
Because of the great difficulty to resolve the surface structurein situ, the oxidation process of the Pt electrode remains poorlyunderstood at the atomic level. A microscopic picture of thecorrosion kinetics is urgently needed for the rational design ofnovel electrode materials.
The evolution of Pt surface morphology under electrochemicalpotential was intensely studied with the aim to reduce electrodecorrosion. It was shown that Pt nanocrystals with a high densityof surface steps and open (100) facets are created after periodiccyclic voltammetry (CV) and the high-Miller-index surfacessuch as (730) and (530) survive as the dominant exposedsurfaces.1,5 The phenomenon is intriguing, as the lowest surfaceenergy Pt(111) is no longer the most stable surface underelectrochemical treatment. Fundamentally, it remains uncertainhow the oxidative species (OH or O) takes part in the oxidationand why the oxidation is surface-structure sensitive. By CVmeasurement, Conway et al. proposed that the surface oxidationoccurs through a place-exchange mechanism between adsorbedOH species and surface Pt atoms.8,9 Imai et al. observed theexistence of a Pt-OH bond (∼2.2 Å) with the SXAFStechnique.10 On the other hand, other experimental studiesshowed that the surface oxide is an anhydrous species without
the presence of OH.11–13 For instance, Jerkiewicz and co-workers11,12 measured the molecular weight of the surface oxideformed at the Pt electrode and suggested PtO as the oxidespecies. While it was known that a high kinetic barrier existsfor atomic O to penetrate into the subsurface14,15 at low Ocoverages (e0.25 ML), recent theoretical studies showed thatthe high surface coverages should be more relevant to surfaceoxidation at elevated electrochemical potentials.16
In this work we utilize the recently developed first-principlesmethods designed for electrochemical systems to compute thesurface oxidation kinetics, aiming to answer where and howthe surface oxidation occurs on Pt surfaces. Three differentlystructured Pt surfaces have been chosen as the model electrodes,namely Pt(111) terrace, stepped (211), and open (100) surfaces.The dependence of surface oxidation kinetics on the surfacemorphology and the electrochemical potential is then resolved.While the surface oxidation starts preferentially from the step-edge such as those represented by (211) steps, we demonstratethat the close-packed Pt(111) terrace can unfortunately beoxidized and destroyed at almost the same electrochemicalpotential (∼1.2 V), when the hydroxyl (OH) acts as a catalyticpromoter to enable the O-Pt place-exchange process. Bycontrast, the open (100) is the most anticorrosion facet due toa high kinetic barrier toward the deep oxidation.
2. Modeling and Theoretical Methods
2.1. DFT Calculation Setups. All density functional theory(DFT) calculations were performed using the SIESTA packagewith numerical atomic orbital basis sets and Troullier-Martinsnorm-conserving pesudopotentials.17–19 The exchange-correlationfunctional utilized was at the generalized gradient approximationlevel, known as GGA-PBE.20 A double-� plus polarization basis(DZP) set was employed. The orbital-confining cutoff wasdetermined from an energy shift of 0.010 eV. The energy cutofffor the real space grid used to represent the density was set as
* Corresponding author. Fax: (+86) 21-6564-2400. E-mail: [email protected].
J. Phys. Chem. C 2010, 114, 4057–4062 4057
10.1021/jp9111734 2010 American Chemical SocietyPublished on Web 02/17/2010
150 Ry. The Quasi-Newton Broyden method was employed forgeometry relaxation until the maximal forces on each relaxedatom were less than 0.1 eV/Å. To further check the accuracyof the calculated energy of surface composition, some key stateswere also examined with plane-wave methodology. For example,the adsorption energy of the O atom with respect to 1/2 O2 inthe gas phase for the 0.25 ML O on the (111) surface is 1.06with SIESTA and 1.13 eV with the plane-wave basis. Transitionstates (TSs) of the catalytic reaction were searched using theConstrained-Broyden-Minimization21 and dimer method.22,23
Three differently structured Pt surfaces have been chosen,namely flat Pt(111), stepped (211), and open (100) surfaces, toprobe the initial oxidation on the Pt electrode. For the calculationof the surface phase diagram, we mainly utilized p(2 × 2) andp(4 × 4) four-layer slabs for the (111) and (100) surfaces andp(1 × 2) four-layer slabs for the (211) surface. To computemore accurately the surface oxidation kinetics involving thesubsurface O phases, the large and thick slabs were utilized:(111) and (100) with p(4 × 4) five-layer slabs, and (211) withp(1 × 4) five-layer slab. In the five-layer slabs, the top threelayers were relaxed and the other layers were held at the bulk-truncated position.
2.2. Theoretical Approach for Studying Electrochemistry.Detailed calculation setups for the phase diagram have beenreported in our recent study.16 In our approach, the surface isexplicitly polarized by adding/subtracting charges, and thecounter charges are placed as Gaussian-distributed plane chargesin a vacuum. The electrochemical potential can be calculatedthrough correction of the calculated work function, which isthen related to the work function of the normal hydrogenelectrode (NHE). Next, the DFT-calculated energy must becorrected to compare the total energy of phases with differentcharges. Two extra energy contributions must be removed fromthe DFT total energy, namely, (i) the energy of the counterchargeitself (ECQ) and its electrostatic interaction with the charged-slab (ECQ-slab) and (ii) the energy of the excess charge in theslab (nQ). For reactions involving the releasing of proton andelectron, the reaction energy can be computed by referencingto the normal hydrogen electrode in a manner proposed by theNørskov group.24 This is governed by Gproton+electron ) G(1/2H2)- neU where e presents the transfer electron, n means thenumber of electrons, and U is the electrochemical potential.
The effect of the water environment on the phase diagramhas been examined through a continuum solvation model bysolving the Poisson-Boltzmann equation numerically in theperiodic slab as implemented recently.25,26 In our studies, weintroduce a large vacuum region (30 Å) along the Z axis thatseparates two adjacent slabs. In the middle of the vacuum region,we define a potential zero plane as the boundary condition forthe integration of the Poisson-Boltzmann equation, which canbe solved via the finite-difference multigrid method. We solvethe Poisson-Boltzmann equation twice in each electronic SCFloop with (i.e., potential Vsol) and without (i.e., potential Vvac)the implicit solution to obtain the excess potential ∆V () Vsol
- Vvac) due to solvation. ∆V is then added to the total potentialfor solving the Kohn-Sham equation in the self-consistent loop.The two parameters utilized in solving the Poisson-Boltzmannequation numerically are as reported in the previous publica-tion.25 We found that the water solvation effect on the phasediagram is small (see Supporting Information).
3. Results
3.1. Thermodynamics of the Surface Oxidation. Conceptu-ally, we can divide the initial oxidation of the surface into three
stages from the atomic level: phase-I, the adsorption of oxidativespecies (O and OH species) on the surface, denoted as Ox/Pts;phase-II, the penetration of oxidative species into the subsurface,initiating the formation of surface oxides, denoted as Ox-PtOy/Pts; phase-III, the roughening of the surface by vacancyformation, denoted as Ox-0/Pts, when the dissolution of Pt asPt2+ occurs. Following this classification, we can investigatethe thermodynamics and the kinetics of the three phases at variedelectrochemical potentials according to the reactions 1 and 2.
The thermodynamics of phase-I, namely the dependence ofsurface coverage on electrochemical potential (U), can beevaluated quantitatively by using the first-principles methods.16,27,28
In our recently developed approach,16 the surface is explicitlypolarized by added charges with the counterionic chargedistributed as a Gaussian-distributed plane charge in a vacuum.We found that the water environment plays only a minor rolein affecting the potential-coverage phase diagram (this has beenchecked via the addition of explicit water molecules previ-ously,16 and also via the inclusion of the implicit waterenvironment through a continuum solvation model25 in thiswork, see Supporting Information S-Figure 1). Since the atomicO is the representative oxidative species at high electrochemicalpotentials, the coverage-potential diagram of three Pt surfaceswith adsorbed O atoms have been computed, based on whichthe quasidifferential oxygen adsorption energy (Ead) at a givenU can then be determined, as shown in Figure 1a and 1b. FromDFT, the Ead of O at a particular coverage, e.g., n + 1 O atomsper unit cell, can be calculated with respect to the free O2
molecule as Ead ) EO(n) + 1/2EO2 - EO
(n+1), where EO(X) is the
DFT total energy of X adsorbed O atoms on surface per unit
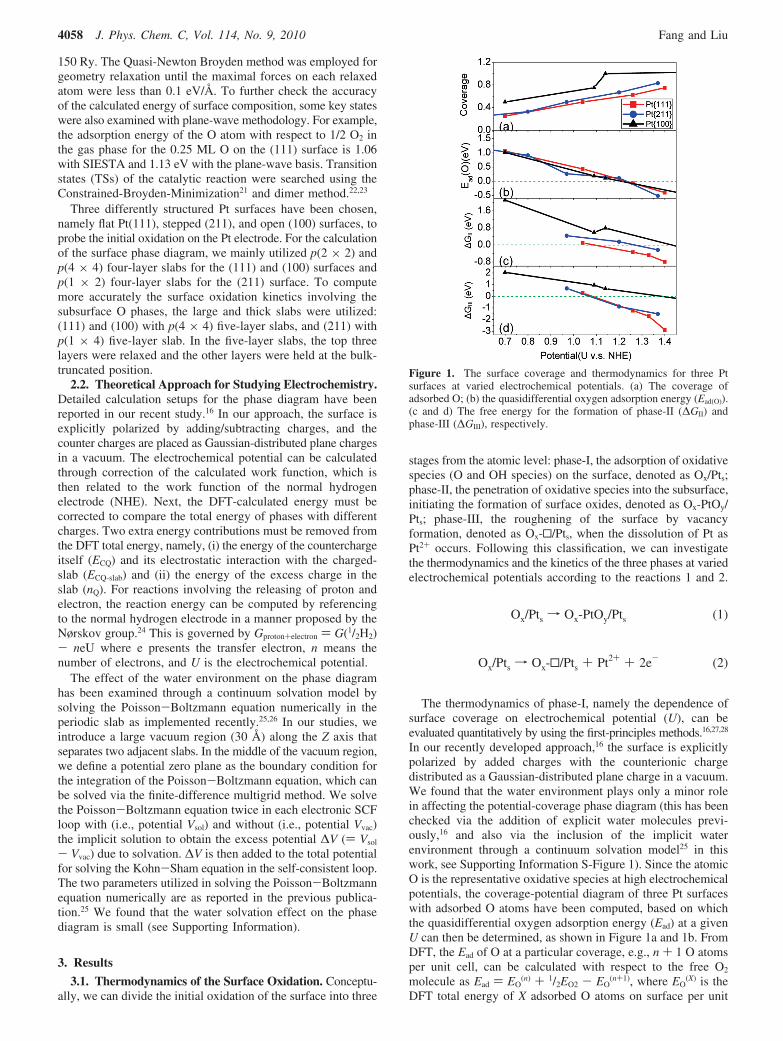
Figure 1. The surface coverage and thermodynamics for three Ptsurfaces at varied electrochemical potentials. (a) The coverage ofadsorbed O; (b) the quasidifferential oxygen adsorption energy (Ead(O)).(c and d) The free energy for the formation of phase-II (∆GII) andphase-III (∆GIII), respectively.
Ox/Pts f Ox-PtOy/Pts (1)
Ox/Pts f Ox-0/Pts + Pt2+ + 2e- (2)
4058 J. Phys. Chem. C, Vol. 114, No. 9, 2010 Fang and Liu
cell. A positive Ead indicates the adsorption of O is exothermiccompared to the gas phase O2.
Figure 1a and 1b shows that the three quantities, namely,the electrochemical potential, the surface coverage, and theadsorption energy of O are intimately correlated. By elevatingthe electrochemical potential, one can increase the coverage ofO on the surface and at the same time reduce the Ead of O. Thedecrease of Ead is due to the repulsive lateral interaction betweenadsorbed O, which is significant when the adsorbed O sharebonding with the same surface Pt atoms.29,30 It can be seen thatthe trends for Ead ∼ U are very similar on three surfaces andEad approaches zero at 1.2-1.3 V on all surfaces, although thecorresponding coverage is not the same. The coverage of O is∼0.6 ML on Pt(111), ∼ 0.7 ML on Pt(211), and above 1 MLon Pt(100). Considering that H2OT 1/2O2 + 2H+ + 2e- reachesthe thermodynamic equilibrium at 1.23 V at the standardcondition (∆G ) 0), the chemical potential of O in H2O atdifferent U with respect to the gas phase O2 (∆µ(O)) can thusbe deduced as ∆µ(O) ) 2(U - 1.23) (eV). This theoreticalrelation coincides well with the quasidifferential Ead(O) ∼ Urelation in Figure 1b, which reflects the grand canonicalequilibrium condition that at any electropotential the adsorbedO should be in equilibrium with the H2O in solution and the O2
in the gas phase.
Knowing the relevant O coverages and the electrochemicalpotential (∼1.2 V) when Ead(O) is about zero, we are now atthe position to determine the most stable structures at phase-IIand phase-III. To this end, we need to measure the stability ofthe possible configurations. This can be done by calculating thefree energy of the formation for phase-II (∆GII) and phase-III(∆GIII) with respect to phase-I using reactions 1 and 2.
∆GII can be represented approximately by the DFT totalenergy change ∆EII of reaction 1 since the corrections due tothe entropy change and pressure-volume (PV) change in thesolid states are negligible. To compute ∆GIII where reaction 2involves the release of Pt2+ and electrons, the electrochemicalhalf-cell reaction Pt2+ + 2e-T Pt(s) can be utilized, where theequilibrium potential is 1.2 V at the standard condition, i.e.G(Pt2+ + 2e-)|1.2 V ) G(Pt)|1.2 V. Considering that G(Pt) of thePt metal equals approximately the total energy of bulk Pt,Ecoh(Pt), G(Pt2+ + 2e-) at any U can be derived by computingG(Pt2+ +2e-) ) Ecoh(Pt) - 2(U - 1.2), where the 2(U - 1.2)term accounts for the (de)stabilization of two electrons by thepotential shift. Using the above methods to compute ∆GII and∆GIII, we then explored extensively a variety of possiblestructures for phase-II and phase-III, each associated with aparticular O coverage that is pinned by the applied electro-chemical potential. In Figure 1c and 1d, we plotted the calculated∆GII and ∆GIII of the most stable structure against its U. Themost stable surface O (phase-I), subsurface O (phase-II), andcorresponding surface Pt vacancy (phase-III) configurationsdetermined on Pt(111), Pt(211), and on Pt(100) (phase-II) atthe potential around 1.2 V are shown in Figure 2. For a cleareroverview, we illustrate the possible phase-II and phase-IIIstructures on Pt(111) with a O coverage at 0.75 ML in Figure3, and those on other surfaces are shown in SupportingInformation S-Figure 2 and S-Figure 3. In our search for thebest subsurface structures, we noticed that the subsurface O atomgenerally prefers to bond more first-layer Pt atoms but lesssecond-layer Pt atoms. This is illustrated in Figure 3a-d, wherethe most stable structure of the subsurface O on Pt(111) is atan atop site to the second layer and at a 3-fold site to the first-layer surface.
For the phase-II, Figure 1c shows that the (111) terrace isthermodynamically the most favorable to produce the subsurfaceO phase while (100) is the most inert. The penetration of O(∆GII) becomes thermodynamically favorable at 1.1 V onPt(111) with the O coverage just above 0.5 ML, which followsby Pt(211) at 1.26 V with the O coverage above 0.67 ML, andPt(100) at 1.45 V with the O coverage above 1 ML. On goingto the phase-III, we found that the creation of the surface Ptvacancy (∆GIII) is in fact thermodynamically more favored thanthe subsurface O formation, as shown in Figure 1d. ∆GIII isnegative at ∼1.1 V on Pt(111) and Pt(211), while at ∼1.4 V onPt(100). The thermodynamics data appears to imply that the Ptdissolution and the vacancy formation may start even beforethe surface being oxidized. However, from the determinedstructures, we found that the Pt surface vacancy is alwaysblocked by several subsurface O atoms, which help to stabilizethe exposed second-layer Pt atoms, as shown in Figure 3 (phase-III). In Figure 3f-j, it is clear that the more the termination ofthe exposed second-layer Pt atoms has with the O atoms, themore stable phase III will be. This suggests that the presenceof subsurface O is the prerequisite for the dissolution of surfacePt atoms, and thus the conversion from phase-I to phase-IIshould be the key kinetic step in the Pt oxidation process.
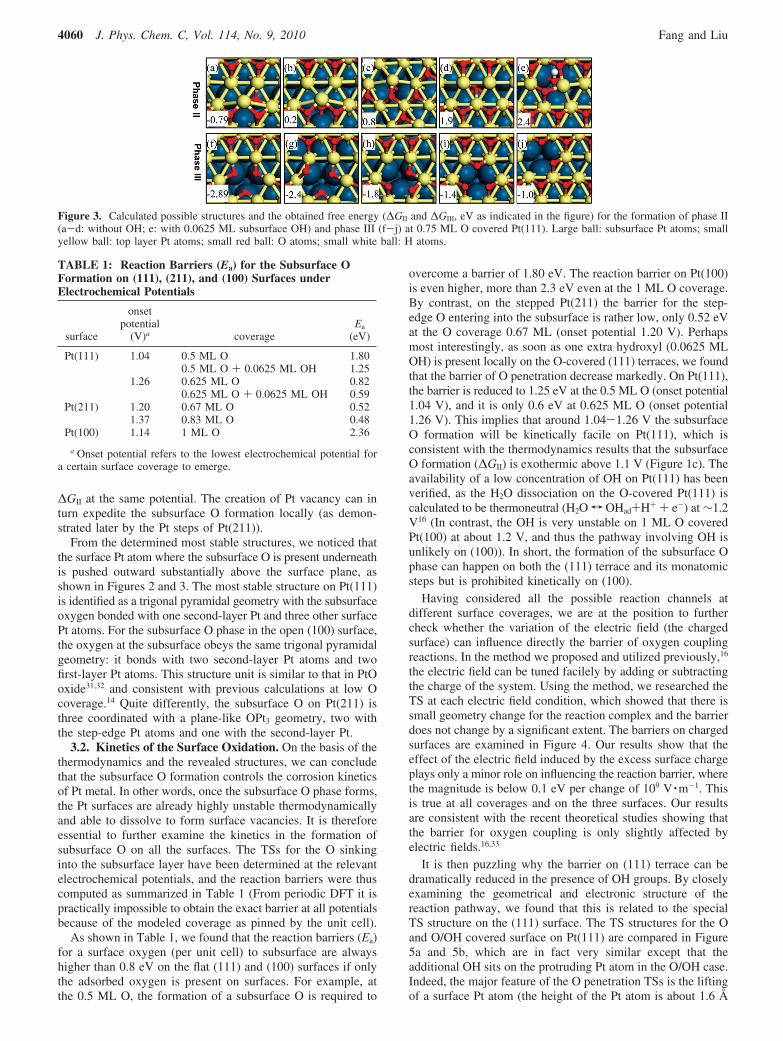
According to our results in the structure search for the moststable subsurface O phases, we would like to emphasize twogeneral findings: (i) The subsurface OH phases are very unstablecompared to the subsurface O phases. Because of the limitedspace in between the Pt layers, there is a large repulsion whena bulky OH group is present in the subsurface. For example,the ∆GII of a subsurface OH phase is 2.4 eV at the 0.75 ML O+ 0.0625 ML OH covered (111) surface as shown in Figure3e, which is significantly larger than the value for the subsurfaceO phase (see Figure 1). We thereafter only focus on our resultson the subsurface O phases. (ii) Two neighboring subsurfaceO atoms are strongly repulsive with each other on the (111)and (100) terraces. This is evidenced by the rapidly increased∆GII with the increase of the subsurface O concentration onPt(111) at ∼1.2 V (see Supporting Information S-Table 1 andS-Figure 4). It implies that the deep oxide formation is hinderedon terraces without the dissolution of Pt atoms. On the otherhand, the existence of a subsurface O on the terrace can initiatethe dissolution of the Pt since ∆GIII is even more negative than
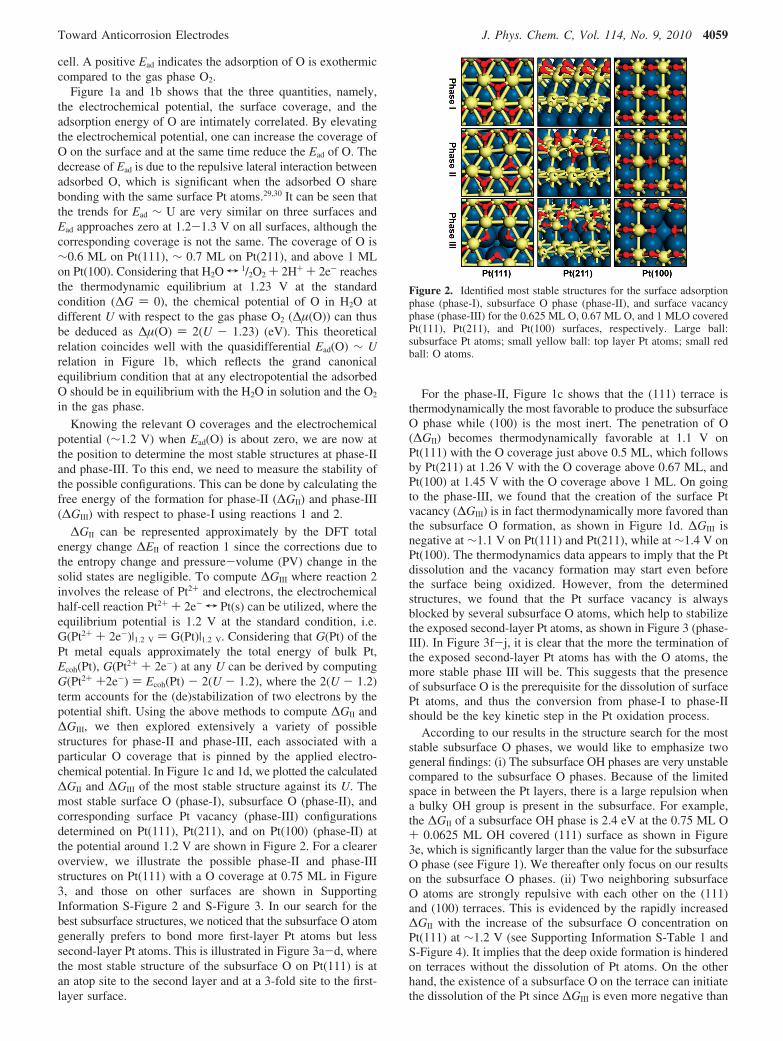
Figure 2. Identified most stable structures for the surface adsorptionphase (phase-I), subsurface O phase (phase-II), and surface vacancyphase (phase-III) for the 0.625 ML O, 0.67 ML O, and 1 MLO coveredPt(111), Pt(211), and Pt(100) surfaces, respectively. Large ball:subsurface Pt atoms; small yellow ball: top layer Pt atoms; small redball: O atoms.
Toward Anticorrosion Electrodes J. Phys. Chem. C, Vol. 114, No. 9, 2010 4059
∆GII at the same potential. The creation of Pt vacancy can inturn expedite the subsurface O formation locally (as demon-strated later by the Pt steps of Pt(211)).
From the determined most stable structures, we noticed thatthe surface Pt atom where the subsurface O is present underneathis pushed outward substantially above the surface plane, asshown in Figures 2 and 3. The most stable structure on Pt(111)is identified as a trigonal pyramidal geometry with the subsurfaceoxygen bonded with one second-layer Pt and three other surfacePt atoms. For the subsurface O phase in the open (100) surface,the oxygen at the subsurface obeys the same trigonal pyramidalgeometry: it bonds with two second-layer Pt atoms and twofirst-layer Pt atoms. This structure unit is similar to that in PtOoxide31,32 and consistent with previous calculations at low Ocoverage.14 Quite differently, the subsurface O on Pt(211) isthree coordinated with a plane-like OPt3 geometry, two withthe step-edge Pt atoms and one with the second-layer Pt.
3.2. Kinetics of the Surface Oxidation. On the basis of thethermodynamics and the revealed structures, we can concludethat the subsurface O formation controls the corrosion kineticsof Pt metal. In other words, once the subsurface O phase forms,the Pt surfaces are already highly unstable thermodynamicallyand able to dissolve to form surface vacancies. It is thereforeessential to further examine the kinetics in the formation ofsubsurface O on all the surfaces. The TSs for the O sinkinginto the subsurface layer have been determined at the relevantelectrochemical potentials, and the reaction barriers were thuscomputed as summarized in Table 1 (From periodic DFT it ispractically impossible to obtain the exact barrier at all potentialsbecause of the modeled coverage as pinned by the unit cell).
As shown in Table 1, we found that the reaction barriers (Ea)for a surface oxygen (per unit cell) to subsurface are alwayshigher than 0.8 eV on the flat (111) and (100) surfaces if onlythe adsorbed oxygen is present on surfaces. For example, atthe 0.5 ML O, the formation of a subsurface O is required to
overcome a barrier of 1.80 eV. The reaction barrier on Pt(100)is even higher, more than 2.3 eV even at the 1 ML O coverage.By contrast, on the stepped Pt(211) the barrier for the step-edge O entering into the subsurface is rather low, only 0.52 eVat the O coverage 0.67 ML (onset potential 1.20 V). Perhapsmost interestingly, as soon as one extra hydroxyl (0.0625 MLOH) is present locally on the O-covered (111) terraces, we foundthat the barrier of O penetration decrease markedly. On Pt(111),the barrier is reduced to 1.25 eV at the 0.5 ML O (onset potential1.04 V), and it is only 0.6 eV at 0.625 ML O (onset potential1.26 V). This implies that around 1.04-1.26 V the subsurfaceO formation will be kinetically facile on Pt(111), which isconsistent with the thermodynamics results that the subsurfaceO formation (∆GII) is exothermic above 1.1 V (Figure 1c). Theavailability of a low concentration of OH on Pt(111) has beenverified, as the H2O dissociation on the O-covered Pt(111) iscalculated to be thermoneutral (H2OT OHad+H+ + e-) at ∼1.2V16 (In contrast, the OH is very unstable on 1 ML O coveredPt(100) at about 1.2 V, and thus the pathway involving OH isunlikely on (100)). In short, the formation of the subsurface Ophase can happen on both the (111) terrace and its monatomicsteps but is prohibited kinetically on (100).
Having considered all the possible reaction channels atdifferent surface coverages, we are at the position to furthercheck whether the variation of the electric field (the chargedsurface) can influence directly the barrier of oxygen couplingreactions. In the method we proposed and utilized previously,16
the electric field can be tuned facilely by adding or subtractingthe charge of the system. Using the method, we researched theTS at each electric field condition, which showed that there issmall geometry change for the reaction complex and the barrierdoes not change by a significant extent. The barriers on chargedsurfaces are examined in Figure 4. Our results show that theeffect of the electric field induced by the excess surface chargeplays only a minor role on influencing the reaction barrier, wherethe magnitude is below 0.1 eV per change of 109 V ·m-1. Thisis true at all coverages and on the three surfaces. Our resultsare consistent with the recent theoretical studies showing thatthe barrier for oxygen coupling is only slightly affected byelectric fields.16,33
It is then puzzling why the barrier on (111) terrace can bedramatically reduced in the presence of OH groups. By closelyexamining the geometrical and electronic structure of thereaction pathway, we found that this is related to the specialTS structure on the (111) surface. The TS structures for the Oand O/OH covered surface on Pt(111) are compared in Figure5a and 5b, which are in fact very similar except that theadditional OH sits on the protruding Pt atom in the O/OH case.Indeed, the major feature of the O penetration TSs is the liftingof a surface Pt atom (the height of the Pt atom is about 1.6 Å
Figure 3. Calculated possible structures and the obtained free energy (∆GII and ∆GIII, eV as indicated in the figure) for the formation of phase II(a-d: without OH; e: with 0.0625 ML subsurface OH) and phase III (f-j) at 0.75 ML O covered Pt(111). Large ball: subsurface Pt atoms; smallyellow ball: top layer Pt atoms; small red ball: O atoms; small white ball: H atoms.
TABLE 1: Reaction Barriers (Ea) for the Subsurface OFormation on (111), (211), and (100) Surfaces underElectrochemical Potentials
surface
onsetpotential
(V)a coverageEa
(eV)
Pt(111) 1.04 0.5 ML O 1.800.5 ML O + 0.0625 ML OH 1.25
1.26 0.625 ML O 0.820.625 ML O + 0.0625 ML OH 0.59
Pt(211) 1.20 0.67 ML O 0.521.37 0.83 ML O 0.48
Pt(100) 1.14 1 ML O 2.36
a Onset potential refers to the lowest electrochemical potential fora certain surface coverage to emerge.
4060 J. Phys. Chem. C, Vol. 114, No. 9, 2010 Fang and Liu
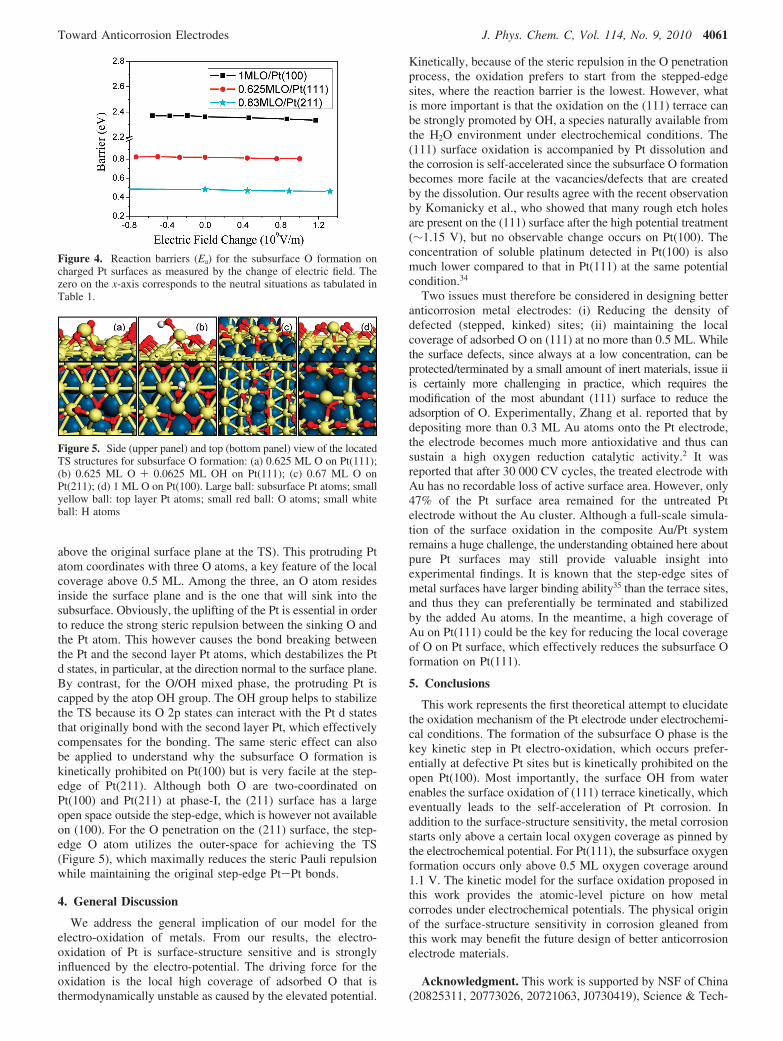
above the original surface plane at the TS). This protruding Ptatom coordinates with three O atoms, a key feature of the localcoverage above 0.5 ML. Among the three, an O atom residesinside the surface plane and is the one that will sink into thesubsurface. Obviously, the uplifting of the Pt is essential in orderto reduce the strong steric repulsion between the sinking O andthe Pt atom. This however causes the bond breaking betweenthe Pt and the second layer Pt atoms, which destabilizes the Ptd states, in particular, at the direction normal to the surface plane.By contrast, for the O/OH mixed phase, the protruding Pt iscapped by the atop OH group. The OH group helps to stabilizethe TS because its O 2p states can interact with the Pt d statesthat originally bond with the second layer Pt, which effectivelycompensates for the bonding. The same steric effect can alsobe applied to understand why the subsurface O formation iskinetically prohibited on Pt(100) but is very facile at the step-edge of Pt(211). Although both O are two-coordinated onPt(100) and Pt(211) at phase-I, the (211) surface has a largeopen space outside the step-edge, which is however not availableon (100). For the O penetration on the (211) surface, the step-edge O atom utilizes the outer-space for achieving the TS(Figure 5), which maximally reduces the steric Pauli repulsionwhile maintaining the original step-edge Pt-Pt bonds.
4. General Discussion
We address the general implication of our model for theelectro-oxidation of metals. From our results, the electro-oxidation of Pt is surface-structure sensitive and is stronglyinfluenced by the electro-potential. The driving force for theoxidation is the local high coverage of adsorbed O that isthermodynamically unstable as caused by the elevated potential.
Kinetically, because of the steric repulsion in the O penetrationprocess, the oxidation prefers to start from the stepped-edgesites, where the reaction barrier is the lowest. However, whatis more important is that the oxidation on the (111) terrace canbe strongly promoted by OH, a species naturally available fromthe H2O environment under electrochemical conditions. The(111) surface oxidation is accompanied by Pt dissolution andthe corrosion is self-accelerated since the subsurface O formationbecomes more facile at the vacancies/defects that are createdby the dissolution. Our results agree with the recent observationby Komanicky et al., who showed that many rough etch holesare present on the (111) surface after the high potential treatment(∼1.15 V), but no observable change occurs on Pt(100). Theconcentration of soluble platinum detected in Pt(100) is alsomuch lower compared to that in Pt(111) at the same potentialcondition.34
Two issues must therefore be considered in designing betteranticorrosion metal electrodes: (i) Reducing the density ofdefected (stepped, kinked) sites; (ii) maintaining the localcoverage of adsorbed O on (111) at no more than 0.5 ML. Whilethe surface defects, since always at a low concentration, can beprotected/terminated by a small amount of inert materials, issue iiis certainly more challenging in practice, which requires themodification of the most abundant (111) surface to reduce theadsorption of O. Experimentally, Zhang et al. reported that bydepositing more than 0.3 ML Au atoms onto the Pt electrode,the electrode becomes much more antioxidative and thus cansustain a high oxygen reduction catalytic activity.2 It wasreported that after 30 000 CV cycles, the treated electrode withAu has no recordable loss of active surface area. However, only47% of the Pt surface area remained for the untreated Ptelectrode without the Au cluster. Although a full-scale simula-tion of the surface oxidation in the composite Au/Pt systemremains a huge challenge, the understanding obtained here aboutpure Pt surfaces may still provide valuable insight intoexperimental findings. It is known that the step-edge sites ofmetal surfaces have larger binding ability35 than the terrace sites,and thus they can preferentially be terminated and stabilizedby the added Au atoms. In the meantime, a high coverage ofAu on Pt(111) could be the key for reducing the local coverageof O on Pt surface, which effectively reduces the subsurface Oformation on Pt(111).
5. Conclusions
This work represents the first theoretical attempt to elucidatethe oxidation mechanism of the Pt electrode under electrochemi-cal conditions. The formation of the subsurface O phase is thekey kinetic step in Pt electro-oxidation, which occurs prefer-entially at defective Pt sites but is kinetically prohibited on theopen Pt(100). Most importantly, the surface OH from waterenables the surface oxidation of (111) terrace kinetically, whicheventually leads to the self-acceleration of Pt corrosion. Inaddition to the surface-structure sensitivity, the metal corrosionstarts only above a certain local oxygen coverage as pinned bythe electrochemical potential. For Pt(111), the subsurface oxygenformation occurs only above 0.5 ML oxygen coverage around1.1 V. The kinetic model for the surface oxidation proposed inthis work provides the atomic-level picture on how metalcorrodes under electrochemical potentials. The physical originof the surface-structure sensitivity in corrosion gleaned fromthis work may benefit the future design of better anticorrosionelectrode materials.
Acknowledgment. This work is supported by NSF of China(20825311, 20773026, 20721063, J0730419), Science & Tech-
Figure 4. Reaction barriers (Ea) for the subsurface O formation oncharged Pt surfaces as measured by the change of electric field. Thezero on the x-axis corresponds to the neutral situations as tabulated inTable 1.
Figure 5. Side (upper panel) and top (bottom panel) view of the locatedTS structures for subsurface O formation: (a) 0.625 ML O on Pt(111);(b) 0.625 ML O + 0.0625 ML OH on Pt(111); (c) 0.67 ML O onPt(211); (d) 1 ML O on Pt(100). Large ball: subsurface Pt atoms; smallyellow ball: top layer Pt atoms; small red ball: O atoms; small whiteball: H atoms
Toward Anticorrosion Electrodes J. Phys. Chem. C, Vol. 114, No. 9, 2010 4061
nology Community of Shanghai Municipality (08DZ2270500),and Program for Professor of Special Appointment (EasternScholar) at Shanghai Institute of Higher Learning.
Supporting Information Available: The Pt(100) phasediagram determined with and without a continuum solvationmodel for the correction of the solvation effect, the possiblestructures and the free energy for the formation of phase-II(∆GII) and phase-III (∆GIII) at 0.67 ML O covered Pt(211) and1 ML O covered Pt(100) surfaces, and the free energy and themost stable structures for the formation of phase II (∆GII) withdifferent subsurface O concentrations. This information isavailable free of charge via the Internet at http://pubs.acs.org/
References and Notes
(1) Tian, N.; Zhou, Z. Y.; Sun, S. G.; Ding, Y.; Wang, Z. L. Science2007, 316, 732.
(2) Zhang, J.; Sasaki, K.; Sutter, E.; Adzic, R. R. Science 2007, 315,220.
(3) Stamenkovic, V. R.; Mun, B. S.; Mayrhofer, K. J. J.; Ross, P. N.;Markovic, N. M. J. Am. Chem. Soc. 2006, 128, 8813.
(4) Lim, B.; Jiang, M. J.; Camargo, P. H. C.; Cho, E. C.; Tao, J.; Lu,X. M.; Zhu, Y. M.; Xia, Y. A. Science 2009, 324, 1302.
(5) Furuya, N.; Shibata, M. J. Electroanal. Chem. 1999, 467, 85.(6) Shao-Horn, Y.; Sheng, W. C.; Chen, S.; Ferreira, P. J.; Holby, E. F.;
Morgan, D. Top. Catal. 2007, 46, 285.(7) Tian, F.; Anderson, A. B. J. Phys. Chem. C 2008, 112, 18566.(8) Conway, B. E. Prog. Surf. Sci. 1995, 49, 331.(9) Angerstein-Kozlowska, H.; Conway, B. E.; Sharp, W. B. A. J.
Electroanal. Chem. 1973, 43.(10) Imai, H.; Izumi, K.; Matsumoto, M.; Kubo, Y.; Kato, K.; Imai, Y.
J. Am. Chem. Soc. 2009, 131, 6295.(11) Jerkiewicz, G.; Vatankhah, G.; Lessard, J.; Soriaga, M. P.; Park,
Y. S. Electrochim. Acta 2004, 49, 1451.
(12) Alsabet, M.; Grden, M.; Jerkiewicz, G. J. Electroanal. Chem. 2006,589, 120.
(13) Harrington, D. A. J. Electroanal. Chem. 1993, 355, 21.(14) Gu, Z. H.; Balbuena, P. B. J. Phys. Chem. C 2007, 111, 9877.(15) Gu, Z. H.; Balbuena, P. B. J. Phys. Chem. C 2007, 111, 17388.(16) Fang, Y. H.; Liu, Z. P. J. Phys. Chem. C 2009, 113, 9765.(17) Soler, J. M.; Artacho, E.; Gale, J. D.; Garcia, A.; Junquera, J.;
Ordejon, P.; Sanchez-Portal, D. J. Phys.: Condens. Matter 2002, 14, 2745.(18) Junquera, J.; Paz, O.; Sanchez-Portal, D.; Artacho, E. Phys. ReV.
B 2001, 64, 235111.(19) Troullier, N.; Martins, J. L. Phys. ReV. B 1991, 43, 1993.(20) Perdew, J. P.; Burke, K.; Ernzerhof, M. Phys. ReV. Lett. 1996, 77,
3865.(21) Wang, H. F.; Liu, Z. P. J. Am. Chem. Soc. 2008, 130, 10996.(22) Henkelman, G.; Jonsson, H. J. Chem. Phys. 1999, 111, 7010.(23) Kaestner, J.; Sherwood, P. J. Chem. Phys. 2008, 128.(24) Rossmeisl, J.; Logadottir, A.; Norskov, J. K. Chem. Phys. 2005,
319, 178.(25) Wang, H. F.; Liu, Z. P. J. Phys. Chem. C 2009, 113, 17502.(26) Jinnouchi, R.; Anderson, A. B. Phys. ReV. B 2008, 77, 245417.(27) Filhol, J. S.; Neurock, M. Angew. Chem., Int. Ed. 2006, 45, 402.(28) Norskov, J. K.; Rossmeisl, J.; Logadottir, A.; Lindqvist, L.; Kitchin,
J. R.; Bligaard, T.; Jonsson, H. J. Phys. Chem. B 2004, 108, 17886.(29) Liu, Z. P.; Jenkins, S. J.; King, D. A. J. Am. Chem. Soc. 2004,
126, 10746.(30) Bleakley, K.; Hu, P. J. Am. Chem. Soc. 1999, 121, 7644.(31) Jacob, T. J. Electroanal. Chem. 2007, 607, 158.(32) Seriani, N.; Jin, Z.; Pompe, W.; Ciacchi, L. C. Phys. ReV. B 2007,
76.(33) Karlberg, G. S.; Rossmeisl, J.; Norskov, J. K. Phys. Chem. Chem.
Phys. 2007, 9, 5158.(34) Komanicky, V.; Chang, K. C.; Menzel, A.; Markovic, N. M.; You,
H.; Wang, X.; Myers, D. J. Electrochem. Soc. 2006, 153, B446.(35) Vang, R. T.; Honkala, K.; Dahl, S.; Vestergaard, E. K.; Schnadt,
J.; Laegsgaard, E.; Clausen, B. S.; Norskov, J. K.; Besenbacher, F. Nat.Mater. 2005, 4, 160.
JP9111734
4062 J. Phys. Chem. C, Vol. 114, No. 9, 2010 Fang and Liu