Embed Size (px)
Citation preview
Toward an Understanding and Predictionof Air Flow in Buildings
by
Joseph William Lstiburek
A thesis submitted in conformity with the requirementsfor the degree of Doctor of Philosophy
School of Graduate StudiesUniversity of Toronto
© Copyright by Joseph William Lstiburek, 2000
Toward an Understanding and Prediction of Air Flow in Buildings
ii
Abstract
Toward an Understanding and Prediction of Air Flow in BuildingsDoctor of Philosophy, 2000Joseph William Lstiburek
Civil EngineeringUniversity of Toronto
This thesis makes two fundamental arguments in the analysis of air flow in
buildings:
• buildings are complex three dimensional air flow networks driven by
complex air pressure relationships; and
• the key to understanding air flow in buildings is the building air pressure
field.
Under standard building analysis, interstitial air flow and interstitial air pressure
fields are not often considered and exterior and interior walls, floors, and roof assemblies
are either considered as monolithic or having openings resulting in flow across the specific
assemblies. Buildings comprise multi-layer envelope assemblies with numerous air gaps or
void spaces that are often connected to service chases. As a result, complex three
dimensional flow paths and intricate air pressure relationships must be considered.
The standard approaches to analysis concentrate on difficult or impossible to
measure parameters – air flows and component leakage areas. This typically results in large
inaccuracies in the prediction of building performance. This thesis shows that the building
air pressure field is readily measurable, the building air flow field is not. This thesis argues
that the building air flow field should be developed from the building air pressure field – not
the other way around as in standard building analysis.
By developing the flow field, the leakage areas and the flow relationships from the
measured building pressure field, interstitial air pressure fields and resulting interstitial air
flows are accounted for. In addition, this approach provides a powerful diagnostic tool for
identifying many of the problems related to direct and indirect effects of air flows.
Toward an Understanding and Prediction of Air Flow in Buildings
iii
The measured building air pressure field can be used with network analysis to solve
the building flow and leakage regime as an alternative to using estimated or measured
leakage areas and measured air flows to solve the building air pressure and flow regime.
This inverse method of using pressures as inputs rather than leakage areas is calibrated by
perturbing both the building and analytical model. The perturbation results in a pressure
response unique to the building. This pressure response is used to apportion flows and
leakage areas in the network analytical model thereby increasing the accuracy and the range
of applicability of the model.
Toward an Understanding and Prediction of Air Flow in Buildings
iv
Acknowledgements
I would like to thank my advisors Professor John Timusk and Professor Kim
Pressnail for their advice and support. I would also like to thank Neil Moyer and John
Tooley – professionally for wrestling with the same questions I faced and personally for
their friendship, unselfish help, advice and criticism. I would also like to thank Dr. Colin
Olsen, Armin Rudd, Michael Blasnik, David Pennebaker, and Gary Nelson for their tireless
assistance in taking field measurements and their helpful review. I particularly would like to
thank Dr. Mark Bomberg for his encouragement and support throughout this process.
Without Dr. Bomberg’s unbounded enthusiasm it is likely that I would not have completed
this work. I would also like to thank Kohta Ueno for his help with the modeling portion of
this thesis and for his patience with my computer skills. I would also like to thank
Stephanie Menegus for the wonderful graphics in this document. Finally, I would like to
thank Gustav Handegord for being a mentor and a role model — you cast a long shadow,
my friend.
Toward an Understanding and Prediction of Air Flow in Buildings
v
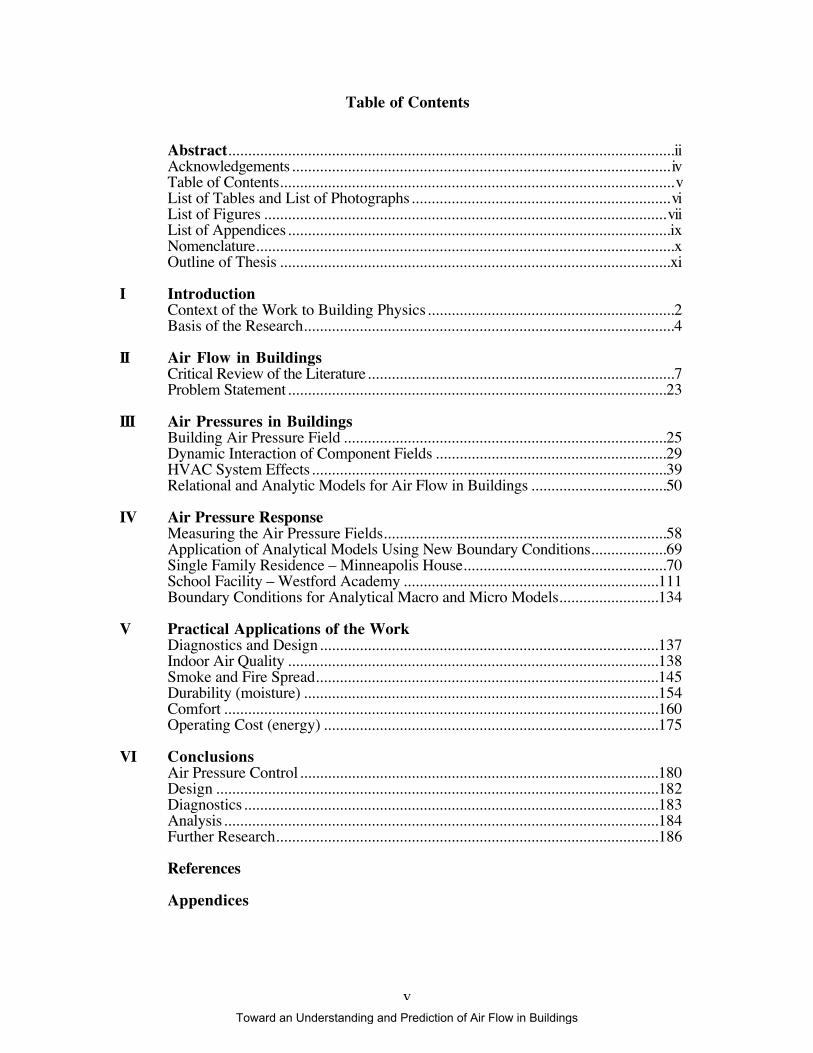
Table of Contents
Abstract................................................................................................................iiAcknowledgements............................................................................................... ivTable of Contents...................................................................................................vList of Tables and List of Photographs.................................................................viList of Figures .....................................................................................................viiList of Appendices................................................................................................ixNomenclature.........................................................................................................xOutline of Thesis ..................................................................................................xi
I IntroductionContext of the Work to Building Physics..............................................................2Basis of the Research.............................................................................................4
II Air Flow in BuildingsCritical Review of the Literature.............................................................................7Problem Statement...............................................................................................23
III Air Pressures in BuildingsBuilding Air Pressure Field .................................................................................25Dynamic Interaction of Component Fields ..........................................................29HVAC System Effects.........................................................................................39Relational and Analytic Models for Air Flow in Buildings ..................................50
IV Air Pressure ResponseMeasuring the Air Pressure Fields.......................................................................58Application of Analytical Models Using New Boundary Conditions...................69Single Family Residence – Minneapolis House...................................................70School Facility – Westford Academy ................................................................111Boundary Conditions for Analytical Macro and Micro Models.........................134
V Practical Applications of the WorkDiagnostics and Design.....................................................................................137Indoor Air Quality .............................................................................................138Smoke and Fire Spread......................................................................................145Durability (moisture) .........................................................................................154Comfort .............................................................................................................160Operating Cost (energy) ....................................................................................175
VI ConclusionsAir Pressure Control..........................................................................................180Design ...............................................................................................................182Diagnostics........................................................................................................183Analysis.............................................................................................................184Further Research................................................................................................186
References
Appendices
Toward an Understanding and Prediction of Air Flow in Buildings
vi
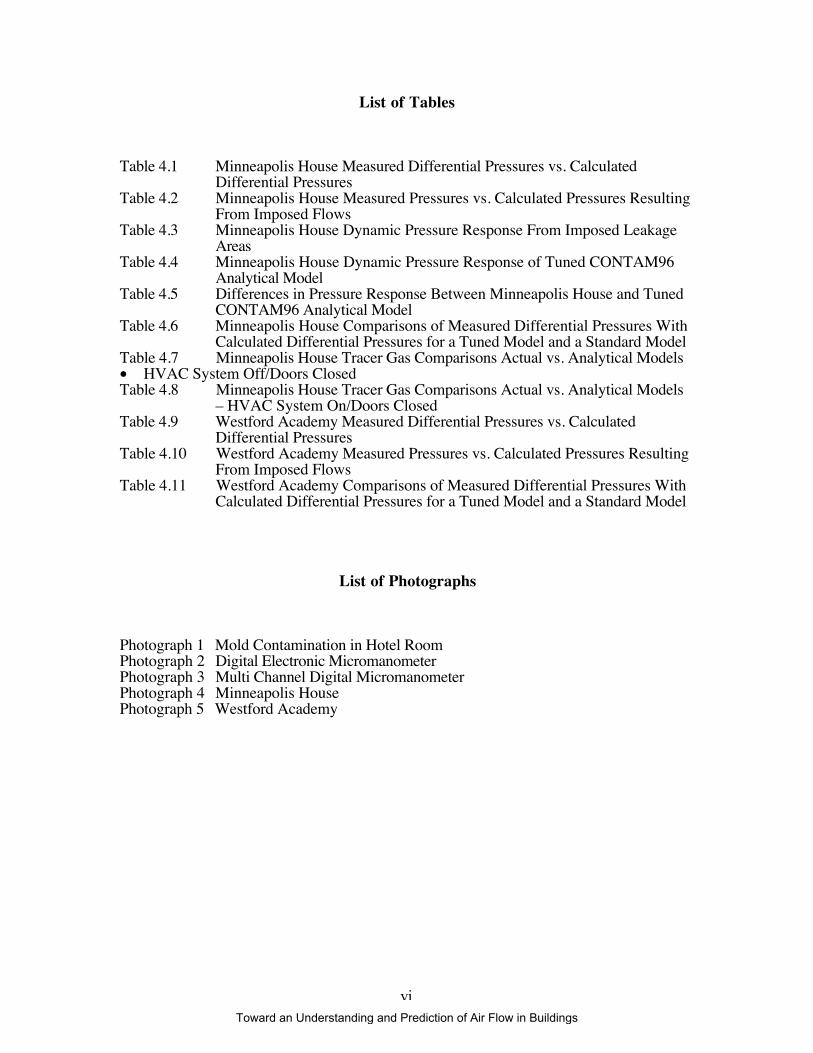
List of Tables
Table 4.1 Minneapolis House Measured Differential Pressures vs. CalculatedDifferential Pressures
Table 4.2 Minneapolis House Measured Pressures vs. Calculated Pressures ResultingFrom Imposed Flows
Table 4.3 Minneapolis House Dynamic Pressure Response From Imposed LeakageAreas
Table 4.4 Minneapolis House Dynamic Pressure Response of Tuned CONTAM96Analytical Model
Table 4.5 Differences in Pressure Response Between Minneapolis House and TunedCONTAM96 Analytical Model
Table 4.6 Minneapolis House Comparisons of Measured Differential Pressures WithCalculated Differential Pressures for a Tuned Model and a Standard Model
Table 4.7 Minneapolis House Tracer Gas Comparisons Actual vs. Analytical Models• HVAC System Off/Doors ClosedTable 4.8 Minneapolis House Tracer Gas Comparisons Actual vs. Analytical Models
– HVAC System On/Doors ClosedTable 4.9 Westford Academy Measured Differential Pressures vs. Calculated
Differential PressuresTable 4.10 Westford Academy Measured Pressures vs. Calculated Pressures Resulting
From Imposed FlowsTable 4.11 Westford Academy Comparisons of Measured Differential Pressures With
Calculated Differential Pressures for a Tuned Model and a Standard Model
List of Photographs
Photograph 1 Mold Contamination in Hotel RoomPhotograph 2 Digital Electronic MicromanometerPhotograph 3 Multi Channel Digital MicromanometerPhotograph 4 Minneapolis HousePhotograph 5 Westford Academy
Toward an Understanding and Prediction of Air Flow in Buildings
vii
List of Figures
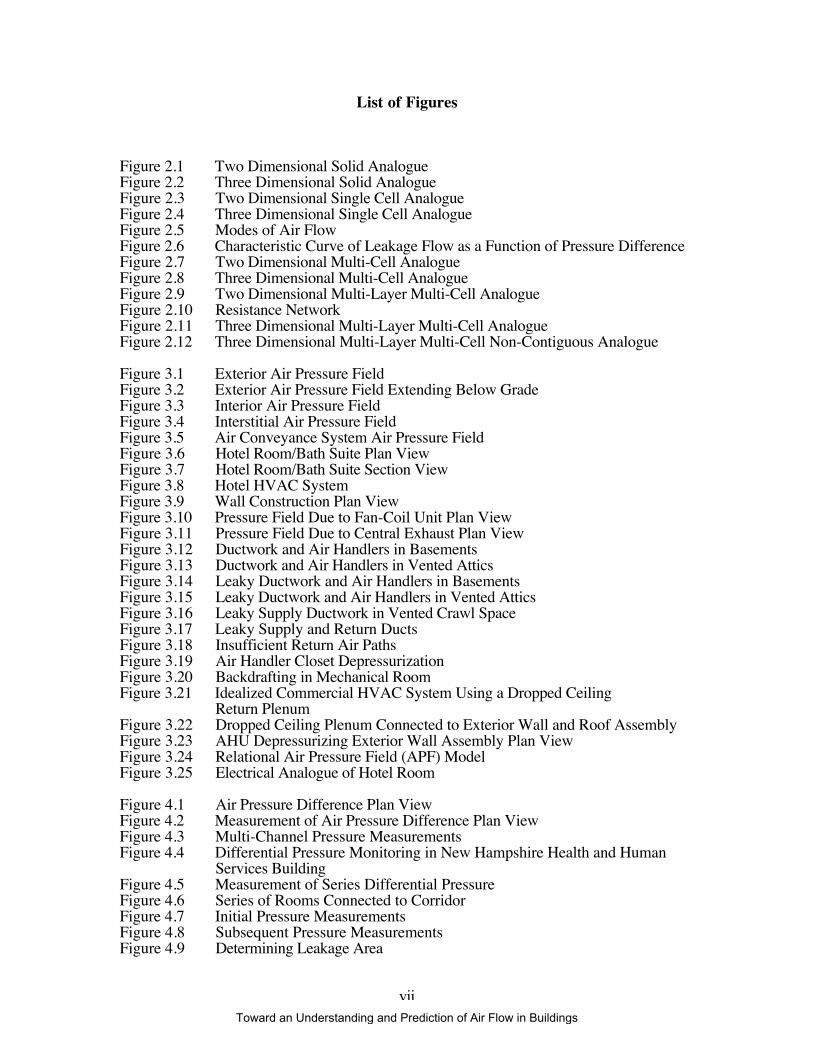
Figure 2.1 Two Dimensional Solid AnalogueFigure 2.2 Three Dimensional Solid AnalogueFigure 2.3 Two Dimensional Single Cell AnalogueFigure 2.4 Three Dimensional Single Cell AnalogueFigure 2.5 Modes of Air FlowFigure 2.6 Characteristic Curve of Leakage Flow as a Function of Pressure DifferenceFigure 2.7 Two Dimensional Multi-Cell AnalogueFigure 2.8 Three Dimensional Multi-Cell AnalogueFigure 2.9 Two Dimensional Multi-Layer Multi-Cell AnalogueFigure 2.10 Resistance NetworkFigure 2.11 Three Dimensional Multi-Layer Multi-Cell AnalogueFigure 2.12 Three Dimensional Multi-Layer Multi-Cell Non-Contiguous Analogue
Figure 3.1 Exterior Air Pressure FieldFigure 3.2 Exterior Air Pressure Field Extending Below GradeFigure 3.3 Interior Air Pressure FieldFigure 3.4 Interstitial Air Pressure FieldFigure 3.5 Air Conveyance System Air Pressure FieldFigure 3.6 Hotel Room/Bath Suite Plan ViewFigure 3.7 Hotel Room/Bath Suite Section ViewFigure 3.8 Hotel HVAC SystemFigure 3.9 Wall Construction Plan ViewFigure 3.10 Pressure Field Due to Fan-Coil Unit Plan ViewFigure 3.11 Pressure Field Due to Central Exhaust Plan ViewFigure 3.12 Ductwork and Air Handlers in BasementsFigure 3.13 Ductwork and Air Handlers in Vented AtticsFigure 3.14 Leaky Ductwork and Air Handlers in BasementsFigure 3.15 Leaky Ductwork and Air Handlers in Vented AtticsFigure 3.16 Leaky Supply Ductwork in Vented Crawl SpaceFigure 3.17 Leaky Supply and Return DuctsFigure 3.18 Insufficient Return Air PathsFigure 3.19 Air Handler Closet DepressurizationFigure 3.20 Backdrafting in Mechanical RoomFigure 3.21 Idealized Commercial HVAC System Using a Dropped Ceiling
Return PlenumFigure 3.22 Dropped Ceiling Plenum Connected to Exterior Wall and Roof AssemblyFigure 3.23 AHU Depressurizing Exterior Wall Assembly Plan ViewFigure 3.24 Relational Air Pressure Field (APF) ModelFigure 3.25 Electrical Analogue of Hotel Room
Figure 4.1 Air Pressure Difference Plan ViewFigure 4.2 Measurement of Air Pressure Difference Plan ViewFigure 4.3 Multi-Channel Pressure MeasurementsFigure 4.4 Differential Pressure Monitoring in New Hampshire Health and Human
Services BuildingFigure 4.5 Measurement of Series Differential PressureFigure 4.6 Series of Rooms Connected to CorridorFigure 4.7 Initial Pressure MeasurementsFigure 4.8 Subsequent Pressure MeasurementsFigure 4.9 Determining Leakage Area
Toward an Understanding and Prediction of Air Flow in Buildings
viii
Figure 4.10 Minneapolis House Floor PlanFigure 4.11 Minneapolis House Six Zone Relational ModelFigure 4.12 Representative Exterior Air PressuresFigure 4.13 Minneapolis House Building Leakage CurveFigure 4.14 Minneapolis House Measured Differential Pressures Due to Perturbation by
Adding a Flow of Known MagnitudeFigure 4.15 Minneapolis House Measured Differential PressuresFigure 4.16 Minneapolis House Calculated Differential PressuresFigure 4.17 Minneapolis House Measured Pressures Resulting From Imposed FlowsFigure 4.18 Minneapolis House Calculated Pressures Resulting From Imposed FlowsFigure 4.19 NW Bedroom Window Pressure Response IFigure 4.20 NW Bedroom Window Pressure Response IIFigure 4.21 NW Bedroom Window Flow ResponseFigure 4.22 SW Bedroom Window Pressure Response IFigure 4.23 SW Bedroom Window Pressure Response IIFigure 4.24 SW Bedroom Window Flow ResponseFigure 4.25 SE Bedroom Window Pressure Response IFigure 4.26 SE Bedroom Window Pressure Response IIFigure 4.27 SE Bedroom Window Flow ResponseFigure 4.28 NE Bedroom Window Pressure Response IFigure 4.29 NE Bedroom Window Pressure Response IIFigure 4.30 NE Bedroom Window Flow ResponseFigure 4.31 Minneapolis House Standard CONTAM96 Analytical ModelFigure 4.32 Minneapolis House Tracer Gas Results – HVAC System Off/Doors
ClosedFigure 4.33 Minneapolis House Tuned CONTAM96 Analytical Model Prediction of
Tracer Gas Results – HVAC System Off/Doors ClosedFigure 4.34 Minneapolis House Standard CONTAM96 Analytical Model Prediction of
Tracer Gas Results – HVAC System Off/Doors ClosedFigure 4.35 Minneapolis House Tracer Gas Results – HVAC System On/Doors ClosedFigure 4.36 Minneapolis House Tuned CONTAM96 Analytical Model Tracer Gas
Results – HVAC System On/Doors ClosedFigure 4.37 Minneapolis House Standard CONTAM96 Analytical Model Prediction of
Tracer Gas Results – HVAC System On/Doors ClosedFigure 4.38 Westford Academy Floor PlanFigure 4.39 Westford Academy Five Zone Relational ModelFigure 4.40 Westford Academy Building Leakage CurveFigure 4.41 Westford Academy Measured Differential PressuresFigure 4.42 Westford Academy Calculated Differential PressuresFigure 4.43 Westford Academy Measured Pressures Resulting From Imposed FlowsFigure 4.44 Westford Academy Calculated Pressures Resulting From Imposed FlowsFigure 4.45 Westford Academy Measured Pressure Response of Opening/Closing
WindowsFigure 4.46 Westford Academy Measured Pressure Response of Opening/Closing
DoorsFigure 4.47 Westford Academy Calculated Pressure Response of Opening/Closing
WindowsFigure 4.48 Westford Academy Calculated Pressure Response of Opening/Closing
Windows on Adjacent SpacesFigure 4.49 Westford Academy Calculated Pressure Response of Opening/Closing
Doors on Adjacent SpacesFigure 4.50 Westford Academy Calculated Differential Pressures Standard
CONTAM96 Analytical ModelFigure 4.51 Westford Academy Tracer Gas Results
Toward an Understanding and Prediction of Air Flow in Buildings
ix
Figure 4.52 Westford Academy Tuned CONTAM96 Analytical Model Prediction ofTracer Gas Results
Figure 4.53 Westford Academy Standard CONTAM96 Analytical Model Prediction ofTracer Gas Results
Figure 5.1 Problem Pressure RelationshipFigure 5.2 Moisture MovementFigure 5.3 Ground Cover InstallationFigure 5.4 New Air Pressure RelationshipFigure 5.5 HVAC System For HotelFigure 5.6 Air Leakage Test ZonesFigure 5.7 New Air Pressure RelationshipsFigure 5.8 Supply Air Approach Plan ViewFigure 5.9 Smoke Extraction SystemFigure 5.10 HVAC System As DesignedFigure 5.11 Unintended Pressurization of Interstitial CavityFigure 5.12 Modified Pressure RelationshipFigure 5.13 Well-Defined Pressure BoundaryFigure 5.14 Poorly-Defined Pressure BoundaryFigure 5.15 Tight Rim ClosureFigure 5.16 Leaky Rim ClosureFigure 5.17 Pressure Boundary at Interior FloorFigure 5.18 Wind Tunnel EffectFigure 5.19 Supply Duct LeakageFigure 5.20 Return Duct LeakageFigure 5.21 Combined Floor Paths and Pressure DriversFigure 5.22 Unvented-Conditioned Attic
Figure 6.1 Compartmentalized Dropped CeilingFigure 6.2 Elimination of Dropped Ceiling Return PlenumsFigure 6.3 “Bleeding” Air Pressure Fields
List of Appendices
A Tuned CONTAM96 Analytical Model – Minneapolis HouseB Standard CONTAM96 Analytical Model – Minneapolis HouseC Tuned CONTAM96 Analytical Model – Westford AcademyD Standard CONTAM96 Analytical Model – Westford Academy
Toward an Understanding and Prediction of Air Flow in Buildings
x
Nomenclature
A = area (m2)
AE = leakage area across exterior of wall assembly (m2)
AI = leakage area across interior of wall assembly (m2)
Aκ = leakage area of known magnitude (m2)
Aij = leakage area (m2)
Al = air leakage area (m2)
Aw = wall or floor area (m2)
C = leakage coefficient
CD = discharge coefficient
CE = discharge coefficient for exterior of wall assembly
CI = discharge coefficient for interior of wall assembly
Ck = flow coefficient
CM = material constant
Co = fluid resistance coefficient
k = coefficient
n = flow exponent
P = static pressure (Pa)
ΔP = pressure difference (Pa)
ΔPE = pressure difference across exterior of wall assembly (Pa)
ΔPI = pressure difference across interior of wall assembly (Pa)
Pt = total pressure (Pa)
Pv = velocity pressure (Pa)
ΔPij = pressure difference (Pa)
Q = flow rate (L/s)
Rn = leakage area – electrical analogue
Rin = pressure ratio
Vij = pressure difference – electrical analogue
x = direction of flow
Greek
β = exponent in leakage function
μ = mean velocity (m/s)
ρ = density of air (kg/m3)
Toward an Understanding and Prediction of Air Flow in Buildings

xi
Outline of Thesis
The introductory chapter presents the context of the work to the field of building
physics. This section provides a summary of the entire thesis. It is followed by a
discussion on the basis of the thesis research. This section outlines the complexity of
modern building assemblies and the resulting three dimensional air flow pathways and an
introduction to interstitial air pressure fields.
Chapter II – Air Flow in Buildings contains a critical review of the literature and
places it in the context of complex three dimensional air flow networks. The chapter ends in
outlining the problem statement. The problem statement sets the stage for the rest of the
thesis by arguing the need for alternative analysis approaches.
Chapter III – Air Pressure in Buildings defines the building air pressure field and
through the use of examples illustrates the dynamic interaction of the component air
pressure fields. HVAC system effects are presented leading to the development of a
relational air pressure field model for buildings. The concept of applying the relational
model and pressure measurements to existing analytical models in order to tune or calibrate
them is introduced.
Chapter IV – Air Pressure Response provides a discussion on the techniques of
measuring building air pressure fields and presents experimental work supporting the
inverse method of using pressures as inputs rather than leakage areas with existing building
analytical models. The experimental work involves a recently constructed detached single
family residence and a 25 year old school facility. The chapter ends with a discussion of
boundary conditions for the analytical models and the range of applicability of the models.
Chapter V – Practical Applications of the Work presents five case studies
illustrating the impact of the work on indoor air quality, smoke and fire spread, durability
(moisture), comfort and operating cost (energy).
Chapter VI – Conclusions summarizes the work in the context of air pressure control,
design, diagnostics and analysis. Future research is also discussed.
Toward an Understanding and Prediction of Air Flow in Buildings

1
I Introduction
Toward an Understanding and Prediction of Air Flow in Buildings
2
Context of the Work to Building Physics
Air flow in buildings is a complex flow and pressure distribution problem that
makes quantification difficult. However, certain parameters have recently become easy to
quantify - specifically the air pressure relationships within buildings. These air pressure
relationships can be used to develop relational models of the building or portion of the
building system under analysis. From these relational models existing analytical models
can be “tuned” or calibrated. The sensitivity and complexity of the analytical models are
determined by the nature of the problem being studied. For example, the degree of
precision can be made to vary between scientific research and engineering practice.
The measured building air pressure field can be used with network analysis to solve
the building flow and leakage regime creating an analytical macro model of the building
flow and leakage regime. The response of the analytical model can be further tuned by
perturbing both the building air pressure field and the analytical model. However, network
analysis and perturbation cannot be used to solve the interstitial flow, pressure and leakage
regime. Network analysis and perturbation may suggest that such flows exist, but the
complexity and workmanship dependence of the interstitial flow, pressure and leakage
regime requires direct measurement. In other words, at present, the boundary conditions of
the interstitial regime can be defined analytically using the methods outlined in this thesis
(the boundary conditions being the building flow, pressure and leakage regime), but the
pressures and flows within the interstitial spaces cannot be predicted with certainty using
analytical means.
Analytical micro models of interstitial assemblies can be developed and tuned or
calibrated by direct field measurements of interstitial air pressures and flows. The micro
models can be expanded or incorporated into analytical macro models that address the entire
building flow and leakage regime. The effect of the micro flows or interstitial regime on the
general building regime can be modeled. In other words it is possible to go from the small
to the large analytically. However, it does not appear to be possible to go in the other
direction. It does not appear to be possible to generalize the interstitial regimes. They are
often purely a local phenomena.
The macro and micro models can both be used in parametric studies to determine
the relative significance of a particular factor. Both can be used to determine the effects of
flows and pressures. However, both types of models are limited in the extent of their
analysis as described above.
Design and diagnostic techniques can be used to avoid problems or to understand
problems within the limits of the analysis approach. Design, through an understanding of
Toward an Understanding and Prediction of Air Flow in Buildings
3
the relational models, can be used to eliminate, control and understand the development and
effects of interstitial air pressure fields and flows. If interstitial air pressure fields are
eliminated or conversely deliberately created, expending effort predicting their presence or
magnitude becomes unnecessary. In other words, the issue can be designed away. With
respect to diagnostics, the interstitial air pressure fields can be measured directly. If they are
measured directly predicting their presence or magnitude becomes unnecessary. The key to
building design and building analysis is knowing what the critical design issues are or what
critical parameters need to be measured.
The current design, construction and analysis process addressing air flow in
buildings is largely based on tradition and past experience. Hutcheon (1971) observed:
"Tradition has a great weakness in that it deals only with a way of doing something, without
any contribution to understanding of why the traditional method works. This being so, it is
usually not possible to identify the important factors either in the situation being served or
in the arrangement of the solution provided." Hutcheon (1971) concluded: “Rational
design is possible only when there is a capability to establish, each time a choice is made,
the probability of a particular result." Hutcheon was pointing out the necessity of reducing
uncertainty in building performance — the need to establish the probable consequences of
design decisions on building performance.
The focus of this thesis is on the predictability and quantification of air flows, air
pressures and leakage relationships in buildings.
Toward an Understanding and Prediction of Air Flow in Buildings
4
Basis of Research
The understanding of air flow through and within buildings has assumed that wind
forces, thermal effects (stack action), and air movement associated with mechanical cooling,
heating and exhaust and other ventilation systems are the dominant factors relating to air
pressure relationships and air pressure related building performance.
In principle, this view is correct, though often too basic. Under this view, the wall
assemblies, roof assemblies, interior floors and demising walls/partitions are treated either
as monolithic or having through-the-assembly openings. Air flow has been assumed to
occur across these assemblies, from one side to the other based on the air pressure
difference across them, typically through simple leakage areas resulting in one dimensional
air flow.
Actually, exterior wall, roof, interior floor and interior wall/partition assemblies are
often hollow or multi-layered with numerous air gaps or void spaces and can operate under
air pressure regimes (fields) that are largely independent of the air pressures on either side
of them. Buildings also contain numerous service chases that provide complex three
dimensional linkage among the exterior wall, roof, interior floor and interior wall/partition
assembly cavities and void spaces. These interstitial air pressure fields within building
assemblies and their linkage to chases and service cavities can lead to lateral flow paths or
more intricate three dimensional flow paths that may or may not connect to the interior or
exterior spaces that the building assemblies separate.
As a result of these interstitial air pressure fields, direct cross assembly (one-
dimensional) air flow does not always hold. To account for the presence of interstitial air
pressure fields air flow must be added or subtracted within an assembly, chase or void
space. In this manner, continuity of mass and momentum holds across the volume of the
assembly or element.
The interstitial air pressure fields often vary with time with complex daily, weekly,
seasonal and sometimes random cycles. They are often, but not always, driven by fan
forces coupled with duct leakage. Thermal effects, moisture effects and wind forces can
also be interstitial air pressure field drivers depending on the linkages of interstitial flow
paths. These time variable interstitial air pressure fields help characterize the dynamic
characteristics of the pressure response of buildings.
The presence of complex, time dependent interstitial air pressure fields and
associated lateral or three dimensional flow paths can lead to complex interactions of the
building structure with the mechanical system and climate.
Toward an Understanding and Prediction of Air Flow in Buildings
5
One of the keys to understanding the complex interactions of the building structure
with the mechanical system and climate is the pressure response of buildings. Building
analysis typically focuses on flows and requires that all flow paths into and out of a control
volume be defined. The flow path resistances need to be characterized. Determining all air
flow paths and determining the flow path resistances directly, is difficult. As such, estimates
of these flow path resistance’s are commonly used. These estimates are based on limited
field data and laboratory measurements. The literature provides some component values
that vary by orders of magnitude and their application is often unable to predict building
flow fields (ASHRAE, 1997).
Standard building analysis develops the building pressure field from the flow field.
This thesis shows that developing the flow field from the building pressure field is more
powerful and permits accounting for interstitial air pressure fields and flows.
To this end this thesis changes the paradigm of analysis: developing the flow field,
the leakage areas and the flow relationships from the building pressure field. Determining
the characteristics of the building pressure field directly, is considerably easier than
determining flow path resistances.
Pressures can be used to predict direction of flows and to develop a relational
model. Knowing all the flow paths and their resistances is no longer necessary for most
engineering practice. It provides a powerful diagnostic tool for solving many of the
problems related to direct and indirect effects of air flows.
It also allows the closing of the gap between the mathematical sophistication of
available multi-cell air flow models and the necessary input information defining the
building boundary conditions. This approach allows the pressure response of the building
to be used to “tune” or calibrate the models extending their range of applicability and
accuracy.
Toward an Understanding and Prediction of Air Flow in Buildings

6
II Air Flow in Buildings
Toward an Understanding and Prediction of Air Flow in Buildings
7
Critical Review of the Literature
Controlling heat flow, air flow, moisture flow and solar and other radiation will
control the interactions among the physical elements of the building, its occupants and the
environment. Of these four, air flow “merits major consideration mainly because of its
influence on heat and moisture flow” (Hutcheon, 1953). Air flow carries moisture that
impacts a materials long-term performance (serviceability) and structural integrity
(durability). Air flow also affects building behavior in a fire (spread of smoke and other
toxic gases, supply of oxygen), indoor air quality (distribution of pollutants and location of
microbial reservoirs) and thermal energy use. The focus of this thesis is air flow in
buildings within this framework.
Historically speaking, the understanding of air flow in buildings may be illustrated
with a series of geometric analogues. The geometric analogues presented progress from the
simple to the more complex, from two dimensional to three dimensional, from solid to
hollow, and from single elements to multiple elements. The geometric analogues are
presented in conjunction with a corresponding more traditional visual analogue where
appropriate (Figures 2.1 through 2.11).
Two and Three Dimensional Solid Analogues
The first set of figures involve solid two dimensional and three dimensional objects
in a flow field (Figure 2.1 and Figure 2.2). They represent wind induced air flows around
buildings.
Wind induced air flows around buildings have been studied extensively (Davenport,
1960; Dalgliesh & Schriever, 1962; Davenport & Isyumov, 1967; Davenport & Hui,
1982; Lin, Surry & Inculet, 1995) over the past four decades in Canada and elsewhere.
The major focus of these studies has been wind induced structural loading, snow deposition
and drift formation and determining the extent of driving forces for rain leakage under wind
driven rain conditions. As a result, methods of determining peak wind loads and maximum
rain intensity conditions are well developed and accessible to designers and practitioners.
Two and Three Dimensional Single Cell Analogues
The next set of figures involve hollow two dimensional and three dimensional
objects (Figure 2.3 and Figure 2.4). These figures represent two different types of analysis.
In the first type of analysis, buildings are placed in a flow field and internal wind induced
pressures are developed from surface pressures and building envelope leakage areas. This
approach is a logical extension of the study of solid two dimensional and three dimensional
Toward an Understanding and Prediction of Air Flow in Buildings

8
objects in a flow field. Wind induced internal pressures are commonly studied in this
manner (Stathopoulos, Surry & Davenport, 1979; Dalgliesh, 1981).
In the second type of analysis, building envelope leakage areas are determined by
inducing interior to exterior pressure differences under controlled supply or exhaust flow
conditions and using the envelope leakage areas to develop air change relationships from
stack effect, mechanical system and wind drivers. This type of analysis has been the focus
of major international effort over the past 30 years and may be considered standard for air
flow analysis of building envelopes.
This traditional air flow analysis based on the measurement of building envelope
leakage areas relies on two basic flow relationships to describe resulting air flows: flow
through orifices and flow through porous media. These relationships are sometimes
referred to as “channel flow” and “diffuse flow” respectively (Lux & Brown, 1986). In
the two extremes they are referred to as turbulent (flow dominated by inertial effects) and
laminar (flow dominated by viscosity effects).
In channel flow and flow through orifices, Bernoulli’s equation is used to develop
the basic flow relationship where the rate of flow is proportional to the square root of the
pressure difference which is characteristic of turbulent flow (Currie, 1974):
Q = A CD [ 2/ρ (Δp) ]1/2 (2 - 1)
where Q = flow rateA = area
CD = discharge coefficientρ = density of air
Δp = pressure difference
Darcy’s Law (equation 2 - 2) can be used to describe the basic flow relationship
through porous media where the rate of flow of a fluid through a porous material is
proportional to the pressure differential (Currie, 1974):
μ = - CM ∂p / ∂x (2 - 2)
where μ = mean velocity∂p / ∂x = pressure gradient
CM = a material constantx = direction of flow
Toward an Understanding and Prediction of Air Flow in Buildings
9
The relationship between leakage and pressure in Darcy flow is linear, which is
characteristic of laminar flow. Equation 2-2 can be expressed as a linear function of
pressure difference (Isaacs & Mills, 1980):
Q = f (Δp) = k(Δp) (2 - 3)
where k = Ck ρ / μ
and where k = coefficient of permeability
Ck = flow coefficientμ = viscosityρ = density
The value of k depends on the path through the material. It is determined
experimentally as it is difficult to predict a value appropriate to a particular set of conditions.
Materials and assemblies are not often homogeneous and rarely exhibit uniform
flow characteristics across them. Kronval (1980) and Bumbaru, Jutras and Patenaude
(1988) argued that the mode of air flow through a material may be either laminar, turbulent
or a combination of both and that the mode may change from laminar to turbulent at several
locations within it. They also noted the further complexity of entrance and exit effects.
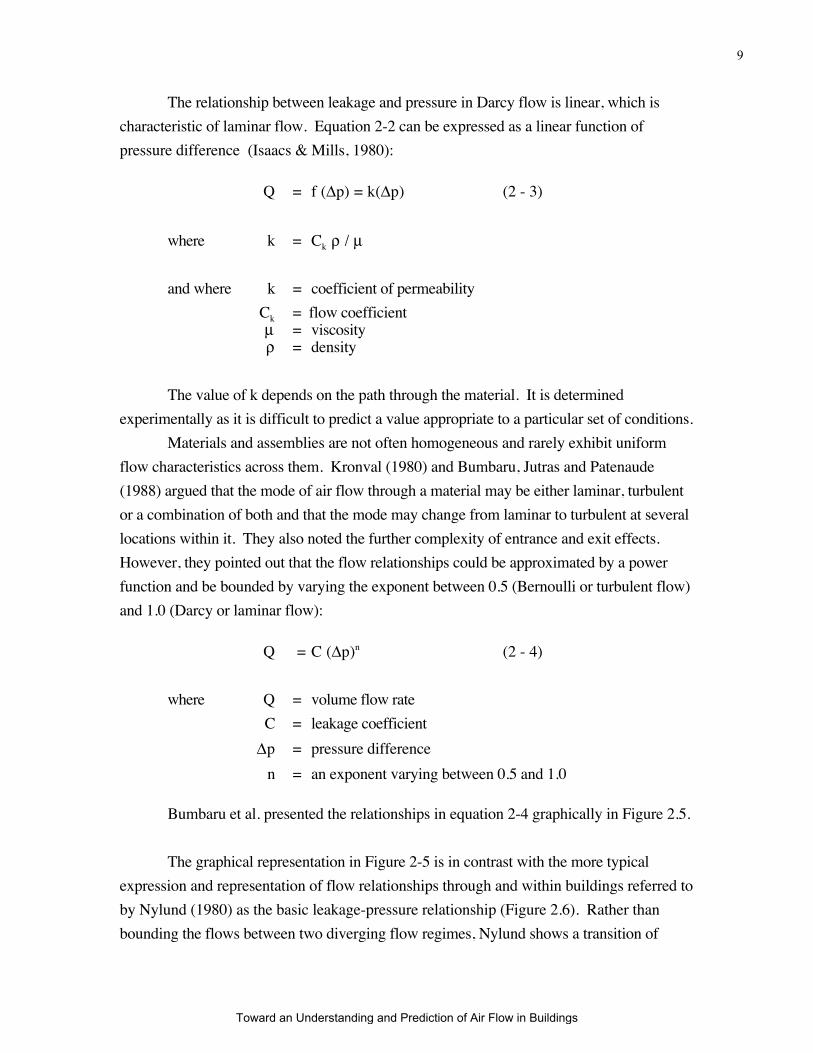
However, they pointed out that the flow relationships could be approximated by a power
function and be bounded by varying the exponent between 0.5 (Bernoulli or turbulent flow)
and 1.0 (Darcy or laminar flow):
Q = C (Δp)n (2 - 4)
where Q = volume flow rate
C = leakage coefficient
Δp = pressure difference
n = an exponent varying between 0.5 and 1.0
Bumbaru et al. presented the relationships in equation 2-4 graphically in Figure 2.5.
The graphical representation in Figure 2-5 is in contrast with the more typical
expression and representation of flow relationships through and within buildings referred to
by Nylund (1980) as the basic leakage-pressure relationship (Figure 2.6). Rather than
bounding the flows between two diverging flow regimes, Nylund shows a transition of
Toward an Understanding and Prediction of Air Flow in Buildings
10
flows from laminar to turbulent. Although Bumbaru et al. were concerned with the flow
characteristics of individual materials and Nylund was concerned with the entire building
envelope, Kronvall (1980) showed that both views are complimentary.
The complexity of the flow regime across the building assembly was addressed by
Kronvall and others (Tamura & Wilson, 1964; Stricker, 1975) by experimentally
determining total flows through or within a building at a range of externally imposed
controlled pressure differentials and utilizing equation 2-4. Curve fitting was then used to
determine the variation of the exponent over the range of pressures.
Nylund and Kronvall both noted that the field work on pressurization of houses
yielded leakage curves whose shape varied from house to house but were all bounded by a
parabolic curve on the one hand (n = 0.5) and a straight line on the other (n = 1.0).
However, Kronvall warned against concluding that the extremes were either complete
turbulent flows or complete laminar flows. He pointed out that entrance and exit pressure
losses were also a function of the square of the velocity.
Sherman and Grimsrud and others extended this approach of the measurement of
the flow-pressure-leakage area relationship to develop infiltration or air change models for
energy analysis (Grimsrud, Sherman, Diamond, Condon & Rosenfeld, 1979; Sherman &
Grimsrud, 1980; Persily & Linteris, 1983; Sherman, 1987). This extended approach
proved to be attractive and useful for predicting long term average values for energy usage
and infiltration on an order of magnitude basis in homes without forced air heating and
cooling systems. Excellent agreement is reported between predicted and measured air flows
for a recently developed single zone model (no interior rooms, doors, single story, no forced
air heating or cooling systems) that considers wind, stack and flue effects (Walker and
Wilson, 1998).
Unfortunately, the approach has been found to be unsuitable for homes with forced
air heating and cooling systems as it does not permit accounting for the changes in interior
air pressure regimes arising from duct leakage, interior door closure and the effect of
interior partition and floor system compartmentalization (Timusk, 1983; Seskus & Rinella,
1983; Cummings & Tooley, 1988; Cummings & Tooley, 1989; Cummings, Tooley &
Moyer, 1990). Significant work on incorporating duct leakage factors into the Sherman-
Grimsrud model has recently been done, though with partial success (Palmiter & Bond,
1991; Palmiter, Brown & Bond, 1991; Palmiter, Bond & Sherman, 1991).
Two and Three Dimensional Multi-Cell Analogues
Toward an Understanding and Prediction of Air Flow in Buildings
11
The work discussed to this point has remained focused on a view implied by Figure
2.3 and Figure 2.4. This view represents a single cell air flow model and analysis. The
single cell approach can logically be extended to multi-cell analysis as shown in Figure 2.7
and Figure 2.8.
In multi-cell analysis calculations become tedious and complex and reliance on the
computational power of computers is necessary. The air flow fields are solved by
representing the building and its elements as an analogous electrical network and using an
iterative process to calculate pressure differences and resulting flow rates across all of the
assembly elements until a certain convergence criterion is met. This approach is the basis of
development of multi-cell air flow models used in whole building air flow analysis (Tamura,
1969; Liddament & Allen, 1983; Klote, 1985; Axley & Grot, 1989; Walton, 1989;
Walton, 1997; Feustel, 1998).
In multi-cell models used in the study of smoke movement or in determining the
transport and dispersion of indoor air contaminants, buildings are represented by a network
of spaces or nodes. Steady-state air flows and pressures throughout the building are
calculated by solving the air flow network analog. The inputs are the stack effect, the
mechanical system air flows and flow leakage areas. The outputs are air flows and
pressures. Flows are considered linear functions of pressure difference (Darcy flow) to
ease calculation and allow the use of matrix mathematics. A few multi-cell models such as
CONTAM96 and COMIS use the power law relationship for flows and pressures. They
can also be used to calculate wind induced pressures on building surfaces and their
subsequent impact on the air flow network analogue (Walton, 1997; Feustel, 1998)
Feustel (1998) called for improved definition of the variables critical for different
building types to develop more accurate input data and, ultimately more accurate models.
He identified wind pressure coefficients as a critical factor that needed further study and
data on building assembly leakage as another. This was in apparent response to the
common divergence of results obtained from modeling compared to those obtained from
field measurements.
Multi-cell models require the user to input detailed information relating to building
construction assembly leakage. This information is difficult to establish. Flow leakage
areas of large openings such as open doors, corridors and open windows can be measured
and input accurately. However, leakage areas across interior and exterior wall, floor and
roof assemblies are usually estimated in a crude manner. Component building flow leakage
areas vary so significantly from building to building due to workmanship that
generalizations may not be possible. The 1997 ASHRAE Fundamentals Handbook lists
Toward an Understanding and Prediction of Air Flow in Buildings
12
effective leakage areas of components that vary by orders of magnitude within individual
categories (ASHRAE, 1997).
Measuring leakage areas is further complicated as they may change with time.
There are seasonal effects due to thermal and moisture content induced dimensional
changes. Luck & Nelson (1965) examined the variation of infiltration rate with relative
humidity in frame buildings. There are also longer term effects as the building and
components age. Some effects are gradual and caused by the building wear. Some effects
can be abrupt such as where an element or component fails.
It is argued here that the level of detailed input information relating to building
construction assembly leakage that multi-cell models require is impossible to obtain with
field measurements except for the most basic of building constructions. Fixing leakage
areas in multi-cell modeling is presently an “art” based on the best guess of the modeler,
rather than a “science” based on field measurement or observation.
The models also require the user to input detailed information describing mechanical
systems in the building. Supply and exhaust flows from mechanical systems can be readily
determined and input accurately. However, mechanical system characteristics may change
with time. Filter resistance changes with time, filters clog, belts and fans wear.
In most models, mechanical system duct leakage is not considered. Even if existing
models were modified to account for mechanical system duct leakage, reliable input data is
difficult to obtain due to testing limitations imposed by lack of sensitivity and repeatability
from pitot tube or hot-wire anemometer traverses and flow hood cumulative error
(Lstiburek, 1993).
Thus, it can be argued here, that the difficulties in determining the detailed
information relating to mechanical systems in buildings that multi-cell models require, is
similar to the difficulties in obtaining building construction assembly leakage areas. Once
again, “art” on behalf of the modeler is required.
Two Dimensional Multi-Layer and Multi-Cell Analogues
So far the geometric figures and their corresponding visual analogues have viewed
building envelope and interior demising walls and floors as monolithic or homogenous
entities with straight-through-the-assembly openings. Real buildings and their components
are rarely constructed from homogenous assemblies. Most assemblies are constructed
from different materials and often contain interstitial cavities. This leads to complex flow
regimes across assemblies. The geometric figure and its corresponding visual analogue
presented in Figure 2.9 are representative of such common multi-element, layered, hollow
construction for walls, floors and roofs.
Toward an Understanding and Prediction of Air Flow in Buildings
13
The multi-layered complexity of building assemblies was recognized by Nylund
(1966) who described the total flow through a building, within a building or through an
assembly as a complex combination of Darcy and Bernoulli flows in series and parallel
flow combinations. He further postulated that the combination of flows through a building
can be modeled by a resistance network of series and parallel flows (Figure 2.10). Nylund
(1980) proposed a graphical solution based on a knowledge of the flow-pressure drops
characteristic of each component. In Nylund’s graphical solution, the pressures or driving
forces were first summed and the flows then calculated to take into account the non-linearity
of the leakage flows as a function of pressure difference.
Nylund’s graphical solution was extended to complex networks describing building
assemblies using numerical methods based on analogous work in electrical circuits and
electrical admittance (Kronvall, 1980). Kronvall defined air admittance as the inverse of the
resistance to air flow of a material or assembly.
Kronvall explored flow paths and flow regimes present in building assemblies and
described them as a complicated network of flows through small openings, flows in ducts or
interstices and flows in permeable materials.
Kronvall was also concerned with the conditions of transition between laminar and
turbulent flow and their dependence on the surface roughness properties of the assembly
components. Kronvall (1980) pointed out the lack of tabulated surface roughness factors in
the literature (except for flow in ducts and pipes) and subsequently experimentally
determined the surface roughness factors for different building materials.
Bumbaru et al. (1988) tested 36 different materials determining air permeance using
a method similar to the one developed by Bomberg and Kumaran (1985). They defined the
resistance to air flow provided by a material as the reciprocal of the air permeance making
air permeance analogous to Kronvall’s air admittance. They found the air permeance varied
for individual material samples as much as 30 to 50 percent from the average permeance due
to the inhomogeneity of the materials tested. However, applying equation 2-4 and curve
fitting, they found that the exponent varied between 0.95 to 1.0 and concluded that the flows
through the materials were mostly laminar. Based on the laminar flow characteristics of the
materials tested, they proposed that air permeance values could be predicted for composite
materials using simple series or parallel air flow calculations analogous to simple series or
parallel heat gain and heat loss calculations.
Unlike the work by Bumbaru et al. (1988) that provides experimentally determined
air permeance values for various building materials, Kronvall (1980) did not publish
experimentally determined air permeance/admittance values validating his network based
Toward an Understanding and Prediction of Air Flow in Buildings
14
numerical methods solutions to full building assemblies, although the approach appears
computationally sound.
Lawton & Quirouette (1991) experimentally determined the air permeance values of
critical building assembly details in residential wood frame construction constructed using
three different construction methods. Twelve different assemblies were tested. No attempt
at comparing the experimentally determined air permeance values with a predictive
computational model such as the Kronvall model was made.
The necessity of predetermining all the flow paths and the difficulty in providing all
the input values relating to material flow characteristics severely limits the use of such
network based numerical air flow models for building assemblies as in the multi-cell
models. Where building assemblies are concerned, most researchers are finding it easier to
build full scale assemblies and test them empirically rather than attempt to model them
numerically.
The graphical, numerical and multi-cell methods for both assemblies and entire
buildings considered to this point are based on a "flow-through" mass balance and an
assumption that the air pressure profile and flows into and through the building are
dependent only on the pressure difference across an assembly. This view holds that
pressure differences in and around buildings are caused by wind, air density differences due
to temperature differences between the interior and exterior (stack effect), the operation of
air consuming devices such as chimneys, and forced-air thermal distribution systems
(Wilson, 1961).
Additionally, this view holds that the pressure difference at a location depends on the
magnitude of these driving mechanisms as well as the characteristics of the openings in the
building envelope (ASHRAE, 1997).
Recent field work only partly supports this view. Work on validation of multi-cell,
network based models has been proceeding with limited success. The most promising
results pertain to network smoke control models. Recent tests (Said, 1991) in an
experimental 10-story fire tower at the National Fire Laboratory of the National Research
Council of Canada show good agreement between measured data and predicted data.
However, the air pressure drivers occurring under fire conditions are one to two orders of
magnitude greater than the air pressure drivers existing under typical operating conditions
and it can be argued that extrapolation of fire test results to normal operating air pressure
conditions may not be possible. A further limitation of the results arises when the
homogeneous nature of the wall and floor assemblies (concrete) that comprise the test fire
tower is considered coupled with the lack of service chases, mechanical systems and
associated ductwork.
Toward an Understanding and Prediction of Air Flow in Buildings
15
A recent survey of airflow models for multi-zone structures (Feustel & Dieris,
1992) revealed the existence of over 50 multi-zone air flow models. Feustel & Dieris
pointed out that although the mathematical sophistication of the various models was
impressive, significant work was required on validation of the models under normal
operating conditions and recommended the construction of test buildings in which model
input parameters could be varied in a controlled manner.
The previous argument relating to the inability to accurately specify building
construction assembly leakage and mechanical system leakage for use in multi-cell
modeling, is extended here to a more general argument that the sophistication of the air flow
models for multi-zone structures far exceeds the sophistication (accuracy) of the inputs or
boundary conditions necessary to run the models.
All of the models use similar flow equations for crack flow and are based on the
assumption of flow-through mass balance or straight-through the assembly air flow.
However, the assumption of flow-through mass balance can be argued by adding or
subtracting air flows to the network at intermediate locations such as building interstitial
cavities.
Field work indicates air flows into and out of interstitial cavities caused by the
leakage of mechanical systems can significantly affect air pressures and building
performance questioning the assumption of flow-through mass balance (Harrje, Gadsby &
Cromer, 1986; Nelson et al. 1986; Tooley & Moyer, 1988; Lstiburek, 1989; Lstiburek,
1992; Lstiburek, 1993).
Adding or subtracting air flows to the network at intermediate locations can occur
with leakage of supply or return systems into or out of interstitial cavities. Supply duct
leakage adds air to interstitial cavities leading to pressurization effects. Return duct leakage
subtracts air from interstitial cavities leading to depressurization effects. Nelson observed
pressurization of floor cavities from supply duct leakage in his infra-red thermography
studies of Minnesota houses (Nelson, 1982). Depressurization of floor cavities in houses
was reported by Harrje, Gadsby & Cromer due to return system leakage where building
cavities such as floor joists (panned floor joists) or stud bays were used as returns (Harrje,
Gadsby & Crommer, 1986).
Air flow patterns other than straight-through an assembly air flow have been known
to significantly affect building performance. Timusk et al. (1988) examined lateral air flow
or “wind washing” and its cooling effect on wood frame building enclosures. In this type
of air flow, air enters an assembly interstitial cavity from the exterior driven by wind effects,
flows laterally within the assembly and then exits the assembly, often to the exterior. The
Toward an Understanding and Prediction of Air Flow in Buildings

16
effect is most pronounced at exterior corners and at soffit assemblies where exterior walls
intersect insulated roofs/ceilings.
Burnett & Straube (1995) showed that air flow in the plane of the wall within the
interstitial air cavities created by the construction of veneer or screened wall systems
significantly affects the moisture performance of the entire assembly. Burnett & Straube
identified not only wind effects as drivers for this air flow, but also identified thermal effects
and moisture buoyancy effects as air pressure drivers.
Average wind pressures on buildings have been shown to be low (Robinson &
Baker, 1975; Burnett & Straube, 1995) and are often of little interest to structural engineers
who have been concerned with the wind induced air flow research. Although peak wind
loading is a critical design component, as is maximum rain intensity, these values are not
representative of typical service life conditions and are usually not relevant for predicting
long term performance as it relates to durability and serviceability.
Burnett & Straube (1995) contend that average wind pressures on low rise buildings
can be expected to be on the order of 1 Pa with a typical range of 0.1 to 10 Pa. They further
concluded that temperature and moisture buoyancy effects, due to their effect on the density
of air, can be as significant as wind as drivers for air flow within screened exterior wall
cavities and indicated that combined driving pressures within vented cavities (wind,
temperature and moisture buoyancy) can be expected to be in the 0.5 to 2 Pa range.
The work by Burnett & Straube implies that small air pressure differences that act
for extended periods of time can have a major impact on building performance. Extending
the argument further, many of the previously ignored, or not studied, or not considered
factors that can produce air pressure effects in the 0.5 to 2 Pa range therefore may have a
significant effect on building performance.
As previously stated, a pressure difference across an assembly alone, where
interstitial pressures are not considered, is not enough to describe building performance.
The interstitial air pressures are usually small and until recently have been beyond
measurement. As a result they have not attracted much interest in the research community.
Three Dimensional Multi-Layer and Multi-Cell Analogues
Considering interstitial pressures requires a more complex view that considers three
dimensional flow paths and time dependent pressure drivers associated with mechanical
systems, wind, stack effects and moisture buoyancy effects even as small as 0.1 to 5 Pa.
Figure 2.11 represents this more complex view, extending the view illustrated in Figure 2.8
and Figure 2.9.
Toward an Understanding and Prediction of Air Flow in Buildings
17
Quirouette (1996), in his proposed cavity excitation method of testing rainscreen
wall and window systems, recognizes this more complex view. The cavity excitation method
determines the leakage characteristics of the pressure equalization chamber and relates them
to the volume of the chamber, the vent area and the stiffness of the air barrier system.
When service chases, interior and exterior soffits, complex architectural features and
non-simplistic massing are also considered, Figure 2.11 expands into the analogue
illustrated in Figure 2.12 where cell connections and interstitial cavity connections are no
longer contiguous. Individual cells are often connected to other cells and interstitial cavities,
n-cells distant in a manner best described as a three dimensional “snakes & ladders” game
with air pressure differentials playing the role of the dice.
Due to the complexity of modern buildings as described in Figure 2.12, air flows in
buildings, except within mechanical systems, are difficult to measure. Component leakage
areas for building assemblies and for mechanical systems are somewhat easier to measure
than air flows, but the limitations of the measurement procedures and the complexity of
modern buildings make them impractical to measure except for the most basic of building
constructions. However, current technology permits measuring even minute air pressure
differences easily.
Toward an Understanding and Prediction of Air Flow in Buildings
18
Toward an Understanding and Prediction of Air Flow in Buildings
19
Toward an Understanding and Prediction of Air Flow in Buildings
20
Toward an Understanding and Prediction of Air Flow in Buildings

21
Toward an Understanding and Prediction of Air Flow in Buildings
22
Toward an Understanding and Prediction of Air Flow in Buildings

23
Problem Statement
It is argued that real buildings are multi-layer building envelope assemblies with
numerous void spaces connected to service chases that result in complex three dimensional
flow paths that are often not contiguous. These flow paths are affected by mechanical
system leakage characteristics and operation not just by thermal effects, wind factors, and
mechanical system flows.
It is further argued that the existing analytical models used in building analysis are
limited in their application and their accuracy due to the level of detailed input information
relating to building construction assembly leakage and mechanical systems. The
sophistication of the air flow models for multi-zone buildings exceed the sophistication
(accuracy) of the boundary conditions necessary to run the models.
In order to address these issues an alternative approach is necessary. This
alternative approach still relies on existing analytical models, but uses them in an innovative
manner. First relational models of air flow in buildings need to be developed that recognize
the complexity of modern buildings. Second, current analytical models need to recognize
the limitations of the available information describing buildings and building assemblies or
they need to be modified to rely on new information that can readily be obtained within the
limits of available technology. Third, limits need to be established on the range of
applicability of both the relational models and analytic models.
It is believed that the key to addressing these issues is more completely
understanding the air pressure relationships in buildings. Recent advances in technology
have made measuring even minute air pressure relationships within buildings practical, low
cost and widely available. The applications and implications of these advances in
technology will now be addressed.
Toward an Understanding and Prediction of Air Flow in Buildings
24
III Air Pressure in Buildings
Toward an Understanding and Prediction of Air Flow in Buildings
25
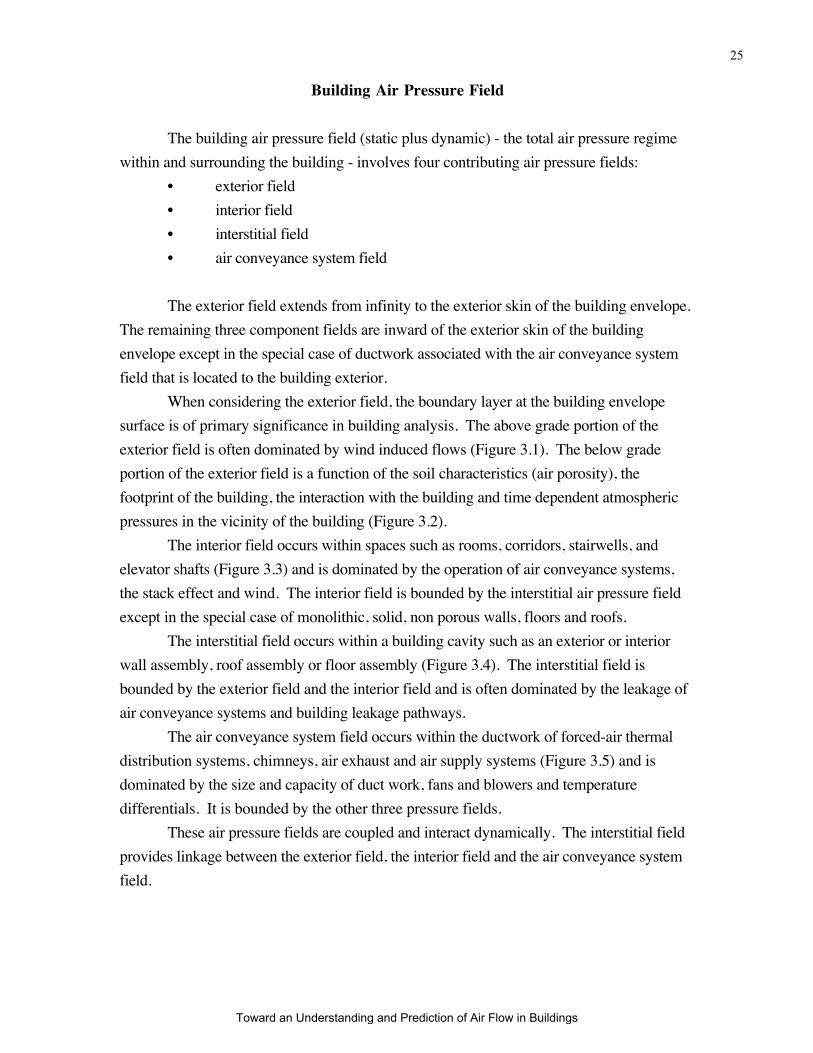
Building Air Pressure Field
The building air pressure field (static plus dynamic) - the total air pressure regime
within and surrounding the building - involves four contributing air pressure fields:
• exterior field
• interior field
• interstitial field
• air conveyance system field
The exterior field extends from infinity to the exterior skin of the building envelope.
The remaining three component fields are inward of the exterior skin of the building
envelope except in the special case of ductwork associated with the air conveyance system
field that is located to the building exterior.
When considering the exterior field, the boundary layer at the building envelope
surface is of primary significance in building analysis. The above grade portion of the
exterior field is often dominated by wind induced flows (Figure 3.1). The below grade
portion of the exterior field is a function of the soil characteristics (air porosity), the
footprint of the building, the interaction with the building and time dependent atmospheric
pressures in the vicinity of the building (Figure 3.2).
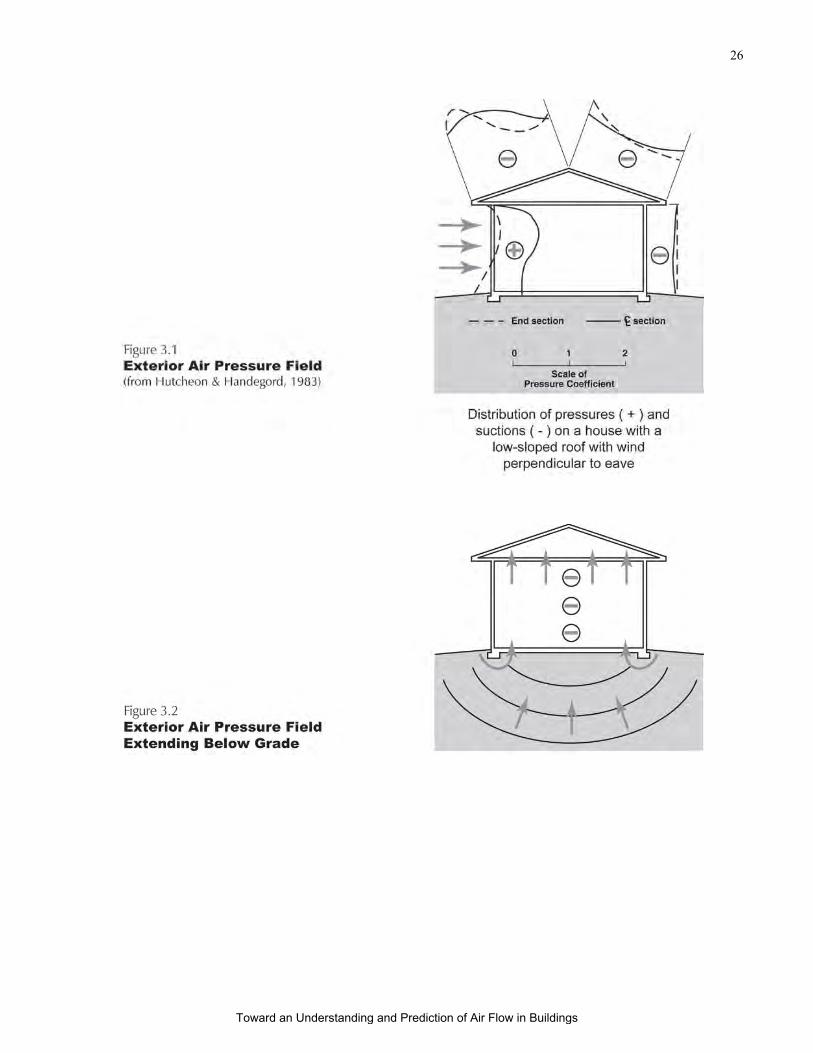
The interior field occurs within spaces such as rooms, corridors, stairwells, and
elevator shafts (Figure 3.3) and is dominated by the operation of air conveyance systems,
the stack effect and wind. The interior field is bounded by the interstitial air pressure field
except in the special case of monolithic, solid, non porous walls, floors and roofs.
The interstitial field occurs within a building cavity such as an exterior or interior
wall assembly, roof assembly or floor assembly (Figure 3.4). The interstitial field is
bounded by the exterior field and the interior field and is often dominated by the leakage of
air conveyance systems and building leakage pathways.
The air conveyance system field occurs within the ductwork of forced-air thermal
distribution systems, chimneys, air exhaust and air supply systems (Figure 3.5) and is
dominated by the size and capacity of duct work, fans and blowers and temperature
differentials. It is bounded by the other three pressure fields.
These air pressure fields are coupled and interact dynamically. The interstitial field
provides linkage between the exterior field, the interior field and the air conveyance system
field.
Toward an Understanding and Prediction of Air Flow in Buildings
26
Toward an Understanding and Prediction of Air Flow in Buildings
27
Toward an Understanding and Prediction of Air Flow in Buildings

28
Toward an Understanding and Prediction of Air Flow in Buildings

29
Dynamic Interaction of Component Fields
A hotel room/bathroom suite with an exhaust grill, a fan coil unit, corridor make-up
air and steel stud demising walls provides a good example of the dynamic interaction of the
component fields and the limitations of standard analysis (Figure 3.6).
As is common in hotel construction, a fan coil unit is suspended from the ceiling
and enclosed in a gypsum board dropped ceiling enclosure. The dropped ceiling enclosure
is designed as a return air plenum. The fan coil unit provides heating and cooling to the
hotel room by pulling air from the room through a return grill located at the underside of the
dropped ceiling enclosure, conditioning the air, and returning the air through a supply
register located in the face of the dropped ceiling enclosure. These units typically supply
1.75 to 2.5 kilowatts of heating and cooling and typically move approximately 100 to 150
L/s of air. Under conventional thinking, this fan coil unit only recirculates air and therefore
does not affect the air pressure relationships in the room (Figure 3.7).
Additionally, an exhaust grill is located in the bathroom of each hotel room suite.
This exhaust grill is connected to a central exhaust duct extending to a roof top exhaust fan.
The roof top exhaust fan often serves several hotel room suites via the central exhaust duct.
This exhaust fan often runs continuously, although in some facilities, timer controlled
operation occurs. Air which is exhausted from the hotel room/bathroom suite by this
exhaust fan is intended to be replaced with make-up air supplied from the corridor. The
main HVAC system commonly supplies sufficient conditioned make-up air to the corridor
to supply all of the hotel room suites served by the corridor. Make-up air from the corridor
is intended to enter the hotel rooms by passing under the door between the room and the
corridor. This door is undercut to provide passage of air from the corridor to the room
(Figure 3.8).
Design Intent
The design intent usually calls for the hotel room to be pressurized relative to the
exterior to control infiltrating hot, humid air during cooling periods, exclude exterior
pollutants and minimize drafts during heating periods. Standard practice calls for supplying
approximately 15 percent more air to a room than is exhausted to accomplish this. For
example, if the exhaust flow out of the bathroom is 25 L/s, the design make-up air to be
supplied to the hotel room/bathroom suite through the door undercut is approximately 29
L/s.
Typical Problem and Standard Analysis
Photograph 1 illustrates an increasingly common problem of mold contamination of
demising wall assemblies associated with buildings constructed as described in Figure 3.6,
Toward an Understanding and Prediction of Air Flow in Buildings
30
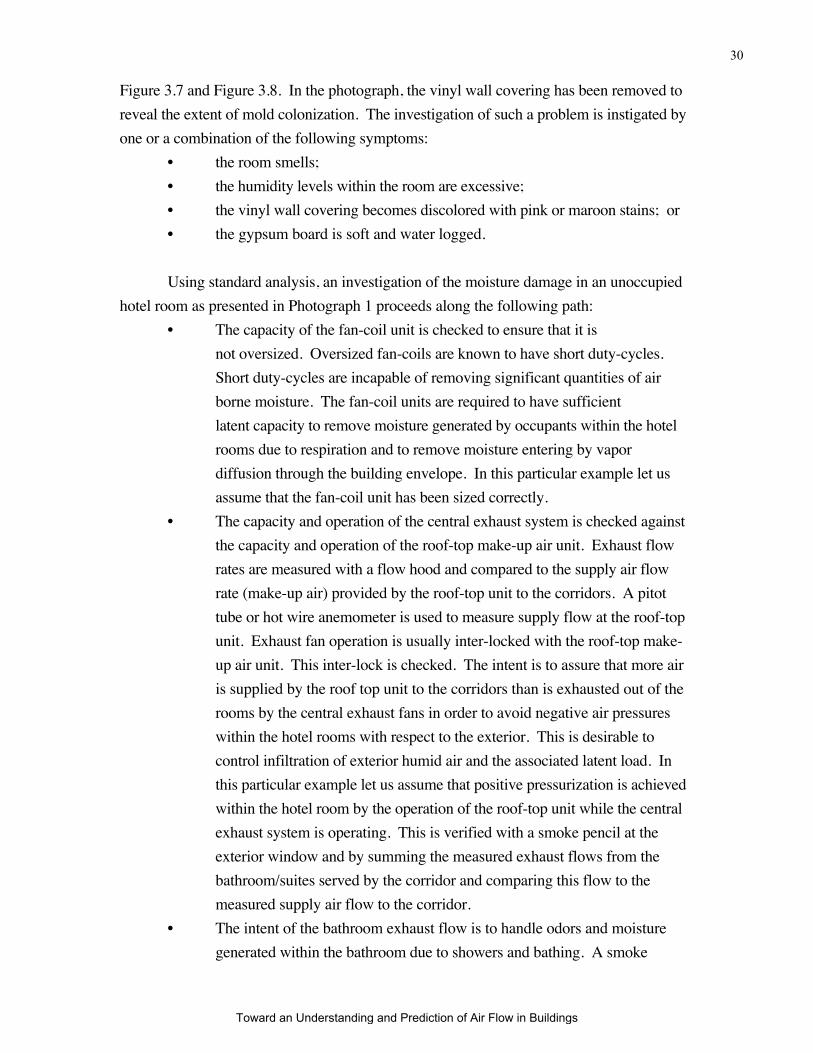
Figure 3.7 and Figure 3.8. In the photograph, the vinyl wall covering has been removed to
reveal the extent of mold colonization. The investigation of such a problem is instigated by
one or a combination of the following symptoms:
• the room smells;
• the humidity levels within the room are excessive;
• the vinyl wall covering becomes discolored with pink or maroon stains; or
• the gypsum board is soft and water logged.
Using standard analysis, an investigation of the moisture damage in an unoccupied
hotel room as presented in Photograph 1 proceeds along the following path:
• The capacity of the fan-coil unit is checked to ensure that it is
not oversized. Oversized fan-coils are known to have short duty-cycles.
Short duty-cycles are incapable of removing significant quantities of air
borne moisture. The fan-coil units are required to have sufficient
latent capacity to remove moisture generated by occupants within the hotel
rooms due to respiration and to remove moisture entering by vapor
diffusion through the building envelope. In this particular example let us
assume that the fan-coil unit has been sized correctly.
• The capacity and operation of the central exhaust system is checked against
the capacity and operation of the roof-top make-up air unit. Exhaust flow
rates are measured with a flow hood and compared to the supply air flow
rate (make-up air) provided by the roof-top unit to the corridors. A pitot
tube or hot wire anemometer is used to measure supply flow at the roof-top
unit. Exhaust fan operation is usually inter-locked with the roof-top make-
up air unit. This inter-lock is checked. The intent is to assure that more air
is supplied by the roof top unit to the corridors than is exhausted out of the
rooms by the central exhaust fans in order to avoid negative air pressures
within the hotel rooms with respect to the exterior. This is desirable to
control infiltration of exterior humid air and the associated latent load. In
this particular example let us assume that positive pressurization is achieved
within the hotel room by the operation of the roof-top unit while the central
exhaust system is operating. This is verified with a smoke pencil at the
exterior window and by summing the measured exhaust flows from the
bathroom/suites served by the corridor and comparing this flow to the
measured supply air flow to the corridor.
• The intent of the bathroom exhaust flow is to handle odors and moisture
generated within the bathroom due to showers and bathing. A smoke
Toward an Understanding and Prediction of Air Flow in Buildings
31
pencil shows that air is pulled into the bathroom under the bathroom door.
The quantity of air extracted from the bathroom via the central exhaust
system (as measured by a flow hood) is approximately 25 L/s. This
matches the design intent and is known by experience to be able to handle
normal bathroom moisture loads and odors.
• The relative humidity and temperature in the corridor are measured and
recorded as follows: 55 percent relative humidity and 23 degrees C or a
dew point temperature of approximately 14 degrees C. This
matches the design intent for the roof top unit to supply “neutral
temperature air at a neutral relative humidity”.
• The exterior relative humidity and temperature are measured and recorded
as follows: 60 percent relative humidity and 32 degrees C or a dew point
temperature of approximately 24 degrees C. This is an expected condition
for August in the location where the hotel is constructed.
• The relative humidity within the hotel room is measured as fluctuating
between 65 percent and 75 percent relative humidity. The interior hotel
room temperature varies between 23 degrees C and 27 degrees C. This
corresponds to dew point temperatures of between 16 degrees C and 20
degrees C. The interior room air moisture levels are unexpectedly high and
not explainable. The interior room air moisture levels should match the
corridor moisture levels, especially if rooms are unoccupied. Recall that the
rooms are at a positive air pressure with respect to the exterior so that
infiltration of exterior moisture laden air is eliminated as a moisture source
using standard analysis and that vapor diffusion from the exterior through
the exterior wall is negligible.
• The possibility of rain water leakage through the building envelope is
examined. The possibility of roof leakage is examined. Let us assume that
no rain water leakage through wall or roof assemblies is occurring.
At this point the investigation and analysis typically breaks down. More often than
not moisture of construction is assumed to be the culprit and the contractor is blamed for
not covering the work during construction and preventing rain wetting of the materials. This
argument is easily eroded if the hotel is more than a few years old and no explanation what-
so-ever is provided.
Toward an Understanding and Prediction of Air Flow in Buildings

32
Non Standard Analysis
Hotel building envelope and interior wall construction is usually steel studs with
gypsum board (Figure 3.9). Steel studs are perforated with punched openings to facilitate
installation of services. These perforations create a connected wall cavity in both interior
and exterior walls. In exterior walls, fiberglass batt insulation is installed. As fiberglass batt
insulation provides very small resistance to air flow, the connected wall cavity construction
in both interior and exterior walls permits considering these walls as acting as air ducts.
Using non standard analysis, the investigation of the moisture damage in an
unoccupied hotel room as presented in Photograph 1 proceeds along the following path:
• The air pressures within the demising walls relative to the exterior are
measured with a manometer. Additionally, the air pressure within the room
relative to the exterior is measured. The demising wall on one side of the
room is measured to be operating under a varying negative air pressure with
respect to the exterior between 1 Pa and 2 Pa. This pressure fluctuates
based on the opening and closing of the bathroom door. The demising wall
on the opposite side of the room varies between a positive air pressure of 1
Pa and a negative air pressure of 1 Pa to the exterior. This pressure
fluctuates based on the duty cycle of the fan-coil. The room is measured to
have a positive air pressure with respect to the exterior that varies between 1
Pa and 2 Pa based on the duty cycle of the fan-coil.
At this point the investigation is essentially complete. The interpretation of the
results follow.
Air Pressure Driver 1: Fan Coil
In the example described in Figure 3.6 and Figure 3.7, the fan coil unit extracts air
out of the dropped ceiling assembly because the dropped ceiling enclosure is designed to
act as a return plenum. Resistance to air flow is provided by a filter in the return grill
creating a negative pressure within the dropped ceiling enclosure relative to its
surroundings. However, dropped ceiling enclosures are seldom air tight due to numerous
penetrations for controls, power supply, and piping. Additionally, joints and seams in the
materials forming the dropped ceiling enclosure are difficult to make airtight.
The dropped ceiling enclosure is connected to the demising wall via the penetrations
for controls, power supply, piping and through openings reflective of the prevailing
construction practice. The demising wall is further connected to the exterior wall. A
negative air pressure field is created in the demising wall relative to the rooms on both sides
due to its connection to the dropped ceiling plenum. This negative air pressure field extends
to the exterior wall and may or may not be negative with respect to the exterior.
Toward an Understanding and Prediction of Air Flow in Buildings
33
If this air pressure field within the demising wall is also negative with respect to the
exterior, it leads to the infiltration of hot humid air during cooling periods and contaminants
during other periods through the exterior wall assembly, down the demising wall to the
dropped ceiling assembly (Figure 3.10). During cooling periods when this air is cooled
due to the cooling of the hotel rooms on both sides of the demising wall, moisture is
deposited in the wall cavities leading to mold and microbial contamination.
This negative air pressure field in the interstitial spaces exists only when the fan coil
unit is operating and exists despite the positive air pressure in the hotel room created by the
air flow from the corridor. This interstitial negative air pressure field is time dependent and
is related to the duty cycle of the fan coil unit.
The demising wall acts as an outside air duct supplying outside air to the fan coil.
This outside air supply tends to increase the positive air pressure in the room with respect to
the exterior. This causes fluctuation in the positive pressure (with respect to the exterior) in
the room in synchronization with the duty cycle of the fan-coil. It also leads to elevated
levels of air borne moisture within the room.
Air Pressure Driver 2: Central Exhaust
In a similar manner to the fan coil unit induced interstitial demising wall
depressurization, leakage of the central exhaust duct located within the plumbing service
shaft also leads to the creation of a negative air pressure field relative to the rooms in the
opposite demising wall that also extends to the exterior wall. This negative air pressure field
exists only when the roof top exhaust fan operates and again exists despite the positive air
pressure in the hotel room (Figure 3.11). When the bathroom door is closed, the flow path
from the suite to the exhaust grill in the bathroom is interrupted creating a flow resistance
resulting in more air to be extracted from the demising wall. This results in increased
depressurization within the demising wall on a cycle matched to the opening and closing of
the bathroom door.
The negative air pressure field due to the roof top exhaust fan (as modified by
bathroom door closure) may or may not be negative with respect to the exterior. If it is
negative with respect to the exterior, it will result in the infiltration of exterior air into the
demising wall, similar to the fan coil unit example. However, it will not lead to an increase
in the levels of air borne moisture within the room since the flow path of this infiltrating air
is to the plumbing service shaft and subsequently out of the building via the roof top
exhaust fan. This infiltrating air does not enter the rooms on either side of the demising
wall.
However, moisture in the infiltrating air is deposited on the gypsum board surfaces
enclosing the demising wall interstitial cavity. The deposited moisture migrates by diffusion
to the vinyl wall covering/gypsum board interface. Little moisture diffuses through the vinyl
Toward an Understanding and Prediction of Air Flow in Buildings
34
wall covering and therefore the room air borne moisture levels are not affected.
Unfortunately, the gypsum board and the vinyl wall covering both deteriorate due to the
accumulated moisture.
Coupling of Air Pressure Fields
Figures 3.10 and 3.11 illustrate the coupling of the air conveyance system field with
the interstitial field and the coupling of the interstitial field to both the exterior field and the
interior fields. Standard analysis recognizes the coupling of the air conveyance system field
to the exterior and interior fields. A typical example is that of exhaust fans pulling air from
bathrooms and discharging it to the exterior. Standard analysis, however, does not
recognize the interaction of the air conveyance system field with the interstitial field.
Standard analysis assumes a "flow-through" mass balance and an assumption that
the air pressure profile and flows are dependent only on the total pressure difference
between the exterior and interior air pressure field. This is clearly not the case in the
examples in Figures 3.10 and 3.11 where air flow is extracted at an intermediate location
(the demising wall cavity) due to leakage of the dropped ceiling plenum containing the fan
coil and due to central exhaust duct leakage. The air extraction from the demising wall
cavities leads to replacement air (make-up air) for the demising wall cavities drawn from the
exterior as well as from the rooms on both sides of the demising walls.
Standard analysis would assume a positive air pressure with respect to the exterior
exists within the demising walls of magnitude somewhere between the interior positive air
pressure and the boundary layer air pressure. Time dependent negative air pressures within
the demising walls relative to both the boundary layer air pressure and the interior air
pressure are completely unexpected and unaccountable with standard analysis.
Toward an Understanding and Prediction of Air Flow in Buildings
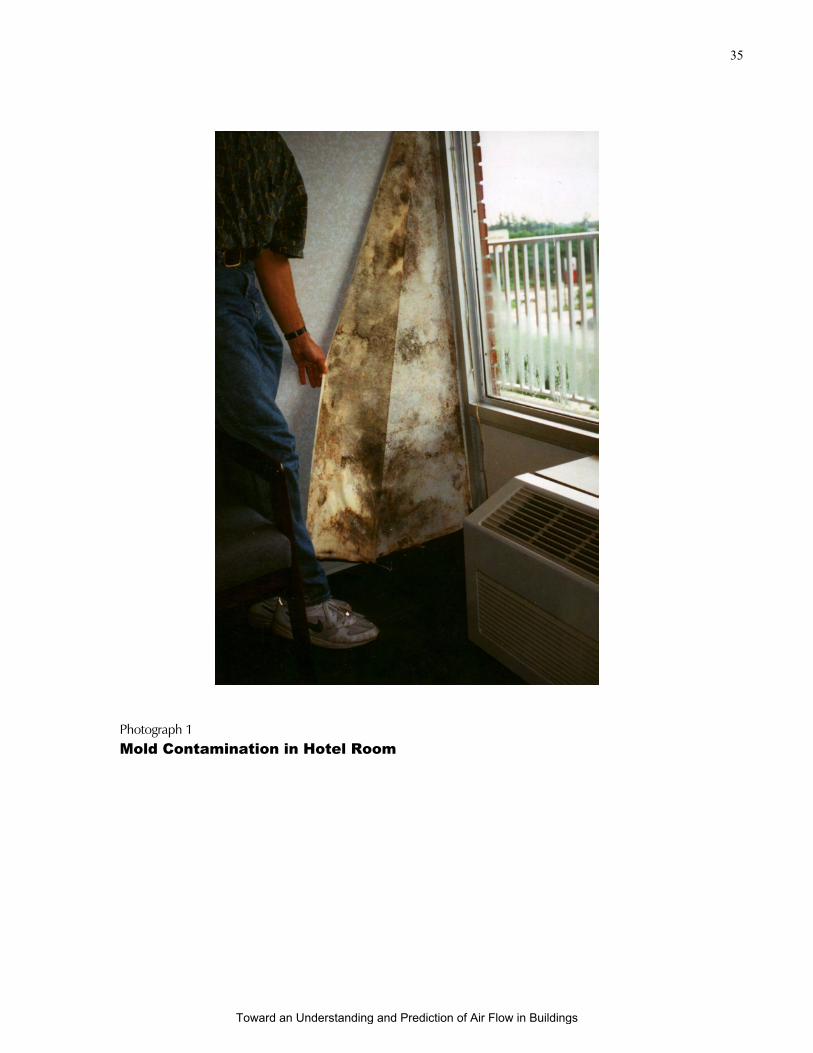
35
Photograph 1
Mold Contamination in Hotel Room
Toward an Understanding and Prediction of Air Flow in Buildings
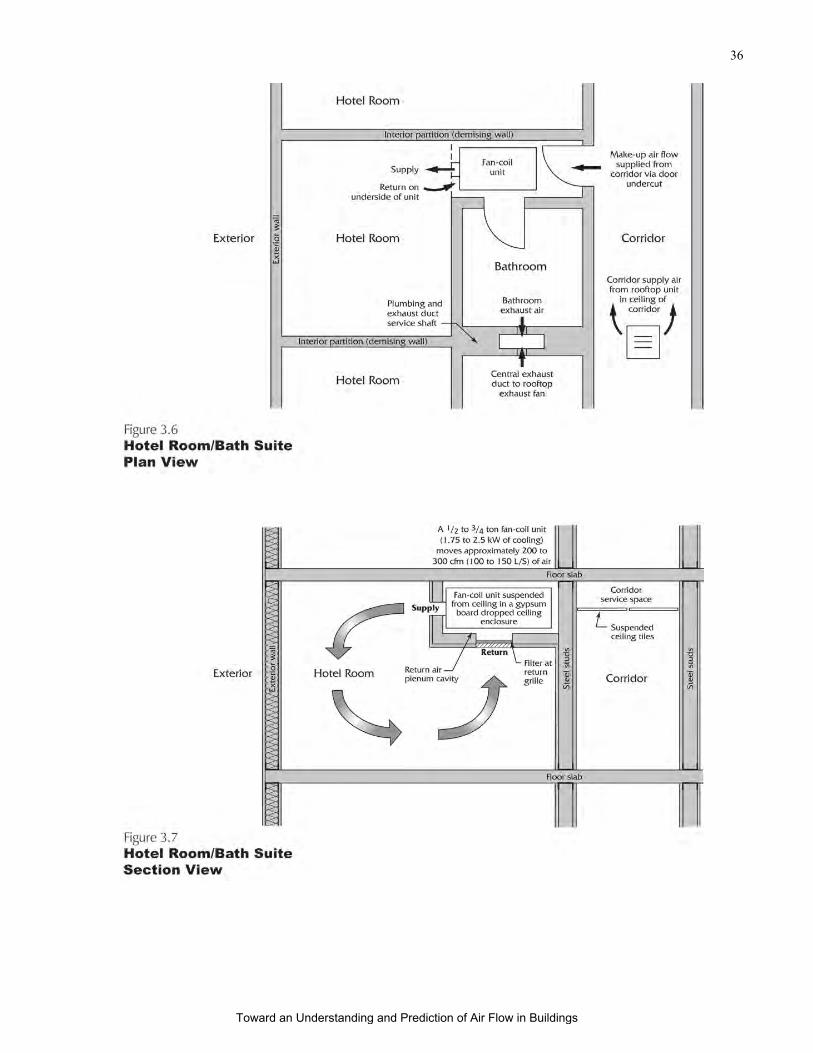
36
Toward an Understanding and Prediction of Air Flow in Buildings

37
Toward an Understanding and Prediction of Air Flow in Buildings
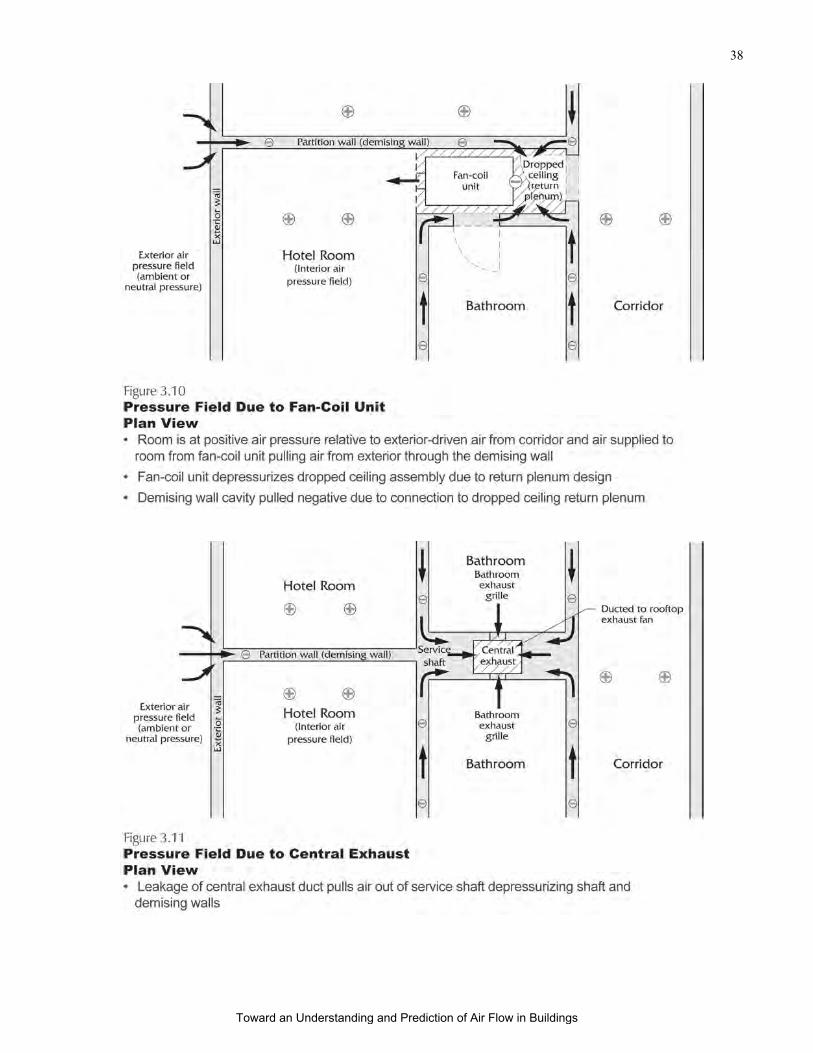
38
Toward an Understanding and Prediction of Air Flow in Buildings
39
HVAC System Effects
Under standard air flow analysis it is known that exhaust systems/fans tend to
depressurize building enclosures inducing infiltration and supply systems/fans tend to
pressurize building enclosures inducing exfiltration.
Also under standard building analysis (typical design assumptions), ducted
distribution systems and air handling units in building enclosures have traditionally been
thought to not alter interior air pressures. They have been viewed as interior circulation
systems which move air from place to place within a building space having a neutral effect
on the pressure differences between the interior and exterior of a building enclosure.
However, ducted distribution systems (forced air heating and cooling systems) and air
handling units often have significant impacts on pressure differences across building
assemblies. This impact is primarily due to leakage of the systems and of the air handling
units themselves. Imbalance between the supply and exhaust flows due to insufficient or
inadequate return paths is also a contributing factor.
Residential Systems
A typical ducted, forced air heating or cooling system can be viewed as two systems:
a supply duct system and a return duct system connected together through a fan located
within an air handling unit. In buildings in heating climates most supply duct systems and
air handling units (furnaces) are normally located in basement spaces (Figure 3.12) whereas
in cooling climates most supply duct systems and air handling units (air conditioners) are
located either in vented attics or in vented crawl spaces (Figure 3.13).
In buildings with basements, the supply system is usually a relatively "tight" system
with supply ducts usually running to every room in the building. The return system is
usually a relatively "leaky" system which often utilizes partition wall stud spaces, floor joist
space cavities with sheet metal nailed to their lower surfaces and holes cut in floor sheathing
with wood blocking as part of the "ducting". Furthermore, there is often only one or two
common returns for the whole building. It is rare to find a return register in every room in
which a supply register is also located. Even if return registers are matched to supply grills
on a room-by-room basis, the return system is often so leaky that it draws only limited
return air from the return registers.
A leaky return duct system can draw a significant amount of air from the
surrounding air space. Figure 3.14 illustrates the example where much of the return air is
drawn from the basement through the leaks in the return system leading to the
depressurization of the basement area relative to the exterior and the main level (Timusk,
1983; Nelson et al., 1986; Tooley & Moyer, 1988).
Toward an Understanding and Prediction of Air Flow in Buildings
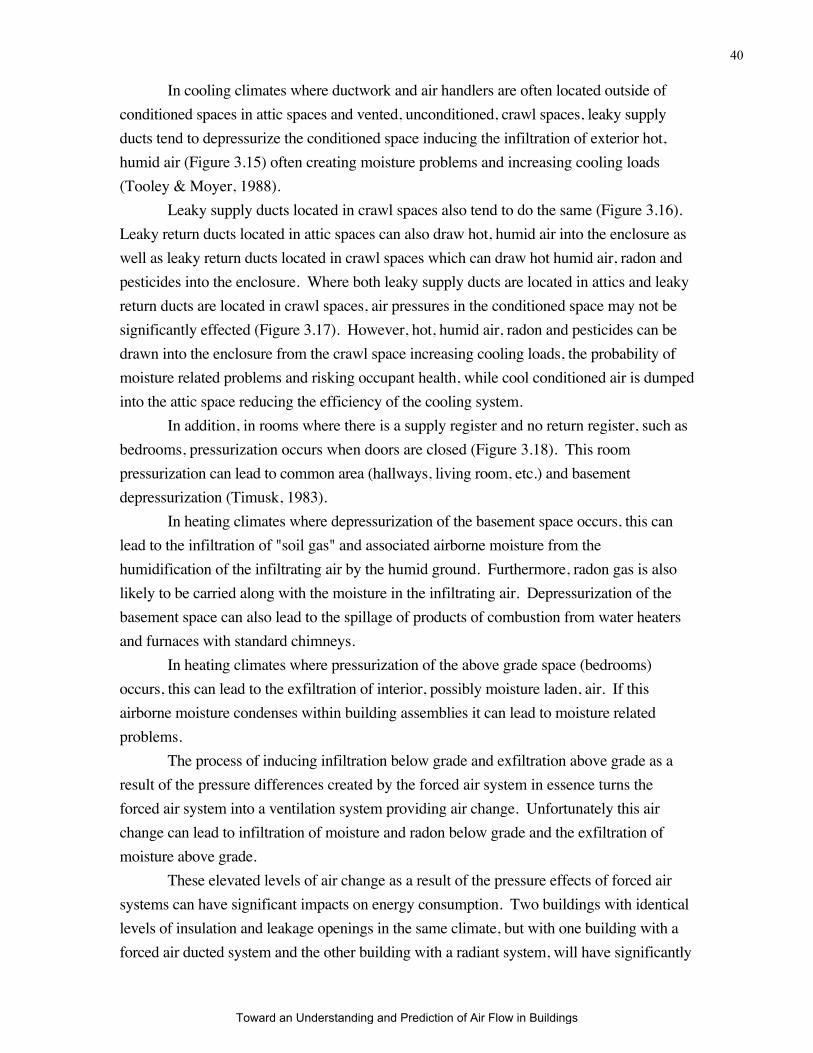
40
In cooling climates where ductwork and air handlers are often located outside of
conditioned spaces in attic spaces and vented, unconditioned, crawl spaces, leaky supply
ducts tend to depressurize the conditioned space inducing the infiltration of exterior hot,
humid air (Figure 3.15) often creating moisture problems and increasing cooling loads
(Tooley & Moyer, 1988).
Leaky supply ducts located in crawl spaces also tend to do the same (Figure 3.16).
Leaky return ducts located in attic spaces can also draw hot, humid air into the enclosure as
well as leaky return ducts located in crawl spaces which can draw hot humid air, radon and
pesticides into the enclosure. Where both leaky supply ducts are located in attics and leaky
return ducts are located in crawl spaces, air pressures in the conditioned space may not be
significantly effected (Figure 3.17). However, hot, humid air, radon and pesticides can be
drawn into the enclosure from the crawl space increasing cooling loads, the probability of
moisture related problems and risking occupant health, while cool conditioned air is dumped
into the attic space reducing the efficiency of the cooling system.
In addition, in rooms where there is a supply register and no return register, such as
bedrooms, pressurization occurs when doors are closed (Figure 3.18). This room
pressurization can lead to common area (hallways, living room, etc.) and basement
depressurization (Timusk, 1983).
In heating climates where depressurization of the basement space occurs, this can
lead to the infiltration of "soil gas" and associated airborne moisture from the
humidification of the infiltrating air by the humid ground. Furthermore, radon gas is also
likely to be carried along with the moisture in the infiltrating air. Depressurization of the
basement space can also lead to the spillage of products of combustion from water heaters
and furnaces with standard chimneys.
In heating climates where pressurization of the above grade space (bedrooms)
occurs, this can lead to the exfiltration of interior, possibly moisture laden, air. If this
airborne moisture condenses within building assemblies it can lead to moisture related
problems.
The process of inducing infiltration below grade and exfiltration above grade as a
result of the pressure differences created by the forced air system in essence turns the
forced air system into a ventilation system providing air change. Unfortunately this air
change can lead to infiltration of moisture and radon below grade and the exfiltration of
moisture above grade.
These elevated levels of air change as a result of the pressure effects of forced air
systems can have significant impacts on energy consumption. Two buildings with identical
levels of insulation and leakage openings in the same climate, but with one building with a
forced air ducted system and the other building with a radiant system, will have significantly
Toward an Understanding and Prediction of Air Flow in Buildings
41
different levels of energy use. The building with the forced air system has much higher
energy consumption levels due to the pressure effects of leaky ductwork.
A common example of an air pressure related moisture problem in a cooling climate
is where a forced air cooling system air handler is located in a closet/utility room and a large
unsealed opening exists between the supply ductwork which is located in the attic space and
the ceiling of the closet/utility room where the supply ductwork penetrates the ceiling
(Figure 3.19). Return air for the system is drawn from the hot, humid attic space into the
utility room through the opening around the ductwork and into the return grill of the air
handler. There are cases where the temperature of the building enclosure has actually gone
up when the air conditioner/air handler was turned on in similar installations (Tooley &
Moyer, 1988). The cooling load increase from the hot, humid air drawn from the attic into
the system was actually greater than the capacity of the cooling system. Another serious
consequence of leaky air handlers and leaky ductwork is the backdrafting of combustion
appliances and possible flame roll-out (Figure 3.20).
One of the most common symptoms of the HVAC system induced air pressure
differentials described is the soiling of carpeting. As air moves between rooms, into and out
of interstitial cavities, across exterior wall assemblies and between above grade and below
grade spaces it migrates under baseboards and under doors. Where carpeting is also
present, this moving air is “filtered” by the porous carpet fibers at leaving telltale dark
marks at baseboards, under doors and at stair treads. The effect is significantly enhanced
where airborne particulates are found in high concentrations such as in smoking
occupancies or where aromatic/scented candles are burned. Candles that burn with these
types of additives release significant quantities of soot that get filtered at carpet/baseboard
intersections, get deposited under doors due to impaction as well as plate out at cold
surfaces due to Brownian motion and plastic surfaces due to electrostatic attraction.
Commercial/Institutional Systems
Figure 3.21 illustrates an idealized view of a common commercial/institutional
HVAC system. In almost all commercial/institutional HVAC systems, a dropped ceiling or
suspended ceiling is used to create a return plenum.
The dropped ceiling is depressurized by air handling units located within the
dropped ceiling. The air handling units extract air from the dropped ceiling, condition it
(filter, heat or cool the air) and inject it into the occupied zone via a duct distribution system.
In other words the supply air is “direct ducted” whereas the return air is pulled up into the
dropped ceiling return plenum due to the negative air pressure created within the dropped
ceiling by the air handling units extracting air from the dropped ceiling area. To facilitate
Toward an Understanding and Prediction of Air Flow in Buildings
42
the return air flow the dropped ceiling is constructed in a deliberately porous manner or
return grills are installed to connect the dropped ceiling to the occupied zone.
In this idealized view, interaction of the dropped ceiling return plenum with the
exterior walls and roof assembly is not considered. Figure 3.22 illustrates the interactions
between dropped ceiling return plenums and exterior wall assemblies and roof assemblies.
Air is extracted from roof assemblies, exterior wall cavities, through parapets and though
exterior sheathings and building papers via communication with the negative pressure field
within the dropped ceiling return plenum created by the operation of the air handling units.
Figure 3.23 illustrates the interactions between air handling units built into exterior
walls and the exterior wall assemblies themselves. This is similar to the interaction of an air
handling unit in a hotel room/bathroom suite described previously in Figure 3.10. Air is
extracted from the exterior wall assembly, drawn into the air handling unit and subsequently
injected into the room.
Leakage of exhaust ductwork in chases and their interaction with interior and
exterior walls has also been previously described in Figure 3.11.
Measurement of System Leakage
Procedures for leakage testing of HVAC systems have been available for quite some
time (SMACNA, 1965; SMACNA, 1967; SMACNA, 1985). Many of these procedures
rely on measuring flow at grills and registers and comparing the values to the flow at air
handlers. Differences in flow are thereby attributed to leakage in the system between the
terminal points (grills and registers) and the air handler. Flow hoods are often used to
determine flows at grills and registers and pitot tubes or hot-wire anemometers are used to
determine flows at air handlers.
However, significant inaccuracy is introduced with these approaches due to the
effects of cumulative error and the sensitivity limitations of flow hoods along with the
extreme reliance on the skill of the tester when conducting pitot tube or hot-wire
anemometer traverses. Variations in flow measurements of 10 to 20 percent commonly
occur using these approaches whereas leakage as low as 3 to 5 percent can have significant
effects on building performance (Tooley & Moyer, 1988; Lstiburek, 1993). This was
recognized by the industry and new procedures were developed using pressurization
methods (SMACNA, 1985). The pressurization methods employed sealing the supply and
return grills and pressurizing the system with a variable speed blower. An orifice meter and
manometer were used to determine flows at the test blower and pressures created within the
duct systems.
The initial pressurization methods were difficult and expensive to conduct and
disruptive in the field. It was not until Nelson (1991) developed portable, low cost,
Toward an Understanding and Prediction of Air Flow in Buildings
43
convenient and accurate pressurization testing equipment that such testing became practical
to conduct in the field.
Due to the difficulties of leakage testing using early pressurization equipment and
the complexity and inaccuracy associated with flow hoods, pitot tubes and hot-wire
anemometers, much of the work in single family dwellings in the 1980’s relied on the
“subtraction method” for estimating leakage values. In this approach, a whole house
pressurization test is conducted. Supply and return registers and grills are then sealed and a
subsequent whole house pressurization test is conducted. The flow rate of the latter is
subtracted from the flow rate of the former to obtain an order of magnitude value of system
leakage (Robinson & Lambert, 1987).
The subtraction method proved to be a useful tool only in buildings where the
majority of the ductwork was located in vented attics or vented crawl spaces. Where
ductwork was located within the conditioned spaces, the method could not be used. Only
leakage flow rates to the exterior could be quantified. Leakage flow rates to the interior
could not be quantified. Additionally, although the approach was relatively “quick and
easy”, its accuracy was no better than the flow hood, pitot tube, hot-wire anemometer
approaches (Cummings, Tooley & Moyer, 1990).
Although the specific duct leakage and air handler leakage values were difficult to
determine directly, their effect on the air pressure field could be determined directly with
portable, hand held micromanometers.
With respect to measuring leakage of dropped ceiling return plenums or the leakage
of air handling units built into exterior walls or soffit assemblies, no practical direct method
of measurement exists. However, the effect of the leakage on the air pressure field can be
determined directly, again with portable, hand held micromanometers.
Toward an Understanding and Prediction of Air Flow in Buildings

44
Toward an Understanding and Prediction of Air Flow in Buildings

45
Toward an Understanding and Prediction of Air Flow in Buildings
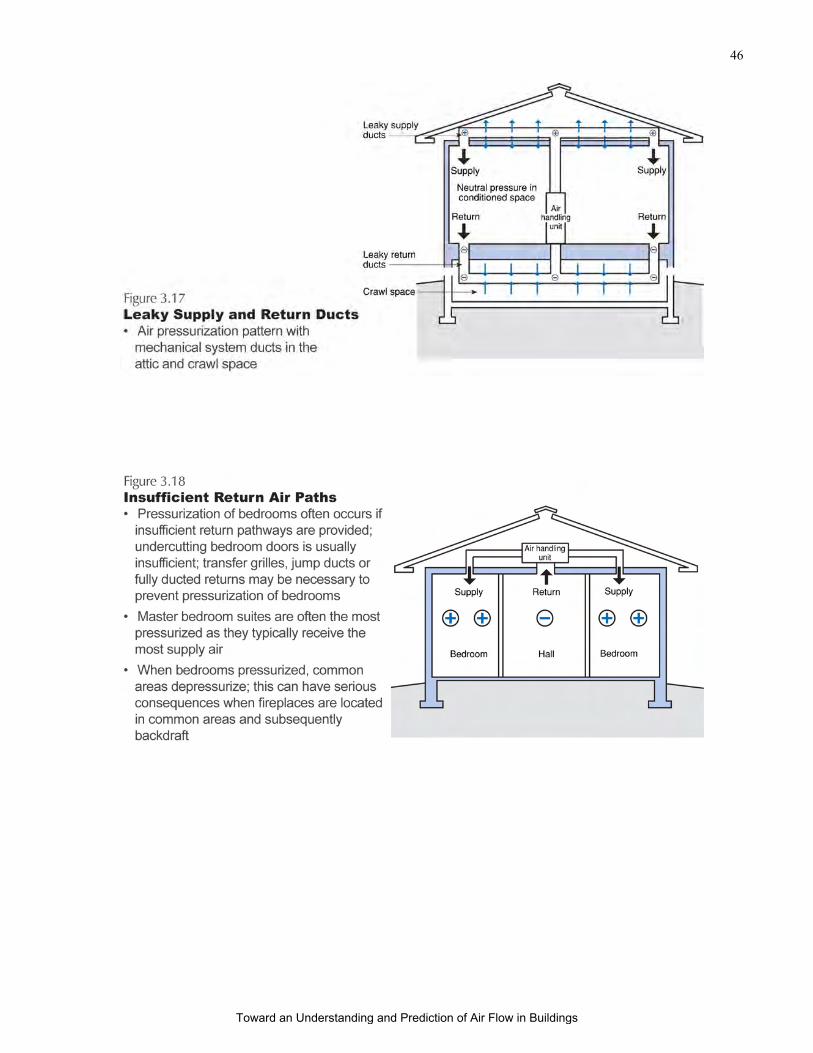
46
Toward an Understanding and Prediction of Air Flow in Buildings
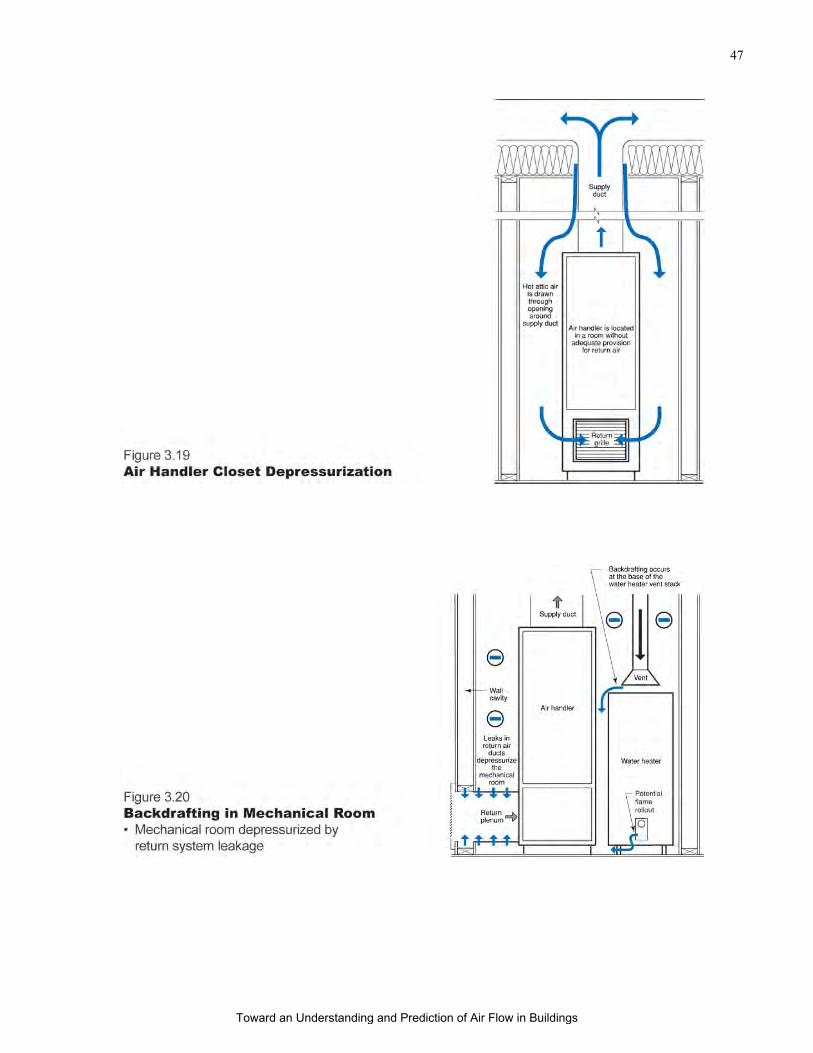
47
Toward an Understanding and Prediction of Air Flow in Buildings
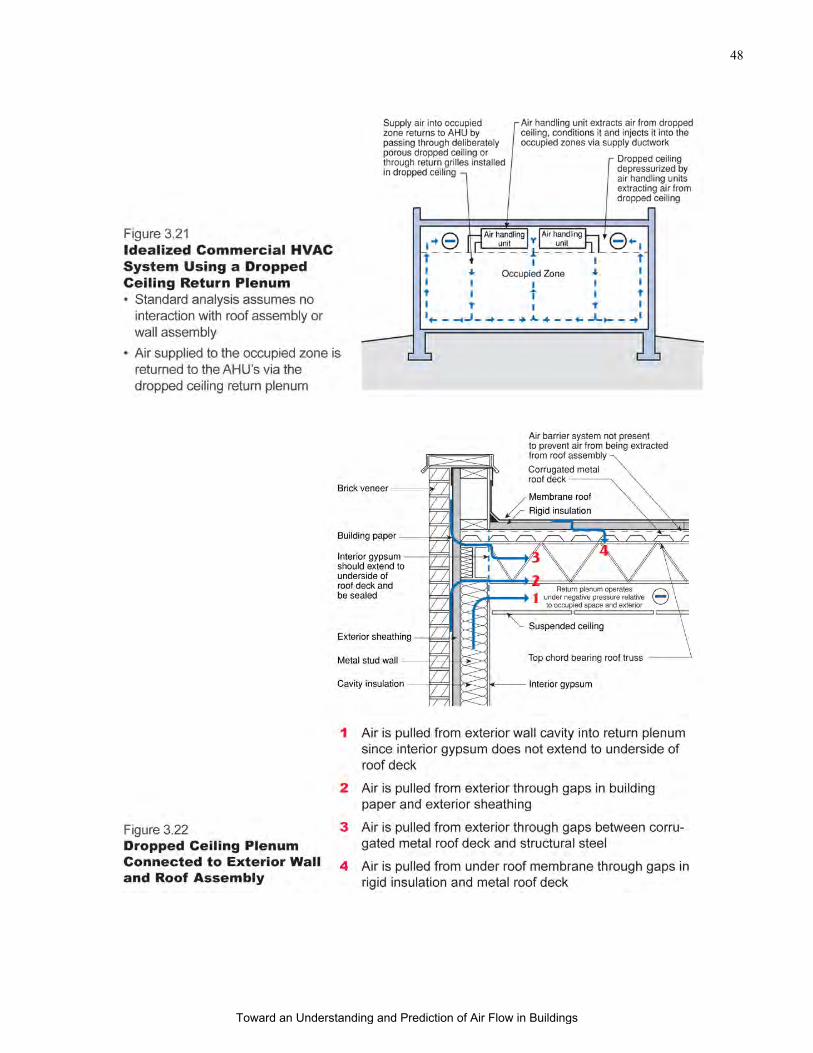
48
Toward an Understanding and Prediction of Air Flow in Buildings
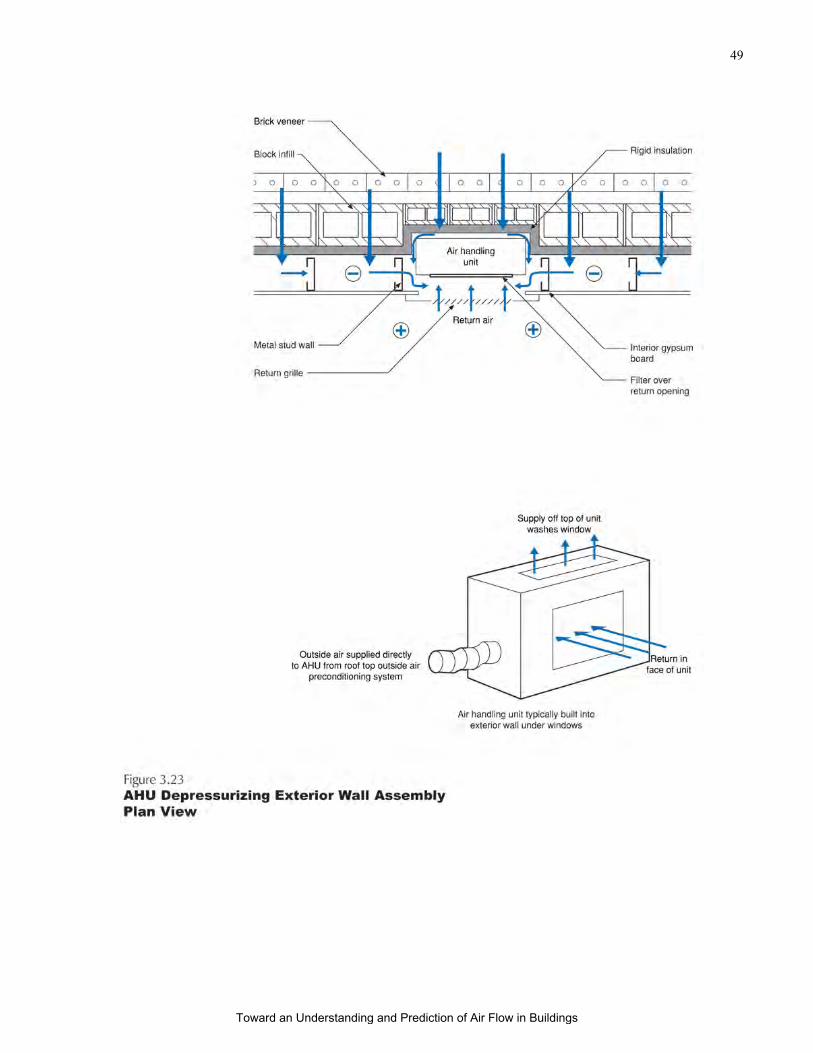
49
Toward an Understanding and Prediction of Air Flow in Buildings
50
Relational and Analytic Models for Air Flow in Buildings
The significance of these complex, time dependent interstitial air pressure fields and
related air flows has not been appreciated or identified for several reasons:
• materials, methods and means of construction have changed;
• the relational model is incomplete; and
• the process of construction is fragmented.
In the past buildings were leaky, not well insulated and the effect of HVAC systems
and other air conveyance systems on building pressures was small. The key air pressure
relationships defining interstitial air pressures are also small and have until recently been
difficult to measure and quantify. Older building structures were more massive with
exterior wall assemblies and interior partitions constructed from masonry, masonry back-up
and plaster resulting in few or no interstitial connected cavities. More recent construction
relies on metal framing, steel studs, gypsum board interior and exterior sheathing resulting
in more numerous and larger void spaces, chases and interstitial cavities.
Building design and construction has also become fragmented as a consequence of
the increasing specialization and complexity of the technology of construction.
Specialization has lead to an abundance of specialists who have tended to focus principally
on their own disciplines. In doing so, the system view is often missed. Under these
conditions the significance of interstitial air flows and the need for more complete relational
models of air flow in buildings is not readily apparent.
Relational Models
Considering interstitial air pressure fields and related air flows and the coupling of
mechanical systems to the building envelope and building cavities leads to the development
of more complete relational models of air flow in buildings. These relational models of air
flow in buildings are based on air pressure relationships rather than on air flow. The
relational models identify direction of air flow, but not the quantification of air flow. They
can be used to determine the magnitude of the air pressures, but not the leakage areas and
therefore not air flows. These relational Air Pressure Field (APF) Models for Buildings
can be used to predict and understand the pressure response of buildings. From these
relational models, existing analytic models can be tuned or calibrated to provide
quantification of flows and leakage areas.
A relational APF model is presented in Figure 3.24 that shows the relationships
among the four component fields comprising the building air pressure field. The proposed
APF Model involves research on air flows and pressures in buildings that spans this
Toward an Understanding and Prediction of Air Flow in Buildings
51
century. The key papers of the component fields are referred to while illustrating their
contribution to enhanced understanding (Figure 3.24).
Historical Basis for Relational Model
Coupling of the exterior field and the interior field is a key factor utilized in the
design of buildings and cladding systems. Loads for the design of cladding can be found
from the algebraic difference between the boundary layer and interior pressures (Davenport,
1960; Dalgliesh & Schriever, 1962; Davenport & Isyumov, 1967; Stathopoulos, Surry &
Davenport, 1979; Dalgliesh, 1981; Davenport & Hui, 1982).
Coupling of the interior and exterior fields due to air density differences between the
interior and exterior (stack effect) has long been utilized in the ventilation design of process
buildings (Barker, 1912; Emswiler, 1926) and in establishing air and smoke flow patterns
in high rise buildings (Tamura & Wilson, 1966).
Coupling of the exterior and the interior field has also been extensively studied with
respect to wind induced natural infiltration (Swami & Chandra, 1987).
Understanding of the coupling of the exterior and the interstitial fields within
exterior wall assemblies forms the basis of pressure equalized rain screen (PER) design for
the control of rain entry into walls (Garden, 1963).
The study of wind washing of cavity insulation in exterior wall assemblies further
established the link between the exterior field and the interstitial field (Timusk, Seskus &
Ary, 1988). The study of ventilation in cladding expanded knowledge about the link
between the exterior field and the interstitial field and identified thermal and moisture
convection as air pressure drivers (Burnett & Straube, 1995).
Coupling of the interior field, the air conveyance system field and the exterior field
was studied extensively because of concerns arising from carbon monoxide poisoning and
negative pressures in airtight houses (Steel, 1982). Relationships between building
envelope tightness (leakage) and air requirements for chimneys were developed (White,
1983) along with test protocols establishing negative air pressure limits for interior air
pressure fields. The pressure limits were related to flow reversals in chimney air
conveyance system fields using calibrated fans to alter interior fields in a controlled manner
(Timusk, 1983).
Building envelope leakage characteristics using calibrated fans to alter interior air
pressure in a controlled manner have been extensively studied (Tamura & Wilson, 1964;
Stricker, 1975) leading to the development of leakage-pressure relationships for building
envelopes. The work on building envelopes is an extension of leakage-pressure
relationships developed for wall assemblies that date to the early part of this century
(Larson, 1929).
Toward an Understanding and Prediction of Air Flow in Buildings
52
Door closure and the distribution of supply registers and return grills were
determined to be air pressure drivers in the spillage and backdrafting of combustion
appliances (Timusk, 1983), thereby identifying the three-way linkage of the interior field, the
air conveyance system field and the exterior field. This work was significantly expanded to
include duct leakage of ducts in both conditioned and unconditioned spaces (Tooley &
Moyer, 1988).
Duct leakage into interstitial spaces was identified as an energy (operating cost)
factor (Harrje, Gadsby & Cromer, 1986; Nelson et al., 1986; Tooley & Moyer, 1988)
thereby identifying the link between the interior and exterior fields, the air conveyance
system field and the interstitial air pressure field.
The linkage between different interstitial fields was subsequently identified as a
moisture transport path (Tooley & Moyer, 1989; Lstiburek, 1989) where the air pressure
driver for the interstitial field was an HVAC system.
Active control of air pressures within interstitial spaces as a design strategy has been
proposed as a viable method of moisture and pollutant control (Handegord, 1989) and
forms the basis of dynamic wall strategies for thermal comfort and ventilation (Timusk,
1987).
Rehabilitation techniques using active control of air pressures within building
envelope interstitial air spaces are common. Pressurization of roof assembly cavities with
exterior air has been successfully used to control the exfiltration of interior moisture laden
air in heating climates (Lstiburek, 1988; Quirouette, 1997) as well as active depressurization
of sub-slab granular pads to control the infiltration of radon and other soil gases into
occupied spaces (Scott, 1979; Acres, 1981). These examples highlight the linkage between
interstitial fields, air conveyance system fields, interior and exterior fields that are used in the
design process.
Designing the linkage of exterior and interstitial air pressure fields is also typical
where the use of powered attic ventilation exhaust fans provide attic air change. This same
strategy has also been found to provide incidental linkage to the interior field and
subsequent chimney flow reversal. Specifically, the operation of powered attic ventilation
exhaust fans has been shown to depressurize conditioned spaces leading to the backdrafting
of chimneys and flame roll-out in combustion water heaters (Tooley & Davis, 1994).
Unifying these excellent, though disjoined research papers under the relational APF
model as developed in this thesis, enhances prediction and understanding of the pressure
response of buildings and of each component field as they interact during the operation of
the building.
Analytical Models
Toward an Understanding and Prediction of Air Flow in Buildings

53
The relational model shown in Figure 3.24 can be used to tune or calibrate existing
multi-cell analytical models. Figure 3.25 represents an electrical analog of the hotel room
described in Figure 3-6. Currents represent the rate of air flows, voltages represent air
pressures and resistance's represent air leakage paths. Ambient air pressure under no wind
conditions at ground level is considered "ground".
Although this approach has a long history (Nylund, 1966; Nylund, 1980; Kronvall,
1980; Walton, 1989), it is adapted here to consider interstitial spaces and the leakage effects
of HVAC systems. In an extension of standard analysis, the nodes represent either rooms
or interstitial spaces. In this manner connected compartments such as rooms, exterior wall
cavities and interior wall cavities are all considered. Additionally, compartments can also
have generators associated with them. The generators represent mechanical system leakage
from either ducts, equipment housing or exhaust system service ductwork and chases.
In this manner a mass balance at each node can occur while allowing the
introduction or removal of flows at intermediate "nodes". Generators are also used to
represent the other "drivers" such as wind, stack and other effects of mechanical systems.
Alternating current generators (AC) are used to represent the dynamic effect of wind
whereas direct current generators (DC) are used to represent stack effects (temperature
differences) and exhaust and supply flows from fans and HVAC systems. The DC
generators are used in two different forms, in one form they provide a constant voltage, and
in the other form they provide a constant current. This is analogous to representing the
stack effect (constant voltage) and an HVAC system flow (constant current).
With this approach standard network analytical models can now be used to address
the interstitial air pressure fields and related air flows. The relational model is used to create
the nodal grid of the analytical model. Difficulties still exist with respect to determining
boundary conditions. However, the relationships between flows, pressures and leakage
paths now correspond to actual construction.
In using the modified network analytical models, the issues relating to the level of
detailed input information for model boundary conditions can be addressed by changing the
focus from difficult to obtain information to easy to obtain information. Specifically, the
resistances representing air leakage paths, can be determined by “pressure mapping” a
building or portion of a building under imposed known air flows. Under this approach, the
pressure response of the building (or portion of building) is measured as a result of the
imposed known air flows. These pressures and imposed flows are input into the model and
air leakage path resistances are calculated meeting the convergence criterion. The calculated
air leakage path resistances are then “fixed”, and the subsequent effect of variable air flows,
wind and stack effects modeled.
Toward an Understanding and Prediction of Air Flow in Buildings
54
This differs from standard multi-cell model analysis where the inputs are wind and
stack pressures, flow rates relating to the air conveyance systems (currents) and air leakage
characteristics (resistance's) of the building components. Outputs are component air flows
(currents) and component air pressures (voltages).
The discussed approach avoids the difficulties of predicting component air leakage
characteristics since component leakage areas are calculated from air pressures and air flows
measured directly. Additionally, the non-linearity typically introduced in multi-cell
numerical analysis in dealing with calculating pressures from flows is also avoided since the
pressures are measured directly. In practice it is very difficult to isolate the air flows, but it
is relatively easy to isolate the air pressures.
Accuracy of the analytical model can be further increased by perturbing the flow
field, the leakage field or the pressure field. By determining the effect of the perturbation on
the pressure field, the analytical model can be refined or “tuned” to match the response of
the building under a similar model based perturbation. In this manner gaps in the
information describing the boundary conditions of the model can be filled in.
Toward an Understanding and Prediction of Air Flow in Buildings
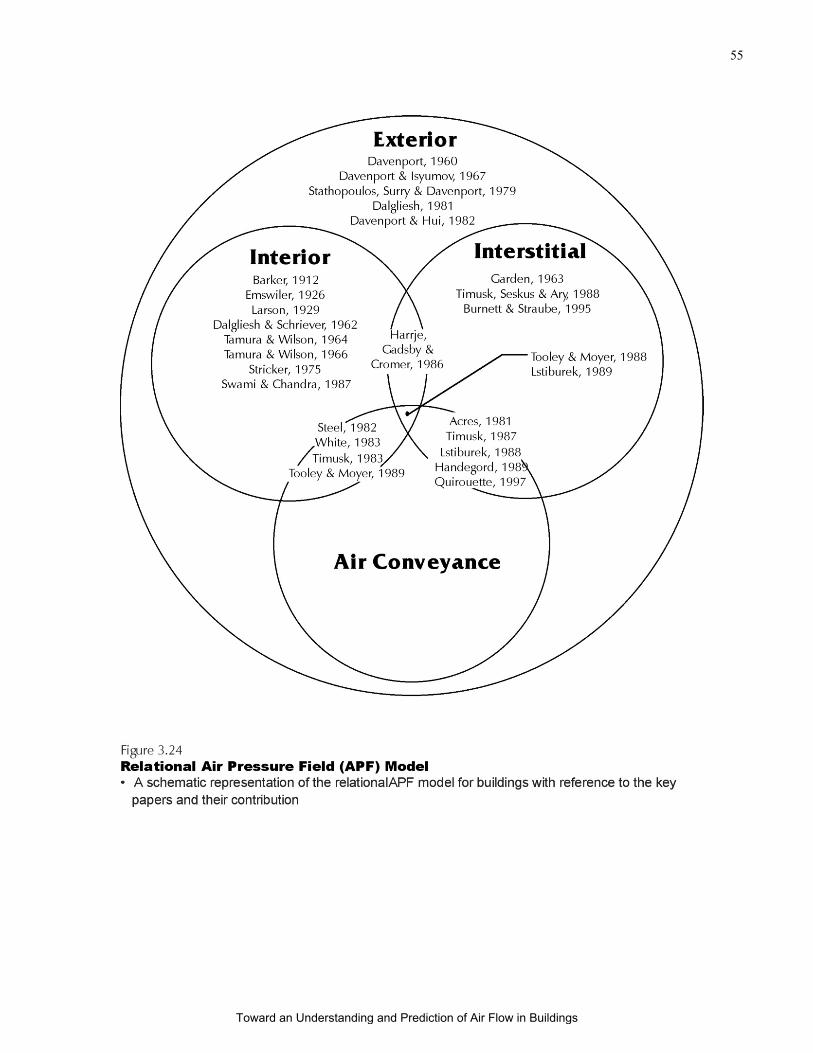
55
Toward an Understanding and Prediction of Air Flow in Buildings
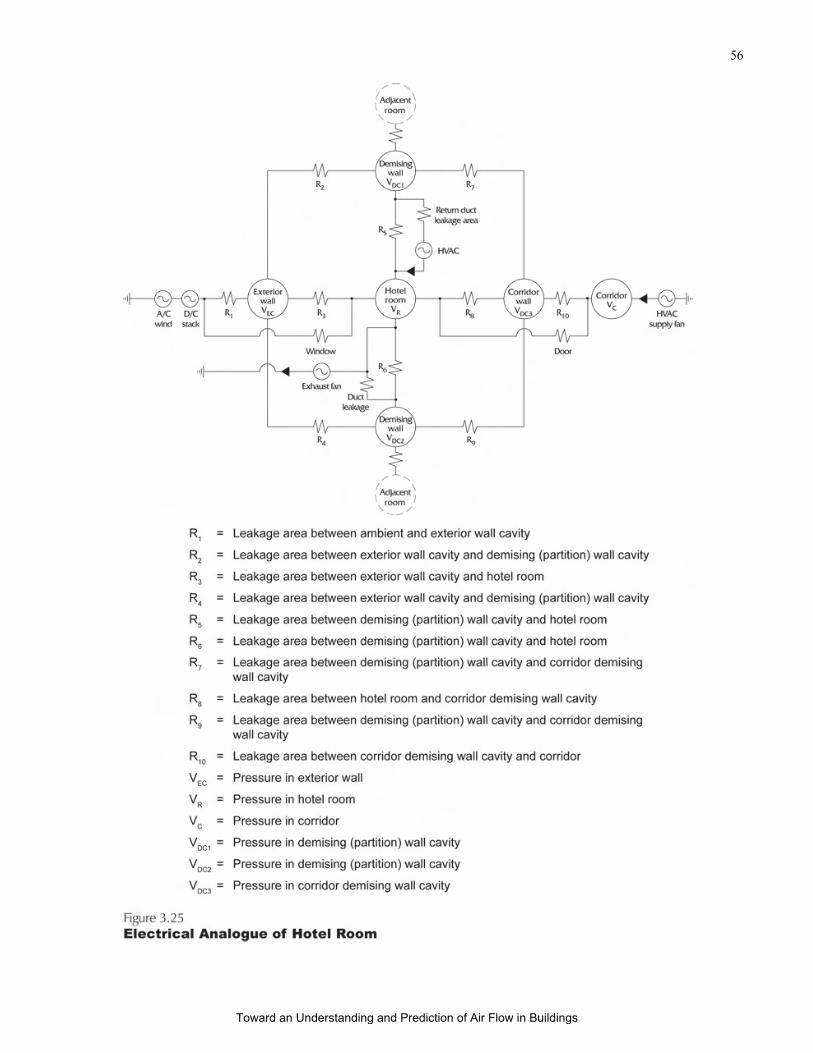
56
Toward an Understanding and Prediction of Air Flow in Buildings
57
IV Air Pressure Response
Toward an Understanding and Prediction of Air Flow in Buildings
58
Measuring Air Pressure Fields
The prevailing air pressure differences in the interstitial and the interior fields are
small. Until recently they have been difficult to measure and quantify. Most investigators
have relied on smoke tubes to detect air flows. Smoke tubes are extremely sensitive even
for small air pressure differences (the author has found them useful with air pressure
differences of less than 1 Pa) and can establish the direction of air flow.
Timusk (1983) found that air pressure measurement resolution on the order of 1 Pa
was necessary in conducting research on chimney backdrafting and air pressure drivers
within houses. Timusk (1987) found that measuring even lower air pressure differences
was necessary when testing dynamic wall insulation. Inclined fluid manometers and
diaphragm-type magnetic linkage pressure gauges were not sufficiently sensitive for these
research needs.
While digital electronic micromanometers with resolution of 0.1 Pa provided the
necessary resolution, see Timusk (1983), they were expensive and difficult to obtain. It was
not until recently that low cost (less than $1,000) portable digital electronic
micromanometers became widely available. With availability, came opportunity for field use
unimaginable only years before. Differential air pressure measurements can now be
conducted easily, quickly and inexpensively. These breakthroughs in measurement
technology set the stage for the enhanced understanding of air pressure drivers in buildings
(Tooley & Moyer, 1988; Lstiburek, 1989; Blasnik & Fitzerald, 1992).
Air Pressure Differential Measurements
Figures 4.1 and 4.2 illustrate the use of a digital electronic micromanometer to
measure the air pressure difference between the exterior and interior and between the
exterior and an interstitial cavity in a demising wall respectively. Photograph 2 shows a
digital electronic micromanometer in a typical setup measuring an air pressure difference
across a wall assembly.
As it became clear that the linkage between different component air pressure fields is
critical for the understanding of building performance, a need for specialized measurement
technology became apparent. Moyer developed a six channel digital electronic
micromanometer to establish a "pressure map" of a nursing home facility (Lstiburek &
Moyer, 1991). The pressure map records the magnitude and direction of the pressure
relationships within the facility under a set of specific operating conditions such as the
operation of the facility HVAC system or under a given interior to exterior temperature
difference. Figure 4.3 and Photograph 3 illustrate the six channel digital electronic
micromanometer set up to pressure map the hotel room described in Figure 2.10. The
Toward an Understanding and Prediction of Air Flow in Buildings

59
multi-channel manometer is connected to a laptop computer which records and graphically
displays the air pressure differentials simultaneously.
Air pressure measurements are often taken relative to the exterior ambient pressure.
During initial field research, calm wind conditions (less than 10 kph) were necessary in
order to develop an understanding of the building air pressure relationships. Calm wind
conditions allow accurate determination of the exterior air pressure field, which can act as a
reference for all other pressure measurements.
Measurement protocols evolved with field experience. Manometers with time-
averaging capabilities allow accurate determination of the exterior air pressure field even
under moderate wind conditions (10 kph to 25 kph). Although it is still desirable to use the
exterior ambient as the reference air pressure, in many cases building common areas such as
atria, crawlspaces or attics were found to act as reasonable reference air pressures. Wind
effects were found to alter the interior to exterior air pressures in accordance with the
conventional view. However, in most cases wind effects did not alter the relationships
occurring as a result of the coupling of the building envelope and the mechanical systems.
Specifically, many of the air pressure relationships occurring among the interstitial field, the
interior field and the air conveyance system field were able to be determined under moderate
wind effects.
The standard measurement protocol used when testing the hotel room illustrated in
Figure 3.6 involves instrumentation shown in Figure 4.3. This protocol involves
measurement of air pressures under many possible combinations of building HVAC system
operation and building envelope leakage pathways. For example the operation of building
air conveyance systems includes various combinations of open and closed interior
doorways. The effect of these changes on the building air pressure field is recorded.
Air pressure measurements usually only represent a "snapshot" of the air pressure
field. Snapshot air pressure measurements may or may not be representative of the air
pressure field of the building. Skill and insight by the investigator conducting
measurements are necessary to interpret the snapshot air pressure measurements. Snapshot
mapping of building air pressure fields is made more effective if the building HVAC system
can be cycled through the various operational conditions (including the effects of door
closure). Especially when this is combined with knowledge of the building operational
conditions over a daily, weekly and seasonal basis. However, such cycling is not always
possible nor under the control of the investigator. Long term air pressure differential
monitoring is sometimes necessary and desirable to establish air pressure relationships
through the "normal" building operating range.
Building air pressure fields often have daily, weekly and seasonal patterns. For
example, most buildings do not operate their HVAC systems at full capacity or at night or
Toward an Understanding and Prediction of Air Flow in Buildings
60
over weekends. Additionally, building exhaust fans are often operated on timers.
Specialized exhaust fans, such as kitchen range hood exhausts, dryers and spot ventilators
operate only as needed. Large differences in air flow induced by HVAC systems also occur
between maximum heating and maximum cooling conditions. During "swing" seasonal
conditions, economizer operation usually provides the largest air flow rates and the largest
air pressure extremes. Additionally, stack effect pressures vary with indoor to outdoor
temperature differences further complicating matters.
Figure 4.4 shows the monitoring of air pressure relationships between a hallway and
work area in a laboratory facility in New Hampshire over a period of two days. The
measurements were taken by connecting a digital micromanometer with an analog output to
a stand alone electronic data storage microprocessor. The data storage capacities of the data
storage microprocessor allow measurements to be taken over several weeks. Data is
downloaded into a laptop computer where data manipulation and analysis can occur.
Figure 4.5 illustrates the use of digital electronic micromanometers to measure the
air pressure distribution across the elements of a wall assembly.
Series Pressure Differential
The general relationship between air flow and pressure was shown by Equation 2-4
(see Currie, 1974). Let the leakage coefficient, C, be expressed as:
C = CD A
where CD = discharge coefficientA = area
Q = CD A (Δp)n (4 - 1)from Hutcheon & Handegord, 1983
As illustrated in Figure 4.5, the cavity air pressure will be that at which the air flows
into and out of the wall cavity are balanced. Assuming no leakage across the floors, that is
no leakage out of the top and bottom of the wall cavity, the following holds:
Toward an Understanding and Prediction of Air Flow in Buildings
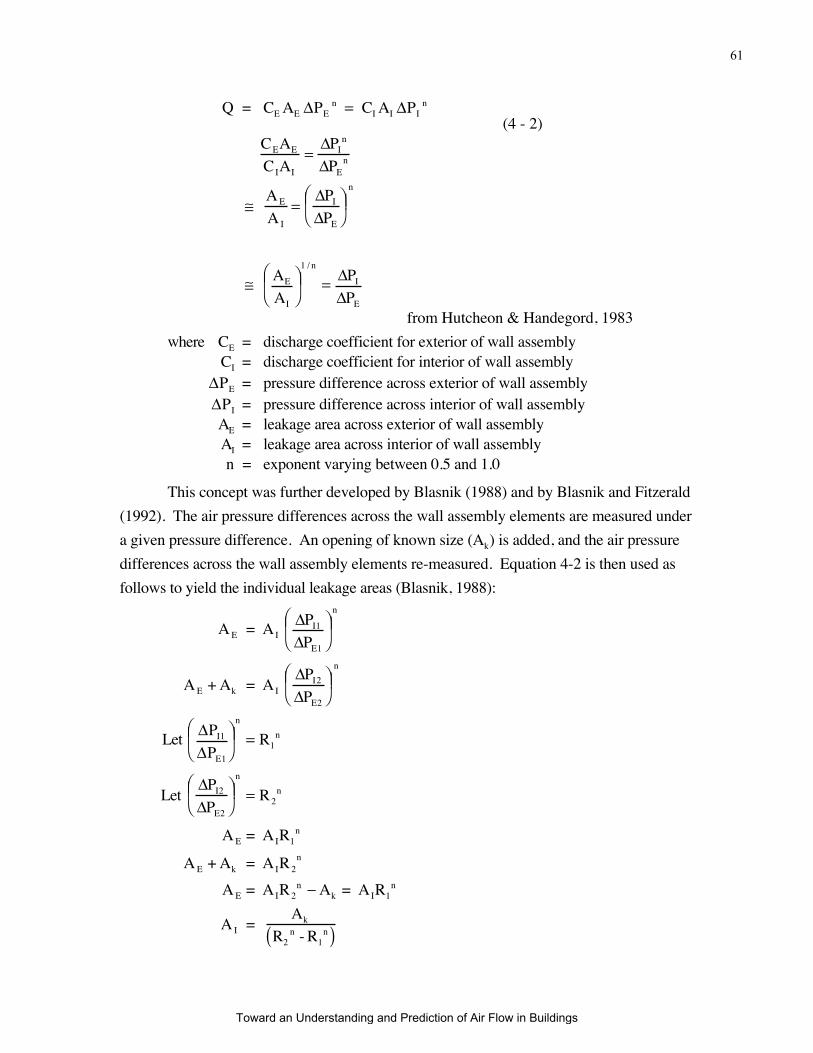
61
Q = CE AE ΔPE n = CI AI ΔPI
n
(4 - 2)
from Hutcheon & Handegord, 1983
where CE = discharge coefficient for exterior of wall assemblyCI = discharge coefficient for interior of wall assembly
ΔPE = pressure difference across exterior of wall assemblyΔPI = pressure difference across interior of wall assemblyAE = leakage area across exterior of wall assemblyAI = leakage area across interior of wall assemblyn = exponent varying between 0.5 and 1.0
This concept was further developed by Blasnik (1988) and by Blasnik and Fitzerald
(1992). The air pressure differences across the wall assembly elements are measured under
a given pressure difference. An opening of known size (Ak) is added, and the air pressure
differences across the wall assembly elements re-measured. Equation 4-2 is then used as
follows to yield the individual leakage areas (Blasnik, 1988):
A E = AI ΔPI1
ΔPE1
⎛ ⎝ ⎜ ⎞
⎠ ⎟
n
A E + Ak = AI ΔPI2
ΔPE2
⎛ ⎝ ⎜ ⎞
⎠ ⎟
n
Let ΔPI1
ΔPE1
⎛ ⎝ ⎜ ⎞
⎠ ⎟
n
= R1n
Let ΔPI2
ΔPE2
⎛ ⎝ ⎜ ⎞
⎠ ⎟
n
= R2n
A E = AIR1n
A E + Ak = AIR2n
A E = AIR2n − Ak = AIR1
n
A I = Ak
R2n - R1
n( )
CEAE
CIAI
=ΔPI
n
ΔPEn
≅ A E
A I
=ΔPI
ΔPE
⎛ ⎝ ⎜ ⎞
⎠ ⎟
n
≅ AE
AI
⎛ ⎝ ⎜ ⎞
⎠ ⎟
1 / n
= ΔPI
ΔPE
Toward an Understanding and Prediction of Air Flow in Buildings
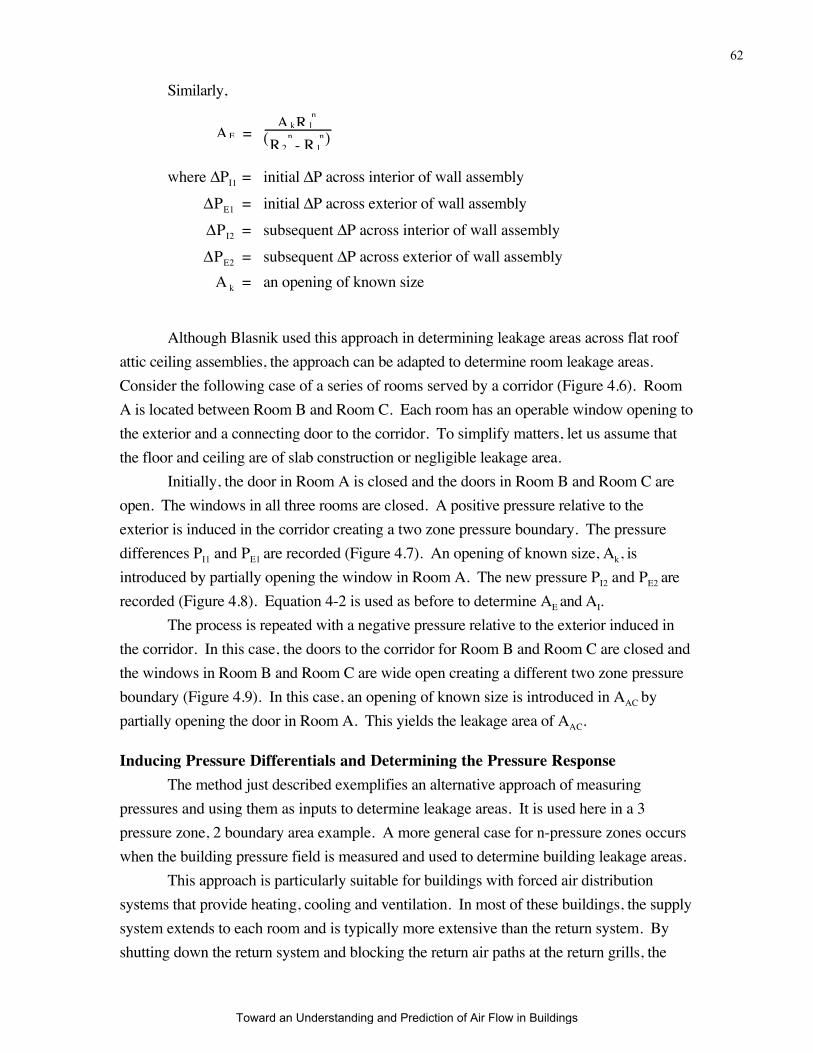
62
Similarly,
where ΔPI1 = initial ΔP across interior of wall assembly
ΔPE1 = initial ΔP across exterior of wall assembly
ΔPI2 = subsequent ΔP across interior of wall assembly
ΔPE2 = subsequent ΔP across exterior of wall assembly
A k = an opening of known size
Although Blasnik used this approach in determining leakage areas across flat roof
attic ceiling assemblies, the approach can be adapted to determine room leakage areas.
Consider the following case of a series of rooms served by a corridor (Figure 4.6). Room
A is located between Room B and Room C. Each room has an operable window opening to
the exterior and a connecting door to the corridor. To simplify matters, let us assume that
the floor and ceiling are of slab construction or negligible leakage area.
Initially, the door in Room A is closed and the doors in Room B and Room C are
open. The windows in all three rooms are closed. A positive pressure relative to the
exterior is induced in the corridor creating a two zone pressure boundary. The pressure
differences PI1 and PE1 are recorded (Figure 4.7). An opening of known size, Ak, is
introduced by partially opening the window in Room A. The new pressure PI2 and PE2 are
recorded (Figure 4.8). Equation 4-2 is used as before to determine AE and AI.
The process is repeated with a negative pressure relative to the exterior induced in
the corridor. In this case, the doors to the corridor for Room B and Room C are closed and
the windows in Room B and Room C are wide open creating a different two zone pressure
boundary (Figure 4.9). In this case, an opening of known size is introduced in AAC by
partially opening the door in Room A. This yields the leakage area of AAC.
Inducing Pressure Differentials and Determining the Pressure Response
The method just described exemplifies an alternative approach of measuring
pressures and using them as inputs to determine leakage areas. It is used here in a 3
pressure zone, 2 boundary area example. A more general case for n-pressure zones occurs
when the building pressure field is measured and used to determine building leakage areas.
This approach is particularly suitable for buildings with forced air distribution
systems that provide heating, cooling and ventilation. In most of these buildings, the supply
system extends to each room and is typically more extensive than the return system. By
shutting down the return system and blocking the return air paths at the return grills, the
AE =AkR1
n
R2n- R1
n( )
Toward an Understanding and Prediction of Air Flow in Buildings
63
supply system can be used to induce a positive pressure field within the building that is
readily measured using the techniques previously described. Additionally, test and balance
information (or techniques) can be used to yield the flow rates to individual rooms. In this
manner, individual supply air flows can be matched to individual room pressures throughout
the building yielding a combined pressure and flow map. The pressure and flow map can
be used to determine the leakage areas or boundary conditions of the interconnected zones
using a multi-cell network model.
Where forced air systems are not present, calibrated fans (e.g. blower door fans) can
be used to supply a known air flow inducing a measurable pressure field. This technique
can be extended with multiple fans used to simulate the effect of a supply system where
corridors and stairwells are used as ducts and risers.
In the general case described, the multi-cell network model matrix equations are not
altered. However, an inverse method has been used where pressures are measured inputs to
the model and leakage areas are outputs.
Toward an Understanding and Prediction of Air Flow in Buildings
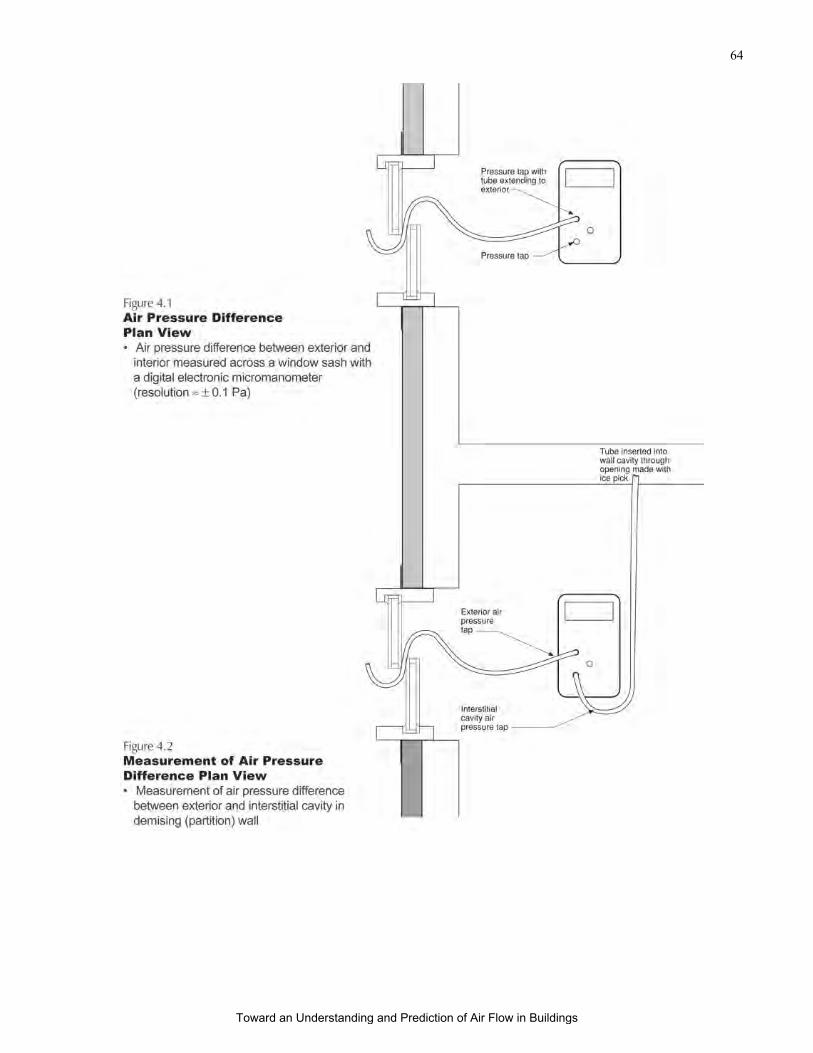
64
Toward an Understanding and Prediction of Air Flow in Buildings
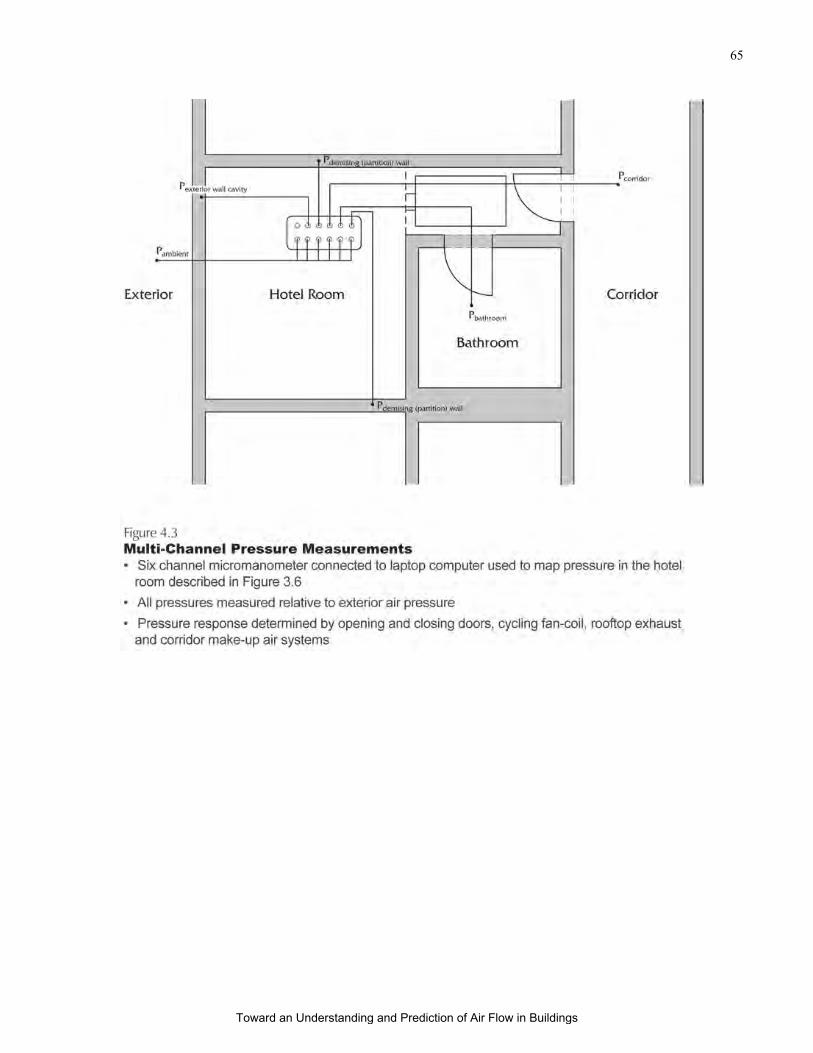
65
Toward an Understanding and Prediction of Air Flow in Buildings
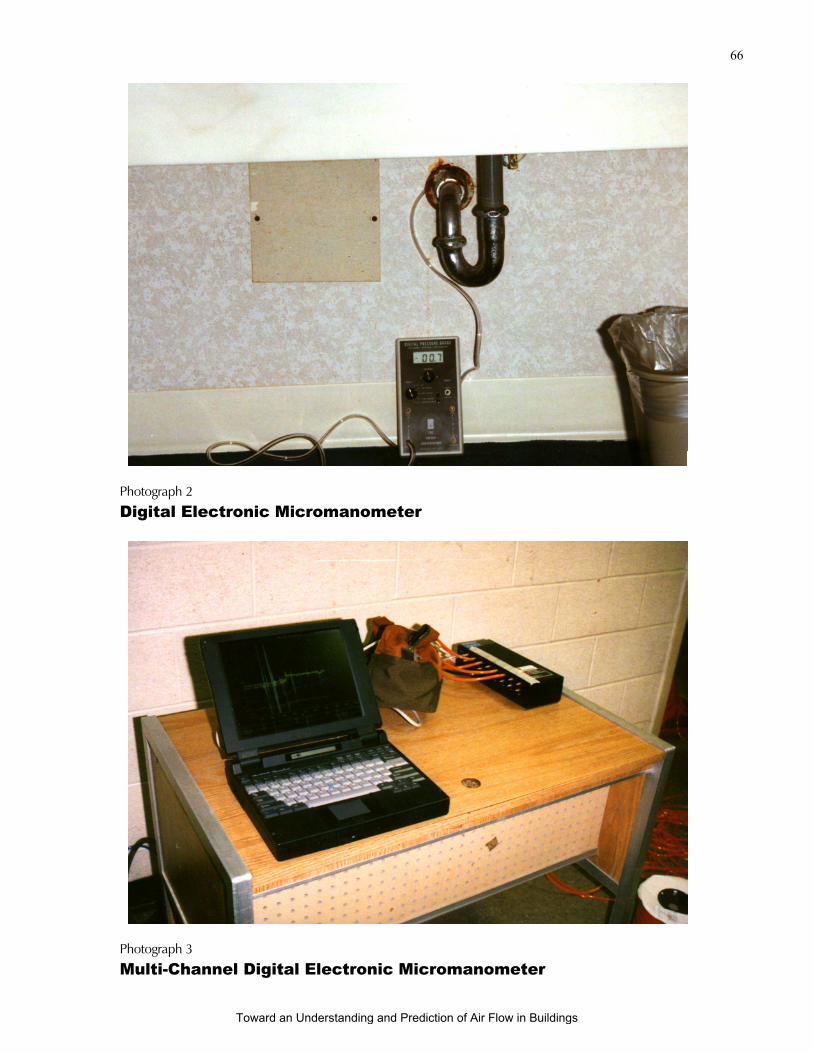
66
Photograph 2
Digital Electronic Micromanometer
Photograph 3
Multi-Channel Digital Electronic Micromanometer
Toward an Understanding and Prediction of Air Flow in Buildings
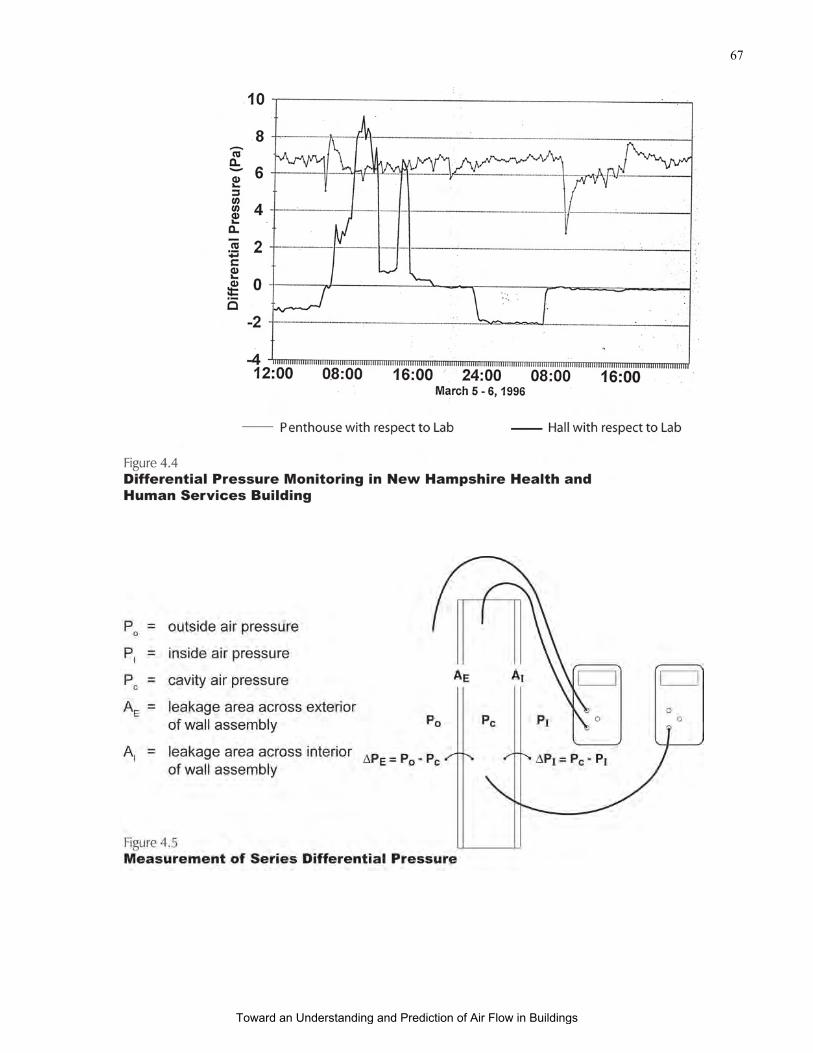
67
Toward an Understanding and Prediction of Air Flow in Buildings
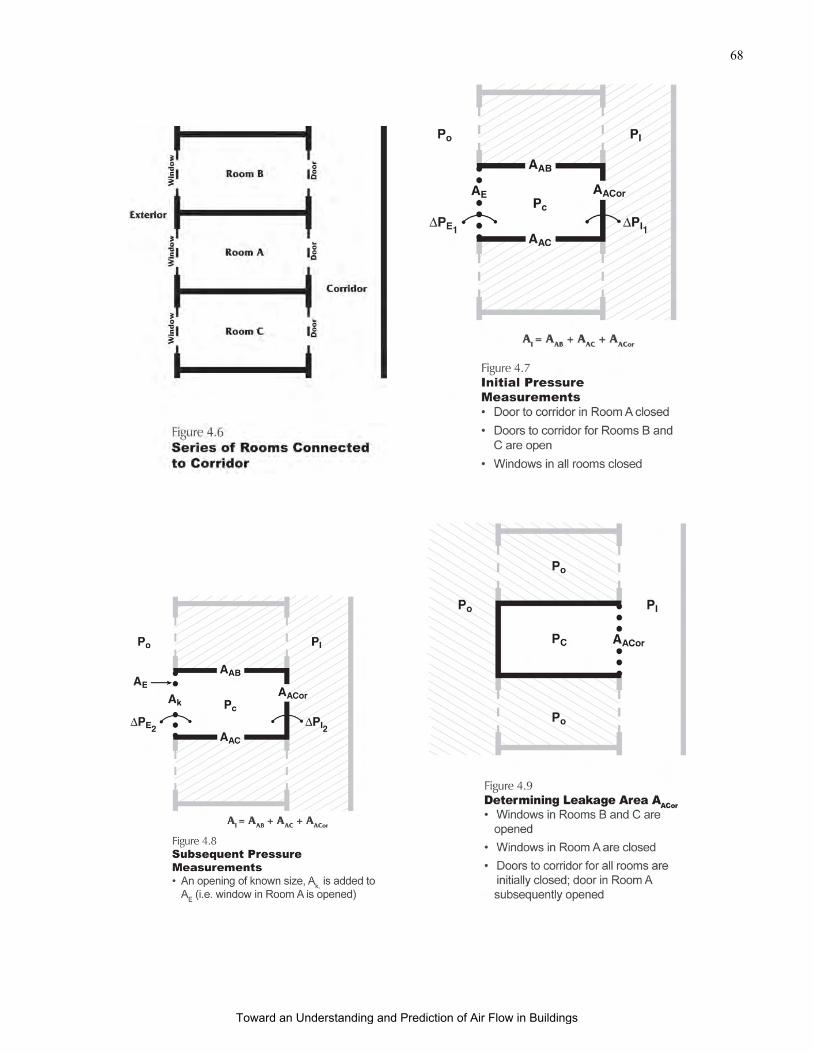
68
Toward an Understanding and Prediction of Air Flow in Buildings
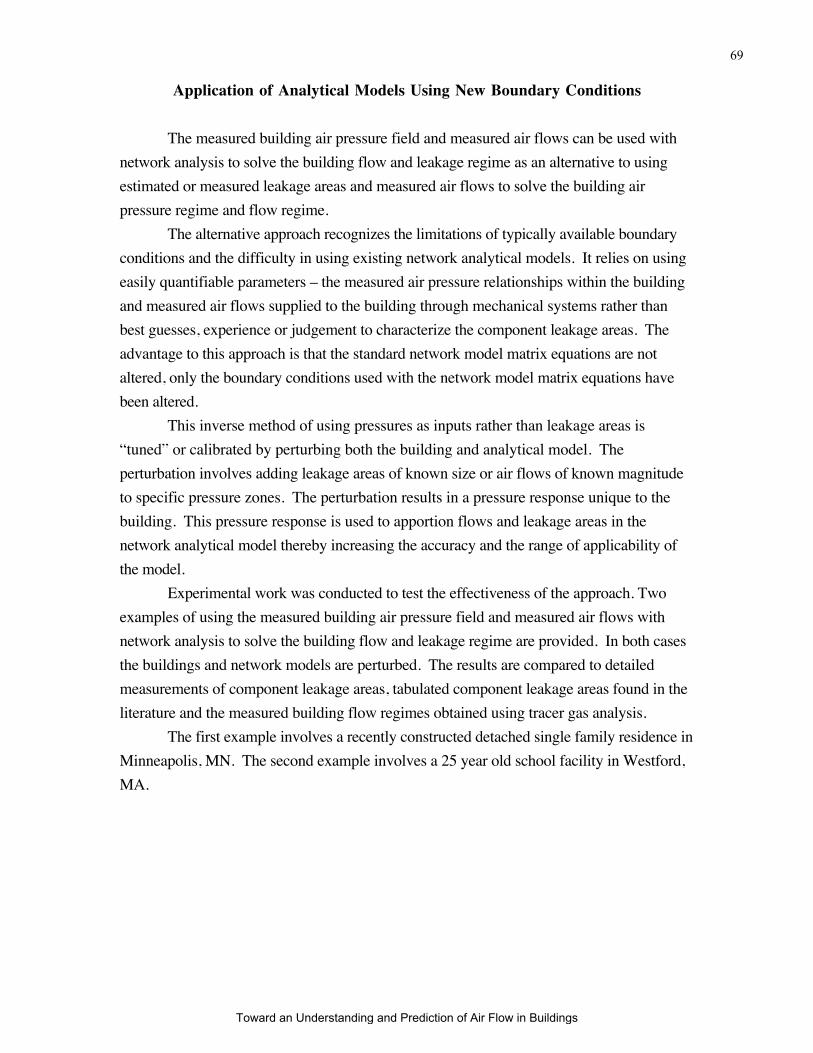
69
Application of Analytical Models Using New Boundary Conditions
The measured building air pressure field and measured air flows can be used with
network analysis to solve the building flow and leakage regime as an alternative to using
estimated or measured leakage areas and measured air flows to solve the building air
pressure regime and flow regime.
The alternative approach recognizes the limitations of typically available boundary
conditions and the difficulty in using existing network analytical models. It relies on using
easily quantifiable parameters – the measured air pressure relationships within the building
and measured air flows supplied to the building through mechanical systems rather than
best guesses, experience or judgement to characterize the component leakage areas. The
advantage to this approach is that the standard network model matrix equations are not
altered, only the boundary conditions used with the network model matrix equations have
been altered.
This inverse method of using pressures as inputs rather than leakage areas is
“tuned” or calibrated by perturbing both the building and analytical model. The
perturbation involves adding leakage areas of known size or air flows of known magnitude
to specific pressure zones. The perturbation results in a pressure response unique to the
building. This pressure response is used to apportion flows and leakage areas in the
network analytical model thereby increasing the accuracy and the range of applicability of
the model.
Experimental work was conducted to test the effectiveness of the approach. Two
examples of using the measured building air pressure field and measured air flows with
network analysis to solve the building flow and leakage regime are provided. In both cases
the buildings and network models are perturbed. The results are compared to detailed
measurements of component leakage areas, tabulated component leakage areas found in the
literature and the measured building flow regimes obtained using tracer gas analysis.
The first example involves a recently constructed detached single family residence in
Minneapolis, MN. The second example involves a 25 year old school facility in Westford,
MA.
Toward an Understanding and Prediction of Air Flow in Buildings
70
Single Family Residence – Minneapolis House
To test the effectiveness of using the pressure response of a building to solve the
building air flow regime, experimental work was conducted on a single family residence in
Minneapolis, MN. Field experimentation was selected over laboratory experimentation,
apart from the obvious cost implications, in order to take advantage of the randomness and
variability of real buildings.
In the analysis of residential structures several parameters are often readily available
or readily determined:
• the total building envelope leakage area (usually determined by a “blower
door” test); and
• the individual HVAC system supply and return flows to bedrooms and
other areas of the house (usually determined with a flow hood).
What is often very difficult to obtain or determine are the following:
• the leakage area of individual zones or spaces; and
• the air flow within and across individual zones or spaces.
However, all this information is necessary in order to take advantage of the powerful
capabilities of available multi-cell network analytical models. The experimental work used
the pressure response approach, the perturbation of the building pressure field, to determine
this often difficult to obtain information and compared the results with information obtained
in a more traditional manner – namely tracer gas testing.
In the field experiment, the house pressure field was perturbed as follows:
• air flows of known magnitude were imposed using the house HVAC
system; and
• leakage areas of known magnitude were added by opening windows.
The pressure response of each of the two perturbations was recorded. The pressure
response of one type of perturbation was used to “tune” a network analytical model. The
“tuning” involved apportioning the network analytical model leakage areas until the
network analytical model pressure response matched the field measurements. Once tuned
using this back calculation approach, the network analytical model was perturbed using the
other perturbation approach. The response of the model perturbed in this manner was
compared to the actual house response due to a similar type of perturbation.
Additionally, as part of the field experimental work, two types of tracer gas testing
were conducted. The results of the field tracer gas testing were compared with predicted
tracer gas results of the previously “tuned” network analytical model.
Toward an Understanding and Prediction of Air Flow in Buildings
71
The intent was to show that different methods of perturbation give similar results in
the apportioning of leakage areas and subsequently to show that the apportioning of
network analytical model leakage areas using pressure field perturbation provides good
agreement with tracer gas testing results.
Finally, the perturbation approach to apportioning network analytical model leakage
areas was compared with results obtained using tabulated values for leakage areas found in
the literature.
Experimental Work – Minneapolis House
The single family residence in question was constructed in 1998 in a commuter
suburb of the twin cities of Minneapolis and St. Paul, MN (Photograph 4). It is a two story
wood frame structure constructed over a cast concrete basement foundation. The floor plan
is presented in Figure 4.10. The residence can be represented by the six zone relational
model presented in Figure 4.11.
The exterior walls are constructed of 38 mm by 140 mm studs insulated with
fiberglass cavity insulation. The exterior sheathing consists of 25 mm fiberboard. The
exterior cladding is vinyl siding. No housewrap or exterior building paper is present. An
interior polyethylene air flow retarder/vapor diffusion retarder is installed under 12 mm
interior gypsum sheathing. The floor system for the main floor and for the second floor is
structural oriented stand board over engineered wood joists. The basement floor is a
concrete slab cast over sheet polyethylene and crushed stone.
Eight exterior air pressure taps were installed. Pressure taps were located high and
low on each of the four exterior walls immediately beneath the vinyl siding. The low taps
were located approximately 1.5 m above grade and the high taps were located approximately
5 m above grade. Additionally, a pressure tap was installed within the vented attic space.
The exterior air pressure reference was established by extending tubing to the four sides of
the residence at grade level and connecting the tubing to a pressure averaging chamber.
Winds during the time of air pressure field testing were intermittent, causing
pressure fluctuations at the surface of the building envelope ±10 Pa. Interior temperatures
varied between 19 and 21 degrees C. Exterior temperatures were minus 15 degrees C.
A representative plot of these exterior air pressures during the time of testing is
presented in Figure 4.12. Note that the attic air pressure difference relative to the interior
common area remains extremely stable. Experience has shown that under moderate wind
conditions (10 kph to 25 kph) well vented attic spaces often make for a good reference
pressure when exterior surface pressures fluctuate excessively and the use of numerous
exterior pressure taps and a pressure averaging chamber is impractical.
A standard depressurization test, yielding a building leakage curve as described in
Figure 4.13, was conducted. During this test all interior doors were open. This test
Toward an Understanding and Prediction of Air Flow in Buildings
72
quantifies the leakage area of the building envelope (the exterior walls, insulated ceiling, the
walls separating the garage from the interior conditioned space, basement walls and
basement slab).
The building was perturbed by adding a single flow of known magnitude to the
common area zone creating differential pressures across the six zones. The perturbation
was accomplished by conducting a modified depressurization test. During this test, the
doors connecting the individual zones were closed and the duct distribution supply and
return system sealed while air was extracted from the common area. An exhaust flow of
475 L/s was imposed on the common area of the residence. The resulting pressure field as
recorded is presented in Figure 4.14 and Figure 4.15.
A six zone analytical model was created using a standard network model,
CONTAM96 (Walton, 1997). CONTAM96 is a resistance based network model
developed by the National Institute for Standards and Technology (NIST). The analytical
model was configured to the relational model presented in Figure 4.11.
Using information from the standard depressurization test and a manual iterative
(trial and error) process, the leakage areas in the CONTAM96 analytical model were
apportioned until reasonable agreement occurred between the pressure field recorded in
Figure 4.15 due to the perturbation resulting from adding an exhaust flow of 475 L/s to the
common area and the pressure field output from the CONTAM96 analytical model
subjected to the same exhaust flow (Figure 4.16). The details describing this “tuned” or
calibrated CONTAM96 analytical model are contained in Appendix A.
The results are compared in Table 4.1. Note that the greatest variation exists with
respect to the southeast bedroom. This was initially believed to be due to the limits of
either the manual iterative process or some unidentified pathway in the building.
The pressure response of the residence was then used to test the pressure response
of the “tuned” analytical model. The pressure field in the residence was perturbed two
different ways to create a pressure response:
• air flows of known magnitude were imposed on individual zones and the
resulting air pressure field recorded; and
• leakage areas of known magnitude were introduced to individual zones and
the resulting air pressure field recorded.
The “tuned” CONTAM96 analytical model (as configured in Figure 4.16 and
described in Appendix A) was similarly perturbed and the pressure response of the model
compared with the actual building pressure response.
Toward an Understanding and Prediction of Air Flow in Buildings
73
Imposed Air Flows – Minneapolis House
Air flows of known magnitude were imposed on individual zones by using the
house furnace and supply duct system. Bedroom doors were closed and return ducts in the
bedrooms were sealed. The basement door was left open. Air was pushed into the
bedrooms from the common area by the operation of the furnace fan. Supply flows were
measured using a calibrated fan (a “duct blaster”) and the resulting air pressure field, the
building pressure response, was recorded (Figure 4.17).
Similar air flows were imposed on the tuned CONTAM96 analytical model (as
previously configured in Figure 4.16 and described in Appendix A). The model pressure
response is recorded in Figure 4.18. The results are compared in Table 4.2. The actual
pressure response of the building and the pressure response of the model “trend” in the
same manner and show excellent agreement except for the southeast bedroom.
Imposed Leakage Areas – Minneapolis House
Exterior windows were opened and closed under conditions where the common area
was depressurized with an exhaust flow that varied between 465 L/s and 475 L/s. The
bedroom doors and the basement door were closed and the supply and return ducts were
sealed. Exterior windows in individual zones were opened and closed on a 15 second cycle
(closed 15 seconds, open 15 seconds) for four cycles each. The varying pressure field
within the house and varying exhaust flows were continuously recorded (10 readings per
second) using a multi-channel digital micromanometer (Energy Conservatory Multi-
Channel Mircromanometer) and plotted (Figure 4.19 through Figure 4.30). The values
from the plots are summarized in Table 4.3.
Figure 4.21, Figure 4.24, Figure 4.27 and Figure 4.30 show the variation in flow
through the exhaust fan as individual windows are opened and closed. The fan controls
were not adjusted during the opening and closing of the exterior windows. However, the
resistance to flow was affected due to the varying of the leakage areas. The flow through
the fan modulated in phase with the opening and closing of the individual window openings
as did the common area pressure (“house pressure”). The variation in house pressure due
to the opening and closing of the individual windows is seen in Figure 4.19, Figure 4.22,
Figure 4.25 and Figure 4.28. Exhaust fan flows and common area pressures hovered
around 465 L/s and minus 56 Pa when individual windows were closed. The values
changed to 475 L/s and minus 44 Pa when individual windows were open.
Examination of the plots indicate that the building pressure field - when window
openings were closed - remained stable throughout the window opening and closing test
sequence.
Figure 4.20, Figure 4.23, Figure 4.26 and Figure 4.29 show the dynamic response
of the building pressure field responding to the opening and closing of individual bedroom
Toward an Understanding and Prediction of Air Flow in Buildings
74
windows. The magnitude of the specific responses to the individual window openings can
be found in Table 4.3.
Table 4.4 contains the results of the dynamic response of the tuned CONTAM96
analytical model (as previously configured in Figure 4.16 and described in Appendix A).
Table 4.5 compares the tuned analytical model pressure field variations with the actual field
measurements. Note that the dynamic pressure response of the building and the dynamic
pressure response of the tuned model trend in the same manner and show good agreement.
Again, the largest variation occurs with respect to the southeast bedroom.
A “standard” CONTAM96 analytical model was constructed using the field
measured building envelope leakage area. The analytical model was configured to the
relational model presented in Figure 4.11. Internal leakage areas were obtained from
tabulated results contained in the literature (ASHRAE, 1997). The envelope leakage area
was apportioned as per common convention (ceiling 1/3, above grade walls 1/3 and
basement 1/3). A 25 mm undercut was assumed for all interior doors. Leakage areas for
interior partitions and floors were specified as follows:
Al/Aw = 0.00011 @ 75 Pa with the CD = 0.65 (4-3)see ASHRAE, 1997
where Al = air leakage areaAw = wall or floor areaCD = discharge coefficient
The details describing this “standard” model are contained in Appendix B.
This standard CONTAM96 analytical model (Figure 4.31) was run with a similar
exhaust flow and similar configuration to the Minneapolis house as described in Figure
4.15 and the tuned CONTAM96 analytical model described in Figure 4.16.
Table 4.6 contains a comparison of the actual measured data from the house and the
data derived from both the standard model and the tuned model. The standard model shows
significant variations from actual measured data and the tuned model.
Tracer Gas Testing – Minneapolis House
Two tracer gas tests were conducted. Sulfur hexafluoride (SF6) was the tracer gas.
The gas analyzer was programmed to measure SF6 concentrations at approximately two
minute intervals at six locations: basement, first floor, northwest bedroom, southwest
bedroom, southeast bedroom and the northeast bedroom. This first test was conducted with
the house interior doors closed and furnace shut down. The return system and supply
system ductwork was sealed. Exterior wind pressures and temperatures were measured.
Toward an Understanding and Prediction of Air Flow in Buildings
75
Interior temperatures were maintained with portable electric resistance heaters. The heaters
were computer controlled to hold temperatures constant to within 0.5 C degrees. The
results are recorded in Figure 4.32.
The tuned CONTAM96 analytical model (as previously configured in Figure 4.16
and described in Appendix A), using the tracer gas decay module, was run under similar
wind pressure and temperature conditions as the actual first tracer gas test. The results are
presented in Figure 4.33.
The standard CONTAM96 analytical model (as described in Appendix B) was run
under similar wind pressure and temperature conditions as the first tracer gas test. The
results are presented in Figure 4.34.
Table 4.7 compares the results of Figure 4.32, Figure 4.33 and Figure 4.34 after a 3
hour decay period. Reasonable agreement among the actual air change measurements and
the two model predictions occurs. The largest divergence occurs with the standard
CONTAM96 analytical model predictions with respect to the basement air change.
The second tracer gas test was conducted with the interior doors closed and the
furnace fan operating on a 20 minute on – 40 minute off duty cycle. Interior temperatures
were again maintained with portable electric resistance heaters. The results are recorded in
Figure 4.35. The tuned CONTAM96 analytical model and the standard CONTAM96
analytical model were also run under similar conditions. The results are presented in Figure
4.36 and Figure 4.37 respectively.
Table 4.8 compares the results of Figure 4.35, Figure 4.36 and Figure 4.37 after a 4
hour decay period. Again the results provide reasonable agreement between predictions and
actual measurements. However, divergence is noted between actual air change and the
predicted air change of both models for the southeast bedroom and particularly between the
standard model and the actual basement air change.
After the analysis of the data from the tuned analytical model, specifically the
curious response of the southeast bedroom from both an air pressure response perspective
and tracer gas air change perspective, the Minneapolis house was subject to an exhaustive
physical examination. A construction defect was subsequently identified that connected the
southeast bedroom to the floor cavity, service chaseway containing the return air duct and
garage through a return system leak and incomplete floor cavity draftstopping. It is
hypothesized that such a pathway could affect the pressure response and air change of the
southeast bedroom during the perturbation testing in the manner the measured data
suggests.
Operation of the furnace was found to depressurize the floor cavity 0.5 Pa relative to
the common area, and the service chaseway containing the return air duct was found to be
Toward an Understanding and Prediction of Air Flow in Buildings

76
depressurized 9 Pa relative to the common area above the second floor draftstopping and 2
Pa relative to the common area below the second floor draftstopping.
Unfortunately, simultaneous interstitial cavity pressure measurements were not taken
during the perturbation testing that would enable verification of this hypothesis.
Additionally, the complex flow pathway described exceeds the current modeling capabilities
of COMTAM96 with respect to iterative “tuning” to allocate leakage areas along complex
flow pathways. In other words, the manual trial and error leakage apportioning approach
used in this thesis was found to be impractical to test this hypothesis. However, a
computerized apportioning approach meeting a convergence criteria is believed to be both
practical and likely to explain the observed phenomena. It remains a subject of future work
and a logical next step in furthering the applicability of the approaches presented in this
thesis.
It is significant to note that the network analysis used with the perturbation testing to
establish boundary conditions suggested the existence of the interstitial flow, pressure and
leakage regime that the depressurization of the floor cavity and service chaseway represents
– but confirmation required direct measurement.
It is also significant to note that the direct measurement was done with the furnace
running – in other words the furnace provided a “local” perturbation that was detected by
the air pressure differential measurement instrumentation – the digital micromanometer.
Photograph 4
Minneapolis House
Toward an Understanding and Prediction of Air Flow in Buildings

77
First Floor Plan
Second Floor PlanFigure 4.10
Minneapolis House
Floor Plan
Toward an Understanding and Prediction of Air Flow in Buildings
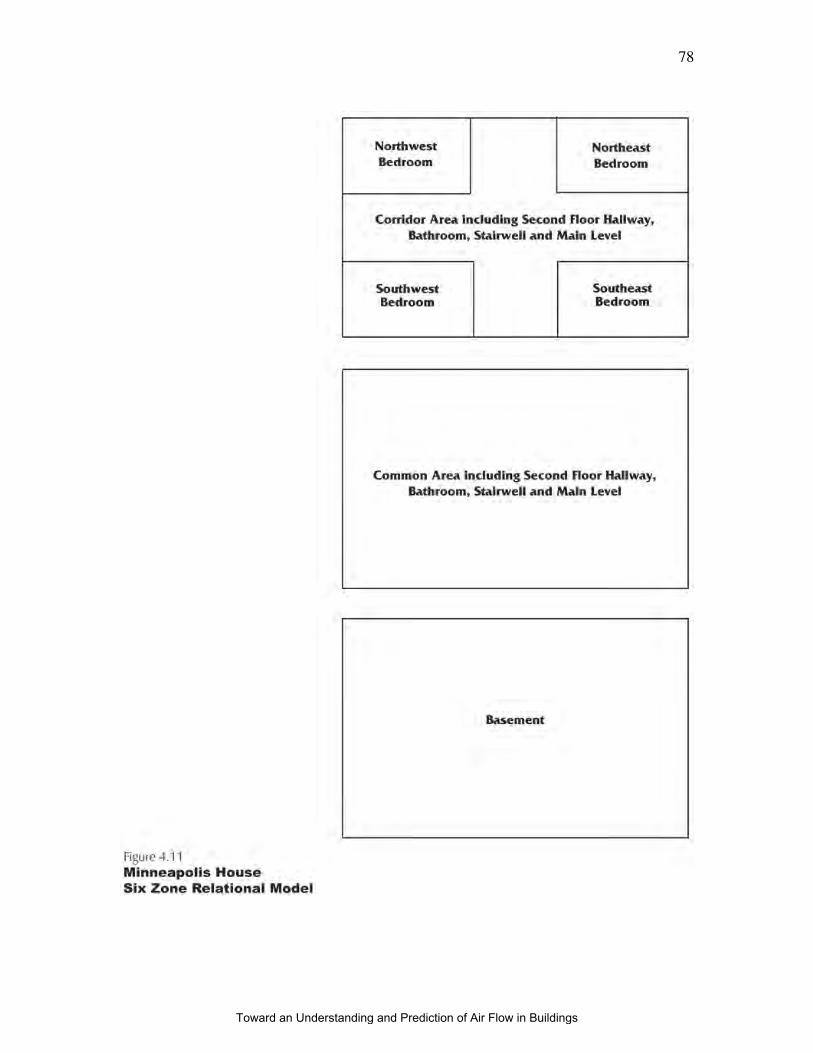
78
Toward an Understanding and Prediction of Air Flow in Buildings

79
Figure 4.12
Representative Exterior Air Pressures (Pa)
Toward an Understanding and Prediction of Air Flow in Buildings
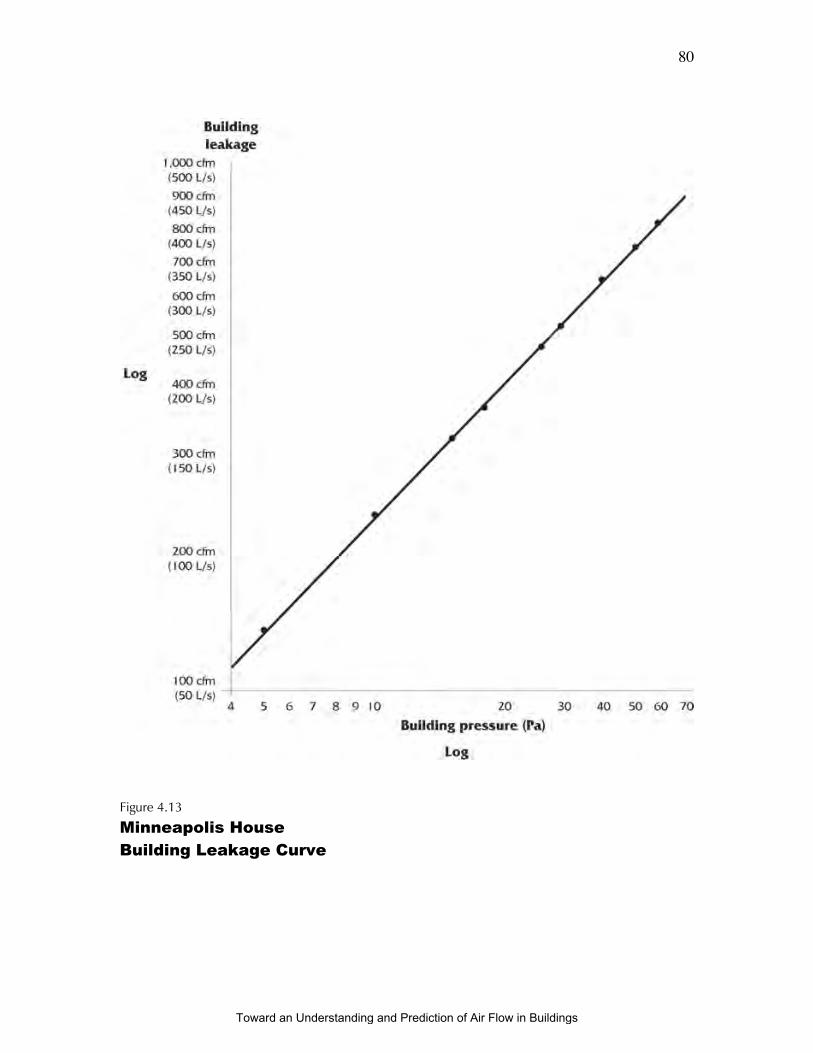
80
Figure 4.13
Minneapolis House
Building Leakage Curve
Toward an Understanding and Prediction of Air Flow in Buildings
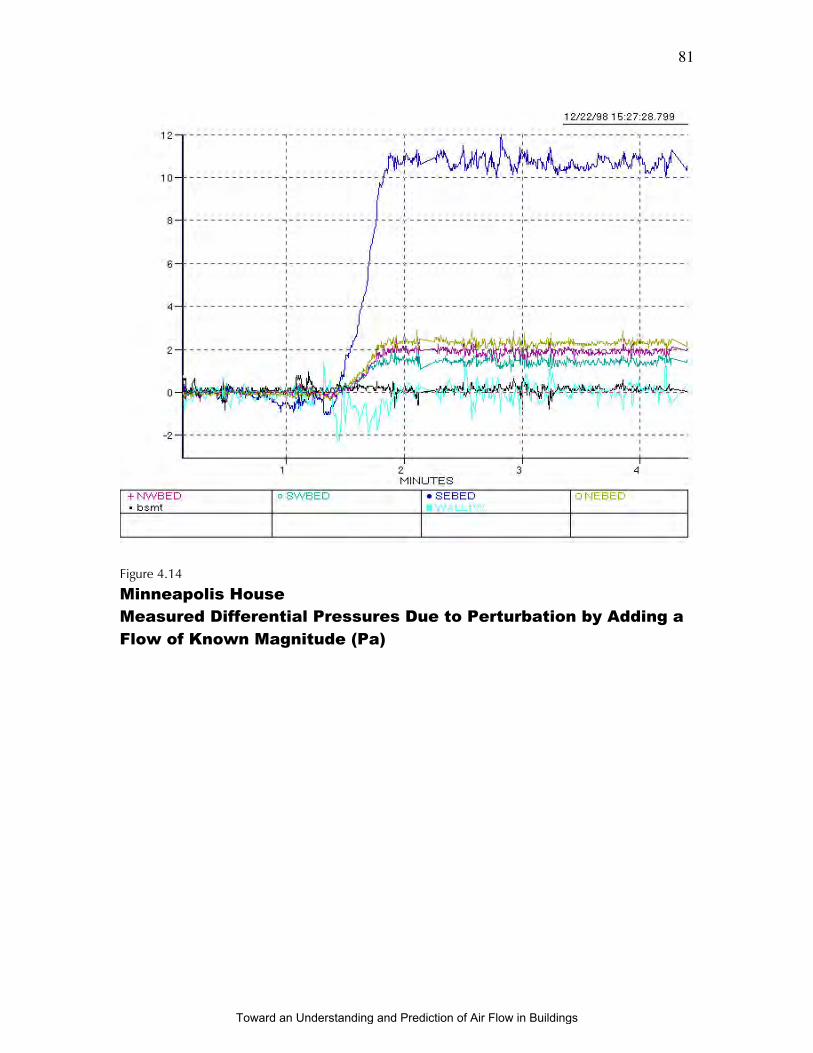
81
Figure 4.14
Minneapolis House
Measured Differential Pressures Due to Perturbation by Adding a
Flow of Known Magnitude (Pa)
Toward an Understanding and Prediction of Air Flow in Buildings
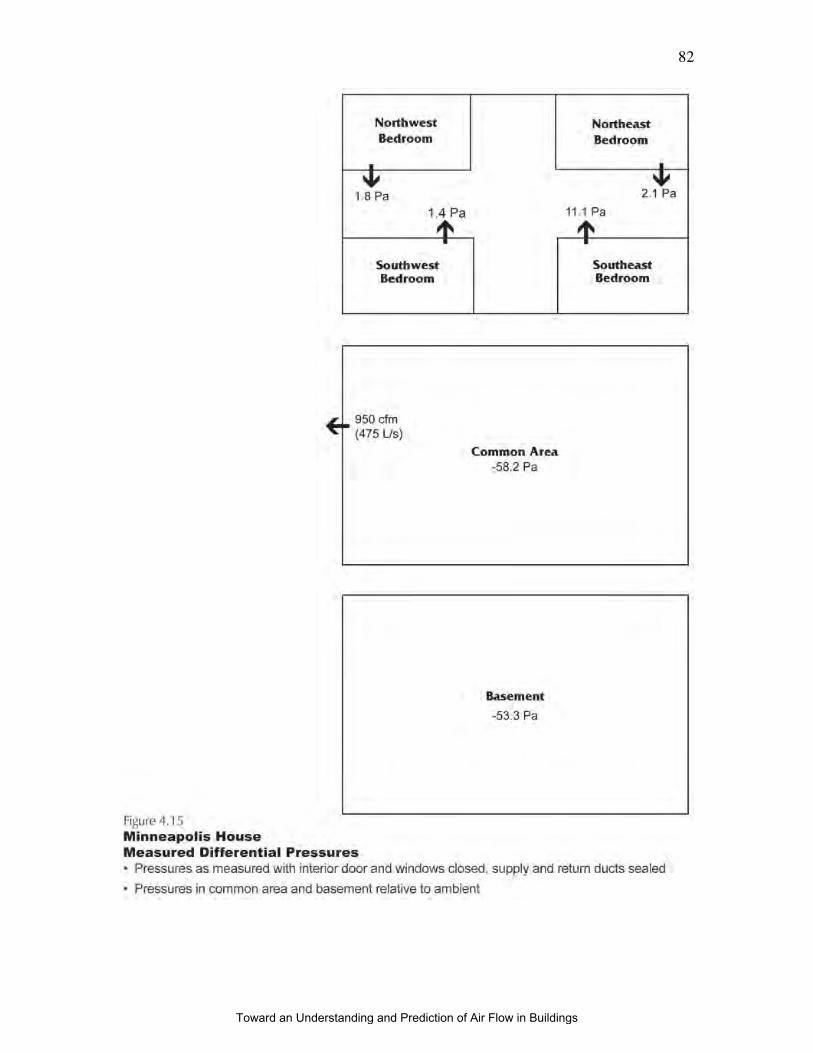
82
Toward an Understanding and Prediction of Air Flow in Buildings
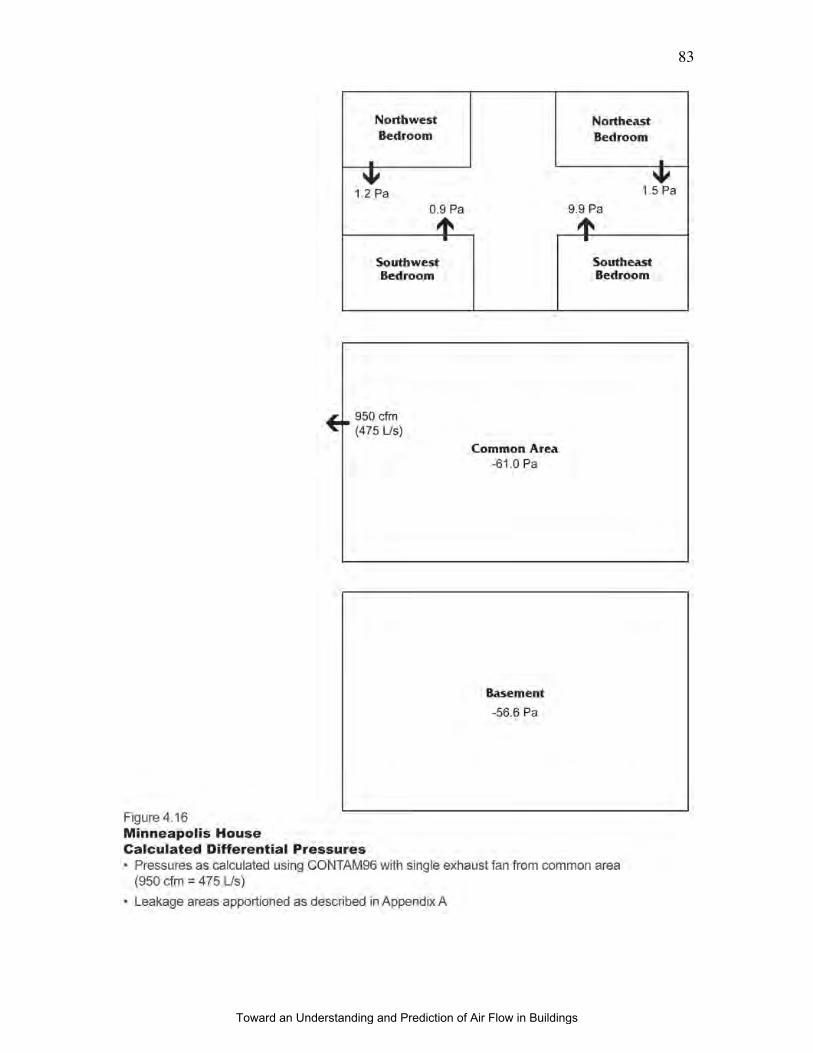
83
Toward an Understanding and Prediction of Air Flow in Buildings
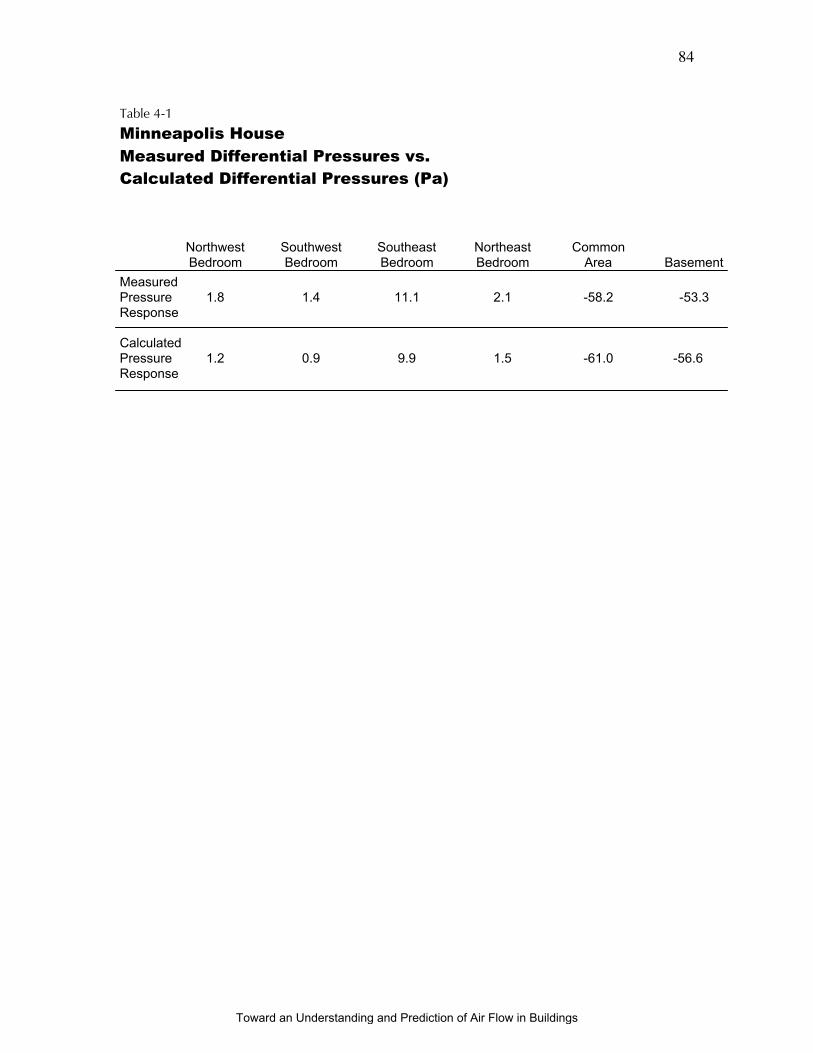
84
Table 4-1
Minneapolis House
Measured Differential Pressures vs.
Calculated Differential Pressures (Pa)
Northwest Southwest Southeast Northeast CommonBedroom Bedroom Bedroom Bedroom Area Basement
MeasuredPressure 1.8 1.4 11.1 2.1 -58.2 -53.3Response
CalculatedPressure 1.2 0.9 9.9 1.5 -61.0 -56.6Response
Toward an Understanding and Prediction of Air Flow in Buildings
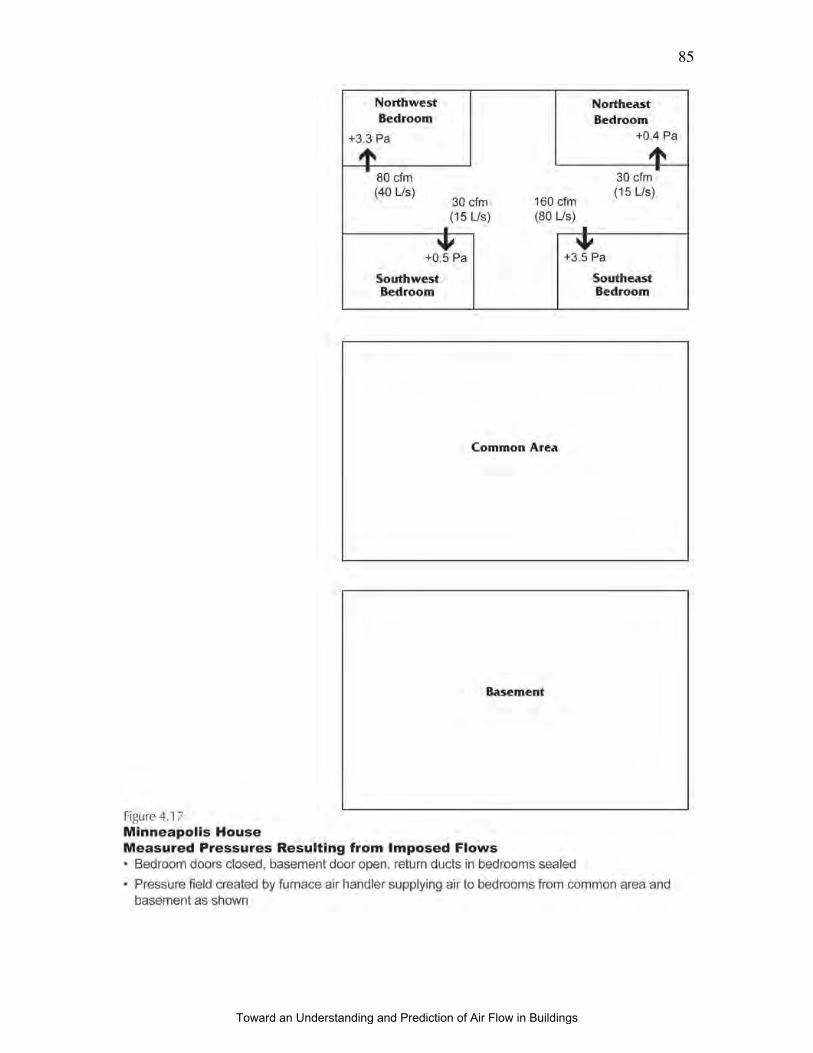
85
Toward an Understanding and Prediction of Air Flow in Buildings
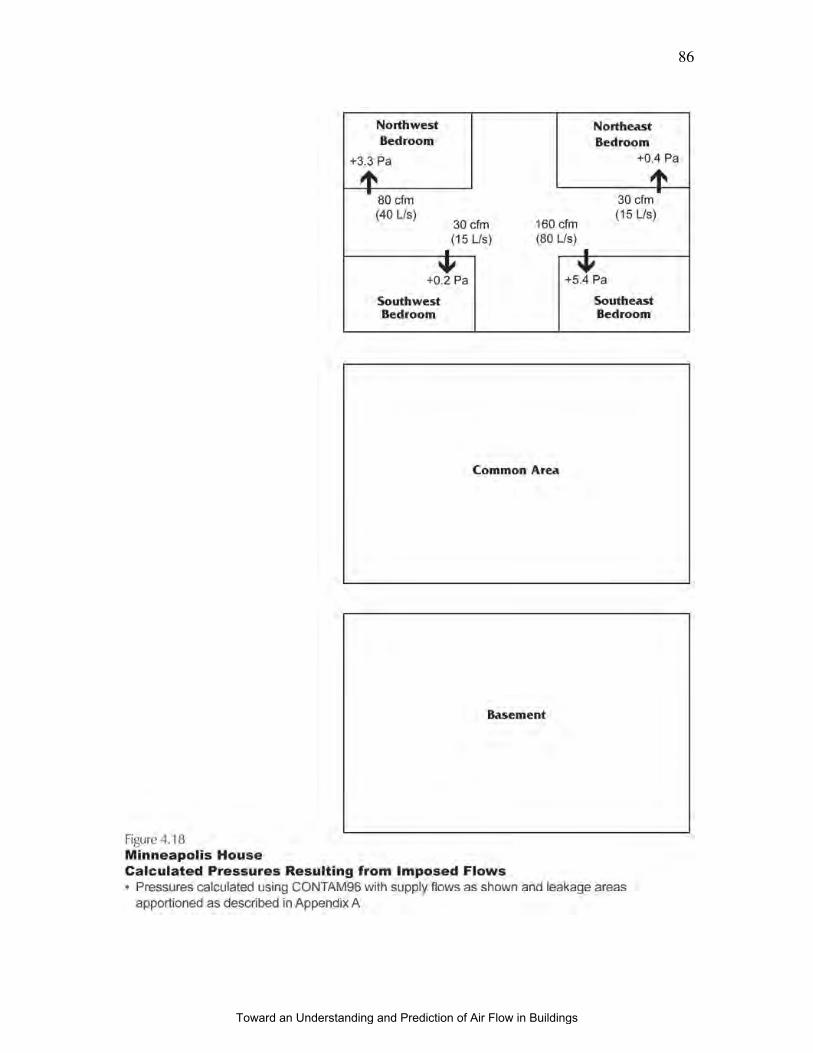
86
Toward an Understanding and Prediction of Air Flow in Buildings
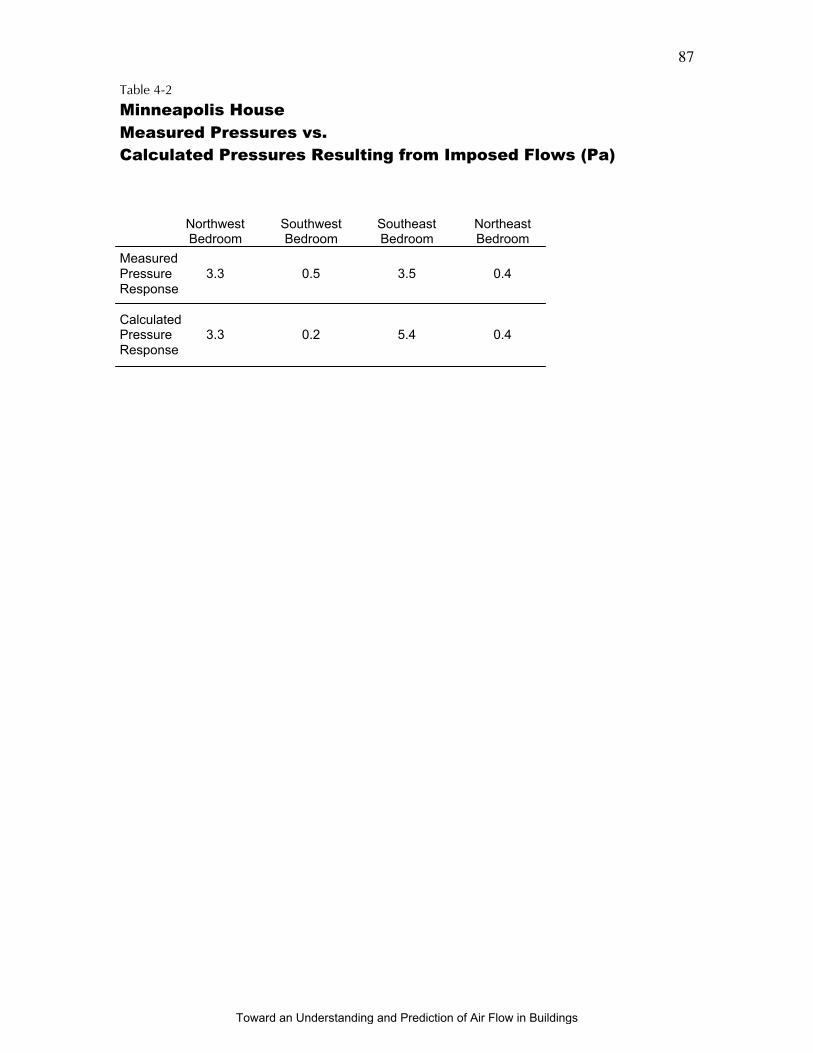
87
Table 4-2
Minneapolis House
Measured Pressures vs.
Calculated Pressures Resulting from Imposed Flows (Pa)
Northwest Southwest Southeast NortheastBedroom Bedroom Bedroom Bedroom
MeasuredPressure 3.3 0.5 3.5 0.4Response
CalculatedPressure 3.3 0.2 5.4 0.4Response
Toward an Understanding and Prediction of Air Flow in Buildings
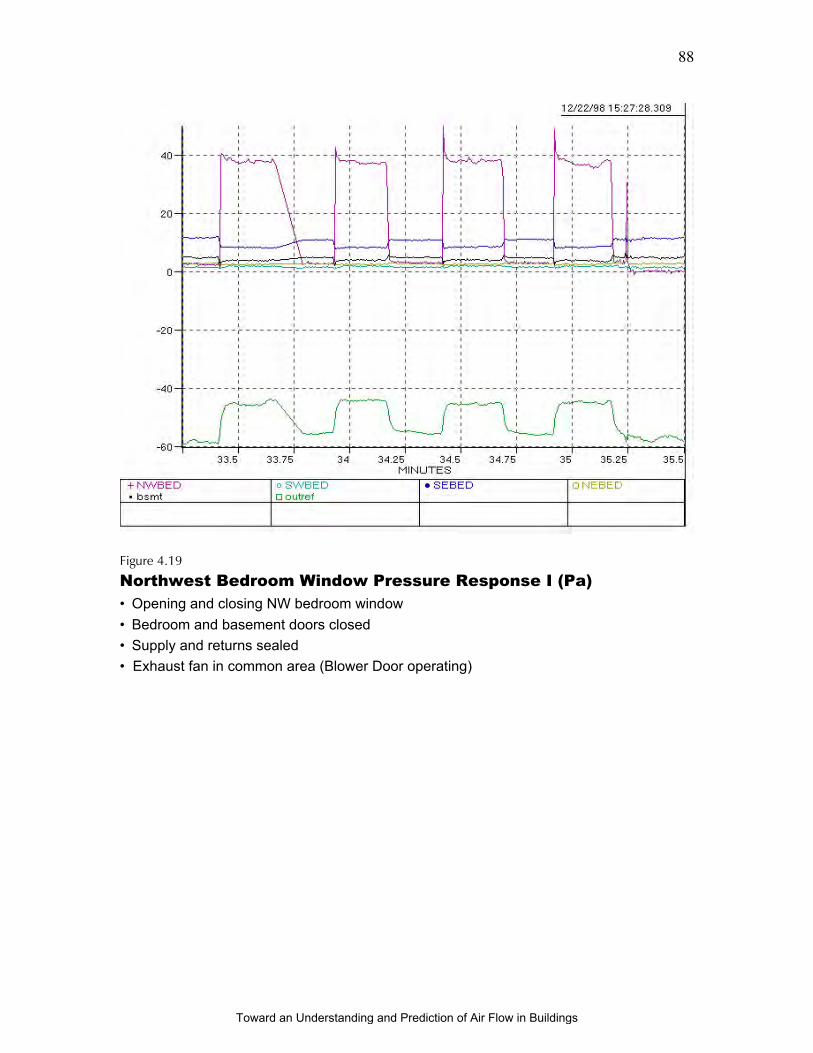
88
Figure 4.19
Northwest Bedroom Window Pressure Response I (Pa)
• Opening and closing NW bedroom window
• Bedroom and basement doors closed
• Supply and returns sealed
• Exhaust fan in common area (Blower Door operating)
Toward an Understanding and Prediction of Air Flow in Buildings
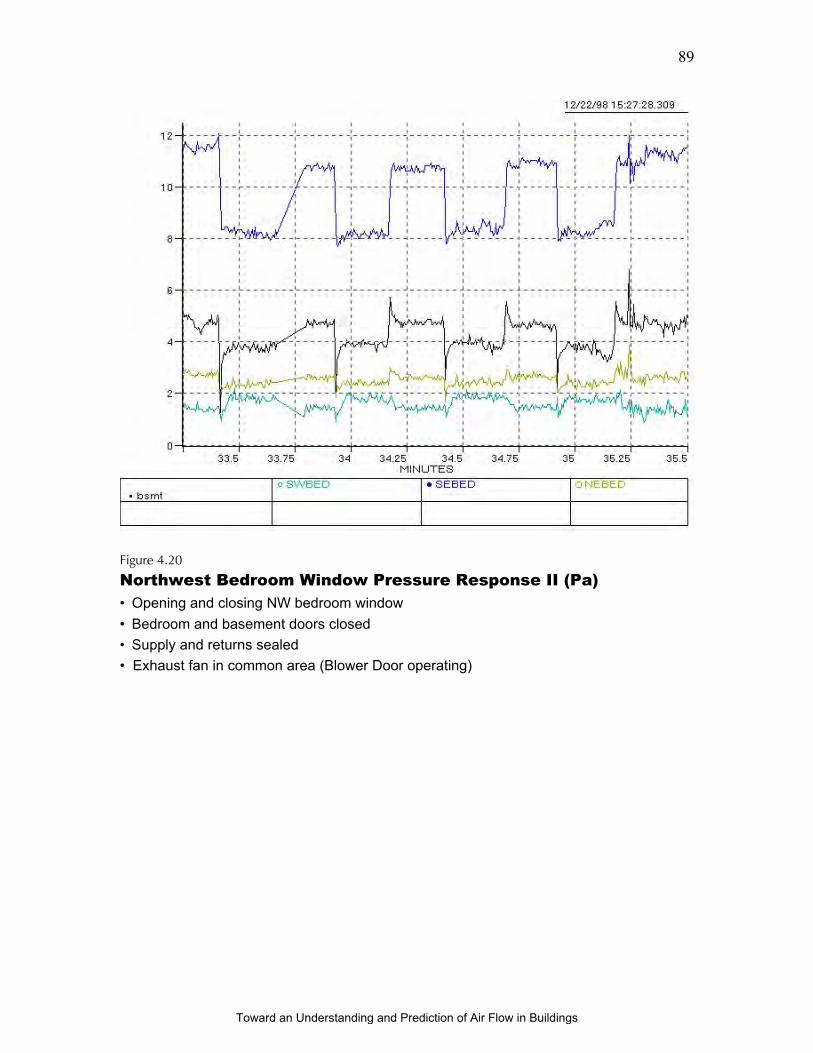
89
Figure 4.20
Northwest Bedroom Window Pressure Response II (Pa)
• Opening and closing NW bedroom window
• Bedroom and basement doors closed
• Supply and returns sealed
• Exhaust fan in common area (Blower Door operating)
Toward an Understanding and Prediction of Air Flow in Buildings
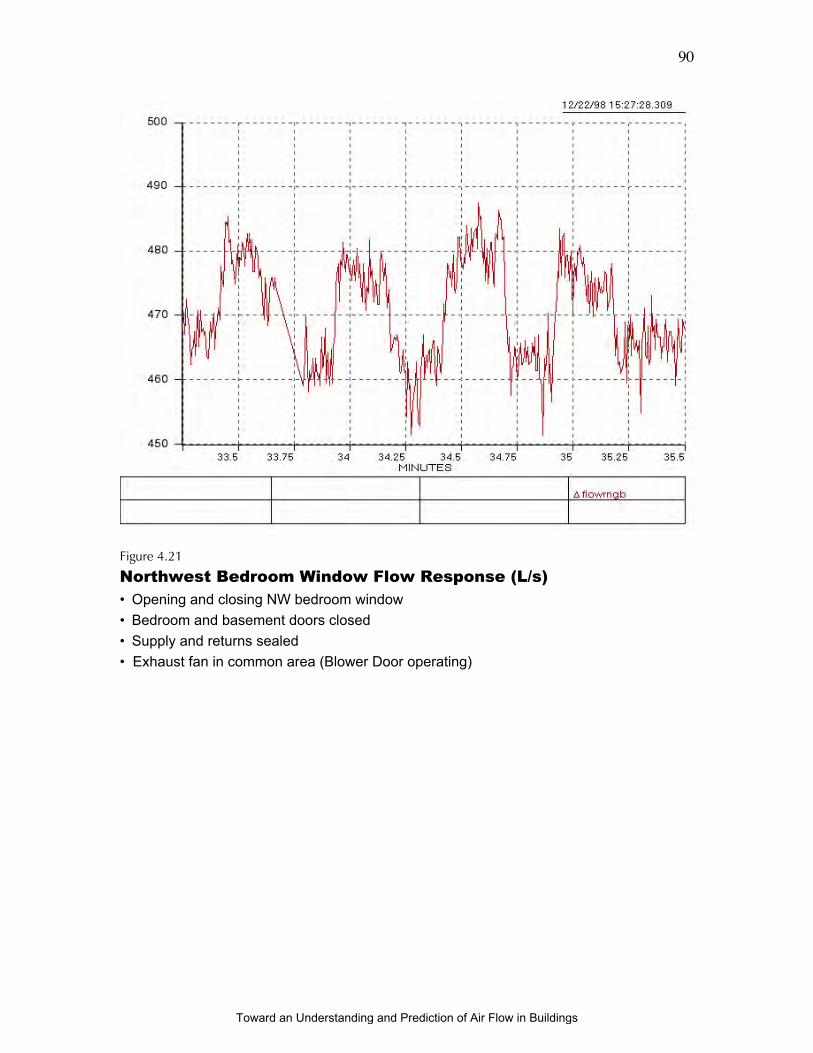
90
Figure 4.21
Northwest Bedroom Window Flow Response (L/s)
• Opening and closing NW bedroom window
• Bedroom and basement doors closed
• Supply and returns sealed
• Exhaust fan in common area (Blower Door operating)
Toward an Understanding and Prediction of Air Flow in Buildings

91
Figure 4.22
Southwest Bedroom Window Pressure Response I (Pa)
• Opening and closing SW bedroom window
• Bedroom and basement doors closed
• Supply and returns sealed
• Exhaust fan in common area (Blower Door operating)
Toward an Understanding and Prediction of Air Flow in Buildings
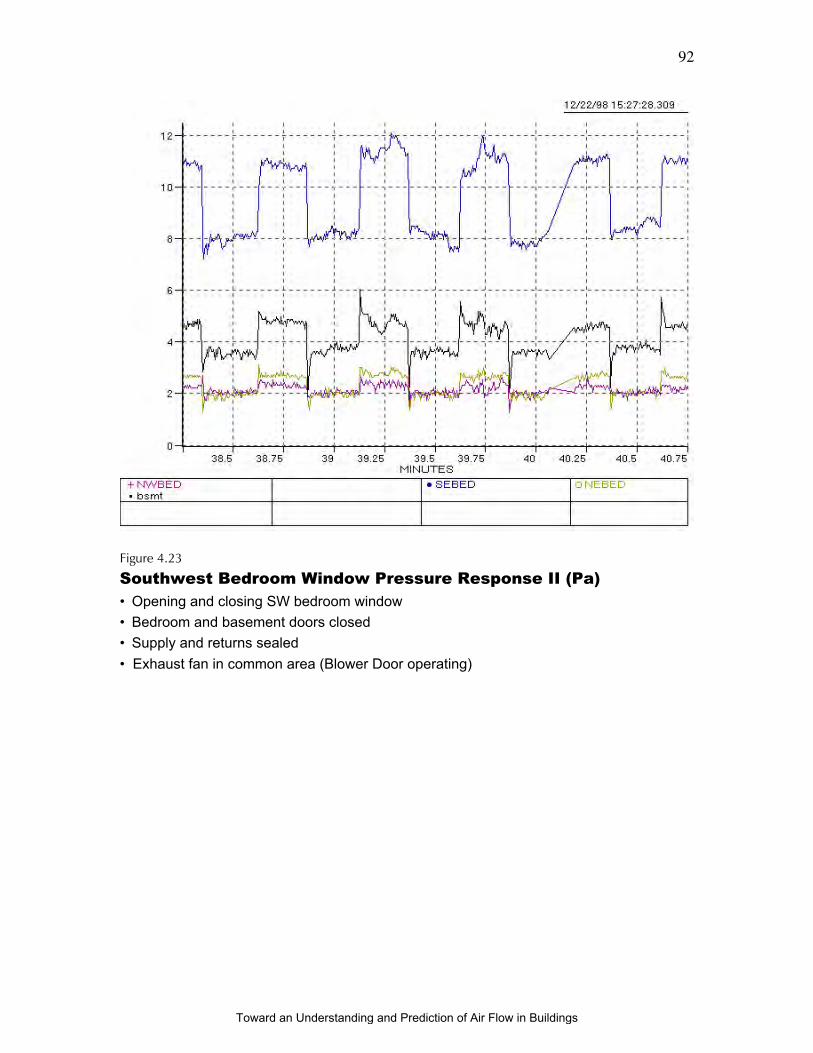
92
Figure 4.23
Southwest Bedroom Window Pressure Response II (Pa)
• Opening and closing SW bedroom window
• Bedroom and basement doors closed
• Supply and returns sealed
• Exhaust fan in common area (Blower Door operating)
Toward an Understanding and Prediction of Air Flow in Buildings
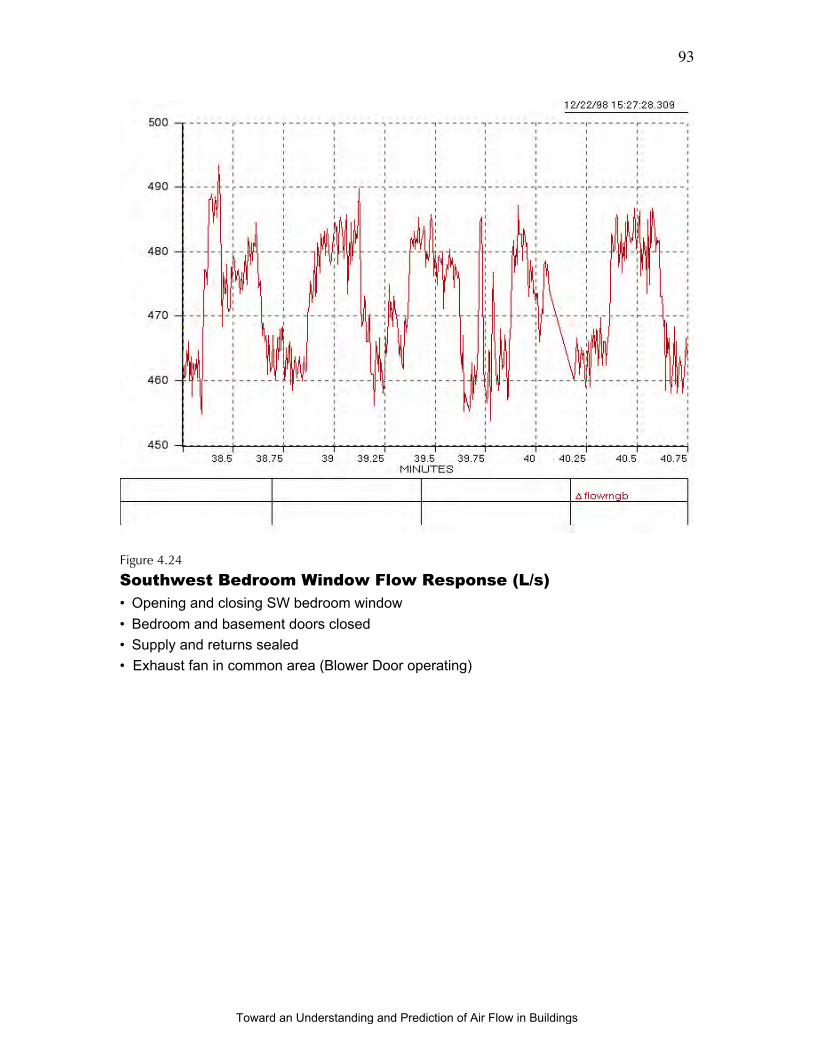
93
Figure 4.24
Southwest Bedroom Window Flow Response (L/s)
• Opening and closing SW bedroom window
• Bedroom and basement doors closed
• Supply and returns sealed
• Exhaust fan in common area (Blower Door operating)
Toward an Understanding and Prediction of Air Flow in Buildings
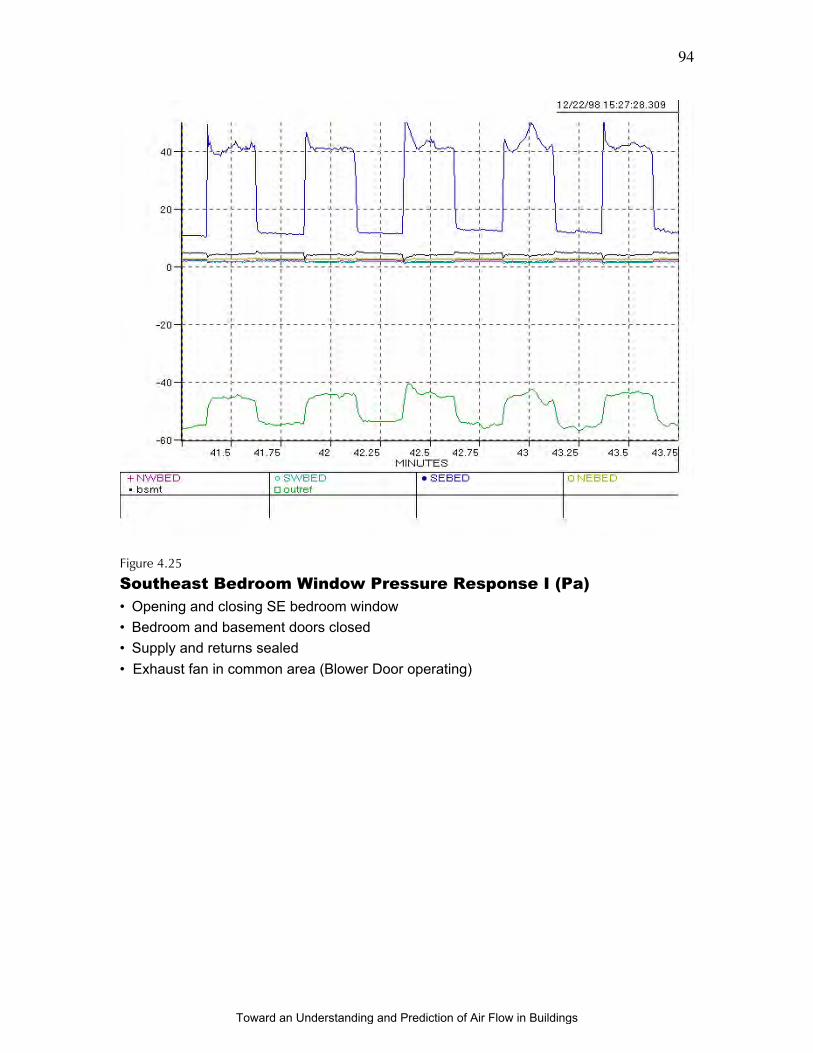
94
Figure 4.25
Southeast Bedroom Window Pressure Response I (Pa)
• Opening and closing SE bedroom window
• Bedroom and basement doors closed
• Supply and returns sealed
• Exhaust fan in common area (Blower Door operating)
Toward an Understanding and Prediction of Air Flow in Buildings
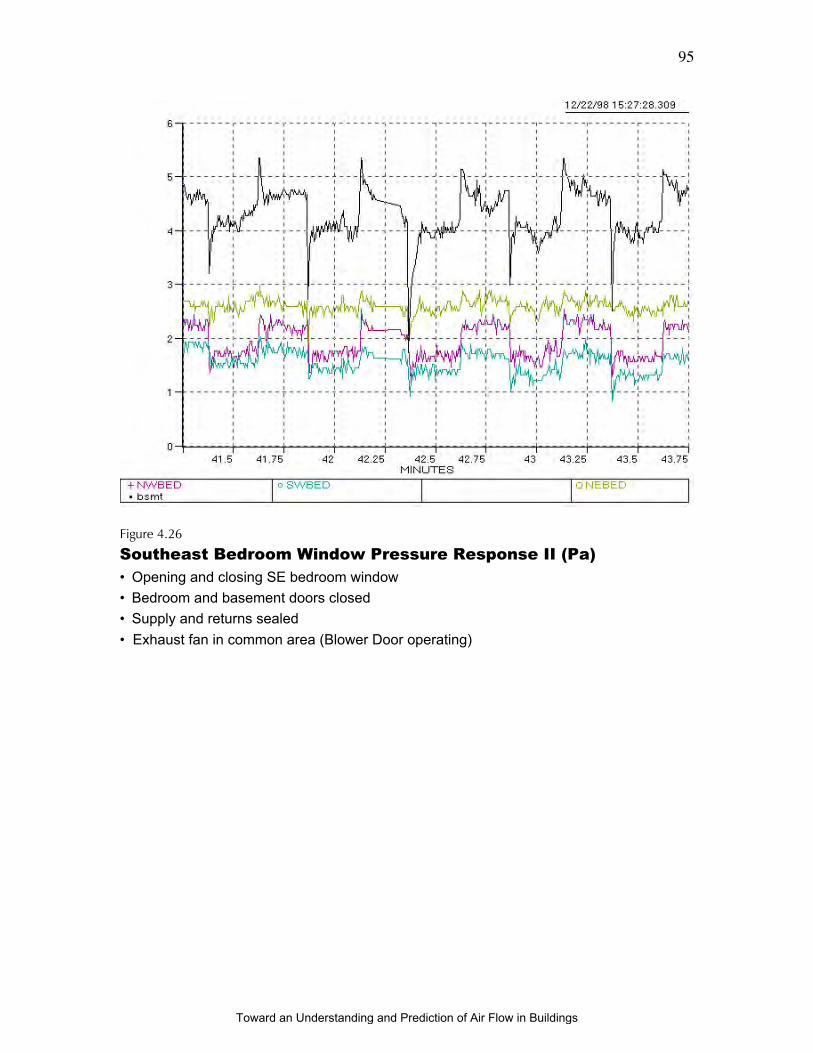
95
Figure 4.26
Southeast Bedroom Window Pressure Response II (Pa)
• Opening and closing SE bedroom window
• Bedroom and basement doors closed
• Supply and returns sealed
• Exhaust fan in common area (Blower Door operating)
Toward an Understanding and Prediction of Air Flow in Buildings
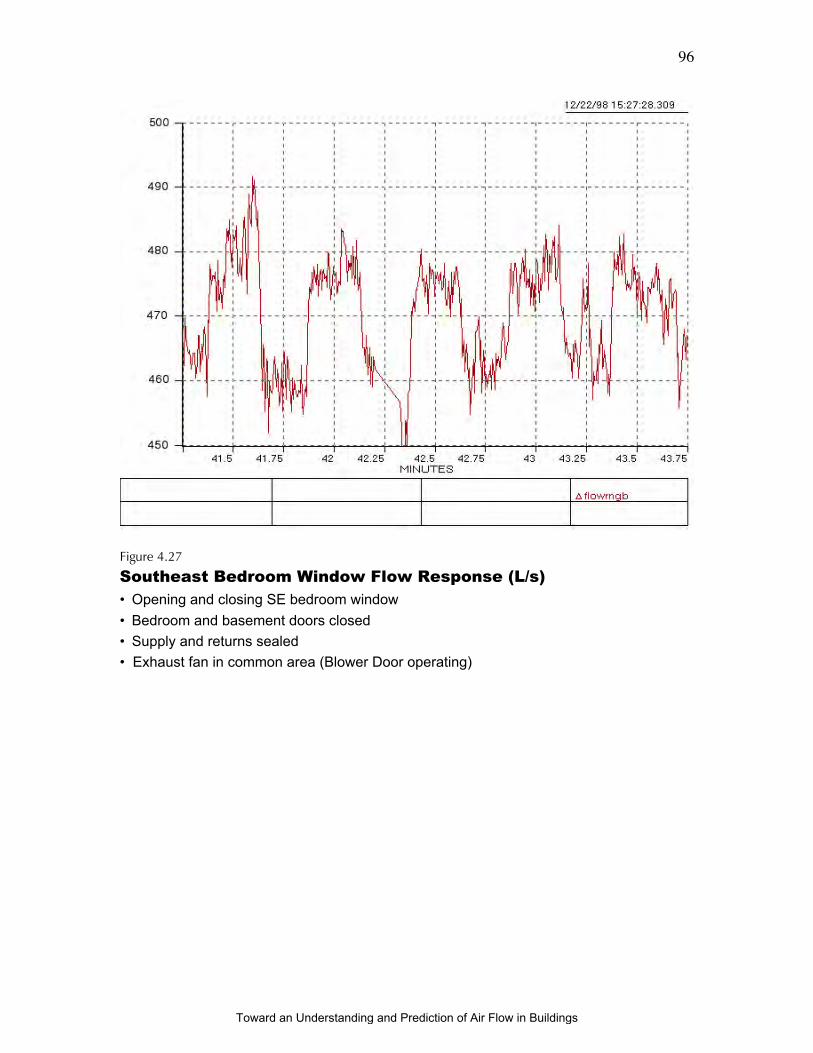
96
Figure 4.27
Southeast Bedroom Window Flow Response (L/s)
• Opening and closing SE bedroom window
• Bedroom and basement doors closed
• Supply and returns sealed
• Exhaust fan in common area (Blower Door operating)
Toward an Understanding and Prediction of Air Flow in Buildings
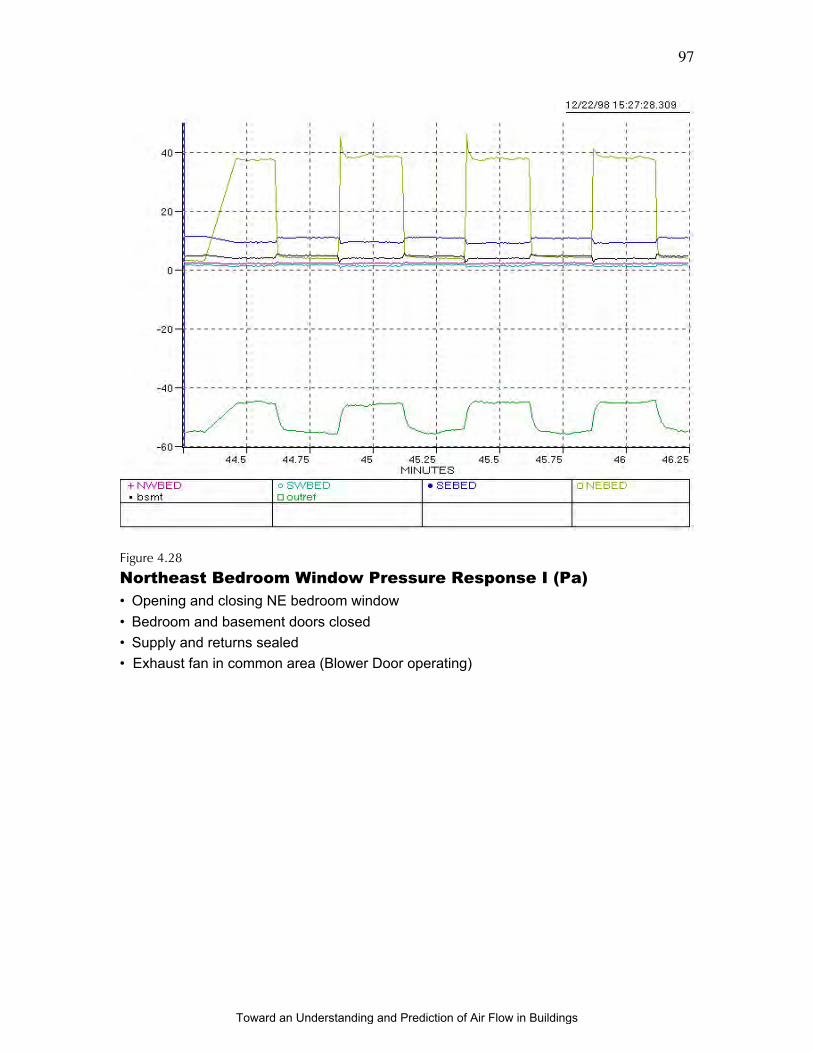
97
Figure 4.28
Northeast Bedroom Window Pressure Response I (Pa)
• Opening and closing NE bedroom window
• Bedroom and basement doors closed
• Supply and returns sealed
• Exhaust fan in common area (Blower Door operating)
Toward an Understanding and Prediction of Air Flow in Buildings
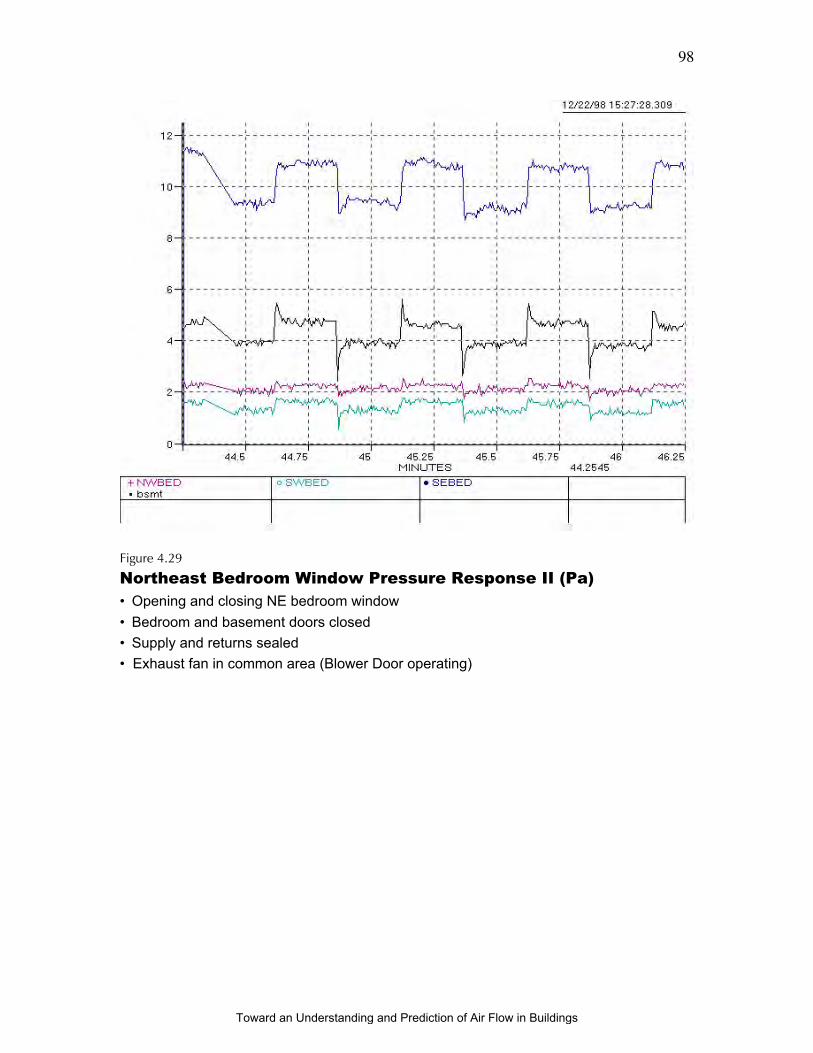
98
Figure 4.29
Northeast Bedroom Window Pressure Response II (Pa)
• Opening and closing NE bedroom window
• Bedroom and basement doors closed
• Supply and returns sealed
• Exhaust fan in common area (Blower Door operating)
Toward an Understanding and Prediction of Air Flow in Buildings
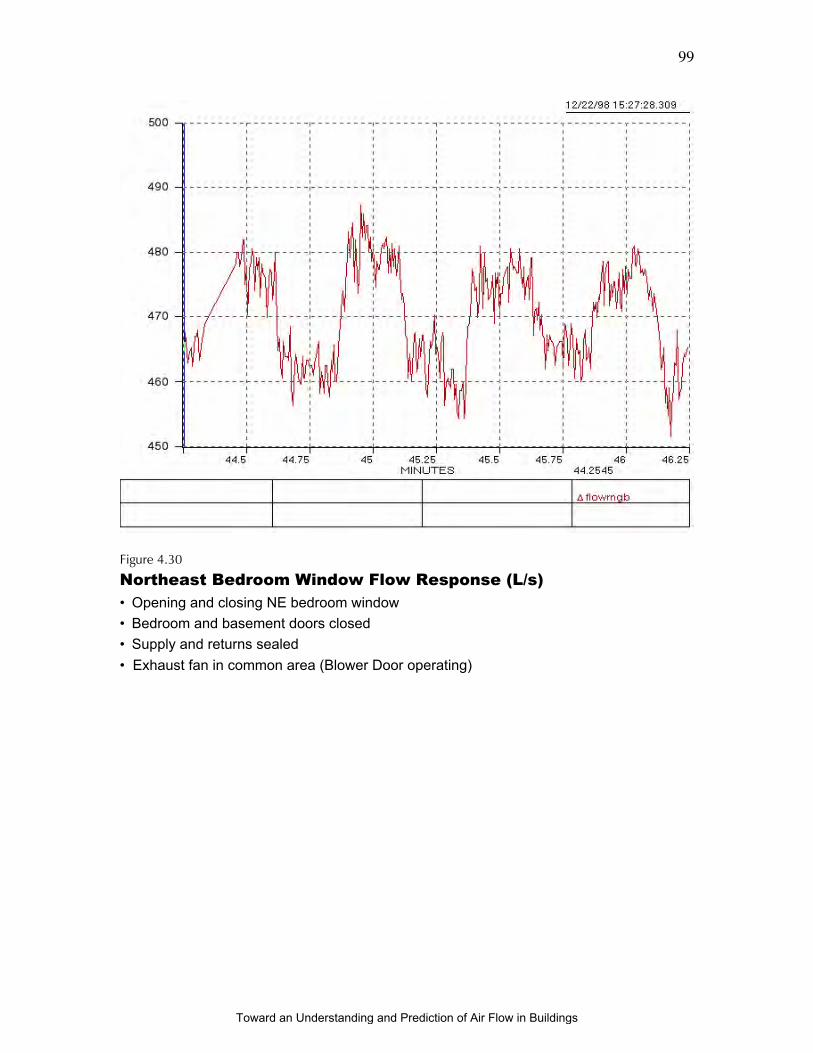
99
Figure 4.30
Northeast Bedroom Window Flow Response (L/s)
• Opening and closing NE bedroom window
• Bedroom and basement doors closed
• Supply and returns sealed
• Exhaust fan in common area (Blower Door operating)
Toward an Understanding and Prediction of Air Flow in Buildings
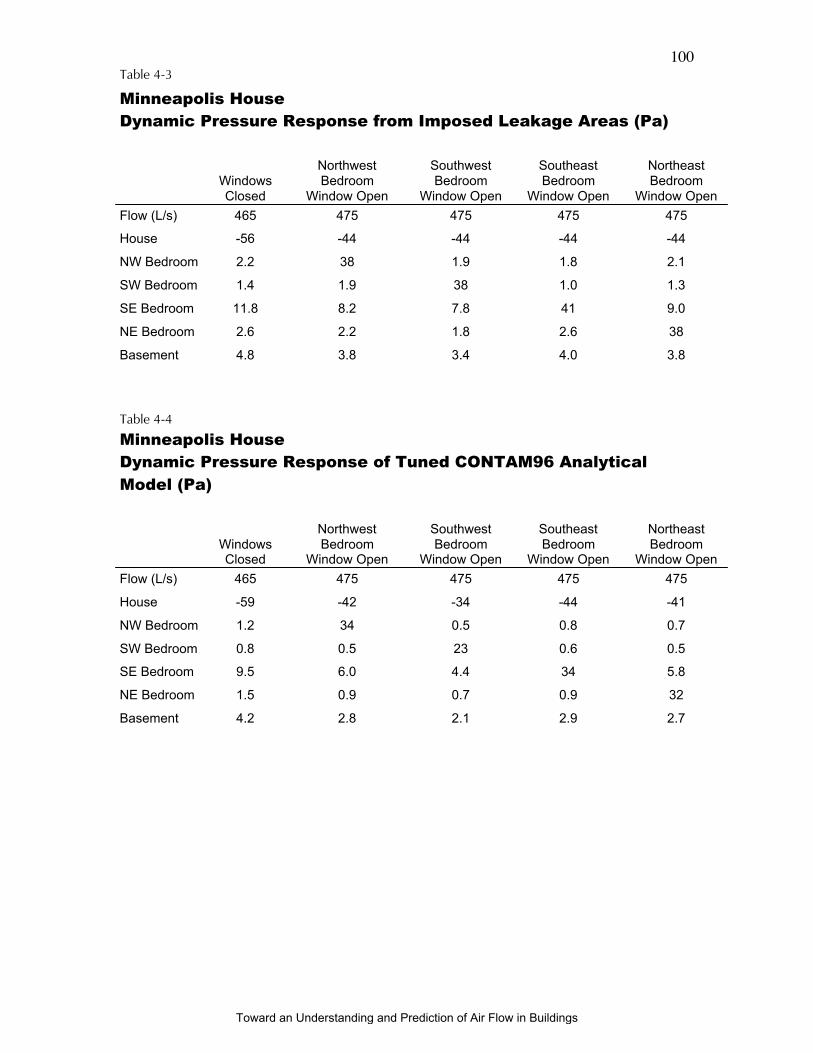
100Table 4-3
Minneapolis House
Dynamic Pressure Response from Imposed Leakage Areas (Pa)
Northwest Southwest Southeast NortheastWindows Bedroom Bedroom Bedroom BedroomClosed Window Open Window Open Window Open Window Open
Flow (L/s) 465 475 475 475 475
House -56 -44 -44 -44 -44
NW Bedroom 2.2 38 1.9 1.8 2.1
SW Bedroom 1.4 1.9 38 1.0 1.3
SE Bedroom 11.8 8.2 7.8 41 9.0
NE Bedroom 2.6 2.2 1.8 2.6 38
Basement 4.8 3.8 3.4 4.0 3.8
Table 4-4
Minneapolis House
Dynamic Pressure Response of Tuned CONTAM96 Analytical
Model (Pa)
Northwest Southwest Southeast NortheastWindows Bedroom Bedroom Bedroom BedroomClosed Window Open Window Open Window Open Window Open
Flow (L/s) 465 475 475 475 475
House -59 -42 -34 -44 -41
NW Bedroom 1.2 34 0.5 0.8 0.7
SW Bedroom 0.8 0.5 23 0.6 0.5
SE Bedroom 9.5 6.0 4.4 34 5.8
NE Bedroom 1.5 0.9 0.7 0.9 32
Basement 4.2 2.8 2.1 2.9 2.7
Toward an Understanding and Prediction of Air Flow in Buildings
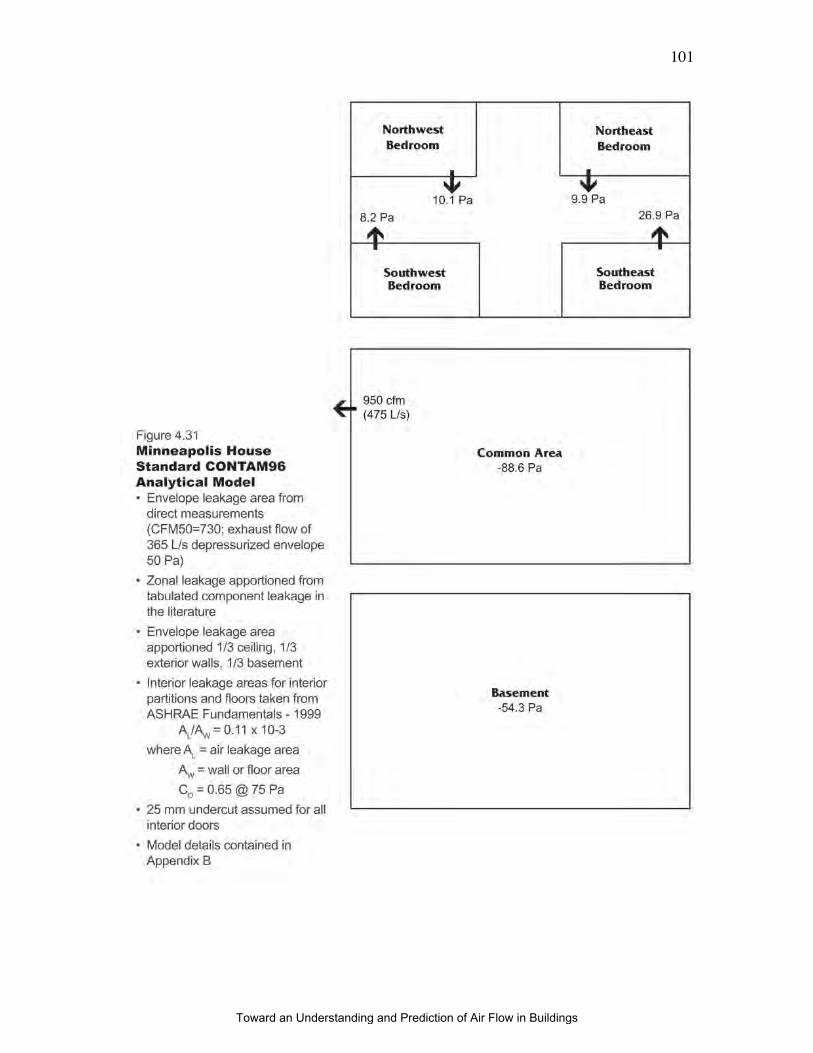
101
Toward an Understanding and Prediction of Air Flow in Buildings
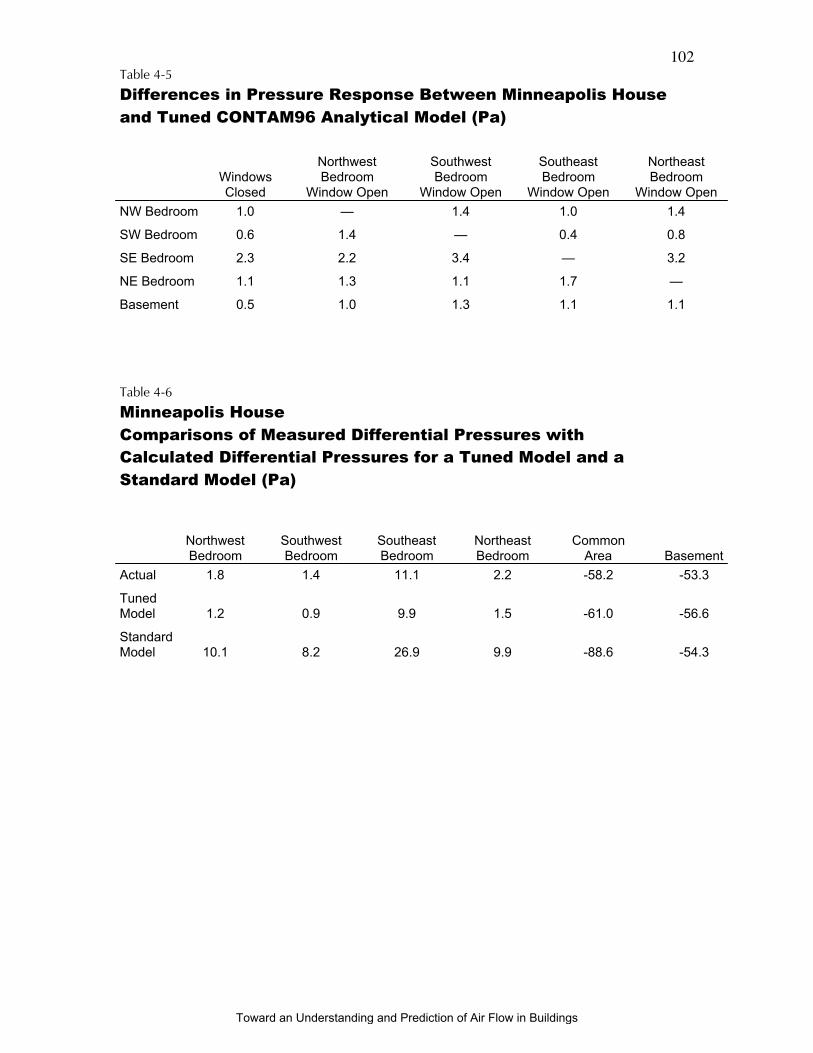
102Table 4-5
Differences in Pressure Response Between Minneapolis House
and Tuned CONTAM96 Analytical Model (Pa)
Northwest Southwest Southeast NortheastWindows Bedroom Bedroom Bedroom BedroomClosed Window Open Window Open Window Open Window Open
NW Bedroom 1.0 — 1.4 1.0 1.4
SW Bedroom 0.6 1.4 — 0.4 0.8
SE Bedroom 2.3 2.2 3.4 — 3.2
NE Bedroom 1.1 1.3 1.1 1.7 —
Basement 0.5 1.0 1.3 1.1 1.1
Table 4-6
Minneapolis House
Comparisons of Measured Differential Pressures with
Calculated Differential Pressures for a Tuned Model and a
Standard Model (Pa)
Northwest Southwest Southeast Northeast CommonBedroom Bedroom Bedroom Bedroom Area Basement
Actual 1.8 1.4 11.1 2.2 -58.2 -53.3
TunedModel 1.2 0.9 9.9 1.5 -61.0 -56.6
StandardModel 10.1 8.2 26.9 9.9 -88.6 -54.3
Toward an Understanding and Prediction of Air Flow in Buildings

103
Figure 4.32
Minneapolis House
Tracer Gas Results with HVAC System Off/Doors Closed
Toward an Understanding and Prediction of Air Flow in Buildings

104
Figure 4.33
Minneapolis House
Tuned CONTAM96 Analytical Model
Tracer Gas Results with HVAC System Off/Doors Closed
Toward an Understanding and Prediction of Air Flow in Buildings
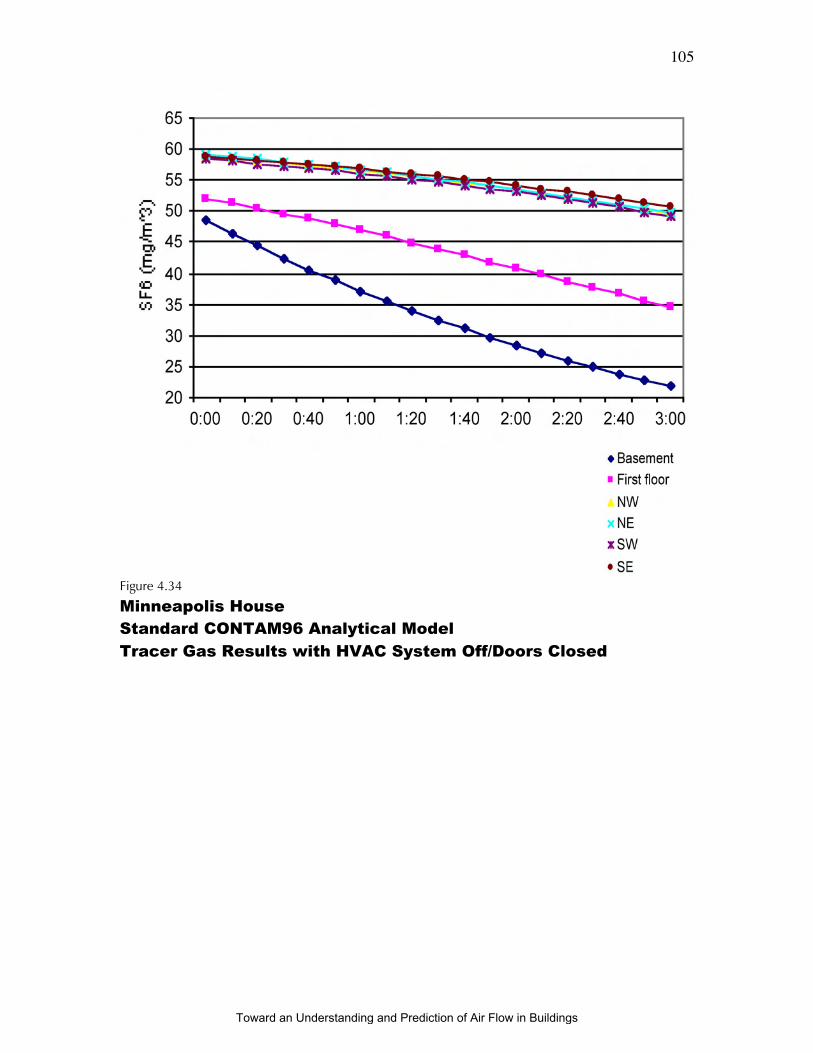
105
Figure 4.34
Minneapolis House
Standard CONTAM96 Analytical Model
Tracer Gas Results with HVAC System Off/Doors Closed
Toward an Understanding and Prediction of Air Flow in Buildings
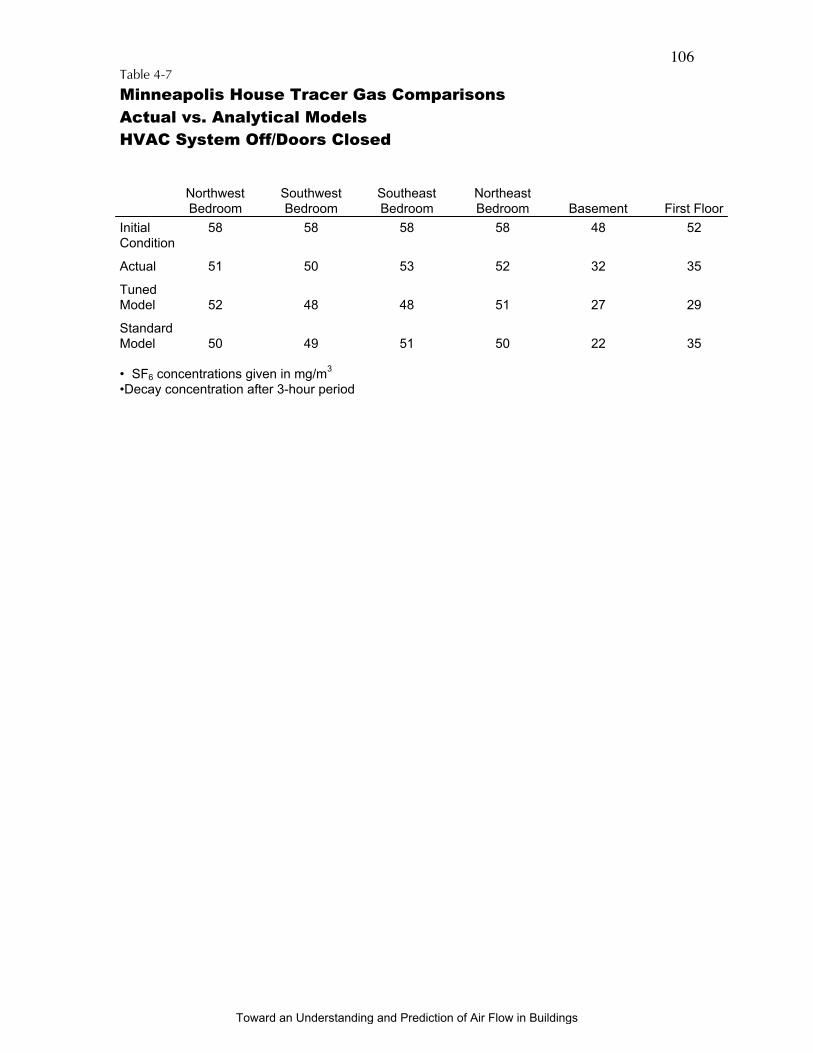
106Table 4-7
Minneapolis House Tracer Gas Comparisons
Actual vs. Analytical Models
HVAC System Off/Doors Closed
Northwest Southwest Southeast NortheastBedroom Bedroom Bedroom Bedroom Basement First Floor
Initial 58 58 58 58 48 52Condition
Actual 51 50 53 52 32 35
TunedModel 52 48 48 51 27 29
StandardModel 50 49 51 50 22 35
• SF6 concentrations given in mg/m3
•Decay concentration after 3-hour period
Toward an Understanding and Prediction of Air Flow in Buildings
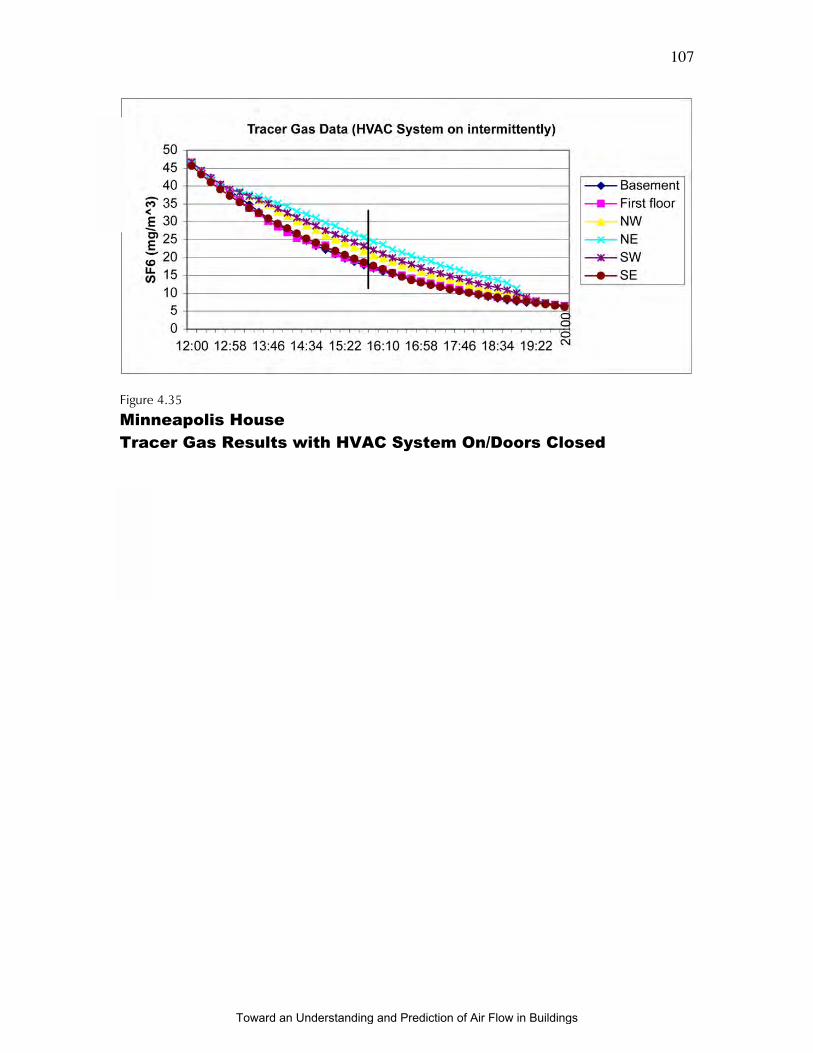
107
Figure 4.35
Minneapolis House
Tracer Gas Results with HVAC System On/Doors Closed
Toward an Understanding and Prediction of Air Flow in Buildings
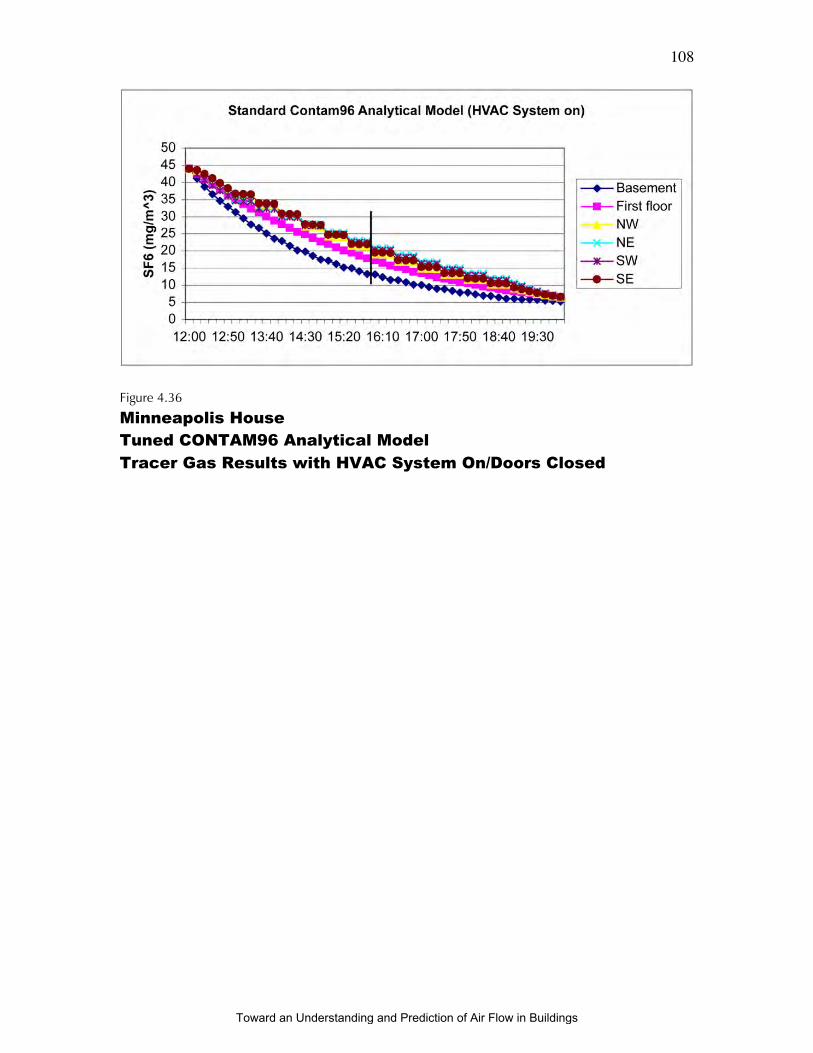
108
Figure 4.36
Minneapolis House
Tuned CONTAM96 Analytical Model
Tracer Gas Results with HVAC System On/Doors Closed
Toward an Understanding and Prediction of Air Flow in Buildings
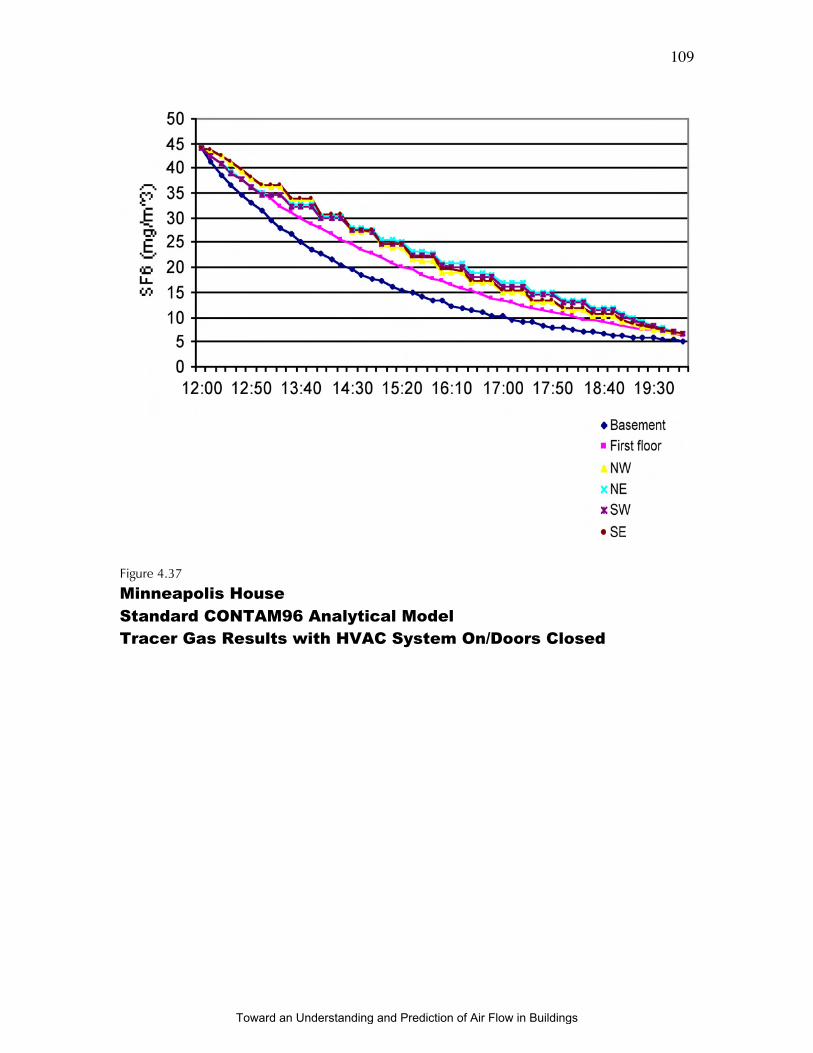
109
Figure 4.37
Minneapolis House
Standard CONTAM96 Analytical Model
Tracer Gas Results with HVAC System On/Doors Closed
Toward an Understanding and Prediction of Air Flow in Buildings
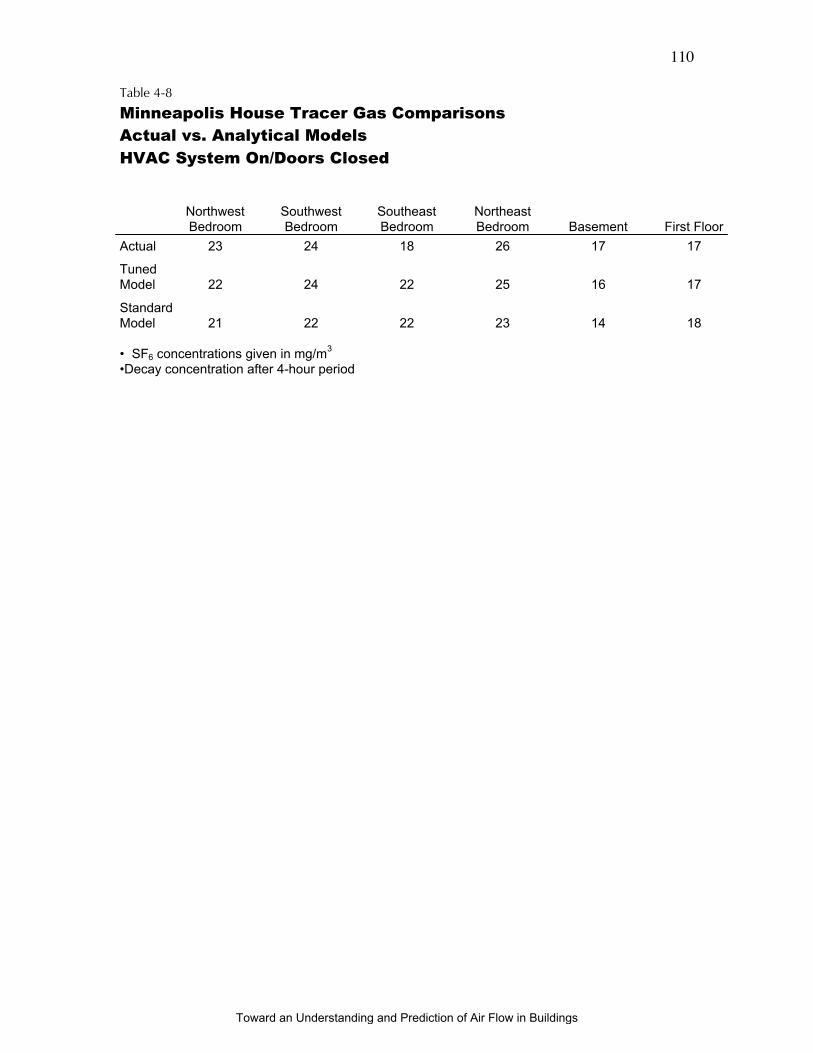
110
Table 4-8
Minneapolis House Tracer Gas Comparisons
Actual vs. Analytical Models
HVAC System On/Doors Closed
Northwest Southwest Southeast NortheastBedroom Bedroom Bedroom Bedroom Basement First Floor
Actual 23 24 18 26 17 17
TunedModel 22 24 22 25 16 17
StandardModel 21 22 22 23 14 18
• SF6 concentrations given in mg/m3
•Decay concentration after 4-hour period
Toward an Understanding and Prediction of Air Flow in Buildings
111
School Facility – Westford Academy
A similar experimental and analysis approach to the approach used with the
Minneapolis House was employed with a much larger facility. The Westford Academy in
Westford, MA was constructed during the early 1970’s (Photograph 5). The floor plan is
presented in Figure 4.38. The exterior walls are constructed of solid masonry. The floor
slabs are concrete and the demising walls are constructed of clay tile masonry. This type of
construction results in few connected interstitial cavities and as a result air flow analysis in
the facility is considerably simplified.
Experimental Work – Westford Academy
The studied portion of the school selected for analysis is represented by the shaded
portion of Figure 4.38. The remainder of the school was isolated from the area of study by
opening windows and exterior doors and corridors to the exterior thereby providing
“ambient” or outdoor air pressures throughout the second floor and in the non-shaded
areas of the first floor.
Conditions during the time of testing were “dead calm”. Interior temperatures and
exterior temperatures were almost identical, varying between 19 and 21 degrees C.
Therefore, wind effects and stack effects can be neglected.
The studied portion of the school is represented by the five zone relational model
presented in Figure 4.39.
Depressurization tests of the five individual zones as well as the combined zones
(the shaded portion of Figure 4.39) were conducted. During each individual test, adjacent
zones were opened/connected to the exterior thereby creating ambient pressure conditions in
the adjacent zones. Also during the period of testing, the building exhaust ventilation
system was shut down, all exhaust grills sealed, and all unit ventilator openings closed. The
results of the depressurization tests are recorded in Figure 4.39 and Figure 4.40.
The building was perturbed by adding a single flow of known magnitude to the
corridor zone creating differential pressures across the five zones. The perturbation was
accomplished by conducting a modified depressurization test. During this test, the doors
connecting the individual zones were closed while air was extracted from the corridor zone.
An exhaust flow of 16,750 L/s was imposed on the corridor zone. The resulting pressure
field as recorded is presented in Figure 4.41.
Information from the depressurization tests, specifically the zonal leakage areas, was
processed with the CONTAM96 network model, to create a five zone analytical model
configured to the relational model presented in Figure 4.39. CONTAM96, via a manual
iterative (trial and error) process, was used to apportion the leakage areas until reasonable
agreement (within 0.5 Pa) occurred between the pressure field recorded in Figure 4.41 and
Toward an Understanding and Prediction of Air Flow in Buildings
112
the pressure field output from the “tuned” CONTAM96 analytical model (Figure 4.42). A
similar method to the approach used with the Minneapolis House, discussed previously, was
used. The details describing this “tuned” CONTAM96 analytical model are contained in
Appendix C.
The results are compared in Table 4.9. The match between the actual differential
pressures and the calculated pressures are closer than in the Minneapolis House described
previously (see Table 4.1). This is believed to be due to simpler construction, more
available information about zonal leakage (zonal leakage tests were conducted for the
Westford Academy, but not for the Minneapolis House) and calmer weather (the absence of
wind and stack effects).
The pressure response of the building was then used to test the pressure response of
the “tuned” analytical model. The pressure field in the building was perturbed two
different ways to create a pressure response (as with the Minneapolis House discussed
previously):
• air flows of known magnitude were imposed on individual zones and the
resulting air pressure field recorded; and
• leakage areas of known magnitude were introduced to individual zones and
the resulting air pressure field recorded.
The “tuned” CONTAM96 analytical model (as configured in Figure 4.42) was
similarly perturbed and the pressure response of the model compared with the actual
building pressure response.
Imposed Air Flows – Westford Academy
Air flows of known magnitude were imposed on three individual zones using
variable speed calibrated fans (“blower doors’). The corridor zone was further perturbed
(depressurized) with an exhaust flow of 16,250 L/s. Doors between individual zones were
closed. Flows were added to individual zones as follows:
• 340 L/s from room 117/119 to the corridor zone;
• 125 L/s from room 105/107/109 to the corridor zone; and
• 70 L/s from room 101/103 to the corridor zone.
This approach where multiple blower doors are used to create an air pressure field is
similar to using a facilities supply HVAC system (with the return portion of the HVAC
system shut down) to create an air pressure field. A ducted supply and return HVAC
system was not present in this particular facility. As such, this approach was used to
Toward an Understanding and Prediction of Air Flow in Buildings

113
impose air flows and create an air pressure response rather than using an actual HVAC
supply system. The building pressure response is recorded in Figure 4.43.
Similar air flows were imposed on the tuned CONTAM96 analytical model (as
previously configured in Figure 4.42). The model pressure response is recorded in Figure
4.44. The results are compared in Table 4.10. Pressure differences between zones for both
the actual building response and model response agree extremely well.
Imposed Leakage Areas – Westford Academy
Exterior windows and interior doors were opened and closed under conditions
where the corridor zone was depressurized with an exhaust flow of 16,250 L/s. Exterior
windows in individual zones were opened and closed on a 15 second cycle (closed 15
seconds, open 15 seconds) for four cycles each. The varying pressure field within the
facility was continuously recorded (10 readings per second) using a multi-channel digital
micromanometer (Energy Conservatory Multi-Channel Mircromanometer) and plotted
(Figure 4.45).
Interior doors connecting individual zones to the corridor zone were similarly cycled
and the resulting pressure field was recorded and plotted (Figure 4.46).
Examination of the plots indicate that the building pressure field – when window
and door openings were closed – remained stable throughout the window and door opening
and closing test sequence.
Figure 4.45 shows the pressure in the corridor responding to the opening and
closing of the windows in both rooms 101/103 and rooms 105/107/109 with pressure drops
in the corridor of approximately 1 Pa and 2 Pa respectively.
Figure 4.47 shows the CONTAM96 analytical model (as configured in Figure 4.42)
responding in a similar manner when windows of the same size are opened and closed. The
model shows pressure drops of 0.8 Pa and 1.5 Pa respectively.
The effect of opening windows in one zone on the pressure in an adjacent zone is
also recorded in Figure 4.45. Opening the windows in room 117 drops the pressure in
room 119 approximately 5 Pa when the door between 117 and 119 is closed. Similarly,
opening the windows in room 119 drops the pressure in room 117 approximately 5 Pa.
Figure 4.48 shows the CONTAM96 analytical model reacting in a similar manner.
Similar effects are observed when doors are opened and closed (Figure 4.46)
leading to a similar response in the CONTAM96 analytical model (Figure 4.49).
A “standard” CONTAM96 analytical model was constructed using the field
measured building envelope leakage area. The analytical model was configured to the
relational model presented in Figure 4.39. Internal leakage areas were obtained from the
literature (ASHRAE, 1997). The envelope leakage area was apportioned as per common
Toward an Understanding and Prediction of Air Flow in Buildings
114
convention (ceiling 1/3, exterior walls 1/3, foundation 1/3). A 25 mm undercut was
assumed for all interior doors. The details describing this “standard” model are contained
in Appendix D.
This standard CONTAM96 analytical model (Figure 4.50) was run with similar
flows to the Westford Academy as described in Figure 4.41 and the tuned CONTAM96
analytical model described in Figure 4.42.
Table 4.11 contains a comparison of the actual measured data from the Westford
Academy and the data derived from both the standard model and the tuned model. The
standard model shows variations from actual measured data and the tuned model with
respect to two of the zones – room 117 and room 119.
Tracer Gas Testing – Westford Academy
Tracer gas testing using sulfur hexafluoride (SF6) was subsequently conducted on
the building and compared with the predicted flow rates from the tuned CONTAM96
analytical model and the standard CONTAM96 analytical model.
A tracer gas test was conducted on room 117 and room 119. An exhaust fan flow
of 50 L/s was imposed on room 117. The door between room 117 and room 119 was
closed. All other doors were closed. Concentrations were measured in both rooms. The
results are recorded in Figure 4.51.
The exhaust flow was imposed on room 117 to create a driving force for air change
due to the absence of wind and the lack of an interior to exterior temperature difference.
The tuned CONTAM96 analytical model (as configured in Figure 4.42) was run
under similar conditions. The results are presented in Figure 4.52. The actual air change
measurements and the model predictions show good agreement.
A “standard” CONTAM96 analytical model (as described in Appendix D) was run
under similar conditions as the tracer gas test. The results are presented in Figure 4.53.
The standard model predictions also show a good match.
Unlike the experience with the Minneapolis house, no significant differences in
predictive capabilities between the tuned network model and the standard network model
were observed with respect to air change (tracer gas concentrations) under the conditions of
the actual field test. This was not surprising given the absence of the wind and stack driving
forces. However, the tuned network model provided an excellent match with respect to
pressure response. This was not the case with the standard network model.
Toward an Understanding and Prediction of Air Flow in Buildings
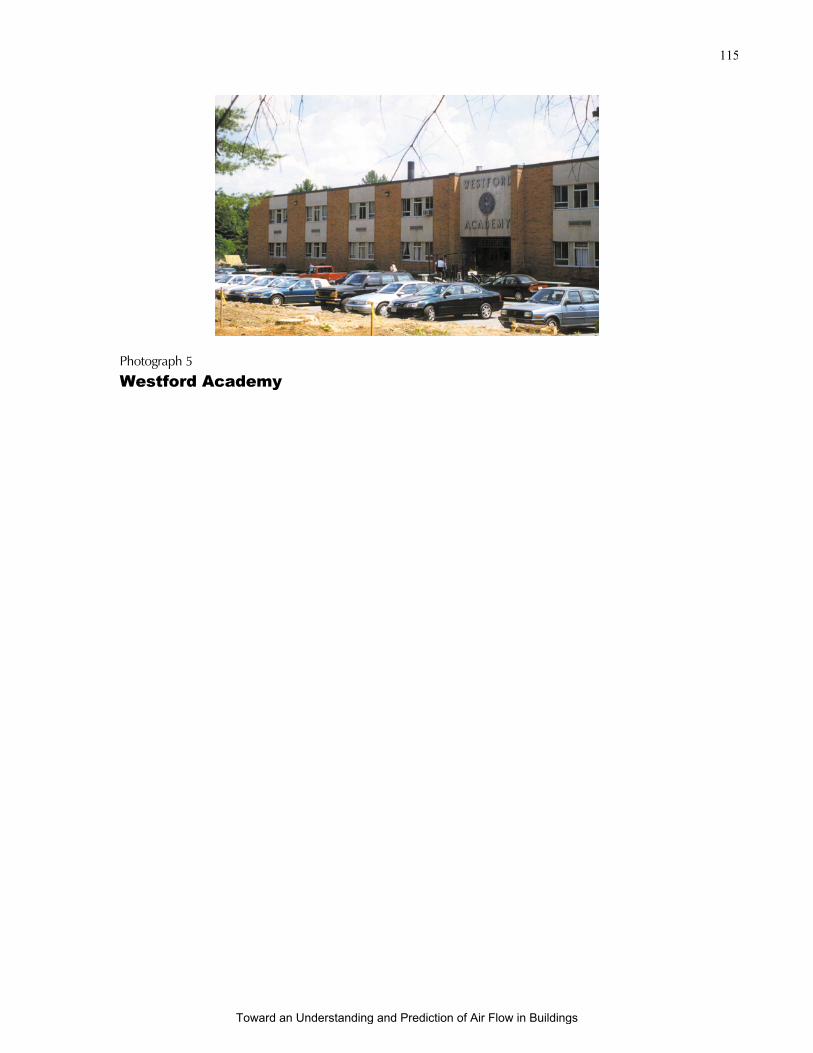
115
Photograph 5
Westford Academy
Toward an Understanding and Prediction of Air Flow in Buildings
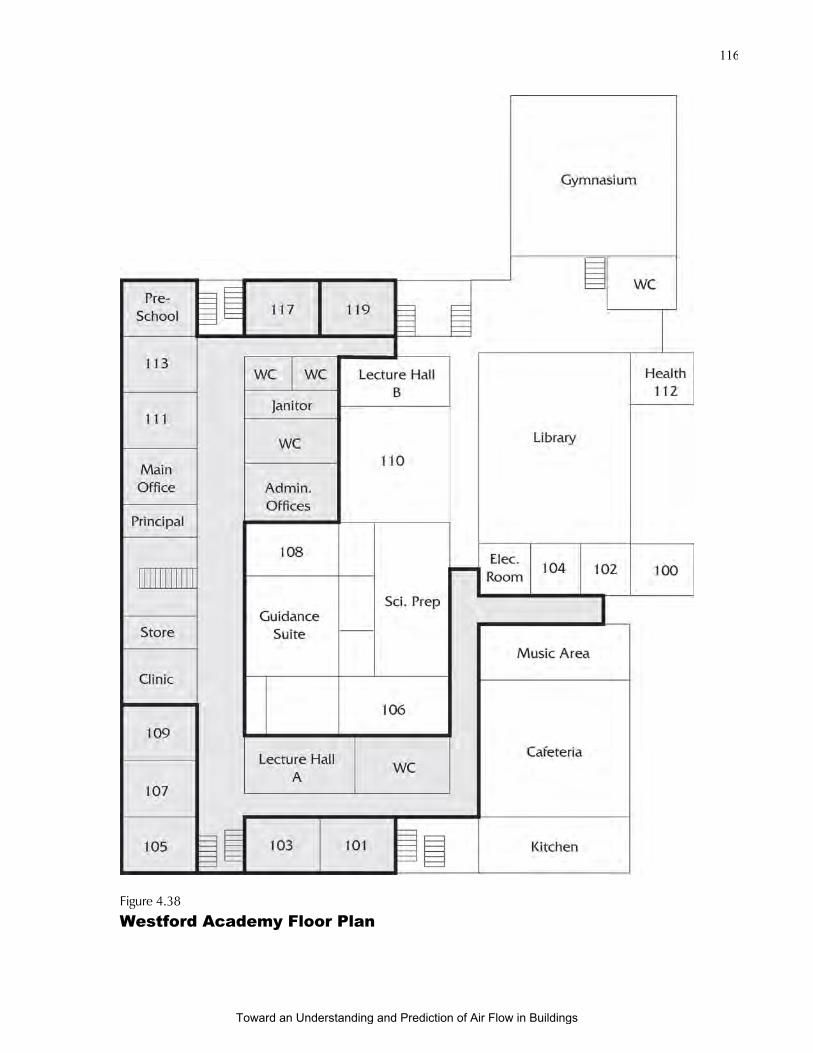
116
Figure 4.38
Westford Academy Floor Plan
Toward an Understanding and Prediction of Air Flow in Buildings
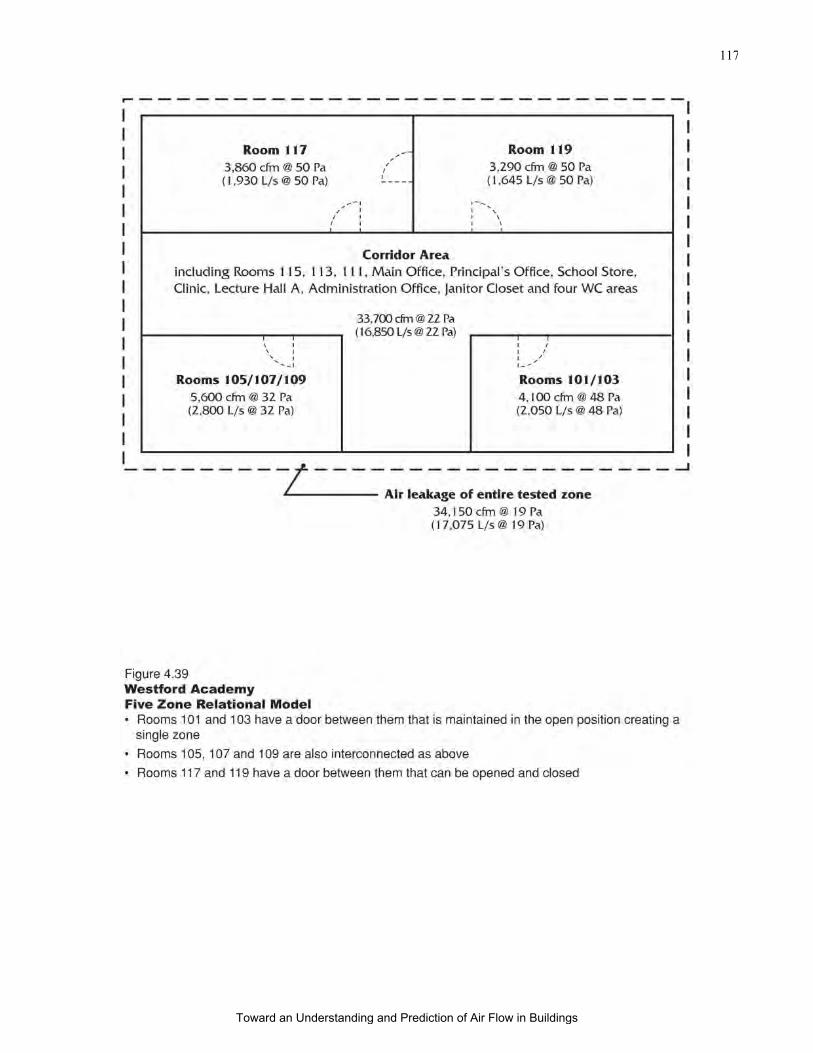
117
Toward an Understanding and Prediction of Air Flow in Buildings
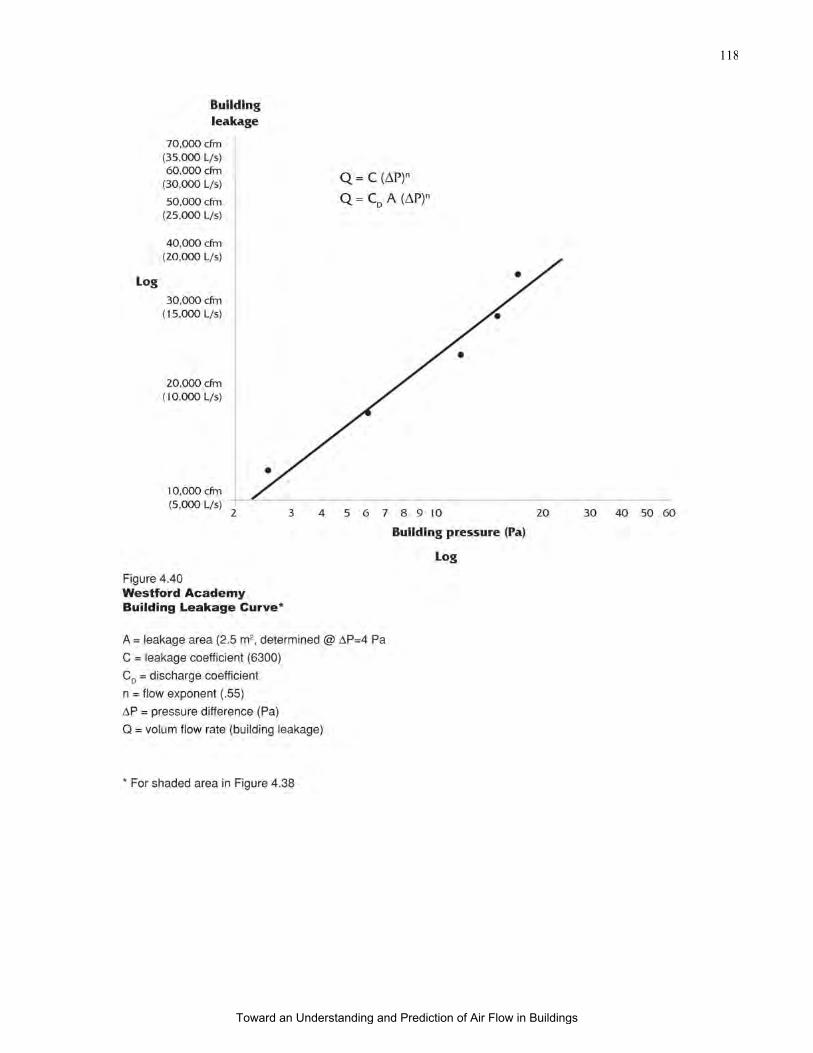
118
Toward an Understanding and Prediction of Air Flow in Buildings
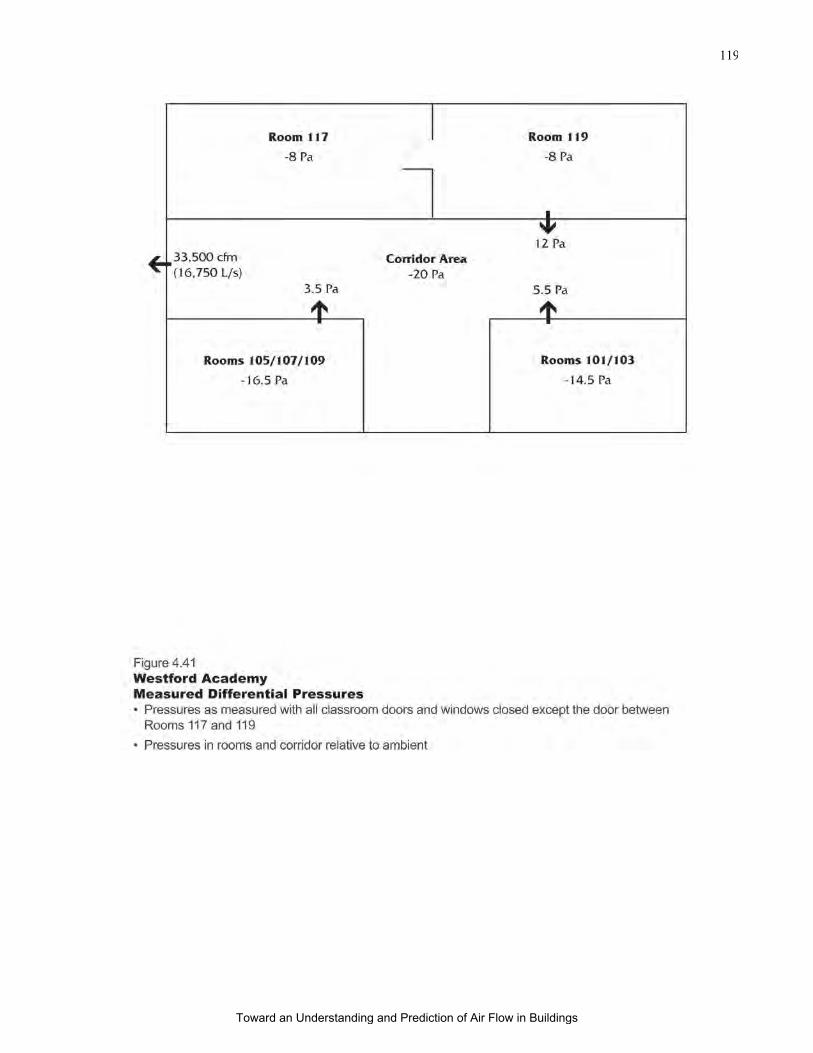
119
Toward an Understanding and Prediction of Air Flow in Buildings
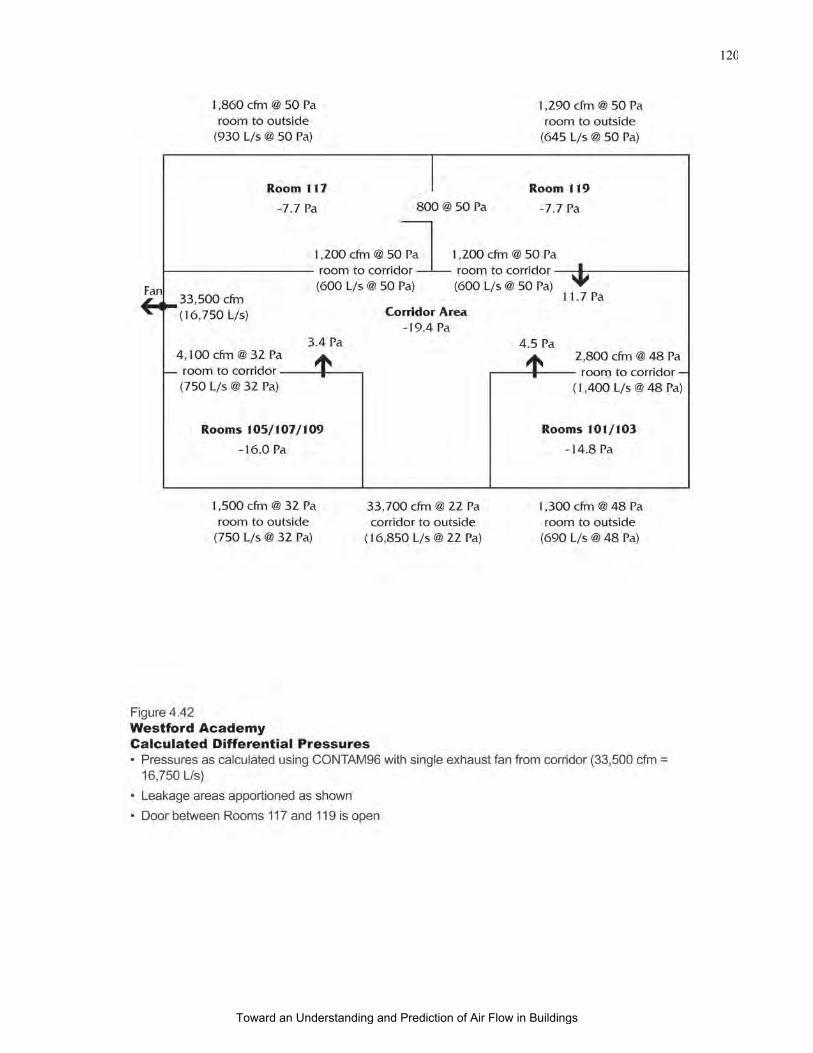
120
Toward an Understanding and Prediction of Air Flow in Buildings

121
Toward an Understanding and Prediction of Air Flow in Buildings
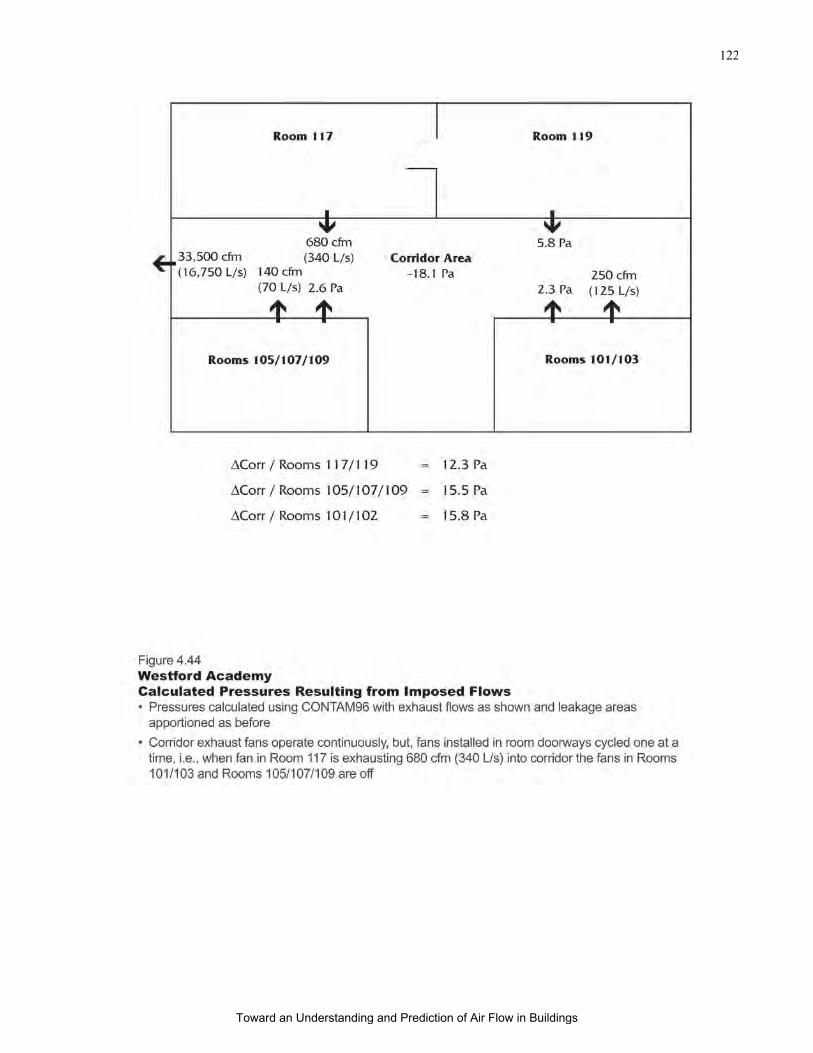
122
Toward an Understanding and Prediction of Air Flow in Buildings
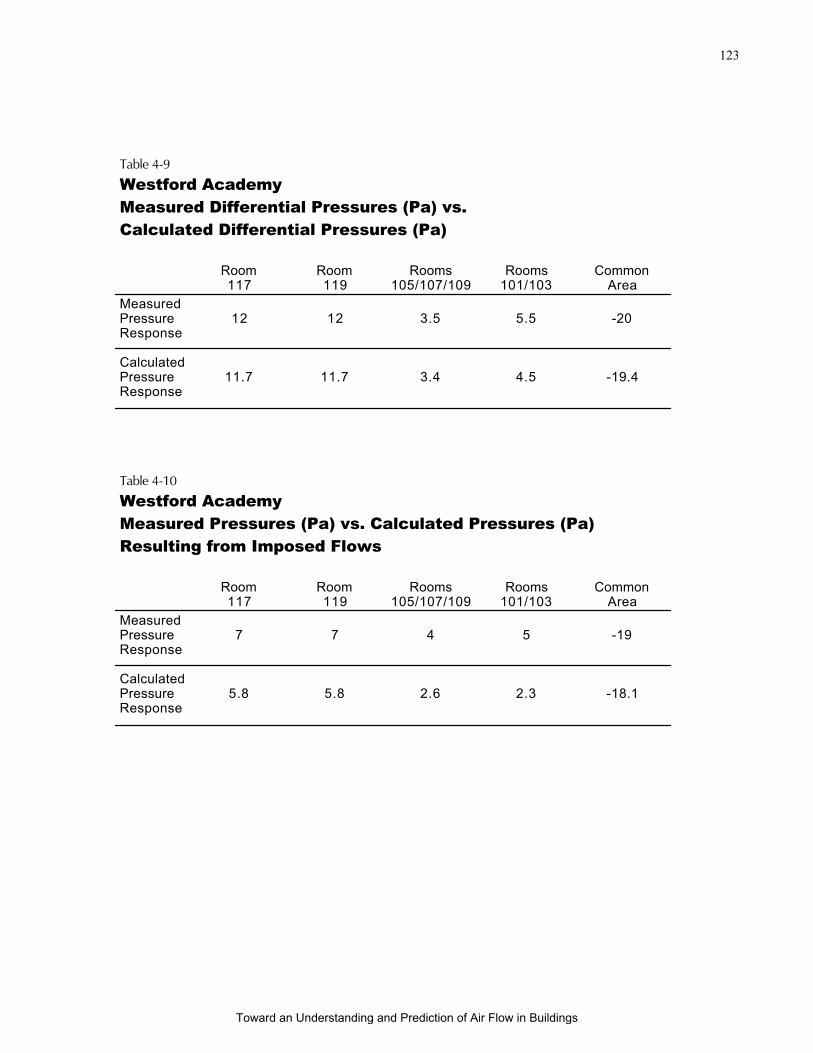
123
Table 4-9
Westford Academy
Measured Differential Pressures (Pa) vs.
Calculated Differential Pressures (Pa)
Room Room Rooms Rooms Common117 119 105/107/109 101/103 Area
MeasuredPressure 12 12 3.5 5.5 -20Response
CalculatedPressure 11.7 11.7 3.4 4.5 -19.4Response
Table 4-10
Westford Academy
Measured Pressures (Pa) vs. Calculated Pressures (Pa)
Resulting from Imposed Flows
Room Room Rooms Rooms Common117 119 105/107/109 101/103 Area
MeasuredPressure 7 7 4 5 -19Response
CalculatedPressure 5.8 5.8 2.6 2.3 -18.1Response
Toward an Understanding and Prediction of Air Flow in Buildings
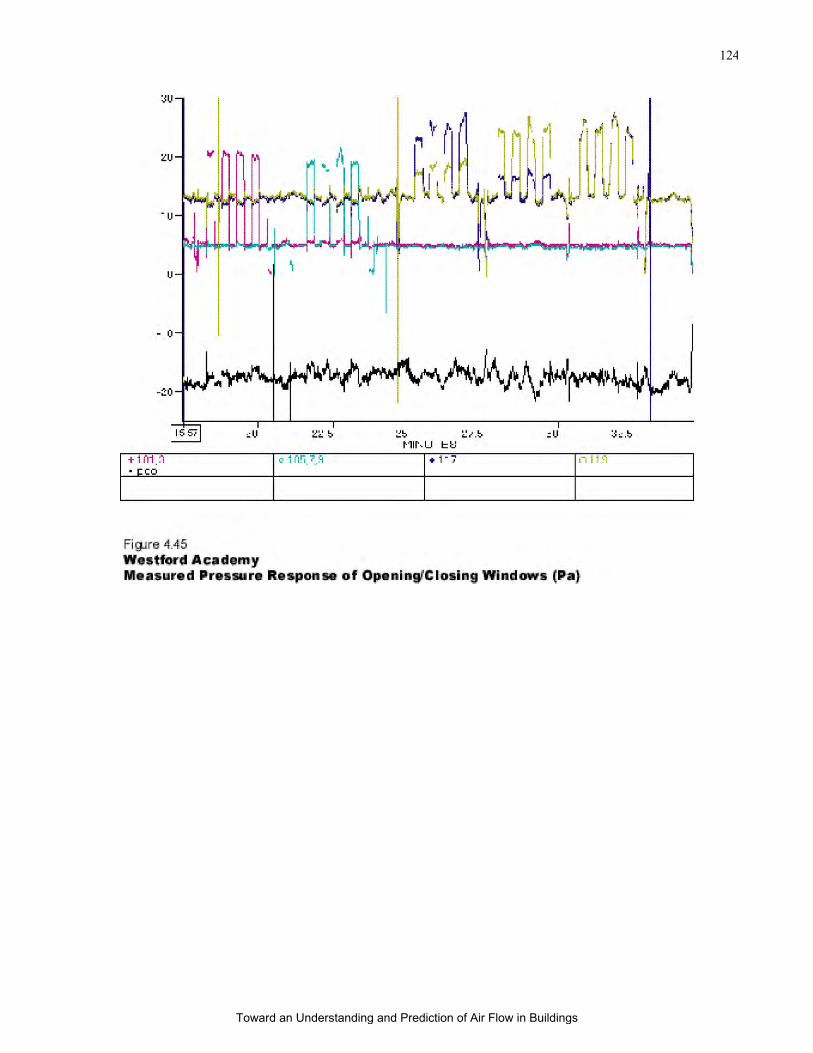
124
Toward an Understanding and Prediction of Air Flow in Buildings

125
Toward an Understanding and Prediction of Air Flow in Buildings
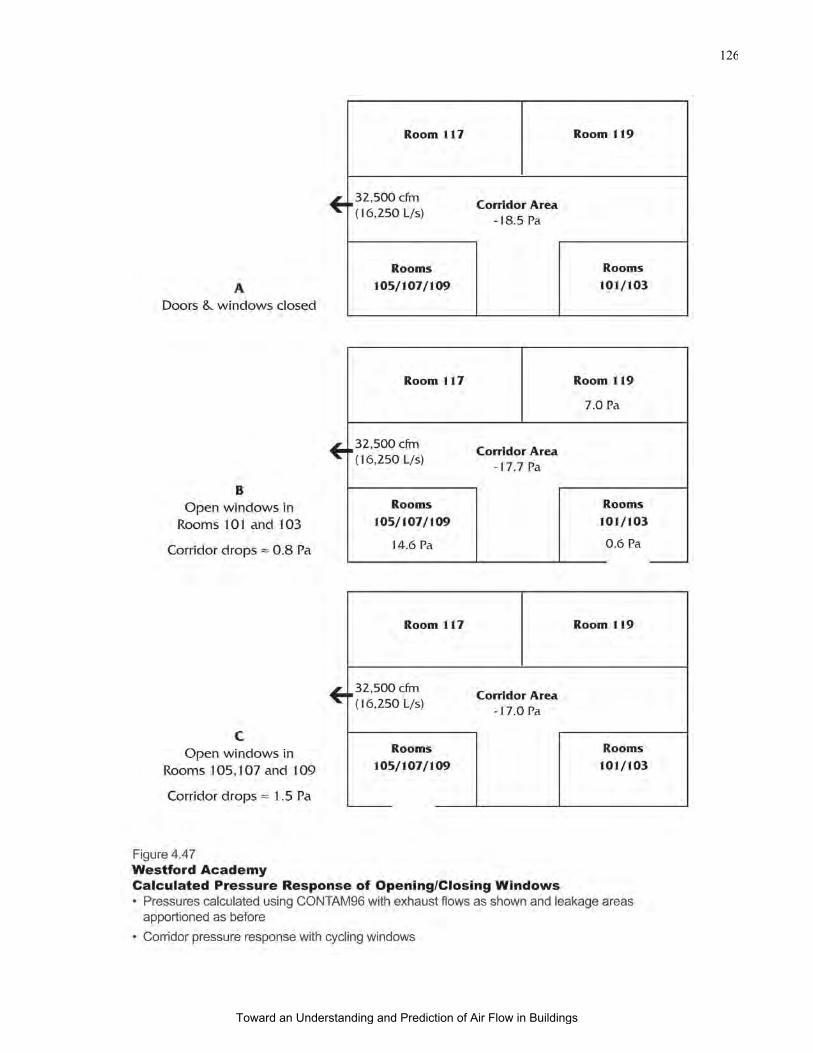
126
Toward an Understanding and Prediction of Air Flow in Buildings
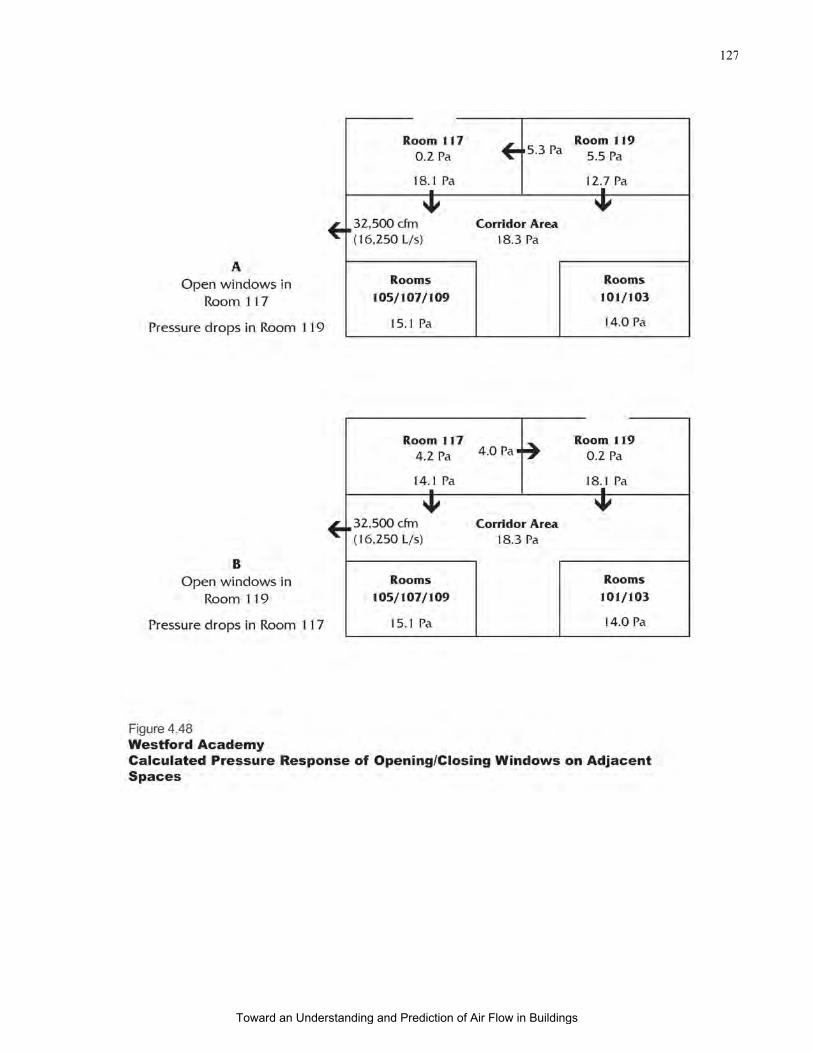
127
Toward an Understanding and Prediction of Air Flow in Buildings

128
Toward an Understanding and Prediction of Air Flow in Buildings
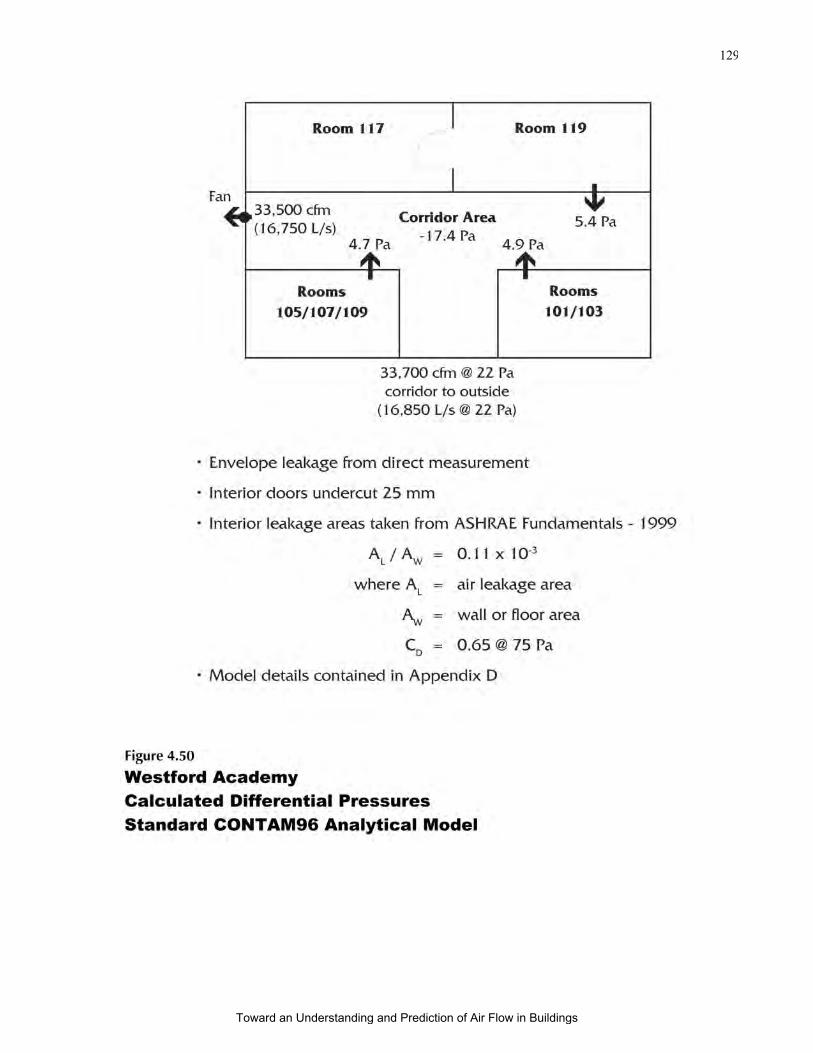
129
Toward an Understanding and Prediction of Air Flow in Buildings

130
Table 4-11
Westford Academy Comparisons of
Measured Differential Pressures (Pa) with Calculated Differential
Pressures (Pa) for a Tuned Model and a Standard Model
Room Room Rooms Rooms Common117 119 105/107/109 101/103 Area
Actual 12 12 3.5 5.5 -20
TunedModel 11.7 11.7 3.4 4.5 -19.4
StandardModel 5.4 5.4 4.7 4.9 -17.4
Toward an Understanding and Prediction of Air Flow in Buildings

131
Figure 4.51
Westford Academy Tracer Gas Results
SF
6 (
mg
/m)
Toward an Understanding and Prediction of Air Flow in Buildings

132
Figure 4.52
Westford Academy
Tuned CONTAM96 Analytical Model Prediction of Tracer
Gas Results
SF
6/
(mg
/m)
Toward an Understanding and Prediction of Air Flow in Buildings

133
Figure 4.53
Westford Academy
Standard CONTAM96 Analytical Model Prediction of Tracer
Gas Results
SF
6 (
mg
/m)
Toward an Understanding and Prediction of Air Flow in Buildings
134
Boundary Conditions for Analytical Macro and Micro Models
The type and amount of information available determines the approach used in
establishing the boundary conditions. Based on the tracer gas measurements, zonal leakage
measurements and pressure responses obtained from the Minneapolis House and the
Westford Academy, two distinct approaches to initialize model boundary conditions can be
used interchangeably or in combination to yield similar results:
• air flows of known magnitude (an imposed flow field) can be used to
perturb the building pressure field; or
• leakage areas of known magnitude can be introduced in a controlled manner
to perturb the building pressure field.
The measured air pressure response to these perturbations can be used to apportion
leakage areas in the network analytical model. The propagation of the pressure response in
the building can be compared to the propagation of the predicted pressure response of the
model and the model leakage areas adjusted as necessary to bring convergence. This
approach provides a previously missing logic to apportioning leakage areas while
constructing an analytical model.
It is important to note that this pressure response approach to determine boundary
conditions for analytic macro models for the general building flow and leakage regime
cannot be used to predict, solve or analyze the interstitial flow, pressure and leakage regime.
This approach may suggest that such flows exist, but as noted in the analysis of the
Minneapolis house, confirmation requires direct measurement. This approach can provide
the general conditions surrounding the interstitial regime, but the pressures and flows within
the interstitial spaces cannot be predicted with certainty using analytical means.
Boundary Conditions for Analytical Micro Models
If an interstitial flow regime has been identified by direct measurement of pressures,
flows, leakage paths or by indirect means such as the presence of mold or condensation, an
analytic micro model can be developed. The accuracy of the micro model can be enhanced
using similar means to those used with analytical macro models. For example, the
interstitial regime described in the hotel room example of Figure 3.10 or of Figure 3.11 can
be modeled by obtaining the response of the interstitial air pressure fields to perturbations
created by adding an air flow of known magnitude to the interstitial cavity or by adding a
leakage area of known magnitude (a variation of “the add a hole approach” – see Blasnik
and Fitzerald, 1992).
Toward an Understanding and Prediction of Air Flow in Buildings

135
V Practical Applications of the
Work
Toward an Understanding and Prediction of Air Flow in Buildings
136
Diagnostics and Design
Understanding the significance of the complex flow and pressure distribution
problems created by the interaction of the building envelope with the mechanical system and
climate can lead to changes in building design, commissioning, operations, maintenance,
diagnostics and rehabilitation.
Diagnostic protocols can be based on the enhanced understanding of pressures and
air flows in buildings and the measurement techniques presented in this thesis. These
diagnostic protocols can be used to aid in identifying problems in buildings related to
indoor air quality, smoke and fire spread, durability of the building envelope relating to air
transport of moisture, operating costs relating to energy use, and comfort issues related to
humidity, temperature and odors.
Additionally, rehabilitation approaches can also be developed that allow an
assessment of the existing interactions in buildings to be rehabilitated, provide the designer
with choices as to desired interactions given the constraints of the existing building, give the
commissioning agent performance guidelines to compare against after rehabilitation is
complete and provide the building operators with building operating instructions and
required operating air pressure relationships.
The designer can now have a choice to either prevent accidental coupling of the
mechanical system to the building envelope by design changes to the building envelope and
the mechanical system or to deliberately couple the mechanical system to the building
envelope to provide enhanced control of air transported moisture control, odor control,
smoke control or heat transfer control.
The commissioning agent can now have the ability to determine the interactions of
the building envelope and the mechanical system in a systematic, repeatable manner and
compare the interactions to design intent.
Finally, the building operators can now have the ability to determine the interactions
of the building envelope and the mechanical system on an ongoing basis in a systematic,
repeatable manner and compare the interactions to design intent, the initial commissioned
state and building operating instructions.
The following five examples are applicable to:
• Indoor Air Quality
• Smoke and Fire Spread
• Durability (moisture)
• Comfort
• Operating Cost (energy)
Toward an Understanding and Prediction of Air Flow in Buildings
137
Indoor Air Quality
A school located in Trenton, NJ provides a good example of using the relational
model of air pressure relationships in buildings and the air pressure measurement
techniques developed in this thesis to diagnose and remediate indoor air quality complaints
associated with the facility.
Description of Facility and History of Problems
The facility in question is a single story masonry school building constructed over a
crawl space foundation. The facility consists of several wings constructed at different
periods over the past 60 years. Each wing has a separate foundation system, although
communication between the various crawl space foundations was present. The crawl space
in the affected area of the facility consists of a perimeter cast concrete foundation wall on
concrete strip footings. The floor deck consists of cast concrete supported on precast
concrete beams supported on the perimeter foundation walls and interior cast concrete
bearing walls. The crawl space floor surfaces were uncovered earth. Crawl space
ventilation consisted of numerous 20 cm x 30 cm vents, distributed in an approximate ratio
of 1/1500 between vent area and floor area.
A teacher in one of the classrooms of the affected area of the facility was
complaining of mold odors, headaches, fatigue, and flue like symptoms. Discussions with
the teacher indicated that similar complaints were also common among the students.
Further discussions indicated that complaints had been registered for several months with
no action resulting. It appeared that no record of complaints had been kept.
Investigation and Testing
Upon entering the classroom which the affected teacher and students occupied,
visible deterioration of plaster and baseboard surfaces were observed along interior and
exterior walls. The deterioration was most intense at the baseboard level, and decreased in
intensity with height. Paint had peeled from the plaster at many locations. Water markings
were observed on the plaster surfaces. The plaster was soft to the touch and disintegrated
when probed. When the plastic covering over the wood baseboard trim was removed,
noticeable musty odors were encountered. The wood was soft and "punky". Significant
decay of the wood was observed. When the wood baseboard was pulled away from the
wall, the intensity of the musty odors increased significantly.
Visual observations revealed a joint between the concrete floor slab and the masonry
perimeter wall. Other joints were observed in the concrete floor slab at the interior concrete
foundation walls. Smoke pencil testing indicated substantial air flow between the crawl
space and the classroom through these exposed joints. Readings taken with a digital
Toward an Understanding and Prediction of Air Flow in Buildings
138
micromanometer indicated that the classroom was operating at 4 Pa negative with respect to
the crawl space (Figure 5.1). Furthermore, interior wall cavities were found to operate at 1
Pa negative with respect to the classroom.
Removal of deteriorated plaster revealed the wall construction. Interior plaster was
installed over wood furring strips creating an air space (or channels) between the plaster and
the masonry wall. Removal of ceiling tiles indicated that the plaster finish extended just
above the dropped ceiling level and that the air space (or channels) between the plaster and
the masonry wall was open at the top and connected to the air space above the dropped
ceiling. This wall geometry created "chimneys" which extended from the crawl space to the
air space above the dropped ceiling.
The air space above the dropped ceiling was used as a return air plenum that
operated under a negative air pressure relative to the classroom due to the operation of air
handling units within the dropped ceiling (Figure 5.2). Additionally, each classroom was
equipped with a roof top exhaust fan that extracted air from the dropped ceiling
depressurizing both the dropped ceiling and the classroom relative to the exterior. When
the roof top exhaust fan was shut down, the negative air pressure difference between the
classroom and the crawl space was reduced to less than 1 Pa.
Discussion with school district staff, and photographs indicated that no ground
cover was present in the crawl space. According to staff, the top surface of the soil appeared
dry. In addition, many of the steam lines in the crawl space were reported to be uninsulated
due to ongoing asbestos mitigation work. Crawl space temperatures in excess of 30
degrees C were typical according to staff.
Crawl space vents were sealed and an exhaust fan was installed in the crawl space
exhausting air to the exterior. The access opening connecting the affected crawl space and
the adjacent crawl space was also sealed. Air pressure differentials between the affected
classroom and the crawl space were monitored. Extracting approximately 325 L/s of air
from the crawl space by means of an exhaust fan depressurized the crawl space 4 Pa with
respect to the classroom area. This was shown to result in a flow reversal of air between the
crawl space and the classroom area. Using a smoke pencil air could be shown to flow from
the classroom area into the crawl space when the exhaust fan was operating rather than from
the crawl space into the classroom.
Conclusions
The complaints from the teacher and students were due to musty odors resulting
from the deterioration of wood trim and other building materials. These odors and
deterioration were due to excessive moisture migrating from the crawl space under the
Toward an Understanding and Prediction of Air Flow in Buildings

139
classrooms into the interstitial spaces of interior and exterior walls as a result of the air
pressure relationship between these spaces and the crawl space.
The rationale for these conclusions follows.
For an odor or indoor air quality problem to occur, four factors are necessary:
• Pollutants are necessary;
• People (receptors) are necessary;
• Pathways are necessary (connecting the pollutants to the people); and
• Pressure differences are necessary (to push or pull the pollutants down the
pathways to the people).
It is obvious that people are necessary to be present in order for a problem to be
detected, or for a problem to exist. It is clear that although removing occupants is an
effective short term solution, this strategy is not an appropriate long term solution. The
receptors in this case are the teacher and students.
A pollutant is also necessary. In this case the primary pollutant is moisture, and this
moisture pollutant leads to the creation of the secondary pollutants which are mold and
other biological agents. Eliminating (removing) the pollutant (source control) is a very
effective approach to controlling indoor air quality problems.
A pathway connecting the pollutant and people (receptors) is also necessary. If
pollutants and receptors are isolated from each other by "perfect" barriers, then problems
can also be eliminated. In this case the pathway connecting the moisture pollutant and the
receptor are the openings connecting the crawl space and the channels between the plaster
surfaces and the masonry walls.
Finally, a driving force is required to "push" or “pull” the pollutant down the
pathway to the occupants (receptors). In this case the driving force is an air pressure
difference between the crawl space and the classrooms. This air pressure difference is
created by a combination of the operation of the roof top exhaust fans and the operation of
the air handling units within the dropped ceiling areas.
Moisture (the primary pollutant) in the soil in the crawl space is evaporated due to
the elevated temperatures in the crawl space. Warm moisture saturated air migrates through
openings in the floor slab into the air space created by the plaster and wood furring (the
pathway). The air is pulled into the air space between the plaster and wood furring as a
result of the operation of the roof top exhaust fans and the operation of the air handling
units (the pressure “drivers”). The moisture saturated air cools once it is in the furring
space leading to condensation and saturation of the building materials at this location. The
saturation of the building materials leads to their deterioration and the creation of odors and
Toward an Understanding and Prediction of Air Flow in Buildings
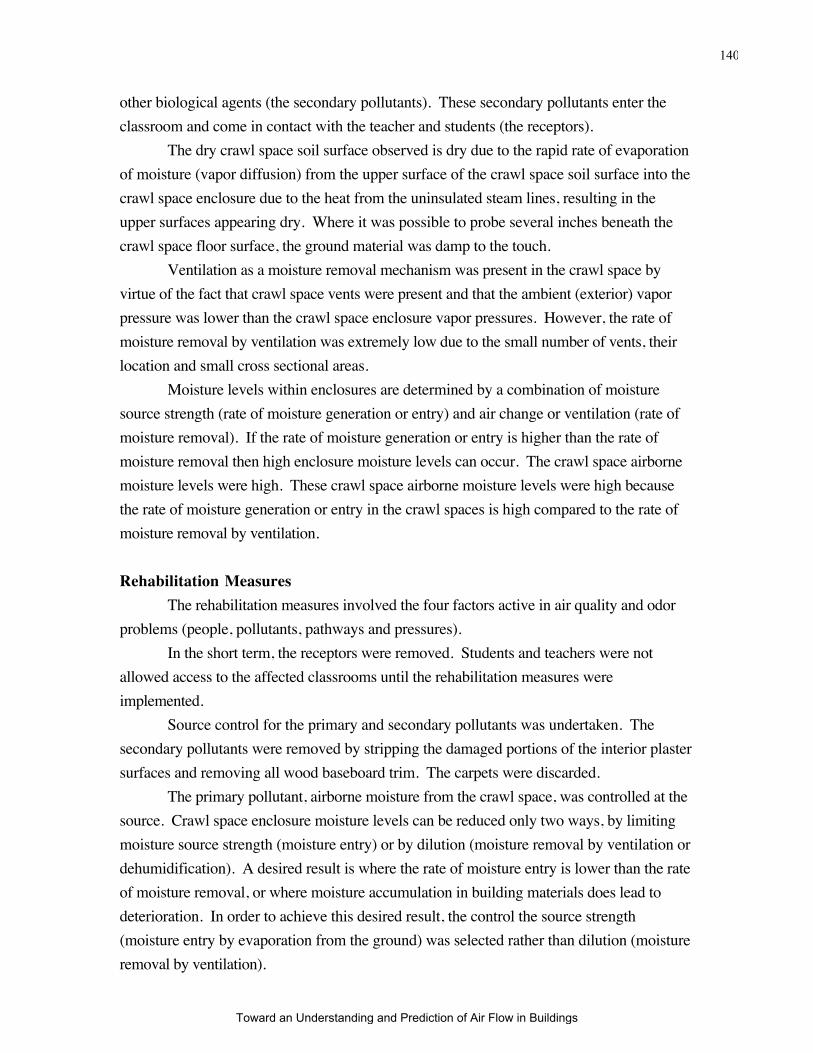
140
other biological agents (the secondary pollutants). These secondary pollutants enter the
classroom and come in contact with the teacher and students (the receptors).
The dry crawl space soil surface observed is dry due to the rapid rate of evaporation
of moisture (vapor diffusion) from the upper surface of the crawl space soil surface into the
crawl space enclosure due to the heat from the uninsulated steam lines, resulting in the
upper surfaces appearing dry. Where it was possible to probe several inches beneath the
crawl space floor surface, the ground material was damp to the touch.
Ventilation as a moisture removal mechanism was present in the crawl space by
virtue of the fact that crawl space vents were present and that the ambient (exterior) vapor
pressure was lower than the crawl space enclosure vapor pressures. However, the rate of
moisture removal by ventilation was extremely low due to the small number of vents, their
location and small cross sectional areas.
Moisture levels within enclosures are determined by a combination of moisture
source strength (rate of moisture generation or entry) and air change or ventilation (rate of
moisture removal). If the rate of moisture generation or entry is higher than the rate of
moisture removal then high enclosure moisture levels can occur. The crawl space airborne
moisture levels were high. These crawl space airborne moisture levels were high because
the rate of moisture generation or entry in the crawl spaces is high compared to the rate of
moisture removal by ventilation.
Rehabilitation Measures
The rehabilitation measures involved the four factors active in air quality and odor
problems (people, pollutants, pathways and pressures).
In the short term, the receptors were removed. Students and teachers were not
allowed access to the affected classrooms until the rehabilitation measures were
implemented.
Source control for the primary and secondary pollutants was undertaken. The
secondary pollutants were removed by stripping the damaged portions of the interior plaster
surfaces and removing all wood baseboard trim. The carpets were discarded.
The primary pollutant, airborne moisture from the crawl space, was controlled at the
source. Crawl space enclosure moisture levels can be reduced only two ways, by limiting
moisture source strength (moisture entry) or by dilution (moisture removal by ventilation or
dehumidification). A desired result is where the rate of moisture entry is lower than the rate
of moisture removal, or where moisture accumulation in building materials does lead to
deterioration. In order to achieve this desired result, the control the source strength
(moisture entry by evaporation from the ground) was selected rather than dilution (moisture
removal by ventilation).
Toward an Understanding and Prediction of Air Flow in Buildings
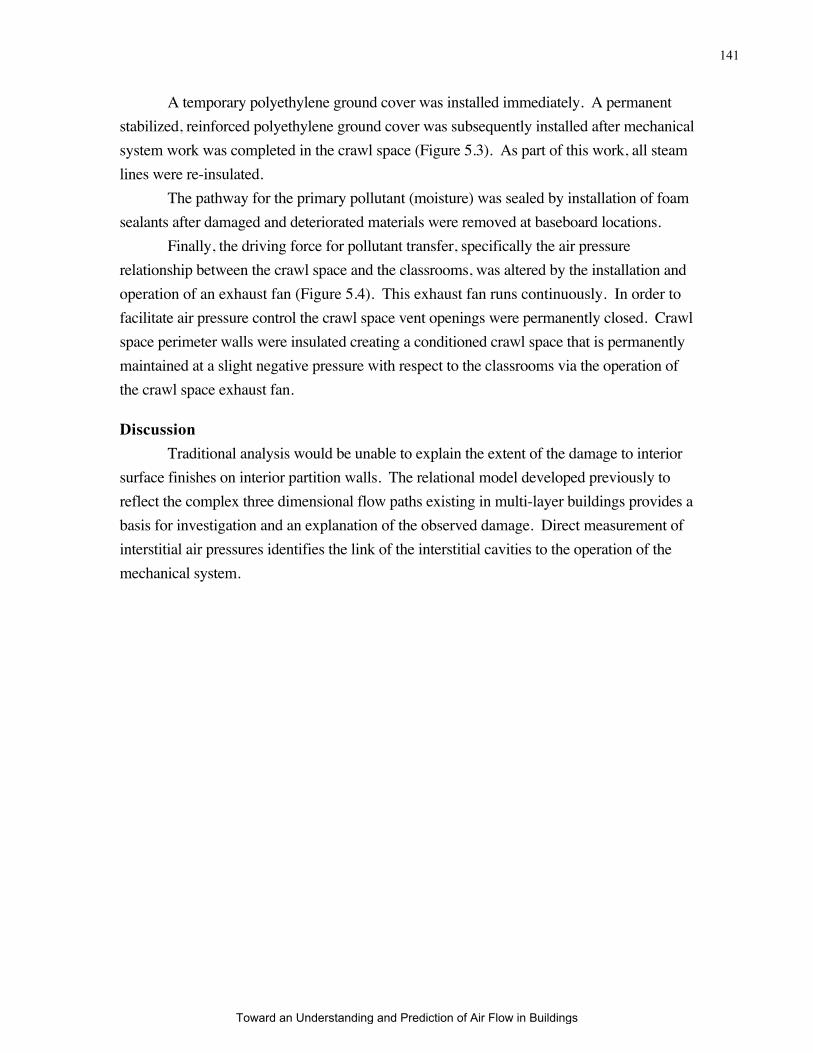
141
A temporary polyethylene ground cover was installed immediately. A permanent
stabilized, reinforced polyethylene ground cover was subsequently installed after mechanical
system work was completed in the crawl space (Figure 5.3). As part of this work, all steam
lines were re-insulated.
The pathway for the primary pollutant (moisture) was sealed by installation of foam
sealants after damaged and deteriorated materials were removed at baseboard locations.
Finally, the driving force for pollutant transfer, specifically the air pressure
relationship between the crawl space and the classrooms, was altered by the installation and
operation of an exhaust fan (Figure 5.4). This exhaust fan runs continuously. In order to
facilitate air pressure control the crawl space vent openings were permanently closed. Crawl
space perimeter walls were insulated creating a conditioned crawl space that is permanently
maintained at a slight negative pressure with respect to the classrooms via the operation of
the crawl space exhaust fan.
Discussion
Traditional analysis would be unable to explain the extent of the damage to interior
surface finishes on interior partition walls. The relational model developed previously to
reflect the complex three dimensional flow paths existing in multi-layer buildings provides a
basis for investigation and an explanation of the observed damage. Direct measurement of
interstitial air pressures identifies the link of the interstitial cavities to the operation of the
mechanical system.
Toward an Understanding and Prediction of Air Flow in Buildings
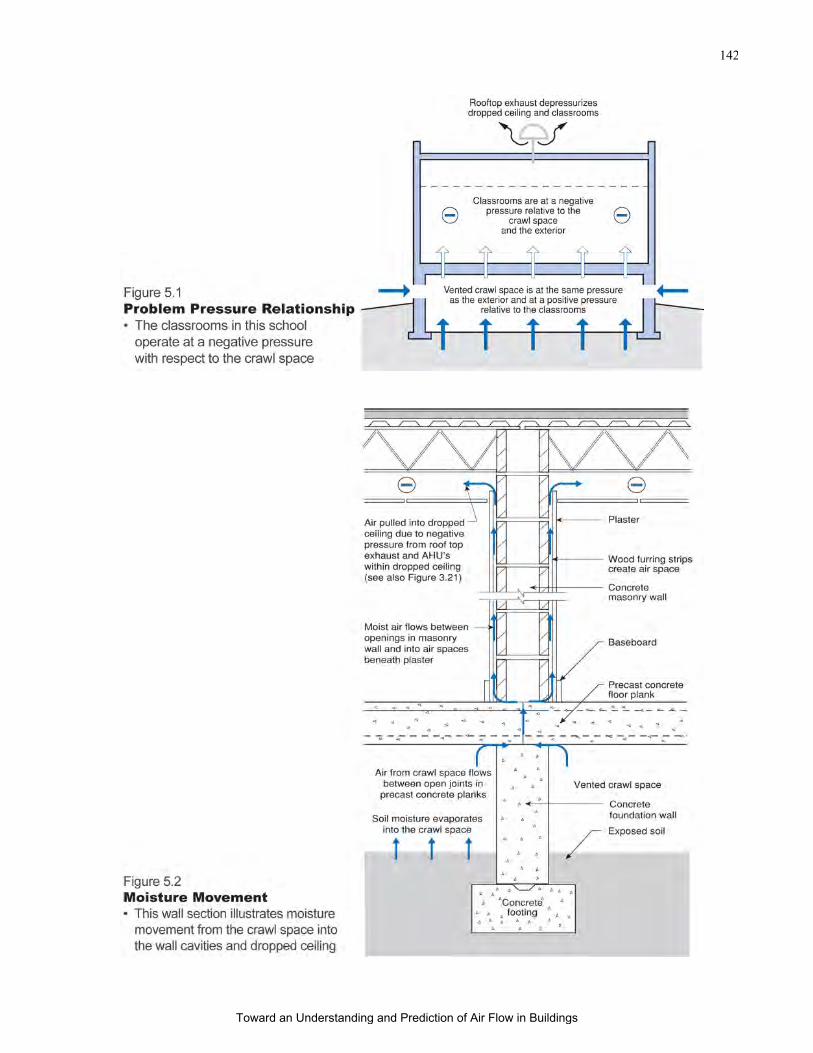
142
Toward an Understanding and Prediction of Air Flow in Buildings
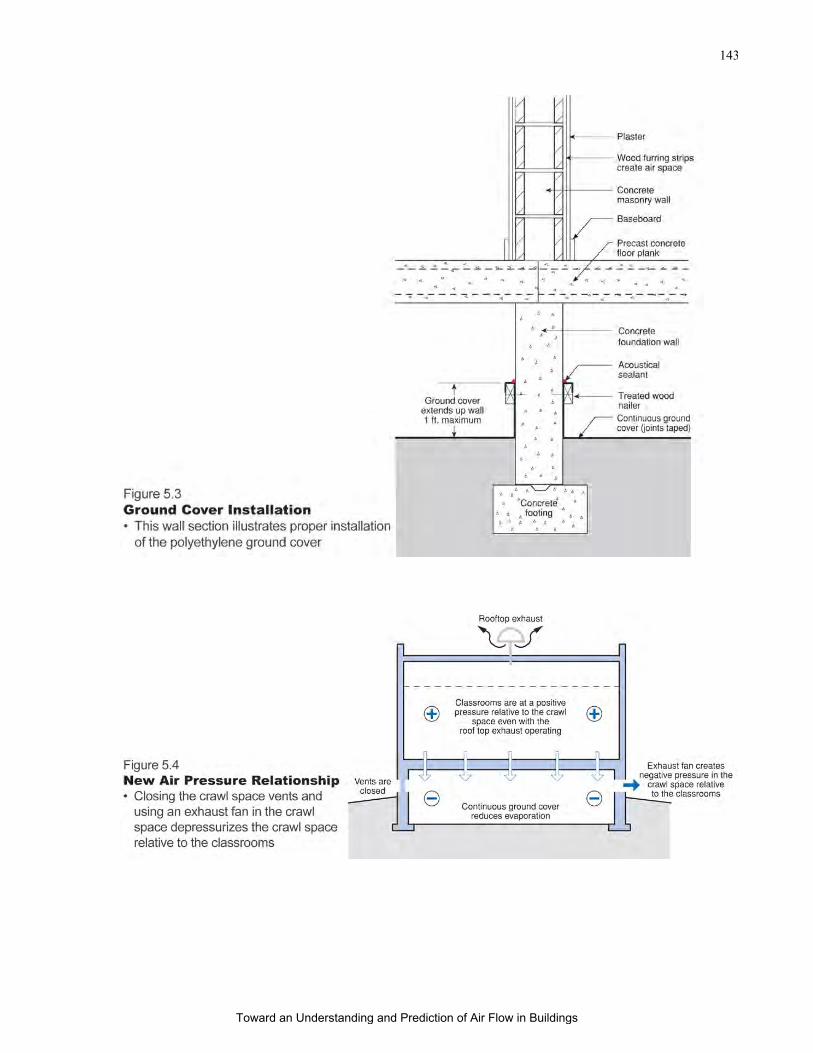
143
Toward an Understanding and Prediction of Air Flow in Buildings
144
Smoke and Fire Spread
A hotel located in Tallahasee, FL provides a good example of addressing smoke and
fire spread concerns in an existing facility scheduled for renovation by using pressurization
testing and pressure field measurements, developing a smoke and fire spread analytical
model based on the pressure field measurements and altering air pressure relationships
based on the analytical modeling and pressurization testing.
Description of Facility and History of Problems
The facility is a seven story concrete frame building constructed on a concrete grade
beam/slab foundation. The ground level contains the hotel registration area, restaurant,
meeting rooms, and service areas. The remaining upper six floors contain hotel suites.
There are 15 suites per floor or 90 suites in total. Each suite contains a hotel room and a
bathroom containing a bathtub/shower, vanity and toilet.
The exterior infill walls are steel stud with interior and exterior gypsum sheathing.
The exterior cladding is a traditional hardcoat stucco system over building paper. The stud
cavities are insulated with kraft faced fiberglass batt insulation. The interior surfaces are
finished with a vinyl wall covering.
According to design drawings roof top exhaust fans extract 25 L/s from each suite
at bathrooms (Figure 5.5). Additionally, 100 L/s is extracted from each corridor. In other
words, 475 L/s is extracted from each floor. Total exhaust for the six floors containing
suites is 2,850 L/s. The roof top exhaust fans operate continuously.
Each suite contains a through-wall packaged terminal heat pump (PTHP) for space
conditioning. Each PTHP supplies 30 L/s of outside air when it is operating. An additional
PTHP also serves each corridor suppling an additional 100 L/s to the corridors.
Approximately 550 L/s of outside air is supplied to each floor when all the PTHP’s on a
floor are operating.
The facility has been experiencing persistent high humidity problems since it was
constructed 5 years earlier. Additionally, it has been scheduled for a major renovation
where interior rooms are to be refurbished. As part of the renovation, a smoke
pressurization and smoke extraction system are to be installed.
Investigation and Testing
Digital manometers were used to establish the air pressure relationships throughout
the facility. Air pressure measurements were taken during calm weather in April. Exterior
temperatures were approximately 27 degrees C. Interior temperatures were approximately
24 degrees C. The facility in general was found to be operating at between 3 and 5 Pa
negative with respect to the exterior. The facility was most negative at the upper floors.
Toward an Understanding and Prediction of Air Flow in Buildings
145
Flow hood measurements of flow through exhaust grills in suites in upper floors indicated
greater exhaust flow than similar measurements in lower floors. The air pressure driver was
the roof top exhaust fans. When roof top fans were shut down, the hotel suite floors
became slightly positive with respect to the exterior - approximately 1 to 2 Pa. Most, but
not all PTHP’s, were shut down during the time that roof top exhaust fans were shut down.
The typical duty cycle of individual PTHP units was found to be about 20 percent.
It was estimated that only three suite PTHP’s plus the corridor PTHP operate at any one
time per floor supplying only approximately 190 L/s of outside air per floor. This yields a
deficit of supply to exhaust of approximately 285 L/s per floor.
Leakage testing of individual floors was conducted using variable speed
pressurization fans. Two types of measurements were taken. The first involved
pressurizing an individual floor by extracting air from a stairwell whose exterior doors were
opened to the exterior. The floors above and below the floor being tested were maintained
at exterior pressure by opening all windows and corridor doors. The second type of
measurement involved pressurizing the floors above and below the test floor as well as the
elevator shafts to identical pressures to the test floor thereby providing isolation of test floor
leakage to floors above and below. The experimental set-up is presented in Figure 5.6.
During both types of testing the individual bathroom exhaust grills and supply air
PTHP registers were taped shut. Additionally, hallway supply air grills were also sealed.
Under the first approach, approximately 500 L/s of outside air was required to pressurize
individual floors 5 Pa to the exterior. Under the second approach, approximately 275 L/s of
outside air was required to pressurize individual floors 5 Pa to the exterior.
Air pressure measurements within interior partition walls were also taken with
portable digital micromanometers. Walls connected to the service shafts containing the
exhaust ducts were found to operate 1 to 2 Pa negative with respect to interior rooms.
Walls not connected to service shafts appeared to operate at the same pressure as interior
rooms. When individual roof top exhaust fans servicing a particular service shaft were shut
down, wall cavity pressure differences relative to interior rooms disappeared.
Wall coverings were removed at select locations from interior partition walls.
Additionally, access openings were cut through gypsum board to allow inspection of wall
cavities. Vinyl wall coverings were found to be discolored with pink spots on room side
surfaces and discolored with black spots on gypsum side surfaces. Both types of
discoloration were more severe on interior partition walls connected to service shafts. Mold
growth was found within wall cavities. Again, as with the case of the wall coverings, more
growth was found within wall cavities connected to service shafts than wall cavities not
connected to service shafts.
Toward an Understanding and Prediction of Air Flow in Buildings

146
Conclusions
The deficit of exhaust to supply air flow is responsible for the negative air pressure
within the facility. The negative air pressure causes the infiltration of exterior unconditioned
air. This unconditioned air is responsible for the high interior humidity except during the
winter months when the exterior air has a low moisture content. Additionally, the negative
pressure field developed in interior partition walls connected to service shafts is due to
leakage of exhaust ductwork contained within the service shafts. This negative pressure
field causes the infiltration of exterior unconditioned air into the interior wall cavities leading
to mold growth and discoloration of the interior vinyl wall coverings.
Rehabilitation Measures
A supply air system was designed to pressurize the hotel suite floors. The key
features of this system follow:
• In order to achieve pressurization, the existing supply air vents in each
PTHP unit are permanently closed.
• Two roof top units supplying 2,100 L/s of neutral temperature air at
approximately 50 percent relative humidity are used to supply 700 L/s of air
to each floor (Figure 5.7).
• The existing exhaust system is balanced to extract 475 L/s from each floor.
• The supply excess of approximately 225 L/s per floor pressurizes each floor
approximately 2 Pa relative to the exterior.
• A grill is installed between the corridors and each service shaft at each floor
to allow the extension of the corridor air pressure field into the service
shafts at each floor thereby eliminating the previous negative pressure field
that extended from the service shafts within interior partition walls to the
exterior (Figure 5.8).
The existing vinyl wall coverings were removed and decontamination of the mold
occurred. Vapor permeable interior finishes were specified to replace the impermeable vinyl
wall coverings.
A smoke pressurization and smoke extraction system was also designed using the
pressurization test results (Figure 5.9). A minimum 25 Pa pressure difference between fire
floors and non fire floors was specified as a design criteria. Approximately 1000 L/s was
found to pressurize each floor approximately 25 Pa relative to the exterior when the roof top
exhaust fans are not operating. Conversely, an approximate exhaust flow of 1,000 L/s was
found to depressurize each floor 25 Pa relative to the exterior when the corridor supply
system is not operating. By supplying 1,000 L/s to non fire floors and extracting 1,000 L/s
Toward an Understanding and Prediction of Air Flow in Buildings
147
from fire floors when the supply and exhaust systems are de-energized a greater than 25 Pa
pressure difference can be maintained.
Discussion
An analytical model for smoke propagation was constructed using the CONTAM96
network model. The network model was configured to the relational model presented in
Figure 5.9 and “tuned” using the zonal pressure measurements to apportion leakage areas
thereby establishing boundary conditions.
Modeling confirmed the expected design performance of the smoke extraction
system and smoke pressurization system described in Figure 5.9. The actual measurement
of boundary conditions through pressurization testing significantly reduced the installation
cost of the smoke extraction and pressurization systems. Required air flows were reduced
approximately 35 percent over those of standard analysis.
Toward an Understanding and Prediction of Air Flow in Buildings
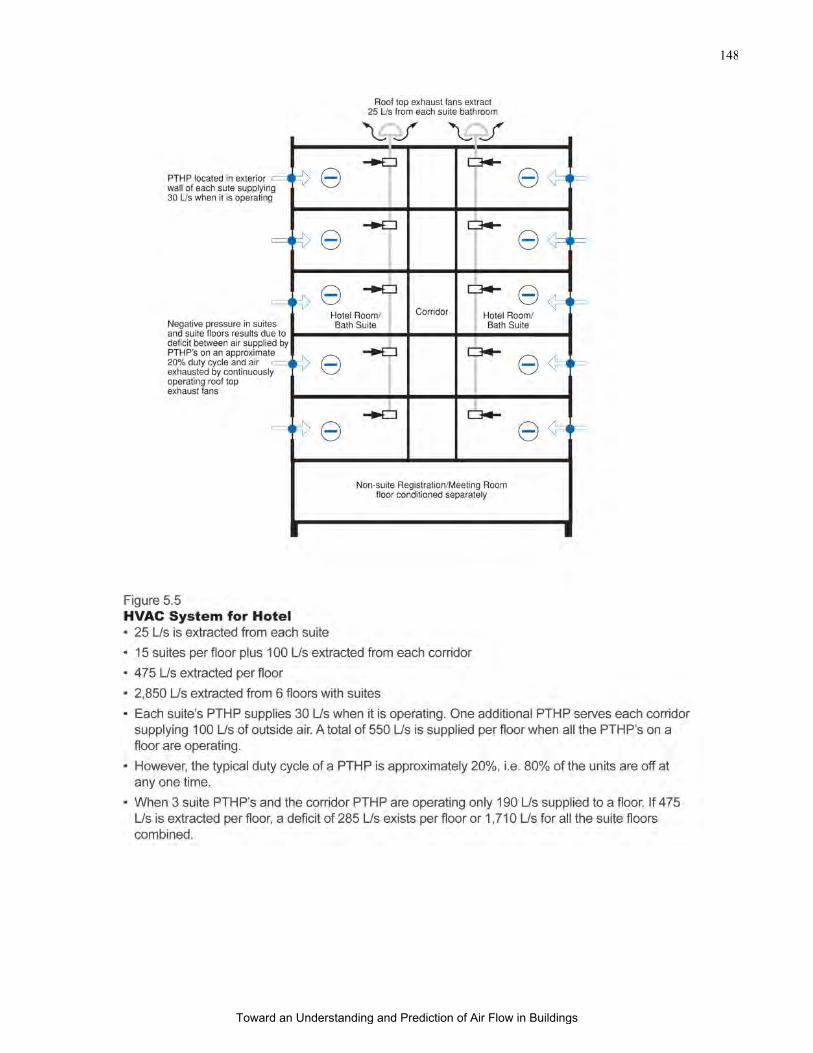
148
Toward an Understanding and Prediction of Air Flow in Buildings
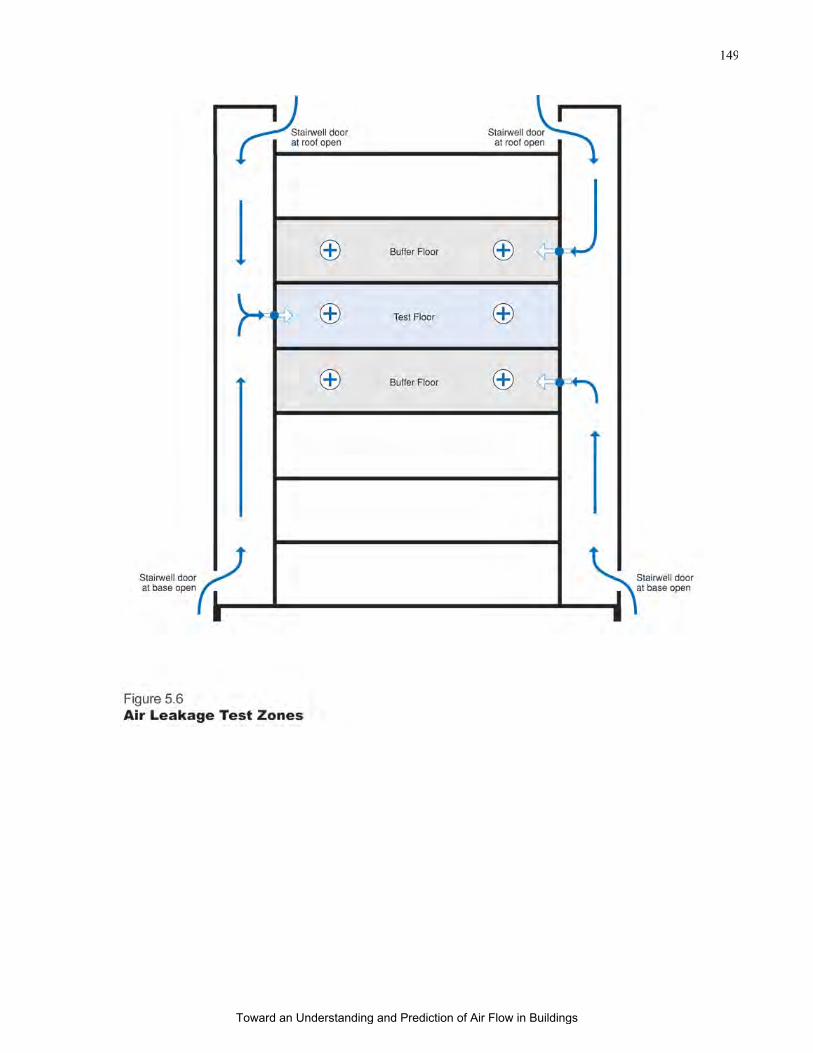
149
Toward an Understanding and Prediction of Air Flow in Buildings
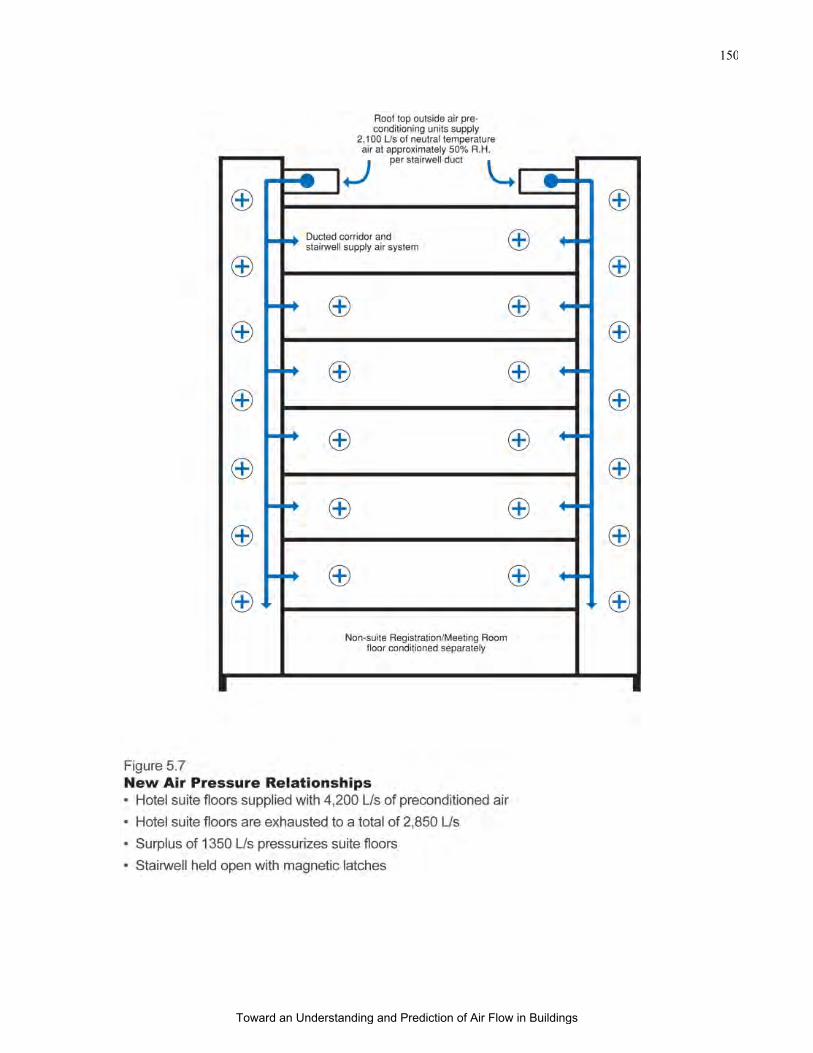
150
Toward an Understanding and Prediction of Air Flow in Buildings
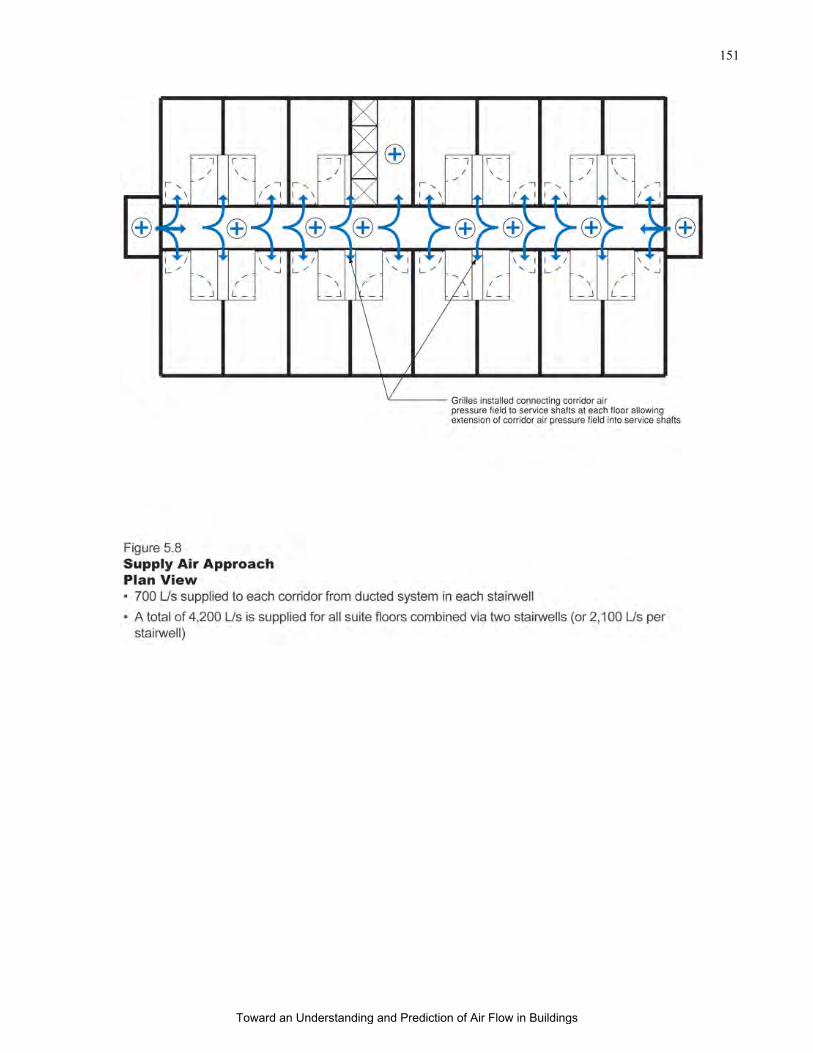
151
Toward an Understanding and Prediction of Air Flow in Buildings
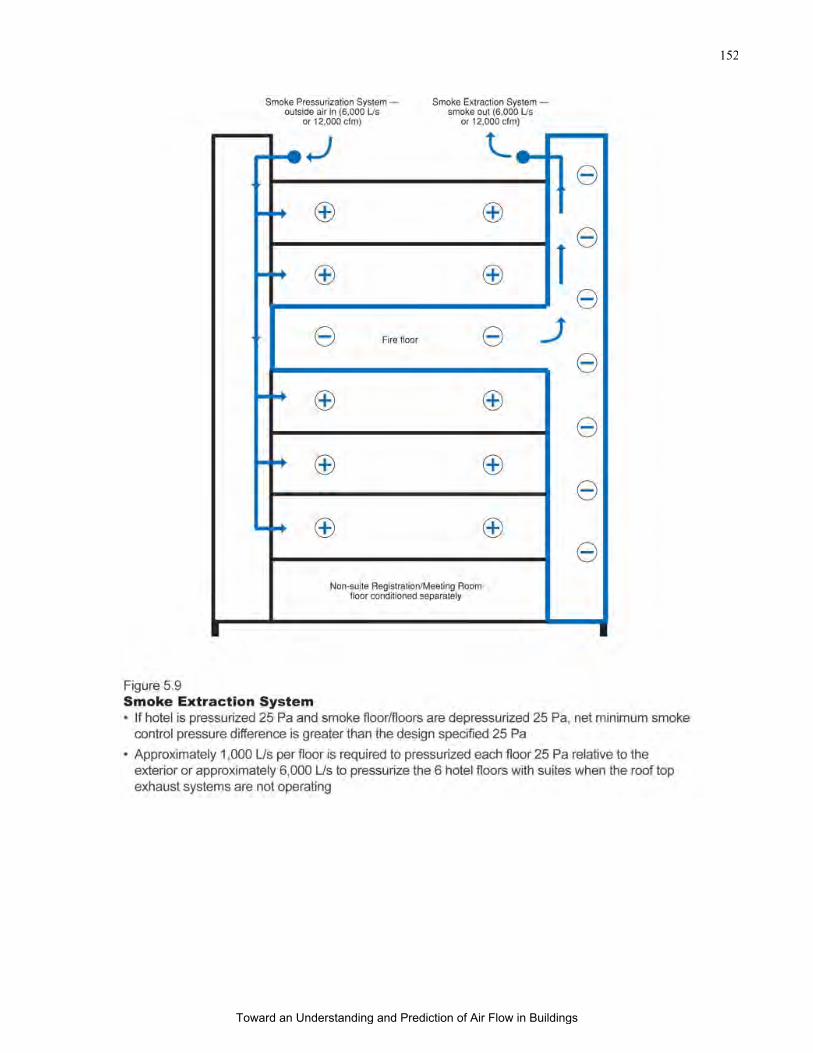
152
Toward an Understanding and Prediction of Air Flow in Buildings
153
Durability (moisture)
A data processing center located in Hartford, CT provides a good example of
addressing durability (moisture) concerns in an existing facility by using “pressure
mapping” to diagnose the problems (identify the linkage among the constituent building
pressure fields) and by using temperature controlled pressurization of interstitial cavities to
remediate the facility.
Description of Facility and History of Problems
The facility is a 10,000 m2 two story steel framed structure on a concrete slab
supported by a grade beam foundation. The exterior cladding consists of face sealed
precast panels. Insulated steel stud walls are constructed to the interior of the precast
panels. A cavity varying between 50 mm and 500 mm exists between the interior surfaces
of the precast panels and the exterior face of the insulated steel stud walls. Gypsum board
is installed on the interior of the steel stud walls over a polyethylene air-vapor barrier.
The roof assembly is a built up roof over 100 mm of rigid insulation installed over a
concrete roof deck.
The facility contains raised floor plenums that provide conditioned air throughout.
The conditioned air is heated, cooled, humdified, dehumidified as necessary by floor
mounted conditioning units that supply air to the under floor plenums. Outdoor air is
preconditioned and introduced to each floor by roof mounted air handlers.
The space conditioning and outdoor air systems (Figure 5.10) create a pressurized
enclosure that is maintained at 24 degrees C., 50 percent relative humidity year round.
Condensation during winter months occurs on the inside face of the precast panels
and drains out at floor slabs and window penetrations leading to deterioration of interior
finishes, mold odors and microbial contamination of interstitial cavities.
Investigation and Testing
Air pressure differential measurements of the facility and interstitial cavities
(“pressure mapping” of the facility) were taken when exterior temperatures were
approximately 15 degrees C. Wind conditions were dead calm. The air pressure
differential relationships as measured are presented in Figure 5.11.
Four portable variable speed calibrated flow fans (“blower doors”) were used to
introduce outside air to the interstitial space between the precast panels and the insulated
steel stud walls. The fans were positioned at the four exterior corners of the building and
introduced air into the interstitial spaces via access holes that were cut in soffits over exterior
doors. Approximately 4,000 L/s of outside air was necessary to pressurize the interstitial
spaces 5 Pa relative to the interior space above the raised floors (the occupied space).
Toward an Understanding and Prediction of Air Flow in Buildings
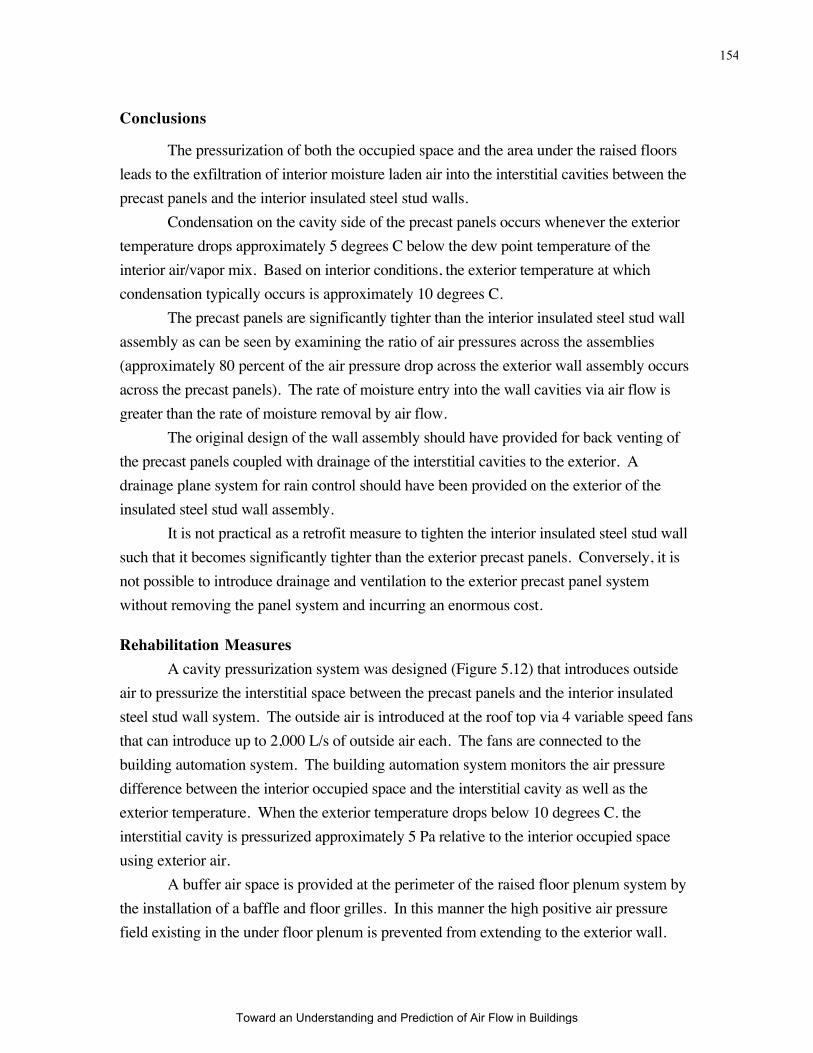
154
Conclusions
The pressurization of both the occupied space and the area under the raised floors
leads to the exfiltration of interior moisture laden air into the interstitial cavities between the
precast panels and the interior insulated steel stud walls.
Condensation on the cavity side of the precast panels occurs whenever the exterior
temperature drops approximately 5 degrees C below the dew point temperature of the
interior air/vapor mix. Based on interior conditions, the exterior temperature at which
condensation typically occurs is approximately 10 degrees C.
The precast panels are significantly tighter than the interior insulated steel stud wall
assembly as can be seen by examining the ratio of air pressures across the assemblies
(approximately 80 percent of the air pressure drop across the exterior wall assembly occurs
across the precast panels). The rate of moisture entry into the wall cavities via air flow is
greater than the rate of moisture removal by air flow.
The original design of the wall assembly should have provided for back venting of
the precast panels coupled with drainage of the interstitial cavities to the exterior. A
drainage plane system for rain control should have been provided on the exterior of the
insulated steel stud wall assembly.
It is not practical as a retrofit measure to tighten the interior insulated steel stud wall
such that it becomes significantly tighter than the exterior precast panels. Conversely, it is
not possible to introduce drainage and ventilation to the exterior precast panel system
without removing the panel system and incurring an enormous cost.
Rehabilitation Measures
A cavity pressurization system was designed (Figure 5.12) that introduces outside
air to pressurize the interstitial space between the precast panels and the interior insulated
steel stud wall system. The outside air is introduced at the roof top via 4 variable speed fans
that can introduce up to 2,000 L/s of outside air each. The fans are connected to the
building automation system. The building automation system monitors the air pressure
difference between the interior occupied space and the interstitial cavity as well as the
exterior temperature. When the exterior temperature drops below 10 degrees C. the
interstitial cavity is pressurized approximately 5 Pa relative to the interior occupied space
using exterior air.
A buffer air space is provided at the perimeter of the raised floor plenum system by
the installation of a baffle and floor grilles. In this manner the high positive air pressure
field existing in the under floor plenum is prevented from extending to the exterior wall.
Toward an Understanding and Prediction of Air Flow in Buildings

155
The variable speed fans allow compensation for stack effect pressures during cold
weather. Using the pressure difference between the interior occupied space and the
interstitial cavity as a reference pressure difference compensates for the dynamic effects of
wind allowing the building itself to act as a “dash pot”. Using the exterior air pressure as
a reference pressure is impractical due to the high variability of the boundary layer air
pressure regime.
Discussion
The relational air pressure field model describing the building (Figure 5.11)
developed from identifying the linkage among the constituent building pressure fields
allows the implementation of an innovative cavity pressurization system to rehabilitate the
facility.
The cavity pressurization system provided a low cost alternative to reconstructing the
exterior wall assembly. The cost of the pressurization system was approximately $35,000
(including diagnostics, testing, design, installation and commissioning). The cost to
reconstruct the exterior wall assembly was estimated at approximately $2,500,000. The
disruption to facility operations during exterior wall assembly reconstruction was not
considered.
Toward an Understanding and Prediction of Air Flow in Buildings
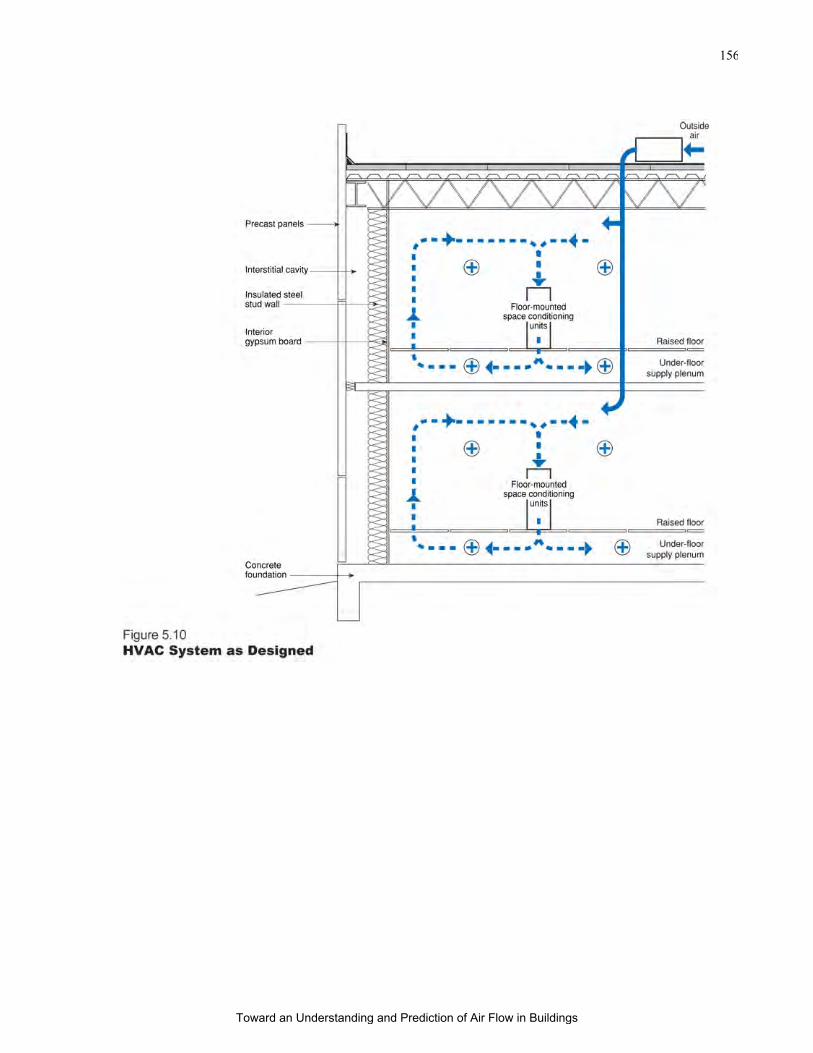
156
Toward an Understanding and Prediction of Air Flow in Buildings
157
Toward an Understanding and Prediction of Air Flow in Buildings
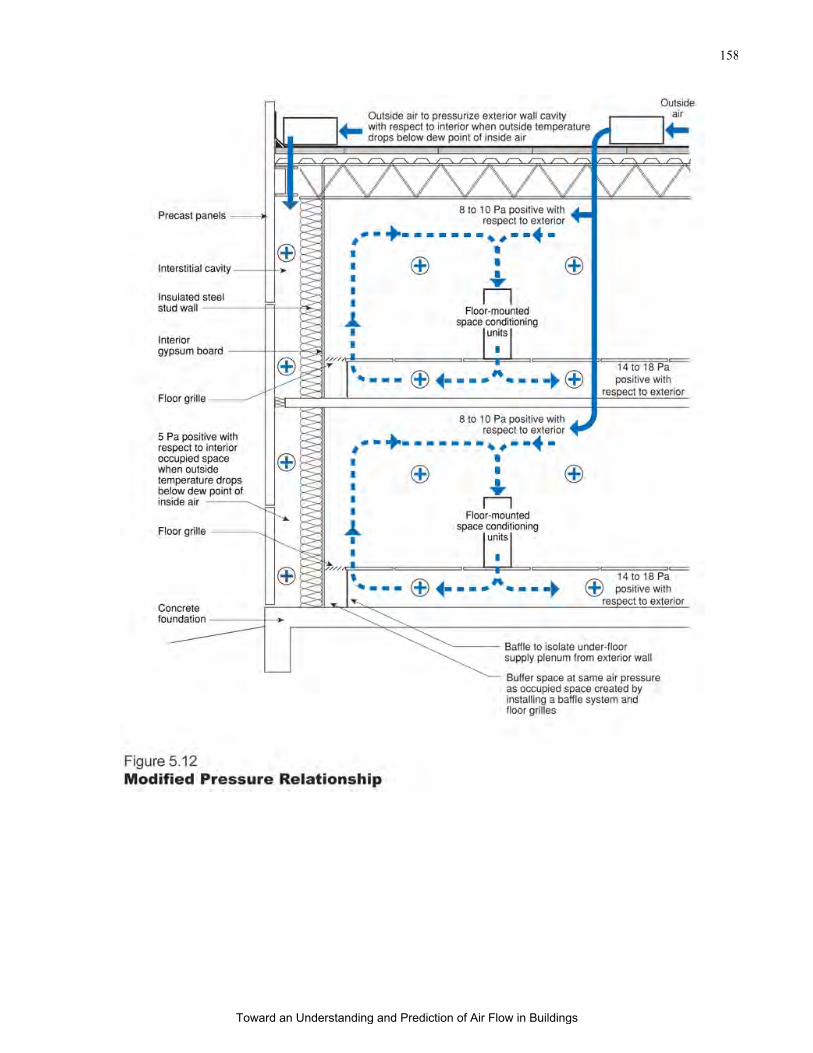
158
Toward an Understanding and Prediction of Air Flow in Buildings
159
Comfort
A condominium development located in Mahwah, NJ provides a good example of
addressing comfort concerns using pressurization testing and series air pressure differential
measurements to diagnose building related problems.
Description of Facility & History of Problems
The development in question is multi-unit project constructed between 1990 and
1991. The units are multi story wood framed structures. Floor framing consist of open
webbed floor trusses. Party walls are double wood frame with fire rated gypsum.
The space conditioning systems consist of forced air natural gas units. These units
are located in utility rooms. A natural gas water heater is also located within each utility
room. Meter closets are constructed external to the units.
The residents of some of the suites had been complaining of cold interior floor
temperatures, high heating bills, an inability to heat the units, large temperature differences
between rooms, between upper floors and lower floors, frozen pipes, and water leakage from
ice damming.
Investigation and Testing
The interior structure of the buildings was visually examined from within via
existing access openings, from within the attic spaces and from access openings (intrusive
disassembly) cut in interior gypsum board and through wood subfloor sheathing.
Particular attention was focused on utility chaseways, fireplace chaseways and enclosures,
party wall construction, floor framing, bulkheads, service penetrations, the intersection of
sloped ceilings and partition walls and mechanical system installation.
Visual observations from within attic spaces of roof assembly perimeters indicated
insulation substantially filling the majority of the spaces between the underside of roof
sheathing and the top plates of exterior walls. Insulation vent baffles were intermittently
installed in truss bays. Soffit venting was discontinuous. Soffit venting, where installed,
occurred through the use of perforated soffit closures.
In roof regions which experienced the greatest amount of ice damming, specifically
the lower reaches of valleys at the intersection of two different roof slopes, no provision for
roof ventilation was found. Intersecting roof truss cavities were blocked solid with wood
framing and filled with insulation.
Attic temperatures were measured in the range of 5 to 10 degrees C when the
exterior temperature was - 18 degrees C indicating a combination of substantial heat loss
and a likely lack of effective attic ventilation. Large gaps were observed between openings
cut in ceiling gypsum board and boots connected to supply ductwork installed in attics
Toward an Understanding and Prediction of Air Flow in Buildings
160
penetrating the ceiling gypsum board openings. Voids and gaps were observed between
ceiling gypsum board and the underside of attic ceiling batt insulation.
Visual observations indicated that the building envelopes were "leaky" at utility
chaseways, fireplace chaseways and enclosures, party wall locations, perimeter "band"
joist/"rim" joist locations, bulkheads, and service penetrations.
Observations, comfort indicators (temperature measurements) and discussions with
occupants indicated imbalances in flow between levels within units as well as between
rooms. In multi level units, most of the delivered air from supply ductwork appeared to be
supplied to the second floor /upper levels. In single level units, large differences in comfort
levels between rooms was noted. Occupants claimed that very little supply air got delivered
by the heating systems.
Large chaseways and related air flow pathways were identified by cutting access
openings over fireplace mantles. Many of these chaseways and flow paths were connected
to vented roof/attic areas constituting significant attic "bypasses". Chimney enclosures were
subject to particularly strong air flows. The installed mineral wool firestopping appeared to
be ineffective in reducing/controlling this air flow.
In units where kitchen sinks shared a common wall with fireplace enclosures and
where in turn these fireplaces and common walls were adjacent to and intersected exterior
walls which in turn were connected to exterior meter closets, particularly strong air flow/air
leakage was observed across access openings cut through interior gypsum board.
Investigation also revealed that the exterior meter closets had no floors and were constructed
directly over a gravel pad. Investigation revealed these gravel pads were directly connected
to the interior basement spaces through openings at the rim joist. These locations also
appeared to correspond with numerous incidences of freezing water pipes.
The garage ceiling of a unit which had experienced frozen sprinkler lines was
removed. The front portion of the garage ceiling was connected to a vented roof area.
Significant flow pathways between the garage ceiling, the insulated floor area and the
conditioned spaces were observed. The rim joist area of the heated floor space above the
garage was constructed from an open webbed girder truss with substantial air leakage
pathways connecting the insulated floor area directly to the vented roof area.
Fiberglass batt insulation completely filled the space between the floor trusses.
However, numerous void areas and pathways in the insulation was observed related to the
inherent nature of several layers of batt insulation installed in a semi-open cavity. These
void areas were directly connected to the vented roof area through the open webbed girder
truss allowing the floor insulation to be effectively short circuited.
Access into the attic space of the roofs constructed over deck areas allowed visual
observation of the construction of floor framing installed above unit kitchen areas. No rim
Toward an Understanding and Prediction of Air Flow in Buildings
161
joist closures were installed allowing the free flow of cold attic air directly into the floor
truss space.
In summary, large building envelope air leakage sites were identified during the
investigation at the following locations:
• utility chaseways;
• fireplace chaseways;
• party walls;
• penetration of ductwork through gypsum board;
• rim joist assemblies;
• bulkheads and dropped ceiling areas;
• service penetrations;
• combustion air ducts;
• tubs adjacent exterior walls;
• intersection of shed roofs and exterior walls;
• intersection of interior demising walls and sloped cathedral ceilings; and
• joints between exterior sheathing in all buildings due to an absence of
building paper.
Building Envelope Air Leakage Testing
Building envelope air leakage testing was conducted to quantify the air leakage of
the building envelopes. The testing was conducted using the fan depressurization approach.
In this approach, air is extracted from the buildings conditioned (heated) spaces using a
portable exhaust fan. This controlled air exhaust results in a negative air pressure within the
building with respect to the exterior (depressurization). The quantity of air exhausted from
the interior of a unit is increased until a standard reference negative air pressure is achieved.
This standard reference negative air pressure is typically 50 Pa (chosen by popular
convention). The amount of air necessary to be exhausted from a unit in order to
depressurize the unit 50 Pa relative to the exterior is then measured. The leakier the
building envelope, the greater the amount of air required to depressurize the building
envelope 50 Pa relative to the exterior. The quantity of air is expressed in liters per second
and is referred to as the building envelope's LPS50 value.
A dozen randomly picked units were tested using the fan depressurization approach.
Leakage values ranged between 1,250 LPS50 and 2,900 LPS50. These values represent
extremely leaky building envelopes given the size (volume) of the units tested. These
leakage values are approximately twice as large as what would be considered acceptable
practice for similar construction of this type, age and geographic location.
Toward an Understanding and Prediction of Air Flow in Buildings
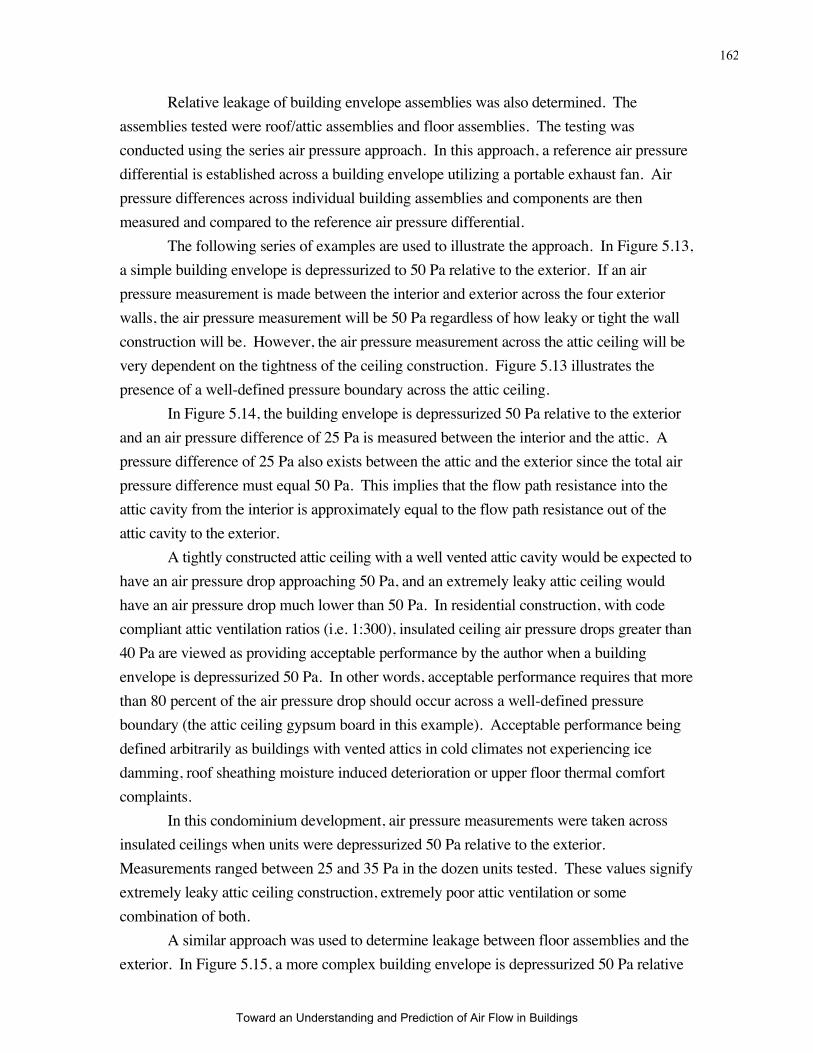
162
Relative leakage of building envelope assemblies was also determined. The
assemblies tested were roof/attic assemblies and floor assemblies. The testing was
conducted using the series air pressure approach. In this approach, a reference air pressure
differential is established across a building envelope utilizing a portable exhaust fan. Air
pressure differences across individual building assemblies and components are then
measured and compared to the reference air pressure differential.
The following series of examples are used to illustrate the approach. In Figure 5.13,
a simple building envelope is depressurized to 50 Pa relative to the exterior. If an air
pressure measurement is made between the interior and exterior across the four exterior
walls, the air pressure measurement will be 50 Pa regardless of how leaky or tight the wall
construction will be. However, the air pressure measurement across the attic ceiling will be
very dependent on the tightness of the ceiling construction. Figure 5.13 illustrates the
presence of a well-defined pressure boundary across the attic ceiling.
In Figure 5.14, the building envelope is depressurized 50 Pa relative to the exterior
and an air pressure difference of 25 Pa is measured between the interior and the attic. A
pressure difference of 25 Pa also exists between the attic and the exterior since the total air
pressure difference must equal 50 Pa. This implies that the flow path resistance into the
attic cavity from the interior is approximately equal to the flow path resistance out of the
attic cavity to the exterior.
A tightly constructed attic ceiling with a well vented attic cavity would be expected to
have an air pressure drop approaching 50 Pa, and an extremely leaky attic ceiling would
have an air pressure drop much lower than 50 Pa. In residential construction, with code
compliant attic ventilation ratios (i.e. 1:300), insulated ceiling air pressure drops greater than
40 Pa are viewed as providing acceptable performance by the author when a building
envelope is depressurized 50 Pa. In other words, acceptable performance requires that more
than 80 percent of the air pressure drop should occur across a well-defined pressure
boundary (the attic ceiling gypsum board in this example). Acceptable performance being
defined arbitrarily as buildings with vented attics in cold climates not experiencing ice
damming, roof sheathing moisture induced deterioration or upper floor thermal comfort
complaints.
In this condominium development, air pressure measurements were taken across
insulated ceilings when units were depressurized 50 Pa relative to the exterior.
Measurements ranged between 25 and 35 Pa in the dozen units tested. These values signify
extremely leaky attic ceiling construction, extremely poor attic ventilation or some
combination of both.
A similar approach was used to determine leakage between floor assemblies and the
exterior. In Figure 5.15, a more complex building envelope is depressurized 50 Pa relative
Toward an Understanding and Prediction of Air Flow in Buildings

163
to the exterior. This building envelope describes a two story building with a floor assembly
separating the two stories. An open stair well connects the two stories. The floor assembly
is constructed from open webbed floor trusses creating a floor plenum. If the interior of the
building is depressurized 50 Pa relative to the exterior, and if the floor assembly is "inside"
the building, no air pressure difference should exist between the floor assembly and the
interior.
In Figure 5.16, the building envelope is depressurized to 50 Pa relative to the
exterior and an air pressure difference of 25 Pa is measured between the interior and the
floor assembly. A pressure difference of 25 Pa also exists between the floor assembly and
the exterior since the total air pressure difference must equal 50 Pa. This implies that the
flow path resistance into the floor assembly from the interior is approximately equal to the
flow path resistance out of the floor assembly to the exterior.
Figure 5.17 and Figure 5.18 illustrate the net effect when floor assembly rim
closures are not installed with open webbed floor joist construction. The hollow floor cavity
created by utilizing open webbed floor joists is effectively moved outside of a well defined
pressure boundary. A similar (to the authors vented attic assembly pressure boundary
performance requirement) ad hoc definition of acceptable performance requires more than
80 percent of the air pressure drop occurs across a well defined pressure boundary (the rim
closure in this example). This would entail limiting the pressure drop across the floor
assembly to less than 10 Pa when the building envelope is depressurized 50 Pa relative to
the exterior.
At this condominium development, air pressure measurements were taken across
floor assemblies when units were depressurized 50 Pa relative to the exterior.
Measurements ranged between 20 and 30 Pa in the dozen units tested. This signifies
extremely poor rim joist closure construction.
Mechanical System Air Leakage Testing
Large mechanical system air leakage sites were identified during the investigation at
the following locations in all unit types in all buildings:
• connections between boots and gypsum board penetrations;
• connections between boots and subfloor penetrations;
• connections between boots and flex ducts;
• connections between flex ducts and sheet metal ducts;
• connections between return grills and return systems;
• return system cavity framing;
• air handler housings;
• connections between supply and return plenums with air handlers;
Toward an Understanding and Prediction of Air Flow in Buildings
164
• connections between supply plenums and supply ducts;
• connections between return plenums and return chaseways and ducts; and
• joints in sheet metal ductwork.
Mechanical system air leakage testing was conducted to quantify the air leakage of
the mechanical systems installed. The testing was conducted using the fan pressurization
approach. In this approach, supply and return diffusers and grills are temporarily sealed
(closed). Air is blown into the duct distribution system (heating system) using a portable
fan. This controlled air supply results in a positive air pressure in the duct system with
respect to the building (pressurization). The quantity of air supplied to the duct system is
increased until a standard reference positive air pressure is achieved. This standard
reference positive air pressure is typically 25 Pa (chosen by popular convention as it is the
typical average air pressure in most duct systems when they are operating). The amount of
air necessary to be added to the duct system in order to pressurize the duct system 25 Pa
relative to the interior is then measured. The leakier the duct system, the greater the amount
of air required to pressurize the duct system 25 Pa relative to the interior. The quantity of
air required for pressurization is expressed in litres per second and is referred to as the duct
system's LPS25 value. This approach is analogous to a plumber pressure testing plumbing
in order to identify leaks.
A dozen mechanical systems were tested using the fan pressurization approach.
These systems were randomly picked and corresponded to the unit types previously tested
for building envelope leakage and building envelope air pressure measurements. Leakage
values ranged between 300 LPS25 and 500 LPS25. These values represent extremely leaky
mechanical systems given the size of the systems tested. These leakage values are
approximately three times as large as what would be considered acceptable practice for
similar construction of this type, age and geographic location.
The total quantity of air circulated by the mechanical systems (through the furnace
blowers) was found to range between 400 and 900 L/s (as per the manufacturers
specifications). Therefore, the total leakage of air flow in the mechanical systems tested at
25 Pa represents approximately 30 to 80 percent of the total quantity of air circulated.
The operation of leaky ducted forced air heating systems often leads to air pressure
differences which induce air leakage/air change. Figure 5.19 illustrates the effect of leaky
supply ducts in an open floor plenum which lead to pressurization of the floor plenum and
exfiltration out the rim closure. Figure 5.20 illustrates the similar (opposite) effect of leaky
supply ducts leading to depressurization of the floor plenum and infiltration through the rim
closure.
Toward an Understanding and Prediction of Air Flow in Buildings

165
The measurement of the air pressures of interstitial spaces (floor cavities and
chimney chaseways) supports the effects of air pressure differentials resulting from leakage
of the air handling systems.
Air pressure measurements indicated significant changes in air pressure
relationships within the floor interstitial/plenum spaces when furnace fans operated. Floor
spaces tended to go to both positive and negative up to 3 Pa relative to the exterior and
relative to the conditioned space on a random (unit-per-unit) basis when the air handlers
operated indicating substantial supply or return duct leakage.
Interaction of Building Envelope Air Leakage and Mechanical System Leakage
The leakage of the duct system when the air handlers are operating induces higher
than typical driving forces across the building envelope. Furthermore, the construction and
communication of the interstitial cavities, the fireplace chaseways, the party walls, and the
attic spaces lead to stack effect air pressure driving forces in addition to the air handler
induced air pressures. When stack effect air pressure differentials are combined with duct
leakage/air handler induced air pressure differentials as well as wind induced air pressure
differences the combined driving forces and identified air leakage sites account for the
significant building envelope air leakage which occurred and resultant complaints and
problems.
When wind blows over a building, the exterior of the windward side of the building
experiences a positive air pressure, and the exterior of the leeward side experiences a
negative air pressure. Side walls typically experience negative air pressures. Leakage
openings in the building envelope which are exposed to these wind induced air pressure
differences leak air. In general the greater the leakage areas the greater the effect of wind on
total air leakage/air change.
This condominium development had significant windward, leeward and sidewall
leakage areas throughout the project. These leakage areas communicated with each other
across the open webbed floor system.
Additionally, large voids and chaseways extended vertically between stories, thereby
creating significant stack effect air pressures and large air flows. These flows were
exacerbated by the open webbed floor construction creating floor plenums which
communicated with these vertical voids and chaseways (Figure 5.21). The most significant
of the vertical chaseways were the fireplace chaseways. However, all units in all buildings
were affected by vertical communication.
Conclusions
The units leaked substantial quantities of air both across the building envelope as
well as from the mechanical system ductwork. The building envelope and mechanical
Toward an Understanding and Prediction of Air Flow in Buildings

166
system air leakage was the cause of the comfort complaints, high utility bills and frozen
pipes at the development.
The ice damming and associated water damage occurred as a result of the ineffective
ventilation of the underside of perimeter roof sheathing due to a lack of air flow pathways
and/or blocked pathways coupled with excessive heat loss into the attic spaces due to air
leakage from attic bypasses and leakage of heated air out of duct distribution systems
particularly at boot/ceiling connections.
The leakage of the duct system when the air handlers are operating induces higher
than typical driving forces across the building envelope. Furthermore, the construction and
communication of the interstitial cavities, the party walls, and the attic spaces likely lead to
stack effect air pressure driving forces in addition to the air handler induced air pressures.
When stack effect air pressure differentials are combined with duct leakage/air handler
induced air pressure differentials the combined driving forces and identified air leakage sites
can easily account for the resultant complaints and problems.
The measurement of leakage through pressurization testing and air pressure
measurements of interstitial spaces supports the hypothesis of pressure effects resulting
from the air handling systems. The identification of air leakage pathways through visual
observations, intrusive disassembly, and induced pressure differentials further supports the
hypothesis.
In heating climates, where sufficient heat loss occurs at roof perimeters above
insulated wall assemblies, ice damming can occur. The heat loss can melt snow on the roof
causing melt water to run down over the roof overhang, where it can freeze forming a dam.
The ice dam causes the water to back up and leak under overlapped shingles and through
roof sheathing. This heat loss can occur from either a lack of thermal insulation where
exterior walls intersect roof and attic assemblies, or from the leakage of warm air up and out
of exterior and interior walls, attic bypasses and from duct leakage.
Air leakage from attic bypasses, exterior walls and air leakage out duct distribution
systems as boot/ceiling connections resulting in high heat loss coupled with a lack of
continuous venting and blocked rafter spaces at eve perimeters led to ice damming and the
subsequent water damage. Observations revealed the lack of a continuous air space and
perimeter eve ventilation as well as many rafter cavities blocked solid with wood framing.
Temperature measurements between attic spaces and the exterior coupled with air pressure
measurements and visual observations confirm the air leakage from attic bypasses, duct
leakage and resultant high heat loss into the attic space.
Continuous soffit ventilation can be used to flush heat away from the underside of
the roof assembly, preventing it from melting accumulated snow on the roof and thus
controlling the formation of ice dams. For continuous soffit ventilation to be effective, a
Toward an Understanding and Prediction of Air Flow in Buildings
167
clear, continuous 50 mm air space should be provided at the roof eave perimeter. This is
usually accomplished with carefully installed baffles at each truss bay. These baffles must
be selected and installed in a manner which controls/prevents wind washing or the short
circuiting of attic insulation.
In order to control ice damming it is also necessary to reduce heat loss into attic
spaces. This means that air leakage from attic bypasses, interior and exterior walls as well
as out of duct work needs to be reduced or eliminated. In addition, where roof geometry
permits, additional thermal insulation may also be installed. However, this additional
thermal insulation should not be installed at the expense of a continuous ventilated air space
located above the insulation.
Rehabilitation Measures
The mechanism responsible for the ice damming and resulting water damage is
ineffective ventilation of the underside of perimeter roof sheathing due to a lack of air flow
pathways and excessive heat loss into the attic spaces due to air leakage from attic by passes
and leakage of heated air through the building envelope and out of duct distribution
systems. Therefore, addressing these factors can alleviate the ice damming complaints:
• Sealing all attic air leakage sites particularly at utility chaseways, party walls
service penetrations, and the intersection of interior partition walls and
sloped cathedral ceilings;
• Sealing all boot connections penetrating attic ceiling gypsum board;
• Providing continuous soffit ventilation and a continuous 50 mm clear air
space above the roof ceiling insulation at the perimeter of the roofs; and
• Providing additional vent openings at roof ridge locations.
The mechanism responsible for the comfort complaints, high utility bills and
freezing pipes is building envelope and mechanical system leakage as a result of the
following factors:
• Large leakage openings connected to interstitial cavities/chaseways creating
substantial air leakage pathways;
• Duct leakage induced air pressure differentials; and
• Stack effect induced air pressure differentials as a result of party wall
leakage areas and interior air leakage pathways;
Therefore, addressing these factors can alleviate the comfort complaints, reduce the
high utility bills and eliminate freezing pipes:
• Sealing all air leakage sites particularly at utility chaseways, party walls
Toward an Understanding and Prediction of Air Flow in Buildings
168
service penetrations, the intersection of interior partition walls and
sloped cathedral ceilings, fireplace chaseways, rim joist
assemblies, and the intersection of shed roofs/porch roofs and exterior
walls;
• Sealing all boot connections penetrating gypsum board;
• Balancing the air distribution systems; and
• Insulating, sealing and heating the floors over garage spaces.
Discussion
This condominium development epitomizes the complex three-dimensional multi-
layer, multi-cell, non-contiguous air flow analogue described initially in Figure 2.12. The
diagnosis of the problems in this condominium development were significantly simplified
through the use of series air pressure differential measurements and the measurement of the
response of interstitial cavity pressures to the operation of air handling systems.
Quantification of duct leakage, envelope leakage and cavity leakage was made possible
using these techniques. This allowed the development of specific targeted rehabilitation
measures.
Toward an Understanding and Prediction of Air Flow in Buildings
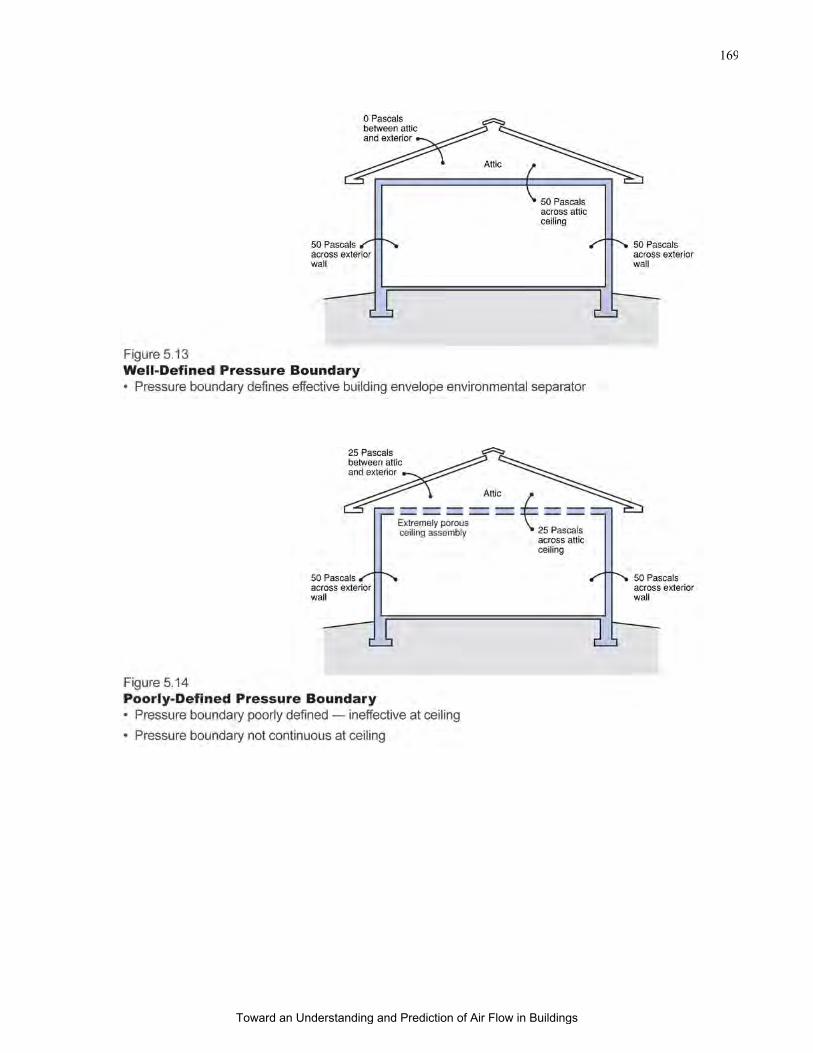
169
Toward an Understanding and Prediction of Air Flow in Buildings
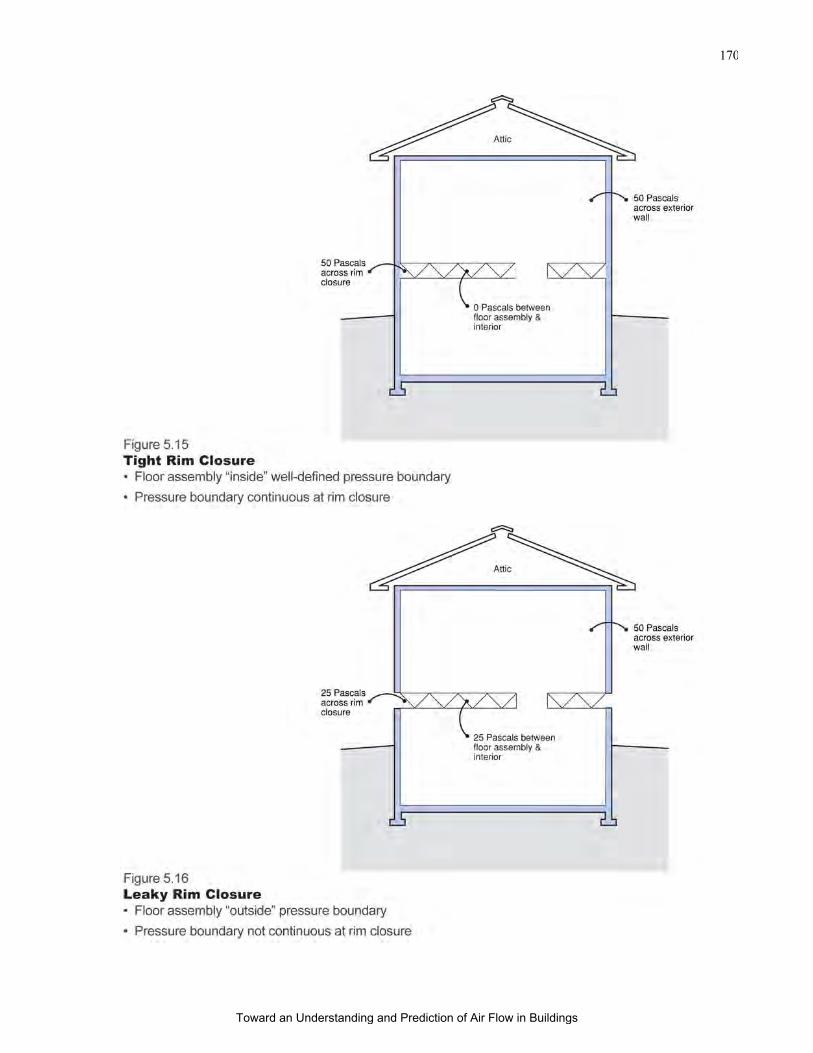
170
Toward an Understanding and Prediction of Air Flow in Buildings
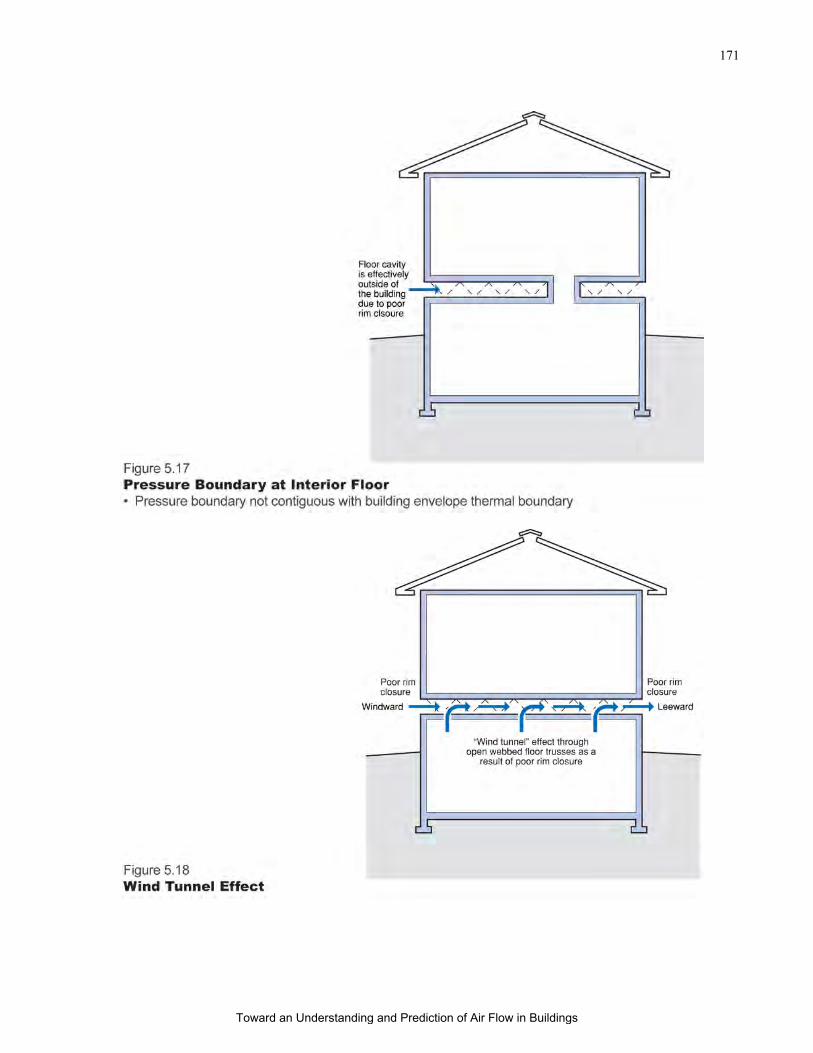
171
Toward an Understanding and Prediction of Air Flow in Buildings
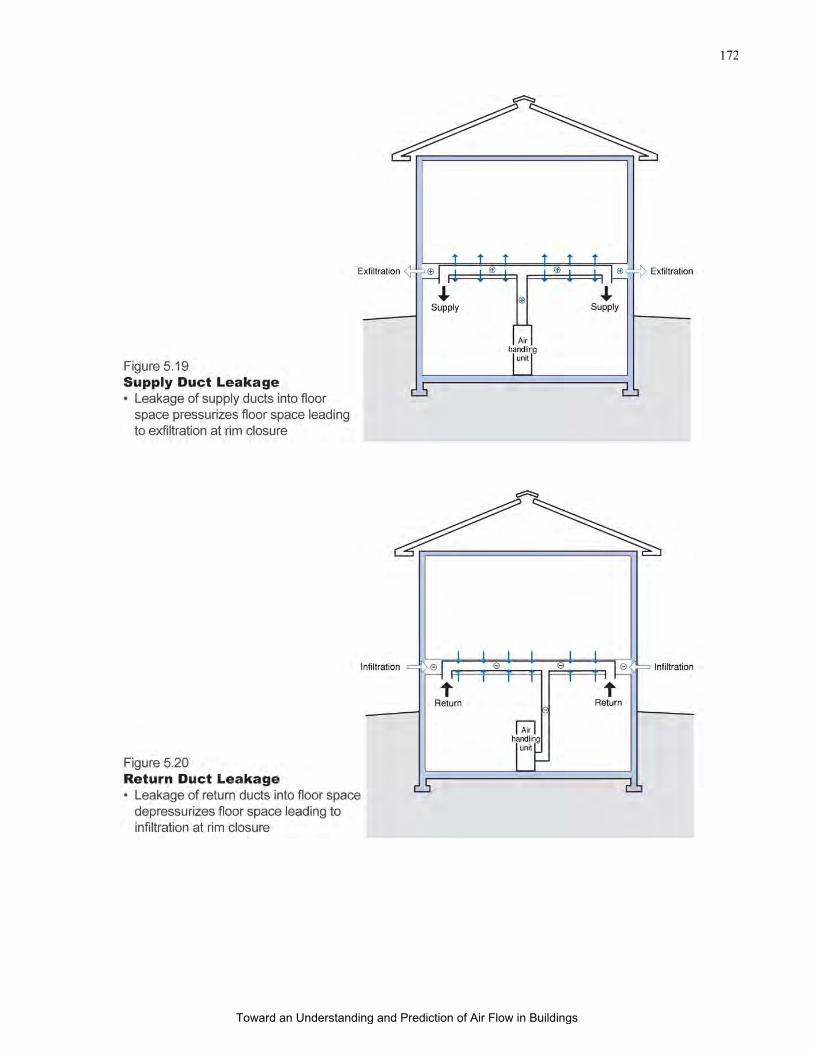
172
Toward an Understanding and Prediction of Air Flow in Buildings
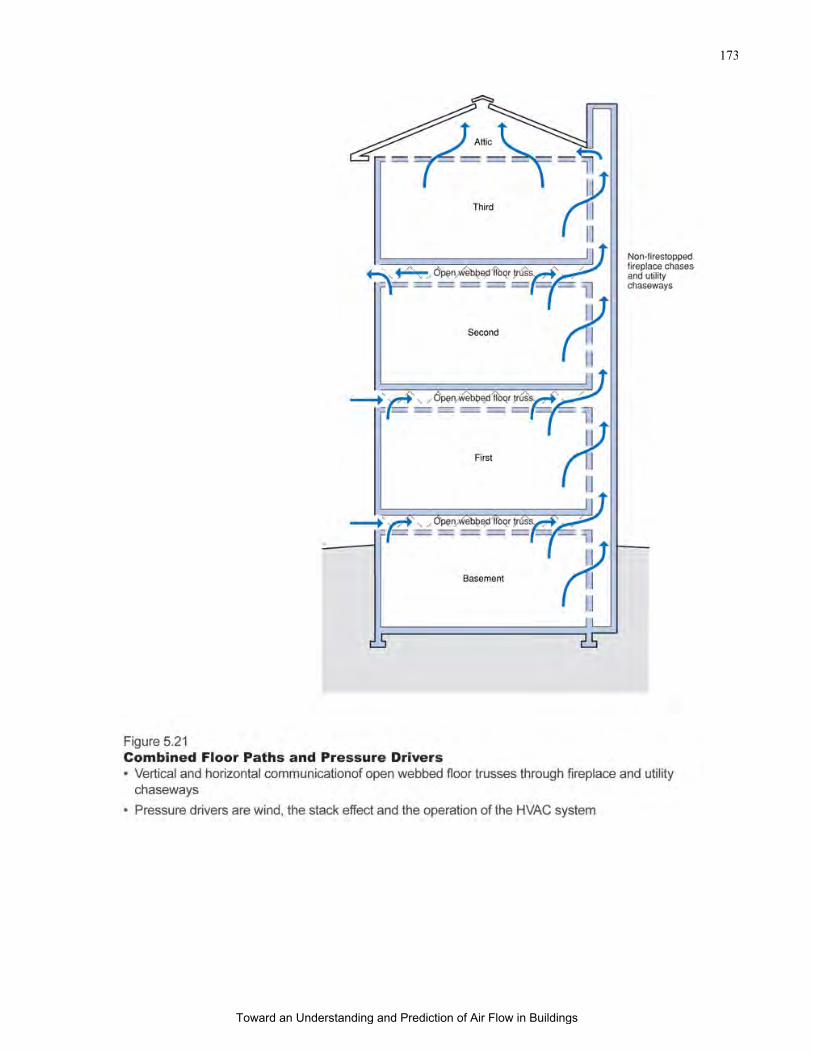
173
Toward an Understanding and Prediction of Air Flow in Buildings
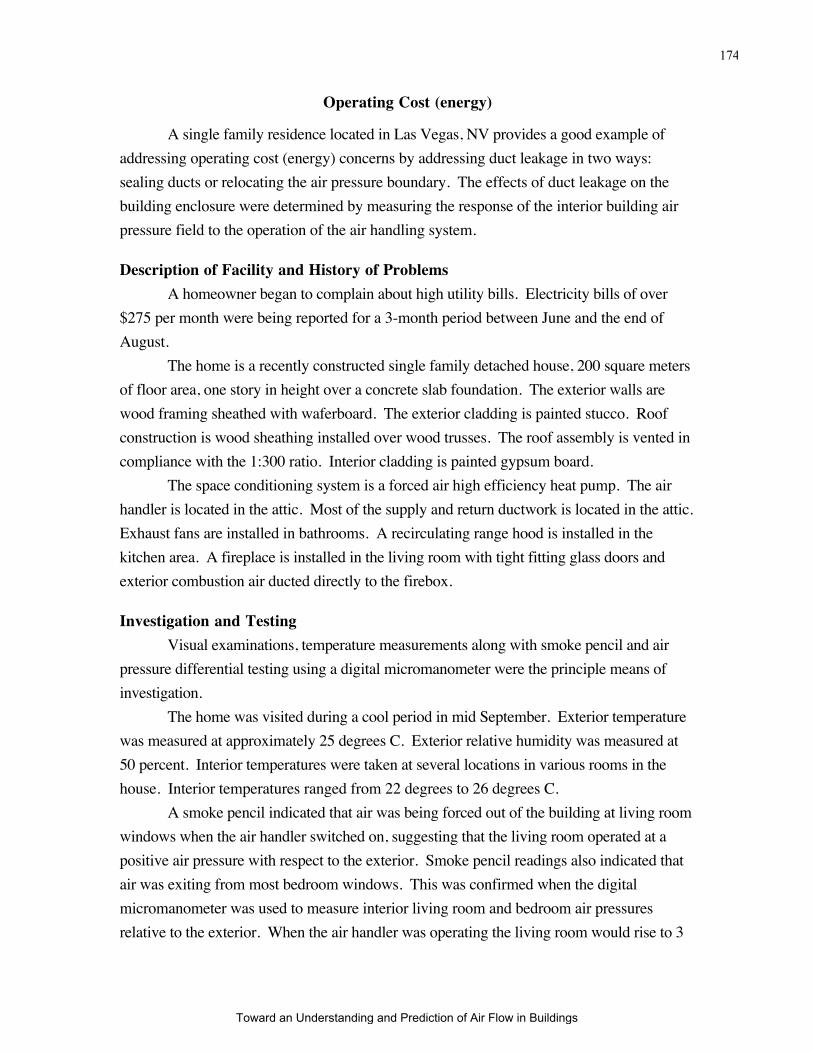
174
Operating Cost (energy)
A single family residence located in Las Vegas, NV provides a good example of
addressing operating cost (energy) concerns by addressing duct leakage in two ways:
sealing ducts or relocating the air pressure boundary. The effects of duct leakage on the
building enclosure were determined by measuring the response of the interior building air
pressure field to the operation of the air handling system.
Description of Facility and History of Problems
A homeowner began to complain about high utility bills. Electricity bills of over
$275 per month were being reported for a 3-month period between June and the end of
August.
The home is a recently constructed single family detached house, 200 square meters
of floor area, one story in height over a concrete slab foundation. The exterior walls are
wood framing sheathed with waferboard. The exterior cladding is painted stucco. Roof
construction is wood sheathing installed over wood trusses. The roof assembly is vented in
compliance with the 1:300 ratio. Interior cladding is painted gypsum board.
The space conditioning system is a forced air high efficiency heat pump. The air
handler is located in the attic. Most of the supply and return ductwork is located in the attic.
Exhaust fans are installed in bathrooms. A recirculating range hood is installed in the
kitchen area. A fireplace is installed in the living room with tight fitting glass doors and
exterior combustion air ducted directly to the firebox.
Investigation and Testing
Visual examinations, temperature measurements along with smoke pencil and air
pressure differential testing using a digital micromanometer were the principle means of
investigation.
The home was visited during a cool period in mid September. Exterior temperature
was measured at approximately 25 degrees C. Exterior relative humidity was measured at
50 percent. Interior temperatures were taken at several locations in various rooms in the
house. Interior temperatures ranged from 22 degrees to 26 degrees C.
A smoke pencil indicated that air was being forced out of the building at living room
windows when the air handler switched on, suggesting that the living room operated at a
positive air pressure with respect to the exterior. Smoke pencil readings also indicated that
air was exiting from most bedroom windows. This was confirmed when the digital
micromanometer was used to measure interior living room and bedroom air pressures
relative to the exterior. When the air handler was operating the living room would rise to 3
Toward an Understanding and Prediction of Air Flow in Buildings

175
Pa positive relative to the exterior. When the air handler was not operating, the living room
and the bedrooms would come to a neutral air pressure with respect to the exterior.
Air pressure measurements were repeated under various conditions of interior doors
being opened and closed. Not much difference in positive pressurization was noted with the
opening and closing of bedroom doors.
A slight increase in air pressure of 1.5 Pa occurred in the master bedroom (relative
to the main body of the house) when the master bedroom door was closed. With all interior
doors in either the open or closed position, the building operated under an approximate 3 Pa
positive air pressure relative to the exterior when the air handler was on.
When the air handler fan was switched on, but with the compressor not functioning,
noticeably warm air was being supplied from a few of the supply registers. Discussions
with the homeowner indicated that it was very difficult to cool the building during hot
weather.
Conclusions
The operation of the air handler draws hot air from the attic into the return side of
the air handler causing the entire building enclosure to become pressurized. When this hot
air is introduced into the return side of the air conditioning system, cooling efficiencies are
significantly reduced. The air conditioning load is significantly increased by the
introduction of this hot air.
As discussed previously, air handlers create air pressure difference in buildings in
several ways including duct leakage and by unbalanced air flows (see Figure 3.15 and
Figure 3.18). In this example, return leaks appear to be dominating, as the building
enclosure operates at positive air pressure with respect to the exterior when the air handler is
operating.
In this example, the effect of bedroom door closure was not substantial. Return side
leakage was shown to be present by virtue of the fact that the building enclosure went to a
positive air pressure when all interior doors were open and the air handler was operating.
The lack of effect of bedroom door closure was demonstrated by very little change in air
pressure occurring when interior doors were opened and closed.
Air in the attic is typically much hotter than the exterior air due to the effect of solar
radiation. When this air is drawn into the return side of the air handling system, it is not
unusual to experience a significant drop in performance. Eighty percent and greater
reductions in efficiency and capacity are common. This typically manifests itself in
substantially increased utility bills and comfort complaints. Houses are unable to be
maintained at cool temperatures.
Toward an Understanding and Prediction of Air Flow in Buildings

176
Rehabilitation Measures
The air pressure relationship in this building should be altered. This can be done
two ways. In the first way, the return side leakage of the air handling system can be
repaired. Attic bypass leakage (openings around the outside of ducts) should also be
repaired as part of this strategy. The strategy can be summarized as follows:
• Seal all return leaks in ductwork and the return plenum using mastic. Seal
the opening around all ducts penetrating the attic ceiling. Seal openings
along top plates.
• Provide transfer grills to facilitate air flow from bedrooms to the main
return grill. Pressure balance house (check air pressure relationships, avoid
negative air pressure after return side leaks are repaired).
In the second way, the air pressure boundary can be relocated. Under typical
conditions, the pressure boundary in a vented attic is the attic ceiling gypsum board. This
typically leads to problems, such as in this example, where the duct work and air handler are
located external to the pressure boundary in the vented attic. An unvented conditioned attic
can be constructed where the pressure boundary becomes the roof deck (Figure 5.22). In
this manner the pressure boundary now encloses the duct work and air handler.
Roof ventilation is sealed and thermal insulation is moved from the attic ceiling to
the underside of the roof deck. Transfer grilles are installed in the attic ceiling connecting
the attic space to the main level of the house. These grills equalize air pressures and
facilitate the flow of air throughout the house. In this manner the attic space becomes a
conditioned space. Air leaking out of the supply ducts is no longer lost to the outside. Air
extracted from the attic space is no longer drawn from the outside. Additionally, the duct
work and air handler are now exposed to room temperatures rather than the extreme
temperatures in vented, unconditioned attic spaces.
After a building enclosure with substantial return system leaks is repaired using the
first approach, supply system leaks can become the dominant effect (see Figure 3.15).
Supply leaks can lead to depressurization of building enclosures and serious health effects
from the spillage and backdrafting of combustion appliances and mold growth from
infiltration of hot, humid air into interstitial cavities in humid climates. Air pressure
relationships should be retested after all repair work is completed in order to prevent the
overlooking of adverse pressure effects.
Discussion
The response of the building interior air pressure field to the operation of the air
handling system identifies the problems associated with the installation of the HVAC
Toward an Understanding and Prediction of Air Flow in Buildings
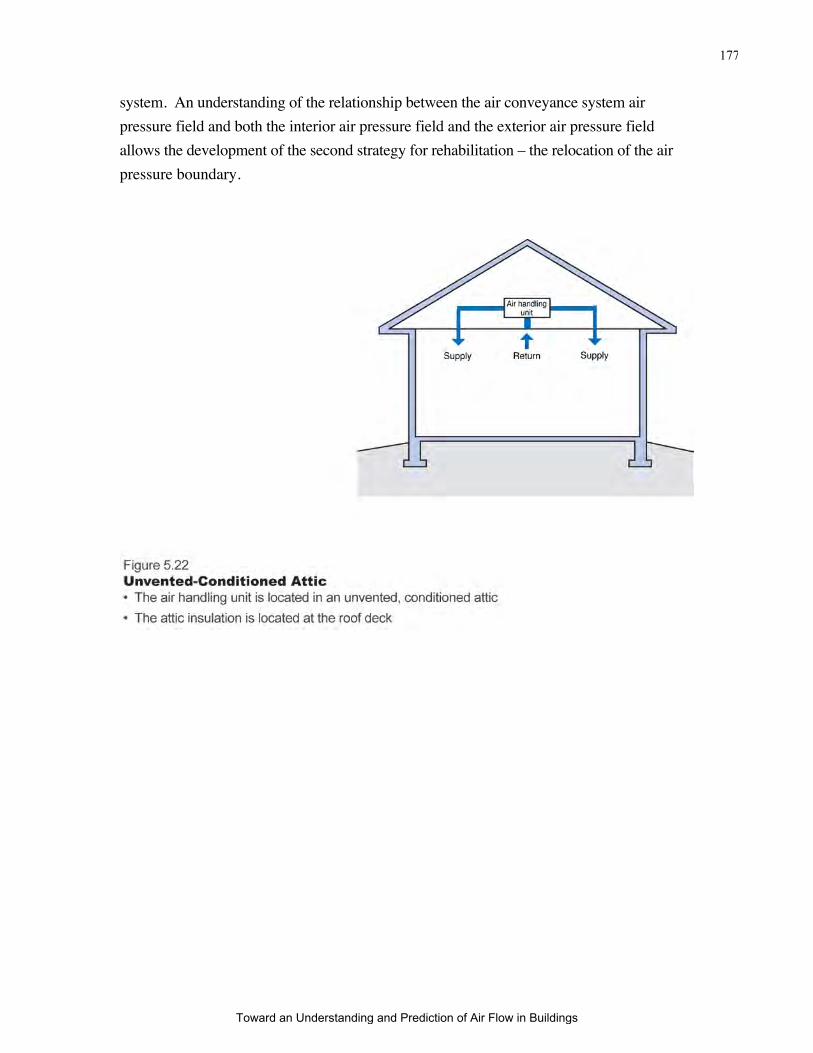
177
system. An understanding of the relationship between the air conveyance system air
pressure field and both the interior air pressure field and the exterior air pressure field
allows the development of the second strategy for rehabilitation – the relocation of the air
pressure boundary.
Toward an Understanding and Prediction of Air Flow in Buildings

178
VI Conclusions
Toward an Understanding and Prediction of Air Flow in Buildings

179
Air Pressure Control
In order to design and build safe, healthy, durable, comfortable and economical
buildings we must understand air flow. Air flow carries moisture which impacts a materials
long-term performance (serviceability) and structural integrity (durability), behavior in fire
(spread of smoke), indoor air quality (distribution of pollutants and location of microbial
reservoirs) and thermal energy.
Air flow in buildings is a complex, time dependent, three dimensional flow network
where successful quantification of flows has been difficult. In order to improve the
understanding, predictability and analysis of this complex flow network system, more
complex relational models are necessary – and more effective use of available analytical
tools are necessary. The development of more complex relational models and more
effective use of available analytical tools has been the focus of this thesis.
This thesis makes the argument that the key to understanding air flow is pressure.
Furthermore, that the key to developing the necessary more complex relational models is
also pressure. And finally, that the key to effectively utilizing the sophisticated available
analytical tools is pressure. It also logically follows that control of air pressure should be
one of the significant factors in whole building system performance.
Air pressure affects the interrelationships between mechanical systems and the
building envelope. These interrelationships are significant and involve numerous disciplines
including architecture, structural engineering, mechanical engineering, fire protection,
acoustics, and interior design. The cross disciplinary nature of the relationships make them
easy to overlook, yet these relationships must be understood to avoid costly mistakes.
The design and construction of the building envelope (the walls, roof and
foundation) significantly affect the design of the heating, ventilating and air conditioning
(HVAC) systems. At the same time, the design, installation and operation of the HVAC
system affects condensation and moisture accumulation within building cavities, rain
penetration, pollutant migration, and the durability of the building envelope.
The strategy to control air pressure in the building includes eliminating the largest
openings and holes. Additionally, it includes controlling the air pressure fluctuations
generated by the building mezzoclimate, indoor climate, microclimate as well as the HVAC
system operational conditions. To control the air, you must first enclose the air. When you
enclose the air, you must control the mechanical system.
An element neglected in the traditional analysis of the air pressure fields in buildings
is the effect of pathways and microclimates created by external cavities and interconnected
internal cavities communicating with HVAC systems. This issue can be addressed at the
diagnostic stage, the design stage or the rehabilitation stage.
Toward an Understanding and Prediction of Air Flow in Buildings

180
Design
One manner to address the problem of the interconnected internal cavities is to
compartmentalize them and disconnect them from the HVAC system. Another option is to
deliberately connect the cavities (the interstitial air pressure field) to the occupied space
(interior air pressure field) with openings, pathways, grills, etc. in order to reduce the air
flow in the cavities by reducing or eliminating the air pressure differential driving force
(“bleeding the pressure”). These strategies can best be implemented at the design stage –
but are also equally valid during rehabilitation or renovation.
Compartmentalization of high rise facilities for smoke control and energy control is
a common design approach (ASHRAE, 1997). This approach can be extended to
interconnected cavities. For example, the problem identified in Figure 3.22 showing the
linkages among the component pressure fields at dropped ceiling areas can be addressed
using two strategies: employing a buffer space that isolates the dropped ceiling thereby
creating a “compartment” (Figure 6.1) or directly ducting the return system eliminating the
negative pressure in the dropped ceiling coupled with installing grills in the dropped ceiling
thereby extending the interior air pressure field to the underside of the roof assembly –
“bleeding the pressure” (Figure 6.2).
A similar approach can be used to address the problem illustrated in Figure 3.23. A
return duct sleeve can be attached to the face of the unit directly connecting the return grill to
the air handling unit. Adding grills through the gypsum board finish extends the interior air
pressure field to the face of the rigid insulation effectively eliminating one of the interstitial
cavities (Figure 6.3).
Deliberately pressurizing or depressurizing interstitial cavities is also a powerful
approach for both new design and for rehabilitation. Both approaches were previously
described in Figure 5.4 and Figure 5.12 respectively.
Finally, extending the pressure field to enclose air conveyance systems can be
utilized to minimize the effect of duct leakage (Figure 5.22). This is a variation of the
approach already described in Figure 6.2 and Figure 6.3.
Toward an Understanding and Prediction of Air Flow in Buildings

181
Diagnostics
One of the most powerful diagnostic techniques available to enhance the
understanding of air flow in buildings is the use of perturbation. This involves imposing a
controlled change to the air pressure field by altering an air flow or by altering an opening
and observing the response of the building air pressure field in magnitude and direction of
change. This approach is powerful in that it can be used to overcome background
“noise”(the typical fluctuations of building air flows and building air pressures.
Monitoring the response of the building air pressure field to the operation of the
mechanical system is one of the most common and powerful uses of the perturbation
approach.
A deliberate alternative intervention can also be imposed and compared to the effect
of building operations. The advantage of this approach is that the timing of building
analysis is not dependent on the occurrence of the “critical condition”. Investigators don’t
always have the luxury of waiting for the critical condition to occur.
In this approach the laboratory is the field, and the key is to get the building to reveal
itself to you. Sometimes the building needs to be pushed or kicked a little in order to get a
response. Passive approaches often don't work very well or quickly. By creating change in
a controlled manner and measuring the change, the interactions of the building envelope and
the mechanical systems can be established — usually quickly and accurately.
The approach developed in the thesis measures the effect of perturbation or
controlled change after the building has responded to a new equilibrium. With ultra fast
pressure transducers (quicker than 10 readings per second) it may be possible to observe
the pressure response of the building dynamically. Perturbations cause a pressure
disturbance or pressure front to propagate through the building system.
Observing the rate and modulation of the pressure disturbance or pressure front as it
propagates through the building system may yield useful information such as the specific
locations of discontinuities such as unintentional openings due to missing fire stopping or
ineffectual compartmentalization. This effort could be the subject of future work.
Toward an Understanding and Prediction of Air Flow in Buildings
182
Analysis
The complexity of real buildings requires more complex relational models. These
models must take into account the interconnected nature of the increasingly common non-
contiguous complex three dimensional flow paths present in modern buildings. The focus
of this thesis has been the development of such a relational model.
The relational model developed in this thesis can be used to configure existing
analytical models to reflect the reality of the modern building. The modern building is
presented in this thesis as consisting of multi layer building envelope assemblies
interconnected to numerous void spaces and service chases often incidentally coupled to the
operation of HVAC systems.
Existing analytical models used in building analysis have been limited in their
application and accuracy due to the level of detailed input information relating to building
construction assembly leakage and mechanical systems.
The gaps in available information can be “filled-in” by using the concept of
perturbation in conjunction with existing network analytical models. By perturbing the
building air pressure field and measuring the response, the pressure response can be used to
“tune” the analytical models by apportioning leakage areas. This approach extends the
range of applicability and accuracy of the models.
This approach represents an alternative pattern of analysis: developing the flow
field, the leakage areas and the flow relationships from the measured building pressure field
- the air pressure regime within and surrounding the building. This thesis argues that
determining the characteristics of the building pressure field directly is considerably easier
than determining the flow path resistances.
At present, network analysis and perturbation cannot be used to solve the interstitial
flow, pressure and leakage regime. Network analysis and perturbation may suggest that
such flows exist, but the complexity and workmanship dependence of the interstitial flow,
pressure and leakage regime requires direct measurement. This thesis presents the case that
the boundary conditions of the interstitial regime can be defined analytically (the boundary
conditions being the building flow, pressure and leakage regime), but that the pressures and
flows within the interstitial spaces cannot be predicted with certainty using analytical means.
The development of a computer-based apportioning approach meeting a
convergence criteria may provide predictability to interstitial flows, pressure and leakage
regimes. A numeric module developed for this task likely could be added to existing
network analytical models and should be the focus of future work.
Analytical micro models of interstitial assemblies can also be developed and tuned
by direct field measurements of interstitial air pressures and flows in the same manner as
the macro models. The micro models can be expanded or incorporated into analytical
Toward an Understanding and Prediction of Air Flow in Buildings

183
macro models that address the entire building flow and leakage regime. The effect of the
micro flows or interstitial regime on the general building regime can be modeled. In other
words it is possible to go from the small to the large analytically. However, it does not
appear to be possible to go in the other direction. It does not appear to be possible to
generalize the interstitial regimes. They are often purely a local phenomena.
Toward an Understanding and Prediction of Air Flow in Buildings
184
Further Research
Several areas of further research have been identified and could be pursued as a
result of the work in this thesis.
• A computer-based apportioning approach could be developed and added to existing
analytical network models. Such a numeric module would allow the use of pressures as
inputs. The thesis work used a tedious manual method for apportioning leakage areas using
very simple building examples. Complex buildings require complex multi-zone models.
Manual methods of apportioning leakage areas are impractical in such cases. Computerized
apportioning methods may hold the promise of providing unprecedented quantifiable
accuracy in air flow analysis.
• With computer-based apportioning of leakage area it may be possible to provide
predictability to interstitial flows, pressures and leakage regimes. Experimental work
measuring simultaneous interstitial cavity pressures with local flow or leakage area
perturbations could be coupled with detailed analytical models using computer-based
apportioning to explore this possibility.
• The dynamic response of the building and building assemblies due to a perturbation
might yield the location and type of discontinuities and connections in interstitial air
pressure fields and flows. Observing the rate and modulation of a pressure disturbance or
pressure front as it propagates through the building system might identify specific locations
of ineffectual compartmentalization, unintended openings, or accidental links to HVAC
systems.
• Building automation systems could be developed that track the building pressure
field over time and identify problems when they occur due to pressure field changes.
Pressure field measurements could be used as feedback mechanisms to control automated
HVAC systems. Although this feature currently exists in some hospitals, data processing
facilities and laboratories, low cost generic systems could be developed for hotels, schools
and office buildings. These systems could be coupled with specific, local interstitial air
pressure field measurements and control approaches that could be incorporated in new
design and construction approaches.
• Commissioning protocols for commissioning building air pressure fields could be
developed. These protocols could be linked to the previously described building automation
systems and HVAC control feedback mechanisms.
Toward an Understanding and Prediction of Air Flow in Buildings
185
• Experimental work determining quasi-steady state interstitial air pressures and
leakage regimes could be coupled with enhanced heat, air and moisture (HAM) analytical
models enhancing the predictability and accuracy of the analytical models. Linking a
network model such as CONTAM96 with a moisture model such as WUFFI or MOIST
should be possible. CONTAM96 could be modified to contain a numeric module for
apportioning leakage areas (as previously described) and also be configured to address
interstitial air pressure fields. In this manner CONTAM96 could be used to provide the
inputs of leakage areas and pressures to WUFFI or MOIST.
Toward an Understanding and Prediction of Air Flow in Buildings

186
Toward an Understanding and Prediction of Air Flow in Buildings

187
Toward an Understanding and Prediction of Air Flow in Buildings

188
References
Acres Consulting Services Ltd.; Phase I - Collaborative Design Project Elliot LakeHousing, Evaluation of Existing Experience in Building Construction Relative toIndoor Radon Levels, Ontario Ministry of Municipal Affairs and Housing, August7, 1981.
ASHRAE; Fundamentals Handbook, Atlanta, 1997.
ASHRAE; Standard 62-1989, Ventilation for Acceptable Indoor Air Quality, Atlanta,1989.
Axley, J. and Grot, R.; The Coupled Air Flow and Thermal Analysis Problem in BuildingAirflow System Simulation, Proceedings ASHRAE Symposium on Calculation ofInterzonal Heat and Mass Transport in Buildings, ASHRAE Transactions, 95 (2),1989.
Barker, A.H.; The Theory and Practice of Heating and Ventilation,The Carton Press, 199, Strand, W.C., London, 1912.
Blasnik, M.; Personal Communication, 1988.
Blasnik, M. and Fitzerald, J.; Pressure Diagnostics - Diagnosing Complex Air LeakagePaths: A New Approach Using Blower Door Induced Pressures, May, 1992.
Bomberg, M. and Kumaran, M.K.; A Test Method to Determine Air Flow Resistance ofExterior Membranes and Sheathing, Building Research Note No. 227, NationalResearch Council, Ottawa, April, 1985.
Bumbaru, D.; Jutras, R.; and Patenaude, A.; Air Permeance of Building Materials,Research Project, Canada Mortgage and Housing Corporation, Ottawa, ON, June,1988.
Burnett, E. and Straube, J.; Vents, Ventilation Drying and Pressure Moderation, ResearchProject, Canada Mortgage and Housing Corporation, Ottawa, ON, December,1995.
Cummings, J.B. and Tooley, J.J.; Infiltration Rates and Pressure Differences in Florida Homes Caused by Closed Interior Doors When the Central Air Handler is On, Passive Solar Conference, Cambridge, MA, 1988.
Cummings, J.B. and Tooley, J.J.; Infiltration and Pressure Differences Induced by ForcedAir Systems in Florida Residences, ASHRAE Transactions, June, 1989.
Cummings, J.B.; Tooley, J.J.; and Moyer, N.A.; Impacts of Duct Leakage on Infiltration Rates, Space Conditioning Energy Use, and Peak Electrical Demand, Proceedings of the ACEEE 1990 Summer Study on Energy Efficiency in Buildings, August, 1990.
Currie, I.G.; Fundamental Mechanics of Fluids, McGraw-Hill, Inc., New York,NY, 1974.
Dalgliesh, W.A.; Wind Loads on Low Buildings, Building Practice Note 18, Division ofBuilding Research, National Research Council of Canada, Ottawa, Canada,January, 1981.
Toward an Understanding and Prediction of Air Flow in Buildings
189
Dalgliesh, W.A. and Schriever, W.R.; Wind Pressures on Buildings, CBD 34, Canadian Building Digest, Division of Building Research, National Research Council of Canada, Ottawa, Canada, October, 1962.
Davenport, A.G.; Wind Loads on Structures, NRCC 5576, Division of BuildingResearch, National Research Council of Canada, Ottawa, Canada, March, 1960.
Davenport, A.G. and Hui, H.Y.; External and Internal Wind Pressures on Claddings ofBuildings, Boundary Layer Wind Tunnel Laboratory, University of WesternOntario, London, Canada, 1982.
Davenport, A.G. and Isyumov, N.; The Application of the Boundary Layer Wind Tunnelto the Prediction of Wind Loading, Proceedings, International Research Seminar onWind Effects on Building Structures, Ottawa, Canada, September, 1967.
Emswiler, J.E.; The Neutral Zone in Ventilation, ASHVE Journal, Vol. 32, 1926.
Feustel, H.E.; Annex 23-An International Effort in Multizone Air Flow Modeling,Proceedings, ROOMVENT ‘96, Yokohama, Japan, July, 1996.
Feustel, H.E.; COMIS-An International Multizone Air Flow and Pollutant TransportModel, to be published in Energy & Buildings, 1998.
Feustel, H.E. and Dieris, J.; A Survey of Airflow Models for Multizone Sturctures,Energy & Buildings, 18, pp. 79-100, 1992.
Ganguli, U. and Quirouette, R.; Pressure Equalization Performance of A Metal and GlassCurtain Wall, CSCE Centenial Conference, NRCC-29024, Montreal, PQ,May, 1987.
Garden, G.K.; Rain Penetration and its Control, CBD 40, Canadian Building Digest, Division of Building Research, National Research Council of Canada, Ottawa, Canada, April, 1963.
Grimsrud, D.T.; Sherman, M.H.; Diamond, R.C.; Condon, P.H. and Rosenfeld, A.H.;Infiltration-Pressurization Correlations: Detailed Measurements on a CaliforniaHouse, ASHRAE Symposium on Air Infiltration, Philadelphia, PA, January,1979.
Handegord, G.O.; Ventilation of Houses, Building Science Insight, DBR, Ottawa, 1984.
Handegord, G.O.; Active Systems For the Control of Condensation in BuildingEnvelopes, CLIMA 2000, Sarajevo, August, 1989.
Harrje, D.T.; Gadsby, K.J. and Cromer, C.J.; Transients and Physics of Return Air,Proceedings of the Air Movement and Distribution Conference, Purdue University,West Lafayette, Indiana, May, 1986.
Hutcheon, N.B.; Fundamental Considerations in the Design of Exterior Walls forBuildings, Engineering Journal, Vol. 36, No. 1, pp. 687-698, June, 1953.
Hutcheon, N.B.; The Utility of Building Science, Invited address at the Central BuildingResearch Institute, India, October, 1971.
Toward an Understanding and Prediction of Air Flow in Buildings
190
Hutcheon, N.B. and Handegord, G.O.; Building Science for a Cold Climate, National Research Council of Canada, 1983.
Isaacs, L.T. and Mills, K.G.; Linear Theory Methods for Pipe Network Analysis, Journalof the Hydraulics Division, Proceedings ASCE, Vol. 106, pp. 1191-1201, 1980.
Klote, J.H.; Computer Modeling for Smoke Control Design, Fire Safety Journal 9: 181-188, 1985.
Kronvall, J.; Air Flows in Building Components, Report TVBH-1002, Division ofBuilding Technology, Lund Institute of Technology, Lund, Sweden, 1980.
Lawton, M. and Quirouette, R.L.; Testing of Air Barrier Construction Details, ResearchProject, Report No. 30132.OR/2, Canada Mortgage and Housing Corporation,Ottawa, ON, August, 1991.
Larson, G.L.; Air Infliltration Through Various Types of Brick Wall Constructions,ASHVE Transactions, Vol. 35, pp 55-58, New York, 1929.
Liddament, M. and Allen, C.; The Validation and Comparison of Mathematical Models ofAir Infiltration, Technical Note 11, Air Infiltration Centre, Bracknell, Great Britain,1983.
Lin, J.X.; Surry, D. and Inculet, D.R.; A Study of the Characteristic Shapes of MeanPressures and Their Gradients on Buildings in Realistic Surroundings, ReportBLWT-SS3-1995, Faculty of Engineering Science, University of Western Ontario,London, Canada, March, 1995.
Lstiburek, J.W.; Lee, MA, Moisture Remediation, June, 1988.
Lstiburek, J.W.; Holiday Inn - Gurnee, IL, Dames & Moore, Trow - Client Report,July, 1989.
Lstiburek, J.W.; Two Studies of Mold and Mildew in Florida Buildings, Journal ofThermal Insulation and Building Envelopes, Volume 16, July, 1992.
Lstiburek, J.W.; Humidity Control in the Humid South, Workshop Proceedings - Bugs,Mold & Rot II, BETEC, Washington, DC, November, 1993.
Lstiburek, J.W. and Moyer, N.A.; Lakeland Nursing Home, Building ScienceCorporation - Client Report, November, 1991.
Luck, J.R. and Nelson, L.W.; The Variation of Infliltration Rate With Relative Humidityin a Frame Building, ASHRAE Transactions, Vol. 71, pp. 718-729, Atlanta, 1965.
Lux, M.E. and Brown, W.C.; Air Leakage Control, Proceedings of Building ScienceInsight ‘86, NRCC 29943, National Research Council of Canada, Ottawa,January, 1989.
Moffatt, S.; Residential Chimney Backdraft Checklist: Design and Evaluation, Canada Mortgage and Housing Corporation, Ottawa, Canada, February, 1984.
Nelson, G.; Personal Communication, 1982.
Nelson, G.; Personal Communication, 1991.
Toward an Understanding and Prediction of Air Flow in Buildings
191
Nelson, B.D.; Robinson, D.A.; Nelson, G.D.; and Hutchinson, M.; Energy EfficientHouse Research Project, ORNL/Sub/83-47980/1, U.S. Department of Energy,September, 1986.
Nylund, P.O.; Vindtathet hos fierskiktsvaggar (The Windtightness of Multi-layer Walls),Byggmastaren, Number 11, National Swedish Board for Building Research,Stockholm, 1966.
Nylund, P.O.; Infiltration and Ventilation, Report D22: 1980, National Swedish Board for Building Research, Stockholm, 1980.
Palmiter, L.S. and Bond, T.C.; Modeled and Measured Infiltration, Ecotope, Inc., Seattle,WA, February, 1991.
Palmiter, L.S.; Bond, T.C. and Sherman, M.; Modeled and Measured Infiltration-ADetailed Case Study of Four Electrically Heated Homes, Electric Power ResearchInstitute, Report CU 7327, Palo Alto, California, 1991.
Palmiter, L.S.; Brown, I.A. and Bond, T.C.; Measured Infiltration and Ventilation in 472All-Electric Homes, ASHRAE Transactions, Vol. 97, Atlanta, 1991.
Persily, A.K. and Linteris, G.T.; A Comparison of Measured and Predicted InfiltrationRates, ASHRAE Transactions, Vol. 89, Atlanta, 1983.
Quirouette, R.L.; Testing Rainscreen Wall and Window Systems: The Cavity ExcitationMethod, Project No. J93r07f-4, Canada Mortgage and Housing Corporation,Ottawa, November, 1996.
Quirouette, R.L.; The Dynamic Buffer Zone Wall System, Energy Efficient BuildingAssociation Annual Conference, Denver, 1997.
Robinson, D.H. and Lambert, L.A.; Field Investigation of Residential Infiltration andHeating Duct Leakage, Lambert Engineering, Inc., Bend, OR, 1987.
Robinson, G. and Baker, M.C.; Wind-Driven Rain and Buildings, Technical Paper No.445 of the Division of Building Research, National Research Council of Canada,Ottawa, July, 1975.
Said, M.N.A.; An Evaluation of a Network Smoke Control Model, ASHRAETransactions, Vol. 97, pp. 275-282, Atlanta, 1991.
Sauer, H.J. and Howell, R.H.; Principles of Heating, Ventilating and Air Conditioning;ISBN 0-910110-89-1, American Society of Heating, Refrigerating and AirConditioning Engineers, Inc., Atlanta, GA, 1990.
Scott, A.G.; Comments on Subfloor Ventilation, Proceedings of the II Workshop onRadon and Radon Daughters in Urban Communities Associated With UraniumMining and Processing, Report of the Atomic Energy Control Board, 1979.
Shaw, C.Y.; The Effect of Mechanical Ventilation on the Air Leakage Characteristic of a Two Storey Detached House, Building Research Note 204, DBR, Ottawa, July, 1983.
Toward an Understanding and Prediction of Air Flow in Buildings

192
Shaw, C.Y. and Brown, W.C.; Effect of a Gas Furnace Chimney on the Air Leakage Characteristic of a Two Storey Detached House, Building Research Note 192, DBR, Ottawa, July, 1982.
Shaw, C.Y. and Tamura, G.T.; Studies on Exterior Wall Air Tightness and Air Infiltration of Tall Buildings, ASHRAE Transactions, Vol 82, 1976
Shaw, C.Y. and Tamura, G.T.; The Calculation of Air Infiltration Rates Caused by Wind and Stack Action for Tall Buildings, ASHRAE Transactions, Vol 83, 1977.
Sheet Metal and Air Conditioning Contractors’ National Association, Inc.; High VelocityConstruction Standards, SMACNA, Tysons Corner, VA, 1965.
Sheet Metal and Air Conditioning Contractors’ National Association, Inc.; Balancing andAdjustment of Air Distribution Systems Manual, SMACNA, Tysons Corner, VA,1967.
Sheet Metal and Air Conditioning Contractors’ National Association, Inc.; HVAC AirDuct Leakage Test Manual, First Edition, SMACNA, Tysons Corner, VA, 1985.
Sherman, M.H.; Estimation of Infiltration from Leakage and Climate Indicators, Energy and Buildings, 10, Elsevier Sequoia, Netherlands, 1987.
Sherman, M.H. and Grimsrud, D.T.; Infiltration-Pressurization Correlation: SimplifiedPhysical Modeling, Semi-Annual ASHRAE Meeting, Denver, Colorado, June,1980.
Sherman, M.H. and Grimsrud, D.T.; Measurement of Infiltration Using Fan Pressurization and Weather Data, First Symposium of the Air Infiltration Centre, Windsor, England, October, 1980.
Steel, F.; Airtight Houses and Carbon Monoxide Poisoning, CBD 222, Canadian BuildingDigest, Division of Building Research, National Research Council of Canada,Ottawa, Canada, March, 1982.
Stathopoulos, T.; Surry, D.; and Davenport, A.G.; Internal Pressure Characteristics ofLow Rise Buildings due to Wind Action, Proceedings of the Fifth InternationalConference on Wind Engineering, Fort Collins, Colorado, U.S.A., July, 1979.
Stricker, S.; Measurement of Air-Tightness of Houses, ASHRAE Transactions 81(Part1): pp. 148-167, Atlanta, 1975.
Swami, H.V. and Chandra, S.; Procedures for Calculating Natural Ventilation Airflow Rates in Buildings, FSEC-CR-163-86, Florida Solar Energy Center, Cape Canaveral, Florida, 1987.
Tamura, G.T.; Computer Analysis of Smoke Movement in Tall Buildings, ASHRAETransactions 75(Part 2): pp. 81-93, 1969.
Tamura, G.T. and Wilson, A.G.; Air Leakage and Pressure Measurements in TwoOccupied Houses, ASHRAE Transactions, Vol. 70, pp. 110-119, (NRCC 7758),Atlanta, 1964.
Toward an Understanding and Prediction of Air Flow in Buildings
193
Tamura, G.T. and Wilson, A.G.; Pressure Differences for a Nine-Story Building a Result of Chimney Effect and Ventilation System Operation, ASHRAE Transactions,Vol. 72, Atlanta, 1966.
Timusk, J; Personal Communication, October, 1983.
Timusk, J; Design, Construction and Performance of a Dynamic Wall House, 8th AirInfiltration Centre Conference, Uberlingen, FRG, Sept 24, 1987.
Timusk, J.; Seskus, A.L. and Ary, N.; Control of Wind Cooling of Wood FrameBuilding Enclosures, Excellence in Housing Conference, EEBA, Portland, ME,April, 1988.
Tooley, J.J. and Davis, B.E.; Power Attic Ventilation - Another Applied Building ScienceNightmare and Treasure Trove, ACEEE, Santa Cruz, CA, August, 1994.
Tooley, J.J. and Moyer, N.A.; Mechanical Air Distribution and Interacting Relationships, Florida Home Energy Reviews of Orlando, Orlando, Florida, February, 1988.
Tooley, J.J. and Moyer, N.A.; Personal Communication, 1989.
Walker, I.S. and Wilson, D.J.; Field Validation of Algebraic Equations for Stack andWind Driven Air Infiltration Calculations, International Journal of Heating,Ventilating, Air-Conditioning and Refrigeration Research, Volume 4, Number 2,April, 1998.
Walton, G.N.; Airflow Network Models for Element-Based Airflow Modeling,ASHRAE Transactions, Vol. 95, Part 2, Atlanta, 1989.
Walton, G.N.; CONTAM96, NISTIR 6056, U.S. Department of Commerce, NationalInstitute of Standards and Technology, Building and Fire Research Laboratory,Gaithersburg, MD, September, 1997.
White, J.; Ventilation Troubled Houses - Status and Trends, Canada Mortgage and Housing Corporation, Ottawa, Canada, June, 1983.
Wilson, A.G.; Influence of the House on Chimney Draft, ASHRAE Journal, Vol. 2., No.12, p.63, Atlanta, December, 1960.
Wilson, A.G.; Air Leakage in Buildings, CBD 23, Canadian Building Digest, Division of Building Research, National Research Council of Canada, Ottawa, Canada, November, 1961.
Toward an Understanding and Prediction of Air Flow in Buildings

194
Appendices
Toward an Understanding and Prediction of Air Flow in Buildings
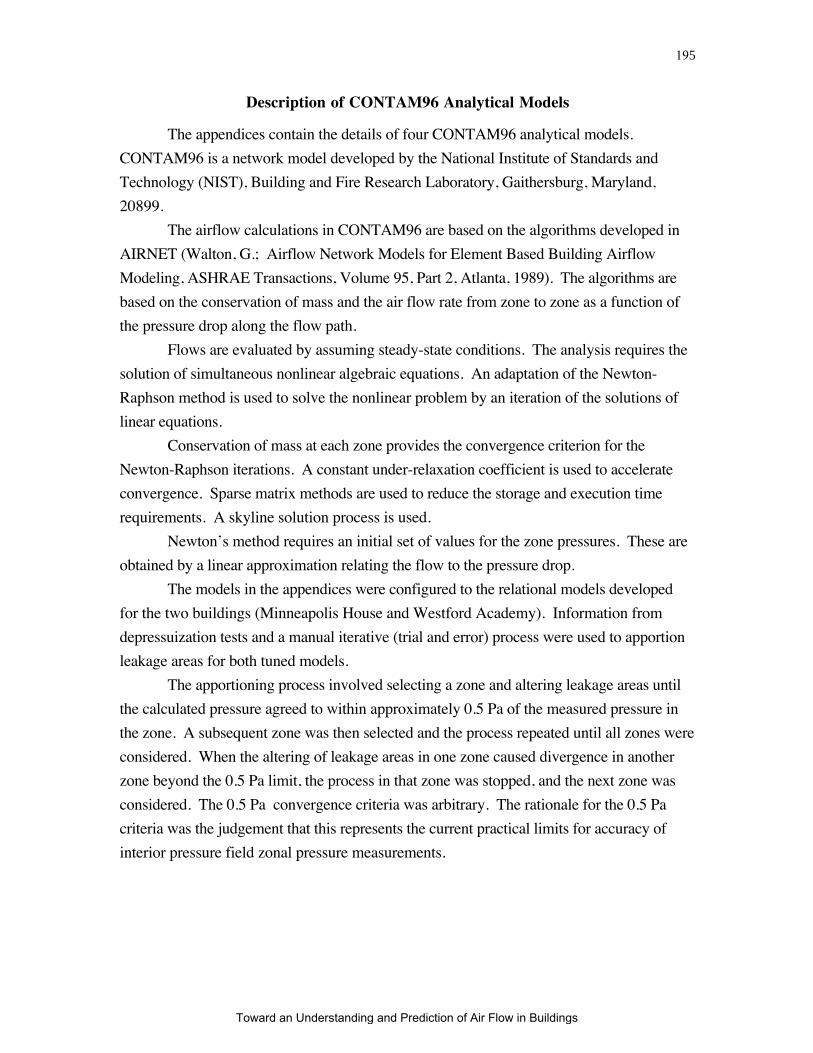
195
Description of CONTAM96 Analytical Models
The appendices contain the details of four CONTAM96 analytical models.
CONTAM96 is a network model developed by the National Institute of Standards and
Technology (NIST), Building and Fire Research Laboratory, Gaithersburg, Maryland,
20899.
The airflow calculations in CONTAM96 are based on the algorithms developed in
AIRNET (Walton, G.; Airflow Network Models for Element Based Building Airflow
Modeling, ASHRAE Transactions, Volume 95, Part 2, Atlanta, 1989). The algorithms are
based on the conservation of mass and the air flow rate from zone to zone as a function of
the pressure drop along the flow path.
Flows are evaluated by assuming steady-state conditions. The analysis requires the
solution of simultaneous nonlinear algebraic equations. An adaptation of the Newton-
Raphson method is used to solve the nonlinear problem by an iteration of the solutions of
linear equations.
Conservation of mass at each zone provides the convergence criterion for the
Newton-Raphson iterations. A constant under-relaxation coefficient is used to accelerate
convergence. Sparse matrix methods are used to reduce the storage and execution time
requirements. A skyline solution process is used.
Newton’s method requires an initial set of values for the zone pressures. These are
obtained by a linear approximation relating the flow to the pressure drop.
The models in the appendices were configured to the relational models developed
for the two buildings (Minneapolis House and Westford Academy). Information from
depressuization tests and a manual iterative (trial and error) process were used to apportion
leakage areas for both tuned models.
The apportioning process involved selecting a zone and altering leakage areas until
the calculated pressure agreed to within approximately 0.5 Pa of the measured pressure in
the zone. A subsequent zone was then selected and the process repeated until all zones were
considered. When the altering of leakage areas in one zone caused divergence in another
zone beyond the 0.5 Pa limit, the process in that zone was stopped, and the next zone was
considered. The 0.5 Pa convergence criteria was arbitrary. The rationale for the 0.5 Pa
criteria was the judgement that this represents the current practical limits for accuracy of
interior pressure field zonal pressure measurements.
Toward an Understanding and Prediction of Air Flow in Buildings
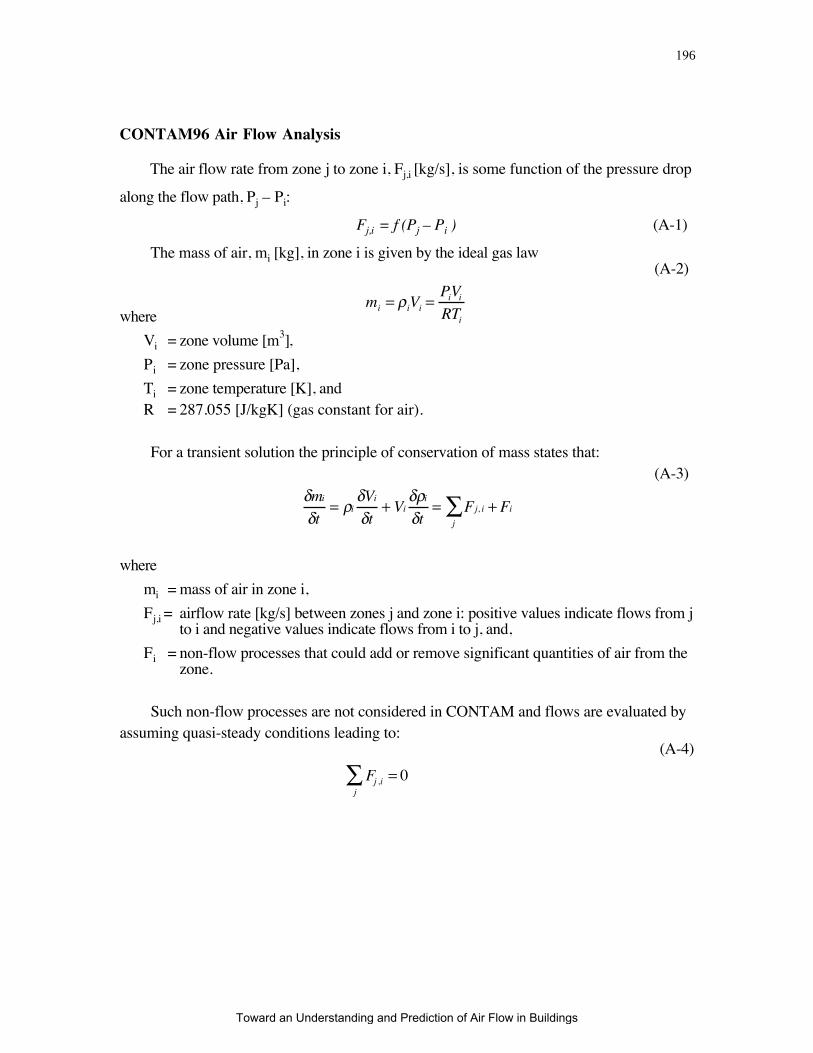
196
CONTAM96 Air Flow Analysis
The air flow rate from zone j to zone i, Fj,i [kg/s], is some function of the pressure drop
along the flow path, Pj – Pi:
Fj,i = f (Pj – Pi ) (A-1)
The mass of air, mi [kg], in zone i is given by the ideal gas law(A-2)
where
Vi = zone volume [m3],
Pi = zone pressure [Pa],
Ti = zone temperature [K], andR = 287.055 [J/kgK] (gas constant for air).
For a transient solution the principle of conservation of mass states that:(A-3)
δmi
δt= ρi
δViδt
+ Viδρiδt
= Fj, i + Fj
∑ i
where
mi = mass of air in zone i,
Fj,i = airflow rate [kg/s] between zones j and zone i: positive values indicate flows from jto i and negative values indicate flows from i to j, and,
Fi = non-flow processes that could add or remove significant quantities of air from thezone.
Such non-flow processes are not considered in CONTAM and flows are evaluated byassuming quasi-steady conditions leading to:
(A-4)
mi = ρiVi =PiViRTi
Fj ,i = 0j
∑
Toward an Understanding and Prediction of Air Flow in Buildings
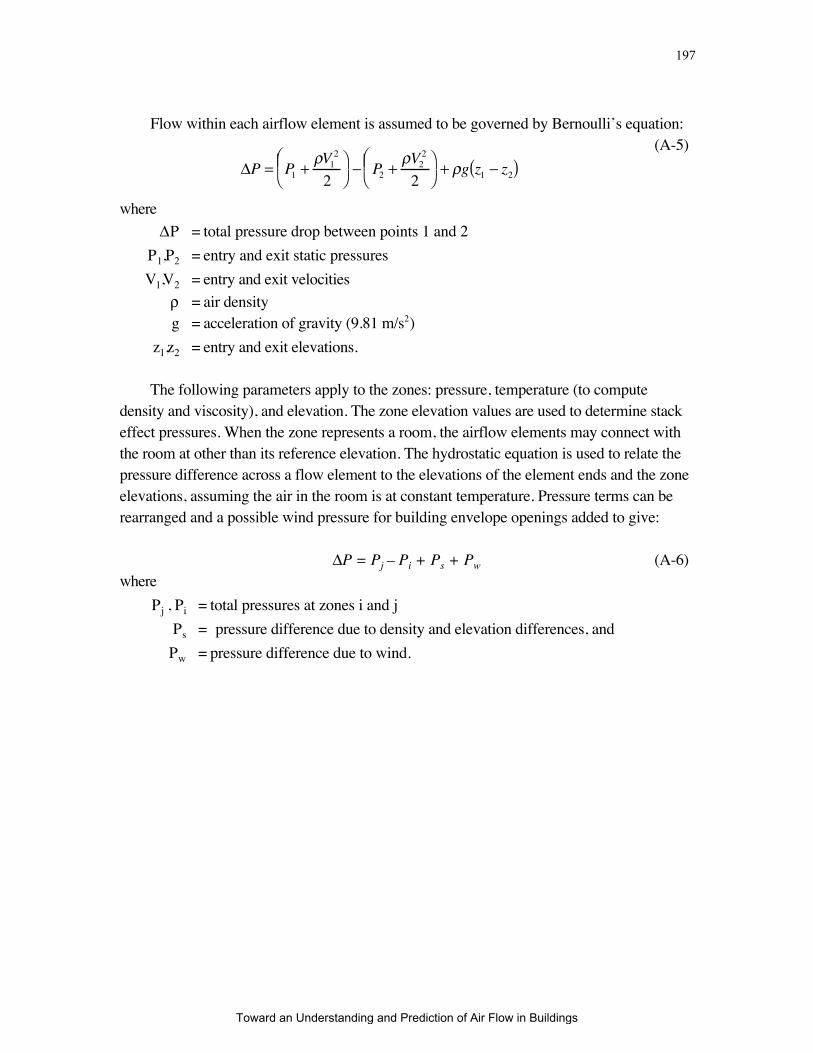
197
Flow within each airflow element is assumed to be governed by Bernoulli’s equation:(A-5)
where
ΔP = total pressure drop between points 1 and 2
P1,P2 = entry and exit static pressures
V1,V2 = entry and exit velocities
ρ = air densityg = acceleration of gravity (9.81 m/s2)
z1,z2 = entry and exit elevations.
The following parameters apply to the zones: pressure, temperature (to computedensity and viscosity), and elevation. The zone elevation values are used to determine stackeffect pressures. When the zone represents a room, the airflow elements may connect withthe room at other than its reference elevation. The hydrostatic equation is used to relate thepressure difference across a flow element to the elevations of the element ends and the zoneelevations, assuming the air in the room is at constant temperature. Pressure terms can berearranged and a possible wind pressure for building envelope openings added to give:
ΔP = Pj – Pi + Ps + Pw (A-6)where
Pj , Pi = total pressures at zones i and j
Ps = pressure difference due to density and elevation differences, and
Pw = pressure difference due to wind.
ΔP = P1 +ρV1
2
2
⎛ ⎝ ⎜ ⎞
⎠ − P2 +
ρV22
2
⎛ ⎝ ⎜ ⎞
⎠ + ρg z1 − z2( )
Toward an Understanding and Prediction of Air Flow in Buildings
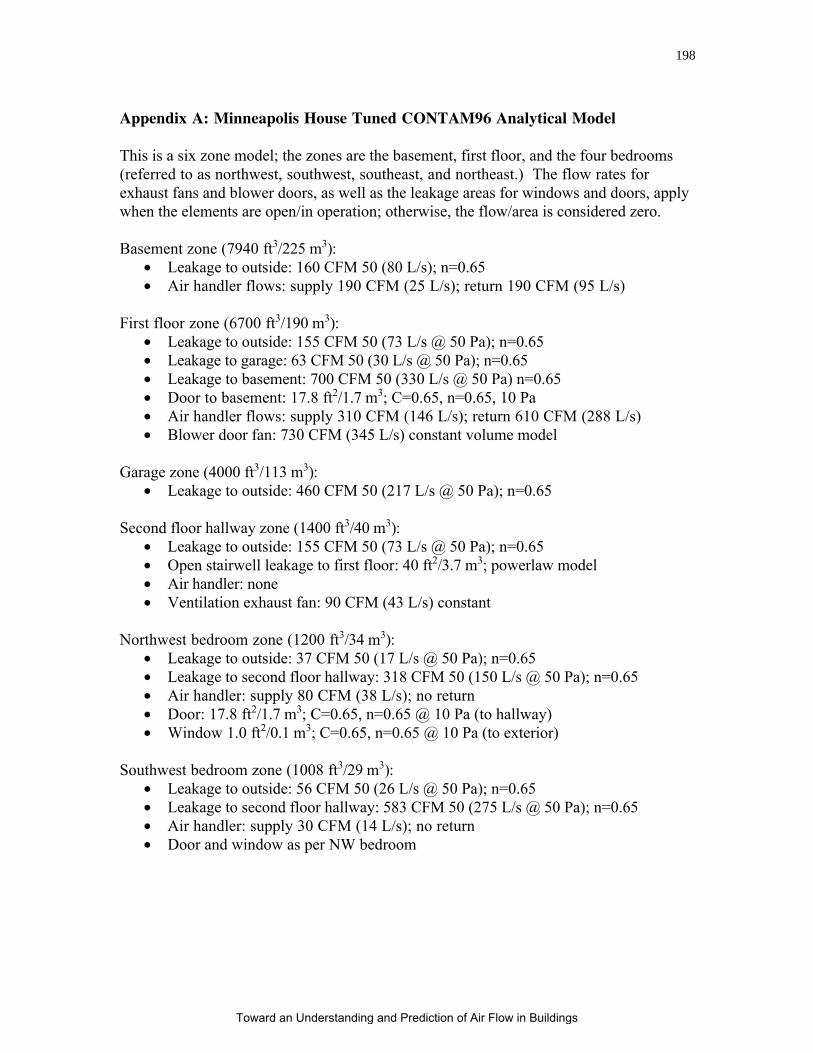
198
Appendix A: Minneapolis House Tuned CONTAM96 Analytical Model
This is a six zone model; the zones are the basement, first floor, and the four bedrooms
(referred to as northwest, southwest, southeast, and northeast.) The flow rates for
exhaust fans and blower doors, as well as the leakage areas for windows and doors, apply
when the elements are open/in operation; otherwise, the flow/area is considered zero.
Basement zone (7940 ft3/225 m3):
• Leakage to outside: 160 CFM 50 (80 L/s); n=0.65
• Air handler flows: supply 190 CFM (25 L/s); return 190 CFM (95 L/s)
First floor zone (6700 ft3/190 m3):
• Leakage to outside: 155 CFM 50 (73 L/s @ 50 Pa); n=0.65
• Leakage to garage: 63 CFM 50 (30 L/s @ 50 Pa); n=0.65
• Leakage to basement: 700 CFM 50 (330 L/s @ 50 Pa) n=0.65
• Door to basement: 17.8 ft2/1.7 m3; C=0.65, n=0.65, 10 Pa
• Air handler flows: supply 310 CFM (146 L/s); return 610 CFM (288 L/s)
• Blower door fan: 730 CFM (345 L/s) constant volume model
Garage zone (4000 ft3/113 m3):
• Leakage to outside: 460 CFM 50 (217 L/s @ 50 Pa); n=0.65
Second floor hallway zone (1400 ft3/40 m3):
• Leakage to outside: 155 CFM 50 (73 L/s @ 50 Pa); n=0.65
• Open stairwell leakage to first floor: 40 ft2/3.7 m3; powerlaw model
• Air handler: none
• Ventilation exhaust fan: 90 CFM (43 L/s) constant
Northwest bedroom zone (1200 ft3/34 m3):
• Leakage to outside: 37 CFM 50 (17 L/s @ 50 Pa); n=0.65
• Leakage to second floor hallway: 318 CFM 50 (150 L/s @ 50 Pa); n=0.65
• Air handler: supply 80 CFM (38 L/s); no return
• Door: 17.8 ft2/1.7 m3; C=0.65, n=0.65 @ 10 Pa (to hallway)
• Window 1.0 ft2/0.1 m3; C=0.65, n=0.65 @ 10 Pa (to exterior)
Southwest bedroom zone (1008 ft3/29 m3):
• Leakage to outside: 56 CFM 50 (26 L/s @ 50 Pa); n=0.65
• Leakage to second floor hallway: 583 CFM 50 (275 L/s @ 50 Pa); n=0.65
• Air handler: supply 30 CFM (14 L/s); no return
• Door and window as per NW bedroom
Toward an Understanding and Prediction of Air Flow in Buildings
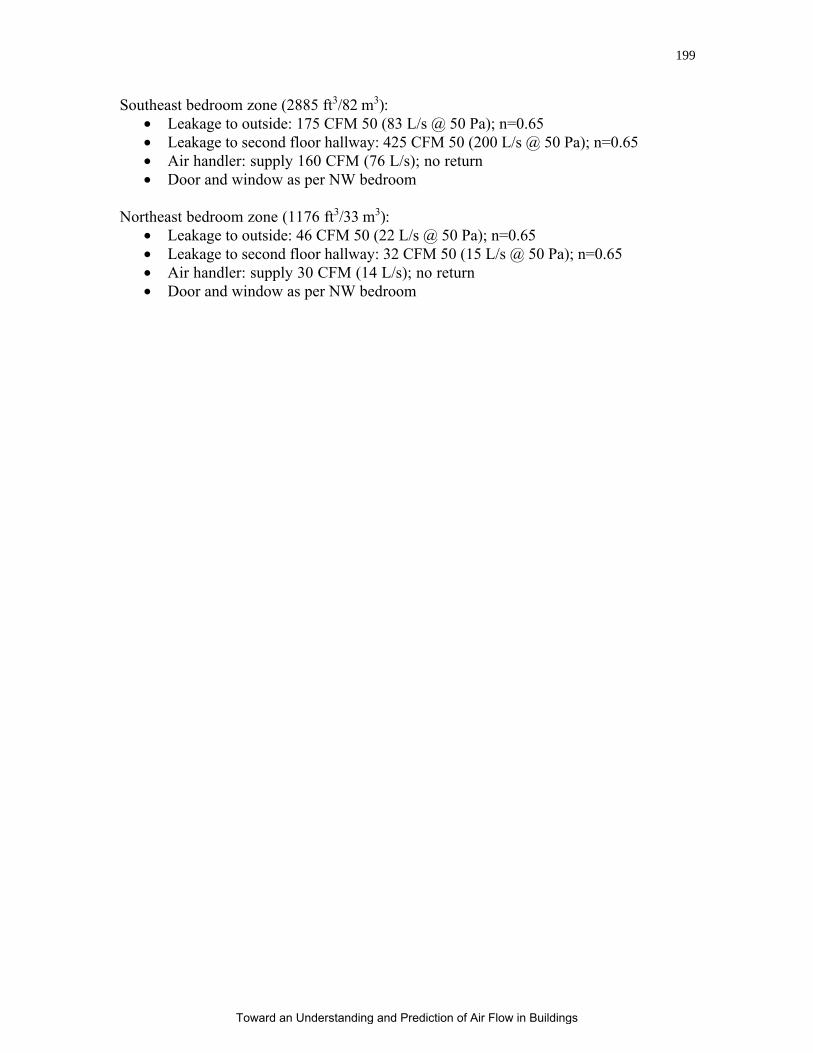
199
Southeast bedroom zone (2885 ft3/82 m3):
• Leakage to outside: 175 CFM 50 (83 L/s @ 50 Pa); n=0.65
• Leakage to second floor hallway: 425 CFM 50 (200 L/s @ 50 Pa); n=0.65
• Air handler: supply 160 CFM (76 L/s); no return
• Door and window as per NW bedroom
Northeast bedroom zone (1176 ft3/33 m3):
• Leakage to outside: 46 CFM 50 (22 L/s @ 50 Pa); n=0.65
• Leakage to second floor hallway: 32 CFM 50 (15 L/s @ 50 Pa); n=0.65
• Air handler: supply 30 CFM (14 L/s); no return
• Door and window as per NW bedroom
Toward an Understanding and Prediction of Air Flow in Buildings

200
Appendix B: Minneapolis House Standard Tuned CONTAM96 Analytical Model
This model is identical to the tuned model in terms of exhaust fans, blower doors,
windows, doors, and stairwell leakage. However, leakage areas are modified as follows:
Basement zone (7940 ft3/225 m3):
• Leakage to outside: 243 CFM 50 (115 L/s @ 50 Pa); n=0.65
First floor zone (6700 ft3/190 m3):
• Leakage to outside: 122 CFM 50 (58 L/s @ 50 Pa); n=0.65
• Leakage to basement: 47.1 in2/304 cm2 @ 75 Pa; C=0.65; n=0.65
Second floor hallway zone (1400 ft3/113 m3):
• Leakage to outside: 47 CFM 50 (22 L/s @ 50 Pa); n=0.65
Northwest bedroom zone (1200 ft3/34 m3):
• Leakage to outside: 62 CFM 50 (29 L/s @ 50 Pa); n=0.65
• Leakage to second floor hallway: 31.6 in2/204 cm2 @ 75 Pa; C=0.65; n=0.65
Southwest bedroom zone (1008 ft3/29 m3):
• Leakage to outside: 53 CFM 50 (25 L/s @ 50 Pa); n=0.65
• Leakage to second floor hallway: 31.9 in2/206 cm2 @ 75 Pa; C=0.65; n=0.65
Southeast bedroom zone (2885 ft3/82 m3):
• Leakage to outside: 142 CFM 50 (67 L/s @ 50 Pa); n=0.65
• Leakage to second floor hallway: 32.0 in2/206 cm2 @ 75 Pa; C=0.65; n=0.65
Northeast bedroom zone (1176 ft3/33 m3):
• Leakage to outside: 61 CFM 50 (29 L/s @ 50 Pa); n=0.65
• Leakage to second floor hallway: 31.8 in2/205 cm2 @ 75 Pa; C=0.65; n=0.65
Leakage to the outside is determined by taking the total measured leakage of the building(730 CFM 50/365 L/s @ 50 Pa) and dividing it into thirds: basement, walls, and ceilingplane. Then, within those groups, the leakage is distributed by surface area proportions.
Leakage to the interior is determined by multiplying the areas of the demising partitions byan average leakage ratio. The 25 mm tall undercut of the bedroom doors is also added,which dominates the leakage to the second floor hallway.
Toward an Understanding and Prediction of Air Flow in Buildings
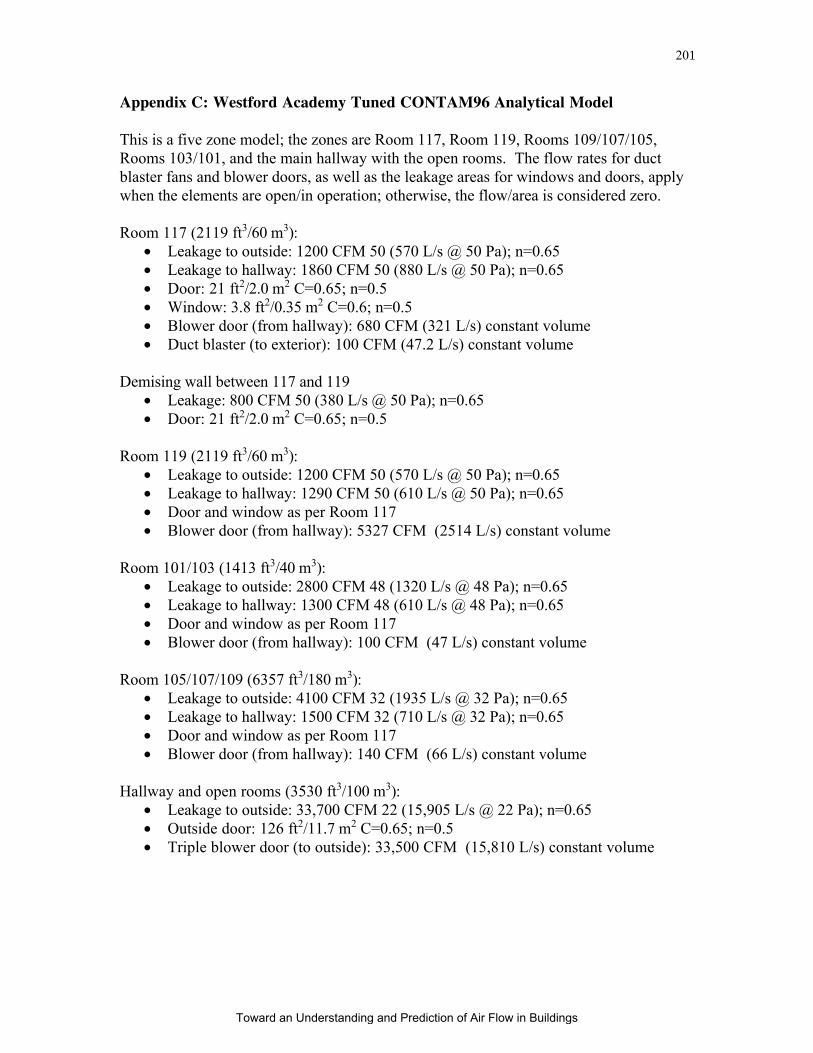
201
Appendix C: Westford Academy Tuned CONTAM96 Analytical Model
This is a five zone model; the zones are Room 117, Room 119, Rooms 109/107/105,
Rooms 103/101, and the main hallway with the open rooms. The flow rates for duct
blaster fans and blower doors, as well as the leakage areas for windows and doors, apply
when the elements are open/in operation; otherwise, the flow/area is considered zero.
Room 117 (2119 ft3/60 m3):
• Leakage to outside: 1200 CFM 50 (570 L/s @ 50 Pa); n=0.65
• Leakage to hallway: 1860 CFM 50 (880 L/s @ 50 Pa); n=0.65
• Door: 21 ft2/2.0 m2 C=0.65; n=0.5
• Window: 3.8 ft2/0.35 m2 C=0.6; n=0.5
• Blower door (from hallway): 680 CFM (321 L/s) constant volume
• Duct blaster (to exterior): 100 CFM (47.2 L/s) constant volume
Demising wall between 117 and 119
• Leakage: 800 CFM 50 (380 L/s @ 50 Pa); n=0.65
• Door: 21 ft2/2.0 m2 C=0.65; n=0.5
Room 119 (2119 ft3/60 m3):
• Leakage to outside: 1200 CFM 50 (570 L/s @ 50 Pa); n=0.65
• Leakage to hallway: 1290 CFM 50 (610 L/s @ 50 Pa); n=0.65
• Door and window as per Room 117
• Blower door (from hallway): 5327 CFM (2514 L/s) constant volume
Room 101/103 (1413 ft3/40 m3):
• Leakage to outside: 2800 CFM 48 (1320 L/s @ 48 Pa); n=0.65
• Leakage to hallway: 1300 CFM 48 (610 L/s @ 48 Pa); n=0.65
• Door and window as per Room 117
• Blower door (from hallway): 100 CFM (47 L/s) constant volume
Room 105/107/109 (6357 ft3/180 m3):
• Leakage to outside: 4100 CFM 32 (1935 L/s @ 32 Pa); n=0.65
• Leakage to hallway: 1500 CFM 32 (710 L/s @ 32 Pa); n=0.65
• Door and window as per Room 117
• Blower door (from hallway): 140 CFM (66 L/s) constant volume
Hallway and open rooms (3530 ft3/100 m3):
• Leakage to outside: 33,700 CFM 22 (15,905 L/s @ 22 Pa); n=0.65
• Outside door: 126 ft2/11.7 m2 C=0.65; n=0.5
• Triple blower door (to outside): 33,500 CFM (15,810 L/s) constant volume
Toward an Understanding and Prediction of Air Flow in Buildings
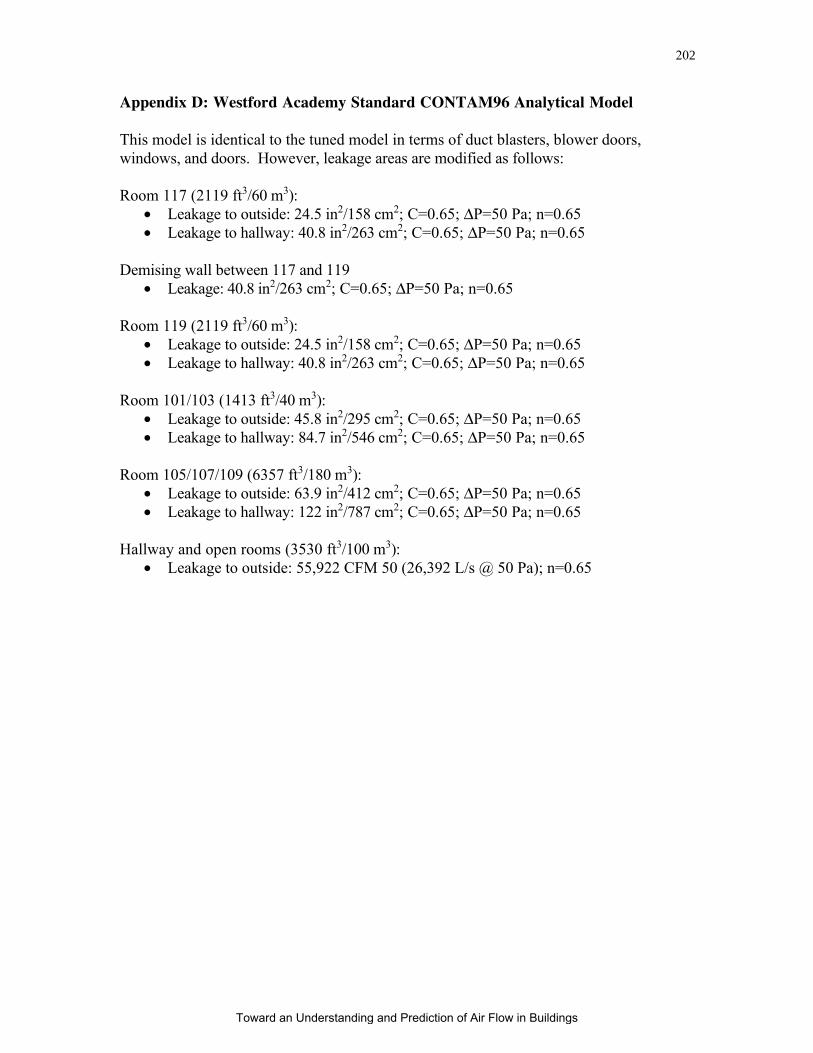
202
Appendix D: Westford Academy Standard CONTAM96 Analytical Model
This model is identical to the tuned model in terms of duct blasters, blower doors,
windows, and doors. However, leakage areas are modified as follows:
Room 117 (2119 ft3/60 m3):
• Leakage to outside: 24.5 in2/158 cm2; C=0.65; ΔP=50 Pa; n=0.65
• Leakage to hallway: 40.8 in2/263 cm2; C=0.65; ΔP=50 Pa; n=0.65
Demising wall between 117 and 119
• Leakage: 40.8 in2/263 cm2; C=0.65; ΔP=50 Pa; n=0.65
Room 119 (2119 ft3/60 m3):
• Leakage to outside: 24.5 in2/158 cm2; C=0.65; ΔP=50 Pa; n=0.65
• Leakage to hallway: 40.8 in2/263 cm2; C=0.65; ΔP=50 Pa; n=0.65
Room 101/103 (1413 ft3/40 m3):
• Leakage to outside: 45.8 in2/295 cm2; C=0.65; ΔP=50 Pa; n=0.65
• Leakage to hallway: 84.7 in2/546 cm2; C=0.65; ΔP=50 Pa; n=0.65
Room 105/107/109 (6357 ft3/180 m3):
• Leakage to outside: 63.9 in2/412 cm2; C=0.65; ΔP=50 Pa; n=0.65
• Leakage to hallway: 122 in2/787 cm2; C=0.65; ΔP=50 Pa; n=0.65
Hallway and open rooms (3530 ft3/100 m3):
• Leakage to outside: 55,922 CFM 50 (26,392 L/s @ 50 Pa); n=0.65
Toward an Understanding and Prediction of Air Flow in Buildings