Embed Size (px)
Citation preview

Toward a Goal-oriented, Business Intelligence
Decision-Making Framework
Alireza PourshahidGregory Richards
Daniel Amyot
Motivation
• Business Intelligence (BI) tools do not always help improving decision making
• Difficulties in:– Integrating goals, indicators, and decisions into a
single conceptual framework – Fitting with the cognitive decision models of
managers– Adapting to organizational changes – Handling unavailability of some data when
performance models are first put in place• Can we improve upon this situation?
Toward a Goal-oriented, Business Intelligence Decision-Making Framework, MCeTech 2011
2
Agenda
• Business Intelligence (BI) Based Decision Making• Goal-oriented Requirement Language (GRL)• GRL and KPI for Business Modeling• Formula-Based Evaluation Algorithm• Business Intelligence Decision-Making Framework• Real-Life Example: Retail Business• Lessons Learned• Conclusions
Toward a Goal-oriented, Business Intelligence Decision-Making Framework, MCeTech 2011
3
BI-Based Decision Making (1/3)
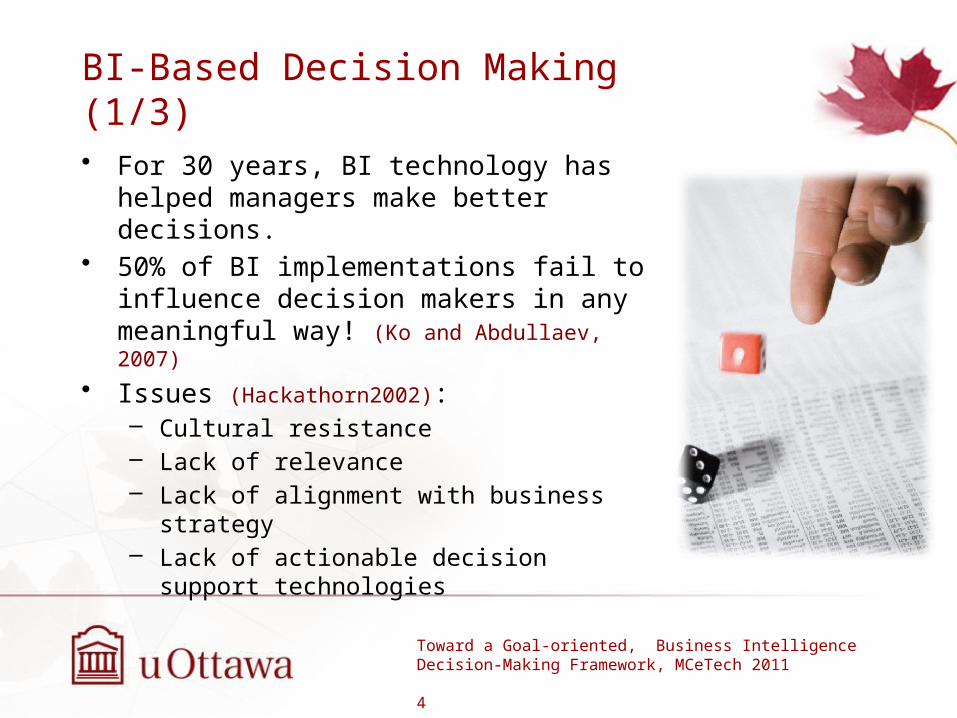
• For 30 years, BI technology has helped managers make better decisions.
• 50% of BI implementations fail to influence decision makers in any meaningful way! (Ko and Abdullaev, 2007)
• Issues (Hackathorn2002): – Cultural resistance– Lack of relevance– Lack of alignment with business strategy– Lack of actionable decision support
technologies
Toward a Goal-oriented, Business Intelligence Decision-Making Framework, MCeTech 2011
4
BI-Based Decision Making (2/3)
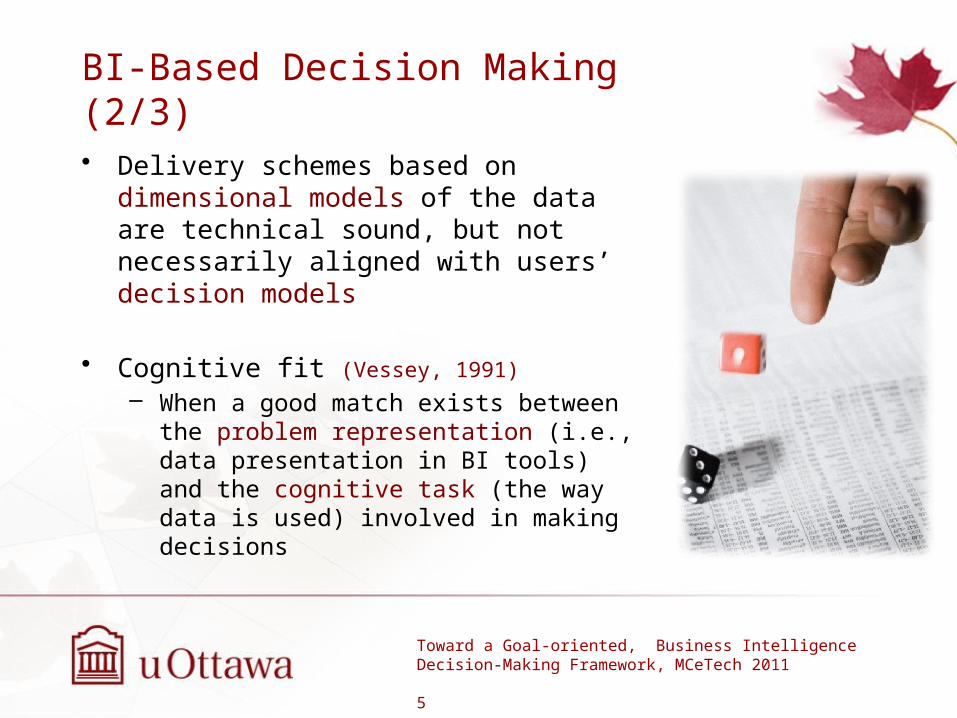
• Delivery schemes based on dimensional models of the data are technical sound, but not necessarily aligned with users’ decision models
• Cognitive fit (Vessey, 1991)– When a good match exists between the
problem representation (i.e., data presentation in BI tools) and the cognitive task (the way data is used) involved in making decisions
Toward a Goal-oriented, Business Intelligence Decision-Making Framework, MCeTech 2011
5
BI-Based Decision Making (3/3)
• BI data and visualizations do not necessarily show the cause and effect relationships we need to make decision (Korhonen et al. 2008)
• Key impact of a decision model is improving the probability of goal accomplishment.
• The cause-effect nature of such decisions is often related to resource allocation.
• Need to model goals and causal relationships visually to reduce the cognitive load!
Toward a Goal-oriented, Business Intelligence Decision-Making Framework, MCeTech 2011
6
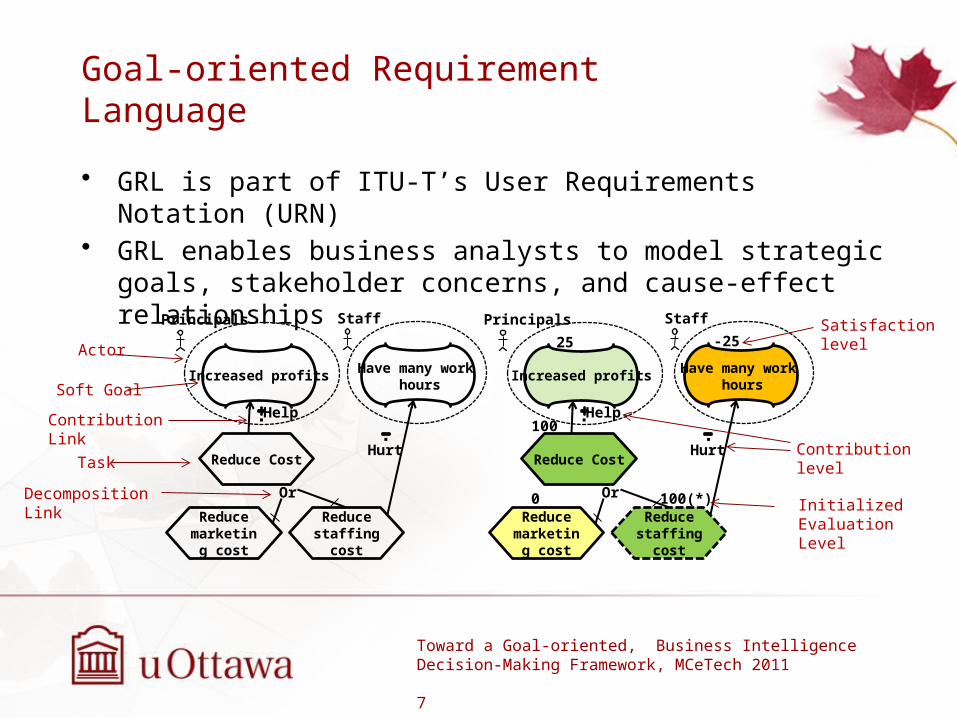
Goal-oriented Requirement Language
• GRL is part of ITU-T’s User Requirements Notation (URN)• GRL enables business analysts to model strategic goals,
stakeholder concerns, and cause-effect relationships
Toward a Goal-oriented, Business Intelligence Decision-Making Framework, MCeTech 2011
7
Reduce Cost
Increased profits
Principals
Reduce marketing
cost
Reduce staffing
cost
Have many work hours
Staff
Help
Hurt
Or
Soft Goal
Actor
Task
Contribution Link
Decomposition Link
Reduce Cost
Increased profits
25
Principals
Reduce marketing
cost
Reduce staffing
cost
Have many work hours
-25
Staff
Help
Hurt
Or 100(*)0
100
Satisfaction level
Contribution level
InitializedEvaluation Level
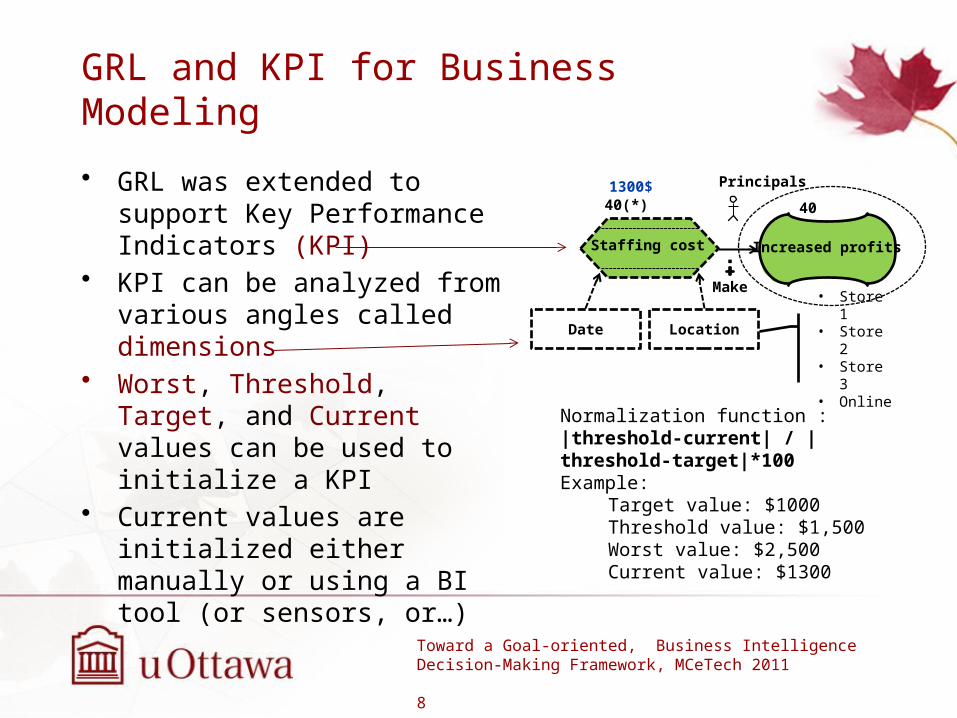
GRL and KPI for Business Modeling
• GRL was extended to support Key Performance Indicators (KPI)
• KPI can be analyzed from various angles called dimensions
• Worst, Threshold, Target, and Current values can be used to initialize a KPI
• Current values are initialized either manually or using a BI tool (or sensors, or…)
Toward a Goal-oriented, Business Intelligence Decision-Making Framework, MCeTech 2011
8
Staffing cost Increased profits
Make
4040(*)1300$
Date Location • Store 1• Store 2• Store 3• Online
Principals
Normalization function :|threshold-current| / |threshold-target|*100Example:
Target value: $1000Threshold value: $1,500Worst value: $2,500Current value: $1300
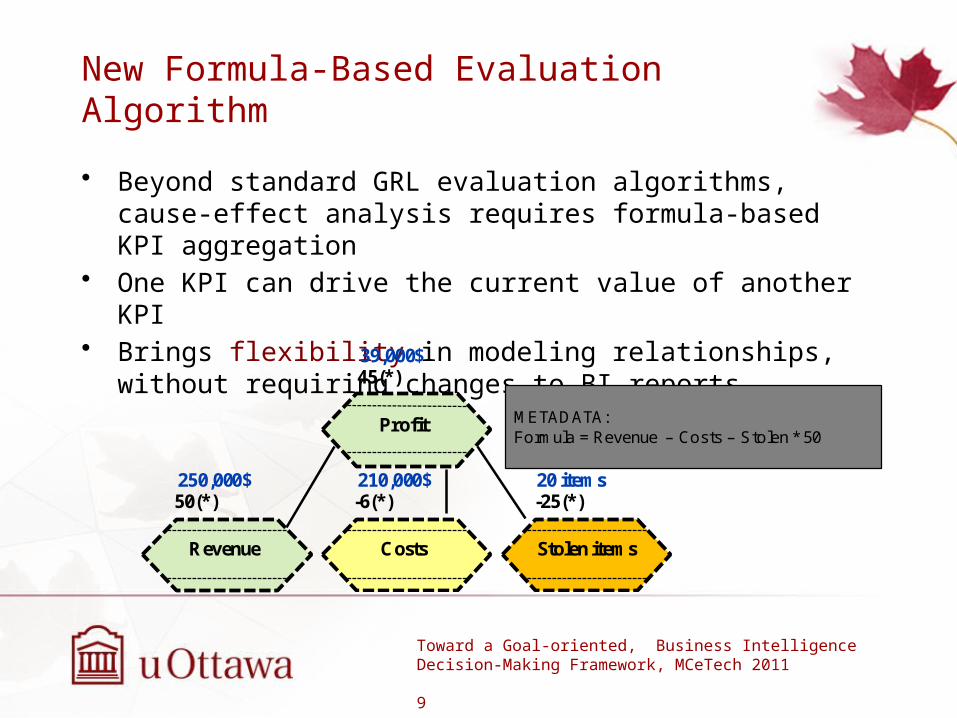
New Formula-Based Evaluation Algorithm
• Beyond standard GRL evaluation algorithms, cause-effect analysis requires formula-based KPI aggregation
• One KPI can drive the current value of another KPI• Brings flexibility in modeling relationships, without
requiring changes to BI reports
Toward a Goal-oriented, Business Intelligence Decision-Making Framework, MCeTech 2011
9
Profit
45(*)39,000$
Revenue
50(*)250,000$
Costs
-6(*)210,000$
Stolen items
-25(*)20 items
METADATA:Formula = Revenue – Costs – Stolen * 50
Business Intelligence Decision-Making Framework
Toward a Goal-oriented, Business Intelligence Decision-Making Framework, MCeTech 2011
10
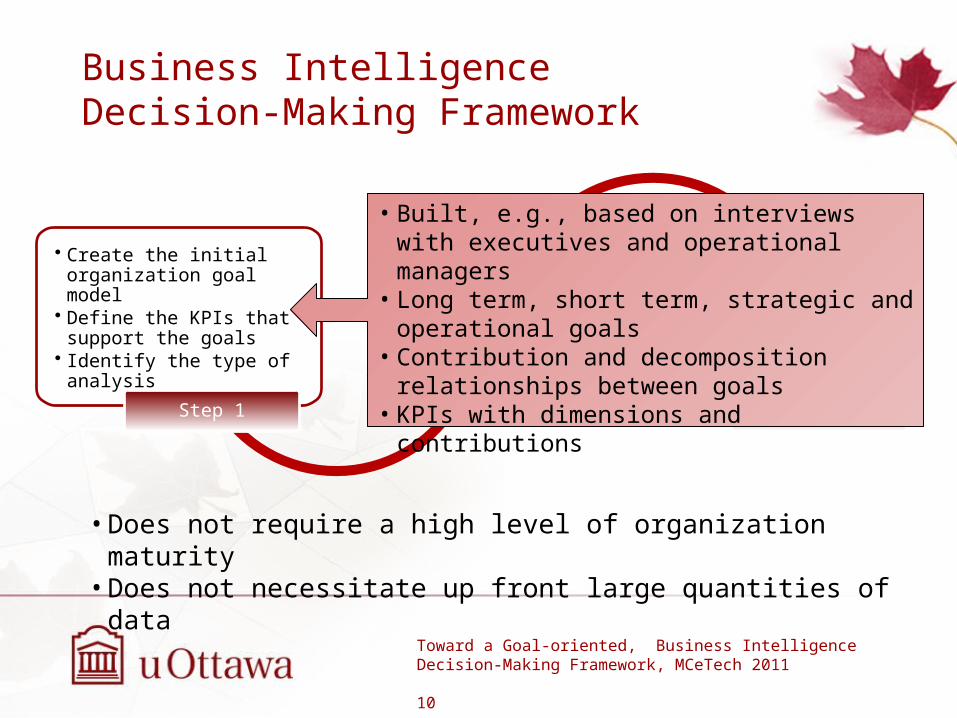
• Create the initial organization goal model
• Define the KPIs that support the goals
• Identify the type of analysis
Step 1
• Add/revise KPIs• Refine the cause-effect
relationships• Create a decision options
diagram• Make a decision
Step 2• Add risks • Add KPIs required to
monitor the result• Evaluate and refine the
model• Go to Step 2
Step 3
• Does not require a high level of organization maturity• Does not necessitate up front large quantities of data
• Built, e.g., based on interviews with executives and operational managers
• Long term, short term, strategic and operational goals
• Contribution and decomposition relationships between goals
• KPIs with dimensions and contributions
Retail Business Real-Life Example
• Ontario-based (small) retail business, 15 years old• 4 local stores, and plans expansion nationally• Scorecard that tracked key operational indicators, but
some data unavailable (e.g., flows of customers)• Most revenues earned through consignment sales• Started selling new items as well, and planning to invest
in an online business (might be risky)• Considering different marketing approaches
Toward a Goal-oriented, Business Intelligence Decision-Making Framework, MCeTech 2011
11
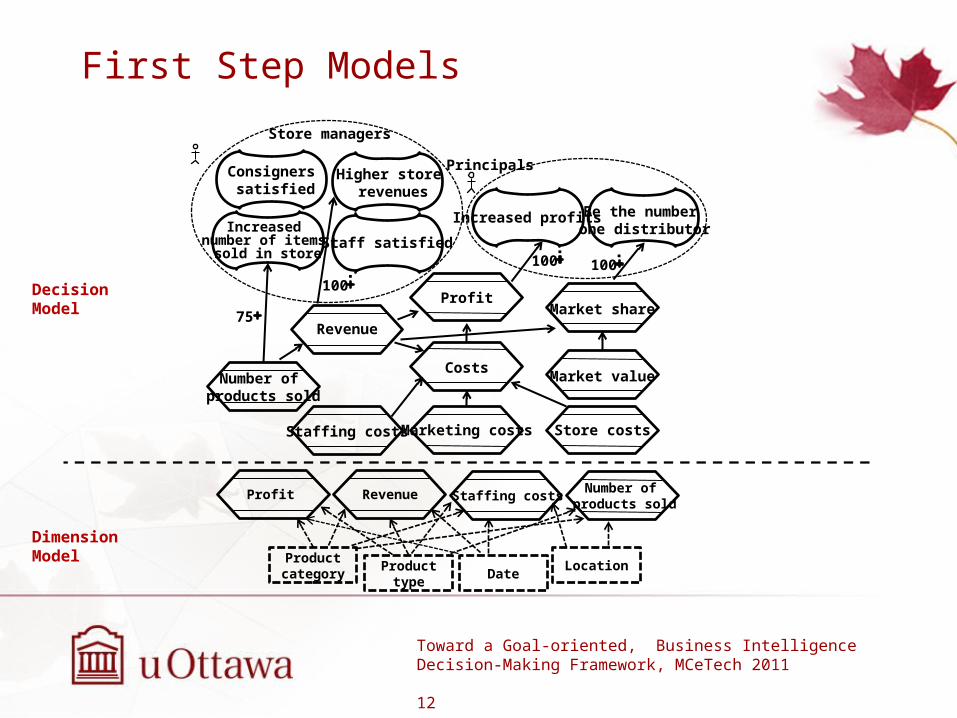
First Step Models
Toward a Goal-oriented, Business Intelligence Decision-Making Framework, MCeTech 2011
12
Increased profits
PrincipalsConsigners satisfied
Store managers
Revenue
100
ProfitMarket share
Market valueNumber of products sold
Costs
Staffing costs Marketing costs Store costs
Be the number one distributor
Higher store revenues
Staff satisfiedIncreased
number of items sold in store 100
75
100
Product category
Product type
Profit Revenue Staffing costsNumber of
products sold
DateLocation
Decision Model
Dimension Model
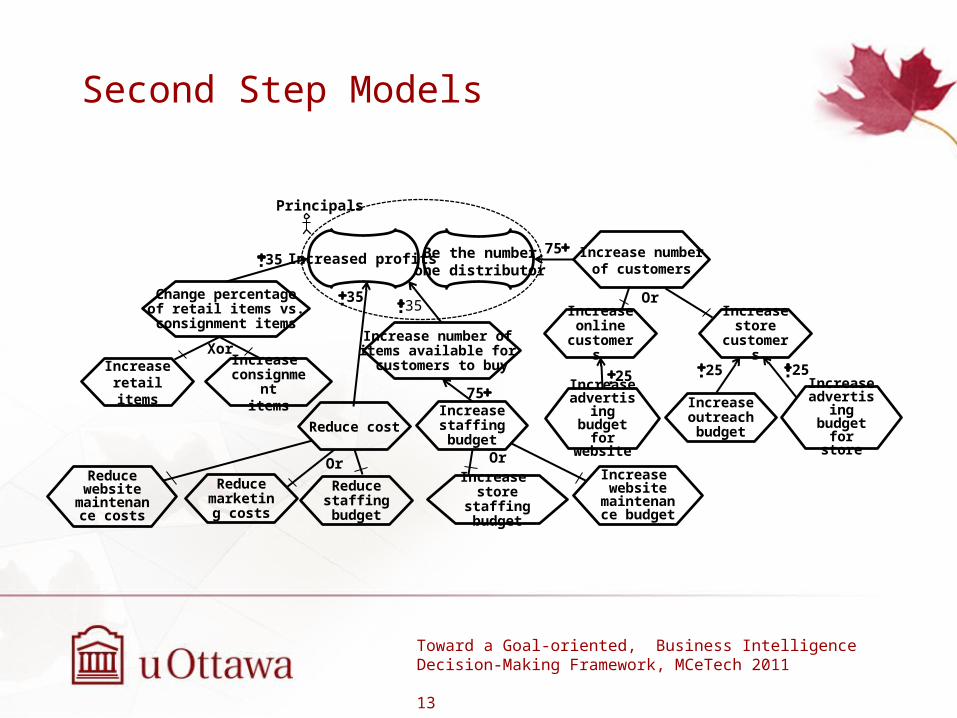
Second Step Models
Toward a Goal-oriented, Business Intelligence Decision-Making Framework, MCeTech 2011
13
Change percentageof retail items vs.
consignment items
Increase retail items
Increase consignment
items
Xor
Increased profits Be the numberone distributor
Reduce cost
Reduce marketing
costs
Reduce staffing budget
OrReduce website
maintenance costs
Increase website
maintenance budget
Increase store staffing
budget
Or
Increase staffing budget
Increase number of items available for customers to buy
Increase numberof customers
Increase online
customers
Increase store
customers
Or
Increase advertising budget for
store
Increase advertising budget for
website
Increase outreachbudget
35
3535
25252575
75
Principals
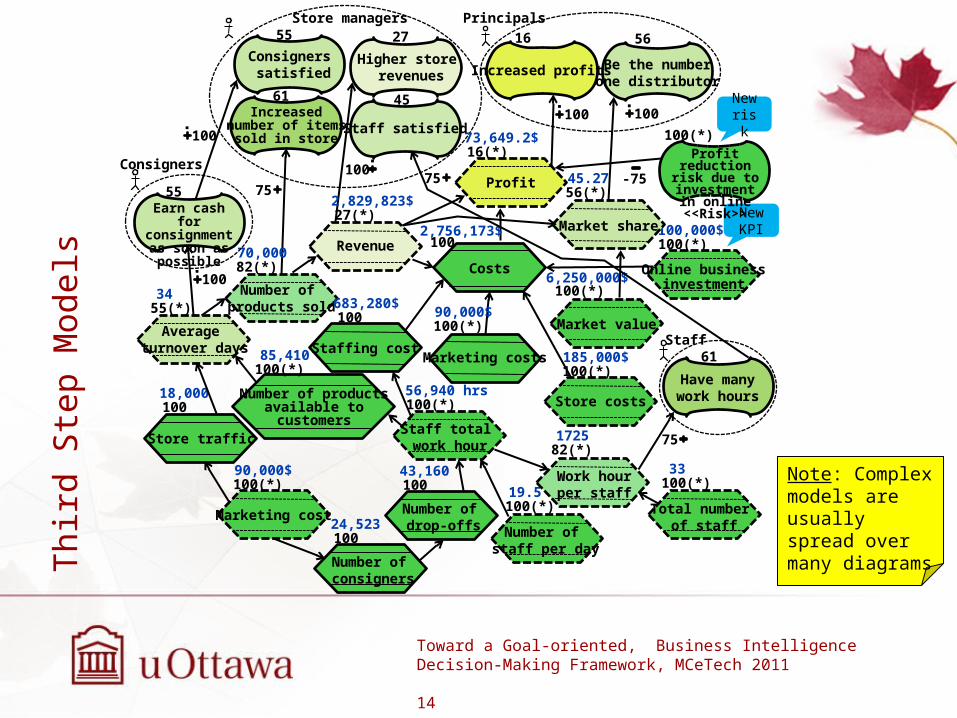
Thir
d S
tep M
odels
Toward a Goal-oriented, Business Intelligence Decision-Making Framework, MCeTech 2011
14
Number of staff per day
100(*)6,250,000$
Store managers
Revenue
100
Number of products sold
Staffing cost
Market value
75
100
Total number of staff
NewKPI
Number of consigners
10024,523
Marketing cost
100(*)90,000$
Store traffic
10018,000
Average turnover days
55(*)34
82(*)70,000
27(*)2,829,823$
Number of drop-offs
10043,160
100(*)19.5
Online businessinvestment
100(*)100,000$
Work hourper staff
82(*)1725
Number of productsavailable tocustomers
100(*)85,410
100683,280$
Marketing costs
100(*)90,000$
Staff total work hour
100(*)56,940 hrs
Costs
1002,756,173$
Profit
16(*)73,649.2$
Store costs
100(*)185,000$
Market share
56(*)45.27
100(*)33
Newrisk
Profit reduction risk due to
investment in online <<Risk>>
100(*)
56
Principals
Be the numberone distributor
Increased profits
16
Staff satisfied
45
Higher store revenues
27
Increasednumber of items
sold in store
61
Consigners satisfied
55
Earn cash for consignment as soon as possible
Consigners
55
Staff
Have many work hours
61
100
75
100
100
75
-75
Note: Complex models are usually spread over many diagrams
Lessons Learned:Business Management Perspective
• Modeling not only helps with documentation of the known aspects of the business but also helps clarify the unknown or uncertain aspects (e.g., relationships)– Decision snapshots can be taken and compared (decision
trails to document rationale and adjust models)• When no historical data is available, use industry
standard or “best guesses” to define cause-effect relationships (improved in later iterations)
• Still not sure of how much information we have to show in the model and how much to keep in DBs or BI reports
• The ability to adjust the range of acceptable values for a KPI is useful for registering risk
Toward a Goal-oriented, Business Intelligence Decision-Making Framework, MCeTech 2011
15
Lessons Learned:Technical Perspective
• Our new extensions to GRL and the new formula-based algorithm provide a great deal of flexibility for model evaluation – New topic for study in ITU-T’s URN standard
• The new algorithm still has room for improvement, especially when it comes to using goals as contributors to KPIs (e.g., for risks)
• Creating different versions of a model in different iterations and keeping them consistent for comparison purposes can be painful with current tool support
Toward a Goal-oriented, Business Intelligence Decision-Making Framework, MCeTech 2011
16
Conclusions
• Conventional BI systems show a cognitive gap between technical data models and managers’ decision models
• By integrating the decision framework into the BI system, we attempt to improve cognitive fit– View complementary to BI tools, not a substitute
• We extended GRL to better display cause-effects relationships between KPIs and objectives, enable formula-based evaluations, and integrate risk
• We introduced an iterative framework to create, refine, and analyze models
• We used a retail business example (and the jUCMNav tool) to illustrate the framework in a real context
Toward a Goal-oriented, Business Intelligence Decision-Making Framework, MCeTech 2011
17