Embed Size (px)
Citation preview

Toward a Factor Model of Relative Valuation
Liuren Wujoint with Xiaolu Hu and Malick Sy
NUS Quantitative Finance Joint Seminar11 Dec 2020
c©Liuren Wu (Baruch) Company Valuation 11 Dec 2020 1 / 23

Perform company valuation on a large universe
Investment and corporate decisions must start with an accurate assessmentof company valuation.
The finance literature talks little about (actual) company valuation, exceptfor textbook treatment.
Quants researchers are excited about new statistical techniques,robo-advisors, and machine learning...
What is the right question? What’s the right performance metric?
What do you feed the machines to learn?
This project contains a large amount of manual work, just so we can find aneffective way of using the machines/techniques
Target question: fair company valuation on a large universe
Efforts: what/how to feed into company valuation
c©Liuren Wu (Baruch) Company Valuation 11 Dec 2020 2 / 23

Learn from the classics
Structural DCF valuation on a single company
Works off consensus to generate variant views based on in-depthmarket/industry/company analysis
Industry size, company share, industry trend, company position.
Top line growth projection
Profit margin and bottom line earnings projection
Investment and financing projection: discount rate
Potential for strategic game-changing decisions
Each analyst covers a small number of companies, and identify key(innovative) drivers for the top/bottom line
Value multiples
Used under highly controlled environments for “comparable” companies
Key is to find the right comparables — metrics defining “comparability”
Statistical valuation of a large universe — Make the universe comparable
Transform company value into a measure as cross-sectionallycomparable as possible
Construct value determinants and conditioning metricscross-sectionally comparable and generally available
c©Liuren Wu (Baruch) Company Valuation 11 Dec 2020 3 / 23

A factor model of company relative valuation
Objective: statistical valuation of a large universe: Make the universe comparable
Transform value into a measure as cross-sectionally comparable as possible
Value multiples (PB, PE, PS) are good starting points
Valid relative value metrics themselves within a controlled groupIdentify conditions/metrics that make these multiples conditionallycomparable within a large universe
The q ratio (value/capital, or its variations) has been widely used:
Investment literature: q is the marginal value of capitalCorporate finance: q is a performance measureAsset pricing: q (BM equity) predicts future stock returns
We use an analogous q ratio to define the relative value of a company:q = ln((TA− BE + MC )/TA).
It reflects equity valuation, but is represented in company value space.
Company v. equity valuation (?)
The starting point of the residual income model, which considers bothwhat you will earn and what you have
One can, in principle, use other value multiples as the starting point...
c©Liuren Wu (Baruch) Company Valuation 11 Dec 2020 4 / 23

A factor model of company relative valuation
Transform value into a measure as cross-sectionally comparable as possible
Construct determinants cross-sectionally comparable and generally available
Tons of ratios/metrics have been constructed to explain valuationMany are variations of closely-related conceptsEach has somewhat different coverage, relevance
We propose a two-step procedure in the determinant construction
Combine/average several descriptors (of similar concepts) to one factorThe averaging can increase coverage, reduce noise, and alleviatemulti-collinearity issue
Link relative value to the constructed factors via a cross-sectionalcontemporaneous regression
with controls on industry differences.
Each step has many choices/variations: Each choice raises more questionsthan answers ...
If we can establish this general approach as useful, researchers can keepworking/innovating on the details down the road.
c©Liuren Wu (Baruch) Company Valuation 11 Dec 2020 5 / 23

The Literature: factor model of stock returns
Our factor model is analogous in construction to factor models of stock returns
Dates back to Fama & McBeth (1973): Regress future stock returns onsome risk factors cross-sectionally.
Has been well developed in the industry (Grinold & Kahn (1999)) as thestarting point for active portfolio management
“Risk factors” are standardized firm characteristics (either returnpredictors, or similarity measures).Slope estimate represents realized return on a “factor portfolio.”Time-series averages represent average “risk premium” estimates forthe risk factors.Widely used for constructing “robust” covariance matrices forportfolios optimization, and portfolio risk attribution.Many commercial packages are available (Barra, Axioma, Bloomberg...)
Our factor model of company valuation serves different purposes:
It is a model for contemporaneous valuation, not for return forecasting:R2 should be much higher...Coefficient estimate reflects market pricing of each valuation factor atthat time.
c©Liuren Wu (Baruch) Company Valuation 11 Dec 2020 6 / 23

The Literature: company valuation
We teach DCF and maybe option-based equity valuation, but little empiricalwork on practical implementation
Accounting literature on empirical implementations and accountingvariations of the DCF (RIM, AEG) ...
Mainly a test of inputs and long-run stationarity assumptions
Statistical regressions:
Rhodes-Kropf, Robinson, and Viswanathan (2005): Variable motivatedby RIM: Book, net incomeBartram, Grinblatt (2018, 2020): (almost) non-discriminative list of(virtually) all BS/IS/CF entriesEdmans, Goldstein, Jiang (2012): nearest neighbors
The three papers capture three important dimensions for building a robuststatistical valuation model
Insights from structural models on value determinantsStatistical search (feature collection, construction, identification)All models are imperfect: Local averaging/Bias-correction with nearestneighbors — value similarity/distance measures
c©Liuren Wu (Baruch) Company Valuation 11 Dec 2020 7 / 23
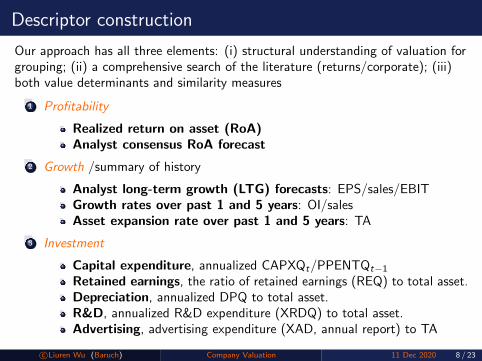
Descriptor construction
Our approach has all three elements: (i) structural understanding of valuation forgrouping; (ii) a comprehensive search of the literature (returns/corporate); (iii)both value determinants and similarity measures
1 Profitability
Realized return on asset (RoA)Analyst consensus RoA forecast
2 Growth /summary of history
Analyst long-term growth (LTG) forecasts: EPS/sales/EBITGrowth rates over past 1 and 5 years: OI/salesAsset expansion rate over past 1 and 5 years: TA
3 Investment
Capital expenditure, annualized CAPXQt/PPENTQt−1Retained earnings, the ratio of retained earnings (REQ) to total asset.Depreciation, annualized DPQ to total asset.R&D, annualized R&D expenditure (XRDQ) to total asset.Advertising, advertising expenditure (XAD, annual report) to TA
c©Liuren Wu (Baruch) Company Valuation 11 Dec 2020 8 / 23

Descriptor construction
4 Liquidity
Working capital, working capital (WCAQ) to total asset.Slack ratio, cash and short-term investment (CHEQ) to total asset.Cash ratio, cash and short-term investment to current liabilities.Quick ratio, CHEQ + accounts receivable (RECTQ) to LCTQ.Current ratio, CHEQ+RECTQ+INVTQ to current liabilitiesTrading liquidity, the log ratio of average dollar trading volume tostock return idiosyncratic volatility (over past year).
5 Leverage: debt-to-book equity ratio
6 Market risk: 73-day daily regression beta
7 Size: log Total Asset
8 Momentum: 6-month and 12-month excluding last month
Other categories/measures/changes?
c©Liuren Wu (Baruch) Company Valuation 11 Dec 2020 9 / 23

Constructing valuation factors from descriptors
At date t, there are j = 1, · · · , nk descriptors for the kth category, fork = 1, · · · ,K factors characterizing the behavior of i = 1, · · · ,N companies.
Standardize the raw values of each descriptor, x jt,i ,
z jt,i =(x jt,i −mj
t)
s jt. (1)
winsorize z jt,i ∈ (1, 99)% to estimate (mjt , s
jt ), truncate z jt,i ∈ [−2, 2].
Create the kth factor f kt,i by averaging the nk descriptors within the category,
f kt,i =
nk∑j=1
wt,jzjt,i (2)
with the weight estimated via a Bayesian regression:
wt =(Z>t Zt + Pt
)−1 (Z>t Ztw
ut + Ptw
0), (3)
wu the unconstrained estimator, w0 = 1nk
the prior, and Pt = 0.1⟨Z>t Zt
⟩.
c©Liuren Wu (Baruch) Company Valuation 11 Dec 2020 10 / 23
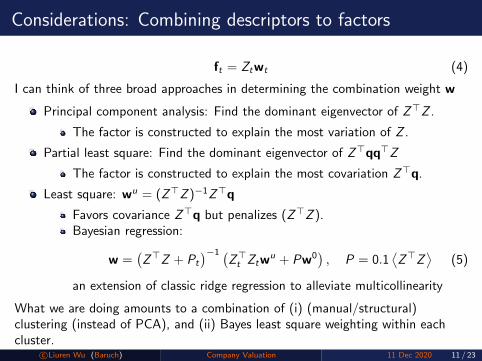
Considerations: Combining descriptors to factors
ft = Ztwt (4)
I can think of three broad approaches in determining the combination weight w
Principal component analysis: Find the dominant eigenvector of Z>Z .
The factor is constructed to explain the most variation of Z .
Partial least square: Find the dominant eigenvector of Z>qq>Z
The factor is constructed to explain the most covariation Z>q.
Least square: wu = (Z>Z )−1Z>q
Favors covariance Z>q but penalizes (Z>Z ).Bayesian regression:
w =(Z>Z + Pt
)−1 (Z>t Ztw
u + Pw0), P = 0.1
⟨Z>Z
⟩(5)
an extension of classic ridge regression to alleviate multicollinearity
What we are doing amounts to a combination of (i) (manual/structural)clustering (instead of PCA), and (ii) Bayes least square weighting within eachcluster.
c©Liuren Wu (Baruch) Company Valuation 11 Dec 2020 11 / 23

Descriptor contribution to factors
Mean Std Auto Percentile values10 25 50 75 90
1. ProfitabilityRoA 0.73 0.36 0.99 0.23 0.32 1.00 1.00 1.00RoA forecast 0.72 0.10 0.84 0.61 0.66 0.71 0.78 0.87
2. GrowthLTG forecast 0.46 0.09 0.96 0.33 0.38 0.47 0.53 0.57Growth 5Y 0.12 0.08 0.91 0.01 0.08 0.13 0.17 0.21Growth 1Y 0.19 0.07 0.77 0.11 0.14 0.18 0.23 0.27Expansion 5Y 0.14 0.16 0.97 -0.03 0.03 0.10 0.23 0.40Expansion 1Y 0.17 0.08 0.86 0.07 0.11 0.15 0.22 0.27
3. InvestmentExpenditure 0.28 0.07 0.94 0.18 0.24 0.27 0.33 0.37Retained earnings 0.25 0.12 0.99 0.11 0.15 0.20 0.37 0.42Depreciation 0.11 0.08 0.97 0.01 0.05 0.10 0.16 0.23R&D 0.32 0.13 0.97 0.11 0.24 0.34 0.40 0.49Advertising 0.19 0.09 0.97 0.08 0.12 0.17 0.25 0.33
c©Liuren Wu (Baruch) Company Valuation 11 Dec 2020 12 / 23

Descriptor contribution to factors
Mean Std Auto Percentile values10 25 50 75 90
4. LiquidityWorking capital 0.27 0.07 0.97 0.19 0.21 0.26 0.33 0.37Slack ratio 0.33 0.09 0.96 0.22 0.27 0.32 0.39 0.45Cash ratio 0.04 0.12 0.95 -0.11 -0.06 0.03 0.13 0.20Quick ratio 0.09 0.09 0.92 -0.02 0.02 0.08 0.14 0.21Current ratio -0.05 0.06 0.87 -0.14 -0.10 -0.05 -0.00 0.03Trading liquidity 0.32 0.09 0.98 0.18 0.25 0.34 0.38 0.41
8. MomentumMomentum 1Y 0.60 0.14 0.83 0.42 0.50 0.61 0.69 0.77Momentum 6M 0.40 0.14 0.83 0.23 0.31 0.39 0.50 0.58
c©Liuren Wu (Baruch) Company Valuation 11 Dec 2020 13 / 23
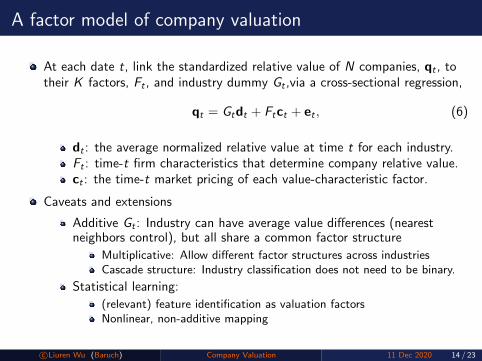
A factor model of company valuation
At each date t, link the standardized relative value of N companies, qt , totheir K factors, Ft , and industry dummy Gt ,via a cross-sectional regression,
qt = Gtdt + Ftct + et , (6)
dt : the average normalized relative value at time t for each industry.Ft : time-t firm characteristics that determine company relative value.ct : the time-t market pricing of each value-characteristic factor.
Caveats and extensions
Additive Gt : Industry can have average value differences (nearestneighbors control), but all share a common factor structure
Multiplicative: Allow different factor structures across industriesCascade structure: Industry classification does not need to be binary.
Statistical learning:
(relevant) feature identification as valuation factorsNonlinear, non-additive mapping
c©Liuren Wu (Baruch) Company Valuation 11 Dec 2020 14 / 23

Model performance
A. Full-sample performance B. In and out-of-sample performance
Full-sample R2 average 68%, reasonably stable across market conditions
Some degeneration during recessions.
Out-of-sample: Divide the sample into two random halves. Estimate therelation on one half; measure performance on the other out-of-sample half.
Mild out-of-sample degeneration: 65% out-of-sample v. 68% in-sample
What’s the right out-of-sample setting/performance metric?
c©Liuren Wu (Baruch) Company Valuation 11 Dec 2020 15 / 23

Market pricing of valuation factorsProfit and growth Investment and liquidity
Leverage and beta Size and momentum
Profit, growth, investment, liquidity have positive and stable contributions.
Momentum is another estimator for growth.
Contributions from leverage and beta are small, and compensate each other– intricate interactions between risk, growth, and profitability ...
Size effect is negative, declining marginal benefit of investment?c©Liuren Wu (Baruch) Company Valuation 11 Dec 2020 16 / 23

How do market pricing and performance vary over time?
Rate TS CS Vol Value Profitability Growth Leverage R2
Market pricing of valuation factorsProfitability 0.32 ( 0.25 ) 0.91 ( 2.40 ) -0.33 ( 0.73 ) -0.15 ( 0.25 ) -2.36 ( 2.62 ) -3.06 ( 2.24 ) 0.43 ( 1.13 ) -1.65 ( 1.85 ) 0.15Growth -1.84 ( 1.54 ) -1.07 ( 2.58 ) 0.84 ( 2.00 ) 0.04 ( 0.07 ) 3.24 ( 4.12 ) 1.21 ( 3.07 ) 0.56 ( 1.71 ) -0.51 ( 0.83 ) 0.14Investment -0.24 ( 0.42 ) 0.50 ( 1.28 ) -1.54 ( 3.53 ) 0.92 ( 1.71 ) -1.73 ( 2.36 ) 1.16 ( 1.39 ) 0.03 ( 0.04 ) 0.22 ( 0.32 ) 0.06Liquidity 0.90 ( 1.75 ) 0.32 ( 0.58 ) -0.52 ( 1.26 ) 0.42 ( 1.04 ) -0.24 ( 0.43 ) 1.23 ( 3.49 ) 0.34 ( 0.99 ) 0.64 ( 1.25 ) 0.05Leverage 1.03 ( 1.94 ) -0.09 ( 0.26 ) 0.24 ( 0.60 ) 0.49 ( 1.48 ) -4.04 ( 8.65 ) 0.65 ( 3.25 ) 0.49 ( 1.09 ) 0.14 ( 0.28 ) 0.21Market risk -1.64 ( 1.43 ) 0.31 ( 0.34 ) -0.17 ( 0.20 ) 2.63 ( 3.96 ) 6.37 ( 6.19 ) -0.88 ( 2.58 ) -1.02 ( 2.26 ) -0.38 ( 0.51 ) 0.17Size 0.34 ( 0.68 ) -0.44 ( 1.40 ) -0.66 ( 1.83 ) 0.28 ( 0.59 ) -0.84 ( 1.64 ) -1.14 ( 4.05 ) 0.03 ( 0.04 ) -0.64 ( 0.98 ) 0.05Momentum 2.30 ( 1.96 ) -0.67 ( 1.29 ) 1.61 ( 1.93 ) 1.39 ( 2.45 ) 3.42 ( 3.86 ) 0.97 ( 1.58 ) -0.01 ( 0.04 ) 0.10 ( 0.14 ) 0.08
Valuation model explanatory powerPerformance -1.25 ( 2.38 ) -0.42 ( 1.70 ) -0.11 ( 0.44 ) -0.27 ( 0.78 ) 3.15 ( 6.41 ) -0.55 ( 2.26 ) 0.09 ( 0.28 ) -0.02 ( 0.04 ) 0.19
hard to draw clear conclusions yet, but worth more research ...What are the market condition metrics that affect the pricing of differentfactors the most? Why?
The cross-sectional model defines “fairness” as fitting the average at thattime — What is actual is rationalHow to define and test the “fairness” of the pricing of each valuation factor?
c©Liuren Wu (Baruch) Company Valuation 11 Dec 2020 17 / 23

Applications
Relative value decomposition:qt = Gtdt + Ftct + et , qt = Gt dt + Ft ct , qt = qt + et
qt — relative value, qt — fair value, et — misvalue
Outside investors can use the model to identify misvaluation as investmentopportunities — the definition of value investing
Profit-seeking trades can make previously-identified return predictingrelations disappear, but will make a valuation model “more accurate.”
Internal management can use the model in its corporate decisions:
Dynamic capital structure rebalancing: Increase debt/buy back stockwhen fair equity value appreciates
Should we compute dynamic hedging ratios on actual value or fairvalue of a contract?
Market-timing: Issue more stocks when stocks are over-valued — theopposite direction of rebalancing: risk on v risk off
Fair/mis-value effects on investments, merger and acquisitions, stocktakeovers, ...
c©Liuren Wu (Baruch) Company Valuation 11 Dec 2020 18 / 23
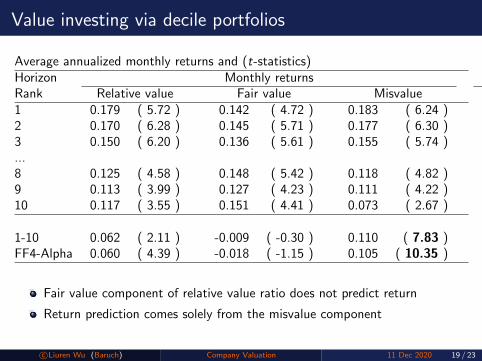
Value investing via decile portfolios
Average annualized monthly returns and (t-statistics)Horizon Monthly returns Quarterly returnsRank Relative value Fair value Misvalue Relative value Fair value Misvalue1 0.179 ( 5.72 ) 0.142 ( 4.72 ) 0.183 ( 6.24 ) 0.165 ( 5.85 ) 0.145 ( 5.37 ) 0.157 ( 6.80 )2 0.170 ( 6.28 ) 0.145 ( 5.71 ) 0.177 ( 6.30 ) 0.165 ( 6.60 ) 0.140 ( 6.25 ) 0.154 ( 6.92 )3 0.150 ( 6.20 ) 0.136 ( 5.61 ) 0.155 ( 5.74 ) 0.142 ( 6.74 ) 0.134 ( 6.41 ) 0.146 ( 6.73 )...8 0.125 ( 4.58 ) 0.148 ( 5.42 ) 0.118 ( 4.82 ) 0.120 ( 5.41 ) 0.132 ( 5.96 ) 0.121 ( 5.98 )9 0.113 ( 3.99 ) 0.127 ( 4.23 ) 0.111 ( 4.22 ) 0.110 ( 4.62 ) 0.120 ( 4.75 ) 0.110 ( 5.14 )10 0.117 ( 3.55 ) 0.151 ( 4.41 ) 0.073 ( 2.67 ) 0.117 ( 3.65 ) 0.138 ( 4.27 ) 0.084 ( 3.53 )
1-10 0.062 ( 2.11 ) -0.009 ( -0.30 ) 0.110 ( 7.83 ) 0.048 ( 1.44 ) 0.007 ( 0.19 ) 0.073 ( 5.27 )FF4-Alpha 0.060 ( 4.39 ) -0.018 ( -1.15 ) 0.105 ( 10.35 ) 0.041 ( 2.63 ) 0.000 ( 0.01 ) 0.064 ( 6.74 )
Fair value component of relative value ratio does not predict return
Return prediction comes solely from the misvalue component
c©Liuren Wu (Baruch) Company Valuation 11 Dec 2020 19 / 23
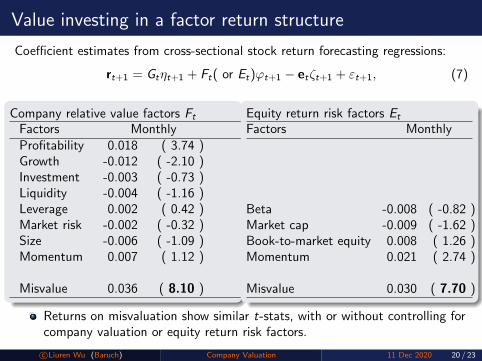
Value investing in a factor return structure
Coefficient estimates from cross-sectional stock return forecasting regressions:
rt+1 = Gtηt+1 + Ft( or Et)ϕt+1 − etζt+1 + εt+1, (7)
Company relative value factors Ft
Factors Monthly QuarterlyProfitability 0.018 ( 3.74 ) 0.016 ( 3.16 )Growth -0.012 ( -2.10 ) -0.014 ( -2.24 )Investment -0.003 ( -0.73 ) -0.001 ( -0.19 )Liquidity -0.004 ( -1.16 ) -0.005 ( -1.24 )Leverage 0.002 ( 0.42 ) 0.003 ( 0.76 )Market risk -0.002 ( -0.32 ) 0.001 ( 0.16 )Size -0.006 ( -1.09 ) -0.005 ( -0.96 )Momentum 0.007 ( 1.12 ) 0.009 ( 1.33 )
Misvalue 0.036 ( 8.10 ) 0.024 ( 5.18 )
Equity return risk factors Et
Factors Monthly Quarterly returns
Beta -0.008 ( -0.82 ) -0.005 ( -0.51 )Market cap -0.009 ( -1.62 ) -0.008 ( -1.52 )Book-to-market equity 0.008 ( 1.26 ) 0.009 ( 1.31 )Momentum 0.021 ( 2.74 ) 0.019 ( 2.29 )
Misvalue 0.030 ( 7.70 ) 0.019 ( 4.89 )
Returns on misvaluation show similar t-stats, with or without controlling forcompany valuation or equity return risk factors.
c©Liuren Wu (Baruch) Company Valuation 11 Dec 2020 20 / 23

The role of valuation in equity financing decisions
Equity financing decision: Change from the previous quarter to nextquarter/total asset at valuation date
Misvaluation: de-biased from one-year moving average
Fair value MisvalueNet equity issuance -0.25 ( -2.52 ) 1.91 ( 10.02 )Equity issuance -1.18 ( -3.67 ) 3.77 ( 8.28 )Equity purchase 0.38 ( 5.92 ) -0.92 ( -7.81 )Issuance-purchase -1.38 ( -4.78 ) 4.41 ( 9.64 )
Effects of misvaluation: Strong and consistent across both net and separateissuance/purchase measures.
Issue more, purchase less when stocks are over-valued.
Effects of fair valuation: strong and opposite
Issue less, purchase more equity when the fair value becomes higher.
c©Liuren Wu (Baruch) Company Valuation 11 Dec 2020 21 / 23
Dynamic rebalancing v. market timing
Equity issuance/purchase can be used to serve two different purposes:
Dynamic rebalancing toward a leverage target
When MC/relative value increases, the company’s leverage declines.To rebalance toward its original leverage target, the firm needs toincrease its leverage and can do so via stock repurchase.Dynamic rebalancing can remove a lot risk without many contracts,wins Scholes/Merton a Nobel in hedging derivatives risk, and can be agood guide for corporate policy to the extent transactions are possible
Market timing to benefit from misvlauation
When market cap (and hence relative value) is higher than fair, thefirm can take advantage of the misvaluation opportunity by issuingmore equities at the higher-than-fair valuation.This market-timing operation makes the firm deviate further from itsleverage target (original leverage level) — (α/β) trade-off
Our results show that the rebalancing operation dominates when the relativevalue variation is fair and is hence more permanent.
The market timing operation dominates when the relative value variation isdriven by temporary misvaluation.
Net issuance depends positively on idiosyncratic relative value.c©Liuren Wu (Baruch) Company Valuation 11 Dec 2020 22 / 23

Concluding remarks
We strive to build a statistical company valuation factor model structurethat can be applied to a large universe
A detailed DCF projection needs domain expertise and works betterwith a singular focus on a selected number of companies.
The statistical valuation approach benefits from a large sample size formore robust estimation.
The two complement each other, and can help each other.
The valuation factor structure is analogous to the stock return factor modelstructure that has been widely adopted/commercialized in the industry.
The two factor models serve very much different objectives:One for valuation; the other for risk attribution.
The valuation factor model structure is much stronger, much more stable,and much better positioned to benefit from the many new statistical andstructural developments
and can be the starting point for investment, financial service, andcorporate policy analysis
A lot more can be done on target construction, feature selection, estimationsetting, performance metrics...c©Liuren Wu (Baruch) Company Valuation 11 Dec 2020 23 / 23