Embed Size (px)
Citation preview
Toward a Better Understanding of the Hispanic Paradox*
Robert A. Hummer University of Texas at Austin
*Presentation given to the Department of Sociology, University of Nebraska, March 1, 2013
Aims of Current Talk
! Produce independent (from NVSS) estimates of Hispanic adult mortality and life expectancy (e50)
! Examine key factors that help differentiate Hispanic adult mortality patterns from non-Hispanic blacks and whites
! Move beyond mortality to examine how important Hispanic health outcomes (chronic conditions, disability) correspond with those of mortality
! Discuss concerns looking ahead and future research implications
Population Research Center The University of Texas at Austin
Motivation for Study
! Continued (methodological and substantive) debate regarding the “Hispanic Paradox”: greater Hispanic-to-white than Hispanic-to-black similarity in mortality and health profiles despite Hispanic levels of education and income that are much closer to those of blacks than whites
** Largely spurred by prominent papers published by Palloni and colleagues **
! Publication of 1st official Hispanic life tables (Arias 2010)
! Rapid growth and substantial socioeconomic disadvantage of Hispanic population; concern regarding their future health and mortality prospects
Population Research Center The University of Texas at Austin
Population Research Center The University of Texas at Austin
! Palloni & Morenoff (2001) criticize work on “…the so-called ‘Hispanic Paradox,’” which they call a “remarkably slippery idea, a moving target of sorts that refers to a number of different things:” ! Outcomes of interest ! Target populations ! Comparison populations
! Result is many possible contrasts across target populations, comparison populations, and outcomes of interest that have muddied this literature
Framing the Debate
Population Research Center The University of Texas at Austin
! Palloni & Arias (2004) later argue they solved the Hispanic Mortality Paradox: it’s only true among FB Hispanics and mostly because of poor data (shallow age gradient of mortality for FB Mexicans indicates “salmon bias”)
- Not true among US-born Hispanics??? Absolutely incorrect on this point… - “Salmon Bias” major finding countered by Turra/ Elo; Hummer et al.; Van Hook and colleagues - Their shallow age gradient for FB Mexicans could have been a result of high mortality using thin/shaky data at young (35-49) ages
Enhanced version of the same data (NHIS-LMF) used here to take a fresh look at mortality patterns; ages 50+
Framing the Debate, con’d
Population Research Center The University of Texas at Austin
Defining the Hispanic Paradox
Markides & Coreil (1986): “The health status of Hispanics… is much more similar to the health status of other whites than that of blacks although socioeconomically, the status of Hispanics is closer to that of blacks… Factors explaining the relative advantages or disadvantages of Hispanics include cultural practices, family supports, selective migration, diet, and genetic heritage.”
Populations and Outcomes of Interest ! Adults aged 50 and above; all analyses sex-specific. Use mortality
data from NHIS-LMF and health data from HRS (and MHAS) ! Foreign-born Hispanic adults: anyone self-identifying (or family-
identified) as Hispanic or Latino/a in the data sets being used who also self-identifies as being born outside of the US or in Puerto Rico
! US-born Hispanic adults: anyone self-identifying (or family-identified) as Hispanic or Latino/a in the data sets being used who reports being born in the US, excluding Puerto Rico
! Comparison groups: self-identified, US-born non-Hispanic blacks and non-Hispanic whites
! Outcomes: 1) mortality following inclusion in a major US survey; some attention to cause-specific mortality 2) self-reported specific chronic conditions 3) self-reported limitations in Activities of Daily Living (one or more reported ADLs)
Population Research Center The University of Texas at Austin
Markides & Eschbach (2011): Continued Support for the Hispanic Paradox
! Based on their review of most recent studies, they report that “the majority of evidence continues to support a Hispanic mortality advantage” and that “immigrant selection remains the most viable explanation”
But they also say…
! Data concerns remain ! Health behavior explanations don’t seem to be the answer ! The role of SES for Hispanic health/mortality remains unclear ! Some studies suggest that Hispanics may live longer than
non-Hispanic whites but with more disability and poorer health ……. Today’s talk is focused on these 4 issues.
Population Research Center The University of Texas at Austin
Addressing Data Concerns
! Aim 1: Produce independent estimates of Hispanic adult mortality rates and life expectancy (e50)
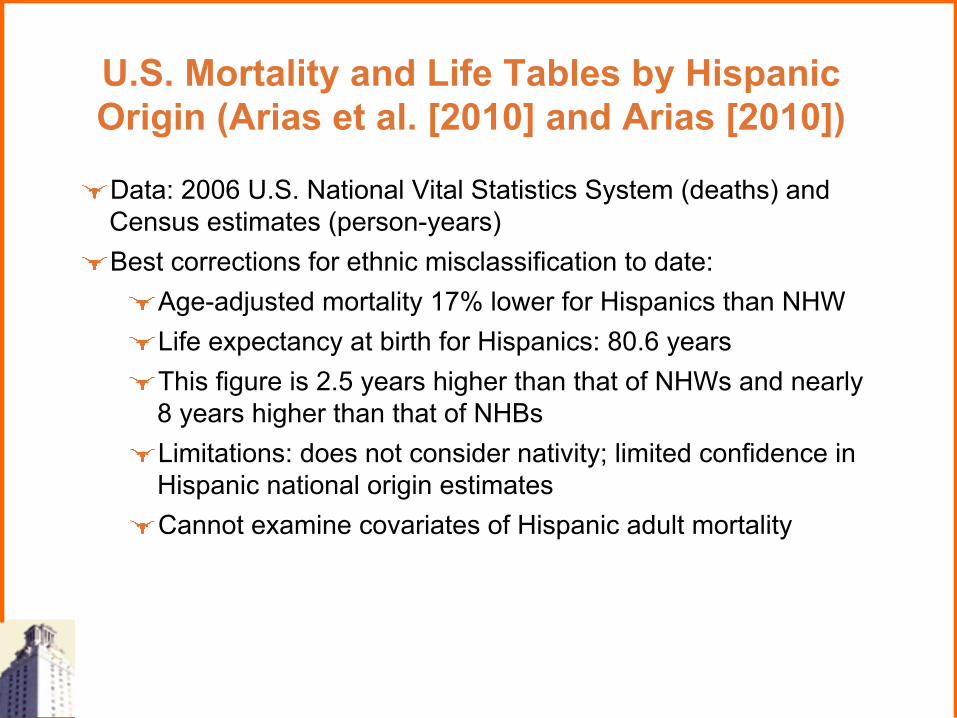
U.S. Mortality and Life Tables by Hispanic Origin (Arias et al. [2010] and Arias [2010])
! Data: 2006 U.S. National Vital Statistics System (deaths) and
Census estimates (person-years) ! Best corrections for ethnic misclassification to date:
! Age-adjusted mortality 17% lower for Hispanics than NHW ! Life expectancy at birth for Hispanics: 80.6 years ! This figure is 2.5 years higher than that of NHWs and nearly
8 years higher than that of NHBs ! Limitations: does not consider nativity; limited confidence in
Hispanic national origin estimates ! Cannot examine covariates of Hispanic adult mortality
Population Research Center The University of Texas at Austin
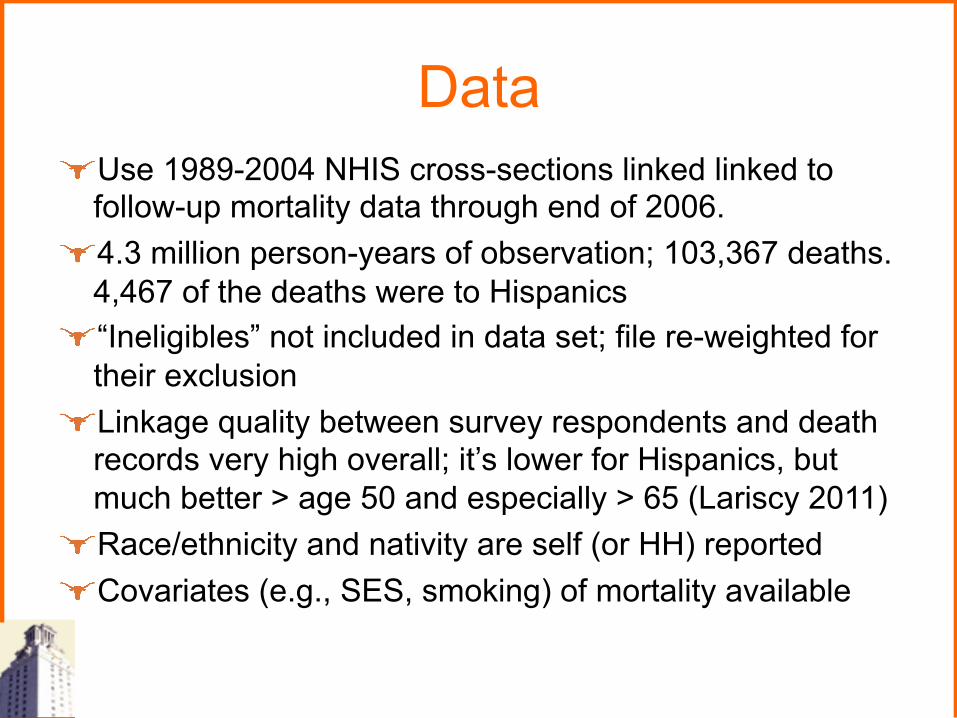
Data ! Use 1989-2004 NHIS cross-sections linked linked to
follow-up mortality data through end of 2006. ! 4.3 million person-years of observation; 103,367 deaths.
4,467 of the deaths were to Hispanics ! “Ineligibles” not included in data set; file re-weighted for
their exclusion ! Linkage quality between survey respondents and death
records very high overall; it’s lower for Hispanics, but much better > age 50 and especially > 65 (Lariscy 2011)
! Race/ethnicity and nativity are self (or HH) reported ! Covariates (e.g., SES, smoking) of mortality available
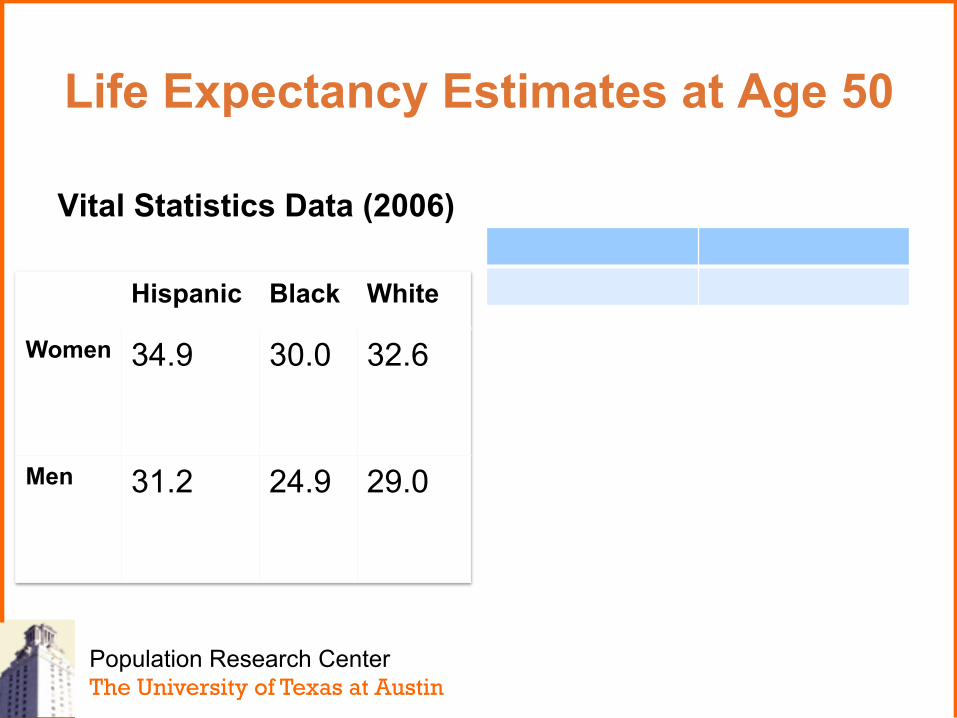
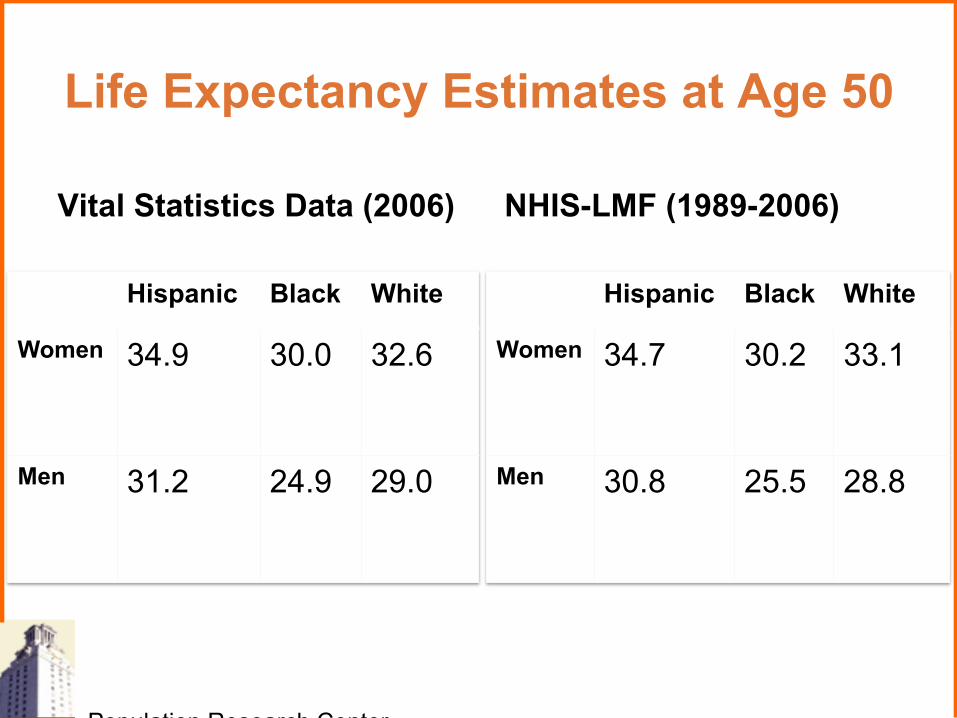
Life Expectancy Estimates at Age 50
Vital Statistics Data (2006)
Hispanic Black White
Women 34.9 30.0 32.6
Men 31.2 24.9
29.0
Population Research Center The University of Texas at Austin
Life Expectancy Estimates at Age 50
Vital Statistics Data (2006)
Hispanic Black White
Women 34.9 30.0 32.6
Men 31.2 24.9
29.0
NHIS-LMF (1989-2006)
Hispanic Black White
Women 34.7 30.2 33.1
Men 30.8 25.5
28.8
Population Research Center The University of Texas at Austin
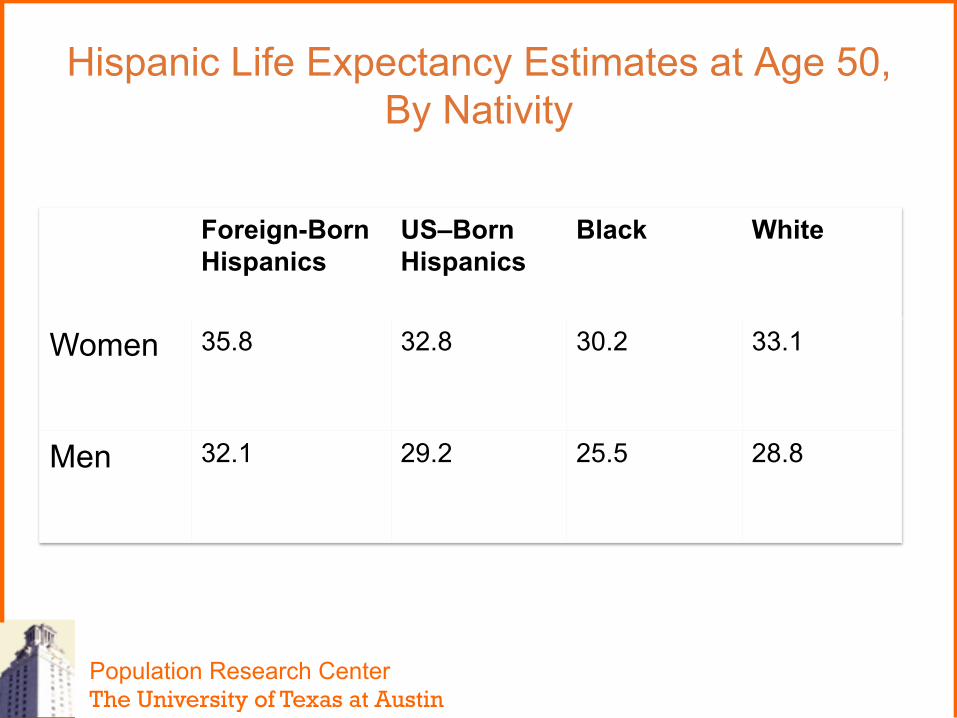
Hispanic Life Expectancy Estimates at Age 50, By Nativity
Foreign-Born Hispanics
US–Born Hispanics
Black White
Women 35.8 32.8 30.2 33.1
Men 32.1 29.2 25.5 28.8
Population Research Center The University of Texas at Austin
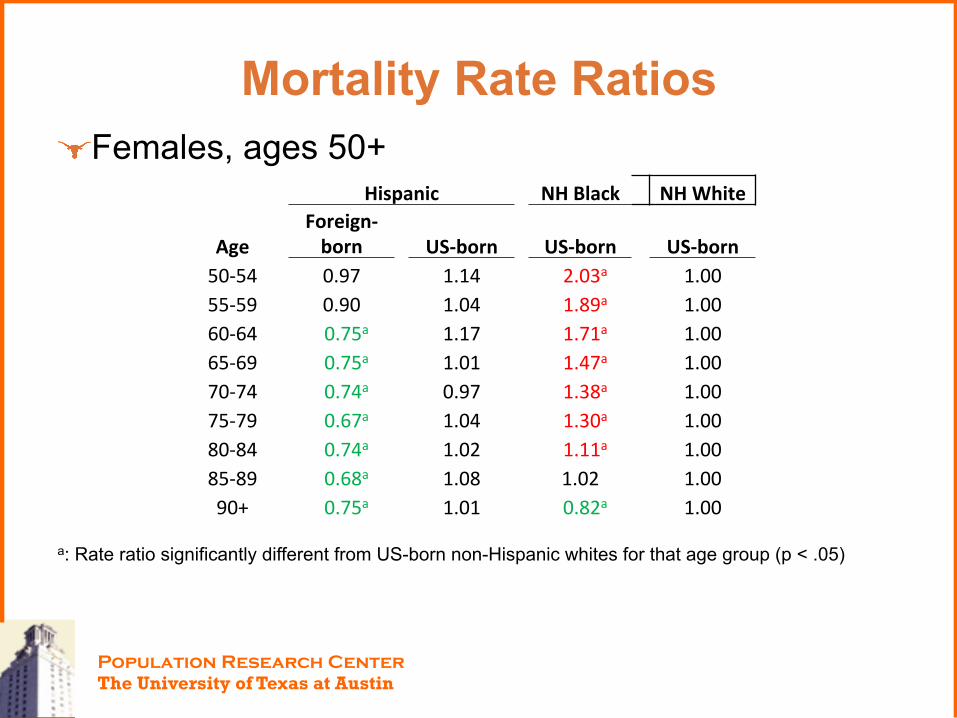
Mortality Rate Ratios ! Females, ages 50+
a: Rate ratio significantly different from US-born non-Hispanic whites for that age group (p < .05)
Hispanic NH Black NH White
Age Foreign-‐born US-‐born US-‐born US-‐born
50-‐54 0.97 1.14 2.03a 1.00 55-‐59 0.90 1.04 1.89a 1.00 60-‐64 0.75a 1.17 1.71a 1.00 65-‐69 0.75a 1.01 1.47a 1.00 70-‐74 0.74a 0.97 1.38a 1.00 75-‐79 0.67a 1.04 1.30a 1.00 80-‐84 0.74a 1.02 1.11a 1.00 85-‐89 0.68a 1.08 1.02 1.00 90+ 0.75a 1.01 0.82a 1.00
Population Research Center The University of Texas at Austin
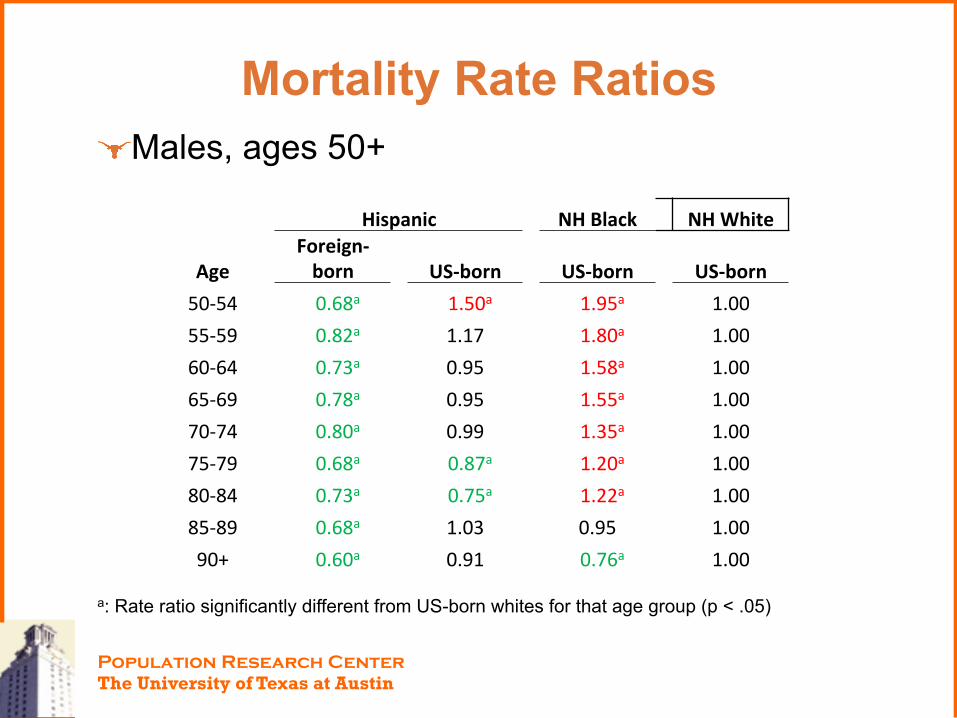
! Males, ages 50+
a: Rate ratio significantly different from US-born whites for that age group (p < .05)
Mortality Rate Ratios
Hispanic NH Black NH White
Age Foreign-‐born US-‐born US-‐born US-‐born
50-‐54 0.68a 1.50a 1.95a 1.00 55-‐59 0.82a 1.17 1.80a 1.00 60-‐64 0.73a 0.95 1.58a 1.00 65-‐69 0.78a 0.95 1.55a 1.00 70-‐74 0.80a 0.99 1.35a 1.00 75-‐79 0.68a 0.87a 1.20a 1.00 80-‐84 0.73a 0.75a 1.22a 1.00 85-‐89 0.68a 1.03 0.95 1.00 90+ 0.60a 0.91 0.76a 1.00
Population Research Center The University of Texas at Austin
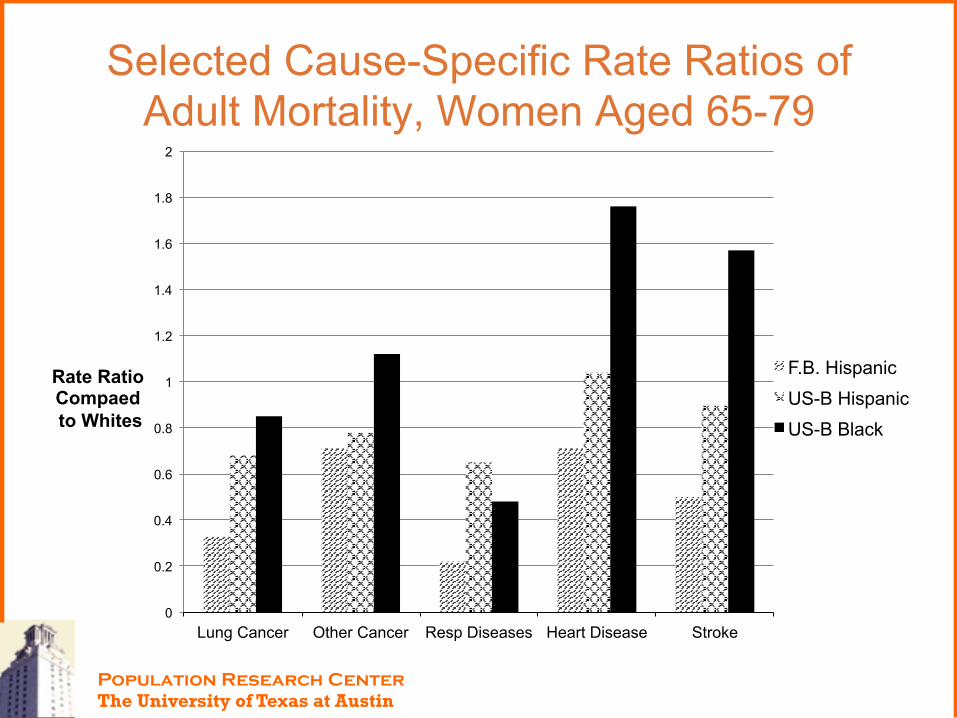
Selected Cause-Specific Rate Ratios of Adult Mortality, Women Aged 65-79
0
0.2
0.4
0.6
0.8
1
1.2
1.4
1.6
1.8
2
Lung Cancer Other Cancer Resp Diseases Heart Disease Stroke
Rate Ratio Compaed to Whites
F.B. Hispanic US-B Hispanic US-B Black
Population Research Center The University of Texas at Austin
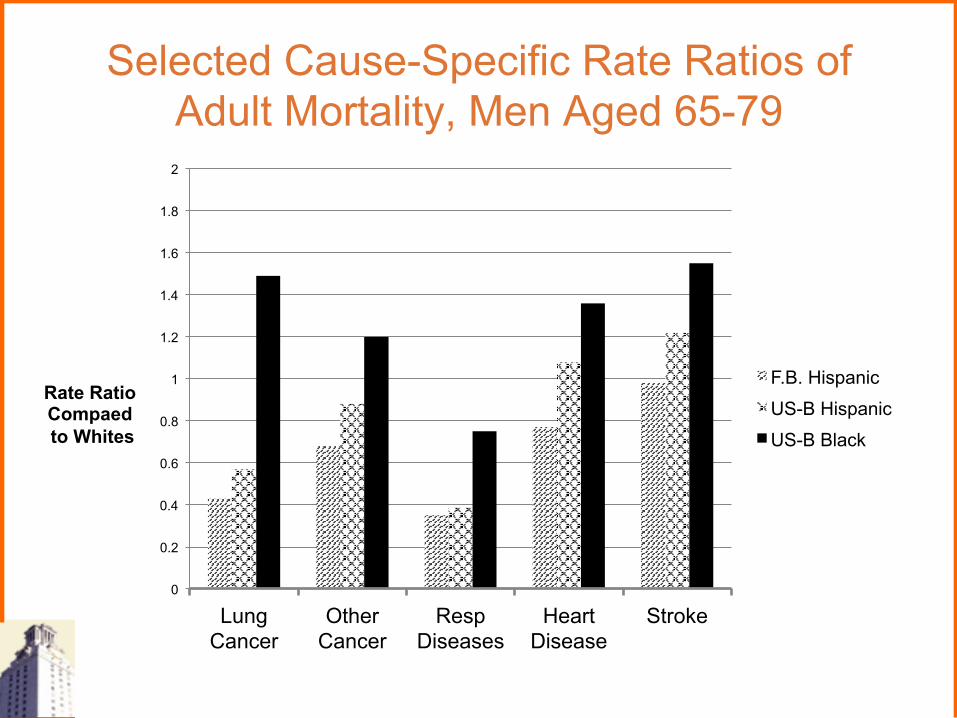
Selected Cause-Specific Rate Ratios of Adult Mortality, Men Aged 65-79
0
0.2
0.4
0.6
0.8
1
1.2
1.4
1.6
1.8
2
Lung Cancer
Other Cancer
Resp Diseases
Heart Disease
Stroke
Rate Ratio Compaed to Whites
F.B. Hispanic
US-B Hispanic
US-B Black
Moving Toward Explanation
Aim 2: Examine key factors that help differentiate Hispanic adult mortality patterns from blacks and whites
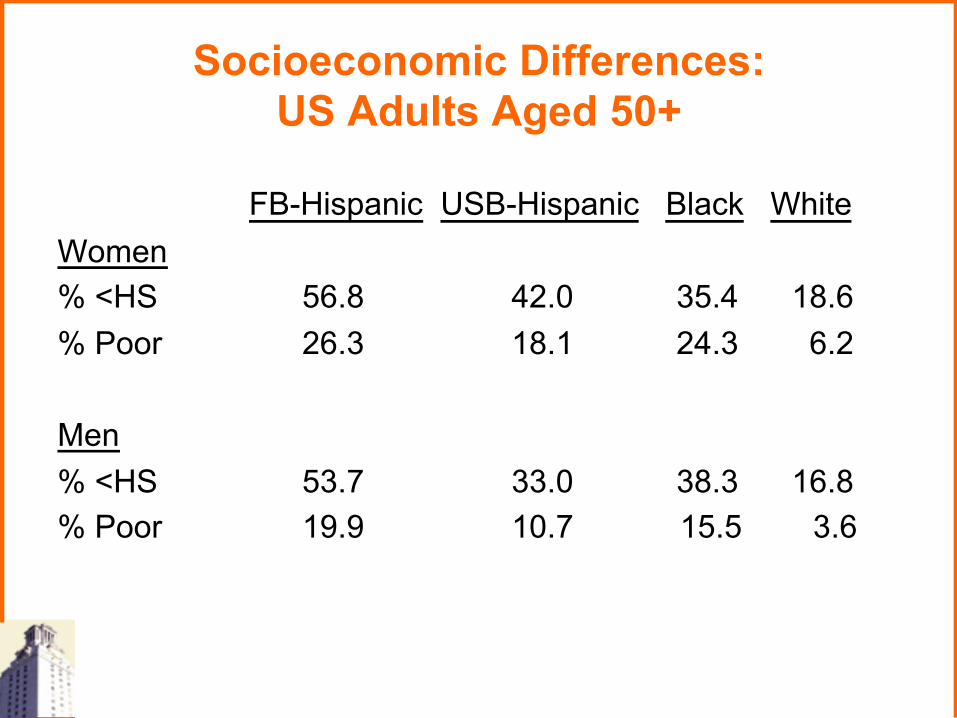
Socioeconomic Differences: US Adults Aged 50+
FB-Hispanic USB-Hispanic Black White Women % <HS 56.8 42.0 35.4 18.6 % Poor 26.3 18.1 24.3 6.2 Men % <HS 53.7 33.0 38.3 16.8 % Poor 19.9 10.7 15.5 3.6
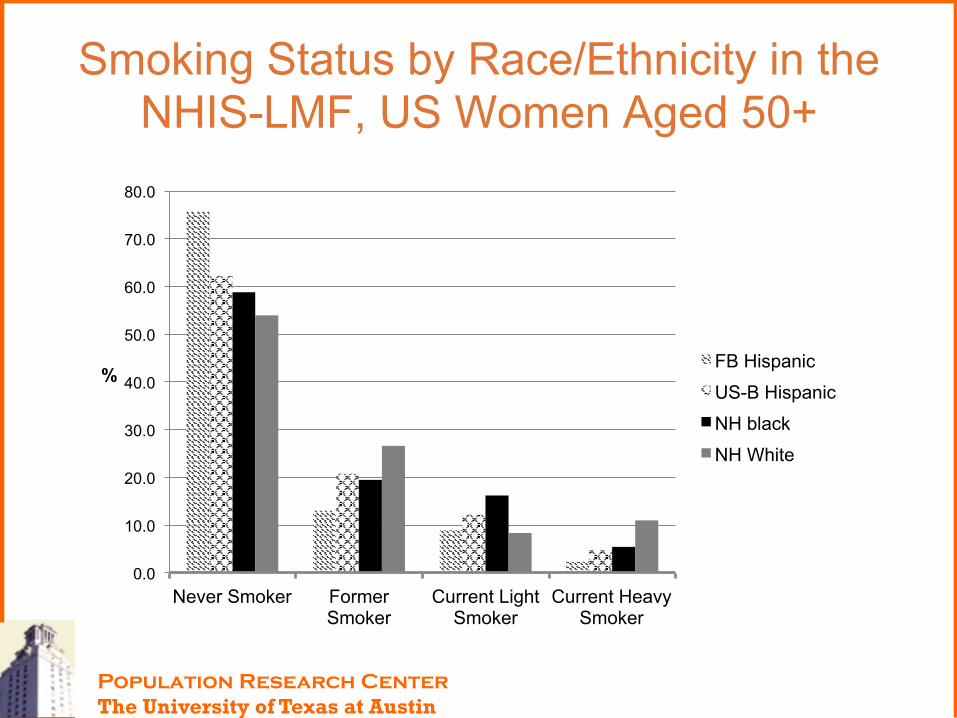
Smoking Status by Race/Ethnicity in the NHIS-LMF, US Women Aged 50+
0.0
10.0
20.0
30.0
40.0
50.0
60.0
70.0
80.0
Never Smoker Former Smoker
Current Light Smoker
Current Heavy Smoker
%
FB Hispanic
US-B Hispanic
NH black
NH White
Population Research Center The University of Texas at Austin
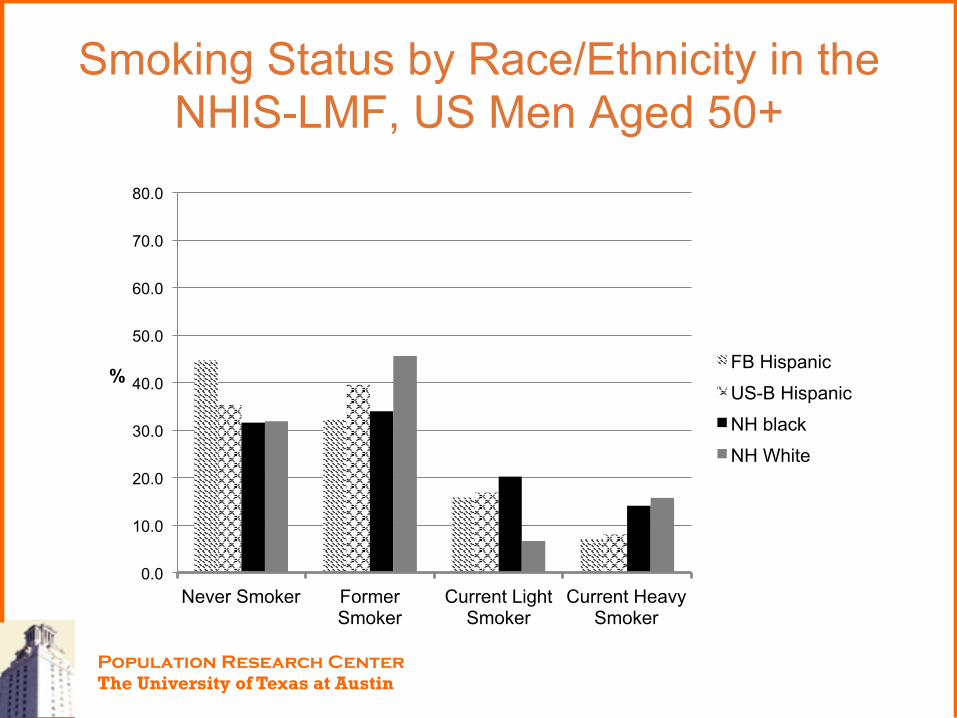
Smoking Status by Race/Ethnicity in the NHIS-LMF, US Men Aged 50+
0.0
10.0
20.0
30.0
40.0
50.0
60.0
70.0
80.0
Never Smoker Former Smoker
Current Light Smoker
Current Heavy Smoker
%
FB Hispanic
US-B Hispanic
NH black
NH White
Population Research Center The University of Texas at Austin
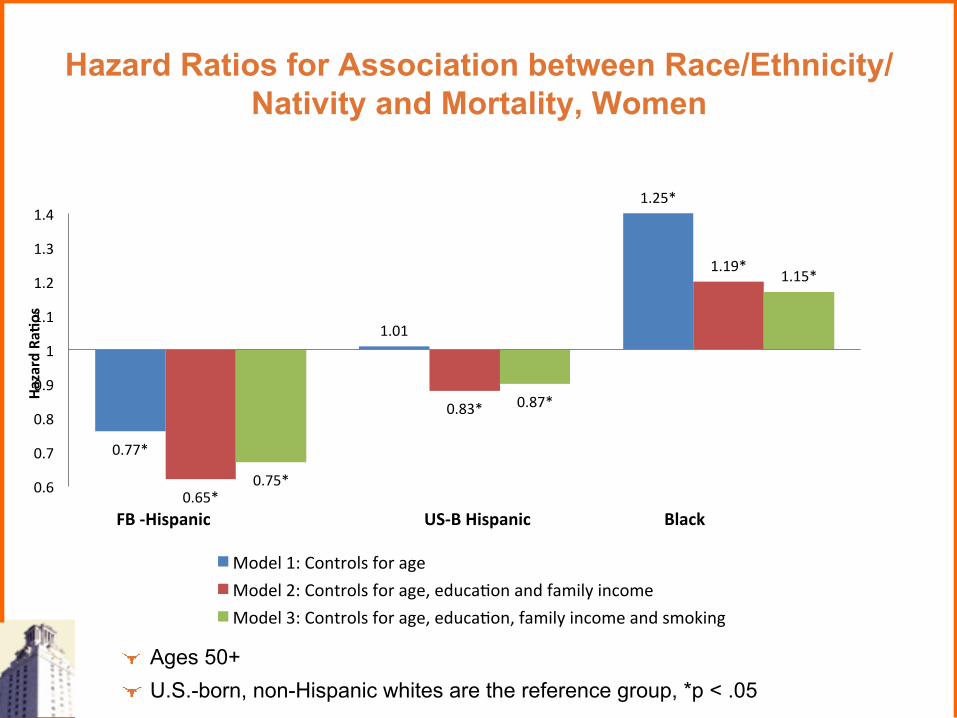
Hazard Ratios for Association between Race/Ethnicity/Nativity and Mortality, Women
! Ages 50+ ! U.S.-born, non-Hispanic whites are the reference group, *p < .05
0.77*
1.01
1.25*
0.65*
0.83*
1.19*
0.75*
0.87*
1.15*
0.6
0.7
0.8
0.9
1
1.1
1.2
1.3
1.4
Hazard Ra=
os
Model 1: Controls for age Model 2: Controls for age, educaAon and family income Model 3: Controls for age, educaAon, family income and smoking
FB -‐Hispanic US-‐B Hispanic Black
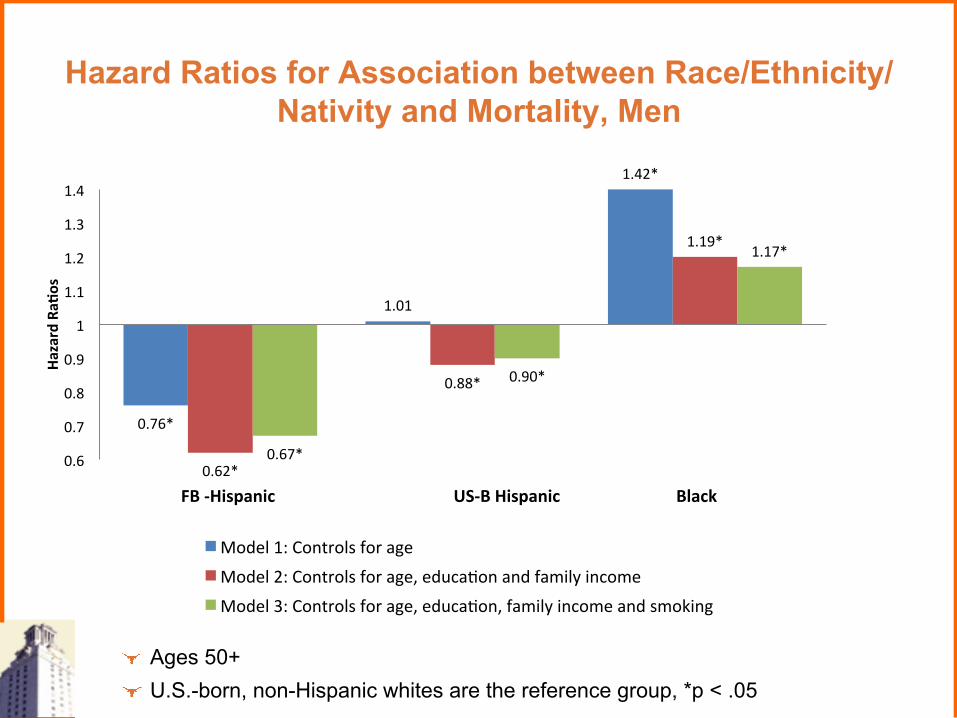
Hazard Ratios for Association between Race/Ethnicity/Nativity and Mortality, Men
! Ages 50+ ! U.S.-born, non-Hispanic whites are the reference group, *p < .05
0.76*
1.01
1.42*
0.62*
0.88*
1.19*
0.67*
0.90*
1.17*
0.6
0.7
0.8
0.9
1
1.1
1.2
1.3
1.4
Hazard Ra=
os
Model 1: Controls for age Model 2: Controls for age, educaAon and family income Model 3: Controls for age, educaAon, family income and smoking
FB -‐Hispanic US-‐B Hispanic Black
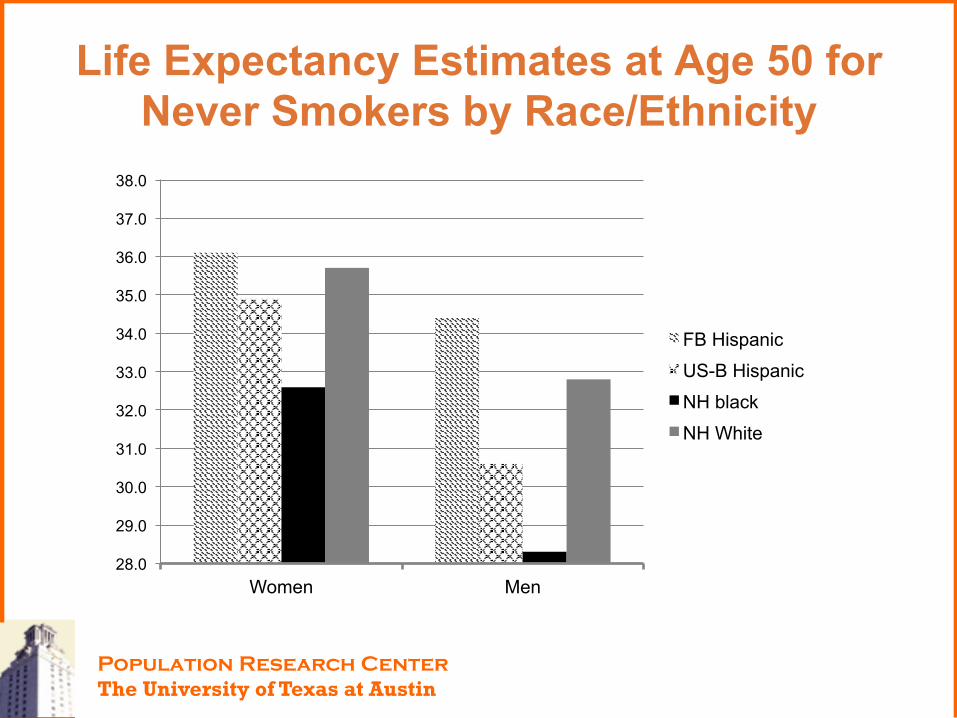
Life Expectancy Estimates at Age 50 for Never Smokers by Race/Ethnicity
28.0
29.0
30.0
31.0
32.0
33.0
34.0
35.0
36.0
37.0
38.0
Women Men
FB Hispanic
US-B Hispanic
NH black
NH White
Population Research Center The University of Texas at Austin
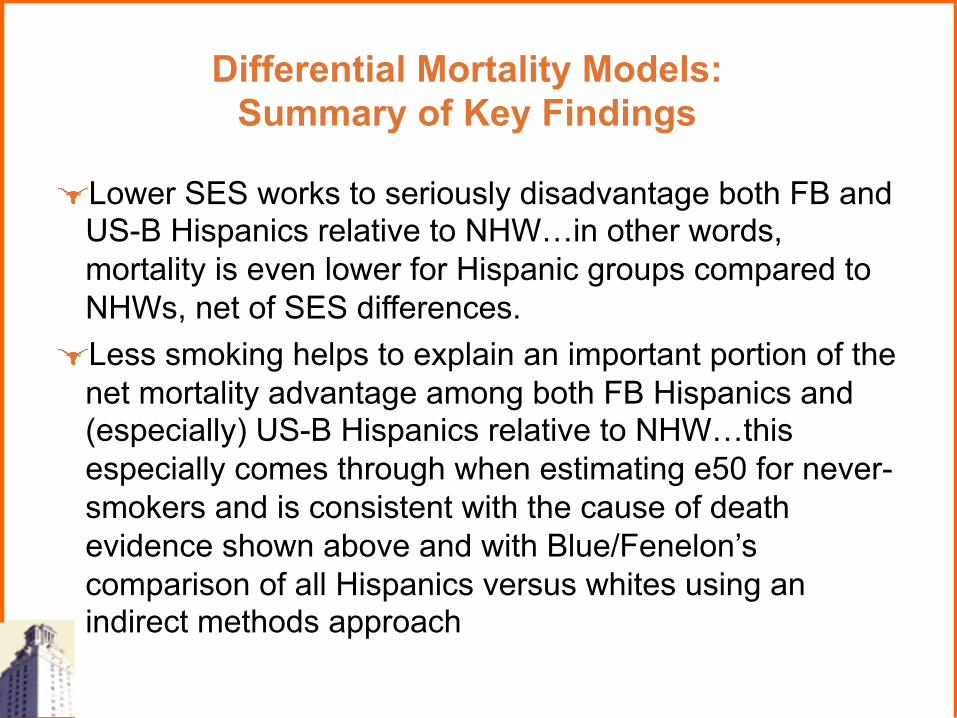
Differential Mortality Models: Summary of Key Findings
! Lower SES works to seriously disadvantage both FB and US-B Hispanics relative to NHW…in other words, mortality is even lower for Hispanic groups compared to NHWs, net of SES differences.
! Less smoking helps to explain an important portion of the net mortality advantage among both FB Hispanics and (especially) US-B Hispanics relative to NHW…this especially comes through when estimating e50 for never-smokers and is consistent with the cause of death evidence shown above and with Blue/Fenelon’s comparison of all Hispanics versus whites using an indirect methods approach
Population Research Center The University of Texas at Austin
Moving Beyond Mortality
! Aim 3: How do important Hispanic health outcomes (chronic conditions, disability) correspond with those of mortality? How can health comparisons between FB Hispanics, US-B Hispanics, blacks, whites, and Mexicans inform the Hispanic Paradox debate?
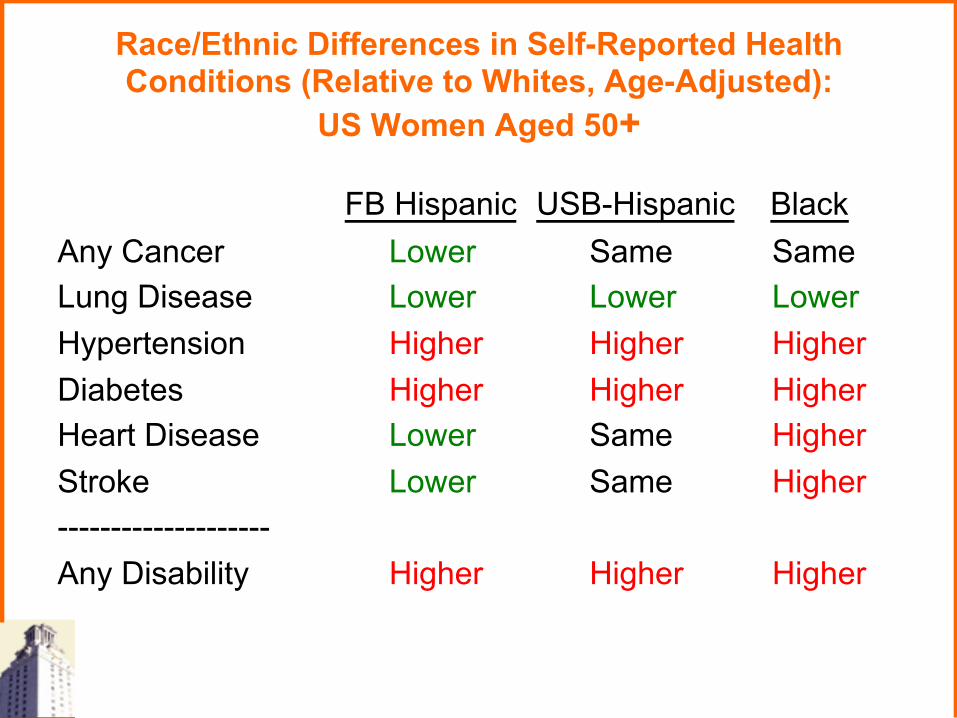
Race/Ethnic Differences in Self-Reported Health Conditions (Relative to Whites, Age-Adjusted):
US Women Aged 50+
FB Hispanic USB-Hispanic Black Any Cancer Lower Same Same Lung Disease Lower Lower Lower Hypertension Higher Higher Higher Diabetes Higher Higher Higher Heart Disease Lower Same Higher Stroke Lower Same Higher -------------------- Any Disability Higher Higher Higher
Race/Ethnic Differences in Self-Reported Health Conditions (Relative to Whites, Age-Adjusted):
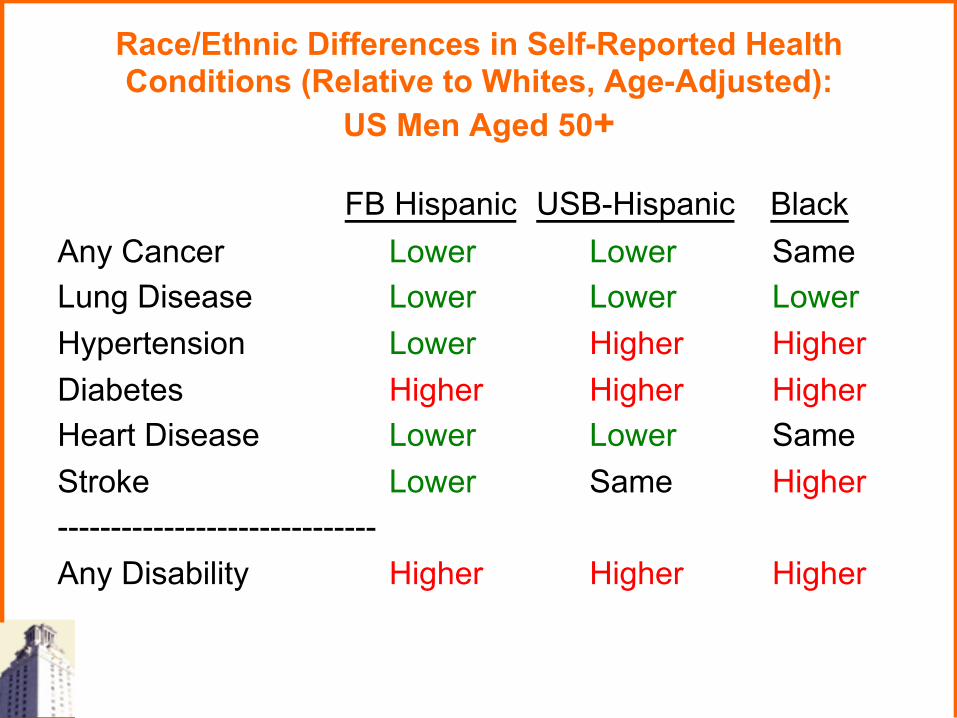
US Men Aged 50+
FB Hispanic USB-Hispanic Black Any Cancer Lower Lower Same Lung Disease Lower Lower Lower Hypertension Lower Higher Higher Diabetes Higher Higher Higher Heart Disease Lower Lower Same Stroke Lower Same Higher ------------------------------ Any Disability Higher Higher Higher
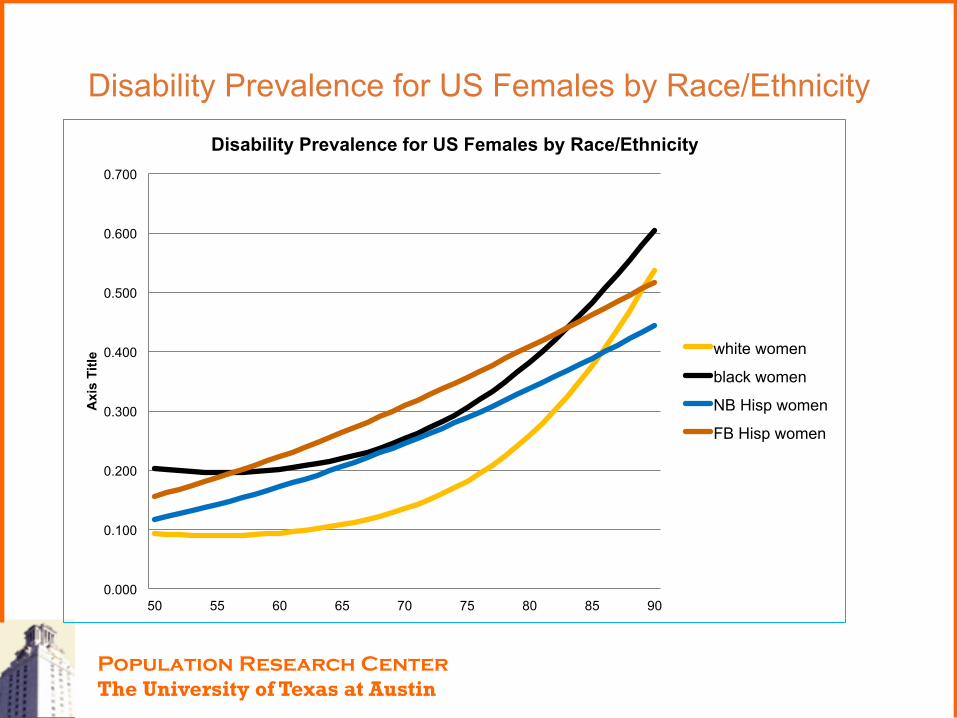
Disability Prevalence for US Females by Race/Ethnicity
0.000
0.100
0.200
0.300
0.400
0.500
0.600
0.700
50 55 60 65 70 75 80 85 90
Axi
s Ti
tle
Disability Prevalence for US Females by Race/Ethnicity
white women
black women
NB Hisp women
FB Hisp women
Population Research Center The University of Texas at Austin
0.000
0.100
0.200
0.300
0.400
0.500
0.600
0.700
50 55 60 65 70 75 80 85 90
Prev
alen
ce
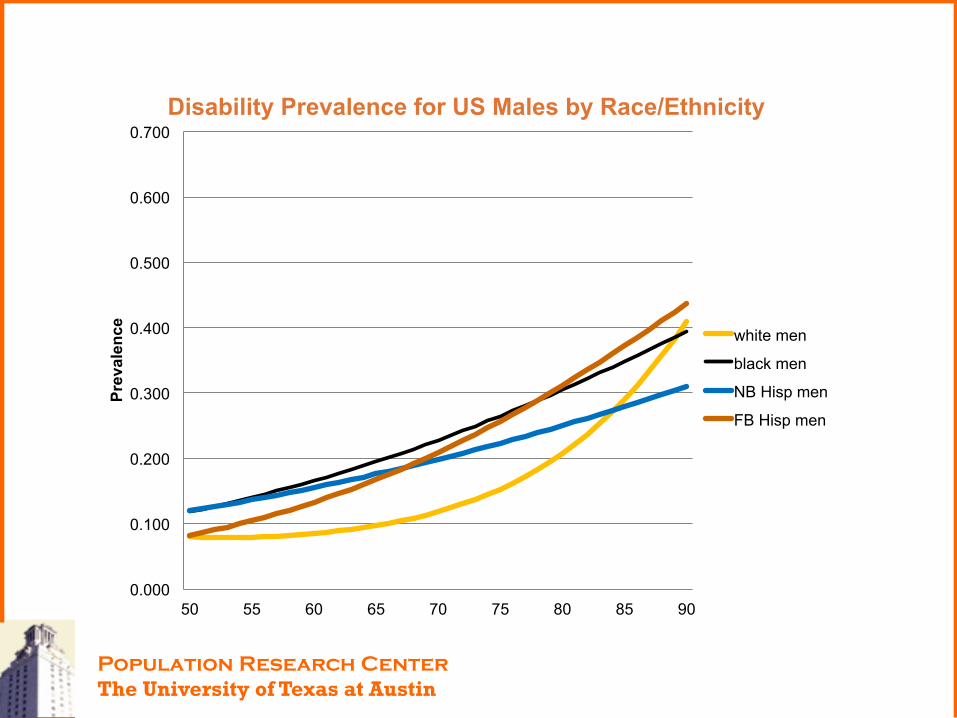
Disability Prevalence for US Males by Race/Ethnicity
white men
black men
NB Hisp men
FB Hisp men
Population Research Center The University of Texas at Austin
MSLT Life Table Approach
! MSLTs allow the integration of mortality and disability information ! Explicit way of assessing whether the Hispanic Paradox in mortality is accompanied by a paradox in disability:
! Does FB Hispanics’ longer life expectancy correspond with a longer healthy life expectancy? ! How does FB and US-B Hispanics’ healthy and disabled LE compare to US blacks and whites?
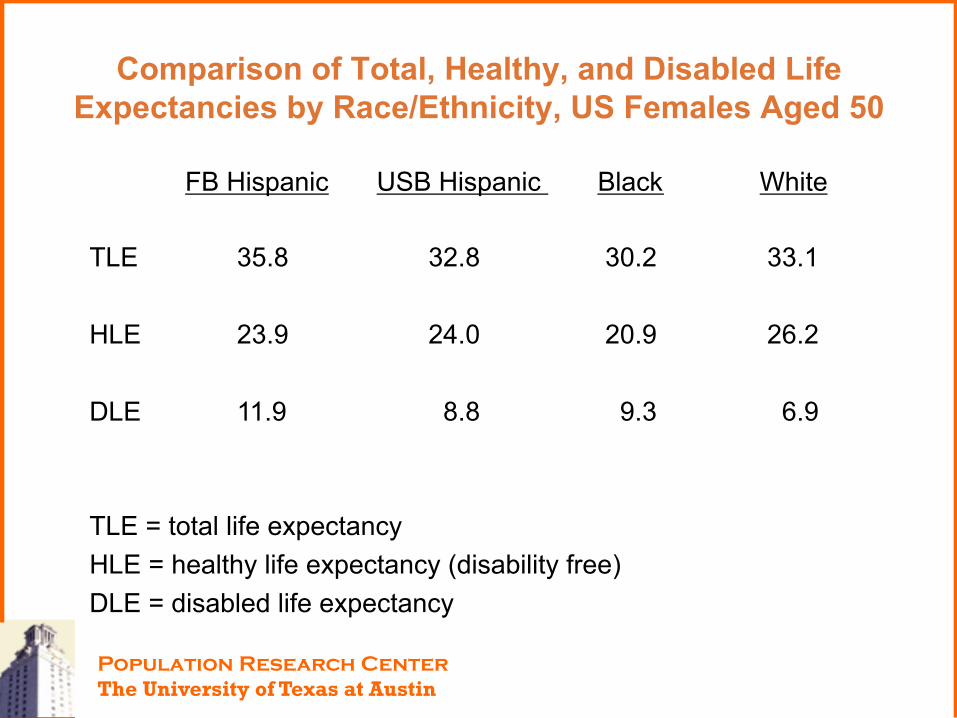
Comparison of Total, Healthy, and Disabled Life Expectancies by Race/Ethnicity, US Females Aged 50
Population Research Center The University of Texas at Austin
FB Hispanic USB Hispanic Black White TLE 35.8 32.8 30.2 33.1 HLE 23.9 24.0 20.9 26.2 DLE 11.9 8.8 9.3 6.9 TLE = total life expectancy HLE = healthy life expectancy (disability free) DLE = disabled life expectancy
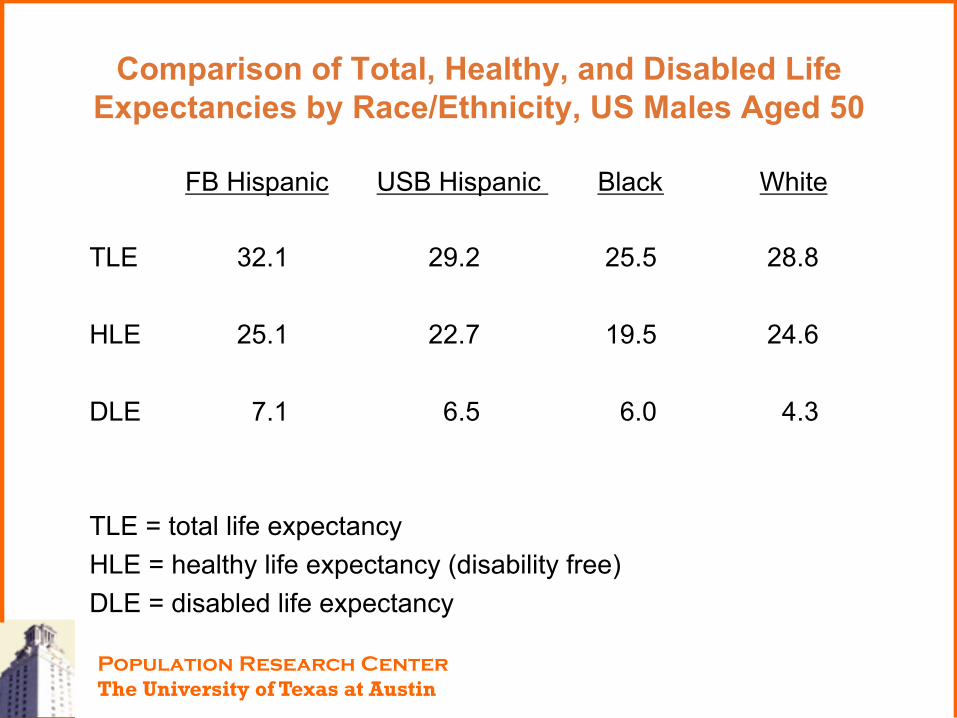
Comparison of Total, Healthy, and Disabled Life Expectancies by Race/Ethnicity, US Males Aged 50
Population Research Center The University of Texas at Austin
FB Hispanic USB Hispanic Black White TLE 32.1 29.2 25.5 28.8 HLE 25.1 22.7 19.5 24.6 DLE 7.1 6.5 6.0 4.3 TLE = total life expectancy HLE = healthy life expectancy (disability free) DLE = disabled life expectancy
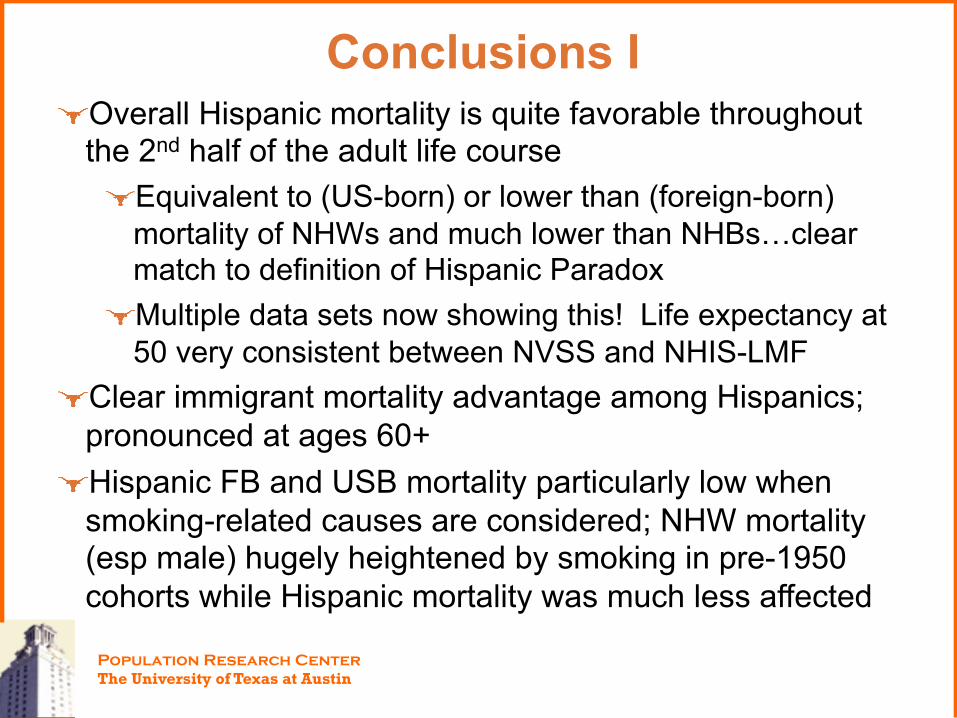
Conclusions I ! Overall Hispanic mortality is quite favorable throughout
the 2nd half of the adult life course ! Equivalent to (US-born) or lower than (foreign-born)
mortality of NHWs and much lower than NHBs…clear match to definition of Hispanic Paradox
! Multiple data sets now showing this! Life expectancy at 50 very consistent between NVSS and NHIS-LMF
! Clear immigrant mortality advantage among Hispanics; pronounced at ages 60+
! Hispanic FB and USB mortality particularly low when smoking-related causes are considered; NHW mortality (esp male) hugely heightened by smoking in pre-1950 cohorts while Hispanic mortality was much less affected
Population Research Center The University of Texas at Austin
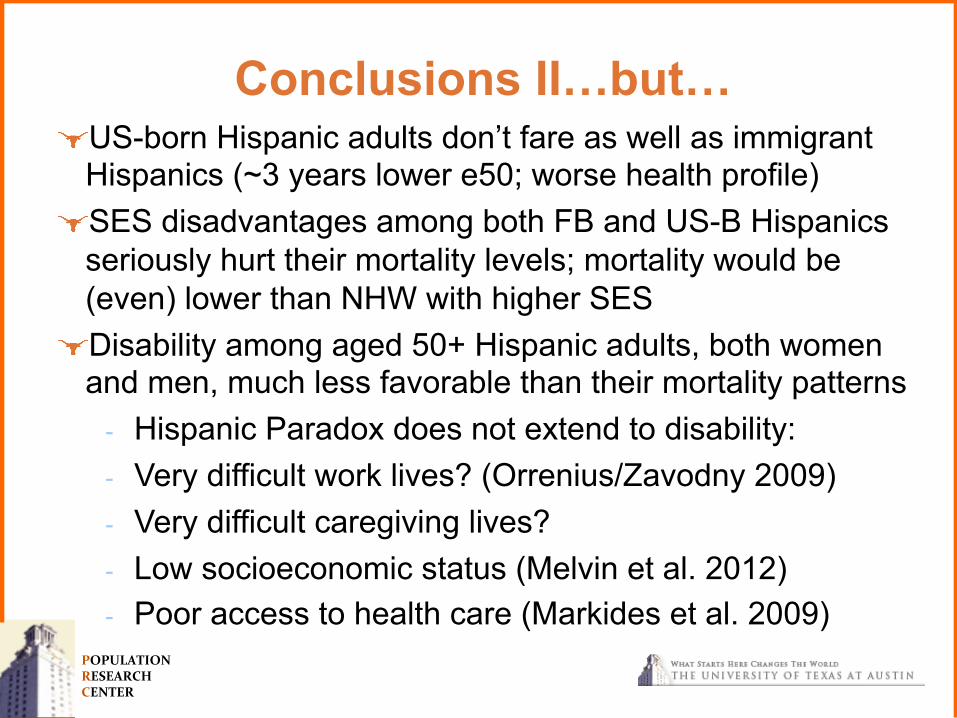
Conclusions II…but…
POPULATION RESEARCH CENTER
! US-born Hispanic adults don’t fare as well as immigrant Hispanics (~3 years lower e50; worse health profile)
! SES disadvantages among both FB and US-B Hispanics seriously hurt their mortality levels; mortality would be (even) lower than NHW with higher SES
! Disability among aged 50+ Hispanic adults, both women and men, much less favorable than their mortality patterns
- Hispanic Paradox does not extend to disability: - Very difficult work lives? (Orrenius/Zavodny 2009) - Very difficult caregiving lives? - Low socioeconomic status (Melvin et al. 2012) - Poor access to health care (Markides et al. 2009)
Research Implications I: Major Challenges and Future Concerns
! Projected more-than-doubling of Hispanic population by 2050; much continued monitoring/work needed. Hispanic population will increasingly become US-born
! Identity shifts at individual level, changing r/e definitions, and migration will continue to make the understanding of Hispanic mortality/health patterns a major challenge
! Heterogeneity among Hispanics – by national origin, legal status, generational status, and race – will need to be addressed…very hard even with the best data sets
! Huge SES gaps between US-born Hispanics and whites – education, income, wealth – not promising for future Hispanic health patterns; life course analyses needed POPULATION RESEARCH CENTER
Research Implications II ! Cohort change analyses desperately needed… signs of
higher young adult mortality among US-born Hispanics…a cohort phenomena and sign of bad trends to come???
! Tobacco use patterns among young adult Hispanics, especially men, look bad…40% of US-born Hispanic young men have used tobacco in last month…highest of any US group. US-born Hispanic females same as whites
! Very high obesity levels among young US-born Hispanics ! Much higher levels of obesity among recent Mexican
immigrants (but also higher education) ! Is the US experience for recent immigrant cohorts worse
than earlier immigrant cohorts? How will the life course effects of undocumented status play out?
POPULATION RESEARCH CENTER
Acknowledgements & Contact Info ! MacArthur Foundation Research Network on an Aging
Society (Jack Rowe, Director) ! Eunice Kennedy Shriver National Institute of Child Health
and Human Development ! Infrastructural grant: 5 R24 HD042849 ! Training grant: 5 T32 HD007081
! Phillip Cantu, Chi-Tsun Chiu, Mark Hayward, Joseph Lariscy, Jennifer Melvin (Population Research Center, University of Texas at Austin); Rebeca Wong (UTMB); Cesar Gonzales (El Colegio de Mexico)
! Contact: [email protected] Population Research Center The University of Texas at Austin