Embed Size (px)
Citation preview

Copyright © 2019 Gallup, Inc. All rights reserved.
Toward a Better Future: Exploring
Outcomes of Attending Career Colleges
and Universities
Copyright © 2019 Gallup, Inc. All rights reserved.
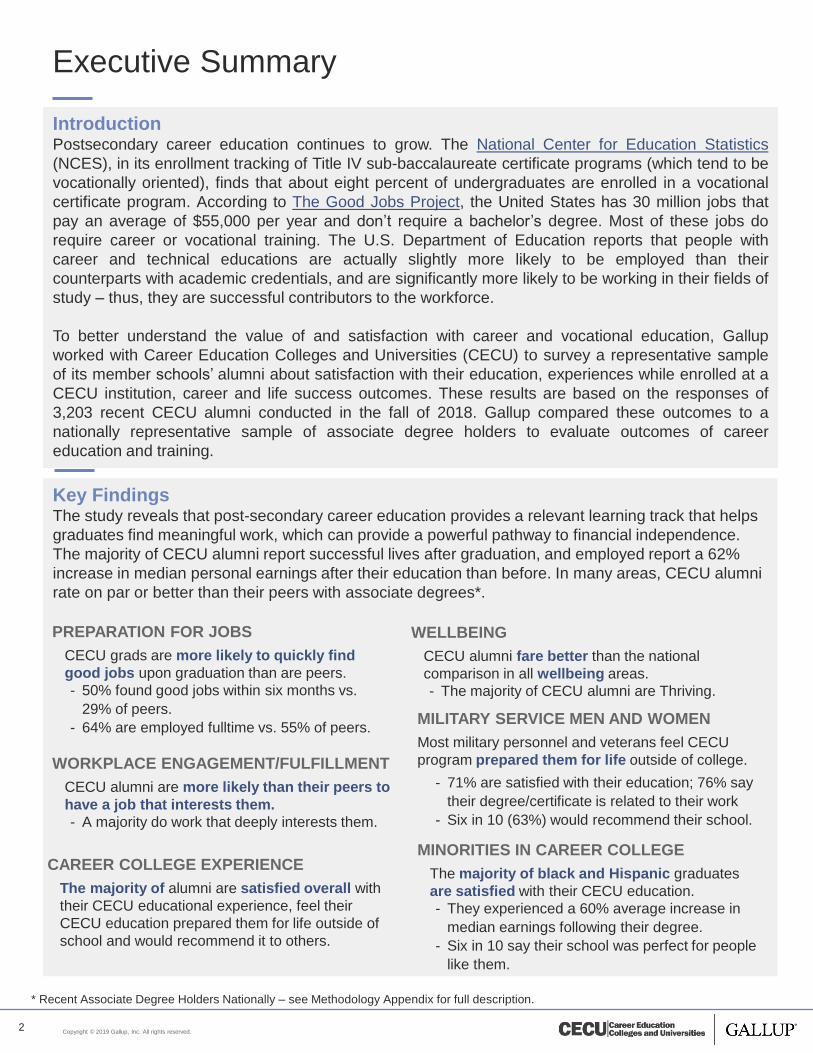
Key FindingsThe study reveals that post-secondary career education provides a relevant learning track that helps
graduates find meaningful work, which can provide a powerful pathway to financial independence.
The majority of CECU alumni report successful lives after graduation, and employed report a 62%
increase in median personal earnings after their education than before. In many areas, CECU alumni
rate on par or better than their peers with associate degrees*.
2
Executive Summary
CAREER COLLEGE EXPERIENCE
The majority of alumni are satisfied overall with
their CECU educational experience, feel their
CECU education prepared them for life outside of
school and would recommend it to others.
PREPARATION FOR JOBS
CECU grads are more likely to quickly find
good jobs upon graduation than are peers.
- 50% found good jobs within six months vs.
29% of peers.
- 64% are employed fulltime vs. 55% of peers.
WORKPLACE ENGAGEMENT/FULFILLMENT
CECU alumni are more likely than their peers to
have a job that interests them.
- A majority do work that deeply interests them.
IntroductionPostsecondary career education continues to grow. The National Center for Education Statistics
(NCES), in its enrollment tracking of Title IV sub-baccalaureate certificate programs (which tend to be
vocationally oriented), finds that about eight percent of undergraduates are enrolled in a vocational
certificate program. According to The Good Jobs Project, the United States has 30 million jobs that
pay an average of $55,000 per year and don’t require a bachelor’s degree. Most of these jobs do
require career or vocational training. The U.S. Department of Education reports that people with
career and technical educations are actually slightly more likely to be employed than their
counterparts with academic credentials, and are significantly more likely to be working in their fields of
study – thus, they are successful contributors to the workforce.
To better understand the value of and satisfaction with career and vocational education, Gallup
worked with Career Education Colleges and Universities (CECU) to survey a representative sample
of its member schools’ alumni about satisfaction with their education, experiences while enrolled at a
CECU institution, career and life success outcomes. These results are based on the responses of
3,203 recent CECU alumni conducted in the fall of 2018. Gallup compared these outcomes to a
nationally representative sample of associate degree holders to evaluate outcomes of career
education and training.
MILITARY SERVICE MEN AND WOMEN
Most military personnel and veterans feel CECU
program prepared them for life outside of college.
- 71% are satisfied with their education; 76% say
their degree/certificate is related to their work
- Six in 10 (63%) would recommend their school.
WELLBEING
CECU alumni fare better than the national
comparison in all wellbeing areas.
- The majority of CECU alumni are Thriving.
MINORITIES IN CAREER COLLEGE
The majority of black and Hispanic graduates
are satisfied with their CECU education.
- They experienced a 60% average increase in
median earnings following their degree.
- Six in 10 say their school was perfect for people
like them.
* Recent Associate Degree Holders Nationally – see Methodology Appendix for full description.
Copyright © 2019 Gallup, Inc. All rights reserved.3
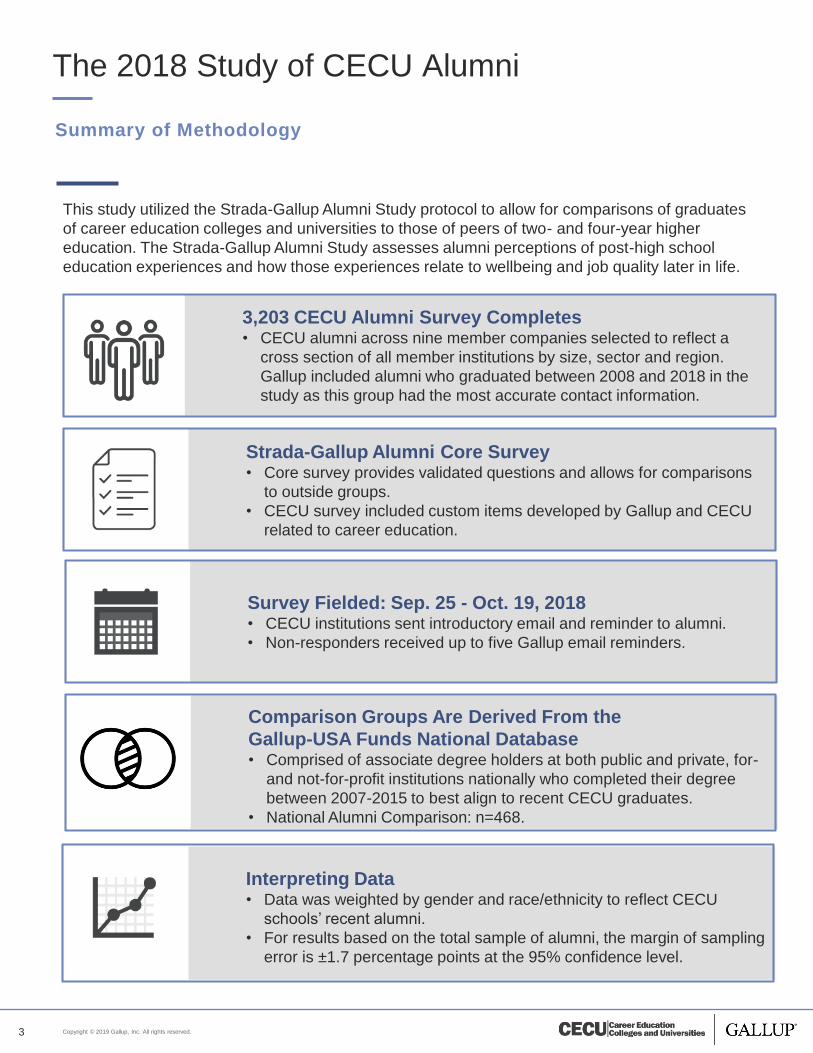
The 2018 Study of CECU Alumni
Summary of Methodology
3,203 CECU Alumni Survey Completes• CECU alumni across nine member companies selected to reflect a
cross section of all member institutions by size, sector and region.
Gallup included alumni who graduated between 2008 and 2018 in the
study as this group had the most accurate contact information.
Strada-Gallup Alumni Core Survey• Core survey provides validated questions and allows for comparisons
to outside groups.
• CECU survey included custom items developed by Gallup and CECU
related to career education.
Survey Fielded: Sep. 25 - Oct. 19, 2018• CECU institutions sent introductory email and reminder to alumni.
• Non-responders received up to five Gallup email reminders.
Comparison Groups Are Derived From the
Gallup-USA Funds National Database • Comprised of associate degree holders at both public and private, for-
and not-for-profit institutions nationally who completed their degree
between 2007-2015 to best align to recent CECU graduates.
• National Alumni Comparison: n=468.
This study utilized the Strada-Gallup Alumni Study protocol to allow for comparisons of graduates
of career education colleges and universities to those of peers of two- and four-year higher
education. The Strada-Gallup Alumni Study assesses alumni perceptions of post-high school
education experiences and how those experiences relate to wellbeing and job quality later in life.
Interpreting Data• Data was weighted by gender and race/ethnicity to reflect CECU
schools’ recent alumni.
• For results based on the total sample of alumni, the margin of sampling
error is ±1.7 percentage points at the 95% confidence level.
Copyright © 2019 Gallup, Inc. All rights reserved.
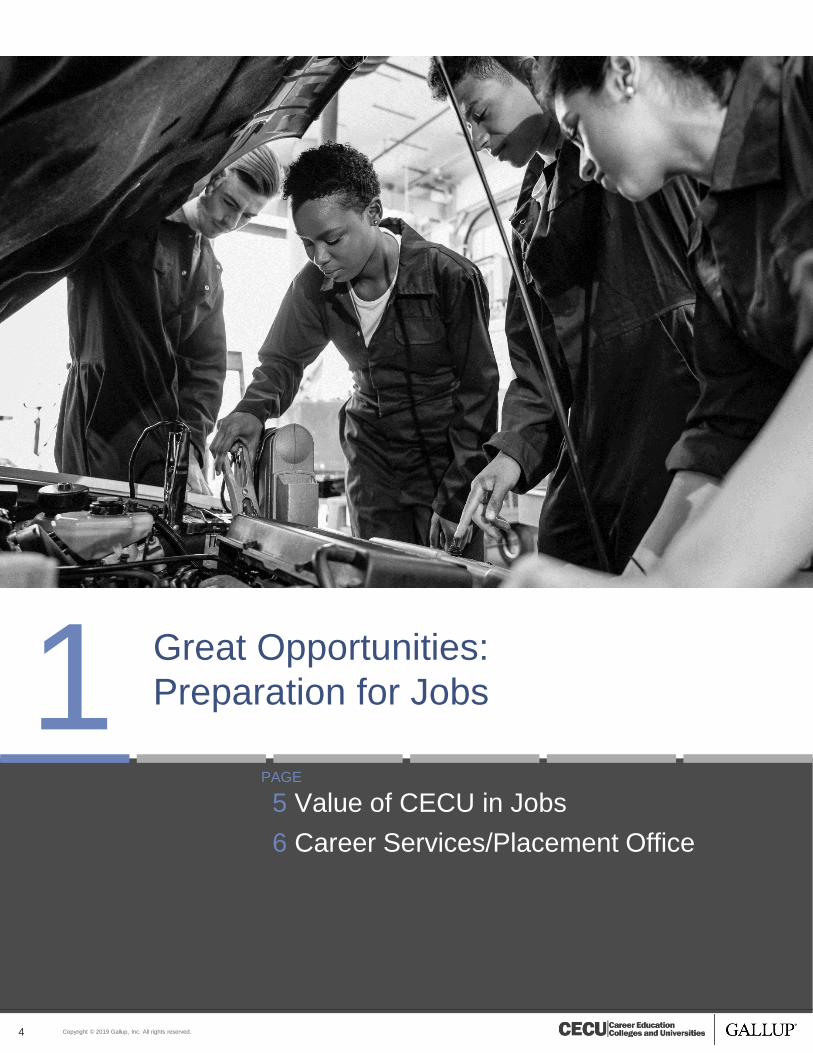
1 Great Opportunities:
Preparation for Jobs
4
5 Value of CECU in Jobs
6 Career Services/Placement Office
PAGE
Copyright © 2019 Gallup, Inc. All rights reserved.5
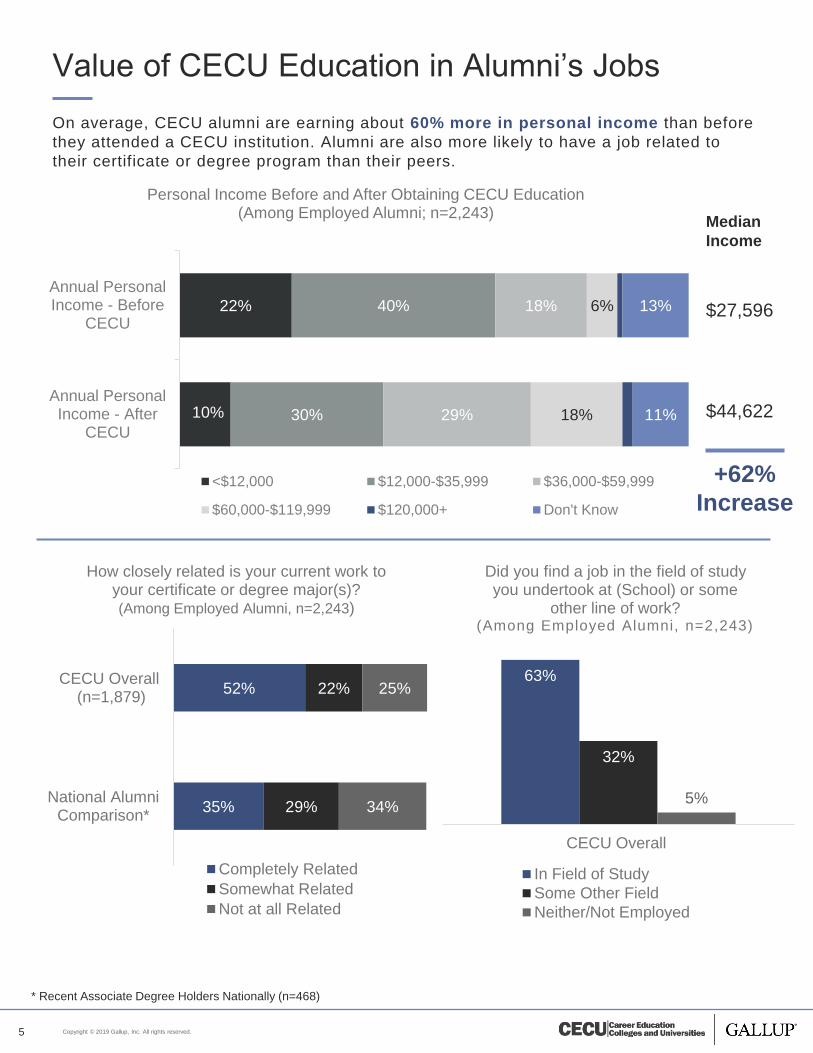
Value of CECU Education in Alumni’s Jobs
On average, CECU alumni are earning about 60% more in personal income than before
they attended a CECU institution. Alumni are also more likely to have a job related to
their certificate or degree program than their peers.
10%
22%
30%
40%
29%
18%
18%
6%
11%
13%
Annual PersonalIncome - After
CECU
Annual PersonalIncome - Before
CECU
Personal Income Before and After Obtaining CECU Education(Among Employed Alumni; n=2,243)
<$12,000 $12,000-$35,999 $36,000-$59,999
$60,000-$119,999 $120,000+ Don't Know
Median
Income
$27,596
$44,622
52%
35%
22%
29%
25%
34%
CECU Overall (n=1,879)
National AlumniComparison*
How closely related is your current work to your certificate or degree major(s)? (Among Employed Alumni, n=2,243)
Completely Related
Somewhat Related
Not at all Related
63%
32%
5%
CECU Overall
Did you find a job in the field of study you undertook at (School) or some
other line of work?(Among Employed Alumni, n=2,243)
In Field of Study
Some Other Field
Neither/Not Employed
* Recent Associate Degree Holders Nationally (n=468)
+62%
Increase
Copyright © 2019 Gallup, Inc. All rights reserved.6
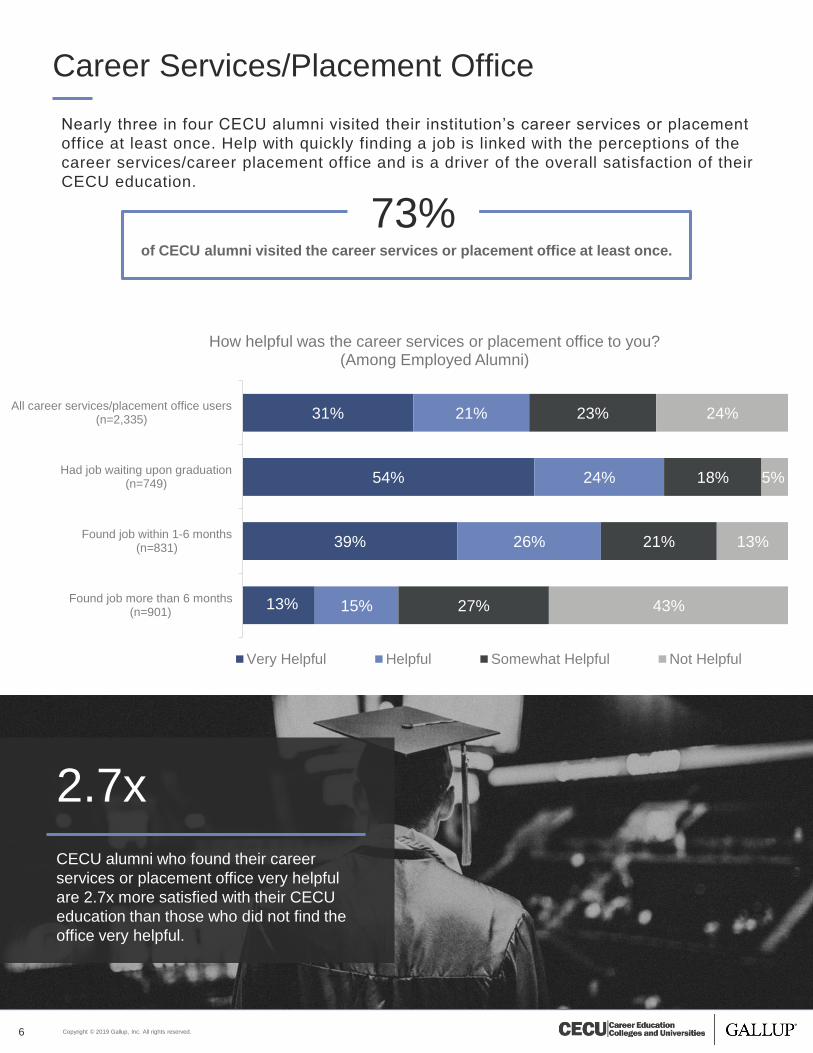
Career Services/Placement Office
Nearly three in four CECU alumni visited their institution’s career services or placement
office at least once. Help with quickly finding a job is linked with the perceptions of the
career services/career placement office and is a driver of the overall satisfaction of their
CECU education.
of CECU alumni visited the career services or placement office at least once.
73%
2.7x
CECU alumni who found their career
services or placement office very helpful
are 2.7x more satisfied with their CECU
education than those who did not find the
office very helpful.
13%
39%
54%
31%
15%
26%
24%
21%
27%
21%
18%
23%
43%
13%
5%
24%
Found job more than 6 months(n=901)
Found job within 1-6 months(n=831)
Had job waiting upon graduation(n=749)
All career services/placement office users(n=2,335)
How helpful was the career services or placement office to you?(Among Employed Alumni)
Very Helpful Helpful Somewhat Helpful Not Helpful
Copyright © 2019 Gallup, Inc. All rights reserved.
2
7
Great Jobs: Workplace
Engagement
8 Employment After Graduation
9 Workplace Fulfillment and Engagement
PAGE
Copyright © 2019 Gallup, Inc. All rights reserved.8
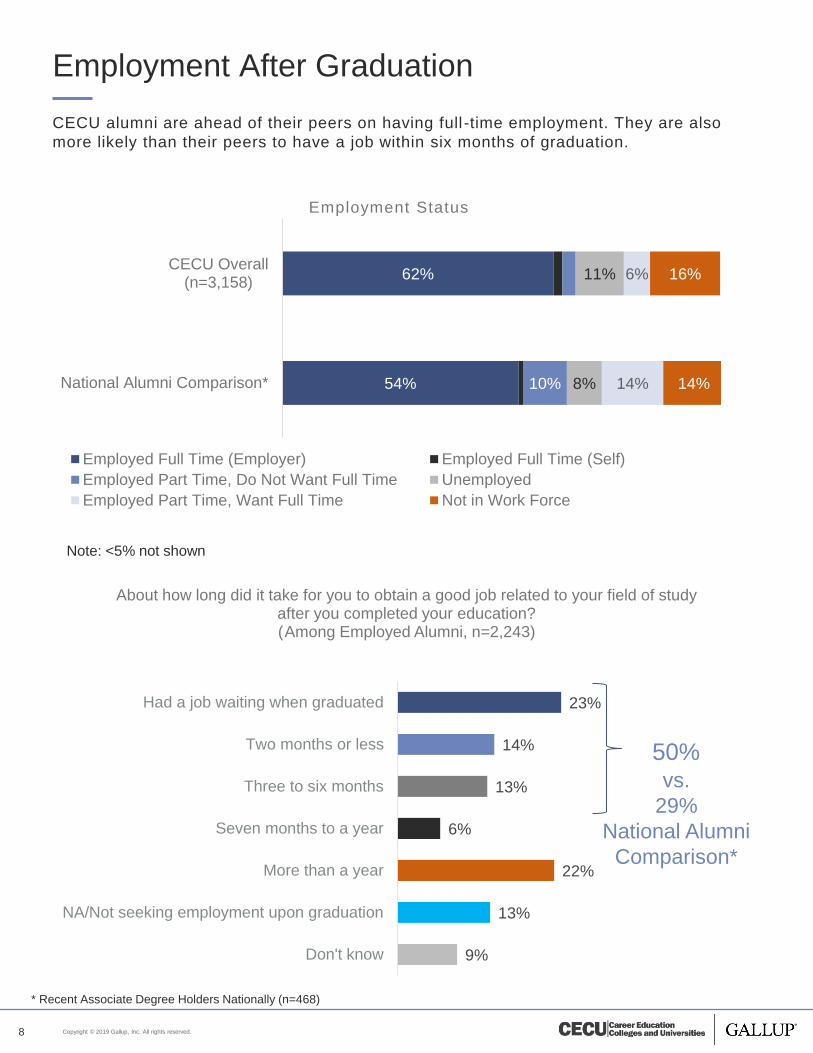
Employment After Graduation
CECU alumni are ahead of their peers on having full -time employment. They are also
more likely than their peers to have a job within six months of graduation.
62%
54% 10%
11%
8%
6%
14%
16%
14%
CECU Overall(n=3,158)
National Alumni Comparison*
Employment Status
Employed Full Time (Employer) Employed Full Time (Self)
Employed Part Time, Do Not Want Full Time Unemployed
Employed Part Time, Want Full Time Not in Work Force
23%
14%
13%
6%
22%
13%
9%
Had a job waiting when graduated
Two months or less
Three to six months
Seven months to a year
More than a year
NA/Not seeking employment upon graduation
Don't know
About how long did it take for you to obtain a good job related to your field of study after you completed your education?(Among Employed Alumni, n=2,243)
50%vs.
29%
National Alumni
Comparison*
* Recent Associate Degree Holders Nationally (n=468)
Note: <5% not shown
Copyright © 2019 Gallup, Inc. All rights reserved.
GROWTH
TEAMWORK
INDIVIDUAL CONTRIBUTION
BASIC NEEDS
9
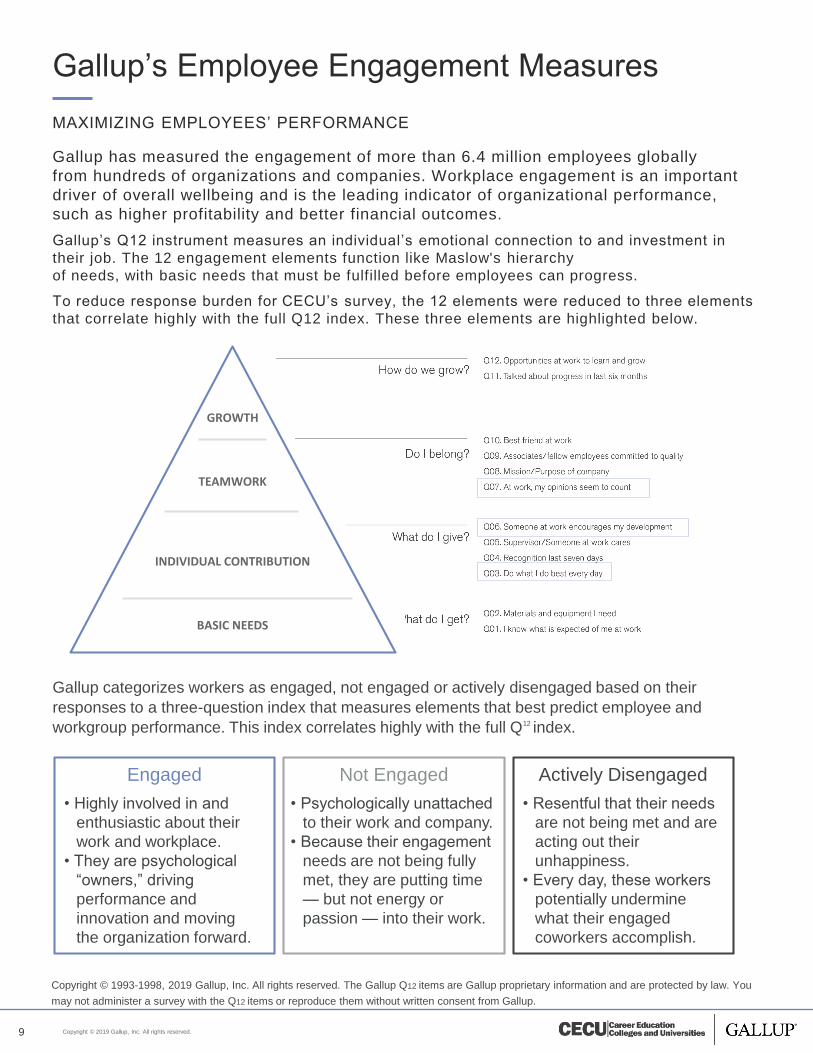
Gallup’s Employee Engagement Measures
MAXIMIZING EMPLOYEES’ PERFORMANCE
Copyright © 1993-1998, 2019 Gallup, Inc. All rights reserved. The Gallup Q12 items are Gallup proprietary information and are protected by law. You
may not administer a survey with the Q12 items or reproduce them without written consent from Gallup.
Engaged
• Highly involved in and
enthusiastic about their
work and workplace.
• They are psychological
“owners,” driving
performance and
innovation and moving
the organization forward.
Not Engaged
• Psychologically unattached
to their work and company.
• Because their engagement
needs are not being fully
met, they are putting time
— but not energy or
passion — into their work.
Actively Disengaged
• Resentful that their needs
are not being met and are
acting out their
unhappiness.
• Every day, these workers
potentially undermine
what their engaged
coworkers accomplish.
Gallup has measured the engagement of more than 6.4 million employees globally
from hundreds of organizations and companies. Workplace engagement is an important
driver of overall wellbeing and is the leading indicator of organizational performance,
such as higher profitability and better financial outcomes.
Gallup’s Q12 instrument measures an individual’s emotional connection to and investment in
their job. The 12 engagement elements function like Maslow's hierarchy
of needs, with basic needs that must be fulfilled before employees can progress.
To reduce response burden for CECU’s survey, the 12 elements were reduced to three elements
that correlate highly with the full Q12 index. These three elements are highlighted below.
Gallup categorizes workers as engaged, not engaged or actively disengaged based on their
responses to a three-question index that measures elements that best predict employee and
workgroup performance. This index correlates highly with the full Q12 index.
Copyright © 2019 Gallup, Inc. All rights reserved.10
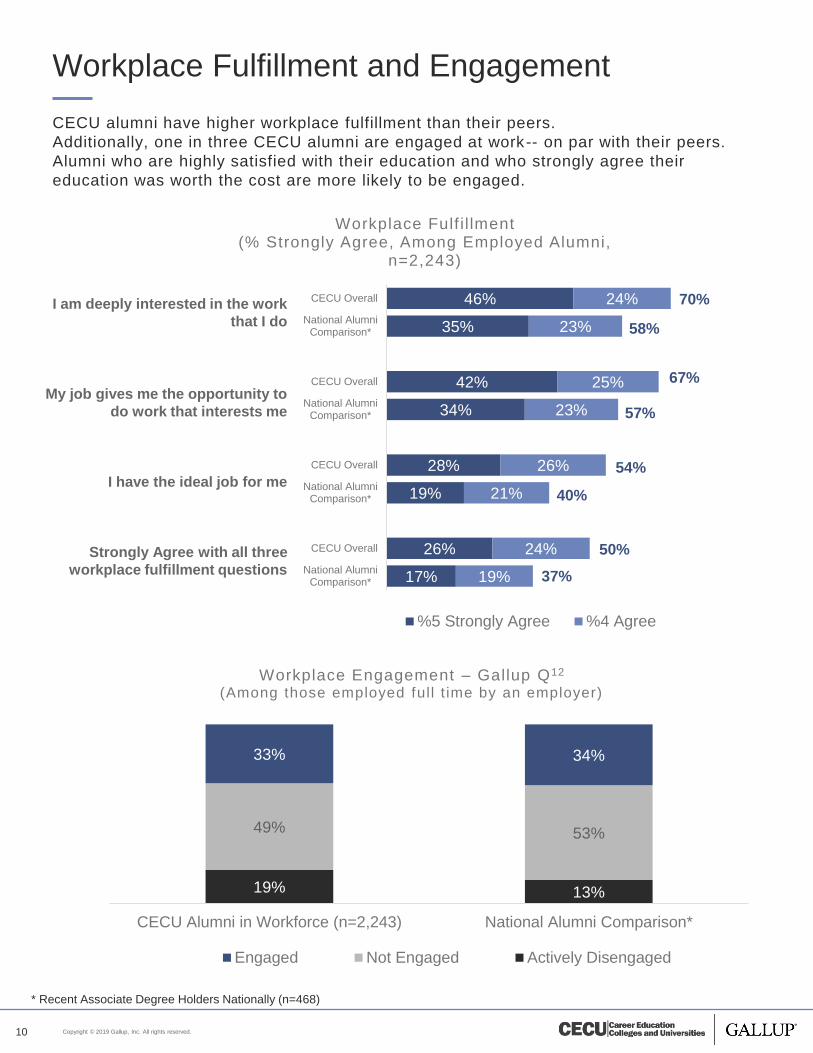
Workplace Fulfillment and Engagement
CECU alumni have higher workplace fulfillment than their peers.
Additionally, one in three CECU alumni are engaged at work-- on par with their peers.
Alumni who are highly satisfied with their education and who strongly agree their
education was worth the cost are more likely to be engaged.
46%
35%
42%
34%
28%
19%
26%
17%
24%
23%
25%
23%
26%
21%
24%
19%
CECU Overall
National AlumniComparison*
CECU Overall
National AlumniComparison*
CECU Overall
National AlumniComparison*
CECU Overall
National AlumniComparison*
Workplace Fulf i l lment(% Strongly Agree, Among Employed Alumni,
n=2,243)
%5 Strongly Agree %4 Agree
* Recent Associate Degree Holders Nationally (n=468)
19% 13%
49% 53%
33% 34%
CECU Alumni in Workforce (n=2,243) National Alumni Comparison*
Workplace Engagement – Gallup Q12
(Among those employed full t ime by an employer)
Engaged Not Engaged Actively Disengaged
I am deeply interested in the work
that I do
My job gives me the opportunity to
do work that interests me
I have the ideal job for me
Strongly Agree with all three
workplace fulfillment questions
67%
70%
58%
54%
40%
50%
37%
57%
Copyright © 2019 Gallup, Inc. All rights reserved.
3
11
Great Lives:
Wellbeing
12 Elements of Wellbeing
13 Thriving Elements
PAGE
Copyright © 2019 Gallup, Inc. All rights reserved.
24%
30%
43%
40%
35%
32%
37%
52%
53%
51%
Physical wellbeing
Community wellbeing
Financial wellbeing
Social wellbeing
Purpose wellbeing
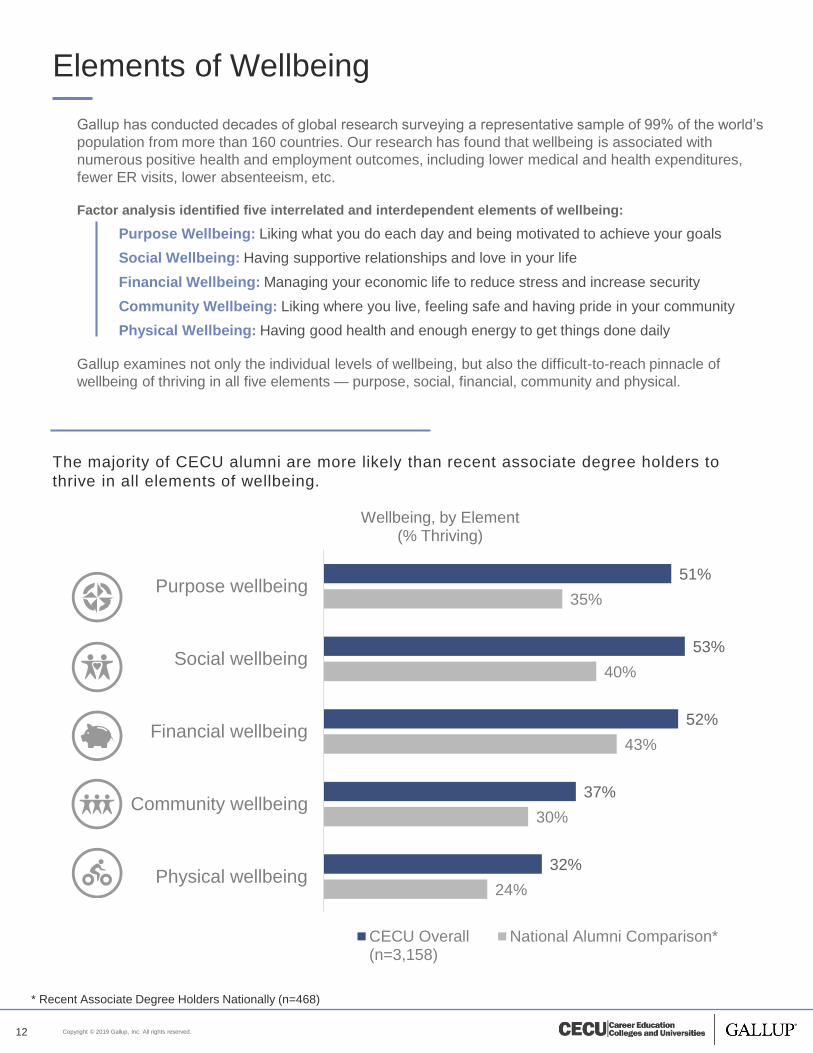
Wellbeing, by Element(% Thriving)
CECU Overall(n=3,158)
National Alumni Comparison*
12
Elements of Wellbeing
The majority of CECU alumni are more likely than recent associate degree holders to
thrive in all elements of wellbeing.
Gallup has conducted decades of global research surveying a representative sample of 99% of the world’s
population from more than 160 countries. Our research has found that wellbeing is associated with
numerous positive health and employment outcomes, including lower medical and health expenditures,
fewer ER visits, lower absenteeism, etc.
Factor analysis identified five interrelated and interdependent elements of wellbeing:
Purpose Wellbeing: Liking what you do each day and being motivated to achieve your goals
Social Wellbeing: Having supportive relationships and love in your life
Financial Wellbeing: Managing your economic life to reduce stress and increase security
Community Wellbeing: Liking where you live, feeling safe and having pride in your community
Physical Wellbeing: Having good health and enough energy to get things done daily
Gallup examines not only the individual levels of wellbeing, but also the difficult-to-reach pinnacle of
wellbeing of thriving in all five elements — purpose, social, financial, community and physical.
* Recent Associate Degree Holders Nationally (n=468)
Copyright © 2019 Gallup, Inc. All rights reserved.13
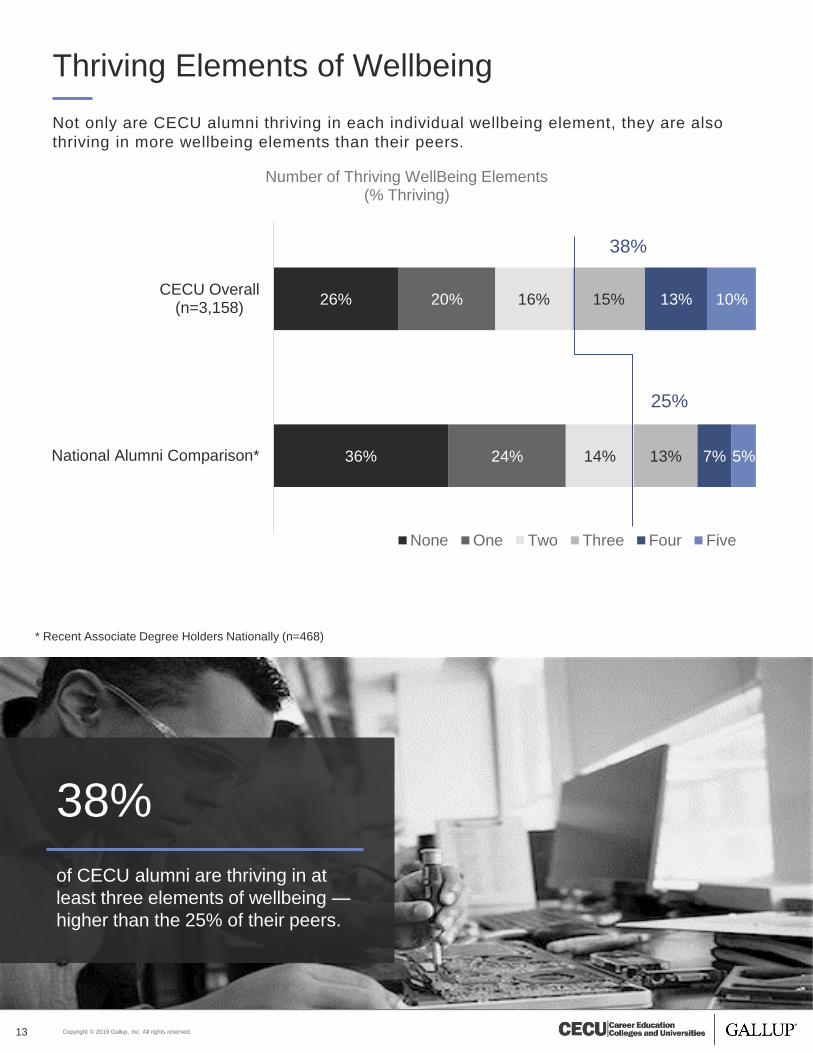
Thriving Elements of Wellbeing
Not only are CECU alumni thriving in each individual wellbeing element, they are also
thriving in more wellbeing elements than their peers.
36%
26%
24%
20%
14%
16%
13%
15%
7%
13%
5%
10%
National Alumni Comparison*
CECU Overall(n=3,158)
Number of Thriving WellBeing Elements(% Thriving)
None One Two Three Four Five
38%
of CECU alumni are thriving in at
least three elements of wellbeing —
higher than the 25% of their peers.
* Recent Associate Degree Holders Nationally (n=468)
38%
25%
Copyright © 2019 Gallup, Inc. All rights reserved.
Great Experiences:
Career Education
Experience
14
415 Educational Quality
16 Support Experiences
17 Transfer Students
PAGE
Copyright © 2019 Gallup, Inc. All rights reserved.15
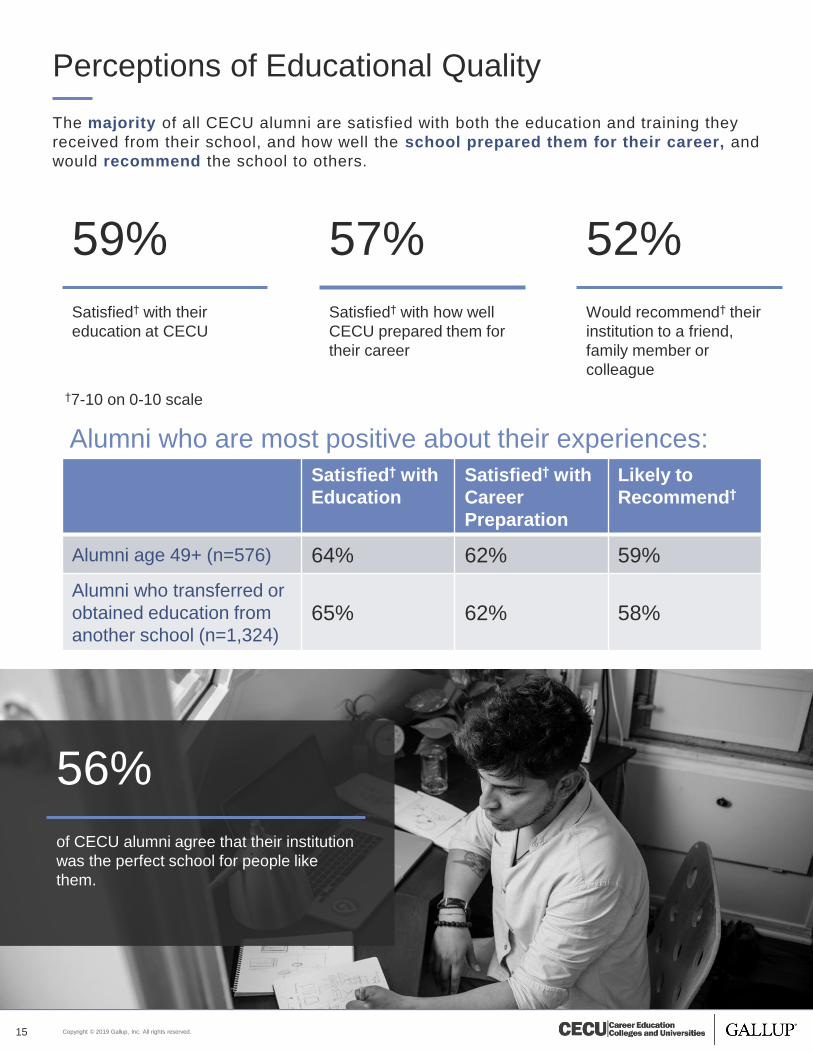
Perceptions of Educational Quality
The majority of all CECU alumni are satisfied with both the education and training they
received from their school, and how well the school prepared them for their career, and
would recommend the school to others.
Satisfied† with
Education
Satisfied† with
Career
Preparation
Likely to
Recommend†
Alumni age 49+ (n=576) 64% 62% 59%
Alumni who transferred or
obtained education from
another school (n=1,324)65% 62% 58%
56%
of CECU alumni agree that their institution
was the perfect school for people like
them.
59% 57% 52%
Satisfied† with their
education at CECU
Satisfied† with how well
CECU prepared them for
their career
Would recommend† their
institution to a friend,
family member or
colleague
Alumni who are most positive about their experiences:
†7-10 on 0-10 scale
Copyright © 2019 Gallup, Inc. All rights reserved.
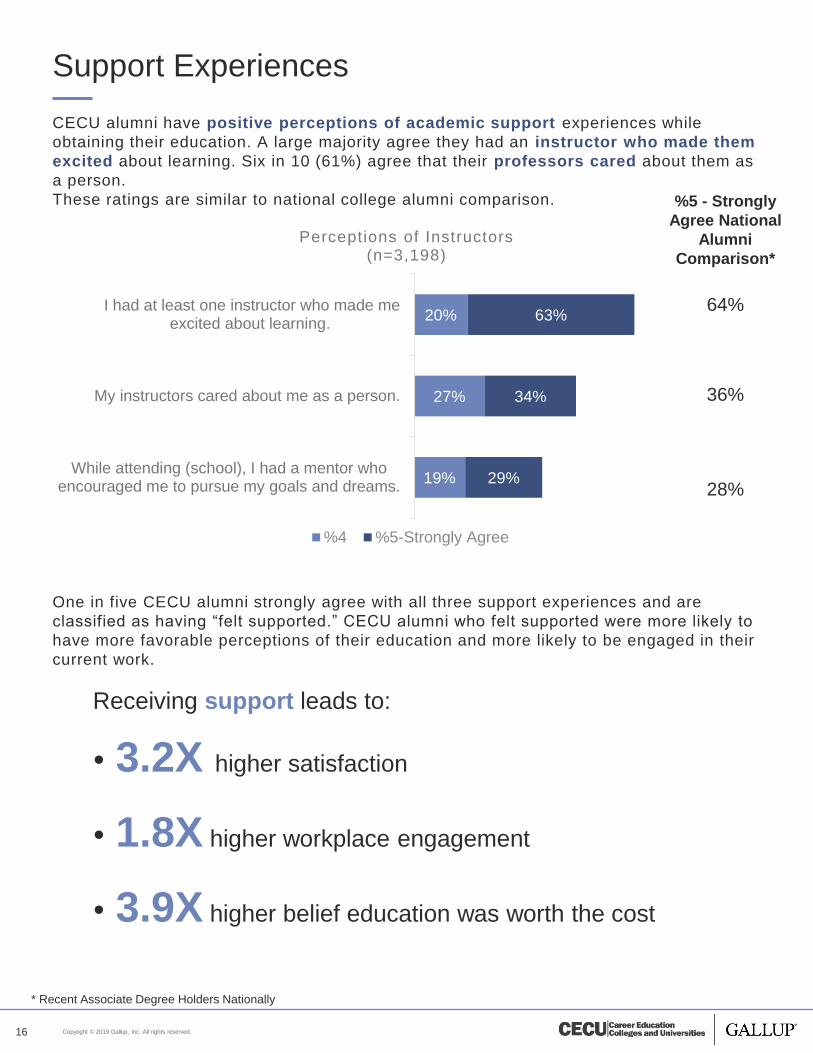
19%
27%
20%
29%
34%
63%
While attending (school), I had a mentor whoencouraged me to pursue my goals and dreams.
My instructors cared about me as a person.
I had at least one instructor who made meexcited about learning.
Perceptions of Instructors(n=3,198)
%4 %5-Strongly Agree
%5 - Strongly
Agree National
Alumni
Comparison*
64%
36%
28%
16
Support Experiences
CECU alumni have positive perceptions of academic support experiences while
obtaining their education. A large majority agree they had an instructor who made them
excited about learning. Six in 10 (61%) agree that their professors cared about them as
a person.
These ratings are similar to national college alumni comparison.
Receiving support leads to:
• 3.2X higher satisfaction
• 1.8X higher workplace engagement
• 3.9X higher belief education was worth the cost
* Recent Associate Degree Holders Nationally
One in five CECU alumni strongly agree with all three support experiences and are
classified as having “felt supported.” CECU alumni who felt supported were more likely to
have more favorable perceptions of their education and more likely to be engaged in their
current work.
Copyright © 2019 Gallup, Inc. All rights reserved.17
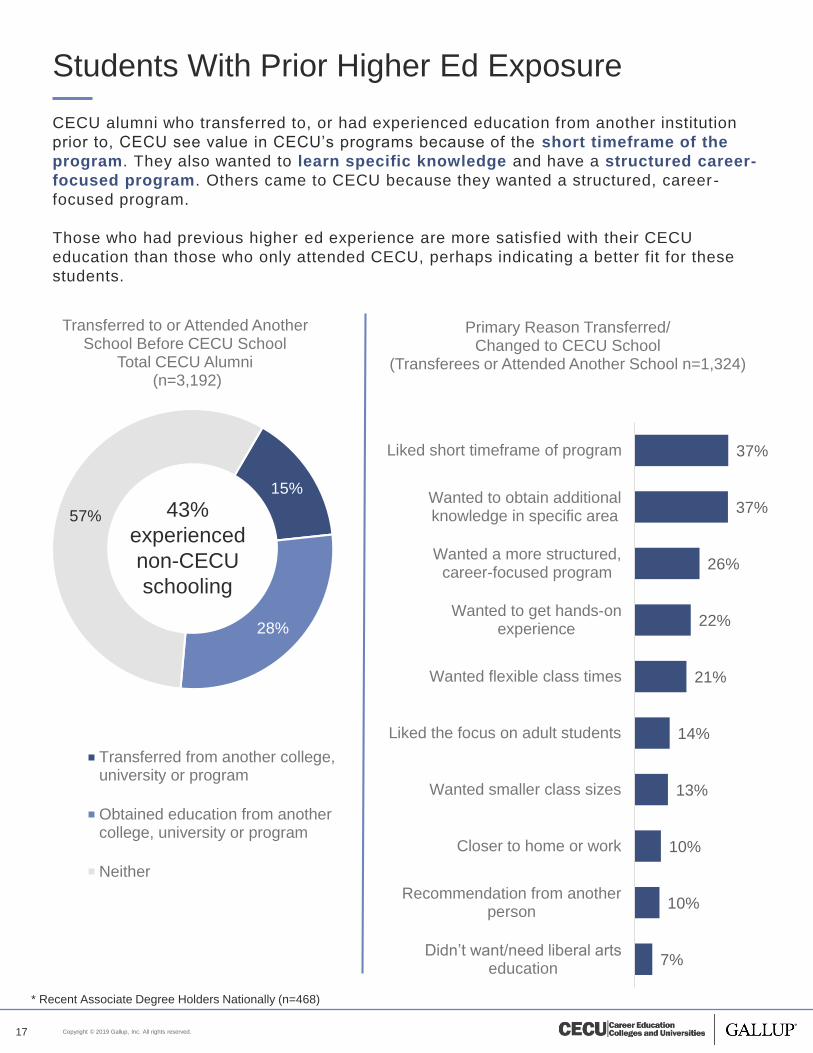
Students With Prior Higher Ed Exposure
CECU alumni who transferred to, or had experienced education from another institution
prior to, CECU see value in CECU’s programs because of the short timeframe of the
program. They also wanted to learn specific knowledge and have a structured career-
focused program. Others came to CECU because they wanted a structured, career -
focused program.
Those who had previous higher ed experience are more satisfied with their CECU
education than those who only attended CECU, perhaps indicating a better fit for these
students.
15%
28%
57%
Transferred to or Attended Another School Before CECU School
Total CECU Alumni(n=3,192)
Transferred from another college,university or program
Obtained education from anothercollege, university or program
Neither
7%
10%
10%
13%
14%
21%
22%
26%
37%
37%
Didn’t want/need liberal arts education
Recommendation from anotherperson
Closer to home or work
Wanted smaller class sizes
Liked the focus on adult students
Wanted flexible class times
Wanted to get hands-onexperience
Wanted a more structured,career-focused program
Wanted to obtain additionalknowledge in specific area
Liked short timeframe of program
Primary Reason Transferred/Changed to CECU School
(Transferees or Attended Another School n=1,324)
* Recent Associate Degree Holders Nationally (n=468)
43%
experienced
non-CECU
schooling
Copyright © 2019 Gallup, Inc. All rights reserved.
5
18
Great Impact: Key
Subpopulations
19 Military Service Members/Veterans
20 Minority Students
PAGE
Copyright © 2019 Gallup, Inc. All rights reserved.19
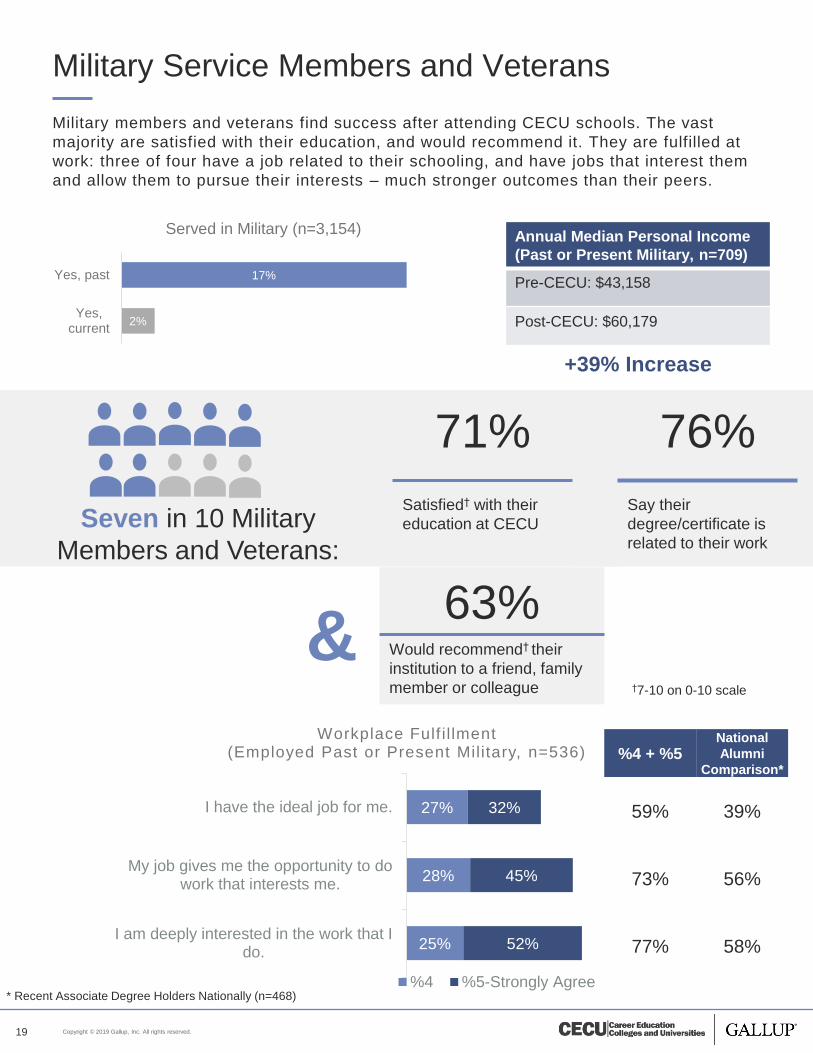
Military Service Members and Veterans
Military members and veterans find success after attending CECU schools. The vast
majority are satisfied with their education, and would recommend it. They are fulfilled at
work: three of four have a job related to their schooling, and have jobs that interest them
and allow them to pursue their interests – much stronger outcomes than their peers.
Annual Median Personal Income
(Past or Present Military, n=709)
Pre-CECU: $43,158
Post-CECU: $60,179
+39% Increase
2%
17%
Yes,current
Yes, past
Served in Military (n=3,154)
71% 76%
Satisfied† with their
education at CECU
Say their
degree/certificate is
related to their work
25%
28%
27%
52%
45%
32%
I am deeply interested in the work that Ido.
My job gives me the opportunity to dowork that interests me.
I have the ideal job for me.
Workplace Fulf i l lment(Employed Past or Present Military, n=536)
%4 %5-Strongly Agree
%4 + %5National
Alumni
Comparison*
59% 39%
73% 56%
77% 58%
* Recent Associate Degree Holders Nationally (n=468)
†7-10 on 0-10 scale
63%Would recommend† their
institution to a friend, family
member or colleague
Seven in 10 Military
Members and Veterans:
&
Copyright © 2019 Gallup, Inc. All rights reserved.
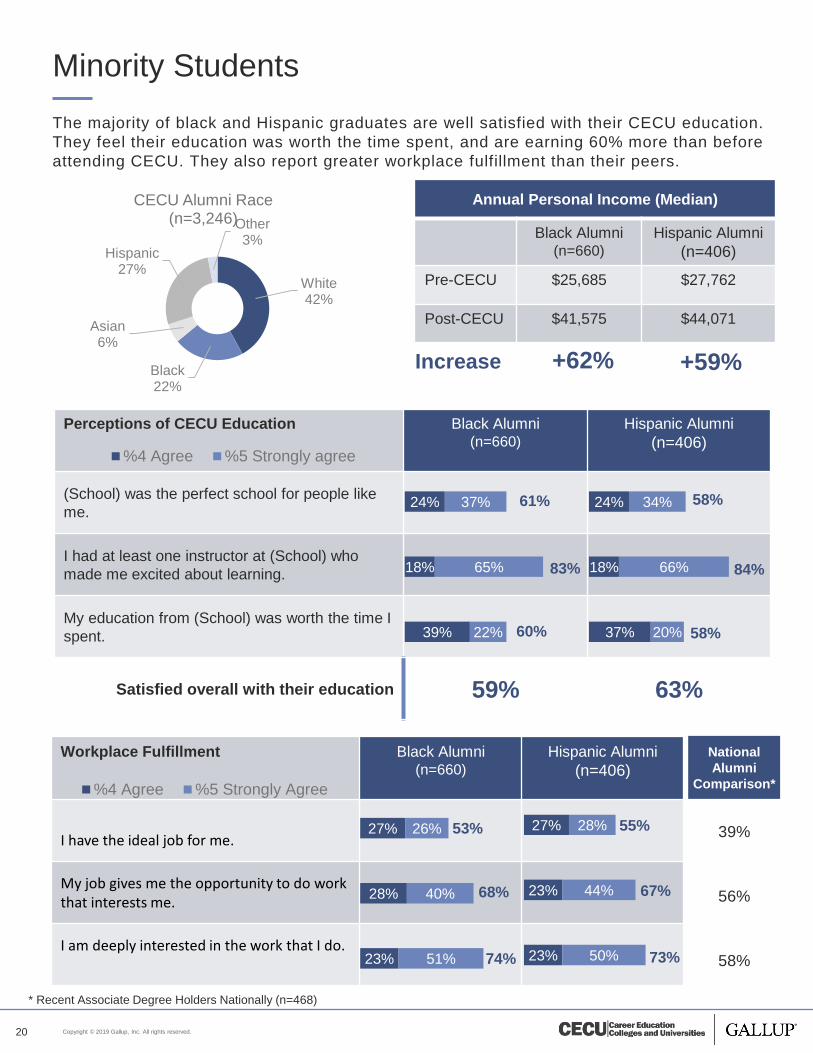
Perceptions of CECU Education Black Alumni(n=660)
Hispanic Alumni
(n=406)
(School) was the perfect school for people like
me.
I had at least one instructor at (School) who
made me excited about learning.
My education from (School) was worth the time I
spent.
Satisfied overall with their education 59% 63%
20
Minority Students
The majority of black and Hispanic graduates are well satisfied with their CECU education.
They feel their education was worth the time spent, and are earning 60% more than before
attending CECU. They also report greater workplace fulfillment than their peers.
White42%
Black22%
Asian6%
Hispanic27%
Other3%
CECU Alumni Race(n=3,246)
Annual Personal Income (Median)
Black Alumni(n=660)
Hispanic Alumni
(n=406)
Pre-CECU $25,685 $27,762
Post-CECU $41,575 $44,071
Increase
39%
18%
24%
22%
65%
37%
%4 Agree %5 Strongly agree
37%
18%
24%
20%
66%
34%
Workplace Fulfillment Black Alumni(n=660)
Hispanic Alumni
(n=406)
I have the ideal job for me.
My job gives me the opportunity to do work that interests me.
I am deeply interested in the work that I do.23%
28%
27%
51%
40%
26%
%4 Agree %5 Strongly Agree
23%
23%
27%
50%
44%
28%
+62% +59%
61%
83%
60%
58%
84%
58%
53%
68%
74%
55%
67%
73%
National
Alumni
Comparison*
39%
56%
58%
* Recent Associate Degree Holders Nationally (n=468)
Copyright © 2019 Gallup, Inc. All rights reserved.
6
21
22 Methodology
23 Demographics
24 About Us
Methodology
PAGE
Copyright © 2019 Gallup, Inc. All rights reserved.
Methodology
CECU METHODOLOGY AND NATIONAL ALUMNI COMPARISON
Methodology – the CECU 2018 Student Survey
Results for the CECU alumni study are based on web surveys conducted Sept. 25-Oct. 19, 2018.
The sampling frame consisted of 102 member organizations, some with multi-campus systems
under parent entities, who are members of CECU, representing about 679 campus locations in the
U.S. Gallup randomly selected 40 member organizations and invited them to participate. Nine
member organizations, representing 75 campuses agreed to participate and sent Gallup alumni
contact information to use in the study. Each institution or individual campus was asked to provide
Gallup email addresses of alumni who graduated between 2008 and early 2018 (at least six
months prior to the study date). CECU companies sent out pre-notification emails, which were
followed by survey email invites sent by Gallup. Gallup sent up to five email reminders to alumni to
encourage participation. Interviews were conducted via the web, in English only.
A total of 3,882 alumni responded to the survey, but due to incomplete responses, these data
represent 3,203 CECU alumni who graduated between 2008 and early 2018. Data were weighted
to match the known demographic distribution (gender, race and Hispanic ethnicity) of recent
graduates of the 102 CECU companies based on National Center for Education Statistics (NCES)
data.
For results based on the total sample of CECU Alumni, the margin of sampling error is ±1.7
percentage points at the 95% confidence level.
National Comparison
• For the purposes of this report, data from CECU are compared with data collected in the Gallup-
USA Funds Associate Degree Graduates study, a nationally representative study of U.S. adults
who have obtained an associate degree as their highest level of education. The Gallup-USA
Funds Associate Degree Graduates study is based on web surveys conducted March 19-May
11, 2015, with a random sample of 2,548 individuals aged 18 and older, with Internet access,
living in all 50 U.S. states and the District of Columbia.
• Some differences may exist between the national comparison points included in this report and
national estimates that Gallup has previously released because this report focuses on
graduates who received their associate degrees from 2007–2015. The comparison group
included in this scorecard is:
• National Comparison Group: Associate degree holders who graduated 2007-2015
surveyed via the Gallup-USA Funds Associate Degree Holders Study, which includes
those who reported they have an associate degree from a two-year institution in the U.S.
as defined by the U.S. Department of Education. Graduate represented public and private
and both for- and not-for-profit institutions. The comparison sample includes 498
graduates.
22
Copyright © 2019 Gallup, Inc. All rights reserved.23
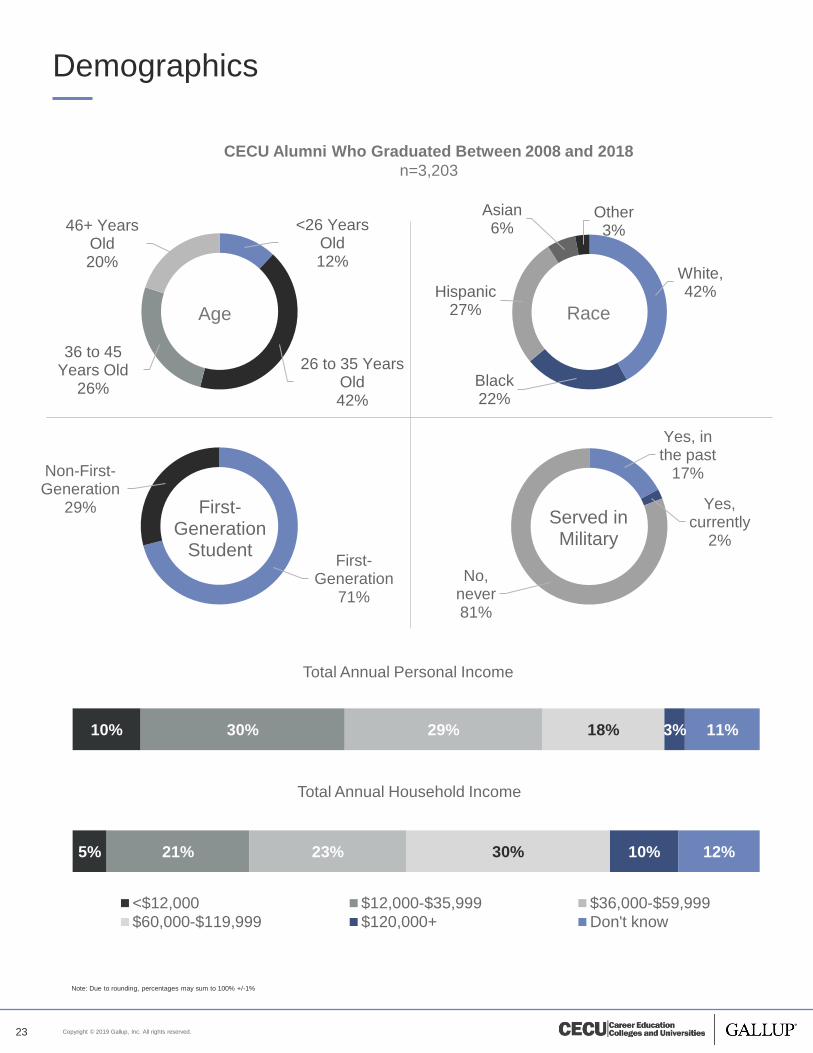
Demographics
5%
10%
21%
30%
23%
29%
30%
18%
10%
3%
12%
11%
<$12,000 $12,000-$35,999 $36,000-$59,999
$60,000-$119,999 $120,000+ Don't know
Total Annual Household Income
CECU Alumni Who Graduated Between 2008 and 2018
n=3,203
Note: Due to rounding, percentages may sum to 100% +/-1%
<26 Years Old12%
26 to 35 Years Old42%
36 to 45 Years Old
26%
46+ Years Old20%
Age
White, 42%
Black22%
Hispanic27%
Asian6%
Other3%
Race
Yes, in the past
17%
Yes, currently
2%
No, never81%
Served in Military
Total Annual Personal Income
First-Generation
71%
Non-First-Generation
29% First-Generation
Student
Copyright © 2019 Gallup, Inc. All rights reserved.
About Us
Gallup
Gallup delivers analytics and advice to help leaders and organizations solve their most pressing
problems. Combining more than 80 years of experience with its global reach, Gallup knows more
about the attitudes and behaviors of employees, customers, students and citizens than any other
organization in the world. For more information, visit www.gallup.com or education.gallup.com.
CECU
The Career Education Colleges and Universities (CECU) is a voluntary membership organization of
accredited, postsecondary schools, institutes, colleges and universities that provide career-specific
educational programs. CECU has about 500 member campuses that educate and support millions of
students for employment in over 200 occupational fields. CECU member institutions provide the full
range of higher education programs, including masters and doctorate degrees, two- and four-year
associate and baccalaureate degree programs, and short-term certificate and diploma programs.
Some of the occupational fields for which CECU institutions provide programs include: information
technology; allied health; business administration; commercial art; radio and television broadcasting;
and culinary and hospitality management.
Most CECU member institutions participate in federal student financial assistance programs under
Title IV of the Higher Education Act. In order to participate, they must be licensed by the state in
which they are located, accredited by a nationally recognized accrediting body, and approved by the
U.S. Department of Education. Many CECU member schools and colleges also participate in other
federal, state and local education and workforce training programs.
24
Copyright © 2019 Gallup, Inc. All rights reserved.Copyright © 2018 Gallup, Inc. All rights reserved.
Copyright
25
Copyright Standards
This document contains proprietary research, copyrighted and trademarked materials of Gallup, Inc.
Accordingly, international and domestic laws and penalties guaranteeing patent, copyright, trademark and
trade secret protection safeguard the ideas, concepts and recommendations related within this document.
The materials contained in this document and/or the document itself may be downloaded and/or copied
provided that all copies retain the copyright, trademark and any other proprietary notices contained on the
materials and/or document. No changes may be made to this document without the express written permission
of Gallup, Inc.
Any reference whatsoever to this document, in whole or in part, on any web page must provide a link back to
the original document in its entirety. Except as expressly provided herein, the transmission of this material shall
not be construed to grant a license of any type under any patents, copyright or trademarks owned or controlled
by Gallup, Inc.
Copyright © 1993-1998, 2019 Gallup, Inc. All rights reserved. Gallup®, Q12® and Gallup PanelTM are
trademarks of Gallup, Inc. Gallup-Sharecare WellBeing Index™ and Well-Being 5® are trademarks of WB5,
LLC. All rights reserved. All other trademarks and copyrights are property of their respective owners.
The Gallup Q12 items are Gallup proprietary information and are protected by law. You may not administer a
survey with the Q12 items or reproduce them without written consent from Gallup.

Copyright © 2019 Gallup, Inc. All rights reserved.