Embed Size (px)
Citation preview

1
TOURO COLLEGE GRADUATE SCHOOL OF EDUCATION
Tracking Completers from Touro’s Graduate School of Education’s Teacher Education Program
Employed in the New York City Public Schools
Completers from 2014-15, 2015-16, and 2016-17
April 18, 2018

2
Contents Overview and Purpose of the Study 5 Audience 7 Research Questions (RQ) 7 Methodology 8 Results 9 Description of the Participant Sample 9 RQ 1. Employment of Touro Graduates in NYCDOE Schools 13 RQ 2. Years between Graduation and First Hiring 16 RQ 3. Completers’ Schools of Initial Employment 17 RQ 4. Completers’ Retention 20 Summary and Conclusions 23 Appendix 25

3
Tables Table 1. Age distribution of Touro teacher education completers by year of completion 10 Table 2. Campus distribution of Touro Teacher Education Program completers by year of completion 10 Table 3. Distribution of certification programs for Touro Teacher Education Program completers by year of program completion 11 Table 4. Distribution of certification programs for Touro Teacher Education program completers by campus location (Graduates of 2014-15, 2015-16, & 2016-17 combined) 12 Table 5. Number and percent of Touro Teacher Education completers that were employed in the NYC public schools by year of completion 13 Table 6. Number and percent of Touro Teacher Education program completers employed by the NYC Public Schools disaggregated by program major (Completers for 2014-15, 2015-16, & 2016-17 combined) 14 Table 7. Number and percent of Touro Teacher Education program completers employed by the NYC Public Schools disaggregated by program major (2016-17 completers) 15 Table 8. Number and percent of Touro Teacher Education program completers hired by the NYC Public Schools by campus location. (2014-15, 2015-16, 2016-17 combined) 16 Table 9. Number and percent of Touro Teacher Education program completers hired by the NYC Public Schools disaggregated by campus location (Completers for 2016-17) 16 Table 10. Number and percent of Touro teacher education program completers hired by NYCDOE before and after the year of their program completion 17 Table 11. Number and percent of Touro teacher education program completers hired by NYCDOE before and after program completion by certification program (2014-15, 2015-16, & 2016-17 combined) 18 Table 12. Borough distribution of initial hiring schools for Touro Teacher Education program completers by campus location (2014-15, 2015-16, & 2016-17 combined) 18 Table 13.Distribution of typed of schools in which Touro Teacher Education program completers were first employed disaggregated by year of completion 19 Table 14. Numbers of NYC Public Schools hiring Touro completers and the numbers of completers hired by these schools (Completers for 2015, 2016, & 2016-17 combined) 20 Table 15. Payroll (employment) status of Touro Teacher Education program completers who were hired by NYCDOE schools disaggregated year of completion 21
4
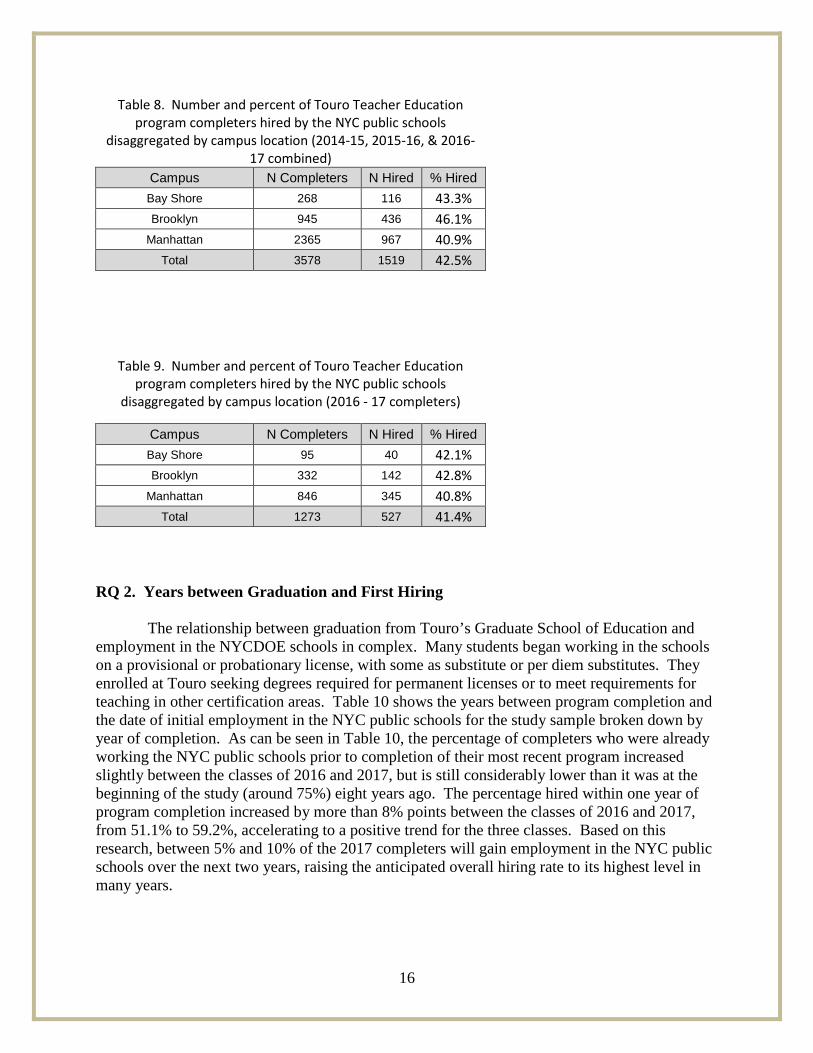
Table 16. Payroll (employment) status of Touro Teacher Education program completers who were hired by NYCDOE schools disaggregated by years between hiring and program completion (class of 2017 21 Table 17. Payroll (retention) status of Touro Teacher Education completers disaggregated by Program majors (classes of 2015, 2016, and 2017 combined) (as of Dec. 1, 2017) 22

5
Overview and Purpose of the Study There is a critical need for teacher preparation institutions to collect and use data to assess the efficacy of their programs and inform program improvement efforts. This need was underscored in a speech by former Education Secretary Arne Duncan at Teachers’ College in October, 2009. Duncan asserted “The bottom line is that we lack empirical evidence of what works in preparing teachers for an outcome-based education system. We don't know what, where, how, or when teacher education is most effective.” The importance of data-based inquiry to the design and re-design of teacher education is embodied in “the culture of evidence and data for educator preparation” that underlies the Council for the Accreditation of Educator Preparation (CAEP) Standards. Version 2.0 of the CAEP Evidence Guide (2015) cites the following definition of the ‘culture of evidence” used by the regional accreditor, Western Association of Schools and Colleges: A habit of using evidence in assessment, decision making, planning, resource allocation, and other institutional processes that is embodied in the characteristics of an institution’s actions and processes.1 CAEP Standard 5 requires that the Education Program Provider maintains a quality assurance system comprised of valid data from multiple measures, including evidence of candidates’ and completers’ positive impact on P-12 student learning and development. Among the sources of evidence required for the quality assurance system are data on licensing, graduation, and hiring rates. As part of its efforts to support data-based inquiry and decision-making and meet the CAEP standards for accreditation, the Dean’s Office of the Touro College Graduate School of Education continues to conduct a study that tracks longitudinally the completers of its teacher education programs. The objectives of this research are to assess the success of Touro’s graduates in entering the teaching profession, the types of schools in which they enter teaching, and their rates and patterns of retention and attrition. The results of this research are intended to be used for several purposes. First, to help faculty and administrators evaluate the success of Touro’s teacher education programs in developing high quality teachers and administrators who are prepared to serve in inner-city schools. Second, to inform ongoing efforts to improve recruitment into the teacher education program by identifying sources of successful program applicants and the specific certification programs (majors) that are more and less successful in preparing graduates to enter and remain in the profession. Third, the data bolster Touro’s evidence base in support of continuing accreditation of its teacher education program.
This research focuses on the employment of Touro completers in the New York City Department of Education’s (NYCDOE) schools. Studying the relationship between Touro and the NYCDOE is important for two reasons. First, NYCDOE is both a major source of applicants to and the largest employer of completers from Touro’s teacher education program. Second, NYCDOE maintains an extensive and reliable human resources
1 The Western Association of Schools and Colleges. (2013). 2013 Handbook of Accreditation (p. 47). Retrieved from http://www.wascsenior.org/resources/handbook-accreditation-2013

6
database that stores historical data on all teachers and personnel employed in the public schools and can be linked to descriptive data on the schools, as well as data in Touro’s student database. Linking data from these databases can be used to track graduates’ interactions between Touro and the NYCDOE.
This is the fourth free-standing report to present findings from this research. Subsequent to the presentation of the first set of findings in Touro’s Inquiry Brief for national accreditation, comprehensive findings were released in four stand-alone reports that described the employment patterns of Touro program completers for the classes of 2008 through 2016. A summary of the key findings from those reports follows: • During the past decade, Touro has been one of the largest trainers and suppliers of
educators to the New York City Public Schools (NYCPS) and, reciprocally, NYCPS has been the largest employer of Touro teacher education graduates. However, the percentages employed declined steadily from over 50% in 2008, when the tracking study began, to 32.0% in 2016. Employment opportunities in the NYCPS were also declining during this same period.
• During the period of study through 2014, the certification areas with the highest employment rates for Touro graduates were Bilingual/Bicultural Pupil Personnel Services, Instructional Technology, Mid-Childhood Education/Special Education (Grades 5 – 9), and Special Education. These certification areas were either shortage areas, hard-to-staff areas, or desirable specialties. Last year’s report on program completers from 2014-15 and 2015-16 found that certification areas with the highest employment rates were TESOL, which had 189 graduates with a total employment rate of 66.7%, and Special Education Grades 7-12, which had 198 graduates and an employment rate of 62.1%. Five other certification areas had employment rates of at least 50%, including Autism and Severe Disabilities, Educational Technology, Mid-Childhood Special Education, Bilingual Pupil Personnel Services, and Math Education.
• Touro’s Graduate School of Education has traditionally attracted large numbers of educators from the NYC public schools who were seeking to upgrade their credentials and deepen their teaching skills. Over the course of this research, we have seen a substantial shift in the balance between completers who were hired before versus upon or after Touro completion, a trend which continued to be observed in the data for last year’s report. Over the eight years of study so far, the percentage of completers who were employed in the NYC public schools two or more years prior to program completion declined from nearly 75% to 43.7% for the completers of 2016.
• Consistent with previous reports, last year’s report showed that the borough with the largest percentage of hires was Brooklyn, with 39.3% of the hires for the classes of 2015 and combined and 36.1% of the hires for 2016. The next highest percentages of hires were in Queens with about one-quarter of the new hires for both years, followed by the Bronx and Staten Island, with more than 10% each.
• The research shows that Touro has a strong presence among the faculties of New York City public schools. The 2015 and 2016 graduates combined were initially employed in 29.3% of the 1,582 NYC public schools and remained hired in 25.6% of the schools in their most recent assignment. 152 schools initially hired more than one completer, 34 hired at least four, and 17 hired at least five.

7
• Touro completers hired in New York City public schools have had consistently high retention rates throughout the eight years of the study. Last year’s report showed that as of Dec. 22, 2016, 87.6% of the class of 2015 were still employed as were 91.2% of the class of 2016. These retention rates are substantially higher than the 80-85% observed in previous reports.
Audience
The primary intended audience for this research is the teacher-education program faculty and administrators at Touro’s Graduate School of Education. This audience can use the data to assess how well these programs are preparing teachers for successful employment in the NYC public schools, as well as serving beginning and provisional teachers who are seeking permanent status and/or advancement in the profession. The data can inform discussions at many venues concerning ways to improve the effectiveness of the programs. Another audience is the program reviewers and auditors at CAEP who will use these data to help make decisions about continuing accreditation for Touro. In addition, the results will be shared with officials at the NYCDOE, especially the Division of Human Resources. These data will provide information about the induction and retention of beginning teachers from a large public university that contributes substantially to the teacher pipeline for New York City. The results can also be incorporated into presentations at national conferences on educational research.
Research Questions (RQ) The study uses a non-experimental, quantitative research design with extant data to address research questions about the distribution and status of Touro teacher education program completers in the New York City public schools, the types of schools in which they teach, and their retention rates. This report presents updated findings for the program completers of 2014-15 (designated 2015)) and 2015-16 (2016), and first-time findings for completers of 2016-17 (the class of 2017), the most recent graduating class. Although findings for the class of 2015 were described in two earlier reports, they have been updated to reflect their employment status as of December 1, 2017 and are presented in this report to track longitudinal trends. The findings for the class of 2016 are updated from those presented in last year’s report, and also reflect their employment status as of Dec. 1, 2017. Also, the data in this report include School Counseling, whereas the previous reports did not. The research questions addressed in this report are as follows:
• RQ 1: What were the numbers and percentages of each completing class that were employed in NYC public schools? How do these employment percentages compare to historical trends over recent years?
• RQ 2: How many completers were already working in the NYC public schools prior to graduating from the Touro teacher education program? What percentage began their employment in NYC schools after graduation?
• RQ 3: What were the locations and school levels of the schools in which the completers were first employed? Were there concentrations of completers working in specific schools and which schools were they?

8
• RQ 4: What were the retention rates of completers? Did these rates vary by year of graduation and Touro certification area program?
Methodology Participants The participants are students who completed Touro teacher education programs in the academic years 2014-15, 2015-16, and 2016-17. The Director of Research at Touro’s School of Education compiled a list of all program completers from these years, including their names, dates of graduation, certification program, social security numbers (last five digits), and birth dates. After eliminating cases with missing information, duplicates, and non-teacher education programs, the file of participants had 3,578 cases, distributed among the classes of completers as follows:
• Class of 2015 = 1,039 • Class of 2016 = 1,266 • Class of 2017 = 1,273
It should be noted that the above numbers of participants for the classes of 2015 and 2016
differ slightly from those in last year’s report. The NYCDOE periodically updates its human resources system as more and better data become available. For this reason, some of the data reported previously may change in this report from those previously reported. This report presents the most accurate data currently available.
Data The data for the study were employee data extracted from the NYCDOE Employee Information System (EIS) and descriptive data on the program completers extracted from the Touro student information system. The EIS data included the following data elements:
• Data on the first teaching assignments of program completers hired in NYC public schools, including initial license, school name and type (level), and effective date;
• Data on their most recent teaching assignment, including school building name and type, license, and effective date; and
• Their current employment status as of December 1, 2017, including active status (Regular active, On Leave, Substitute or On Sabbatical, and Terminated from employment), current school location and type, job title, and number of years of active service.
Data Analysis The analytic file used to address the RQs was built through a series of match/merge routines. First, the Touro Dean’s Office sent the Excel file of Touro graduates’ social security numbers and birth dates (File 1) to NYCDOE over a secure data transfer site (FTP) for matching and merging to the EIS file. Then, NYCDOE transferred the matched/merged file (File 2) back to the Dean’s Office. Next, the Dean’s Office ran a merge of File 2 to the original Touro

9
graduate file to pick up data on year of graduation, program, and campus location, thereby creating File 3, the final analytic file. All merges and data analyses were performed with SPSS, version 23.0 software. The data analysis procedures used to address the research questions used descriptive statistics, including frequency distributions and cross-tabulations. In order to calculate the number of years between graduation and first employment in NYCDOE, we computed a variable “Years to Hire”, by subtracting the year of graduation from the year of first employment. Negative values indicated that the graduate was already employed in an NYCDOE school prior to graduating Touro, usually as a provisional or substitute teacher.
Results
Description of the Participant Sample This section describes the participants in the study sample in terms of age, campus location, and program majors. Table 1 shows the age of the study sample as of their date of program completion. The data are categorized into intervals ranging from 25 years or under through 56 or over. The modal interval for both classes of completers was 26-30, with just over 40% of each class in this interval. For the three classes combined, around 70% were 35 years of age or less. Completers of 2017 had twice as many younger students (25 and under) than completers of 2016, which had more than twice as many as the completers of 2015. Conversely, the completers of 2017 had fewer students 40 years of age and older than the other two classes. Table 2 shows the distribution of the completer participants by campus location. Around two-thirds of the three classes completed their programs at the Manhattan campus and around one-quarter at Brooklyn. Around seven percent were at the Bay Shore campus. Table 3 displays the program major areas of each class of completers while Table 4 shows the breakdown by campus for the combined sample. Out of the 17 program major areas displayed, Childhood Education/Special Education (Grades 1-6) and Early Childhood/Special Ed (Birth-Grade 2) combined had around three fifths of the graduates for each year, with the former comprising 32.9% and the latter 28% for the combined sample. For the combined sample, Special Education Generalist Grades 7-12 had the next highest percentage of enrollment, 8.5%, followed by TESOL, 6.8%, Bilingual Speech and Language Disabilities, 5.5%. As can be seen in Table 4 for the combined sample, more than half of the completers from the Bay Shore campus were in Childhood Education/Special Ed compared to around 30% for the Manhattan and Brooklyn campuses, while nearly half of the Brooklyn completers were in Early Childhood/ Special Education, compared to around 20% for the other two campuses. Nearly one-quarter of the Bay Shore completers were in Special Education Generalist Grades 7-12, compared to 13.4% and 4.7% for Brooklyn and Manhattan, respectively. Completers from many of the programs were almost exclusively located at the Manhattan campus, including Bilingual/TESOL programs, Education Technology, and Literacy.

10
Table 1. Age distribution of Touro Teacher Education completers by year of completion
Age Interval Statistic Completion year
Total 2015 2016 2017
25 or under
N completers 26 91 193 310
% within completion year 2.5% 7.2% 15.2% 8.7%
26 - 30 N completers 428 542 519 1489
% within completion year 41.2% 42.8% 40.8% 41.6%
31 - 35 N completers 212 254 244 710
% within completion year 20.4% 20.1% 19.2% 19.8%
36 - 40 N completers 133 132 122 387
% within completion year 12.8% 10.4% 9.6% 10.8%
41 - 45 N completers 86 107 86 279
% within completion year 8.3% 8.5% 6.8% 7.8%
46 - 50 N completers 57 58 36 151
% within completion year 5.5% 4.6% 2.8% 4.2%
51 - 55 N completers 54 40 37 131
% within completion year 5.2% 3.2% 2.9% 3.7%
56 or over N completers 43 42 36 121
% within completion year 4.1% 3.3% 2.8% 3.4%
Total N completers 1039 1266 1273 3578
% within completion year 100.0% 100.0% 100.0% 100.0%
Table 2. Campus distribution of Touro Teacher Education Program completers by year of completion
Campus Statistic Completion Year
Total 2015 2016 2017
Bay Shore N Completers 80 93 95 268
% within Year 7.7% 7.3% 7.5% 7.5%
Brooklyn N Completers 264 349 332 945
% within Year 25.4% 27.6% 26.1% 26.4%
Manhattan N Completers 695 824 846 2365
% within Year 66.9% 65.1% 66.5% 66.1%
Total N Completers 1039 1266 1273 3578
% within Year 100.0% 100.0% 100.0% 100.0%

11
Table 3. Distribution of program majors for Touro Teacher Education program completers by year of completion
Program Major Statistic Completion Year
Total 2015 2016 2017
Bil/Bicul Ed. PPS N Completers 21 12 12 45
% within Year 2.0% 0.9% 0.9% 1.3%
Bil. Gen. Ed. N Completers 5 15 4 24
% within Year 0.5% 1.2% 0.3% 0.7%
Bil. Spec. Ed. N Completers 86 21 10 117
% within Year 8.3% 1.7% 0.8% 3.3%
Biology N Completers 0 4 7 11
% within Year 0.0% 0.3% 0.5% 0.3%
Bil. Spch. Lang. Dis. N Completers 37 88 71 196
% within Year 3.6% 7.0% 5.6% 5.5%
Ed./Spec. Ed. Gr. 1 - Gr. 6 N Completers 361 385 430 1176
% within Year 34.7% 30.4% 33.8% 32.9%
TESOL N Completers 55 93 94 242
% within Year 5.3% 7.3% 7.4% 6.8%
Instruct. Tech. N Completers 34 28 28 90
% within Year 3.3% 2.2% 2.2% 2.5%
Mathematics Ed. N Completers 9 16 15 40
% within Year 0.9% 1.3% 1.2% 1.1%
School Counseling N Completers 0 2 11 13
% within Year 0.0% 0.2% 0.9% 0.4%
Early Child/Spec. Ed. Birth - Gr. 2
N Completers 269 332 402 1003
% within Year 25.9% 26.2% 31.6% 28.0%
Tching. Autistic & Mlt. Dis. N Completers 11 2 2 15
% within Year 1.1% 0.2% 0.2% 0.4%
Spec. Ed. Generalist Gr. 7 - 12 N Completers 83 115 105 303
% within Year 8.0% 9.1% 8.2% 8.5%
Teaching Literacy N Completers 53 58 63 174
% within Year 5.1% 4.6% 4.9% 4.9%
BS in Ed. Spec. ED. N Completers 0 51 4 55
% within Year 0.0% 4.0% 0.3% 1.5%
Mid Child. Spec. Ed. Gr. 5- 9 N Completers 15 4 0 19
% within Year 1.4% 0.3% 0.0% 0.5%
TESOL-CR-ITI * N Completers 0 40 15 55
% within Year 0.0% 3.2% 1.2% 1.5%
Total N Completers 1039 1266 1273 3578
% within Year 100.0% 100.0% 100.0% 100.0%
* TESOL-CR-ITI is the TESOL Clinically Rich Teacher Institute grant program

12
Table 4. Distribution of program majors for Touro Teacher Education program completers by campus location (Graduates of 2014-15, 2015-16, and 2016-17 combined)
Program Major Statistic Campus
Total Bay Shore Brooklyn Manhattan
Bil/Bicul Ed. PPS N Completers 0 0 45 45
% within Campus 0.0% 0.0% 1.9% 1.3%
Bil. Gen. Ed. N Completers 0 0 24 24
% within Campus 0.0% 0.0% 1.0% 0.7%
Bil. Spec. Ed. N Completers 0 4 113 117
% within Campus 0.0% 0.4% 4.8% 3.3%
Biology N Completers 0 1 10 11
% within Campus 0.0% 0.1% 0.4% 0.3%
Bil. Spch. Lang. Dis. N Completers 0 2 194 196
% within Campus 0.0% 0.2% 8.2% 5.5%
Ed./Spec. Ed. Gr. 1 - Gr. 6 N Completers 147 306 723 1176
% within Campus 54.9% 32.4% 30.6% 32.9%
TESOL N Completers 1 1 240 242
% within Campus 0.4% 0.1% 10.1% 6.8%
Instruct. Tech. N Completers 0 1 89 90
% within Campus 0.0% 0.1% 3.8% 2.5%
Mathematics Ed. N Completers 0 0 40 40
% within Campus 0.0% 0.0% 1.7% 1.1%
School Counseling N Completers 0 1 12 13
% within Campus 0.0% 0.1% 0.5% 0.4%
Early Child/ Spec. Ed. Birth - Gr. 2 N Completers 53 461 489 1003
% within Campus 19.8% 48.8% 20.7% 28.0%
Tching. Autistic & Mlt. Dis. N Completers 0 0 15 15
% within Campus 0.0% 0.0% 0.6% 0.4%
Spec. Ed. Generalist Gr. 7 - 12 N Completers 64 127 112 303
% within Campus 23.9% 13.4% 4.7% 8.5%
Teaching Literacy N Completers 1 1 172 174
% within Campus 0.4% 0.1% 7.3% 4.9%
BS in Ed. Spec. ED. N Completers 1 34 20 55
% within Campus 0.4% 3.6% 0.8% 1.5%
Mid Child. Spec. Ed. Gr. 5- 9 N Completers 1 6 12 19
% within Campus 0.4% 0.6% 0.5% 0.5%
TESOL-CR-ITI * N Completers 0 0 55 55
% within Campus 0.0% 0.0% 2.3% 1.5%
Total N Completers 268 945 2365 3578
% within Campus 100.0% 100.0% 100.0% 100.0%
*TESOL-CR-ITI is the TESOL Clinically Rich Intensive Teacher Institute grant program

13
RQ 1. Employment of Touro Graduates in NYCDOE Schools Yearly Employment Trends: The analyses that addressed research question 1 included all Touro teacher education completers from the three target years, with completers from January, June, and August collapsed under the respective classes of completers. Table 5 displays the number and percent of each class that were ever employed in the NYC public schools at any time up until the pinpoint day for reporting, Dec.1, 2-17. In total for the three classes combined, 42.5%% of the 3,578 completers held or obtained teaching positions in the NYC public schools, excluding those hired in non-teaching positions, including administrators, guidance counselors, attendance teachers, social workers, and school psychologists. The percentage employed is far higher than the 31.9% reported last year for several reasons. First, the higher percentage is partially attributable to additional completers from the classes of 2015 and 2016 who were hired for the first time over the year since the last report was issued. Second, a small number of the apparent additional hires are due to clerical updates and edits to the NYCDOE Human Resources files. Third, and most encouraging, is the relatively high employment rate for the current class of 2017, which at 41.4% is almost 10% points higher than the 31.6% reported last year for the class of 2016. This is an apples-to-apples comparison, since both statistics include the same program majors, except School Counseling, which is a very small major, and the data were extracted at the same relative time, about six months after June graduation. The hiring rate for the class of 2017 reverses a declining trend that began eight years ago, at the beginning of the current research study, and may auger a loosening of the teacher labor market that has suppressed hiring over the decade.
Table 5. Number and percent of Touro Teacher Education completers that were employed in the NYC public schools by year of completion
Year of Completion N Completers N Hired by the NYC Public
Schools as Teachers % Hired by the NYC Public
Schools as Teachers 2015 1039 432 41.6% 2016 1266 560 44.2% 2017 1273 527 41.4% Total 3578 1519 42.5%
Note 1. These data include only completers who were hired as teachers by the NYC public schools. Completers hired in non-teaching positions, such as administrators and guidance counselors, are not included as hires.
Note 2. Data for 2015 and 2016 have been updated from the previous report, dated March 29, 2017. The updates include completers who were hired after the closing date for the previous report and updates and revisions to the NYCDOE Human Resources files.
Employment by Certification Program: Table 6 displays the employment data disaggregated by 17 program certification areas for the three-year completer sample while Table 7 displays the same data for the current class of 2017, both in descending order of % Hired. For the three-year sample, the program major areas with the highest employment rates were TESOL

14
CR-ITI, which had 55 completers with a total employment rate of 94.5%, and Special Ed. Generalist Gr. 7-12, which had 303 completers and a 73.3% hiring rate. Six other program major areas had employment rates of at least 50%: Instructional Technology, with 90 completers and a 67.8% rate, the traditional TESOL major, with 242 completers and a 66.9% rate, Teaching Autistic and Multiple Disabilities, 15 completers and a 60% hiring rate, Teaching Literacy, 174 completers and a 56.9% rate, Mid Childhood Special Ed, 19 completers and a 52.6% rate, and Mathematics Ed, 40 completers and a 50% hiring rate. Bilingual Speech and Language Disabilities and Bilingual Special Education, two relatively large programs that have shown low hiring rates in past reports, continued to exhibit low hiring rates, 17.3% and 12.8%, respectively.
Table 6. Number and percent of Touro Teacher Education program completers hired by the NYC public schools disaggregated by program
major (2014-15, 2015-16, & 2016-17 combined)
Program Major N Compl. N Hired
% Hired
TESOL-CR-ITI * 55 52 94.5% Spec. Ed. Generalist Gr. 7 - 12 303 222 73.3%
Instruct. Tech. 90 61 67.8% TESOL 242 162 66.9%
Tching. Autistic & Mlt. Dis. 15 9 60.0% Teaching Literacy 174 99 56.9%
Mid Child. Spec. Ed. Gr. 5- 9 19 10 52.6% Mathematics Ed. 40 20 50.0%
Biology 11 5 45.5% Ed./Spec. Ed. Gr. 1 - Gr. 6 1176 512 43.5%
Bil. Gen. Ed. 24 7 29.2% Early Child/ Spec. Ed. Birth - Gr. 2 1003 288 28.7%
School Counseling 13 3 23.1% Bil/Bicul Ed. PPS 45 9 20.0%
BS in Ed. Spec. ED. 55 11 20.0% Bil. Spch. Lang. Dis. 196 34 17.3%
Bil. Spec. Ed. 117 15 12.8% Total 3578 1519 42.5%
Note. In descending order of % Hired. * TESOL-CR-ITI is the TESOL Clinically Rich Intensive Teacher Institute grant program

15
For the class of 2017 alone, as would be expected, the employment rates by certification area are similar to those for the three-year sample. As can be seen in Table 7 for 2016, the program major with the highest employment rate was TESOL-CR-ITI, with 15 completers and a 93.3% hiring rate. Teaching Autistic and Multiple Disabilities had a 100% rate, but only two completers. Four other majors had hiring rates over 50%, as can be seen in the Table 7. Two small programs, Bilingual/Bicultural Ed. Pupil Personnel Services and the Bachelor’s Ed/Spec. Ed. Major had no hires for 2017.
Table 7. Number and percent of Touro Teacher Education program completers hired by the NYC public schools disaggregated by
program major (2016 - 2017 completers)
Program Major N Compl. N Hired
% Hired
Tching. Autistic & Mlt. Dis. 2 2 100.0%
TESOL-CR-ITI * 15 14 93.3%
Spec. Ed. Generalist Gr. 7 - 12 105 75 71.4%
Teaching Literacy 63 43 68.3%
Instruct. Tech. 28 17 60.7%
TESOL 94 56 59.6%
Mathematics Ed. 15 7 46.7%
Biology 7 3 42.9%
Ed./Spec. Ed. Gr. 1 - Gr. 6 430 180 41.9%
Early Child/ Spec. Ed. Birth - Gr. 2 402 111 27.6%
School Counseling 11 3 27.3%
Bil. Gen. Ed. 4 1 25.0%
Bil. Spec. Ed. 10 2 20.0%
Bil. Spch. Lang. Dis. 71 13 18.3%
Bil/Bicul Ed. PPS 12 0 0.0%
BS in Ed. Spec. ED. 4 0 0.0%
Total 1273 527 41.4%
Note. In descending order of % Hired. * TESOL-CR-ITI is the TESOL Clinically Rich Intensive Teacher Institute grant program
Employment by Campus: Table 8 breaks down the employment data by campus for the three-year sample while Table 9 provides the same information for the class of 2017. For the three-year sample, the hiring rate for the Brooklyn campus has almost three % points higher than for Bay Shore, 46.1% for the former and 43.3% for the latter, with Manhattan showing a 40.9% hiring rate. The campus employment rates for the class of 2017 were more even, with Manhattan two points lower than Brooklyn and Bay Shore in between.
16
Table 8. Number and percent of Touro Teacher Education program completers hired by the NYC public schools
disaggregated by campus location (2014-15, 2015-16, & 2016-17 combined)
Campus N Completers N Hired % Hired Bay Shore 268 116 43.3% Brooklyn 945 436 46.1%
Manhattan 2365 967 40.9% Total 3578 1519 42.5%
Table 9. Number and percent of Touro Teacher Education program completers hired by the NYC public schools
disaggregated by campus location (2016 - 17 completers)
Campus N Completers N Hired % Hired Bay Shore 95 40 42.1% Brooklyn 332 142 42.8%
Manhattan 846 345 40.8% Total 1273 527 41.4%
RQ 2. Years between Graduation and First Hiring
The relationship between graduation from Touro’s Graduate School of Education and employment in the NYCDOE schools in complex. Many students began working in the schools on a provisional or probationary license, with some as substitute or per diem substitutes. They enrolled at Touro seeking degrees required for permanent licenses or to meet requirements for teaching in other certification areas. Table 10 shows the years between program completion and the date of initial employment in the NYC public schools for the study sample broken down by year of completion. As can be seen in Table 10, the percentage of completers who were already working the NYC public schools prior to completion of their most recent program increased slightly between the classes of 2016 and 2017, but is still considerably lower than it was at the beginning of the study (around 75%) eight years ago. The percentage hired within one year of program completion increased by more than 8% points between the classes of 2016 and 2017, from 51.1% to 59.2%, accelerating to a positive trend for the three classes. Based on this research, between 5% and 10% of the 2017 completers will gain employment in the NYC public schools over the next two years, raising the anticipated overall hiring rate to its highest level in many years.

17
Table 10. Number and percent of Touro teacher education program completers hired by NYCDOE before and after the year of their program completion by year of completion
Years between hiring and program completion Statistic
Year of Completion Total
2015 2016 2017
3 or more years before completion N Completers 147 217 215 579
% within Year 34.0% 38.8% 40.8% 38.1%
2 years before completion N Completers 41 0 0 41
% within Year 9.5% 0.0% 0.0% 2.7%
Within 1 year of completion N Completers 216 286 312 814
% within Year 50.0% 51.1% 59.2% 53.6%
More than 1 year after completion N Completers 28 57 0 85
% within Year 6.5% 10.2% 0.0% 5.6%
Total N Completers 432 560 527 1519
% within Year 100.0% 100.0% 100.0% 100.0%
RQ 3. Completers’ Schools of Initial Employment Distributions of Boroughs and Levels of Schools of First Employment: Table 11 shows the borough distribution of the completers’ first school of hire for each class of completers. The borough with the largest percentage of new hires was Brooklyn, with 36.5% of the hires for the three classes combined. The next highest percentage of hires was Queens with 22.3%. Across the three years, the percentage of hires in the Bronx increased from 13.4% for the class of 2015 to 16.3% for the class of 2017. The percentage of hires in Staten Island schools decreased over the same period from 13.2% for the class of 2015 to 9.5% for the class of 2017. Table 12 displays the borough distributions for the schools of initial hiring disaggregated by campus location for the three classes combined. Completers from the Brooklyn campus were hired mainly in Brooklyn and Staten Island schools, 53.7% in the former and 31.4% in the latter. The initial schools of Manhattan campus completers were widely dispersed throughout the boroughs, with a small number in Staten Island. More than 40% of the Bayshore completers were employed in Queens’ schools, the borough closest in proximity to the campus, with one-quarter employed in Brooklyn.
Table 13 displays the distributions of types of schools of initial hires for each of the three classes. Consistent with previous reports, more than 40% of each class’ new hires was employed in elementary schools and nearly 20% in high schools. Close to 15% of each class’ new hired were employed in K-8 schools and 19% of the class of 2015 and 14% of the class of 2016 were hired in JHS/intermediate schools. Around 17% of the class of 2015 and 19% of the class of 2016 were hired in high school/secondary schools. The percentage employed in middle schools declined from 18% for the class of 2015 to 13.8% for the class of 2107 with a concomitant increase in the percentage employed in K-12 schools from 4.6% to 7.5%.

18
Table 11. Borough distribution of initial hiring schools for Touro Teacher Education program completers by year of program completion
Borough of First Hire Statistic Year of Completion
Total 2015 2016 2017
Manhattan N Completers 39 68 66 173
% within Grad Year 9.0% 12.1% 12.5% 11.4%
Bronx N Completers 58 74 86 218
% within Grad Year 13.4% 13.2% 16.3% 14.4%
Brooklyn N Completers 173 196 185 554
% within Grad Year 40.0% 35.0% 35.1% 36.5%
Queens N Completers 88 131 120 339
% within Grad Year 20.4% 23.4% 22.8% 22.3%
Staten Island N Completers 57 64 50 171
% within Grad Year 13.2% 11.4% 9.5% 11.3%
Other (Including citywide offices and programs
N Completers 17 27 20 64
% within Grad Year 3.9% 4.8% 3.8% 4.2%
Total N Completers 432 560 527 1519
% within Grad Year 100.0% 100.0% 100.0% 100.0%
Table 12. Borough distribution of initial hiring schools for Touro Teacher Education program completers by campus location (2014-15, 2015-16, & 2016-17 combined)
Borough of First Hire Statistic Campus
Total Bay Shore Brooklyn Manhattan
Manhattan N Completers 18 17 138 173 % within Grad
Year 15.5% 3.9% 14.3% 11.4%
Bronx N Completers 17 12 189 218 % within Grad
Year 14.7% 2.8% 19.5% 14.4%
Brooklyn N Completers 29 234 291 554 % within Grad
Year 25.0% 53.7% 30.1% 36.5%
Queens N Completers 47 21 271 339 % within Grad
Year 40.5% 4.8% 28.0% 22.3%
Staten Island N Completers 1 137 33 171 % within Grad
Year 0.9% 31.4% 3.4% 11.3%
Other (Including citywide offices and programs
N Completers 4 15 45 64 % within Grad
Year 3.4% 3.4% 4.7% 4.2%
Total N Completers 116 436 967 1519 % within Grad
Year 100.0% 100.0% 100.0% 100.0%

19
Table 13. Distribution of types of schools in which Touro Teacher Education program
completers were first employed disaggregated by year of completion
School Type Statistic Completion Year
Total 2015 2016 2017
CENTRAL, DISTRICT, & REGI0NAL HEADQUARTERS
N completers 6 5 7 18 % within year 1.5% 0.9% 1.4% 1.2%
DISTRICT PRE-K CENTER N completers 6 5 5 16 % within year 1.5% 0.9% 1.0% 1.1%
ELEMENTARY N completers 178 240 224 642 % within year 43.2% 45.4% 44.3% 44.4%
HIGH SCHOOL N completers 74 96 98 268 % within year 18.0% 18.1% 19.4% 18.5%
JUNIOR HIGH-INTERMEDIATE-MIDDLE
N completers 74 78 70 222 % within year 18.0% 14.7% 13.8% 15.3%
K-12 ALL GRADES N completers 19 26 38 83 % within year 4.6% 4.9% 7.5% 5.7%
K-8 N completers 55 79 64 198 % within year 13.3% 14.9% 12.6% 13.7%
Total N completers 412 529 506 1447 % within year 100.0% 100.0% 100.0% 100.0%
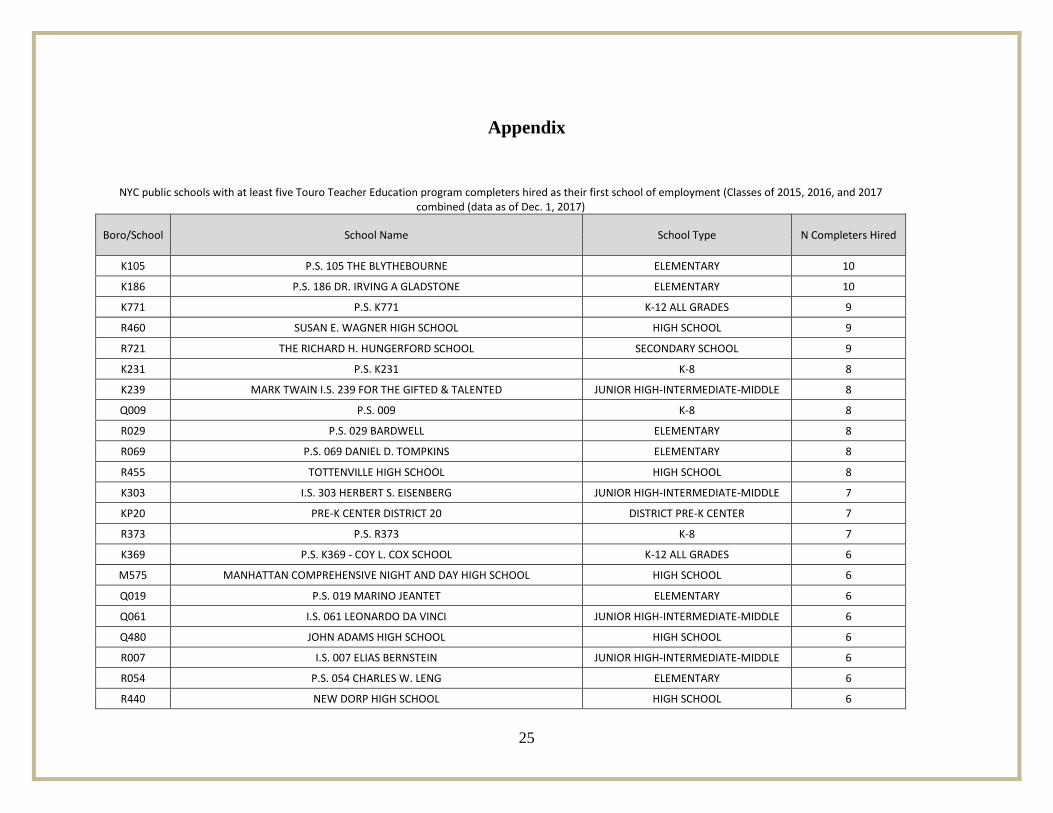
Note. Data are missing for 72 completers Concentration of Employment in NYCDOE Schools: The first graduate tracking report found that Touro graduates were ubiquitous in the NYCDOE schools, with the graduates from the classes of 2008 – 2013 serving in 1,081 or two thirds of the 1,582 NYCDOE public schools. The report also found a subset of schools with high concentrations of graduates. This report looks at similar data for completers for the three classes of 2015, 2016, and 2017. Table 14 displays data on the numbers of NYC Public Schools hiring Touro completers from the three classes combined, including the concentration of these completers in certain schools. As can be seen in the table, of the 1,582 NYC public schools,2 Touro completers were initially hired in 802 schools, over one-half of the schools in the city system. This number of schools is nearly twice the number that hired completers last year for the classes of 2015 and 2016. The difference is attributable to new hires in 2017 from the previous two classes and new hires from the recent class of 2017. In addition to the breadth of their presence in NYC public schools, there continue to be schools with high concentrations of completers. A total of 343 schools hired more than one completer from the three classes to their faculty with 69 of these schools having at least four and 40 having at least five. (The appendix has a list of the high concentration schools. The data point to the continuation of a strong relationship between the NYC public schools and Touro.
2 Number of schools is based on NYCDOE statistical data for 2016-17.

20
Table 14. Numbers of NYC Public Schools hiring Touro completers and the numbers of completers hired by these schools (Completers for 2015, 2016, & 2017 combined)
Schools with Touro Completers First
School Hired
Total NYC Public Schools 1,582 Touro completers hired * 1,456 Number of schools hiring Touro completers 802 % of schools hiring Touro completers 50.7% Schools hiring more than 1 Touro completer 343 Schools hiring at least 4 Touro completers 69 Schools hiring at least 5 Touro completers 40 * Excludes completers hired in Central Headquarters and District Offices
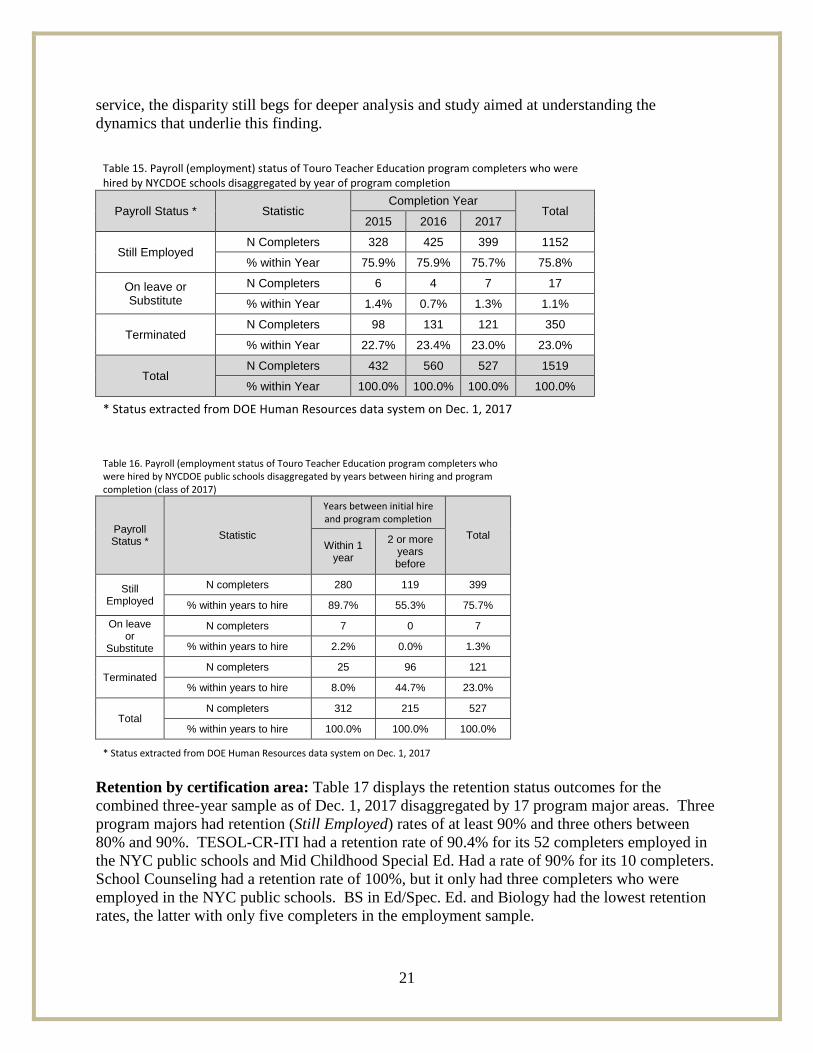
RQ 4. Completers’ Retention Retention: Table 15 displays the employment status (current payroll status) of the Touro completers as of Dec. 1, 2017 for each of the three years of the study. The status categories are Still Employed, a single category for those On Leave, On Sabbatical, or serving as a Substitute Teacher, and a category for those who have been Terminated from the payroll, signifying that they left the NYC school system. Overall, of all graduates from each class of completers who were hired by the NYC public schools, around 76% of each class were Still Employed and on the regular payroll as of Dec. 1, 2017; around 23% had been Terminated from the payroll. These retention rates are substantially lower than the 80-85% observed in earlier reports, as well as near 90% reported last year. However, in order to understand the retention/attrition picture, one has to drill down into the complex history of Touro completers. As shown earlier in this report and previous reports on this research, completers were varied in the time between graduation and when they were first hired, with a large percentage having been employed in the NYC public schools prior to program completion. Table 16 drills down into the complexities of this relationship by disaggregating the payroll status categories for the completers of 2017 by two columns that represent the years between graduation and first hiring. As can be seen in this table, the retention rate, in the category Still Employed, for completers hired within one of graduation is nearly 90% compared to only 55.3% for completers who were hired two or more years before program completion. The attrition rate for the former group is 8% compared to 44.7% for the latter. The attrition rate for completers hired within one year of graduation is comparable to the NYC system-wide attrition rate for first-year teachers of 8.2% which was reported in an analysis by the United Federation of Teachers (UFT) in a 2015 paper posted on the organization’s website.3 The attrition rate of 44.7% for completers hired two or more years before program completion is substantially higher than the than the 37.4% 5-year system-wide attrition rate reported in the UFT document. Although the parameters of the samples are not parallel, with the sample of Touro completers including teachers with a wide range of years of
3 http://www.uft.org/files/attachments/attrition-report-dec-2015.pdf
21
service, the disparity still begs for deeper analysis and study aimed at understanding the dynamics that underlie this finding.
Table 15. Payroll (employment) status of Touro Teacher Education program completers who were hired by NYCDOE schools disaggregated by year of program completion
Payroll Status * Statistic Completion Year
Total 2015 2016 2017
Still Employed N Completers 328 425 399 1152
% within Year 75.9% 75.9% 75.7% 75.8%
On leave or Substitute
N Completers 6 4 7 17
% within Year 1.4% 0.7% 1.3% 1.1%
Terminated N Completers 98 131 121 350
% within Year 22.7% 23.4% 23.0% 23.0%
Total N Completers 432 560 527 1519
% within Year 100.0% 100.0% 100.0% 100.0%
* Status extracted from DOE Human Resources data system on Dec. 1, 2017
Table 16. Payroll (employment status of Touro Teacher Education program completers who were hired by NYCDOE public schools disaggregated by years between hiring and program completion (class of 2017)
Payroll Status * Statistic
Years between initial hire and program completion
Total Within 1
year
2 or more years before
Still Employed
N completers 280 119 399
% within years to hire 89.7% 55.3% 75.7%
On leave or
Substitute
N completers 7 0 7
% within years to hire 2.2% 0.0% 1.3%
Terminated N completers 25 96 121
% within years to hire 8.0% 44.7% 23.0%
Total N completers 312 215 527
% within years to hire 100.0% 100.0% 100.0%
* Status extracted from DOE Human Resources data system on Dec. 1, 2017
Retention by certification area: Table 17 displays the retention status outcomes for the combined three-year sample as of Dec. 1, 2017 disaggregated by 17 program major areas. Three program majors had retention (Still Employed) rates of at least 90% and three others between 80% and 90%. TESOL-CR-ITI had a retention rate of 90.4% for its 52 completers employed in the NYC public schools and Mid Childhood Special Ed. Had a rate of 90% for its 10 completers. School Counseling had a retention rate of 100%, but it only had three completers who were employed in the NYC public schools. BS in Ed/Spec. Ed. and Biology had the lowest retention rates, the latter with only five completers in the employment sample.

22
Table 17. Payroll (retention) status of Touro Teacher Education completers disaggregated by program major (classes of 2015, 2016, 2017 combined) (as of Dec. 1, 2017)
Program Major Statistic Payroll Status
Total Still Employed
On leave or Sub Terminated
School Counseling N Completers 3 0 0 3
% within Major 100.0% 0.0% 0.0% 100.0% TESOL-Clinically Rich
Intensive Teacher Institute (CR-ITI)
N Completers 47 0 5 52
% within Major 90.4% 0.0% 9.6% 100.0%
Mid Child. Spec. Ed. Gr. 5- 9
N Completers 9 0 1 10
% within Major 90.0% 0.0% 10.0% 100.0%
Bil. Gen. Ed. N Completers 6 0 1 7
% within Major 85.7% 0.0% 14.3% 100.0%
Spec. Ed. Generalist Gr. 7 - 12
N Completers 189 0 33 222
% within Major 85.1% 0.0% 14.9% 100.0%
Mathematics Ed. N Completers 16 1 3 20
% within Major 80.0% 5.0% 15.0% 100.0%
Tching. Autistic & Mlt. Dis. N Completers 7 0 2 9
% within Major 77.8% 0.0% 22.2% 100.0%
TESOL N Completers 124 1 37 162
% within Major 76.5% 0.6% 22.8% 100.0%
Instruct. Tech. N Completers 46 1 14 61
% within Major 75.4% 1.6% 23.0% 100.0%
Ed./Spec. Ed. Gr. 1 - Gr. 6 N Completers 383 8 121 512
% within Major 74.8% 1.6% 23.6% 100.0%
Early Child Spec. Ed. Birth - Gr. 2
N Completers 212 4 72 288
% within Major 73.6% 1.4% 25.0% 100.0%
Teaching Literacy N Completers 68 1 30 99
% within Major 68.7% 1.0% 30.3% 100.0%
Bil. Spch. Lang. Dis. N Completers 23 0 11 34
% within Major 67.6% 0.0% 32.4% 100.0%
Bil/Bicul Ed. PPS N Completers 5 0 4 9
% within Major 55.6% 0.0% 44.4% 100.0%
Bil. Spec. Ed. N Completers 8 0 7 15
% within Major 53.3% 0.0% 46.7% 100.0%
BS in Ed. Spec. ED. N Completers 5 1 5 11
% within Major 45.5% 9.1% 45.5% 100.0%
Biology N Completers 1 0 4 5
% within Major 20.0% 0.0% 80.0% 100.0%
Total N Completers 1152 17 350 1519
% within Major 75.8% 1.1% 23.0% 100.0%
.

23
Summary and Conclusions
This is the fourth free-standing report of findings from a study that tracks the employment and retention of Touro Graduate School of Education’s Teacher Education program completers employed in the New York City public schools. The study uses a non-experimental, quantitative research design with extant data to address research questions about the numbers and percentages of program completers (graduates) who are employed in the NYC public schools, the types of schools in which they teach, when they began teaching, and their retention in these schools and the school system. The participants were completers of the teacher education program from the three classes of 2015, 2016, and 2017 and the data for the study were employee data extracted from the NYCDOE Employee Information System (EIS). The major findings are as follows:
• In total for the three classes combined, 42.5% of the 3,578 completers held or obtained teaching positions in the NYC public schools. The percentage employed is far higher than the 31.9% reported last year. Although the higher employment percentage is partially attributable to additional completers from the classes of 2015 and 2016 who were hired for the first time over the year since the last report was issued, as well as clerical updates and edits to the NYCDOE Human Resources files, it is chiefly due to the relatively high employment rate for the current class of 2017, which at 41.4% is almost 10% points higher than the 31.6% reported last year for the class of 2016. The hiring rate for the class of 2017 reverses a declining trend that began eight years ago, at the beginning of the current research study, and may auger a loosening of the teacher labor market that has suppressed hiring over the decade.
• For the three-year sample, the program major areas with the highest employment rates were TESOL Clinically Rich Intensive Teacher Institute (CR-ITI), which had 55 completers with a total employment rate of 94.5%, and Special Ed. Generalist Gr. 7-12, which had 303 completers and a 73.3% hiring rate. Six other program major areas had employment rates of at least 50%: Instructional Technology, with 90 completers and a 67.8% rate, the traditional TESOL major, with 242 completers and a 66.9% rate, Teaching Autistic and Multiple Disabilities, 15 completers and a 60% hiring rate, Teaching Literacy, 174 completers and a 56.9% rate, Mid Childhood Special Ed, 19 completers and a 52.6% rate, and Mathematics Education, 40 completers and a 50% hiring rate.
• The percentage of completers who were already working in the NYC public schools prior to completion of their most recent program increased slightly between the classes of 2016 and 2017, but is still considerably lower than it was at the beginning of the study (around 75%) eight years ago. The percentage hired within one year of program completion increased by more than 8% points between the classes of 2016 and 2017, from 51.1% to 59.2%, accelerating to a positive trend across the three classes. Based on this research, between 5% and 10% of the 2017 completers will gain employment in the NYC public schools over the next two years, raising the anticipated overall hiring rate to its highest level in many years.
• The borough with the largest percentage of hires was Brooklyn, with 36.5% of the new hires for the three classes combined. The next highest percentage of hires was Queens with 22.3%. Across the three years, the percentage of hires in the Bronx

24
increased from 13.4% for the class of 2015 to 16.3% for the class of 2017. The percentage of hires in Staten Island schools decreased over the same period from 13.2% for the class of 2015 to 9.5% for the class of 2017.
• Completers from the Brooklyn campus were hired mainly in Brooklyn and Staten Island schools, 53.7% in the former and 31.4% in the latter. The initial schools of Manhattan campus completers were widely dispersed throughout the boroughs, with a small number in Staten Island. More than 40% of the Bay Shore completers were employed in Queens’ schools, the borough closest in proximity to the campus, with one-quarter employed in Brooklyn.
• Consistent with previous reports, more than 40% of each class’ new hires was employed in elementary schools and nearly 20% in high schools.
• Touro completers were initially hired in 802 schools, over one-half of the schools in the city system. This number of schools is nearly twice the number that hired completers last year for the classes of 2015 and 2016. The difference is attributable to new hires in 2017 from the previous two classes and new hires from the recent class of 2017. In addition to the breadth of their presence in NYC public schools, there continue to be schools with high concentrations of completers. A total of 343 schools hired more than one completer from the three classes to their faculty, with 69 of these schools having at least four and 40 having at least five.
• Overall, of all completers from each class who were hired by the NYC public schools, around 76% was Still Employed and on the regular payroll as of Dec. 1, 2017; around 23% had been Terminated from the payroll.
• The retention rate for completers hired within one year of graduation is nearly 90% compared to only 55.3% for completers who were hired two or more years before program completion. The attrition rate for the former group is 8% compared to 44.7% for the latter. The attrition rate for completers hired within one year of graduation is comparable to the NYC system-wide attrition rate for first-year teachers of 8.2%.
• Three program majors had retention (Still Employed) rates of at least 90% and three others between 80% and 90%. TESOL-CR-ITI had a retention rate of 90.4% for its 52 completers employed in the NYC public schools and Mid Childhood Special Ed. had a rate of 90% for its 10 completers. School Counseling had a retention rate of 100%, but it only had three completers who were employed in the NYC public schools.
The conclusion of this report is that Touro’s Graduate School of Education continues to be a major provider of teachers to the pipeline filling the classes of New York City public schools. Large numbers of completers serve in an increasing number and percentage of NYC public schools, with completers for the classes of 2015, 2016, and 2017 staffing the faculties of more than half of NYC’s public schools and large concentrations of completers working in certain schools. Moreover, it appears that the New York City market for Touro completers has turned a corner, with larger percentages of new completers gaining employment in NYC public schools. In addition, the retention rate for completers working in NYC public schools is comparable to that for the full population of teachers. Nevertheless, given the complex relationship between Touro and the NYC public schools, with Touro serving as both provider of new teachers and the trainer of existing teachers, faculty discussion of these findings and continued tracking and research on Touro Teacher Education program completers is essential.
25
Appendix
NYC public schools with at least five Touro Teacher Education program completers hired as their first school of employment (Classes of 2015, 2016, and 2017 combined (data as of Dec. 1, 2017)
Boro/School School Name School Type N Completers Hired
K105 P.S. 105 THE BLYTHEBOURNE ELEMENTARY 10
K186 P.S. 186 DR. IRVING A GLADSTONE ELEMENTARY 10
K771 P.S. K771 K-12 ALL GRADES 9
R460 SUSAN E. WAGNER HIGH SCHOOL HIGH SCHOOL 9
R721 THE RICHARD H. HUNGERFORD SCHOOL SECONDARY SCHOOL 9
K231 P.S. K231 K-8 8
K239 MARK TWAIN I.S. 239 FOR THE GIFTED & TALENTED JUNIOR HIGH-INTERMEDIATE-MIDDLE 8
Q009 P.S. 009 K-8 8
R029 P.S. 029 BARDWELL ELEMENTARY 8
R069 P.S. 069 DANIEL D. TOMPKINS ELEMENTARY 8
R455 TOTTENVILLE HIGH SCHOOL HIGH SCHOOL 8
K303 I.S. 303 HERBERT S. EISENBERG JUNIOR HIGH-INTERMEDIATE-MIDDLE 7
KP20 PRE-K CENTER DISTRICT 20 DISTRICT PRE-K CENTER 7
R373 P.S. R373 K-8 7
K369 P.S. K369 - COY L. COX SCHOOL K-12 ALL GRADES 6
M575 MANHATTAN COMPREHENSIVE NIGHT AND DAY HIGH SCHOOL HIGH SCHOOL 6
Q019 P.S. 019 MARINO JEANTET ELEMENTARY 6
Q061 I.S. 061 LEONARDO DA VINCI JUNIOR HIGH-INTERMEDIATE-MIDDLE 6
Q480 JOHN ADAMS HIGH SCHOOL HIGH SCHOOL 6
R007 I.S. 007 ELIAS BERNSTEIN JUNIOR HIGH-INTERMEDIATE-MIDDLE 6
R054 P.S. 054 CHARLES W. LENG ELEMENTARY 6
R440 NEW DORP HIGH SCHOOL HIGH SCHOOL 6

26
K094 P.S. 094 THE HENRY LONGFELLOW ELEMENTARY 5
K097 P.S. 97 THE HIGHLAWN ELEMENTARY 5
K153 P.S. 153 HOMECREST ELEMENTARY 5
K215 P.S. 215 MORRIS H. WEISS ELEMENTARY 5
K228 I.S. 228 DAVID A. BOODY JUNIOR HIGH-INTERMEDIATE-MIDDLE 5
K278 J.H.S. 278 MARINE PARK JUNIOR HIGH-INTERMEDIATE-MIDDLE 5
K505 FRANKLIN DELANO ROOSEVELT HIGH SCHOOL HIGH SCHOOL 5
M094 P.S. M094 K-12 ALL GRADES 5
Q042 P.S./M.S 042 R. VERNAM K-8 5
Q110 P.S. 110 ELEMENTARY 5
Q233 P.S. Q233 K-12 ALL GRADES 5
Q425 JOHN BOWNE HIGH SCHOOL HIGH SCHOOL 5
R013 P.S. 013 M. L. LINDEMEYER ELEMENTARY 5
R025 SOUTH RICHMOND HIGH SCHOOL I.S./P.S. 25 K-12 ALL GRADES 5
R049 I.S. 49 BERTA A. DREYFUS JUNIOR HIGH-INTERMEDIATE-MIDDLE 5
R051 I.S. 051 EDWIN MARKHAM JUNIOR HIGH-INTERMEDIATE-MIDDLE 5
R072 I.S. 072 ROCCO LAURIE JUNIOR HIGH-INTERMEDIATE-MIDDLE 5
R080 THE MICHAEL J. PETRIDES SCHOOL K-12 ALL GRADES 5