Embed Size (px)
Citation preview
Tourist Activity Analysis by Leveraging Mobile Social Media Data
This is the Accepted version of the following publication
Vu, Huy Quan, Li, G, Law, R and Zhang, Y (2017) Tourist Activity Analysis by Leveraging Mobile Social Media Data. Journal of Travel Research. ISSN 0047-2875
The publisher’s official version can be found at http://journals.sagepub.com/doi/10.1177/0047287517722232Note that access to this version may require subscription.
Downloaded from VU Research Repository https://vuir.vu.edu.au/34417/
1
TOURIST ACTIVITY ANALYSIS BY LEVERAGING MOBILE
SOCIAL MEDIA DATA ABSTRACT
Approaches to traditional travel diary construction rely on tourist participation and manual recording; hence, they are not only time-consuming but also limited in the scale and the number of samples. Online social network platforms have been used as alternative data sources for capturing the movements and travel patterns of tourists at a large scale. However, they fail to provide detailed contextual information on tourist activities for further analysis. In this paper, we present a new approach to travel diary construction based on the venue check-in data available in mobile social media with rich information on locations, time, and activities. Our case study focuses on the inbound tourism in Hong Kong using a data set comprising of 17,355 check-ins generated by 600 tourists. We demonstrate how the proposed travel diary can provide useful practical implications for applications in location management, transportation management, impact management, and tourist experience promotion among others. Keywords: activity preference, travel diary, Foursquare, Twitter, check-in 1. INTRODUCTION
Tourism researchers have long sought insights into the travel behaviors and activity patterns of tourists (Edwards et al. 2009; Vu et al. 2015). Such information has significant implications for product development and destination management (Lew and McKercher 2006). Tourism practitioners can anticipate the needs and tailor personalized package offers to serve tourists in a more satisfactory manner (Finsterwalder and Laesser 2013). The level and choice of tourist activities are affected significantly by the spatial mobility of tourists, the duration of the holiday, and the characteristics of the places visited (Zillinger 2008). Understanding tourism activity patterns enables transportation management organizations to appropriately plan and manage tourist flows (Xia et al. 2010). Spatial and temporal activity patterns can be used to define the boundaries of districts and nodes and to develop new attractions and products along common routes (Chancellor 2012). Information on the movement of tourists helps tourism practitioners and policy makers create plans to prevent a potentially negative tourism effect on society, environment, and culture (Lew and McKercher 2006).
Understanding the spatial and temporal information on the travel behavior of tourists is important to comprehend their travel activities. A traditional questionnaire-based survey approach may be unable to sufficiently capture microscopic travel behavior in spatial–temporal dimensions (Asakura and Iryo 2007). A travel diary can provide detailed insights into tourist activities (Poria 2006). Diaries are used to record tourists’ daily movements, places visited, activities, time of day, duration of time spent at each place, and transport mode taken to navigate around the destination (Zillinger 2008; McKercher and Lau 2008). In addition to paper-based travel diaries, travel data can also be collected using mobile instruments with global positioning system (GPS) technology (Zakrisson and Zillinger 2012; McKercher et al. 2012). The data are represented as sequential “dots” in spatial–temporal dimensions (longitude, latitude, and time stamp), which provide detailed and accurate information for evaluating the effects and performances of transportation policies (Asakura and Iryo 2007).
2
Travel diary is a promising data source for travel activity analysis because it captures more detailed information on tourist experiences compared with traditional questionnaires (Asakura and Iryo 2007; McKercher and Lau 2008; McKercher et al. 2012). A major drawback of existing works on travel diary construction is their dependence on the direct contact with tourists to seek their participation in the data collection process. Tourists need to spend time manually documenting their trips, and extra costs are incurred in purchasing mobile instruments to record spatial–temporal travel data. Thus, the collected data are limited to minimal responses in small-scale tourism destinations for a limited period.
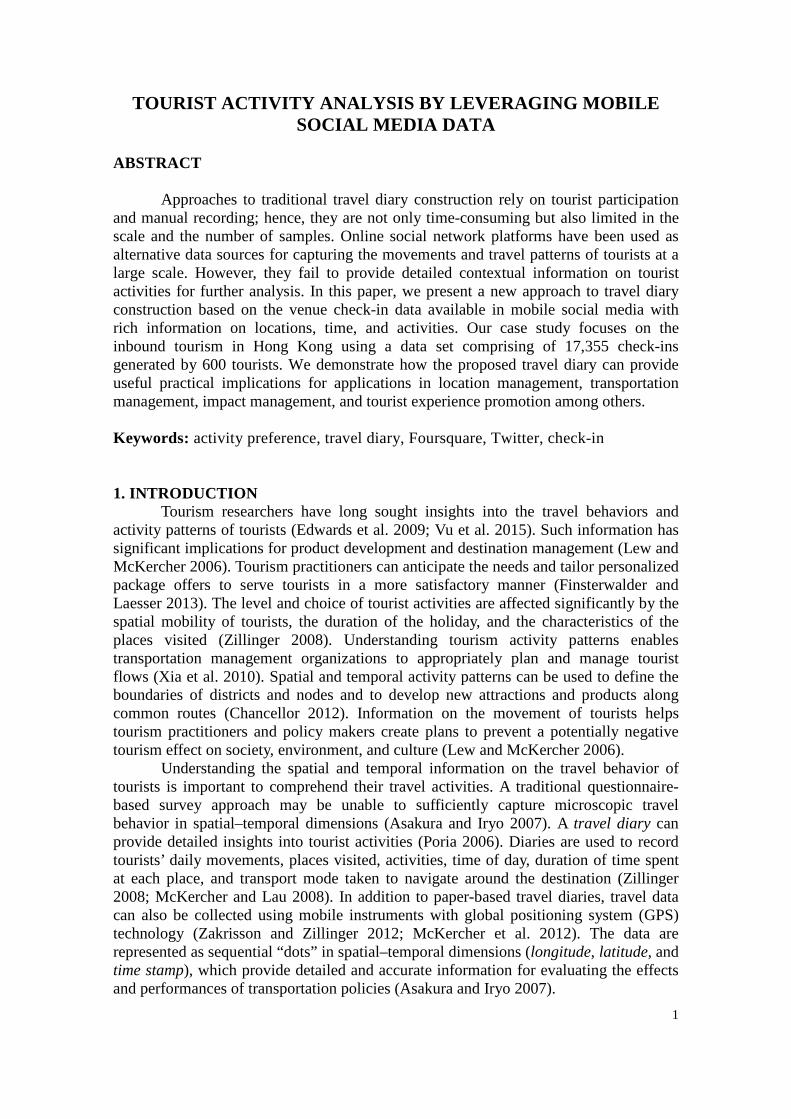
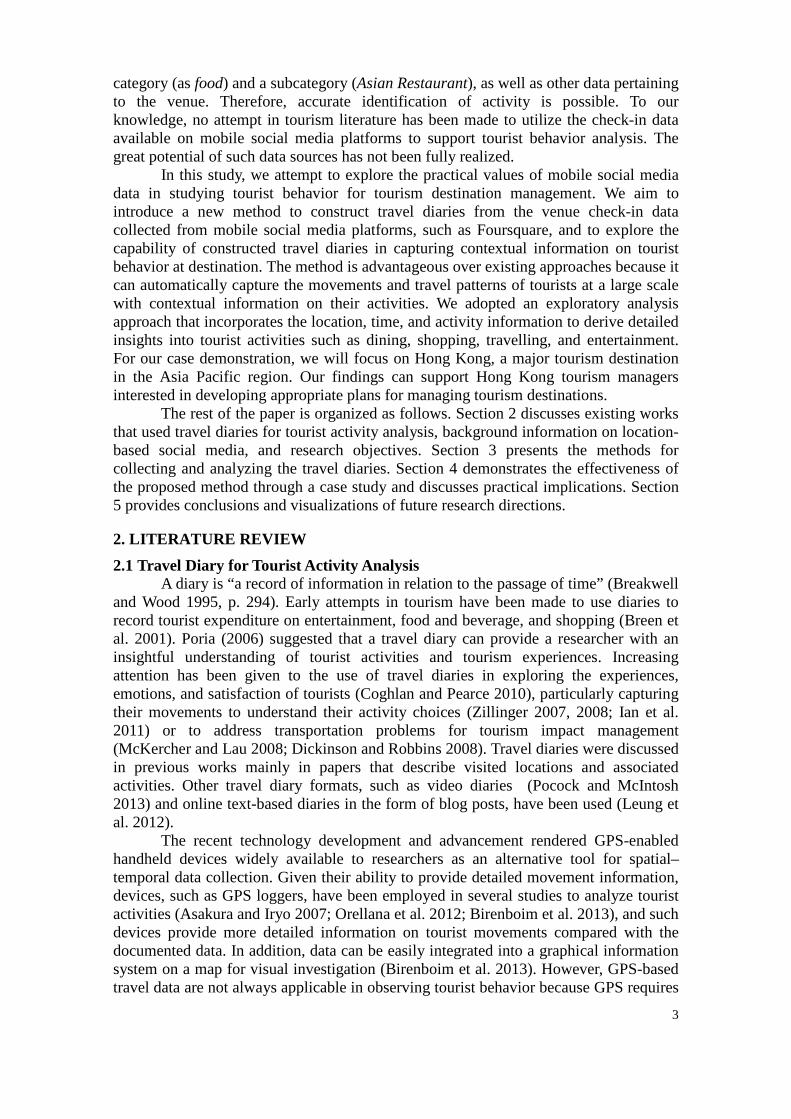
Online social media, such as the case of geotagged travel photos, have emerged as alternative travel data sources (Onder et al. 2014; Vu et al. 2015). However, the use of online social media is seriously limited because they cannot provide detailed contextual information on the activities of tourists for further analysis. Suppose a tourist reported several visited locations at the Hong Kong International Airport using GPS technology. Figure 1a shows that the tourist visited several places in the airport as indicated by the pinpoints on the map. However, Figure 1b provides much richer information on the tourists’ activities, such as traveling to the airport terminal by train, eating at a restaurant, shopping, and using the travel lounge. Existing studies using GPS technology can provide geolocation information (Figure 1a) but fail to provide detailed activity information (Figure 1b). Knowing the visited locations alone does not provide adequate information on tourist activities. Although GPS information such as longitude and latitude can pinpoint the location of tourists, their accuracy is questionable (Hauff 2013). In metropolitan cities such as Hong Kong, in particular, where the venues are small and close to each other, accurately identifying tourist activity based on GPS information can be difficult. Therefore, a method that can effectively and comprehensively collect detailed travel diary data is necessary.
(a) Without Activity Information (b) With Activity Information
Figure 1: Visited Locations in the Hong Kong International Airport
The recent availability of location-aware mobile social applications, including Foursquare (www.foursquare.com), Ubersocial (www.ubersocial.com), and Yelp (www.yelp.com) changed the manner in which people indicate their activity information. These applications allow users to explicitly share their current location in the form of venue check-ins, with metadata such as venue name, categories, and subcategories. For example, if a user visits a Chinese restaurant for dinner, then a check-in using Foursquare contains information including time, GPS location, restaurant name, a venue
3
category (as food) and a subcategory (Asian Restaurant), as well as other data pertaining to the venue. Therefore, accurate identification of activity is possible. To our knowledge, no attempt in tourism literature has been made to utilize the check-in data available on mobile social media platforms to support tourist behavior analysis. The great potential of such data sources has not been fully realized.
In this study, we attempt to explore the practical values of mobile social media data in studying tourist behavior for tourism destination management. We aim to introduce a new method to construct travel diaries from the venue check-in data collected from mobile social media platforms, such as Foursquare, and to explore the capability of constructed travel diaries in capturing contextual information on tourist behavior at destination. The method is advantageous over existing approaches because it can automatically capture the movements and travel patterns of tourists at a large scale with contextual information on their activities. We adopted an exploratory analysis approach that incorporates the location, time, and activity information to derive detailed insights into tourist activities such as dining, shopping, travelling, and entertainment. For our case demonstration, we will focus on Hong Kong, a major tourism destination in the Asia Pacific region. Our findings can support Hong Kong tourism managers interested in developing appropriate plans for managing tourism destinations.
The rest of the paper is organized as follows. Section 2 discusses existing works that used travel diaries for tourist activity analysis, background information on location-based social media, and research objectives. Section 3 presents the methods for collecting and analyzing the travel diaries. Section 4 demonstrates the effectiveness of the proposed method through a case study and discusses practical implications. Section 5 provides conclusions and visualizations of future research directions. 2. LITERATURE REVIEW
2.1 Travel Diary for Tourist Activity Analysis A diary is “a record of information in relation to the passage of time” (Breakwell
and Wood 1995, p. 294). Early attempts in tourism have been made to use diaries to record tourist expenditure on entertainment, food and beverage, and shopping (Breen et al. 2001). Poria (2006) suggested that a travel diary can provide a researcher with an insightful understanding of tourist activities and tourism experiences. Increasing attention has been given to the use of travel diaries in exploring the experiences, emotions, and satisfaction of tourists (Coghlan and Pearce 2010), particularly capturing their movements to understand their activity choices (Zillinger 2007, 2008; Ian et al. 2011) or to address transportation problems for tourism impact management (McKercher and Lau 2008; Dickinson and Robbins 2008). Travel diaries were discussed in previous works mainly in papers that describe visited locations and associated activities. Other travel diary formats, such as video diaries (Pocock and McIntosh 2013) and online text-based diaries in the form of blog posts, have been used (Leung et al. 2012).
The recent technology development and advancement rendered GPS-enabled handheld devices widely available to researchers as an alternative tool for spatial–temporal data collection. Given their ability to provide detailed movement information, devices, such as GPS loggers, have been employed in several studies to analyze tourist activities (Asakura and Iryo 2007; Orellana et al. 2012; Birenboim et al. 2013), and such devices provide more detailed information on tourist movements compared with the documented data. In addition, data can be easily integrated into a graphical information system on a map for visual investigation (Birenboim et al. 2013). However, GPS-based travel data are not always applicable in observing tourist behavior because GPS requires
4
an open-sky environment to receive signals from satellites (Asakura and Iryo 2007). If researchers wish to fully understand tourist experiences and mobility, GPS data should be combined with methods, such as questionnaires (Zakrisson and Zillinger 2012). Recent studies still need to use written diaries and questionnaires to obtain information on participating tourist activities in addition to GPS data (McKercher et al. 2012; Spangenberg 2014). Traditional travel diary construction approaches are time-consuming and limited to a small number of participants, which renders these approaches inefficient for studying tourist behavior at a large scale.
Tourism researchers have turned to different data sources to capture the travel behavior of tourists. For instance, Joo et al. (2015) used tourist pass data at theme parks to examine the effect of weather on their visiting patterns. Sobolevsky (2015) captured the travel patterns of tourists using bankcard transaction data recorded via bankcard terminals. The movement patterns of tourists between attractions can be captured using Bluetooth (Versichele et al. 2014) or mobile tracking data (Raun et al. 2016). Although these data can capture tourist travel patterns at large scales, they are not publicly available, which prevents them from wide adoptions. Therefore, an alternative data collection approach is necessary, such as in the case of social media, as discussed in the next section.
2.2 Social Media as the New Data Source
Social media are Web 2.0 applications that contain user-generated context, such as texts, photos, and video posts (Obar and Wildman 2015). Some popular social media websites include Twitter (www.twitter.com), Facebook (www.facebook.com), and Instagram (www.instagram.com). Social media technologies have different forms, namely, blogs, forums, photo sharing, product/service reviews, social gaming, video sharing, and virtual worlds (Aichner and Jacob 2015). With the massive volume of data available, social media can provide valuable and previously difficult-to-obtain information on tourist activities, perceptions, and concerns (Claster et al. 2015).
Recently, tourism researchers have shifted their attention to social media as an alternative data source for tourist activities. For instance, Leung et al. (2012) analyzed travel information in blog posts to reveal tourist movement patterns for destination management. Claster et al. (2015) analyzed comments available on Twitter to understand the potentials and motivations in medical tourism in order to promote the medical service market. Yoo and Lee (2015) explored tourist behavior and perception in heritage hotels by analyzing Facebook messages. Stepchenkova and Zhan (2013) utilized user-generated photos on the photo-sharing site, Flickr, to explore tourist perception on destination. Given the availability of geographical information embedded in the photos’ metadata, recent works have resorted to geotagged photos as an alternative data source for tourist travel studies (Kadar 2013; Onder et al. 2014; Vu et al. 2015; Garcia-Palomares et al. 2015; Vu et al. 2017). However, these works focused mainly on tourist movements rather than on actual participated activities at the destination perhaps because of the lack of contextual information in the metadata of geotagged photos. Inferring tourist activities solely based on GPS information is inaccurate (Hauff 2013), whereas the manual analysis of photo content of a large data set can be difficult and time-consuming (Stepchenkova and Zhan 2013). 2.3 Mobile Social Media
Mobile social applications have been recently developed for users to share and access social media using mobile devices, such as smart phones and tablets. Social media applications running on mobile devices provide features that allow users to share
5
their current location. The combination of mobile devices and social media is referred to as mobile social media (Kaplan 2012). With the Check-in function on mobile social media, users can exchange messages relevant to one specific location at a certain time. “Check-in” is a popular method for individuals to show their interest in a location, place, or venue (Kessler 2010). Tracking Check-in functions is recognized as an effective method of developing long-term relationships with customers (Kessler 2010; Kaplan 2012).
The Check-in data on mobile social media differ from those in GPS loggers or geotagged photos because they provide semantic tags to the places where users are located rather than merely giving raw geolocations. Check-in data have recently received attention from computer scientists who seek to develop analytical techniques to better understand user activities (Yu et al. 2014; Hasan and Ukkusuri 2014; Jin et al. 2016) and develop an intelligent recommendation system (Chen et al. 2015). In these works, the Check-in data were collected from Foursquare, a popular mobile social media platform with more than 60 million users as of 2015 (https:// foursquare.com/about). Lindqvist et al. (2011) found the main reasons for people using Foursquare including elements of fun, exploration, and coordination with friends. Users tend to use the history of visited places as a form of presentative image of themselves (Patil et al. 2012). With the huge volume of Check-in data available, mobile social media, such as Foursquare, has become a promising travel diary resource to derive insights into tourist activities.
2.4 Summary
Traditional surveying approach to travel diary construction is time-consuming with limited captured information. Researchers have shifted their attention to user-generated data on social media sites, especially on geotagged photos. However, location information is usually in raw geographical data and lacks detailed information on user activities. The accuracy of information on the location is also questionable (Hauff 2013), which may result in the inaccurate identification of small-size or closely-located venues. The availability of venue check-in data on mobile social media has opened a new opportunity to capture user activities (Yu et al. 2014; Hasan and Ukkusuri 2014; Jin et al. 2016). However, the potential of such data resource in tourist behavior analysis has not been fully explored. The present paper aims to introduce a new method for constructing travel diaries from venue check-in data on mobile social media and for capturing tourist behavior in destinations for improved tourism destination management. Details on data collection and analysis are provided in the next section. The effectiveness of the proposed approach is demonstrated using a case study of inbound tourists in Hong Kong, a major tourism destination in the Asia Pacific region.
3. METHODOLOGY This section presents our method to construct a travel diary and analysis to investigate tourist activities at the destination. As a popular mobile social media platform (Yu et al. 2014; Jin et al. 2016), Foursquare provides a comprehensive location database of venues worldwide. Foursquare has a special feature wherein users are rewarded with points for check-in if they are actually staying at or very close to the selected venue (Patil et al. 2012). This motivates users to perform genuine check-ins on Foursquare, as their main motivation of checking in is to establish an image of themselves or to connect with friends (Lindqvist et al. 2011). As such, we selected Foursquare as the data source for tourist activities in this paper. One issue with the Foursquare is that it does not support direct and automatic extraction of the check-in
6
data. Fortunately, Foursquare has recently integrated their system into other social media sites, including Twitter. Users can link their Foursquare accounts to their Twitter accounts. When a check-in is made using a Foursquare mobile application, called Swarm (www.swarmapp.com), the check-in information is shown on the user’s Twitter timeline. Hence, we propose to collect Foursquare venue check-in data via Twitter’s Application Programming Interface (API).
Subsequent subsections first present the identification of users whose Twitter accounts are integrated with their Foursquare accounts. Second, their check-in records were subsequently extracted to construct travel diaries. Finally, we described various methods to explore tourist activities based on travel diaries.
3.1 User Identification The user identification stage aims to identify Twitter users whose accounts are integrated with the Swarm check-in application. Twitter data can be accessed using its streaming API, the documentation for which is available at the URL: http://dev.twitter.com/docs/. Streaming API provides free access to a global stream of tweet data and returns a portion of public tweets posted on Twitter at any time. With the massive volume of tweets posted, a large number of tweets can be received in a given day by the Streaming API, which is generally sufficient for statistical analysis (Cheng et al. 2011; Ferreira et al. 2015). Should a need for more streaming data arises, commercial APIs, such as Decahose or Firehose, can be used for a fee (gnip.com).
The Streaming API of Twitter allows users to collect tweets posted within the geographical area specified by a bounding box whose coordinates are referenced as 𝑥𝑥𝑚𝑚𝑚𝑚𝑚𝑚 , 𝑦𝑦𝑚𝑚𝑚𝑚𝑚𝑚 , 𝑥𝑥𝑚𝑚𝑚𝑚𝑚𝑚 , and 𝑦𝑦𝑚𝑚𝑚𝑚𝑚𝑚 for minimum longitude, minimum latitude, maximum longitude, and maximum latitude, respectively. Therefore, focusing the data on specific tourism destinations is convenient. The collected tweets are then processed and stored as records with the following information:
{userID, userLocation, Language, tweetID, date-time, GPS Coordinates, text} A tweet with a venue check-in through Swarm or a check-in tweet looks similar
to the following: {1206636xxx, Tokyo, Japanese, 733150534132236xxx, 5/19/2016 2:21:00 PM,
[22.3153, 113.9348], “I’m at Hong Kong International Airport”, https://www.swarmapp.com/c/8tfAWSjlQjU}
Privacy reasons prevent the study from disclosing the full details that can identify the user who posted the tweet in the aforementioned example. Among the stored data, the userID is a unique number assigned to each Twitter user. The userLocation indicates the user’s location of origin, such as a city or a country. The user’s location of origin is useful in determining whether the user is a local resident or a tourist. In the aforementioned example, the user is a tourist because he/she came from Tokyo, Japan to visit Hong Kong. Language specifies the main language used by the user, which is useful in identifying the user’s nationality or cultural background. In case the userLocation information is not provided, Language information is available (i.e., Japanese); thus, it is likely that the user comes from Japan. Researchers can distinguish between tourists and local residents based on userLocation and/or Language. The date–time information is irrelevant at this stage because the local time at the location where the Streaming API is deployed rather than the tweet’s location is indicated. The succeeding section discusses the extraction of exact local date and time of the Check-ins.
For the tweet text, a reference link to indicate the use of Swarm is provided. A filter is applied to keep any check-in tweet with the keyword “swarmapp” in the text
7
and to discard the others. Although location check-in applications other than Swarm are available, Foursquare check-in using Swarm is the most popular application on Twitter (Cheng et al. 2011). Given the retrieved check-in tweets, their userIDs are extracted. Duplicated userIDs are removed, whereas unique ones are retained for travel diary construction in the next stage.
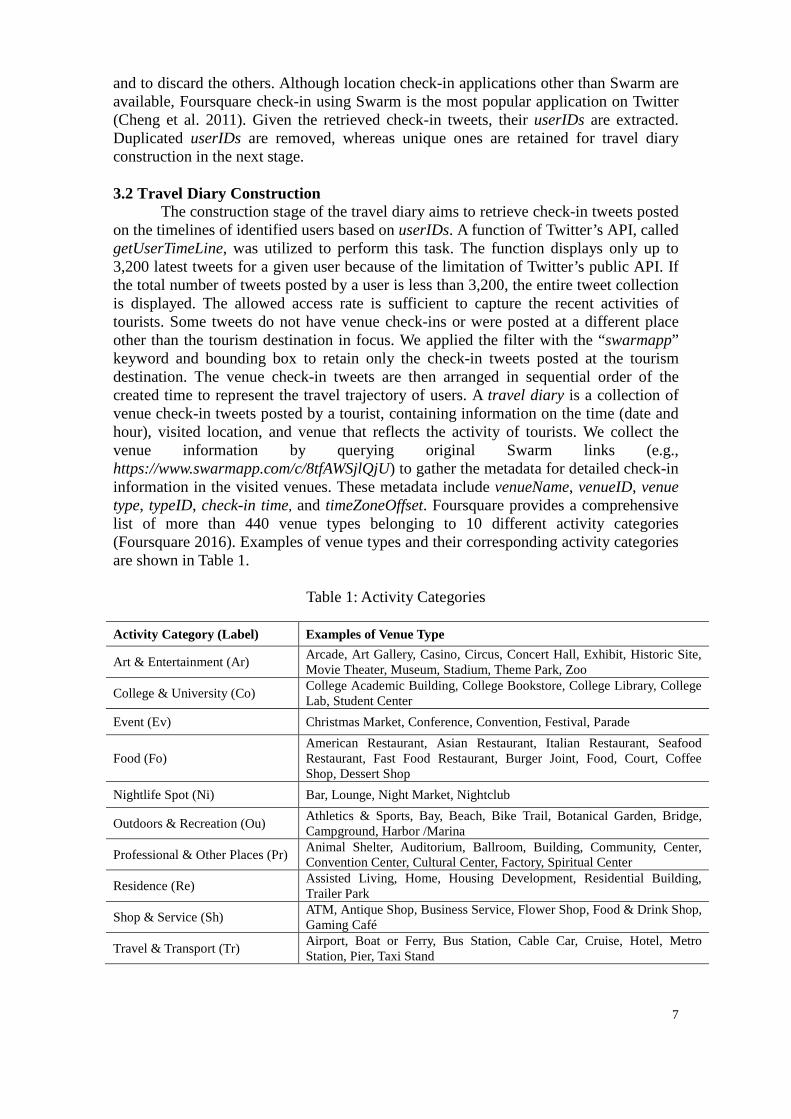
3.2 Travel Diary Construction The construction stage of the travel diary aims to retrieve check-in tweets posted on the timelines of identified users based on userIDs. A function of Twitter’s API, called getUserTimeLine, was utilized to perform this task. The function displays only up to 3,200 latest tweets for a given user because of the limitation of Twitter’s public API. If the total number of tweets posted by a user is less than 3,200, the entire tweet collection is displayed. The allowed access rate is sufficient to capture the recent activities of tourists. Some tweets do not have venue check-ins or were posted at a different place other than the tourism destination in focus. We applied the filter with the “swarmapp” keyword and bounding box to retain only the check-in tweets posted at the tourism destination. The venue check-in tweets are then arranged in sequential order of the created time to represent the travel trajectory of users. A travel diary is a collection of venue check-in tweets posted by a tourist, containing information on the time (date and hour), visited location, and venue that reflects the activity of tourists. We collect the venue information by querying original Swarm links (e.g., https://www.swarmapp.com/c/8tfAWSjlQjU) to gather the metadata for detailed check-in information in the visited venues. These metadata include venueName, venueID, venue type, typeID, check-in time, and timeZoneOffset. Foursquare provides a comprehensive list of more than 440 venue types belonging to 10 different activity categories (Foursquare 2016). Examples of venue types and their corresponding activity categories are shown in Table 1.
Table 1: Activity Categories
Activity Category (Label) Examples of Venue Type
Art & Entertainment (Ar) Arcade, Art Gallery, Casino, Circus, Concert Hall, Exhibit, Historic Site, Movie Theater, Museum, Stadium, Theme Park, Zoo
College & University (Co) College Academic Building, College Bookstore, College Library, College Lab, Student Center
Event (Ev) Christmas Market, Conference, Convention, Festival, Parade
Food (Fo) American Restaurant, Asian Restaurant, Italian Restaurant, Seafood Restaurant, Fast Food Restaurant, Burger Joint, Food, Court, Coffee Shop, Dessert Shop
Nightlife Spot (Ni) Bar, Lounge, Night Market, Nightclub
Outdoors & Recreation (Ou) Athletics & Sports, Bay, Beach, Bike Trail, Botanical Garden, Bridge, Campground, Harbor /Marina
Professional & Other Places (Pr) Animal Shelter, Auditorium, Ballroom, Building, Community, Center, Convention Center, Cultural Center, Factory, Spiritual Center
Residence (Re) Assisted Living, Home, Housing Development, Residential Building, Trailer Park
Shop & Service (Sh) ATM, Antique Shop, Business Service, Flower Shop, Food & Drink Shop, Gaming Café
Travel & Transport (Tr) Airport, Boat or Ferry, Bus Station, Cable Car, Cruise, Hotel, Metro Station, Pier, Taxi Stand
8
Check-in time is recorded as the number of seconds since the Coordinated Universal Time (UTC) 00:00:00 on 1st January 1970 Hierarchy (UNIX, 2013). The timeZoneOffset is the number of minutes between the local time of the check-in and the UTC at longitude 0. For example, a check-in in Hong Kong, which is at +0800 UTC, will have a timeZoneOffset of +480. The exact local time of the check-in at a specific tourism destination can be determined because the UTC is recorded using Swarm. The format of local time at a tourism destination is subsequently converted into a human readable form, such as 6/20/2016 10:54:22. We recorded each entry in a travel diary with check-in data in the following format to make it convenient for analysis.
{User ID, Entry ID, Date, Time, Venue Name, Venue Type, Activity Category, GPS Location}
In addition to the objective check-in data, other data that reflect subjective perspectives, such as venue tips, can also be incorporated into the travel diaries as user opinions. Tips are usually posted after the user visited a venue rather than during check-in time. These tips can then be retrieved from the user profile page by following the link https://foursquare.com/userID?all=tips, where userID is the actual user identification number. The interpretation of the tip content can reflect the experience and opinions of the tourists toward the visited venues. 3.3 Exploratory Analysis of Travel Diaries
In this paper, we demonstrate the capability of the travel diary with venue check-ins to capture the rich information about tourist activity patterns at destinations. Several approaches were employed for exploratory analysis, including the following:
Descriptive Statistics: We used descriptive statistics (Holcomb 1998) to summarize the tourist activities in the data collection. We measured an activity’s popularity by the proportion of tourists who visited a venue type at least once. We compared the popularity between different groups of tourists to identify their activity preferences. Statistical tests were employed to verify the statistical significance of proportional differences between tourist groups (Kanji, 2006). Insights into tourist trajectory, such as activities on the first day of arrival and the last day before departure, were also revealed.
Temporal Analysis: We adopted the heat map visualization technique (Krentzman et al. 2011) into a temporal analysis of tourist activity that accounts for both time and venue information. The numbers of check-ins based on the day of a week and hour of a day were computed for each venue type under consideration. Data are subsequently visualized using the heat map, where the individual numbers of check-ins contained in a matrix of day and hour are represented as colors. Various color schemes can be used to illustrate the heat map (Harrower and Brewer 2003). We utilized the HeatMap package in MATLAB (HeatMap 2016) to visualize the temporal activities of tourists. A dark-colored cell in the matrix of day and hour represents high activity, whereas a light-colored cell represents otherwise.
Spatial Analysis: We demonstrated the advantages of the travel diary in supporting the transportation management through a spatial analysis using a geographical information system, such as Google Earth (https://earth.google.com). In addition to GPS information, venue type information was also incorporated to gain detailed insights into tourist activity at each location.
9
The effectiveness of travel diaries and analysis techniques in supporting tourism destination management is demonstrated in the case study provided in Section 4. 4. CASE STUDY
This section presents a case study on tourist activities in Hong Kong. The data collection and travel diary construction process are provided first, followed by the description and analysis of results. Discussions on the practical implications of the findings and the proposed method are also provided.
4.1 Data Collection The data used in this study are Foursquare venue check-ins, which were collected via Twitter following the method described in Section 3. The Streaming API was deployed for three weeks, from 4th to 25th June 2016, to collect the tweets of users. We went over the geographical area of Hong Kong by a bounding box, whose coordinates are 𝑥𝑥𝑚𝑚𝑚𝑚𝑚𝑚 = 113.8876, 𝑦𝑦𝑚𝑚𝑚𝑚𝑚𝑚 = 22.2153, 𝑥𝑥𝑚𝑚𝑚𝑚𝑚𝑚 = 114,3600, and 𝑦𝑦𝑚𝑚𝑚𝑚𝑚𝑚 = 22.5145. A filter with the “swarmapp” keyword was used to extract check-in tweets alone. Furthermore, we determined the users’ location of origin based on userLocation to distinguish tourists from local residents. In case userLocation was not provided, Language information was used to identify user location. Only the languages spoken by a unique country (e.g., Japanese, Thai, and Korean) are valuable in identifying the users’ nationality or cultural background. If the spoken language is commonly used, such as English or Chinese, the users’ location cannot be determined. We excluded those users from our data collection. The function getUserTimeLine was applied to collect check-in tweets from the users’ Twitter timelines to construct the travel diaries (Section 3.2). A total of 17,355 check-in tweets were collected based on 600 userIDs of tourists.
Majority of the tourists in the obtained data are from Asian countries such as Malaysia, Philippines, Singapore, China, Thailand, and Japan, whereas other tourists are from the United Kingdom and United States. The tourists were categorized based on their cultural backgrounds (Vu et al. 2015), such as Asian and Western tourists, to explore the differences in the tourist behavior of these groups. Detailed statistical results of the obtained data are shown in Table 2. One possibility considered was that venue check-ins on users’ timeline were made before the streaming period. However, the tourists stayed in Hong Kong at the time of the Streaming-API deployment; thus, the collected data can indicate their recent activities. The number of Asian tourists was higher than that of Western tourists probably because Asian countries are the major Short Haul source markets of Hong Kong tourism (HKTB 2016), and many of these tourists are Foursquare users (Pingdom. 2011).
Table 2: Venue Check-in Data Collection Group No. of Tourists No. of Check-ins Average
Asian 467 12,836 27.49 Western 133 4,519 33.98 Total: 600 17,355
10
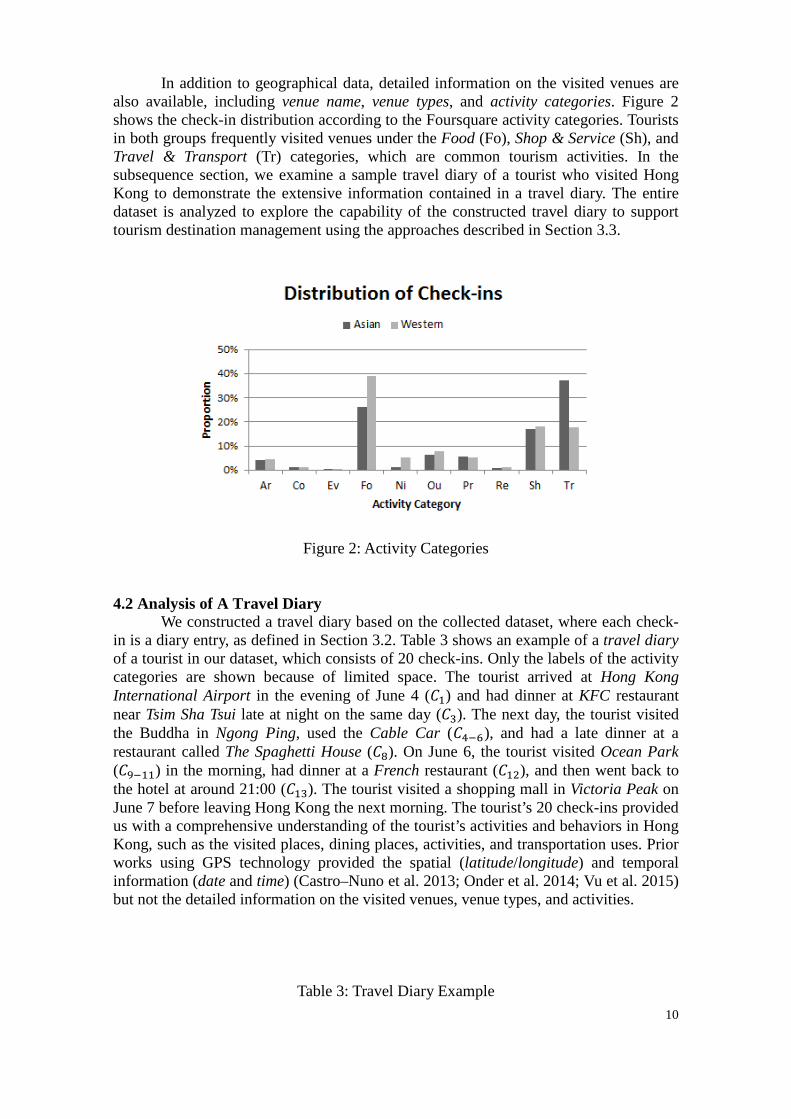
In addition to geographical data, detailed information on the visited venues are also available, including venue name, venue types, and activity categories. Figure 2 shows the check-in distribution according to the Foursquare activity categories. Tourists in both groups frequently visited venues under the Food (Fo), Shop & Service (Sh), and Travel & Transport (Tr) categories, which are common tourism activities. In the subsequence section, we examine a sample travel diary of a tourist who visited Hong Kong to demonstrate the extensive information contained in a travel diary. The entire dataset is analyzed to explore the capability of the constructed travel diary to support tourism destination management using the approaches described in Section 3.3.
Figure 2: Activity Categories 4.2 Analysis of A Travel Diary
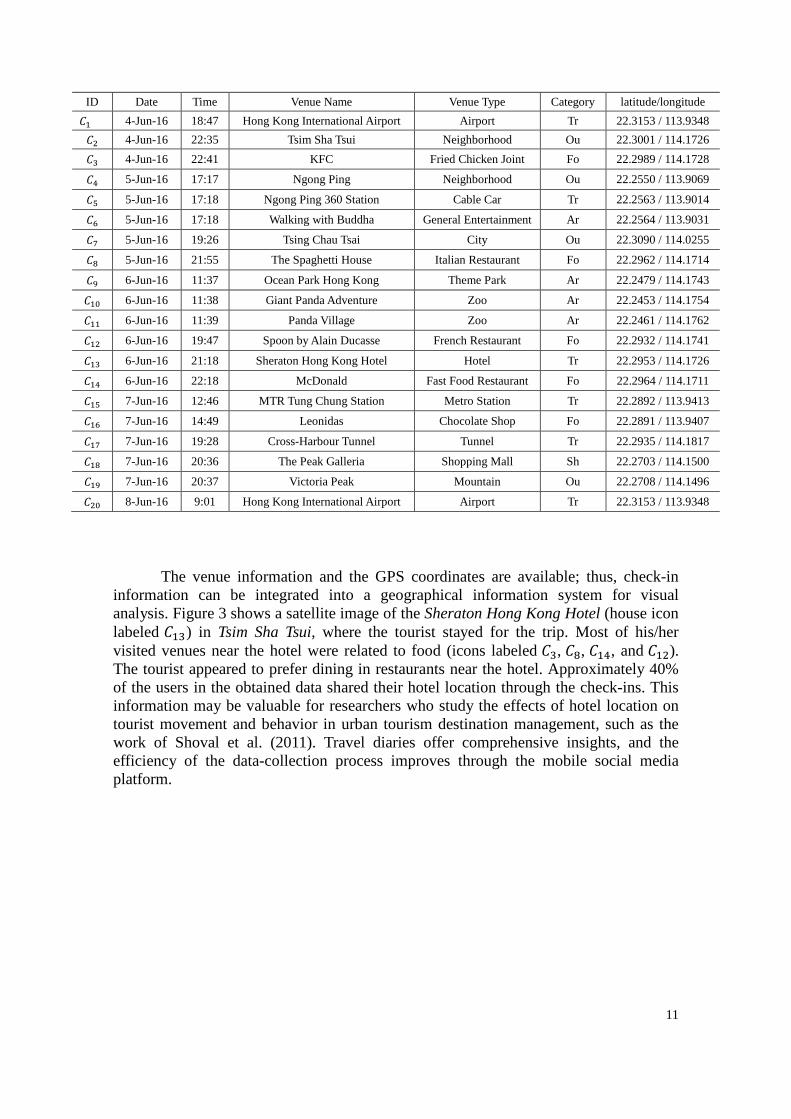
We constructed a travel diary based on the collected dataset, where each check-in is a diary entry, as defined in Section 3.2. Table 3 shows an example of a travel diary of a tourist in our dataset, which consists of 20 check-ins. Only the labels of the activity categories are shown because of limited space. The tourist arrived at Hong Kong International Airport in the evening of June 4 (𝐶𝐶1) and had dinner at KFC restaurant near Tsim Sha Tsui late at night on the same day (𝐶𝐶3). The next day, the tourist visited the Buddha in Ngong Ping, used the Cable Car (𝐶𝐶4−6), and had a late dinner at a restaurant called The Spaghetti House (𝐶𝐶8). On June 6, the tourist visited Ocean Park (𝐶𝐶9−11) in the morning, had dinner at a French restaurant (𝐶𝐶12), and then went back to the hotel at around 21:00 (𝐶𝐶13). The tourist visited a shopping mall in Victoria Peak on June 7 before leaving Hong Kong the next morning. The tourist’s 20 check-ins provided us with a comprehensive understanding of the tourist’s activities and behaviors in Hong Kong, such as the visited places, dining places, activities, and transportation uses. Prior works using GPS technology provided the spatial (latitude/longitude) and temporal information (date and time) (Castro–Nuno et al. 2013; Onder et al. 2014; Vu et al. 2015) but not the detailed information on the visited venues, venue types, and activities.
Table 3: Travel Diary Example
11
The venue information and the GPS coordinates are available; thus, check-in
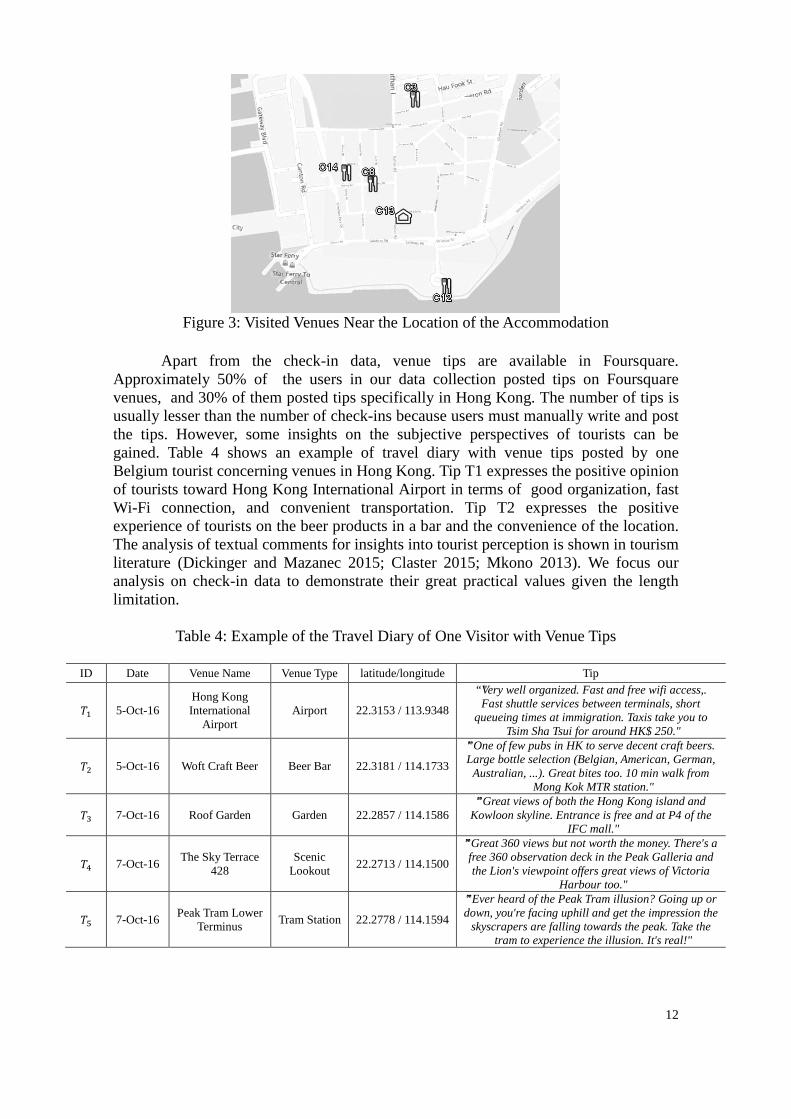
information can be integrated into a geographical information system for visual analysis. Figure 3 shows a satellite image of the Sheraton Hong Kong Hotel (house icon labeled 𝐶𝐶13) in Tsim Sha Tsui, where the tourist stayed for the trip. Most of his/her visited venues near the hotel were related to food (icons labeled 𝐶𝐶3, 𝐶𝐶8, 𝐶𝐶14, and 𝐶𝐶12). The tourist appeared to prefer dining in restaurants near the hotel. Approximately 40% of the users in the obtained data shared their hotel location through the check-ins. This information may be valuable for researchers who study the effects of hotel location on tourist movement and behavior in urban tourism destination management, such as the work of Shoval et al. (2011). Travel diaries offer comprehensive insights, and the efficiency of the data-collection process improves through the mobile social media platform.
ID Date Time Venue Name Venue Type Category latitude/longitude 𝐶𝐶1 4-Jun-16 18:47 Hong Kong International Airport Airport Tr 22.3153 / 113.9348 𝐶𝐶2 4-Jun-16 22:35 Tsim Sha Tsui Neighborhood Ou 22.3001 / 114.1726
𝐶𝐶3 4-Jun-16 22:41 KFC Fried Chicken Joint Fo 22.2989 / 114.1728
𝐶𝐶4 5-Jun-16 17:17 Ngong Ping Neighborhood Ou 22.2550 / 113.9069
𝐶𝐶5 5-Jun-16 17:18 Ngong Ping 360 Station Cable Car Tr 22.2563 / 113.9014
𝐶𝐶6 5-Jun-16 17:18 Walking with Buddha General Entertainment Ar 22.2564 / 113.9031
𝐶𝐶7 5-Jun-16 19:26 Tsing Chau Tsai City Ou 22.3090 / 114.0255
𝐶𝐶8 5-Jun-16 21:55 The Spaghetti House Italian Restaurant Fo 22.2962 / 114.1714
𝐶𝐶9 6-Jun-16 11:37 Ocean Park Hong Kong Theme Park Ar 22.2479 / 114.1743
𝐶𝐶10 6-Jun-16 11:38 Giant Panda Adventure Zoo Ar 22.2453 / 114.1754
𝐶𝐶11 6-Jun-16 11:39 Panda Village Zoo Ar 22.2461 / 114.1762
𝐶𝐶12 6-Jun-16 19:47 Spoon by Alain Ducasse French Restaurant Fo 22.2932 / 114.1741
𝐶𝐶13 6-Jun-16 21:18 Sheraton Hong Kong Hotel Hotel Tr 22.2953 / 114.1726
𝐶𝐶14 6-Jun-16 22:18 McDonald Fast Food Restaurant Fo 22.2964 / 114.1711
𝐶𝐶15 7-Jun-16 12:46 MTR Tung Chung Station Metro Station Tr 22.2892 / 113.9413
𝐶𝐶16 7-Jun-16 14:49 Leonidas Chocolate Shop Fo 22.2891 / 113.9407
𝐶𝐶17 7-Jun-16 19:28 Cross-Harbour Tunnel Tunnel Tr 22.2935 / 114.1817
𝐶𝐶18 7-Jun-16 20:36 The Peak Galleria Shopping Mall Sh 22.2703 / 114.1500
𝐶𝐶19 7-Jun-16 20:37 Victoria Peak Mountain Ou 22.2708 / 114.1496
𝐶𝐶20 8-Jun-16 9:01 Hong Kong International Airport Airport Tr 22.3153 / 113.9348
12
Figure 3: Visited Venues Near the Location of the Accommodation
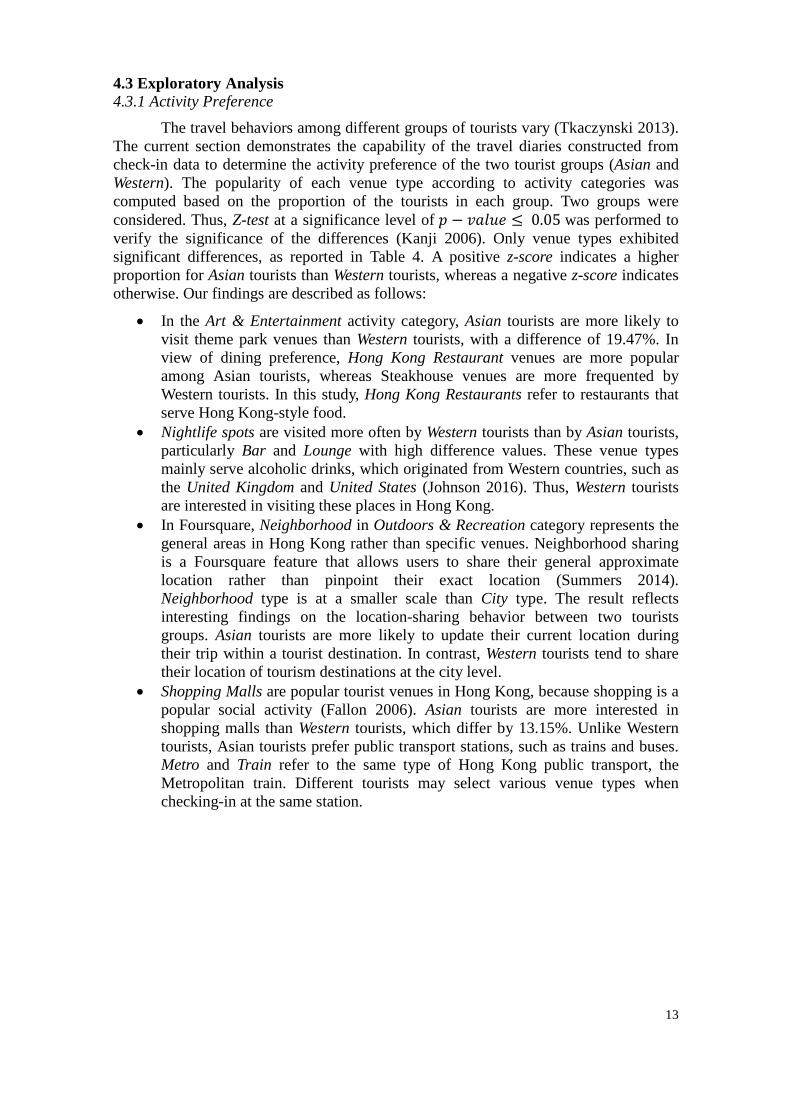
Apart from the check-in data, venue tips are available in Foursquare.
Approximately 50% of the users in our data collection posted tips on Foursquare venues, and 30% of them posted tips specifically in Hong Kong. The number of tips is usually lesser than the number of check-ins because users must manually write and post the tips. However, some insights on the subjective perspectives of tourists can be gained. Table 4 shows an example of travel diary with venue tips posted by one Belgium tourist concerning venues in Hong Kong. Tip T1 expresses the positive opinion of tourists toward Hong Kong International Airport in terms of good organization, fast Wi-Fi connection, and convenient transportation. Tip T2 expresses the positive experience of tourists on the beer products in a bar and the convenience of the location. The analysis of textual comments for insights into tourist perception is shown in tourism literature (Dickinger and Mazanec 2015; Claster 2015; Mkono 2013). We focus our analysis on check-in data to demonstrate their great practical values given the length limitation.
Table 4: Example of the Travel Diary of One Visitor with Venue Tips
ID Date Venue Name Venue Type latitude/longitude Tip
𝑇𝑇1 5-Oct-16 Hong Kong International
Airport Airport 22.3153 / 113.9348
“"Very well organized. Fast and free wifi access,. Fast shuttle services between terminals, short
queueing times at immigration. Taxis take you to Tsim Sha Tsui for around HK$ 250."
𝑇𝑇2 5-Oct-16 Woft Craft Beer Beer Bar 22.3181 / 114.1733
"”One of few pubs in HK to serve decent craft beers. Large bottle selection (Belgian, American, German,
Australian, ...). Great bites too. 10 min walk from Mong Kok MTR station."
𝑇𝑇3 7-Oct-16 Roof Garden Garden 22.2857 / 114.1586 "”Great views of both the Hong Kong island and
Kowloon skyline. Entrance is free and at P4 of the IFC mall."
𝑇𝑇4 7-Oct-16 The Sky Terrace 428
Scenic Lookout 22.2713 / 114.1500
"”Great 360 views but not worth the money. There's a free 360 observation deck in the Peak Galleria and the Lion's viewpoint offers great views of Victoria
Harbour too."
𝑇𝑇5 7-Oct-16 Peak Tram Lower Terminus Tram Station 22.2778 / 114.1594
"”Ever heard of the Peak Tram illusion? Going up or down, you're facing uphill and get the impression the
skyscrapers are falling towards the peak. Take the tram to experience the illusion. It's real!"
13
4.3 Exploratory Analysis 4.3.1 Activity Preference
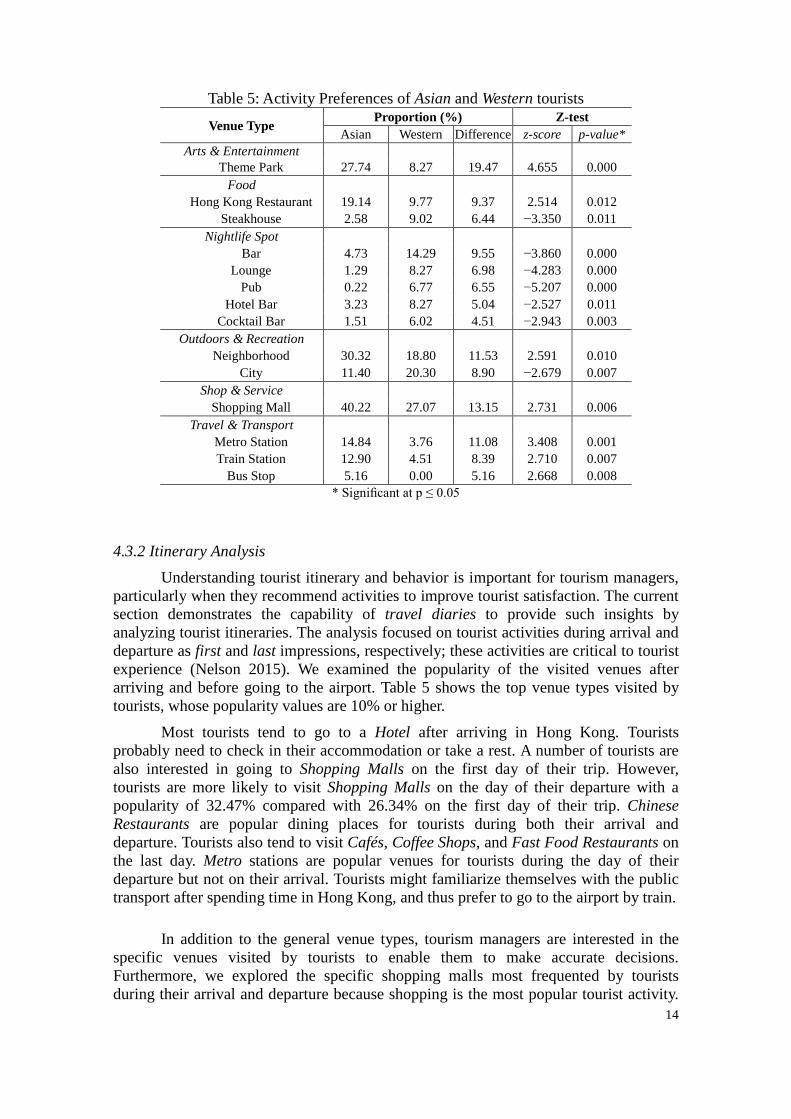
The travel behaviors among different groups of tourists vary (Tkaczynski 2013). The current section demonstrates the capability of the travel diaries constructed from check-in data to determine the activity preference of the two tourist groups (Asian and Western). The popularity of each venue type according to activity categories was computed based on the proportion of the tourists in each group. Two groups were considered. Thus, Z-test at a significance level of 𝑝𝑝 − 𝑣𝑣𝑣𝑣𝑣𝑣𝑣𝑣𝑣𝑣 ≤ 0.05 was performed to verify the significance of the differences (Kanji 2006). Only venue types exhibited significant differences, as reported in Table 4. A positive z-score indicates a higher proportion for Asian tourists than Western tourists, whereas a negative z-score indicates otherwise. Our findings are described as follows:
• In the Art & Entertainment activity category, Asian tourists are more likely to visit theme park venues than Western tourists, with a difference of 19.47%. In view of dining preference, Hong Kong Restaurant venues are more popular among Asian tourists, whereas Steakhouse venues are more frequented by Western tourists. In this study, Hong Kong Restaurants refer to restaurants that serve Hong Kong-style food.
• Nightlife spots are visited more often by Western tourists than by Asian tourists, particularly Bar and Lounge with high difference values. These venue types mainly serve alcoholic drinks, which originated from Western countries, such as the United Kingdom and United States (Johnson 2016). Thus, Western tourists are interested in visiting these places in Hong Kong.
• In Foursquare, Neighborhood in Outdoors & Recreation category represents the general areas in Hong Kong rather than specific venues. Neighborhood sharing is a Foursquare feature that allows users to share their general approximate location rather than pinpoint their exact location (Summers 2014). Neighborhood type is at a smaller scale than City type. The result reflects interesting findings on the location-sharing behavior between two tourists groups. Asian tourists are more likely to update their current location during their trip within a tourist destination. In contrast, Western tourists tend to share their location of tourism destinations at the city level.
• Shopping Malls are popular tourist venues in Hong Kong, because shopping is a popular social activity (Fallon 2006). Asian tourists are more interested in shopping malls than Western tourists, which differ by 13.15%. Unlike Western tourists, Asian tourists prefer public transport stations, such as trains and buses. Metro and Train refer to the same type of Hong Kong public transport, the Metropolitan train. Different tourists may select various venue types when checking-in at the same station.
14
Table 5: Activity Preferences of Asian and Western tourists
Venue Type Proportion (%) Z-test
Asian Western Difference z-score p-value* Arts & Entertainment
Theme Park 27.74 8.27 19.47 4.655 0.000 Food
Hong Kong Restaurant 19.14 9.77 9.37 2.514 0.012 Steakhouse 2.58 9.02 6.44 −3.350 0.011
Nightlife Spot Bar 4.73 14.29 9.55 −3.860 0.000
Lounge 1.29 8.27 6.98 −4.283 0.000 Pub 0.22 6.77 6.55 −5.207 0.000
Hotel Bar 3.23 8.27 5.04 −2.527 0.011 Cocktail Bar 1.51 6.02 4.51 −2.943 0.003
Outdoors & Recreation Neighborhood 30.32 18.80 11.53 2.591 0.010
City 11.40 20.30 8.90 −2.679 0.007 Shop & Service
Shopping Mall 40.22 27.07 13.15 2.731 0.006 Travel & Transport
Metro Station 14.84 3.76 11.08 3.408 0.001 Train Station 12.90 4.51 8.39 2.710 0.007
Bus Stop 5.16 0.00 5.16 2.668 0.008 * Significant at p ≤ 0.05
4.3.2 Itinerary Analysis
Understanding tourist itinerary and behavior is important for tourism managers, particularly when they recommend activities to improve tourist satisfaction. The current section demonstrates the capability of travel diaries to provide such insights by analyzing tourist itineraries. The analysis focused on tourist activities during arrival and departure as first and last impressions, respectively; these activities are critical to tourist experience (Nelson 2015). We examined the popularity of the visited venues after arriving and before going to the airport. Table 5 shows the top venue types visited by tourists, whose popularity values are 10% or higher.
Most tourists tend to go to a Hotel after arriving in Hong Kong. Tourists probably need to check in their accommodation or take a rest. A number of tourists are also interested in going to Shopping Malls on the first day of their trip. However, tourists are more likely to visit Shopping Malls on the day of their departure with a popularity of 32.47% compared with 26.34% on the first day of their trip. Chinese Restaurants are popular dining places for tourists during both their arrival and departure. Tourists also tend to visit Cafés, Coffee Shops, and Fast Food Restaurants on the last day. Metro stations are popular venues for tourists during the day of their departure but not on their arrival. Tourists might familiarize themselves with the public transport after spending time in Hong Kong, and thus prefer to go to the airport by train.
In addition to the general venue types, tourism managers are interested in the specific venues visited by tourists to enable them to make accurate decisions. Furthermore, we explored the specific shopping malls most frequented by tourists during their arrival and departure because shopping is the most popular tourist activity.
15
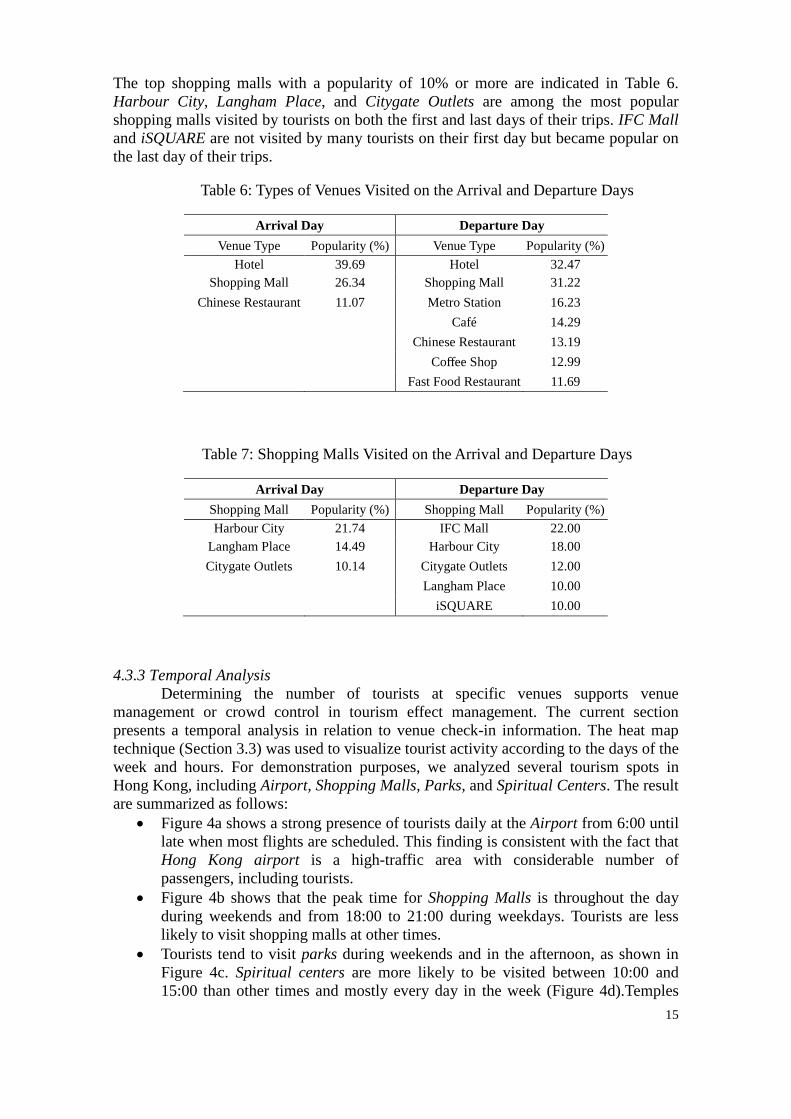
The top shopping malls with a popularity of 10% or more are indicated in Table 6. Harbour City, Langham Place, and Citygate Outlets are among the most popular shopping malls visited by tourists on both the first and last days of their trips. IFC Mall and iSQUARE are not visited by many tourists on their first day but became popular on the last day of their trips.
Table 6: Types of Venues Visited on the Arrival and Departure Days
Arrival Day Departure Day
Venue Type Popularity (%) Venue Type Popularity (%) Hotel 39.69 Hotel 32.47
Shopping Mall 26.34 Shopping Mall 31.22 Chinese Restaurant 11.07 Metro Station 16.23
Café 14.29 Chinese Restaurant 13.19 Coffee Shop 12.99 Fast Food Restaurant 11.69
Table 7: Shopping Malls Visited on the Arrival and Departure Days
Arrival Day Departure Day
Shopping Mall Popularity (%) Shopping Mall Popularity (%) Harbour City 21.74 IFC Mall 22.00
Langham Place 14.49 Harbour City 18.00 Citygate Outlets 10.14 Citygate Outlets 12.00
Langham Place 10.00 iSQUARE 10.00
4.3.3 Temporal Analysis Determining the number of tourists at specific venues supports venue
management or crowd control in tourism effect management. The current section presents a temporal analysis in relation to venue check-in information. The heat map technique (Section 3.3) was used to visualize tourist activity according to the days of the week and hours. For demonstration purposes, we analyzed several tourism spots in Hong Kong, including Airport, Shopping Malls, Parks, and Spiritual Centers. The result are summarized as follows:
• Figure 4a shows a strong presence of tourists daily at the Airport from 6:00 until late when most flights are scheduled. This finding is consistent with the fact that Hong Kong airport is a high-traffic area with considerable number of passengers, including tourists.
• Figure 4b shows that the peak time for Shopping Malls is throughout the day during weekends and from 18:00 to 21:00 during weekdays. Tourists are less likely to visit shopping malls at other times.
• Tourists tend to visit parks during weekends and in the afternoon, as shown in Figure 4c. Spiritual centers are more likely to be visited between 10:00 and 15:00 than other times and mostly every day in the week (Figure 4d).Temples
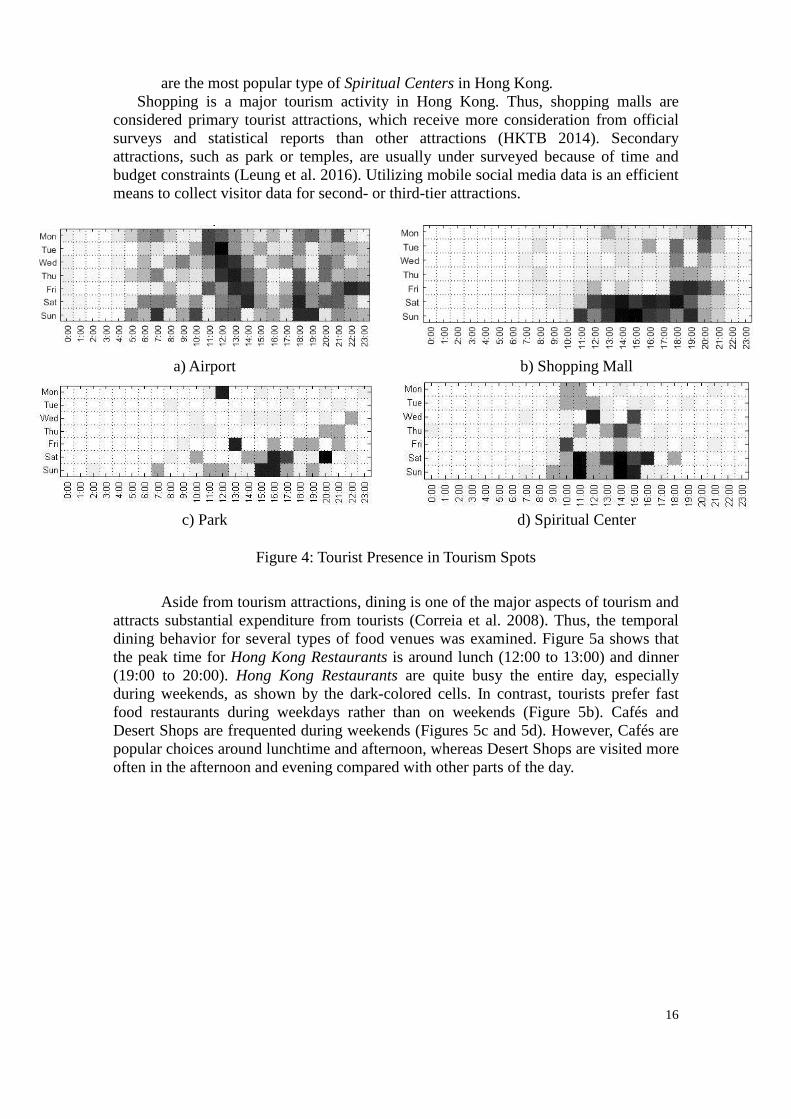
16
are the most popular type of Spiritual Centers in Hong Kong. Shopping is a major tourism activity in Hong Kong. Thus, shopping malls are
considered primary tourist attractions, which receive more consideration from official surveys and statistical reports than other attractions (HKTB 2014). Secondary attractions, such as park or temples, are usually under surveyed because of time and budget constraints (Leung et al. 2016). Utilizing mobile social media data is an efficient means to collect visitor data for second- or third-tier attractions.
a) Airport b) Shopping Mall
c) Park d) Spiritual Center
Figure 4: Tourist Presence in Tourism Spots
Aside from tourism attractions, dining is one of the major aspects of tourism and attracts substantial expenditure from tourists (Correia et al. 2008). Thus, the temporal dining behavior for several types of food venues was examined. Figure 5a shows that the peak time for Hong Kong Restaurants is around lunch (12:00 to 13:00) and dinner (19:00 to 20:00). Hong Kong Restaurants are quite busy the entire day, especially during weekends, as shown by the dark-colored cells. In contrast, tourists prefer fast food restaurants during weekdays rather than on weekends (Figure 5b). Cafés and Desert Shops are frequented during weekends (Figures 5c and 5d). However, Cafés are popular choices around lunchtime and afternoon, whereas Desert Shops are visited more often in the afternoon and evening compared with other parts of the day.
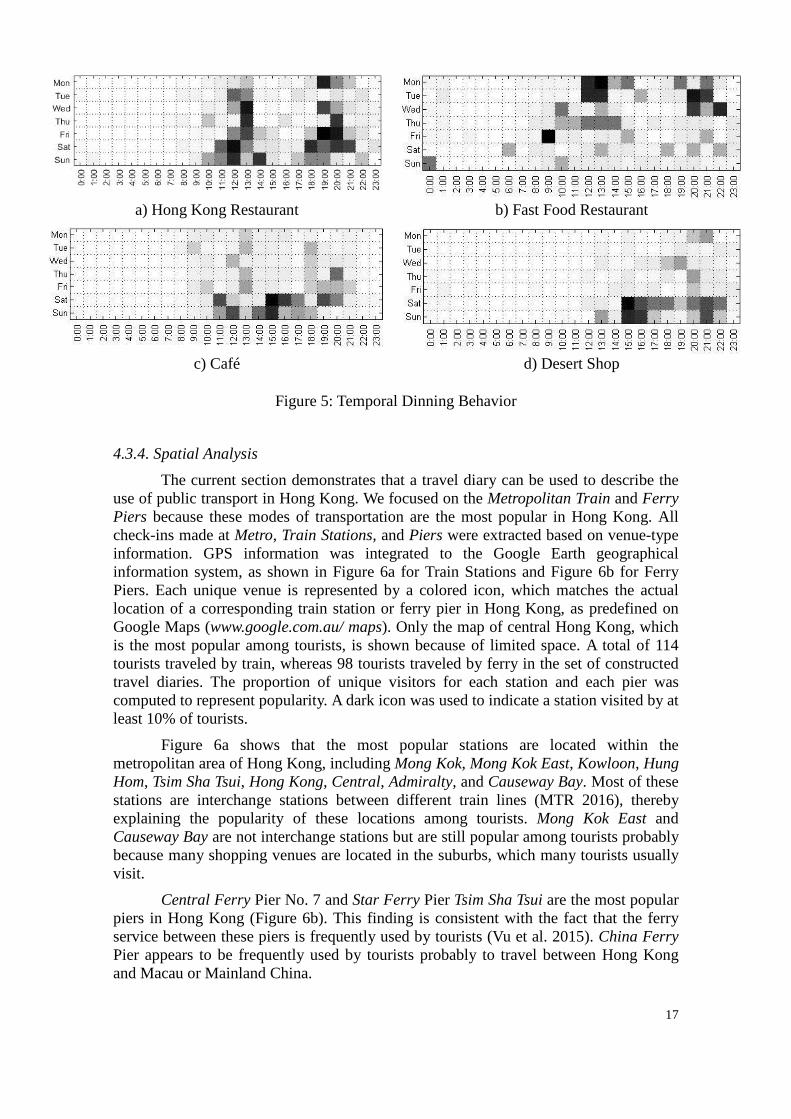
17
a) Hong Kong Restaurant b) Fast Food Restaurant
c) Café d) Desert Shop
Figure 5: Temporal Dinning Behavior
4.3.4. Spatial Analysis
The current section demonstrates that a travel diary can be used to describe the use of public transport in Hong Kong. We focused on the Metropolitan Train and Ferry Piers because these modes of transportation are the most popular in Hong Kong. All check-ins made at Metro, Train Stations, and Piers were extracted based on venue-type information. GPS information was integrated to the Google Earth geographical information system, as shown in Figure 6a for Train Stations and Figure 6b for Ferry Piers. Each unique venue is represented by a colored icon, which matches the actual location of a corresponding train station or ferry pier in Hong Kong, as predefined on Google Maps (www.google.com.au/ maps). Only the map of central Hong Kong, which is the most popular among tourists, is shown because of limited space. A total of 114 tourists traveled by train, whereas 98 tourists traveled by ferry in the set of constructed travel diaries. The proportion of unique visitors for each station and each pier was computed to represent popularity. A dark icon was used to indicate a station visited by at least 10% of tourists.
Figure 6a shows that the most popular stations are located within the metropolitan area of Hong Kong, including Mong Kok, Mong Kok East, Kowloon, Hung Hom, Tsim Sha Tsui, Hong Kong, Central, Admiralty, and Causeway Bay. Most of these stations are interchange stations between different train lines (MTR 2016), thereby explaining the popularity of these locations among tourists. Mong Kok East and Causeway Bay are not interchange stations but are still popular among tourists probably because many shopping venues are located in the suburbs, which many tourists usually visit.
Central Ferry Pier No. 7 and Star Ferry Pier Tsim Sha Tsui are the most popular piers in Hong Kong (Figure 6b). This finding is consistent with the fact that the ferry service between these piers is frequently used by tourists (Vu et al. 2015). China Ferry Pier appears to be frequently used by tourists probably to travel between Hong Kong and Macau or Mainland China.
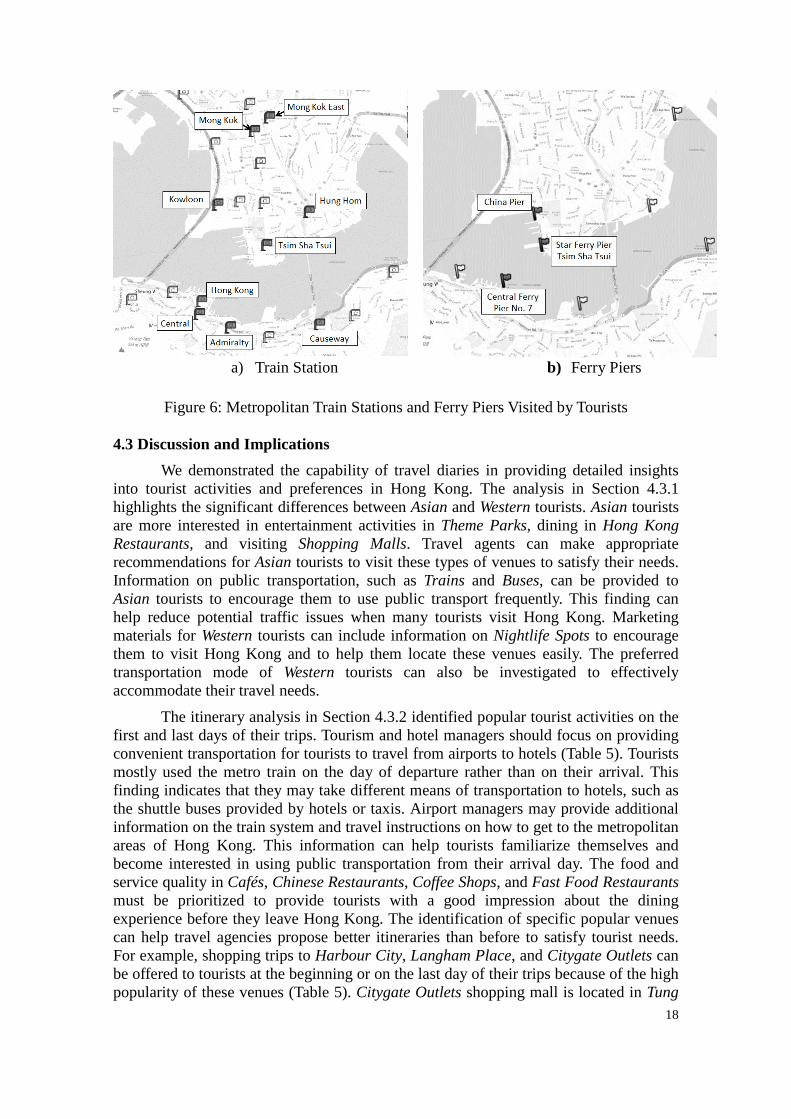
18
a) Train Station b) Ferry Piers
Figure 6: Metropolitan Train Stations and Ferry Piers Visited by Tourists
4.3 Discussion and Implications
We demonstrated the capability of travel diaries in providing detailed insights into tourist activities and preferences in Hong Kong. The analysis in Section 4.3.1 highlights the significant differences between Asian and Western tourists. Asian tourists are more interested in entertainment activities in Theme Parks, dining in Hong Kong Restaurants, and visiting Shopping Malls. Travel agents can make appropriate recommendations for Asian tourists to visit these types of venues to satisfy their needs. Information on public transportation, such as Trains and Buses, can be provided to Asian tourists to encourage them to use public transport frequently. This finding can help reduce potential traffic issues when many tourists visit Hong Kong. Marketing materials for Western tourists can include information on Nightlife Spots to encourage them to visit Hong Kong and to help them locate these venues easily. The preferred transportation mode of Western tourists can also be investigated to effectively accommodate their travel needs.
The itinerary analysis in Section 4.3.2 identified popular tourist activities on the first and last days of their trips. Tourism and hotel managers should focus on providing convenient transportation for tourists to travel from airports to hotels (Table 5). Tourists mostly used the metro train on the day of departure rather than on their arrival. This finding indicates that they may take different means of transportation to hotels, such as the shuttle buses provided by hotels or taxis. Airport managers may provide additional information on the train system and travel instructions on how to get to the metropolitan areas of Hong Kong. This information can help tourists familiarize themselves and become interested in using public transportation from their arrival day. The food and service quality in Cafés, Chinese Restaurants, Coffee Shops, and Fast Food Restaurants must be prioritized to provide tourists with a good impression about the dining experience before they leave Hong Kong. The identification of specific popular venues can help travel agencies propose better itineraries than before to satisfy tourist needs. For example, shopping trips to Harbour City, Langham Place, and Citygate Outlets can be offered to tourists at the beginning or on the last day of their trips because of the high popularity of these venues (Table 5). Citygate Outlets shopping mall is located in Tung
19
Chung, which is close to Hong Kong Airport. Convenient transportation between the Citygate Outlets and Hong Kong Airport can be provided to increase tourist visits.
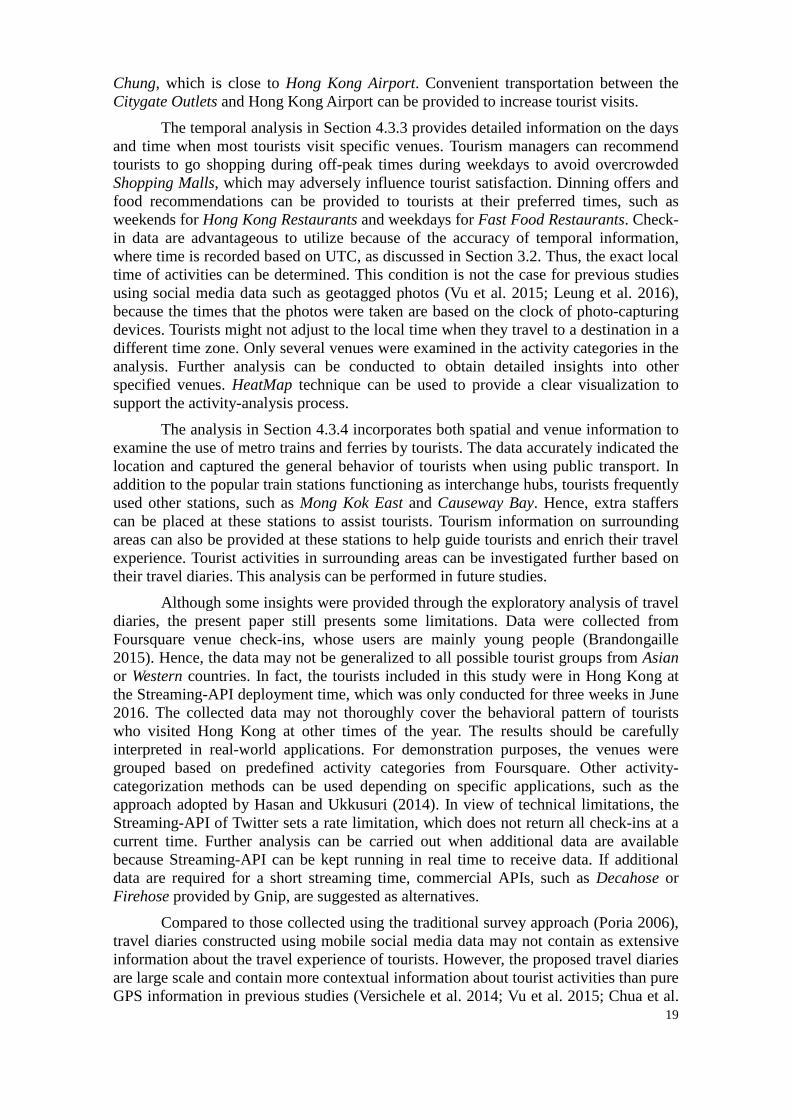
The temporal analysis in Section 4.3.3 provides detailed information on the days and time when most tourists visit specific venues. Tourism managers can recommend tourists to go shopping during off-peak times during weekdays to avoid overcrowded Shopping Malls, which may adversely influence tourist satisfaction. Dinning offers and food recommendations can be provided to tourists at their preferred times, such as weekends for Hong Kong Restaurants and weekdays for Fast Food Restaurants. Check-in data are advantageous to utilize because of the accuracy of temporal information, where time is recorded based on UTC, as discussed in Section 3.2. Thus, the exact local time of activities can be determined. This condition is not the case for previous studies using social media data such as geotagged photos (Vu et al. 2015; Leung et al. 2016), because the times that the photos were taken are based on the clock of photo-capturing devices. Tourists might not adjust to the local time when they travel to a destination in a different time zone. Only several venues were examined in the activity categories in the analysis. Further analysis can be conducted to obtain detailed insights into other specified venues. HeatMap technique can be used to provide a clear visualization to support the activity-analysis process.
The analysis in Section 4.3.4 incorporates both spatial and venue information to examine the use of metro trains and ferries by tourists. The data accurately indicated the location and captured the general behavior of tourists when using public transport. In addition to the popular train stations functioning as interchange hubs, tourists frequently used other stations, such as Mong Kok East and Causeway Bay. Hence, extra staffers can be placed at these stations to assist tourists. Tourism information on surrounding areas can also be provided at these stations to help guide tourists and enrich their travel experience. Tourist activities in surrounding areas can be investigated further based on their travel diaries. This analysis can be performed in future studies.
Although some insights were provided through the exploratory analysis of travel diaries, the present paper still presents some limitations. Data were collected from Foursquare venue check-ins, whose users are mainly young people (Brandongaille 2015). Hence, the data may not be generalized to all possible tourist groups from Asian or Western countries. In fact, the tourists included in this study were in Hong Kong at the Streaming-API deployment time, which was only conducted for three weeks in June 2016. The collected data may not thoroughly cover the behavioral pattern of tourists who visited Hong Kong at other times of the year. The results should be carefully interpreted in real-world applications. For demonstration purposes, the venues were grouped based on predefined activity categories from Foursquare. Other activity-categorization methods can be used depending on specific applications, such as the approach adopted by Hasan and Ukkusuri (2014). In view of technical limitations, the Streaming-API of Twitter sets a rate limitation, which does not return all check-ins at a current time. Further analysis can be carried out when additional data are available because Streaming-API can be kept running in real time to receive data. If additional data are required for a short streaming time, commercial APIs, such as Decahose or Firehose provided by Gnip, are suggested as alternatives.
Compared to those collected using the traditional survey approach (Poria 2006), travel diaries constructed using mobile social media data may not contain as extensive information about the travel experience of tourists. However, the proposed travel diaries are large scale and contain more contextual information about tourist activities than pure GPS information in previous studies (Versichele et al. 2014; Vu et al. 2015; Chua et al.
20
2016, Vu et al. 2017). Inferring tourist activities based on venue check-ins is more convenient than depending on other contents, such as photos, and textual comments. The majority of reported findings are based on objective observations, which describe the general patterns in the data set. The information captured by check-in data reflects the activity patterns of tourists. Apart from check-in data, venue tips provide extra insights into the subjective perspective of tourists; hence, they can be incorporated with check-in data to construct a complete travel diary. The case study mainly used the quantitative methods to objectively describe and summarize tourist activities to demonstrate the capability of the check-in data given that the analysis of textual content for tourist insights has been sufficiently explored in the literature (Dickinger and Mazanec 2015; Claster 2015; Mkono 2013). In addition, some tips were written in the native language of users (e.g., Japanese, Thai, and Korean) rather than in English; this requires special text processing techniques for analysis. The subjective perspectives of tourists, which were reflected in the venue tips, were not reported because of length limitation. The proposed travel diaries with check-in data can be adopted into the future analysis using data mining techniques, such as Association Rules Mining (Versichele et al. 2014), Markov Chains (Vu et al. 2015), and Sequential Rules Mining (Vu et al 2017), to reveal additional insights into the activity patterns of tourists.
Aside from Foursquare, other mobile social media platforms, such as Yelp (Jin et al. 2012), Dianping (Huan et al. 2016), and Weibo Places (Cao et al. 2014), provide check-in services. Most of these platforms provide rewards or credits to encourage users to make genuine check-ins. Due to the popularity of venue check-ins among social media users, popular social media platforms, such as Facebook and Twitter, have also incorporated check-in functions into their systems (CNN 2010). Researchers and tourism practitioners can utilize these popular data sources with contextual information to study the travel behavior of tourists. The proposed method does not aim to substitute the traditional travel diary data collection approaches (Breen et al. 2001; Poria 2006; Coghlan and Pearce 2010). However, as an alternative, it is more affordable to obtain massive richer information than GPS tracking data (Orellana et al. 2012; Birenboim et al. 2013), which can be naturally extended by the geotagged social media data (Chua et al. 2016, Vu et al. 2017).
21
5. CONCLUSIONS
Tourism researchers devoted significant efforts to capture and analyze tourist activities in order to support the strategic planning and decision-making of destination management organizations. Data collection using travel diaries is widely adopted to gain useful information. However, traditional approaches to construct travel diaries usually require direct contact with tourists. Participants are required to manually record their journey and experiences using various media, such as paper, video, online blogs, and GPS loggers. This process is time-consuming and captures limited information. Online social media were used to capture the spatial–temporal behavior of tourists at a large scale, but these sources failed to provide detailed contextual information on user activity.
The present paper attempts to introduce mobile social media in constructing travel diaries in order to capture travel and contextual information reflecting tourist activities. We presented a method to extract Foursquare check-in data and to collect travel information without directly engaging with tourists. The data contained information on the visited locations, temporal behaviors, and activities of tourists. We demonstrated the capability of the proposed approach in a case study of Hong Kong-inbound tourists to support tourism destination management. Differences in activity preferences between Asian and Western tourists were identified according to various activity categories. The use of venue information with spatial–temporal information provided more comprehensive insights than traditional approaches using social media data. Practical implications of the findings were discussed to support location management, transport management, tourism effect management, and visitor experience promotion. The method proposed in the present study can provide researchers and tourism managers with the opportunity to gain insights into tourist behaviors and activity patterns.
The direct extension of this work involves a detailed analysis on tourist behavior in Hong Kong when additional data are available. The analysis can be carried out on other venue types in different activity categories, and tourist opinions, such as venue tips, are integrated into the analysis. For instance, detailed analysis on visiting patterns of food venues and tips can help managers design travel packages with suitable dining options for different tourist groups. The use of other types of transportation, such as bus and taxi, by tourists can be investigated further to improve transportation planning and development. Contrast analysis can be performed between local residents and tourists to examine the differences or similarities between these groups in order to make appropriate recommendations and to provide tourists with rich travel experiences. When userIDs are identified, tourism practitioners can develop user real-time monitoring applications and make instant decisions with real-time data. Mobile recommendation applications can also be developed to offer tourists with special services based on their check-in locations and preferences. Future studies can also consider different mobile social media platforms as travel diaries sources to obtain a comprehensive understanding of tourists’ travel behavior.
22
REFERENCES Aichner, T., and F. Jacob. 2015. “Measuring the degree of corporate social media use.”
International Journal of Market Research, 57 (2): 257-275.
Asakura, Y., and T. Iryo. 2007. “Analysis of tourist behaviour based on the tracking data collected using a mobile communication instrument.” Transportation Research Part A: Policy and Practice 41(7): 684-690.
Brandongaille. 2015. 26 great foursquare demographics. Retrieved 15th July 2016, http://brandongaille.com/26-great-foursquare-demographics/
Birenboim, A., S. Anton-Clave, A. P. Russo, and N. Shoval. 2013. “Temporal activity patterns of theme park visitors.” Tourism Geographies 15(4): 601-619.
Breakwell, G., and P. Wood. 1995. Diary Techniques. In G. M. Breakwell, S. Hammond, and C. Fife-Schaw (Eds.) Research Methods in Psychology, 293-301. Sage, London.
Breen, H., A. Bull, and M. Walo. 2001. “A comparison of survey methods to estimate visitor expenditure at a local event.” Tourism Management 22 (5):473-479.
Castro-Nuno, M., J. A. Molina-Toucedo, and M. P. Pablo-Romero. 2013. “Tourism and GDP: A meta-analysis of panel data studies.” Journal of Travel Research 52(6):745-758.
Cao, J., Q. Hu, and Q. Li. 2014. “A study of users’ movements based on check-in data in location-based social networks”. In Proceedings of the International Symposium on Web and Wireless Geographical Information Systems, 54-66, Seoul, South Korea, May 29-30.
Chancellor, H. C. 2012. “Applying travel pattern data to destination development and marketing decisions.” Tourism Planning & Development 9 (3):321-332.
Chen, C., D. Zhang, B. Guo, X. Ma, G. Pan, and Z. Wu. 2015. “TripPlanner: Personalized trip planning leveraging heterogeneous crowdsourced digital footprints.” IEEE Transactions on Intelligent Transportation Systems 16 (3):1259-1273.
Cheng, Z., J. Caverlee, and K. Lee. 2011. “Exploring millions of footprints in location sharing services”. In Proceedings of the Fifth International AAAI Conference on Weblogs and Social Media, 81–88, Barcelona, Catalonia, Spain, July 17-21.
Chua, A., L. Servillo, E. Marcheggiani, and A. V. Moere. 2016. “Mapping Cilento: Using Geotagged Social Media Data to Characterize Tourist Flows in Southern Italy.” Tourism Management 57:295–310.
Claster, W., N. Ghotbi, and S. Shanmuganathan. 2015. “Gathering medical tourism information through algorithmic text analysis of tweets”. In M. Cooper, K. Vafadari, M. Hieda (ed.) Current Issues and Emerging Trends in Medical Tourism, 173-188. Hershey, PA: Medical Information Science Reference.
CNN 2010. Facebook Introduces check-in feature. Retrieved 7th March 2017, http://edition.cnn.com/2010/TECH/social.media/08/18/facebook.location/
23
Coghlan, A., and P. Pearce. 2010. “Tracking affective components of satisfaction.” Tourism and Hospitality Research 10 (1):42-58.
Correia, A., M. Moital, C. F. D. Costa, and R. Peres. 2008. “The determinants of gastronomic tourists’ satisfaction: a second-order factor analysis.” Journal of Food Service 19 (3):164-176.
Dickinson, J. E., and D. Robbins. 2008. “Representations of tourism transport problems in a rural destination.” Tourism Management 29 (6):1110-1121.
Dickinger, A., and J. A., Mazanec. 2015. “Significant word items in hotel guest reviews: A feature extraction approach.” Tourism Recreation Research 40(3):353-363.
Edwards, D., T. Griffin, B. Hayllar, T. Dickson, and S. Schweinsberg. 2009. Understanding tourist experience and behavior in cities: An Australian case study. Technical report, Sustainable Tourism. Retrieved 15th July 2016 https://opus.lib.uts.edu.au/bitstream/10453/16847/1/2010002806OK.pdf,
Ferreira, A. P. G., T. H. Silva, and A. A. F. Loureiro. 2015. “Beyond sights: Large scale study of tourists behavior using foursquare data”. In Proceedings of IEEE 15th International Conference on Data Mining Workshops, 1117-1124, Atlantic City, NJ, America, November 14-17.
Finsterwalder, J., and C. Laesser. 2013. “Segmenting outbound tourists based on their activities: toward experiential consumption spheres in tourism services?” Tourism Review 68 (3):21-43.
Foursquare. 2016. Foursquare category hierarchy. Retrieved 15th July 2016 https://developer.foursquare.com/categorytree
Garcia-Palomares, J. C., J. Gutierrez, and C. Minguez. 2015. “Identification of tourist hot spots based on social networks: A comparative analysis of European metropolises using photo-sharing services and GIS.” Applied Geography 63:408-417.
Harrower, M., and C. A. Brewer. 2003. “Colorbrewer.org: An online tool for selecting colour schemes for maps.” The Cartographic Journal 40 (1):27-37.
Hasan, S., and S. V. Ukkusuri. 2014. “Urban activity pattern classification using topic models from online geo-location data.” Transportation Research Part C 44:363-381.
Hauff, C. 2013. “A study on the accuracy of Flickrs geotag data”. In Proceedings of the 36th international ACM SIGIR conference on Research and development in information retrieval, 1037-1040, Dublin, Ireland, July 28 –August 01.
Heatmap. 2016. Math Works. Retrieved 15th July 2016, https://au.mathworks.com/help/bioinfo/ref/heatmap.html
HKTB. 2014. Visitor Profile Report 2014. Retrieved August 21, 2015, from http://securepartnernet.hktb.com/filemanager/intranet/dept_info/private_20/paper/Visitor-Pro/Profile2014/Visitor_Profile_2014_0.pdf
HKTB. 2016. Monthly report - visitor arrivals statistics: May 2016. HKTB Insights & Research. Retrieved 8th July 2016 http://www.discoverhongkong.com/common/images/about-hktb/pdf/Tourism%20Statistics%2005%202016.pdf
24
Holcomb, Z. C.1998. Fundamentals of Descriptive Statistics (1st ed.). Pyrczak Publishing. Glendale, California, USA
Huan, Y., Y. Chen, Q. Zhou, J. Zhao, and X. Wang. 2016. “Where are we visiting? Measurement and analysis of venues in Dianping”. In Proceedings of the IEEE International Conference on Communications, 1-6, Kuala Lumpur, Malaysia, May 23-27.
Ian, P., P. Shane, and L. Jillian. 2011. “Grey nomads on tour: A revolution in travel and tourism for older adults.” Tourism Analysis 16 (3):283-294.
Jin, L., X. Long, K. Zhang, Y.-R. Lin, and J. Joshi . 2016. “Characterizing users check-in activities using their scores in a location-based social network.” Multimedia Systems 22 (1): 87-98.
Jin L., X. Long, J. B. D. Joshi, and M. Anwar. 2012. “Analysis of access control mechanisms for users' check-ins in Location-Based Social Network Systems”. In Proceedings of the IEEE 13th International Conference on Information Reuse & Integration (IRI), 712-717, Las Vegas, August 8-10.
Johnson, B. 2016. The great British pub. Historic UK: The History and Heritage Accommodation Guide. Retrieved 20th May 2016 from http://www.historic-uk.com/CultureUK/The-Great-British-Pub/.
Joo, H. H., H.-G. Kang, J. J. Moon. 2014. “The effect of rain on the decision to visit a Theme Park.” Asia Pacific Journal of Tourism Research, 19(1):61-85.
Kadar, B., and M. Gede. 2013. “Where do tourists go? Visualizing and analysing the spatial distribution of geotagged photography.” Cartographica: The International Journal for Geographic Information and Geovisualization, 48 (2):78-88.
Kanji, G. K. 2006. 100 Statistical tests. London, UK: SAGE Publication Ltd.
Kaplan, A. M. 2012. “If you love something, let it go mobile: Mobile marketing and mobile social media 4x4.” Business Horizons 55 (2):129-139.
Kessler, S. 2010. The future of the hotel industry and social media. Mashable Australia. Retrieved on 23rd June 2016, http://mashable.com/2010/10/18/hotel-industry-social-media.
Krentzman, A. R., E. A. R. Robinson, J. M. Jester, and B. E. Perron. 2011. “Heat maps: A technique for classifying and analyzing drinking behavior.” Substance Use & Misuse 46 (5):687-695.
Leung, X. Y., F. Wang, B. Wu, B. Bai, K. A. Stahura, and Z. Xie. 2012. “A social network analysis of overseas tourist movement patterns in Beijing: the Impact of the Olympic Games.” International Journal of Tourism Research 14 (5):469-484.
Leung, R., H. Q. Vu, J. Rong, and Y. Miao. 2016. “Tourist visit and photo sharing behavior analysis: A case study of Hong Kong temples”. In Proceedings of Information and Communication Technology in Tourism, pp. 197-209, Bilbao, Spain, Febuary 02 – 05.
Lew, A., and B. McKercher. 2006. “Modeling tourist movements: A local destination analysis”. Annals of Tourism Research, 33 (2):403-423.
Lindqvist J., J. Cranshaw, J. Wiese, J. Hong, and J. Zimmerman. 2011. “I’m the Mayor of my House: Examining why People use Foursquare - a Social-driven Location
25
Sharing Application”. In Proceedings of the SIGCHI Conference on Human Factors in Computing Systems, 2409-2418, Vancouver, BC, May 07 – 12.
McKercher, B., and G. Lau. 2008. “Movement patterns of tourists within a destination.” Tourism Geographies 10 (3):355-374.
McKercher, B., N., Shoval, E. Ng, and A. Birenboim. 2012. “First and repeat visitor behaviour: GPS tracking and GIS analysis in Hong Kong”. Tourism Geographies 14 (1):147-161.
Mkono, M. 2013. “Existential authenticity in cultural restaurant experiences in Victoria Falls, Zimbabwe: A netnogphic analysis.” International Journal of Culture, Tourism and Hospitality Research 7(4):353-363.
MTR. 2016. MTR system map. MTR Corporation Limited. Retrieved on 15 July 2016, http://www.mtr.com.hk/archive/en/services/routemap.pdf
Nelson, R. R. 2015. “The all-important first and last impression: A guide to auditing the trip to and from your airport.” Journal of Convention & Event Tourism 16(1): 20-26.
Obar, J. A., S. Wildman. 2015. “Social media definition and the governance challenge: An introduction to the special issue.” Telecommunications Policy 39 (9):745-750.
Onder, I., Koerbitz, W., and A. Hubmann-Haidvogel. 2014. “Tracing tourists by their digital footprints.” Journal of Travel Research 55(5):566-573.
Orellana, D., A. K. Bregt, A. Ligtenberg, and M. Wachowicz. 2012. “Exploring visitor movement patterns in natural recreational areas.” Tourism Management 33 (3):672-682.
Patil, S., G. Norcie, A. Kapadia , and A. Lee. 2012. "Check out where I am!": location-sharing motivations, preferences, and practices. Proceedings of Extended Abstracts on Human Factors in Computing Systems, 1997-2002, Austin, Texas, May 05 – 10,
Pingdom. 2011. Social network popularity around the world in 2011. Retrieved 8th July 2016, http://royal.pingdom.com/2011/10/21/social-network-popularity-around-the-world-in-2011/
Pocock, N., and A. McIntosh . 2013. “Long-term traveler return, 'home'?” Annals of Tourism Research 42:402-424.
Poria, Y. 2006. “A published diary as a data source.” Annals of Tourism Research, 33 (4):1163-1166.
Raun, J., R. Ahas, and M. Tiru. 2016. “Measuring Tourism Destinations Using Mobile Tracking Data.” Tourism Management 57:202–12.
Shoval, N., M. Bob, E. Ng, and A. Birenboim. 2011. “Hotel location and tourist activity in cities.” Annals of Tourism Research 38 (4):1594-1612.
Sobolevsky, S., I. Bijic, A. Belyi, I. Sitko, B. Hawelka, J. M. Arias, and C. Ratti. 2015. “Scaling of City Attractiveness for Foreign Visitors through Big Data of Human Economical and Social Media Activity.” IEEE International Congress on Big Data, 600–607, New York, NY.
Spangenberg, T. 2014. “Development of a mobile toolkit to support research on human mobility behavior using GPS trajectories.” Information Technology & Tourism 14 (4):317-346.
26
Stepchenkova, S., and F. Zhan. 2013. “Visual destination images of Peru: Comparative content analysis of DMO and user-generated photography.” Tourism Management 36:590-601.
Summers, N. 2014. Swarm redefine the Foursquare check-in to help you meet nearby friends. Retrieved 11 October 2016, http://thenextweb.com/apps/2014/05/15/can-foursquares-new-swarm-app-save-check/
Tkaczynski, A. 2013. “Flower power? Activity preferences of residents and tourists to an Australian owner festival.” Tourism Analysis 18 (5):607-613.
UNIX. 2013. The open group base specifications issue 7, section 4.15 seconds since the epoch. UNIX - The Open Group. Retrieved 10th July 2016, http://pubs.opengroup.org/onlinepubs/9699919799/basedefs/V1_chap04.html
Versichele, M., L. de Groote, M. C. Bouuaer, T. Neutens, I. Moerman, and N. Van de Weghe. 2014. “Pattern Mining in Tourist Attraction Visits through Association Rule Learning on Bluetooth Tracking Data: A Case Study of Ghent, Belgium.” Tourism Management 44:67–81.
Vu, H. Q., G. Li, R. Law, and B. H. Ye. 2015. “Exploring the travel behaviors of inbound tourists to Hong Kong using geotagged photos.” Tourism Management 46:222-232.
Vu. H. Q., G. Li, R. Law, Y. Zhang. 2017. “Travel diaries analysis by sequential rules mining.” Journal of Travel Research, In Press. DOI: 10.1177/0047287517692446
Xia, J., F. H. Evans, K. Spilsbury, V. Ciesielski, C. Arrowsmith, and G. Wright. 2010. “Market segments based on the dominant movement patterns of tourists.” Tourism Management 31 (4):464-469.
Yelp 2016. What are check-ins?. Yelp Inc. Retrieved March 2016, https://www.yelp-support.com/article/What-are-Check-Ins
Yoo, K.-H., and W. Lee. 2015. “Use of Facebook in the US heritage accommodations sector: A exploratory study.” Journal of Heritage Tourism 10 (2):191-201.
Yu, Y., S. Tang, R. Zimmermann, and K. Aizawa. 2014. Empirical observation of user activities: Check-ins, venue photos and tips in Foursquare. In Proceedings of the First International Workshop on Internet-Scale Multimedia Management, 31-34, Orlando, Florida, USA, November 07.
Zakrisson, I., and M. Zillinger 2012. “Emotions in motion: tourist experiences in time and space.” Current Issues in Tourism 15 (6):505-523.
Zillinger, M. 2007. “Tourist routes: A time-geographical approach on German Car-Tourists in Sweden.” Tourism Geographies 9 (1):64-83.
Zillinger, M. 2008. “German tourist behaviour in Sweden.” Tourism, 56 (2):143-158.