Embed Size (px)
Citation preview

Statistical release P0351
Tourism and Migration
April 2013
Embargoed until:29 July 2013
13:00 Enquiries: Forthcoming issue: Expected release date:
User Information Services May 2013 26 August 2013 Tel.: (012) 310 8600 / 4892 / 8390
Statistics South Africa P0351
Tourism and migration, April 2013
1
Contents Preface ....................................................................................................................................................................... 2 1. Key findings ...................................................................................................................................................... 3 1.1 Travellers ............................................................................................................................................................ 3 1.1.1 Number of travellers ........................................................................................................................................... 3 1.1.2 Mode of travel ..................................................................................................................................................... 3 1.2 Tourists ............................................................................................................................................................... 4 1.2.1 Mode of travel ..................................................................................................................................................... 4 1.2.2 Regional and national distribution ...................................................................................................................... 4 1.2.3 Purpose of visit............................... ....... ...........................................................................................................5 1.2.4 Sex and age distribution ..................................................................................................................................... 5 2. Figures .................................................................................................................................................................... 6 Figure 1. Number of tourists from the ten leading overseas countries in April 2013 compared to April 2012 ............. 6 Figure 2. Number of tourists from the ten leading Southern African Development Community (SADC) countries
in April 2013 compared to April 2012 ............................................................................................................ 6 Figure 3. Number of tourists from the ten leading ‘other’ African countries in April 2013 compared to April 2012 ...... 7 3. Tables ...................................................................................................................................................................... 8 Table 1. Number of South African residents and foreign travellers by travel direction ............................................... 8 Table 2. Number of South African residents and foreign travellers by travel direction and mode of travel ................ 9 Table 3. Number of tourists by country of residence and mode of travel .................................................................. 10 Table 4. Number of tourists by country of residence and purpose of visit ................................................................ 14 Table 5. Number of tourists from overseas, SADC and ‘other’ African regions by sex and age group .................... 18 4. Explanatory notes .......................................................................................................................................... 19 4.1 Introduction ....................................................................................................................................................... 19 4.2 Purpose of the statistical release ..................................................................................................................... 19 4.3 Scope and coverage ......................................................................................................................................... 19 4.4 Data .................................................................................................................................................................. 19 4.5 Limitations ........................................................................................................................................................ 20 4.6 Definitions of terms ........................................................................................................................................... 20 4.6.1 Definitions used by the United Nations World Tourism Organisation (UNWTO) ............................................. 20 4.6.2 Definitions used specifically in this release ...................................................................................................... 20 4.7 Symbols used ................................................................................................................................................... 20 5. General information ....................................................................................................................................... 21
Statistics South Africa P0351
Tourism and migration, April 2013
2 Preface This monthly statistical release provides information on South African residents and foreign travellers who entered or left South Africa in April 2013. Specific focus is on foreign tourists who entered the country during this month. The tourists are classified by region and country of residence. Details of their mode of travel; purpose of visit; and age and sex distribution are also provided.
PJ Lehohla Statistician-General

Statistics South Africa P0351
Tourism and migration, April 2013
3 1. Key findings
1.1 Travellers
1.1.1 Number of travellers
The routine data collected by the Department of Home Affairs’ (DHA) immigration officers at the ports of entry into South Africa show that a total of 3 183 228 travellers (arrivals and departures) passed through South African ports of entry in April 2013. As presented in Table 1 on page 8, these travellers were made up of 827 188 South African residents and 2 356 040 foreign travellers. A further breakdown of the figures for South African residents indicates that there were 436 896 arrivals and 390 292 departures. The corresponding volumes for foreign arrivals and departures were 1 278 502 and 1 077 538, respectively.
A comparison between the movements in March 2013 and April 2013 indicates that the volumes of arrivals increased for both South African residents and foreign travellers while the volume of departures decreased for both South African residents and foreign travellers. The volume of arrivals for South African residents increased by 12,5% (from 388 245 in March 2013 to 436 896 in April 2013) and the volume of departures for South African residents decreased by 15,3% (from 460 973 in March 2013 to 390 292 in April 2013). Foreign arrivals increased by 3,4% (from 1 235 930 in March 2013 to 1 278 502 in April 2013) while foreign departures decreased by 4,5% (from 1 128 559 in March 2013 to 1 077 538 in April 2013).
A comparison between the movements in April 2012 and April 2013 indicates that the volumes of arrivals and departures decreased for South African residents and increased for foreign travellers. For South African residents, the volume of arrivals decreased by 4,2% (from 455 895 in April 2012 to 436 896 in April 2013) and the volume of departures decreased by 14,6% (from 457 250 in April 2012 to 390 292 in April 2013). The volume of arrivals for foreign travellers increased by 10,5% (from 1 157 430 in April 2012 to 1 278 502 in April 2013) and the volume of departures increased by 11,1% (from 970 112 in April 2012 to 1 077 538 in April 2013).
Detailed information on the departure of travellers is not available in the movement control system. Data on the purpose of travel and the number of days South African residents intend to spend or spent abroad are not collected by the DHA. Hence, it is not possible to categorise South African residents as tourists and non-tourists. However, some data are available on foreign arrivals for this categorisation.
As presented in Table 1, in April 2013, 79 892 (6,2%) foreign arrivals were classified as non-visitors while 1 198 610 (93,8%) were classified as visitors. The visitors were categorised into three groups:
i. arrivals only – comprising of visitors who entered the country in April 2013 but did not depart in April 2013 [411 906 (34,4%)];
ii. single trips – visitors who came once in April 2013 and left in April 2013 [354 226 (29,6%)]; and
iii. multiple trips – visitors who came and left more than once in April 2013 [432 478 (36,1%)].
Visitors were further grouped as same-day visitors and overnight visitors (tourists). In April 2013, there were 395 135 (33,0%) same-day visitors and 803 475 (67,0%) tourists. Between March 2013 and April 2013, the volume of same-day visitors increased by 9,3% (from 361 593 in March 2013 to 395 135 in April 2013) and tourists decreased by 1,4% (from 815 075 in March 2013 to 803 475 in April 2013). Furthermore, between April 2012 and April 2013, the volume of same-day visitors increased by 34,2% (from 294 482 in April 2012 to 395 135 in April 2013) while the volume of tourists increased by 0,08% (from 802 834 in April 2012 to 803 475 in April 2013).
1.1.2 Mode of travel
Travellers who cross South Africa’s borders rarely use trains since they are mainly used for transporting goods. Data presented in Table 2 on page 9 show that in April 2013, road transport was the most common mode of travel used by 2 328 804 (73,2%) out of the 3 183 228 travellers. The total number of travellers who used air transport was 830 688 (26,1%). The arrivals data on South African residents show that 149 666 (34,3%) came by air and 279 560 (64,0%) came by road. For departures, 150 861 (38,7%) and 233 894 (59,9%) used air and road transport respectively.
Statistics South Africa P0351
Tourism and migration, April 2013
4
In the case of foreign travellers, 273 633 (21,4%) arrived by air while those who came by road were 997 395 (78,0%). When departing South Africa, 256 528 (23,8%) foreign travellers left by air whilst 817 955 (75,9%) left by road. Table 2 further shows that an overwhelming majority [379 037 (95,9%)] of same-day visitors arrived in the country by road. Only 15 856 (4,0%) same-day visitors flew into the country. Data on tourists show that, 567 943 (70,7%) used road transport but 232 590 (28,9%) came by air.
1.2 Tourists
1.2.1 Mode of travel
The country of residence of tourists is used to categorise them into their respective countries and regions. Information on the specific region and country of residence of the tourists and the mode of travel used to enter South Africa is provided in Table 3 on page 10. In April 2013, 170 835 (88,1%) overseas tourists arrived in the country by air whilst 20 154 (10,4%) came in by road. This is in contrast to the number of tourists from the Southern African Development Community (SADC) countries who came into South Africa predominantly by road [545 439 (92,5%)]. Only 44 161 (7,5%) tourists from the SADC countries came in by air. The number of tourists who came into South Africa by air from ‘other’ African countries was 16 480 (90,8%); with 1 644 (9,1%) using road transport.
1.2.2 Regional and national distribution
In April 2013, the distribution of overseas tourists was as follows; Europe, 105 016 (54,2%); Asia, 34 254 (17,7%); North America, 29 181 (15,1%); Australasia, 13 492 (7,0%); Central and South America, 9 283 (4,8%) and Middle East, 2 622 (1,4%). Virtually all tourists from Africa came from the SADC countries, [589 646 (97,0%)]. The distribution of the remaining tourists from Africa is as follows: West Africa, 10 017 (1,6%); East and Central Africa, 6 827 (1,1%) and North Africa 1 313 (0,2%).
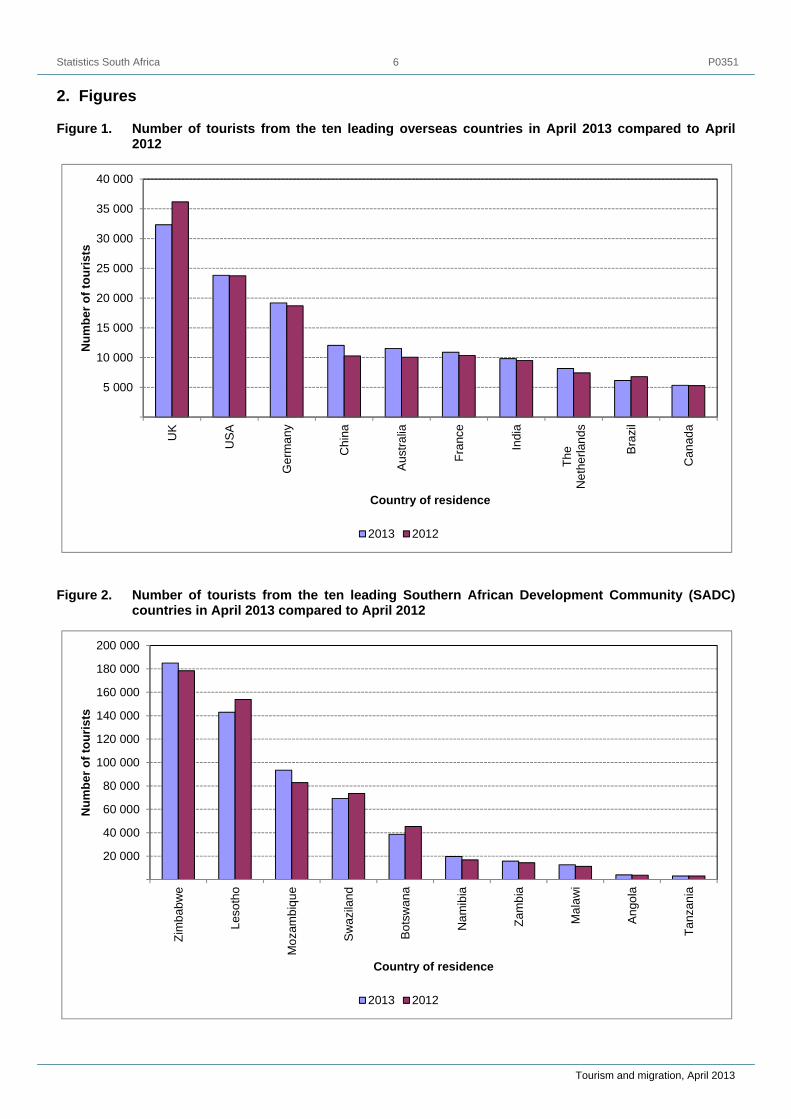
Data presented in Figure 1 on page 6 indicate that United Kingdom (UK), 32 322 (16,7%); United States of America (USA), 23 833 (12,3%); Germany, 19 190 (9,9%); China 12 052 (6,2%); Australia, 11 552 (6,0%); France, 10 904 (5,6%); India 9 815 (5,1%); The Netherlands, 8 163 (4,2%); Brazil, 6 155 (3,2%) and Canada, 5 347 (2,8%) were the ten leading overseas countries visiting South Africa in April 2013. Tourists from these ten countries constituted 71,9% of all tourists from overseas countries. A comparison between movements in April 2012 and April 2013 shows that the number of tourists increased in eight countries (China, Australia, The Netherlands, France, India, Germany, Canada and USA) and decreased in two countries (UK and Brazil). China had the highest increase of 17,3% (from 10 277 tourists in April 2012 to 12 052 tourists in April 2013) while UK had the largest decrease of 10,6% (from 36 145 tourists in April 2012 to 32 322 tourists in April 2013).
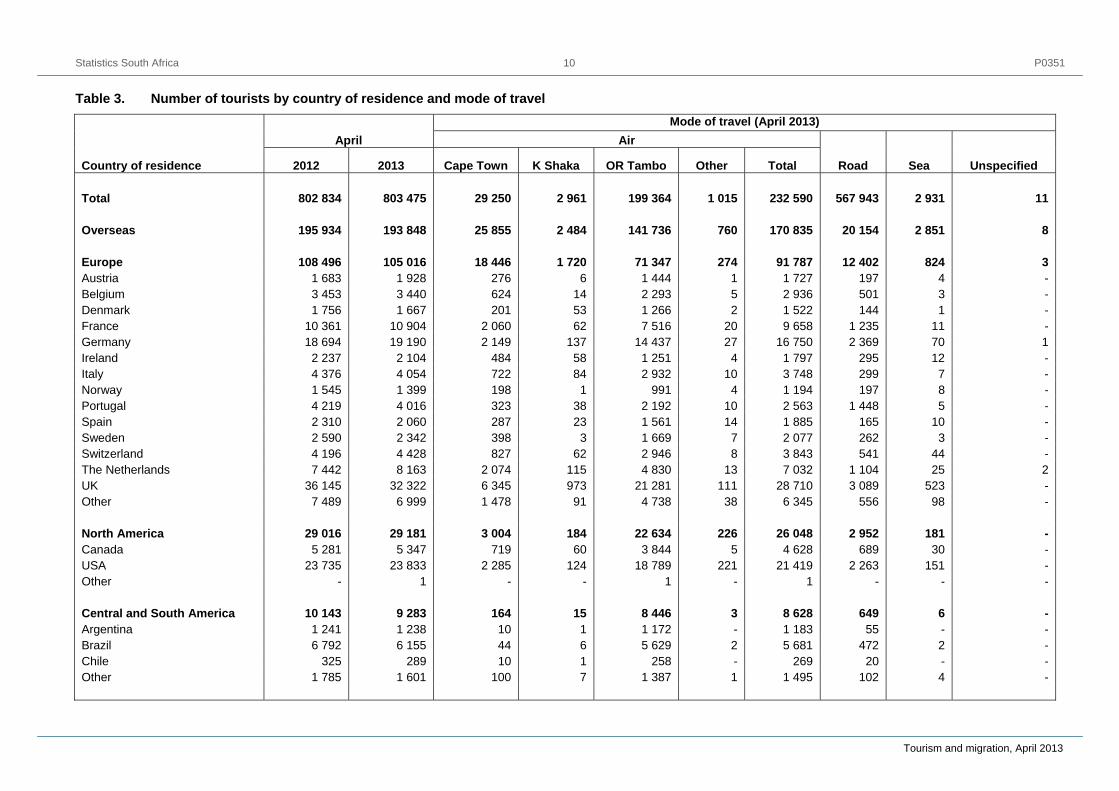
The ten leading SADC countries in the number of tourists visiting South Africa in March 2013 were Zimbabwe, 184 972 (31,4%); Lesotho, 142 959 (24,2%); Mozambique, 93 399 (15,8%); Swaziland, 69 342 (11,8%); Botswana, 38 596 (6,5%); Namibia, 19 735 (3,3%); Zambia, 15 760 (2,7%); Malawi, 12 659 (2,1%); Angola, 4 033 (0,7%) and Tanzania, 2 986 (0,5%) (see Figure 2 on page 6). Tourists from these ten countries constituted 99,1% of all tourists from the SADC countries. A comparison between movements in April 2012 and April 2013 shows that the number of tourists increased in six countries (Namibia, Malawi, Mozambique, Zambia, Angola and Zimbabwe) and decreased for (Botswana, Lesotho, Swaziland and Tanzania). Namibia had the highest increase of 17,4% (from 16 814 tourists in April 2012 to 19 735 tourists in April 2013). Botswana showed the largest decrease of 14,9% (from 45 335 tourists in April 2012 to 38 596 tourists in April 2013).
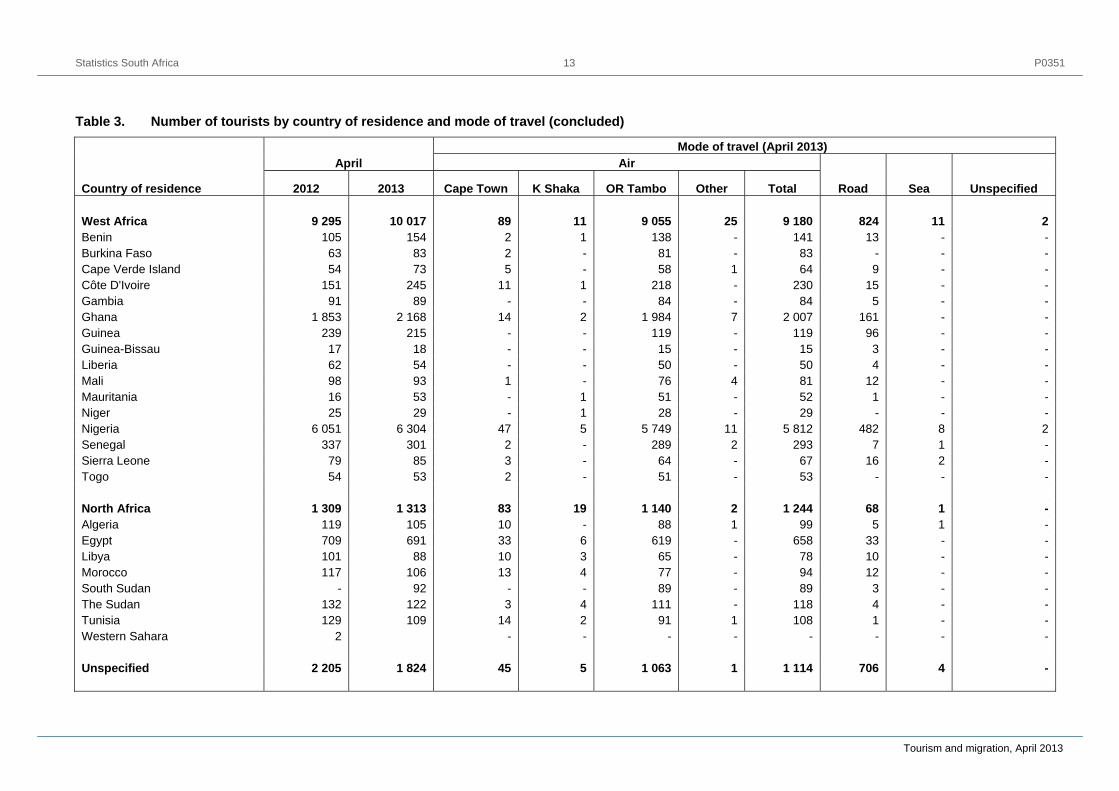
The ten leading countries in the number of tourists visiting South Africa in April 2013 from ‘other’ African countries, as shown in Figure 3 on page 7, were Nigeria, 6 304 (34,7%); Kenya, 2 964 (16,3%); Ghana, 2 168 (11,9%); Uganda, 1 242 (6,8%); Ethiopia, 763 (4,2%); Egypt, 691 (3,8%); Cameroon, 510 (2,8%); Gabon, 412 (2,3%); Senegal, 301 (1,7%) and Congo, 288 (1,6%). Tourists from these ten countries constituted 86,2% of all tourists from ‘other’ African countries. A comparison between movements in April 2012 and April 2013 shows that the number of tourists increased in five countries (Ethiopia, Kenya, Ghana, Uganda and Nigeria) and decreased for (Gabon, Senegal, Congo, Cameroon and Egypt). Ethiopia had the highest increase of 40,3% (from 544 tourists in

Statistics South Africa P0351
Tourism and migration, April 2013
5 April 2012 to 763 tourists in April 2013). Gabon showed the largest decrease of 14,2% (from 480 tourists in April 2012 to 412 tourists in April 2013).
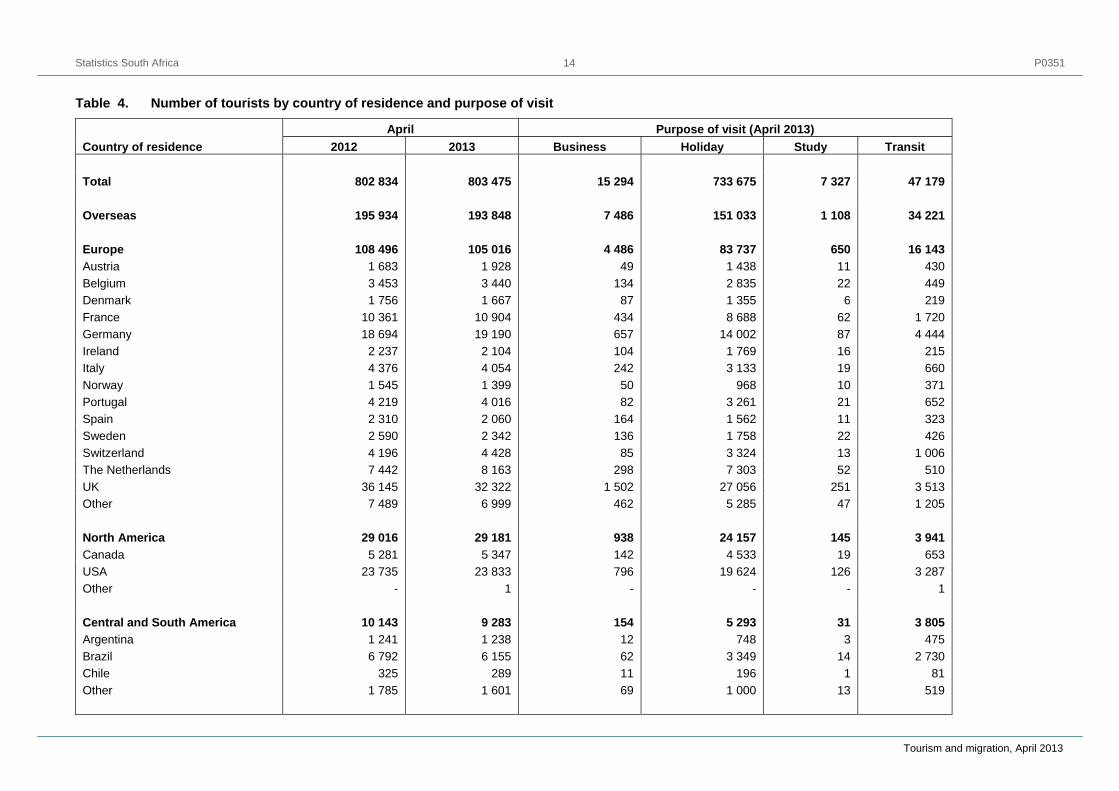
1.2.3 Purpose of visit
As observed from data given in Table 4 on page 14, in April 2013, a majority [733 675 (91,3%)] of tourists were in South Africa for holidays compared to only 47 179 (5,9%), 15 294 (1,9%), and 7 327 (0,9%) of tourists who were in South Africa in transit; for business and for study purposes respectively. A detailed analysis reveals that of all the tourists from each of the overseas regions, at least 57,0% came to South Africa for holidays. A total of 11 610 (86,1%) tourists came from Australasia; 2 182 (83,2%) from Middle East; 24 157 (82,8%) from North America; 83 737 (79,7%) from Europe, 24 054 (70,2%) from Asia and 5 293 (57,0%) from Central and South America were in South Africa for holidays. Middle East had a higher proportion (7,6%) of their tourists in South Africa for business compared to other overseas regions while Central and South America (41,0%) had higher proportions of their tourists in transit.
The majority of African tourists [581 227 (95,6%)] came to South Africa for holidays. However, there were differences between tourists from the SADC countries and ‘other’ African countries namely:
Whereas 566 659 (96,1%) of tourists from the SADC countries were on holidays; 14 568 (80,2%) of tourists from ‘other’ African countries came for the same purpose. Data on the regions of ‘other’ African countries show that tourists on holidays constituted 82,1% (8 225); 79,1% (5 401) and 71,7% (942) for West Africa; East and Central Africa; and North Africa, respectively.
Business persons constituted 4,1% (737) of tourists from ‘other’ African countries and 1,2% (7 014) from the SADC countries. North Africa had the highest proportion of 8,3% (109) of its tourists in South Africa for business.
Students made up 3,0% (540) of tourists from ‘other’ African countries compared with 1,0% (5 672) from the SADC countries. East and Central Africa had the highest proportion of 4,4% (302) of their tourists in South Africa for study purposes.
The proportion of tourists in transit was higher for those from ‘other’ African countries [12,7% (2 312)] compared to those from SADC countries [1,7% (10 301)]. North Africa had the highest proportion of 17,2% (226) of their tourists in transit.
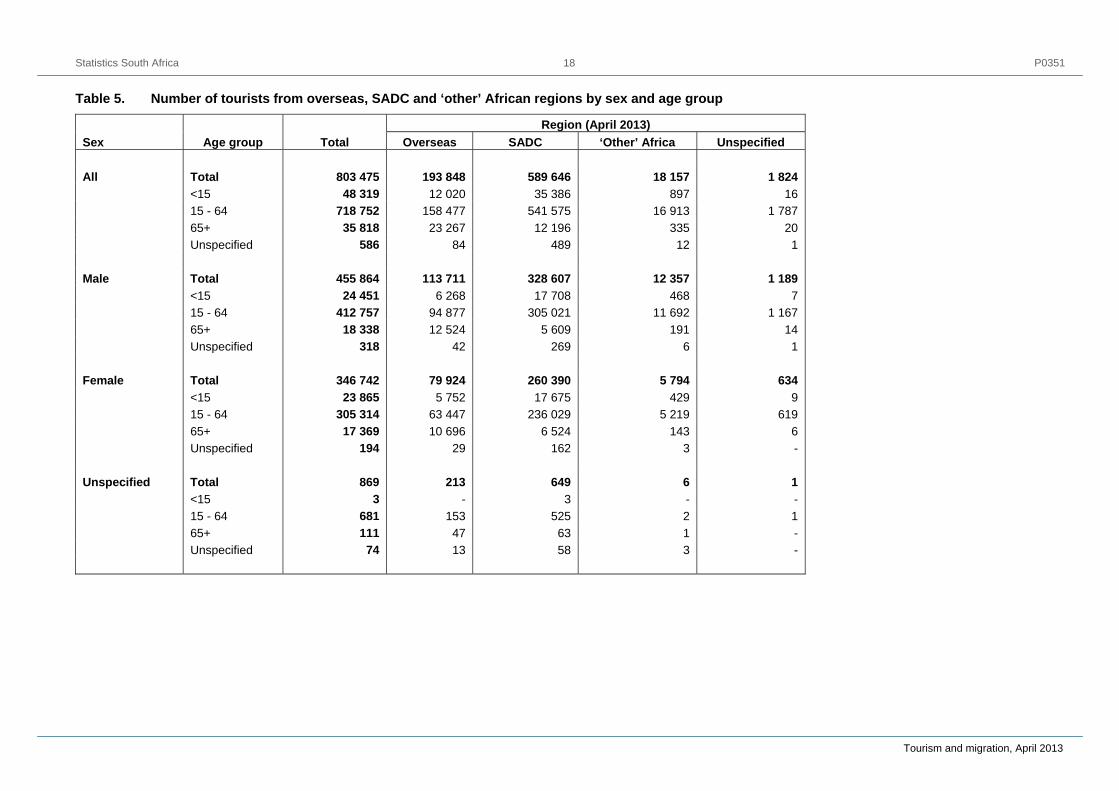
1.2.4 Sex and age distribution
Table 5 on page 18 shows that, in April 2013, there were 455 864 (56,7%) male and 346 742 (43,2%) female tourists. Overseas tourists were made up of 113 711 (58,7%) male tourists and 79 924 (41,2%) female tourists. There were 328 607 (55,7%) male and 260 390 (44,2%) female tourists from the SADC countries. The tourists from ‘other’ African countries were made up of 12 357 (68,1%) males and 5 794 (31,9%) females.
The ages of the tourists were categorised into three broad groups namely; those younger than 15 years, 15 to 64 years, and 65 years and older. The overall results presented in Table 5 show that 718 752 (89,5%) of tourists were aged between 15 and 64 years; 35 818 (4,5%) were aged 65 years and older and 48 319 (6,0%) were aged less than 15 years. Taking the regions of residence into consideration, the results further show that 158 477 (81,8%) of overseas tourists were aged between 15 and 64 years compared with 541 575 (91,8%) and 16 913 (93,1%) of tourists in the same age range from the SADC countries and ‘other’ African countries respectively.
The proportion of tourists aged less than 15 years was higher among tourists from overseas [6,2% (12 020)] and those from the SADC countries [6,0% (35 386)] than among tourists from ‘other’ African countries [4,9% (897)]. There was a higher proportion of young female tourists in comparison to young male tourists for all the three regions. A comparison of the three regions shows relatively high proportions of the elderly among both male [11,0% (12 524)] and female 13,4% (10 696) tourists from overseas. This is in contrast to the pattern observed among tourists from the other two regions. Thus 1,7% (5 609) of male and 2,5% (6 524) of female tourists from the SADC countries were aged 65 years and older. Likewise, 1,5% (191) of male and 2,5% (143) of female tourists from ‘other’ African countries were aged 65 years and older.
Statistics South Africa P0351
Tourism and migration, April 2013
6 2. Figures
Figure 1. Number of tourists from the ten leading overseas countries in April 2013 compared to April 2012
5 000
10 000
15 000
20 000
25 000
30 000
35 000
40 000U
K
USA
Ger
man
y
Chi
na
Aus
tralia
Fran
ce
Indi
a
The
Net
herla
nds
Bra
zil
Can
ada
Num
ber o
f tou
rists
Country of residence
2013 2012
Figure 2. Number of tourists from the ten leading Southern African Development Community (SADC) countries in April 2013 compared to April 2012
20 000
40 000
60 000
80 000
100 000
120 000
140 000
160 000
180 000
200 000
Zim
babw
e
Leso
tho
Moz
ambi
que
Sw
azila
nd
Bot
swan
a
Nam
ibia
Zam
bia
Mal
awi
Ang
ola
Tanz
ania
Num
ber o
f tou
rists
Country of residence
2013 2012

Statistics South Africa P0351
Tourism and migration, April 2013
7
Figure 3. Number of tourists from the ten leading ‘other’ African countries in April 2013 compared to April 2012
1 000
2 000
3 000
4 000
5 000
6 000
7 000N
iger
ia
Ken
ya
Gha
na
Uga
nda
Eth
iopi
a
Egy
pt
Cam
eroo
n
Gab
on
Sen
egal
Con
go
Num
ber o
f tou
rists
Country of residence
2013 2012

Statistics South Africa P0351
Tourism and migration, April 2013
8 3. Tables Table 1. Number of South African residents and foreign travellers by travel direction
Travel direction
2012 2013 % change
April March April April 2012 - April 2013 March 2013 - April 2013 Total 3 040 687 3 213 707 3 183 228 4,7 -0,9 South African residents 913 145 849 218 827 188 -9,4 -2,6 Arrivals 455 895 388 245 436 896 -4,2 12,5 Departures 457 250 460 973 390 292 -14,6 -15,3 Foreign traveller 2 127 542 2 364 489 2 356 040 10,7 -0,4 Arrivals 1 157 430 1 235 930 1 278 502 10,5 3,4 Departures 970 112 1 128 559 1 077 538 11,1 -4,5 Foreign arrivals 1 157 430 1 235 930 1 278 502 10,5 3,4 Non-visitors 60 114 59 262 79 892 32,9 34,8 Visitors 1 097 316 1 176 668 1 198 610 9,2 1,9 Visitors 1 097 316 1 176 668 1 198 610 9,2 1,9 Arrivals only 426 140 386 179 411 906 -3,3 6,7 Single trips 390 677 445 613 432 478 10,7 -2,9 Multiple trips 280 499 344 876 354 226 26,3 2,7 Visitor 1 097 316 1 176 668 1 198 610 9,2 1,9 Same-day 294 482 361 593 395 135 34,2 9,3 Overnight (tourists) 802 834 815 075 803 475 0,1 -1,4

Statistics South Africa P0351
Tourism and migration, April 2013
9 Table 2. Number of South African residents and foreign travellers by travel direction and mode of travel
Travel Direction April
Mode of travel (April 2013) Air
Road Sea Unspecified 2012 2013 Cape Town K Shaka OR Tambo Other Total Total 3 040 687 3 183 228 108 893 22 841 690 576 8 378 830 688 2 328 804 23 718 18 South African residents 913 145 827 188 33 499 13 366 248 334 5 328 300 527 513 454 13 207 - Arrivals 455 895 436 896 16 893 6 975 123 100 2 698 149 666 279 560 7 670 - Departures 457 250 390 292 16 606 6 391 125 234 2 630 150 861 233 894 5 537 - Foreign travellers 2 127 542 2 356 040 75 394 9 475 442 242 3 050 530 161 1 815 350 10 511 18 Arrivals 1 157 430 1 278 502 33 259 3 975 234 898 1 501 273 633 997 395 7 456 18 Departures 970 112 1 077 538 42 135 5 500 207 344 1 549 256 528 817 955 3 055 - Visitors 1 097 316 1 198 610 29 602 2 971 214 777 1 096 248 446 946 980 3 173 11 Same-day 294 482 395 135 352 10 15 413 81 15 856 379 037 242 - Overnight (tourists) 802 834 803 475 29 250 2 961 199 364 1 015 232 590 567 943 2 931 11
Statistics South Africa P0351
Tourism and migration, April 2013
10
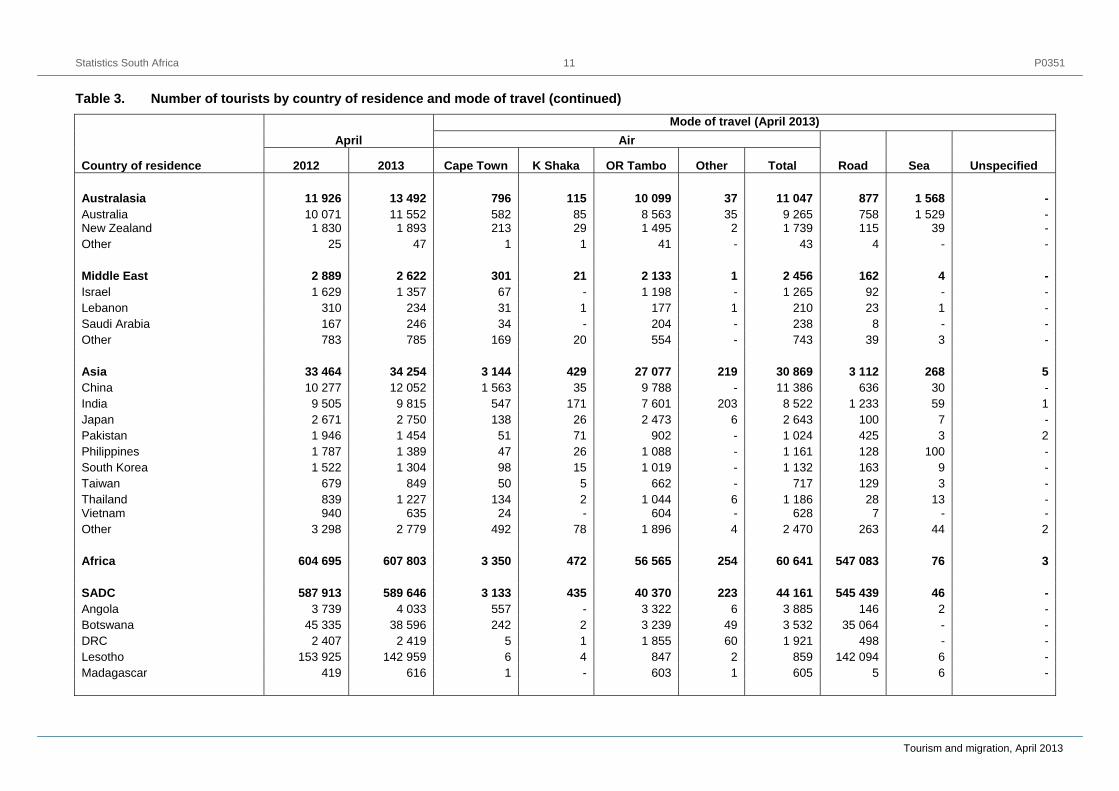
Table 3. Number of tourists by country of residence and mode of travel
Country of residence
April Mode of travel (April 2013)
Air
Road
Sea Unspecified 2012 2013 Cape Town K Shaka OR Tambo Other Total Total 802 834 803 475 29 250 2 961 199 364 1 015 232 590 567 943 2 931 11 Overseas 195 934 193 848 25 855 2 484 141 736 760 170 835 20 154 2 851 8 Europe 108 496 105 016 18 446 1 720 71 347 274 91 787 12 402 824 3 Austria 1 683 1 928 276 6 1 444 1 1 727 197 4 - Belgium 3 453 3 440 624 14 2 293 5 2 936 501 3 - Denmark 1 756 1 667 201 53 1 266 2 1 522 144 1 - France 10 361 10 904 2 060 62 7 516 20 9 658 1 235 11 - Germany 18 694 19 190 2 149 137 14 437 27 16 750 2 369 70 1 Ireland 2 237 2 104 484 58 1 251 4 1 797 295 12 - Italy 4 376 4 054 722 84 2 932 10 3 748 299 7 - Norway 1 545 1 399 198 1 991 4 1 194 197 8 - Portugal 4 219 4 016 323 38 2 192 10 2 563 1 448 5 - Spain 2 310 2 060 287 23 1 561 14 1 885 165 10 - Sweden 2 590 2 342 398 3 1 669 7 2 077 262 3 - Switzerland 4 196 4 428 827 62 2 946 8 3 843 541 44 - The Netherlands 7 442 8 163 2 074 115 4 830 13 7 032 1 104 25 2 UK 36 145 32 322 6 345 973 21 281 111 28 710 3 089 523 - Other 7 489 6 999 1 478 91 4 738 38 6 345 556 98 - North America 29 016 29 181 3 004 184 22 634 226 26 048 2 952 181 - Canada 5 281 5 347 719 60 3 844 5 4 628 689 30 - USA 23 735 23 833 2 285 124 18 789 221 21 419 2 263 151 - Other - 1 - - 1 - 1 - - - Central and South America 10 143 9 283 164 15 8 446 3 8 628 649 6 - Argentina 1 241 1 238 10 1 1 172 - 1 183 55 - - Brazil 6 792 6 155 44 6 5 629 2 5 681 472 2 - Chile 325 289 10 1 258 - 269 20 - - Other 1 785 1 601 100 7 1 387 1 1 495 102 4 -
Statistics South Africa P0351
Tourism and migration, April 2013
11
Table 3. Number of tourists by country of residence and mode of travel (continued)
Country of residence
April Mode of travel (April 2013)
Air
Road
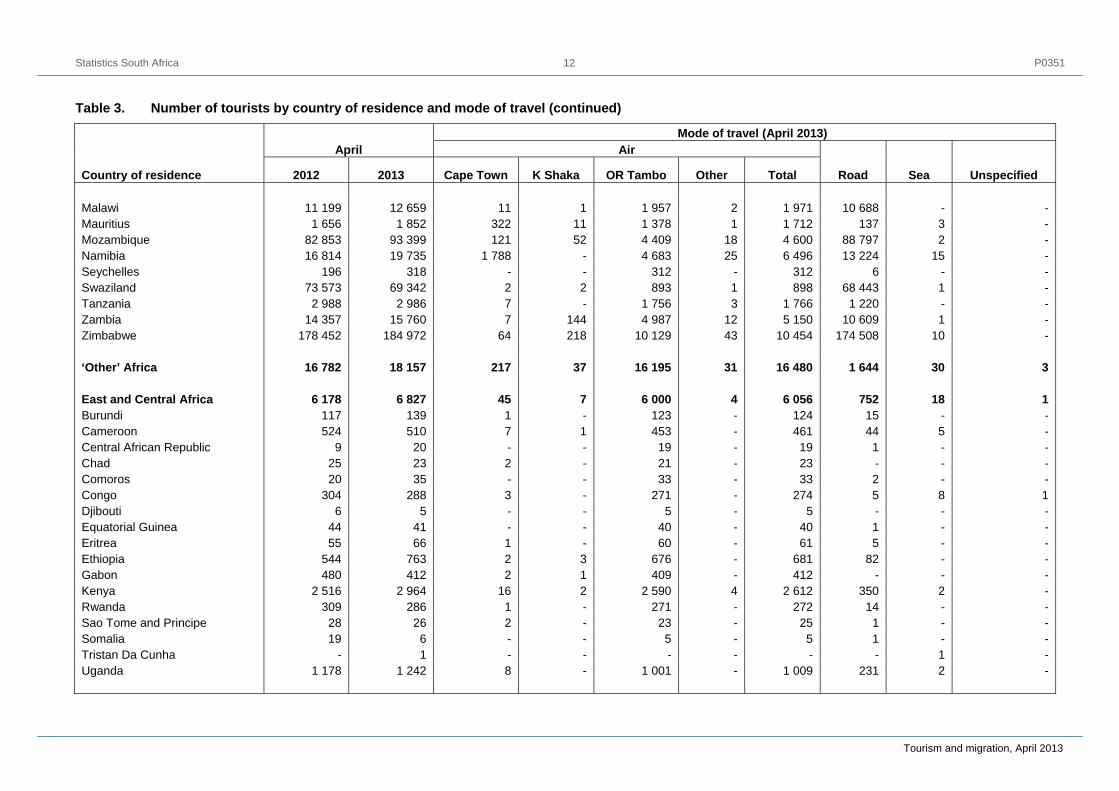
Sea Unspecified 2012 2013 Cape Town K Shaka OR Tambo Other Total Australasia 11 926 13 492 796 115 10 099 37 11 047 877 1 568 - Australia 10 071 11 552 582 85 8 563 35 9 265 758 1 529 - New Zealand 1 830 1 893 213 29 1 495 2 1 739 115 39 - Other 25 47 1 1 41 - 43 4 - - Middle East 2 889 2 622 301 21 2 133 1 2 456 162 4 - Israel 1 629 1 357 67 - 1 198 - 1 265 92 - - Lebanon 310 234 31 1 177 1 210 23 1 - Saudi Arabia 167 246 34 - 204 - 238 8 - - Other 783 785 169 20 554 - 743 39 3 - Asia 33 464 34 254 3 144 429 27 077 219 30 869 3 112 268 5 China 10 277 12 052 1 563 35 9 788 - 11 386 636 30 - India 9 505 9 815 547 171 7 601 203 8 522 1 233 59 1 Japan 2 671 2 750 138 26 2 473 6 2 643 100 7 - Pakistan 1 946 1 454 51 71 902 - 1 024 425 3 2 Philippines 1 787 1 389 47 26 1 088 - 1 161 128 100 - South Korea 1 522 1 304 98 15 1 019 - 1 132 163 9 - Taiwan 679 849 50 5 662 - 717 129 3 - Thailand 839 1 227 134 2 1 044 6 1 186 28 13 - Vietnam 940 635 24 - 604 - 628 7 - - Other 3 298 2 779 492 78 1 896 4 2 470 263 44 2 Africa 604 695 607 803 3 350 472 56 565 254 60 641 547 083 76 3 SADC 587 913 589 646 3 133 435 40 370 223 44 161 545 439 46 - Angola 3 739 4 033 557 - 3 322 6 3 885 146 2 - Botswana 45 335 38 596 242 2 3 239 49 3 532 35 064 - - DRC 2 407 2 419 5 1 1 855 60 1 921 498 - - Lesotho 153 925 142 959 6 4 847 2 859 142 094 6 - Madagascar 419 616 1 - 603 1 605 5 6 -
Statistics South Africa P0351
Tourism and migration, April 2013
12
Table 3. Number of tourists by country of residence and mode of travel (continued)
Country of residence
April Mode of travel (April 2013)
Air
Road
Sea Unspecified 2012 2013 Cape Town K Shaka OR Tambo Other Total Malawi 11 199 12 659 11 1 1 957 2 1 971 10 688 - - Mauritius 1 656 1 852 322 11 1 378 1 1 712 137 3 - Mozambique 82 853 93 399 121 52 4 409 18 4 600 88 797 2 - Namibia 16 814 19 735 1 788 - 4 683 25 6 496 13 224 15 - Seychelles 196 318 - - 312 - 312 6 - - Swaziland 73 573 69 342 2 2 893 1 898 68 443 1 - Tanzania 2 988 2 986 7 - 1 756 3 1 766 1 220 - - Zambia 14 357 15 760 7 144 4 987 12 5 150 10 609 1 - Zimbabwe 178 452 184 972 64 218 10 129 43 10 454 174 508 10 - ‘Other’ Africa 16 782 18 157 217 37 16 195 31 16 480 1 644 30 3 East and Central Africa 6 178 6 827 45 7 6 000 4 6 056 752 18 1 Burundi 117 139 1 - 123 - 124 15 - - Cameroon 524 510 7 1 453 - 461 44 5 - Central African Republic 9 20 - - 19 - 19 1 - - Chad 25 23 2 - 21 - 23 - - - Comoros 20 35 - - 33 - 33 2 - - Congo 304 288 3 - 271 - 274 5 8 1 Djibouti 6 5 - - 5 - 5 - - - Equatorial Guinea 44 41 - - 40 - 40 1 - - Eritrea 55 66 1 - 60 - 61 5 - - Ethiopia 544 763 2 3 676 - 681 82 - - Gabon 480 412 2 1 409 - 412 - - - Kenya 2 516 2 964 16 2 2 590 4 2 612 350 2 - Rwanda 309 286 1 - 271 - 272 14 - - Sao Tome and Principe 28 26 2 - 23 - 25 1 - - Somalia 19 6 - - 5 - 5 1 - - Tristan Da Cunha - 1 - - - - - - 1 - Uganda 1 178 1 242 8 - 1 001 - 1 009 231 2 -
Statistics South Africa P0351
Tourism and migration, April 2013
13 Table 3. Number of tourists by country of residence and mode of travel (concluded)
Country of residence
April Mode of travel (April 2013)
Air
Road
Sea Unspecified 2012 2013 Cape Town K Shaka OR Tambo Other Total West Africa 9 295 10 017 89 11 9 055 25 9 180 824 11 2 Benin 105 154 2 1 138 - 141 13 - - Burkina Faso 63 83 2 - 81 - 83 - - - Cape Verde Island 54 73 5 - 58 1 64 9 - - Côte D'Ivoire 151 245 11 1 218 - 230 15 - - Gambia 91 89 - - 84 - 84 5 - - Ghana 1 853 2 168 14 2 1 984 7 2 007 161 - - Guinea 239 215 - - 119 - 119 96 - - Guinea-Bissau 17 18 - - 15 - 15 3 - - Liberia 62 54 - - 50 - 50 4 - - Mali 98 93 1 - 76 4 81 12 - - Mauritania 16 53 - 1 51 - 52 1 - - Niger 25 29 - 1 28 - 29 - - - Nigeria 6 051 6 304 47 5 5 749 11 5 812 482 8 2 Senegal 337 301 2 - 289 2 293 7 1 - Sierra Leone 79 85 3 - 64 - 67 16 2 - Togo 54 53 2 - 51 - 53 - - - North Africa 1 309 1 313 83 19 1 140 2 1 244 68 1 - Algeria 119 105 10 - 88 1 99 5 1 - Egypt 709 691 33 6 619 - 658 33 - - Libya 101 88 10 3 65 - 78 10 - - Morocco 117 106 13 4 77 - 94 12 - - South Sudan - 92 - - 89 - 89 3 - - The Sudan 132 122 3 4 111 - 118 4 - - Tunisia 129 109 14 2 91 1 108 1 - - Western Sahara 2 - - - - - - - - Unspecified 2 205 1 824 45 5 1 063 1 1 114 706 4 -
Statistics South Africa P0351
Tourism and migration, April 2013
14 Table 4. Number of tourists by country of residence and purpose of visit
Country of residence April Purpose of visit (April 2013)
2012 2013 Business Holiday Study Transit Total 802 834 803 475 15 294 733 675 7 327 47 179 Overseas 195 934 193 848 7 486 151 033 1 108 34 221 Europe 108 496 105 016 4 486 83 737 650 16 143 Austria 1 683 1 928 49 1 438 11 430 Belgium 3 453 3 440 134 2 835 22 449 Denmark 1 756 1 667 87 1 355 6 219 France 10 361 10 904 434 8 688 62 1 720 Germany 18 694 19 190 657 14 002 87 4 444 Ireland 2 237 2 104 104 1 769 16 215 Italy 4 376 4 054 242 3 133 19 660 Norway 1 545 1 399 50 968 10 371 Portugal 4 219 4 016 82 3 261 21 652 Spain 2 310 2 060 164 1 562 11 323 Sweden 2 590 2 342 136 1 758 22 426 Switzerland 4 196 4 428 85 3 324 13 1 006 The Netherlands 7 442 8 163 298 7 303 52 510 UK 36 145 32 322 1 502 27 056 251 3 513 Other 7 489 6 999 462 5 285 47 1 205 North America 29 016 29 181 938 24 157 145 3 941 Canada 5 281 5 347 142 4 533 19 653 USA 23 735 23 833 796 19 624 126 3 287 Other - 1 - - - 1 Central and South America 10 143 9 283 154 5 293 31 3 805 Argentina 1 241 1 238 12 748 3 475 Brazil 6 792 6 155 62 3 349 14 2 730 Chile 325 289 11 196 1 81 Other 1 785 1 601 69 1 000 13 519

Statistics South Africa P0351
Tourism and migration, April 2013
15
Table 4. Number of tourists by country of residence and purpose of visit (continued)
Country of residence April Purpose of visit (April 2013)
2012 2013 Business Holiday Study Transit Australasia 11 926 13 492 235 11 610 36 1 611 Australia 10 071 11 552 200 9 957 27 1 368 New Zealand 1 830 1 893 34 1 640 8 211 Other 25 47 1 13 1 32 Middle East 2 889 2 622 198 2 182 29 213 Israel 1 629 1 357 77 1 141 5 134 Lebanon 310 234 28 172 - 34 Saudi Arabia 167 246 10 232 4 - Other 783 785 83 637 20 45 Asia 33 464 34 254 1 475 24 054 217 8 508 China 10 277 12 052 362 8 194 26 3 470 India 9 505 9 815 610 7 824 76 1 305 Japan 2 671 2 750 117 1 738 7 888 Pakistan 1 946 1 454 61 1 144 12 237 Philippines 1 787 1 389 20 520 9 840 South Korea 1 522 1 304 63 970 30 241 Taiwan 679 849 14 549 4 282 Thailand 839 1 227 19 1 077 19 112 Vietnam 940 635 6 89 1 539 Other 3 298 2 779 203 1 949 33 594 Africa 604 695 607 803 7 751 581 227 6 212 12 613 SADC 587 913 589 646 7 014 566 659 5 672 10 301 Angola 3 739 4 033 80 2 979 212 762 Botswana 45 335 38 596 312 36 161 896 1 227 DRC 2 407 2 419 53 2 182 85 99 Lesotho 153 925 142 959 54 141 892 653 360 Madagascar 419 616 9 256 6 345

Statistics South Africa P0351
Tourism and migration, April 2013
16 Table 4. Number of tourists by country of residence and purpose of visit (continued)
Country of residence April Purpose of visit (April 2013)
2012 2013 Business Holiday Study Transit Malawi 11 199 12 659 272 11 880 47 460 Mauritius 1 656 1 852 82 1 477 24 269 Mozambique 82 853 93 399 1 008 90 420 132 1 839 Namibia 16 814 19 735 2 170 14 813 1 111 1 641 Seychelles 196 318 6 293 - 19 Swaziland 73 573 69 342 515 67 109 1 296 422 Tanzania 2 988 2 986 45 2 436 59 446 Zambia 14 357 15 760 1 073 13 643 182 862 Zimbabwe 178 452 184 972 1 335 181 118 969 1 550 ‘Other’ Africa 16 782 18 157 737 14 568 540 2 312 East and Central Africa 6 178 6 827 293 5 401 302 831 Burundi 117 139 5 108 2 24 Cameroon 524 510 21 344 30 115 Central African Republic 9 20 - 13 2 5 Chad 25 23 2 20 - 1 Comoros 20 35 - 17 1 17 Congo 304 288 5 240 18 25 Djibouti 6 5 1 3 - 1 Equatorial Guinea 44 41 1 32 7 1 Eritrea 55 66 6 54 1 5 Ethiopia 544 763 31 673 14 45 Gabon 480 412 10 339 20 43 Kenya 2 516 2 964 156 2 346 136 326 Rwanda 309 286 4 191 20 71 Sao Tome and Principe 28 26 - 18 - 8 Somalia 19 6 - 6 - - Tristan Da Cunha - 1 - 1 - - Uganda 1 178 1 242 51 996 51 144

Statistics South Africa P0351
Tourism and migration, April 2013
17 Table 4. Number of tourists by country of residence and purpose of visit (concluded)
Country of residence April Purpose of visit (April 2013)
2012 2013 Business Holiday Study Transit West Africa 9 295 10 017 335 8 225 202 1 255 Benin 105 154 7 140 1 6 Burkina Faso 63 83 6 61 2 14 Cape Verde Island 54 73 3 59 2 9 Côte D'Ivoire 151 245 19 188 3 35 Gambia 91 89 3 35 1 50 Ghana 1 853 2 168 62 1 732 17 357 Guinea 239 215 8 149 2 56 Guinea-Bissau 17 18 1 9 2 6 Liberia 62 54 1 44 2 7 Mali 98 93 6 67 - 20 Mauritania 16 53 3 42 - 8 Niger 25 29 3 23 1 2 Nigeria 6 051 6 304 179 5 392 166 567 Senegal 337 301 18 202 1 80 Sierra Leone 79 85 10 53 1 21 Togo 54 53 6 29 1 17 North Africa 1 309 1 313 109 942 36 226 Algeria 119 105 6 81 4 14 Egypt 709 691 59 477 6 149 Libya 101 88 4 46 11 27 Morocco 117 106 9 82 2 13 South Sudan - 92 11 75 - 6 The Sudan 132 122 9 95 12 6 Tunisia 129 109 11 86 1 11 Western Sahara 2 - - - - Unspecified 2 205 1 824 57 1 415 7 345
Statistics South Africa P0351
Tourism and migration, April 2013
18
Table 5. Number of tourists from overseas, SADC and ‘other’ African regions by sex and age group
Sex Age group
Total Region (April 2013)
Overseas SADC ‘Other’ Africa Unspecified All Total 803 475 193 848 589 646 18 157 1 824 <15 48 319 12 020 35 386 897 16 15 - 64 718 752 158 477 541 575 16 913 1 787 65+ 35 818 23 267 12 196 335 20 Unspecified 586 84 489 12 1 Male Total 455 864 113 711 328 607 12 357 1 189 <15 24 451 6 268 17 708 468 7 15 - 64 412 757 94 877 305 021 11 692 1 167 65+ 18 338 12 524 5 609 191 14 Unspecified 318 42 269 6 1 Female Total 346 742 79 924 260 390 5 794 634 <15 23 865 5 752 17 675 429 9 15 - 64 305 314 63 447 236 029 5 219 619 65+ 17 369 10 696 6 524 143 6 Unspecified 194 29 162 3 - Unspecified Total 869 213 649 6 1 <15 3 - 3 - - 15 - 64 681 153 525 2 1 65+ 111 47 63 1 - Unspecified 74 13 58 3 -
Statistics South Africa P0351
Tourism and migration, April 2013
19
4. Explanatory notes 4.1 Introduction
Legal movements across South African borders as well as legal immigration into South Africa fall under the jurisdiction of the Department of Home Affairs (DHA). Statistics South Africa (Stats SA) then processes and publishes this information.
Administrative data sources from the DHA, that is, information from all the country’s ports of entry and applications for permanent residence, constitute the only comprehensive source of information on foreign arrivals and departures, documented immigrants and emigrants. The information from this source of data provides the best national coverage (both in terms of space and time) of the population movements of South African residents and foreign travellers. The data:
can be used to estimate, monitor and understand salient characteristics of foreign travellers and volumes of South African residents travelling outside South Africa; and
provide information that can be used to (a) assess the extent of government’s progress in strengthening bilateral political and economic relations by assessing the number of international tourist arrivals; and (b) benchmark surveys focusing on demand for local tourism services by foreign travellers.
The information on documented migrants provides crucial information on receiving countries of South African emigrants which could be targeted in initiatives geared towards attracting back migrants into the country. In addition, the data on permanent residents are valuable in assessing not only the demographic and economic profiles of immigrants but also their contribution to national social and economic programmes.
4.2 Purpose of the statistical release
This release reports on arrivals and departures of South African residents and foreign travellers. Detailed information on the gender and age structure; mode of travel; national and regional distribution; and purpose of travel of overnight visitors or tourists are provided.
4.3 Scope and coverage
The release covers data on arrivals and departures of South African residents and foreign travellers. A detailed analysis of the data on foreign tourists with respect to: mode of travel, purpose of visit, sex and age distribution is covered in the release. Statistics on documented migration, that is self-declared emigrants, are not reported due to the unavailability of data.
4.4 Data
Information published in this release is based on data obtained from the following data sources within the DHA.
Data routinely collected by immigration officers at all road, air and sea entry ports on all travellers (South African residents and foreign travellers) arriving into or departing from South Africa are captured into the DHA’s population Movement Control System (MCS). The counts/statistics relate to the number of individual movements, rather than to the number of people. Hence, the multiple movements of individual people during the calendar month are each counted separately. Generally the data are collected directly from travel documents either by scanning or capturing onto the port’s electronic database. No forms or cards are used (except in rare occasions when the capturing system is down) to collect information from travellers. Individual ports regularly transmit data onto the national database at the head office of the DHA.
Stats SA downloads the data covering a particular calendar month from the mainframe of the State Information Technology Agency (SITA), where the DHA stores its data.
As part of data interrogation, data from the OR Tambo International Airport, which has the highest volume of travellers, are compared with passenger statistics from the Airport Company of South Africa (ACSA). As expected, in any specific month, an increase in the volume of passengers reported by ACSA has been accompanied by an increase in the volume of travellers recorded by DHA. A similar pattern was also

Statistics South Africa P0351
Tourism and migration, April 2013
20
observed when the volume of travellers decreased. However, the volume of passengers recorded by ACSA is generally higher than that of the DHA because of, among other reasons, travellers who are in transit and those who boarded airplanes but were refused entry into the country. In April 2013, the DHA data was 3,1% lower than that of ACSA.
4.5 Limitations
The information on the total number of arrivals and departures of South African residents is collected from the scanning of passports. However, data are not collected from passengers on country visited; country of final destination, the duration of stay; intended duration of stay and purpose of visit. With this limitation, it is impossible to identify the number of tourists from the data on South African residents.
Due to unavailability of data from the DHA, information on documented immigrants is not included in this current publication. The documented immigration information will be provided as soon as it is made available to Stats SA.
4.6 Definitions of terms
4.6.1 Definitions used by the United Nations World Tourism Organisation (UNWTO)
Traveller is someone who moves between different geographical locations for any purpose and any duration.
Visitor refers to any person travelling to a place other than that of his/her usual environment for less than 12 months and whose main purpose of the trip is other than the exercise of an activity remunerated from within the place visited.
Same-day visitor is a visitor who visits a place for less than one night.
Tourist (overnight visitor) is a visitor who stays at least one night in collective or private accommodation in the place visited.
Tourism comprises the activities of persons travelling to, and staying in places outside their usual environment, for not more than one consecutive year, for leisure, business and other purposes. The usual environment of a person consists of a certain area around his/her place of residence, plus all other places he/she frequently visits.
4.6.2 Definitions used specifically in this release
South African resident refers to either a South African citizen or a non-South African citizen with a South African permanent residence permit.
Foreign traveller refers to a traveller who is not a South African citizen or permanent resident.
Region refers to the following country classification: Overseas: Europe, North America, Central and South America, Australasia, the Middle East, Asia, Africa: SADC, East and Central Africa, West Africa and North Africa.
Country refers to individual countries within a region. The country of residence is used. The country of residence should not be confused with the country from which the visitor travelled.
Africa refers to all the countries in Africa (both mainland and island countries).
SADC refers to the fourteen countries, excluding South Africa, which belongs to the Southern African Development Community.
‘Other’ African refers to all non SADC African countries.
Overseas refers to all countries outside Africa.
Trip refers to the arrival and departure of a visitor in a specified month.
4.7 Symbols used
- = nil
< = less than

Statistics South Africa P0351
Tourism and migration, April 2013
21
5. General information Stats SA publishes approximately 300 different statistical releases each year. It is not economically viable to produce them in more than one of South Africa's eleven official languages. Since the releases are used extensively, not only locally but also by international economic and social-scientific communities, Stats SA releases are published in English.
Stats SA has copyright on this publication. Users may apply the information as they wish, provided that they acknowledge Stats SA as the source of the basic data wherever they process, apply, utilise, publish or distribute the data; and also that they specify that the relevant application and analysis (where applicable) result from their own processing of the data.
Advance release calendar
An advance release calendar is disseminated on www.statssa.gov.za Stats SA products
A complete set of Stats SA publications is available at the Stats SA Library and the following libraries: National Library of South Africa, Pretoria Division National Library of South Africa, Cape Town Division Natal Society Library, Pietermaritzburg Library of Parliament, Cape Town Bloemfontein Public Library Johannesburg Public Library Eastern Cape Library Services, King William’s Town Central Regional Library, Polokwane Central Reference Library, Mbombela Central Reference Collection, Kimberley Central Reference Library, Mafikeng
Stats SA also provides a subscription service.
Electronic services
A large range of data are available via online services, diskette and computer printouts. For more details about our electronic data, contact user information services.
You can visit us on the Internet at: www.statssa.gov.za
Enquiries
Telephone: (012) 310 8600/ 8390/ 8351/ 4892/ 8496/ 8095 (user information services) (012) 310 8692 (technical enquiries) (012) 310 8161 (orders) (012) 310 4883/4885/8018 (library)
Fax: (012) 310 8500/ 8495 (user information services) (012) 310 6937 (technical enquiries)
Email: [email protected] (technical enquiries) [email protected] (user information services) [email protected] (orders)
Postal address: Private Bag X44, Pretoria, 0001
Produced by Stats SA