Embed Size (px)
Citation preview
The University of Melbourne, Australia
School of Behavioural Science
Tough-mindedness and the Enjoyment of Negative Emotions in Music: A Psychophysiological
Investigation
Timothy Colin Bednall 67443
Supervised by
Dr David Rawlings and Dr Nick Allen

The Enjoyment of Negative Emotions in Music Tim Bednall
Declaration
I, Timothy Colin Bednall, declare that the research reported in this thesis was
conducted in accordance with principles for the ethical treatment of human subjects as
approved for this research by The University of Melbourne Human Research
Committee.
Word Count: 9,994
Signed: ________________________ Date: ____/____ /________
i
The Enjoyment of Negative Emotions in Music Tim Bednall
Acknowledgements
Let me begin by saying that there was nothing easy about this project. Bringing
together three divergent area of Psychology, running two pilot studies, performing
hours of data entry, learning how to use the physiological measurement technology,
recruiting and testing forty participants individually, processing the each
physiological variable, analysing copious amounts of data, and writing it all up
coherently – was all very hard work! So to the people I am about to thank, know that
I am extremely grateful for all the help and support you have given me over this year.
My foremost thanks go out to both my supervisors, David Rawlings and Nick
Allen. Both are gentlemen and scholars, whose humour and wisdom are only
exceeded by their patience for this one enthusiastic, and occasionally misguided
Honours student. It has been an honour to work with you both.
I would also like to acknowledge my colleagues in the Affective Neuroscience
Lab – all great people whom I would gladly call friends. In particular, I would like to
thank Chris Benjamin, Jonny Walker and Karmen Jobling for their immeasurable
encouragement and camaraderie over this year – and for helping me to retain some
semblance of a social life! I’d also like to thank Ros Lethbridge for her considerable
assistance (and bravery) in pilot testing my experiment, and for giving me some very
useful tips about how to manage participants. My thanks also go out to Julian ‘Macro
May’ Simmons for all of his technical assistance, and for generally looking out for
yours truly. Finally, a very special thanks goes to visiting professor Edwin Cook, for
lending his considerable expertise to my physiological data collection and analysis.
ii
The Enjoyment of Negative Emotions in Music Tim Bednall
The next person I would like to acknowledge is David’s other supervisee and
my fellow traveller, Mechaela Hill – whose reassurance, humanity and love of ‘Buffy’
and ‘Angel’ have helped to keep me sane over this year. She may score highly on the
P scale, but she’s all right in my book!
I’d also like to thank a heap of my other fourth-year contemporaries: Heidi
Moëschinger, Timothy Gummersall, Georgina Hughes, Karen Wirth, Kate Parsons,
Samantha Hutton, Tom Peachey, Jessica Ross, Freda Zapsalis, Shannon Lacy, Alex
Fornito, Jackie Bornstein, Amanda Smith, Kathryn Allen, Julie Botten, Kate Martin,
and Amanda North – for brightening up my year. It’s been great working alongside
you all!
Many thanks to all of my participants – especially those of you who came in
over the winter break. I hope the whole experience was not too traumatic!
Finally, I would like to acknowledge Mum and Dad for their ever-present love
and support, as well as my good friends Peter-Simon Germain, David Barton, Michael
Stuchbery and Jayson McNaughton. Couldn’t have done it without you.
iii

The Enjoyment of Negative Emotions in Music Tim Bednall
Dedicated to Robin James Bednall
My little brother who has been overseas on a working holiday for the most part of this
year, whose companionship and joie de vie have been sorely missed.
iv
The Enjoyment of Negative Emotions in Music Tim Bednall
Table of Contents
Declaration .....................................................................................................................i
Acknowledgements........................................................................................................ii
List of Tables ...............................................................................................................vii
List of Figures ............................................................................................................viii
List of Appendices ........................................................................................................ix
Introduction...................................................................................................................1
Theoretical framework of emotions and psychophysiology: the present approach ...................................................................................................................2
Music and the enjoyment of negative emotions ....................................................5
Tough-mindedness and musical preference ..........................................................9
The Present Study: Hypotheses ............................................................................14
Methodology ................................................................................................................17
Participants.............................................................................................................17
Stimulus Materials .................................................................................................18 Sounds and Music ................................................................................................18 The Startle Probe..................................................................................................19
Psychological Measurement..................................................................................20
Physiological Measurement and Data Processing...............................................21 Startle Magnitude.................................................................................................21 Heart Rate ............................................................................................................22 Facial Electromyographic (EMG) Activity .........................................................23 Skin Resistance Responses ..................................................................................24
Procedure................................................................................................................26
Data Reduction.......................................................................................................27
Results..........................................................................................................................28
Adequacy Checks ...................................................................................................28
Comparisons Across A Priori Categories and Between P+/- Groups for Sounds..................................................................................................................................28
Self-Report Ratings (Sounds) ..............................................................................31 Physiological Measures (Sounds) ........................................................................33
Comparisons Across A Priori Categories and Between P+/- Groups for Music..................................................................................................................................38
Self-Report Ratings (Music) ................................................................................40 Physiological Measures (Music)..........................................................................44
Comparisons Across Empirical Enjoyment Categories .....................................46
v

The Enjoyment of Negative Emotions in Music Tim Bednall
Comparing the overall tendencies of the P+/- groups to enjoy negative emotion in music (and to dislike emotionally positive music)...........................................49
Discussion....................................................................................................................50
Sounds – Relationships between valence/arousal and physiology.....................50
Music – Relationships between valence, arousal and enjoyment, and physiology ...............................................................................................................52
Tough-mindedness and musical preference ........................................................54
Methodological Considerations ............................................................................55
Conclusions.............................................................................................................58
References ...................................................................................................................59
vi

The Enjoyment of Negative Emotions in Music Tim Bednall
List of Tables
Table 1. - Analysis of variance for self-report and physiological variables in the sound condition, across a priori valence and arousal categories and between the P+/P- groups...................................................................................................................30
Table 2. - Analysis of variance for self-report and physiological variables in the music
condition, across a priori valence and arousal categories and between the P+/P- groups...................................................................................................................39
Table 3. - Analysis of variance for self-report and physiological variables in the music
condition, across empirical enjoyment categories ...............................................46
vii
The Enjoyment of Negative Emotions in Music Tim Bednall
List of Figures
Figure 1. The Self-Assessment Manikin (SAM) scales of valence and arousal ..............20 Figure 2. Facial EMG electrode placement ......................................................................25 Figure 3. Skin Resistance Response Electrode Placement ...............................................25 Figure 4. Mean (untransformed) valence ratings across the arousal a priori valence
categories, ordered by arousal category and P+/- groups. .......................................31 Figure 5. Mean arousal ratings across the arousal a priori valence categories, ordered by
arousal category and P+/- groups. ...........................................................................32 Figure 6. Mean corrugator activity across the arousal a priori valence categories, ordered
by arousal category and P+/- groups. ......................................................................33 Figure 7. Mean (untransformed) zygomatic activity across the arousal a priori valence
categories, ordered by arousal category and P+/- groups. .......................................34 Figure 8. Mean (standardised) startle blink magnitudes across the arousal a priori valence
categories, ordered by arousal category and P+/- groups. .......................................35 Figure 9. Mean heart rate acceleration across the arousal a priori valence categories,
ordered by arousal category and P+/- groups. .........................................................36 Figure 10. Mean skin resistance change across the arousal a priori valence categories,
ordered by arousal category and P+/- groups. .........................................................37 Figure 11. Mean valence ratings across the arousal a priori valence categories, ordered
by arousal category and P+/- groups. ......................................................................40 Figure 12. Mean arousal ratings across the arousal a priori valence categories, ordered by
arousal category and P+/- groups. ...........................................................................41 Figure 13. Mean arousal ratings across the arousal a priori valence categories, ordered by
arousal category and P+/- groups. ...........................................................................42 Figure 14. Mean (standardised) startle magnitudes across the arousal a priori valence
categories, ordered by arousal category and P+/- groups. .......................................44 Figure 15. Mean skin resistance change across the arousal a priori valence categories,
ordered by arousal category and P+/- groups. .........................................................45 Figure 16. Mean valence, arousal and enjoyment self-report ratings across the empirical
enjoyment categories. ..............................................................................................47 Figure 17. Mean (standardised) startle magnitudes across the empirical enjoyment
categories. ................................................................................................................48
viii

The Enjoyment of Negative Emotions in Music Tim Bednall
List of Appendices
Appendix 1 - The Pilot Study ......................................................................................69 Appendix 2 - Instruction Sheet for Participants...........................................................72 Appendix 3 - Debriefing Form ....................................................................................79 Appendix 4 - Mean self-report ratings and physiology difference scores for each a
priori valence/arousal category, in sound and music conditions. ........................81 Appendix 5 - Mean Difference Scores (Self-Report and Physiology) between High-P
and Low-P Participants for Sound Presentations.................................................83 Appendix 6 - Mean self-report and physiology difference scores for music, in
empirical enjoyment categories ...........................................................................85 Appendix 7 - Correlations between reported enjoyment and other self-report ratings
for each a priori music category..........................................................................87
ix
The Enjoyment of Negative Emotions in Music Tim Bednall
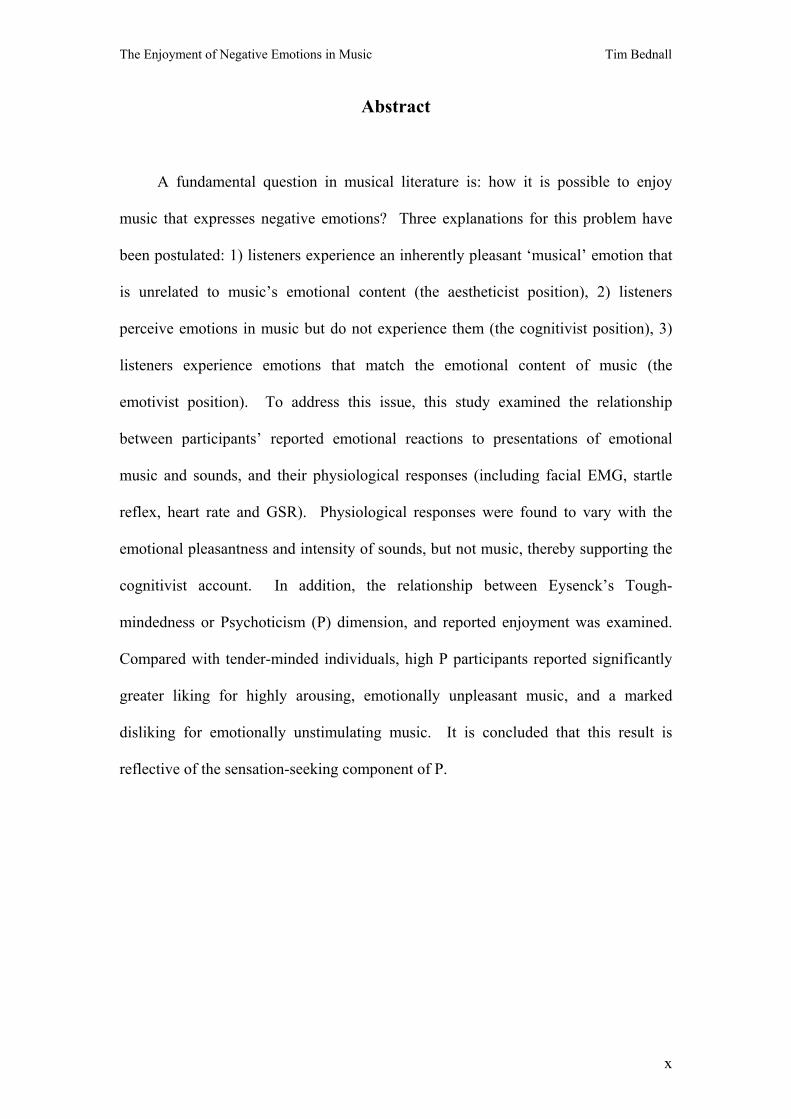
Abstract
A fundamental question in musical literature is: how it is possible to enjoy
music that expresses negative emotions? Three explanations for this problem have
been postulated: 1) listeners experience an inherently pleasant ‘musical’ emotion that
is unrelated to music’s emotional content (the aestheticist position), 2) listeners
perceive emotions in music but do not experience them (the cognitivist position), 3)
listeners experience emotions that match the emotional content of music (the
emotivist position). To address this issue, this study examined the relationship
between participants’ reported emotional reactions to presentations of emotional
music and sounds, and their physiological responses (including facial EMG, startle
reflex, heart rate and GSR). Physiological responses were found to vary with the
emotional pleasantness and intensity of sounds, but not music, thereby supporting the
cognitivist account. In addition, the relationship between Eysenck’s Tough-
mindedness or Psychoticism (P) dimension, and reported enjoyment was examined.
Compared with tender-minded individuals, high P participants reported significantly
greater liking for highly arousing, emotionally unpleasant music, and a marked
disliking for emotionally unstimulating music. It is concluded that this result is
reflective of the sensation-seeking component of P.
x
The Enjoyment of Negative Emotions in Music Tim Bednall
Introduction
It is generally agreed that music has the ability to stimulate listeners’ feelings.
However, the relationship between the recognition of emotion within the structure of
music and the experience of emotion is not straightforward. An apparent paradox
exists, in that music can reflect negative emotions that we would usually be inclined
to avoid in everyday life (such as melancholy, anger, fearfulness, etc.), and yet, in
many instances we can derive much enjoyment from listening to such pieces
(Levinson, 1990).
In addition, numerous studies (e.g. Cattell & Saunders, 1954; Daoussis &
McKelvie, 1986; Rawlings & Ciancarelli, 1997; Wheeler, 1985) have suggested
strong relationships between relatively enduring personality characteristics and
musical preference, as well as the capacity to enjoy certain emotional qualities in
music. For example, Cattell and Saunders found that extraversion was associated
with the enjoyment of musical pieces characterised by a “joyful but agitated mood”.
The personality dimension ‘Tough-mindedness’ has been found to be associated with
a liking for “hard rock” music (Rawlings, Hodge, Sherr & Dempsey, 1995; Robinson,
Weaver & Zillman, 1996), a style that characteristically tends to express negative
emotions and rebellious sentiments.
The present study proposes to address two broad research questions. First, what
is the nature of the emotions experienced when listening to music, such that it is
possible to enjoy the experience of negative emotions in music? Second, how is
Tough-mindedness related to the tendency to enjoy music of negative emotional
content? Both questions are addressed in a design that compares the expected and
1
The Enjoyment of Negative Emotions in Music Tim Bednall
observed relationships between self-reported emotional responses to presentations of
sounds and music, and known physiological correlates of these ratings.
The following sections address the emotional and psychophysiological
theoretical frameworks used in this study, the issue of emotional representation in
music, and the nature of Tough-mindedness. In the final section of the introduction,
specific research hypotheses are outlined relating to the enjoyment of negative
emotions in music, and the potential moderating effect of Tough-mindedness on
response patterns.
Theoretical framework of emotions and psychophysiology: the present approach
Emotions have been conceptualised as states of readiness for adaptive action
(Izard, 1993; Lang, 1979), comprising two oppositional systems: an appetitive system
that promotes approach-based behaviours, and a defensive system associated with
avoidance and protective behaviours (Konorski, 1967; Lang, 1995). According to this
view, emotions are associated with efferent activity in verbal-cognitive, motor and
physiological systems (Lang, 1993, 1994). Rather than being only secondary
reactions to emotional stimulation, such activity is considered to be a constituent
feature of emotional states.
A large body of research has demonstrated that differentiated affective states
and reliable patterns of associated physiological change can be prompted by symbolic
representations of real-life events in a laboratory context, including studies using
emotional pictures (e.g. Greenwald, Cook & Lang, 1989; Hare, Wood, Britain &
Shadman, 1970; Lang, Greenwald, Bradley & Hamm, 1993; Levenston, Patrick,
Bradley & Lang, 2000), film clips (Averill, 1969; Gross & Levenson, 1995;
2

The Enjoyment of Negative Emotions in Music Tim Bednall
Tourangeau & Ellsworth, 1979), and auditory stimuli (Bradley & Lang, 2000a;
Krumhansl, 1997; Witvliet, 1997). In all of these experiments, self-report and
physiological responses have been shown to vary according to the emotional
pleasantness and intensity of the presented stimuli.
As with many of the aforementioned investigations, the current study uses a
dimensional framework of emotions, which defines emotional responses in terms of
two orthogonal scales: valence and arousal. Valence is a pleasantness-unpleasantness
dimension associated with appetitive / defensive response dispositions. Arousal refers
to the intensity of emotional responses, or the degree of activation. Anger and fear,
for example, might be conceptualised as states of low valence (involving defensive
preparation for a confrontation or avoidance), and high arousal. This model has been
promoted by several theorists (e.g. Mehrabian & Russell, 1974; Watson & Tellegen,
1985), and is consistent with the dimensions uncovered by Osgood, Suci and
Tannenbaum’s (1957) influential factor-analytic research into emotional semantics.
A chief benefit of the above framework is that self-reports of valence and
arousal have been shown to be associated with reliable patterns of physiological
change (for a comprehensive overview, see Bradley & Lang, 2000b). It thereby
provides additional (and arguably more objective and direct) indicators of emotional
states. In addition, the dimensional framework allows for the possibility that the
patterns of physiological change for different emotional states might overlap (e.g.
anger and fear), and consequently does not preclude the view that specific emotional
meanings can be inferred from the context in which physiological changes are
experienced, as was suggested by the renowned experiment of Schachter and Singer
(1962).
3
The Enjoyment of Negative Emotions in Music Tim Bednall
In laboratory settings, facial electromyographic (EMG) activity in the
zygomaticus major (zygomatic) and corrugator supercilii (corrugator) muscles has
been demonstrated to covary with the reported valence of pictorial stimuli (Bradley &
Lang, 2000b; Lang et al., 1993). Corrugator muscles are used in the lowering of the
brows, and activity in this region has been shown to increase during presentations of
emotionally unpleasant stimuli. Zygomatic muscles are those used in smiling, and
tend to show greatly increased activity in response to pleasant stimuli, as well as
minor activity during unpleasant stimulation due to facial grimacing.
While these measures have been shown to be reliable indicators of emotional
states, they are subject to intentional facial manipulation on the part of research
participants. An alternate measure of affective valence that overcomes this potential
difficulty is the startle reflex, an involuntary eye-blink response triggered by the
delivery of a sudden, intense acoustic or visual probe. Lang and his colleagues (Lang,
Bradley & Cuthbert, 1990; Vrana, Spence & Lang, 1988) found this response to be
inhibited during presentations of pleasant emotional pictures and potentiated during
unpleasant presentations. These authors conceptualised the blink as a defensive
withdrawal response that was intensified in a synchronous state of defensive readiness
or inhibited in a mismatched state of pleasantness, as prompted by the
negative/positive emotions experienced during affective presentations. There is also
some evidence to suggest that the startle response is modulated by attention. Anthony
and Graham (1985) found that potentiation of the reflex occurred when attentional
resources were directed to the same sensory modality as the startle probe. For
example, if attention were directed to a visual event, a flash probe would produce a
larger response than an acoustic probe.
4
The Enjoyment of Negative Emotions in Music Tim Bednall
Electrodermal activity (i.e. electrical skin conductance) has shown a tendency to
increase with ratings of high emotional arousal, independently of the pleasantness of
the experience (Lang et al, 1993; Greenwald et al., 1989). Heart rate also appears to
be modulated by the level of emotional intensity, as prior studies using mental
imagery tasks have shown that recall of both highly pleasant and unpleasant memories
prompts cardiac acceleration (Vrana, Cuthbert & Lang, 1989). However, in studies
involving the perception of pictorial stimuli, the presentation of unpleasant scenes
caused greater cardiac deceleration than pleasant scenes, suggesting that emotional
valence and/or attentional orientation also influence cardiac activity during perception
(Lang et al. 1993; Bradley, Cuthbert & Lang, 1990; Greenwald et al., 1989).
In order to evaluate the nature of people’s emotional reactions to auditory
stimuli, the current study presented a series of (non-aesthetic) sounds, along with a
series of musical excerpts to research participants, while physiological changes
(including corrugator/zygomatic EMG activity, startle blink magnitudes, heart rate,
and skin conductance) were recorded during these presentations. Participants were
asked to rate each presentation on scales of valence, arousal, familiarity and
enjoyment. These data were used to address the two major goals of the present study,
as outlined in the following sections.
Music and the enjoyment of negative emotions
There has been considerable speculation as to how music possesses the ability to
rouse strong emotions in people. Some have suggested (e.g. Goldman, 1992) that
emotions arise out of a special appreciation for the artistic quality of a musical piece.
Others have focused on how distinctive feelings can be represented by music, and
how musical expression might succeed in rousing strong emotions within listeners.
5
The Enjoyment of Negative Emotions in Music Tim Bednall
Dowling and Harwood (1986), using the classifications of signs devised by the
semiotician Charles Peirce, presented a comprehensive account of three
complementary ways which music could represent emotions. They suggested that
emotions could be represented through associations with extramusical concepts (an
indexical representation), through a formal resemblance to the dynamic and temporal
form of emotions (an iconic representation), and through the syntactic structure of
musical pieces (a symbolic representation). The latter explanation was compatible
with Meyer’s (1956) view of emotional meaning in music – that people create
unconscious expectancies (or schemata) about the progression of musical pieces while
listening to them, and that violations of these expectancies result in physiological
arousal. Drawing on Mandler’s (1984) schema theory, Dowling and Harwood
suggested that an unexpected change in the flow of music would result in such arousal
and, consequently, a cognitive appraisal about the emotional meaning of that
occurrence.
While this account provides a plausible explanation for the various levels of
representation of emotion within the form of music, it does not specify whether there
exists a relationship between the emotional content of music and the types of
emotions actually experienced by musical listeners. Throughout musical and
psychological literature, a substantial number of theorists have addressed this issue,
whose views could be summarised within three basic standpoints: the aestheticist,
cognitivist and emotivist positions.
Aestheticist theorists (Gurney, 1966; Langer, 1942; Bell, 1914) have argued that
music rouses a special ‘aesthetic’ emotion that is invariably pleasurable, which
listeners may associate with memories of non-musical emotions and important life
6
The Enjoyment of Negative Emotions in Music Tim Bednall
episodes. The ‘aesthetic’ emotion was claimed to arise from listeners’ appreciation
for the artistic form of musical expressivity, as opposed to the emotional content of
music. In opposition, cognitivist theorists (Kivy, 1990; Scruton, 1983) have
maintained that emotions are perceived within the structure of music, but not
correspondingly experienced. This account does not reject outright the idea that
music can stimulate feelings, but purports that any emotions experienced are the result
of prior associations, appreciation for the music’s artistry, or psychopathology.
Finally, emotivist theorists (Levinson, 1990; Schubert, 1996) have argued that music
possesses the ability to stimulate genuine emotions in listeners, which mirror the
specific emotions expressed by music.
With regard to the enjoyment of negative emotions in music paradox, both the
aestheticist and cognitivist accounts suggest that the expressive content of music does
not directly elicit correspondingly negative emotions in people. Levinson (1990)
disputed this explanation, and suggested that the appeal of negative emotional content
was associated with cathartic benefits for musical listeners, reasoning that feelings
evoked by music would occur without direct reference to a real-life context, thereby
allowing listeners to savour negative feelings for their own special character.
Schubert (1996) proposed a mechanistic explanation for this process, using an
associative (neural) network model. He suggested that displeasure centres within this
network became inhibited in an aesthetic context, enabling negative emotional
stimulation to be experienced pleasurably.
A recent study that attempted to substantiate either the cognitivist or the
emotivist account was Krumhansl’s (1997) investigation, which examined music
students’ psychophysiological reactions to music of varying emotional content.
7
The Enjoyment of Negative Emotions in Music Tim Bednall
Participants were asked to listen to several musical excerpts with different emotional
content (sadness, fearfulness and happiness), while physiological responses were
recorded. The study revealed distinctive patterns of physiological activity for each
type of excerpt, suggesting that the listeners experienced emotional states that
corresponded with the emotional content of each piece, and therefore supported the
emotivist account.
However, an inherent limitation of Krumhansl’s approach was its reliance on a
rigid categorisation of emotional states, and consequently, its implicit assumption
about the existence of emotion-specific patterns of physiological arousal. This is
problematic because, while some (non-musical) studies have identified physiological
correlates of specific emotional states (e.g. Ekman, Levenson & Friesen, 1983;
Stemmler, 1989), the patterns of ensuing arousal have been shown to be largely
dependent on the particular methods used to elicit emotions in each study (Cacioppo,
Klein, Berntson & Hatfield, 1993). Indeed, Krumhansl’s measurements showed only
moderate consistency with the physiological patterns found in the aforementioned
studies, implying that ‘musical’ emotions are distinct from experientially similar
feelings that occur in non-musical contexts.
An alternate approach was taken by Witvliet’s (1997) study of music-prompted
physiological effects (including facial EMG, the startle blink, heart rate and skin
conductance), which utilised the valence / arousal dimensional framework. Witvliet’s
investigation revealed that the physiological changes elicited by listening to
emotionally charged music corresponded with listeners’ ratings of valence and
arousal, which were found to be consistent with changes observed in previous studies
(e.g. Lang et al., 1993). The one exception was the startle reflex magnitude, which
8

The Enjoyment of Negative Emotions in Music Tim Bednall
was found to be negatively associated with reported arousal – in contrast to other
studies that have suggested the response is potentiated by low valence (i.e. negative)
stimuli. Again, the results of this study appeared to support the emotivist account, as
the subjects’ valence and arousal self-reports corresponded with the emotions
expressed in the musical presentations, which in turn were reflected in the subjects’
physiological responses. Notably, Witvliet also observed that people generally
reported greater liking for the high valence presentations, but failed to distinguish
whether physiological responses were influenced by valence or enjoyment alone.
The first goal of the present study was to extend the research of Krumhansl and
Witvliet by investigating directly the issue of which account (aestheticist, cognitivist
or emotivist) best explained the enjoyment of negative emotions in music paradox.
To address this question, the relationships between participants’ physiological
responses to music and their self-report ratings (of valence, arousal and enjoyment)
were examined. In addition, the present study extended the aforementioned research
by including a much wider range of musical styles.
Tough-mindedness and musical preference
The second goal of the experiment was to investigate the potential moderating
effect of the personality characteristic ‘Tough-mindedness’ on the tendency of people
to enjoy music of varying emotional content. Tough-mindedness, which is also called
Psychoticism (P), is the third dimension of the personality framework of H. J.
Eysenck, along with the dimensions of Extraversion (E) and Neuroticism (N).
The P dimension was originally conceptualised by Eysenck (Eysenck &
Eysenck, 1976) as a measure reflecting a predisposition to psychotic disorders,
9
The Enjoyment of Negative Emotions in Music Tim Bednall
including schizophrenia and bipolar disorder. Since its emergence as a questionnaire
in 1975, the P scale has been criticised by numerous authors, most notably for its
apparent inability to differentiate psychotic and non-psychotic populations, and its
questionable face validity (Bishop, 1977; Block, 1977a,b; Claridge, 1981). For
example, Block (1977a) suggested that the P scale might actually be more indicative
of aggressive, impulsive and antisocial characteristics than underlying psychotic
tendencies. Some have also argued that P should be split across two or more basic
factors. In particular, Costa and McCrae’s “Big 5” model of personality has posed a
significant challenge to Eysenck’s framework, with these authors suggesting that P
might be better represented by two factors from their model (Agreeableness and
Conscientiousness), following their discovery of strong negative correlations between
P and these dimensions (Costa & McCrae, 1985).
In response to the first of the above criticisms, Eysenck (1977, 1992a) argued
that the tendency of psychiatric groups to show elevated ‘Lie’ (L) scale scores was
indicative of distortion in the P scores of this population, and re-emphasised that the P
scale was designed to measure psychotic tendencies in a “normal” (non-clinical)
population. In reply to Costa and McCrae, Eysenck (1992b) pointed to several meta-
analyses of personality factorial studies (e.g. Tellegen and Waller, 1991) that
suggested three personality domains at the highest level, and criticised the “Big 5”
model for its lack of theoretical and biological foundations. He also drew attention to
the numerous intercorrelations between the “Big 5” dimensions, and suggested that
Agreeableness and Conscientiousness were actually sub-factors that formed part of
the higher-order construct of Psychoticism. Eysenck (1992b) argued that the
construct validity of the P-scale was supported by a number of experimental and real-
life phenomena that differentiate psychotics and normals, as well as high and low P
10
The Enjoyment of Negative Emotions in Music Tim Bednall
scorers – including hormonal-biochemical levels, responses to conditioning tasks,
performance on various psychological tasks and questionnaires, and physiological
functioning.
Of particular relevance to the present study is the apparent resilience of high P
scorers to emotional stressors. There is considerable evidence to suggest that high P
individuals show less emotional disturbance in stressful situations, as reflected by
attenuated physiological responses. Breivik, Roth and Jørgsen (1998) found that P
was negatively correlated with heart rate increase before parachuting from a plane. In
another physiological study, Stelmack, Plouffe and Falkenberg (1983) evidenced a
significantly lesser increase of skin-conductance in high-P participants, in response to
emotionally stimulating pictures. Robinson and Zahn (1985) also revealed a tendency
of high P scorers to show less autonomic responsivity (using heart rate and skin
conductance measures) to two-flash threshold response tasks performed in standing
and reclining positions.
With respect to this apparent resilience, a number of researchers (e.g. Eysenck
& Eysenck, 1976; Robinson & Zahn, 1985) have suggested that P might represent a
lesser form of psychopathy, as well as underlying psychotic behaviour. An absence of
exhibited fearfulness has traditionally been viewed as a key characteristic of
psychopathy (Fowles, 1980; Hare, 1970; Lykken, 1957). Recently, the tendencies of
psychopaths to show blunted emotional and physiological responses to affective
stimuli have come under investigation. Patrick, Bradley and Lang (1993) examined
the startle reflex responses of sexual offenders to pictorial stimuli. They found that
inmates with high psychopathy showed less potentiation of the reflex to unpleasant
pictures, compared with non-psychopaths. This finding has since been replicated
11
The Enjoyment of Negative Emotions in Music Tim Bednall
using a general prison population (Levenston et al., 2000). The authors of both
studies suggested that this inhibition was indicative of a heightened threshold for
aversive stimuli in psychopaths, and a possible deficiency in emotional processing.
Another personality characteristic theorised to be linked closely with P is
sensation-seeking (SS) (Zuckerman, 1979, 1994), a characteristic reflecting
tendencies to pursue novel and intense sensory stimulation. According to Zuckerman
(1994), underlying biological mechanisms account for individual differences in SS,
with high sensation-seekers motivated to maintain an optimum level of arousal of the
catecholamine systems (which are believed to be associated with positive rewards at
low levels, and anxiety at high levels). An exploratory study by Eysenck and
Zuckerman (1978) suggested that SS was positively correlated with both
Psychoticism and Extraversion, as measured by the Eysenck Personality
Questionnaire (Eysenck & Eysenck, 1975).
More recently, Glicksohn and Abulafia (1998) examined the relationship
between SS and the Eysenck personality dimensions in a combined factor analysis.
The analysis revealed that P and three of the four subcomponents of SS (Excitement-
Seeking, Disinhibition and Boredom Susceptibility) formed a single higher order
factor. The authors identified this as ‘Impulsive Unsocialized Sensation Seeking’, a
personality dimension originally conceptualised by Zuckerman (1992) as
encompassing both P and SS. This emergent factor appeared to be distinct from
Extraversion, supporting Zuckerman’s contention that SS and P were inherently
related.
The construct of sensation-seeking has been used in empirical studies of
aesthetic preference more than any other measure. High SS individuals have been
12

The Enjoyment of Negative Emotions in Music Tim Bednall
observed to exhibit preferences for highly complex and arousing art forms, including
tension-evoking paintings (Zuckerman, Ulrich & McLaughlin, 1993), complex
polygons (Looft & Baranowski, 1971; Rawlings, Twomey, Burns & Morris, 1998),
and hard-rock music (Litle & Zuckerman, 1986; Rawlings, Barrantes i Vidal &
Furnham, 2000; Rawlings et al., 1998).
Similarly, several sources of evidence have pointed to a relationship between
Tough-mindedness and a preference for hard-rock music, as well as a strong dislike
for “soft” popular music. Rawlings et al. (1995) found a correlation between P and
liking of hard-rock/heavy metal musical excerpts, and a strong negative correlation
between P and easy listening music. The study also revealed that high-P scorers
tended to show a preference for dissonant (augmented, atonal and diminished) chords.
Robinson, Weaver and Zillmann (1996) evidenced a strong relationship between the
enjoyment of hard/rebellious rock-music video clips and P. Finally, McCown, Keiser,
Mulhearn and Williamson (1997) found that P was associated with a preference for
enhanced bass.
Hard-rock music possesses three distinctive qualities that are likely to be
associated with its appeal to tough-minded people. First, themes of rebelliousness and
defiance of authority are common within this style of music (Robinson et al., 1996).
Because P is partly characterised by lack of socialisation and disrespect for authority
figures (Eysenck & Eysenck, 1976), it follows that such music would likely hold
personal relevance and appeal to high P individuals. Second, hard-rock music often
expresses negative emotions (e.g. despondency, hopelessness, and aggression) that
many musical listeners would find inherently unpleasant. However, given that highly
tough-minded people tend to be resilient to emotional stressors, it is plausible that
13

The Enjoyment of Negative Emotions in Music Tim Bednall
they would have a greater capacity than most people to derive pleasure from this style
of music. Finally, hard-rock music is characteristically arousing to the senses,
because of its dissonance, volume and power. Since P is strongly associated with
sensation-seeking, it is probable that the intense quality of hard-rock would be a major
attraction for the highly tough-minded.
This line of reasoning gives rise to two pertinent questions. First, is the appeal
of hard-rock music to high P scorers due to a general preference for the style, or is it
related to the emotional content of this type of music? Second, compared to low-P
individuals, would highly tough-minded people show a greater liking for other music
styles that were similarly arousing and emotionally unpleasant? This study addresses
these questions by comparing the self-report ratings and physiological responses
between highly tough-minded (P+) and tender-minded (P-) participant groups for the
sound and music presentations. In order to determine the effect of emotional content
on the enjoyment of music for each participant group, comparisons were made
between the groups for presentations belonging to pre-defined valence × arousal
categories.
The Present Study: Hypotheses
It was expected that the valence and arousal ratings would be congruent with the
specific categories to which we had assigned each sound and music stimulus.
Physiological changes that resulted from the non-aesthetic sound presentations were
also expected to be consistent with changes observed in previous psychophysiological
studies (e.g. Bradley & Lang, 2000a). Specifically, it was hypothesised that: 1)
corrugator activity would increase during unpleasant presentations, 2) zygomatic
14
The Enjoyment of Negative Emotions in Music Tim Bednall
activity would increase for pleasant stimuli, 3) startle blink magnitudes would be
potentiated by unpleasant stimuli and inhibited by pleasant stimuli, 4) greater cardiac
deceleration would occur for unpleasant stimuli, and 5) skin resistance would
decrease during highly arousing presentations.
With regard to the enjoyment of negative emotions in music paradox, specific
hypotheses were formulated for each of the emotivist, aestheticist, and cognitivist
accounts. First, the emotivist account purports that emotions experienced while
listening to music are the same as everyday emotions. Hence, this standpoint predicts
that the relationships between physiological changes and ratings of valence and
arousal will be the same as those observed in other studies using non-aesthetic stimuli
(as well as the sound samples used in this study). Second, the aestheticist standpoint
argues that ‘musical emotions’ are inherently positive, and related to people’s
appreciation (or liking) for musical pieces. Thus, this account predicts that
physiological patterns indicative of positive emotions (i.e. zygomatic EMG activity,
corrugator EMG inactivity and startle blink inhibition) will be associated with rated
enjoyment, and not rated valence. Finally, the (pure) cognitivist account claims that
the emotional content of music alone does not stimulate genuine emotions in listeners.
Consequently, this account predicts no reliable changes in the physiological responses
from baseline levels during presentations of music, based on affective self-reports.
However, the more general cognitivist account predicts a possible association between
liking and physiology (following a cognitive appraisal of the music’s artistry). Hence,
the range of physiological responses predicted by the aestheticist standpoint actually
represents a subset of the patterns of responses predicted by the cognitivist account.
15
The Enjoyment of Negative Emotions in Music Tim Bednall
In relation to the influence of Tough-mindedness on musical preference, it was
predicted that the P+ group would report greater enjoyment than the P- group for the
musical stimuli designated to the low valence categories, due to the association
between P and emotional resilience. In particular, it was expected that the P+ group
would report substantially greater enjoyment for music belonging to the low valence-
high arousal category, since hard-rock music is associated with this region of affective
space. It was also expected that the P+ group would show less cardiac acceleration,
startle magnitudes and GSR activity, in response to both highly stimulating and
unpleasant stimuli. Owing to the relationship between P and sensation-seeking, it was
predicted that the P+ group would report greater enjoyment than the P- group for
highly arousing presentations, and the opposite for stimuli belonging to the low
arousal category.
Finally, since highly tough-minded people tend to show a greater appreciation
for emotionally negative music styles (such as hard rock) and less enjoyment for some
forms of emotionally positive styles (such as easy listening), it was expected that the
P+ group’s enjoyment ratings for each musical stimulus would show greater
divergence from their valence ratings, compared to the P- group.
16
The Enjoyment of Negative Emotions in Music Tim Bednall
Methodology
Participants
Participants were 40 first-year Psychology students from the University of
Melbourne, who took part in this experiment as part of a research participation course
requirement. They were selected from a pool of volunteers (N = 322) who had
participated in a personality screening-project earlier in the year. Based on their P-
scale scores in the Eysenck Personality Questionnaire-Revised (EPQ-R; Eysenck,
Eysenck & Barrett, 1985), the volunteers were contacted by e-mail and telephone and
invited to participate in the present study. The 20 highest and lowest scorers who
accepted this invitation were recruited.
The mean P scores for the high (P+) and low (P-) groups were 12.2 and 1.3
respectively, with standard deviations 2.02 and .98. The P scores ranged from 0 to 3
in the P- group, and from 11 to 20 in the P+ group. The maximum P scores for the P-
group and minimum for the P+ group corresponded to the 26.7 and 93.3 percentiles of
the screening sample respectively, and were 0.89 and 1.45 standard deviations from
the screening sample mean (X = 6.04, s = 3.42). Ages ranged from 18 to 32 years,
with group means of 19.65 (P-) and 19.45 (P+). Groups did not differ in racial
composition (the P+ group included 15 Caucasians and 5 Asians, and the P- group
included 14 Caucasians and 6 Asians).
Due to the constraints of the selection process and the greater proportion of
females in the screening project, it was unfortunately not possible to provide a gender
17

The Enjoyment of Negative Emotions in Music Tim Bednall
balance within and between the groups. Three of the forty chosen participants were
male, and these belonged to the high P group.
Stimulus Materials
Sounds and Music
A series of 18 (non-aesthetic) sounds and 18 musical excerpts were used in this
experiment. For both the sound/musical categories, the presentations had been chosen
to represent three levels of valence (six pleasant, six neutral, and six unpleasant) and
two levels of arousal (nine high arousal, nine low arousal). The excerpts had been
selected from an earlier pre-testing process, in which ten colleagues of the author had
rated 100 sound and musical clips on the valence and arousal dimensions. Details
about the pilot study and the presentations are presented in Appendix 1.
The sound samples were obtained from Bradley and Lang’s (1999) IADS
(International Affective Digitized Sounds) CD-ROM of auditory stimuli and from the
Internet site WAVcentral.com. The musical excerpts from the Internet site MP3.com
as well as the author’s own CD collection. The excerpts were chosen to represent a
wide variety of musical styles, with the majority being lesser-known pieces in order to
minimise the possibility of effects related to prior associations. In order to provide a
broad musical variety, approximately half of the half of the music presentations in
each category contained vocals (see Appendix 1).
Each excerpt was edited digitally to a 11.5 second presentation, which involved
the looping of the sound samples. This particular length was chosen partly because of
technological limitations in the software package used to present the stimuli, but also
because previous physiological studies using auditory stimuli (e.g. Bradley & Lang,
18
The Enjoyment of Negative Emotions in Music Tim Bednall
2000a) have tended to use presentations under ten seconds to considerable success.
The average peak volumes of the sound and music presentations were 89.25dB (SD =
3.42) and 91.47dB (SD = 6.83), respectively. The volumes varied with respect to the
sounds’ natural volumes in the environment (e.g. the sound of a jet was louder than
singing birds), and the style of music (e.g. hard rock was louder than easy listening).
The presentations were converted to 16-bit monophonic .WAV files, at 22500 Hz.
The stimuli were presented using Pioneer SE 4000 stereo headphones attached
to the speaker (SPK) output of a Sound Blaster AWE64 (Value Edition) sound card,
in an IBM-compatible computer. The sequence and timing of the presentations were
controlled by the software package Virtual Psychophysiology Monitor Program
(VPM; Cook, 2000). Before the experiment, two random sequences of stimuli were
generated to minimise the possible impact of order effects. Half of the participants in
each P group listened to the presentations in one order, while the rest were exposed to
the alternate sequence.
The Startle Probe
The startle probe consisted of a 50msec burst of 108.2dB white noise with
immediate rise time, which was presented binaurally through headphones at 3.0, 5.5,
8.0, or 10.5 seconds after stimulus onset, for all presentations. The probe was also
presented after a third of the stimuli, following delays of 3, 4, 5, 6, or 7 seconds. The
delays corresponded to the sequences generated before the experiment, and were
identical for participants using the same sequence.
19
The Enjoyment of Negative Emotions in Music Tim Bednall
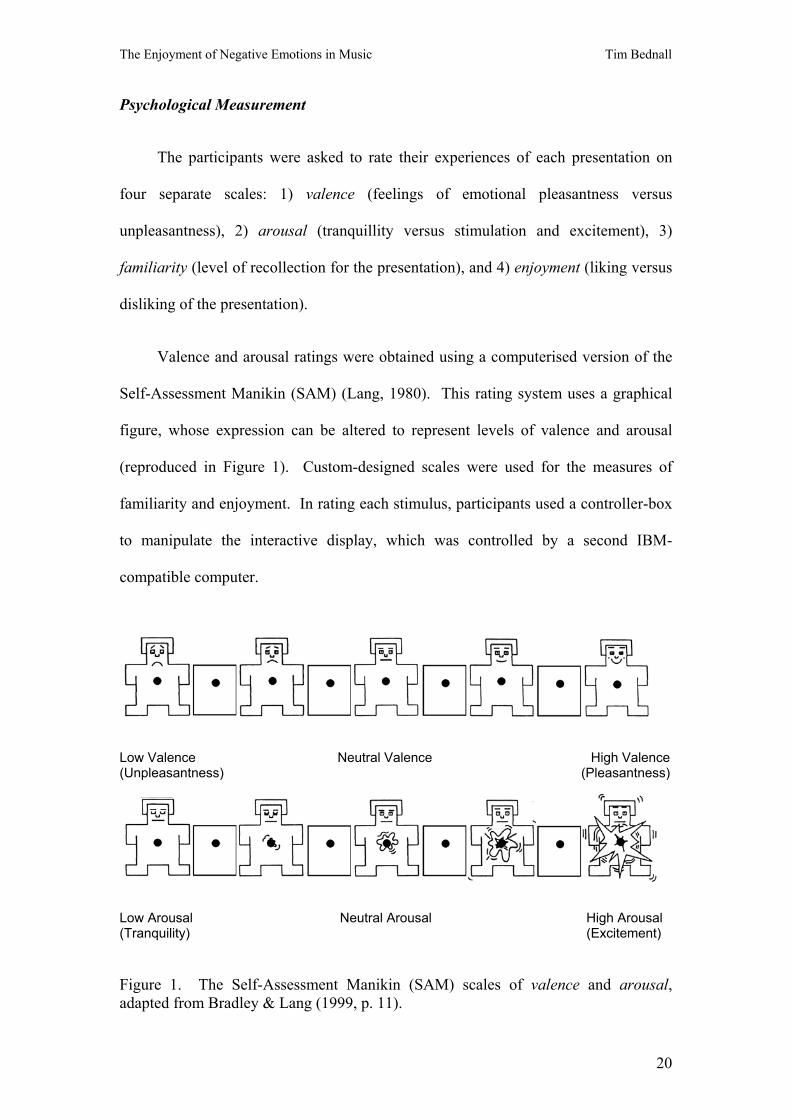
Psychological Measurement
The participants were asked to rate their experiences of each presentation on
four separate scales: 1) valence (feelings of emotional pleasantness versus
unpleasantness), 2) arousal (tranquillity versus stimulation and excitement), 3)
familiarity (level of recollection for the presentation), and 4) enjoyment (liking versus
disliking of the presentation).
Valence and arousal ratings were obtained using a computerised version of the
Self-Assessment Manikin (SAM) (Lang, 1980). This rating system uses a graphical
figure, whose expression can be altered to represent levels of valence and arousal
(reproduced in Figure 1). Custom-designed scales were used for the measures of
familiarity and enjoyment. In rating each stimulus, participants used a controller-box
to manipulate the interactive display, which was controlled by a second IBM-
compatible computer.
Low Valence Neutral Valence High Valence (Unpleasantness) (Pleasantness)
Low Arousal Neutral Arousal High Arousal (Tranquility) (Excitement)
Figure 1. The Self-Assessment Manikin (SAM) scales of valence and arousal, adapted from Bradley & Lang (1999, p. 11).
20
The Enjoyment of Negative Emotions in Music Tim Bednall
Physiological Measurement and Data Processing
For each participant, five physiological measures associated with emotional
responses were taken: startle reflex modulation, facial electromyographic (EMG)
activity (in the zygomatic and corrugator muscle groups), galvanic skin response
(GSR), and heart rate.
Physiological signals were recorded using Grass bioelectric recording
equipment linked to an IBM compatible microcomputer via a PC-Labcard 812-PG
analog-to-digital converter. The VPM software package (Cook, 2000) controlled the
timing and presentation of the stimuli, and the collection and storage of the
physiological and self-report data. For each trial, physiological signals were recorded
over a 23.5 second period (including a 2s baseline interval, the 11.5s presentation, and
a 10s post-stimulus interval). The physiological signals were processed and analysed
following the experiment.
Startle Magnitude
The eye blink component of the startle response was recorded unilaterally by
measuring the EMG activity from the obicularis oculi muscle beneath each
participant’s right eye. A pair of electrodes was placed below the eye, in the positions
specified by Cacioppo and Tassinary (1990) (see Figure 2). The raw EMG signals
from the obicularis oculi muscle were amplified and filtered (half amp. high and low
frequency cutoffs were 10kHz and 10Hz respectively) using a Grass 7P511 amplifier.
Blink responses were sampled at 1,000Hz.
The digitized raw EMG from the startle blink was integrated (i.e., full-wave
rectified and low pass filtered with a time constant of 50ms) offline. Startle responses
21
The Enjoyment of Negative Emotions in Music Tim Bednall
were scored with the VPM software package (Cook, 2000), using the algorithm of
Balaban, Losito, Simons and Graham (1986). Blink magnitudes were scored as the
distances between the peak and baseline activity levels. Startle probes were presented
during all of the trials, and in the interval following one third of the presentations to
obtain a baseline measure. Mean baseline magnitudes were calculated separately for
the sounds and music items.
The raw blink scores were standardised within each participant to decrease
variability due to differences in the absolute size of the startle blinks across all
participants. This was done separately for the sound and music items. Ratio scores
(i.e. the in-trial magnitudes divided by the mean baseline magnitudes) were used in
the between-groups analyses. Startle data from four participants, as well as a
proportion of the data from another two (only in the music condition), were discarded
because of equipment failure.
Heart Rate
Heart rate was measured by placing electrodes on the upper forearms of both
arms, with the ground electrode on the “non-dominant” foreleg. The signal was
amplified by a Grass 7P511 AC amplifier with the “half amp low frequency” filter set
to 100Hz and the “half amp high frequency” filter set to 1kHz, and sensitivity set at
7.5 µV/mm. This signal was sampled at 1,000Hz, and was applied to a Schmitt
trigger, a device that detects the R component of the cardiac waveform, and produces
a TTL level pulse which interrupts the computer program on each heart beat with a
resolution of 1 millisecond.
The beat data were filtered using a VPM editing tool designed to detect
improbable beat intervals. Following this procedure, cardiac inter-beat intervals were
22
The Enjoyment of Negative Emotions in Music Tim Bednall
converted into a beats-per-minute format in half-second epochs, weighting each
interval by the fraction of the epoch time that it occupied. From the interval data,
mean baseline and in-trial beat-rate scores were calculated, which were used in the
later analyses. One participant’s heart rate data was excluded from the analysis, due
to excessive noise within the signal.
Facial Electromyographic (EMG) Activity
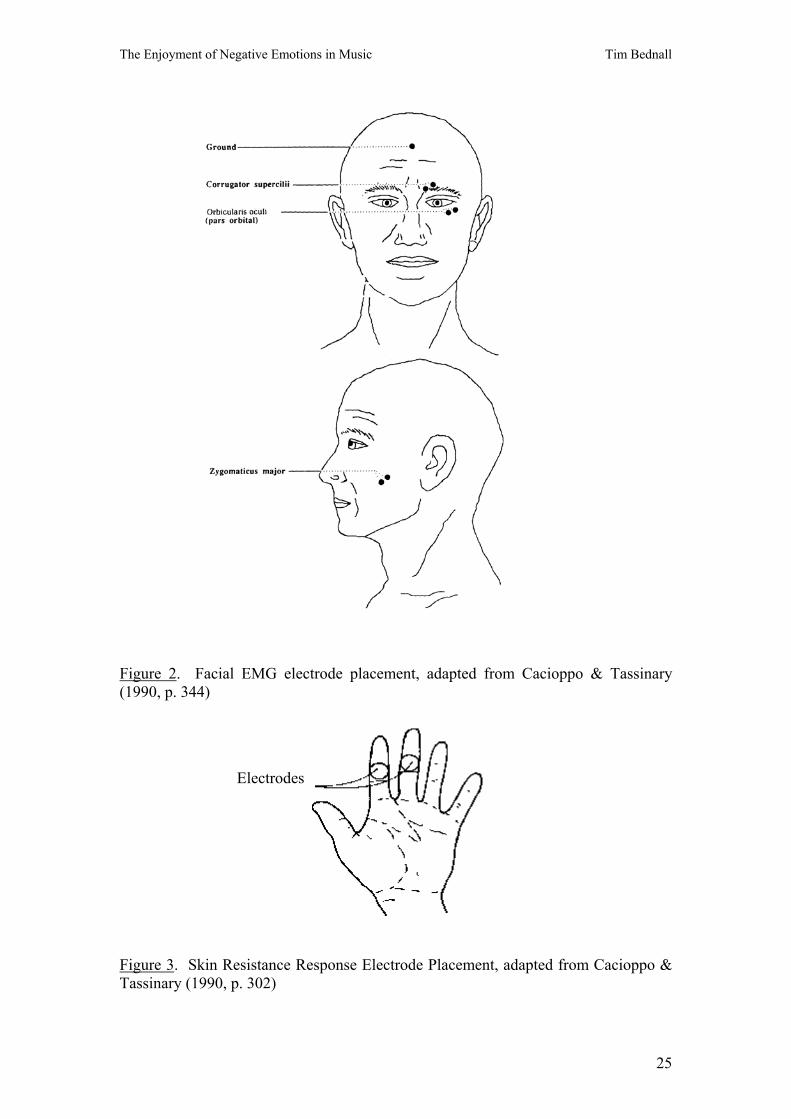
Facial muscle activity was measured by placing electrodes over the corrugator
supercilli (corrugator) and zygomatic major (zygomatic) muscles in the positions
specified by Cacioppo and Tassinary (1990) (see Figure 2). The signals were
amplified and filtered as described above for the startle response, except that facial
EMG signals were recorded for the entire duration of each sound and music
presentation.
In the analyses, facial muscle activity was represented by the average integrated
activity (i.e., full-wave rectified and low pass filtered with a time constant of
500msec) from each site over the duration of the sound/music presentations, after
subtraction of the mean activity for the 2-second pre-stimulus (baseline) period.
Because a startle probe was presented in every trial, we considered it acceptable to use
the EMG data recorded over the entire duration of the presentations in the analyses,
rather than a subset of this data. We also theorised that music might take longer than
sounds to induce an emotional reaction, so we opted to use data recorded over the
entire presentation.
23

The Enjoyment of Negative Emotions in Music Tim Bednall
Skin Resistance Responses
Skin resistance was recorded by two Ag/AgCl electrodes, placed on the thenar
and hypothenar eminences of the non-dominant hand, and connected to a Grass 7P122
DC amplifier. See Figure 3 for skin resistance response electrode placement. Mean
baseline (pre-stimulus) and in-trial skin resistance levels were extracted from the GSR
data, following the experiment. The baseline measures were subtracted from the in-
trial measures to obtain change scores, which were later used in the statistical
analyses. Since this measure reflects changes to electrical resistance, negative scores
represented an increase in skin conductivity due to greater sweatiness, and hence, an
increase in autonomic arousal.
24
The Enjoyment of Negative Emotions in Music Tim Bednall
Figure 2. Facial EMG electrode placement, adapted from Cacioppo & Tassinary (1990, p. 344)
Electrodes
Figure 3. Skin Resistance Response Electrode Placement, adapted from Cacioppo & Tassinary (1990, p. 302)
25

The Enjoyment of Negative Emotions in Music Tim Bednall
Procedure
After signing the consent form, each participant was taken into a well-lit,
isolated room containing the physiological apparatus. They were seated in a
comfortable chair, in front of a television displaying the interactive rating interface.
The participants were informed that they would be listening to a series of sound
and music presentations, and that they would be asked to rate each on the scales of
valence, arousal, familiarity and enjoyment. Each of the scales was explained in
detail (see Appendix 2 for the instruction sheet), and the participants were instructed
how to use the computerised rating system. In particular, it was emphasised that the
valence and arousal ratings were supposed to reflect how the presentations made them
feel, not whether the excerpts contained these qualities. A clear distinction was also
drawn between the valence and enjoyment scales. Participants were given explicit
instructions to use the valence scale to reflect the degree to which they felt positive or
negative emotions after listening to each presentation, and the enjoyment scale to
indicate how much they liked or disliked each piece.
The electrodes were then attached to each participant in their appropriate
positions, and headphones placed on their ears. Following this process, they were
given four example presentations (two sound, two music) to reinforce their memories
of the rating instructions and to habituate them to the startle probe.
When the experimenter was satisfied that the participants understood the
instructions, the sounds and then musical excerpts were presented over the
headphones in one of the two pre-generated order sequences. During each
presentation, the physiological measurements were recorded from the participants. At
26

The Enjoyment of Negative Emotions in Music Tim Bednall
the end of each presentation, participants rated that excerpt using the five self-report
scales before the commencement of the next trial.
Following the completion of the experiment, the participants were unhooked
from the electrodes, debriefed (see Appendix 3 for the debriefing form), given their
course credit, and thanked.
Data Reduction
As stated previously, each sound and musical stimulus was assigned to one of
six a priori categories, according to how participants in the pre-testing study had rated
it. The categories comprised three valence levels (low / neutral / high) by two arousal
levels (low / high). Within these categories, mean self-report ratings and physiological
changes were calculated for each participant. This was done separately for the sounds
and music.
In a second part of the analysis, the musical presentations were assigned to three
empirical enjoyment categories (low, medium and high), based on their mean
enjoyment ratings across participants. This was done to examine the relationship
between the enjoyment self-report rating and the associated physiological responses
of each participant, and consequently to address the hypotheses relating to the
enjoyment of negative emotions paradox.
Finally, to determine the correspondence between the valence and enjoyment
ratings, absolute differences were calculated between these ratings for every musical
excerpt. A total was calculated for each participant, which was intended to reflect that
participant’s overall disparity between emotional pleasantness and enjoyment.
27
The Enjoyment of Negative Emotions in Music Tim Bednall
Results
Adequacy Checks
Before any analyses were conducted, the self-report and physiological data were
checked for departures from normality, using one-sample Kolmogorov-Smirnov tests
and normal probability plots. Transformations were made where deemed necessary,
and are detailed before each analysis. Statistics depicted in graphs are based on the
untransformed data.
All repeated-measures analyses were tested for violations of sphericity. When a
violation occurred, the Greenhouse-Geisser Epsilon (ε) value was used to adjust the
degrees of freedom. In such instances, ε is reported with the original degrees of
freedom.
In all analyses, an alpha level of .05 was used in determining significance.
Values of p less than .10 were classified as non-significant trends.
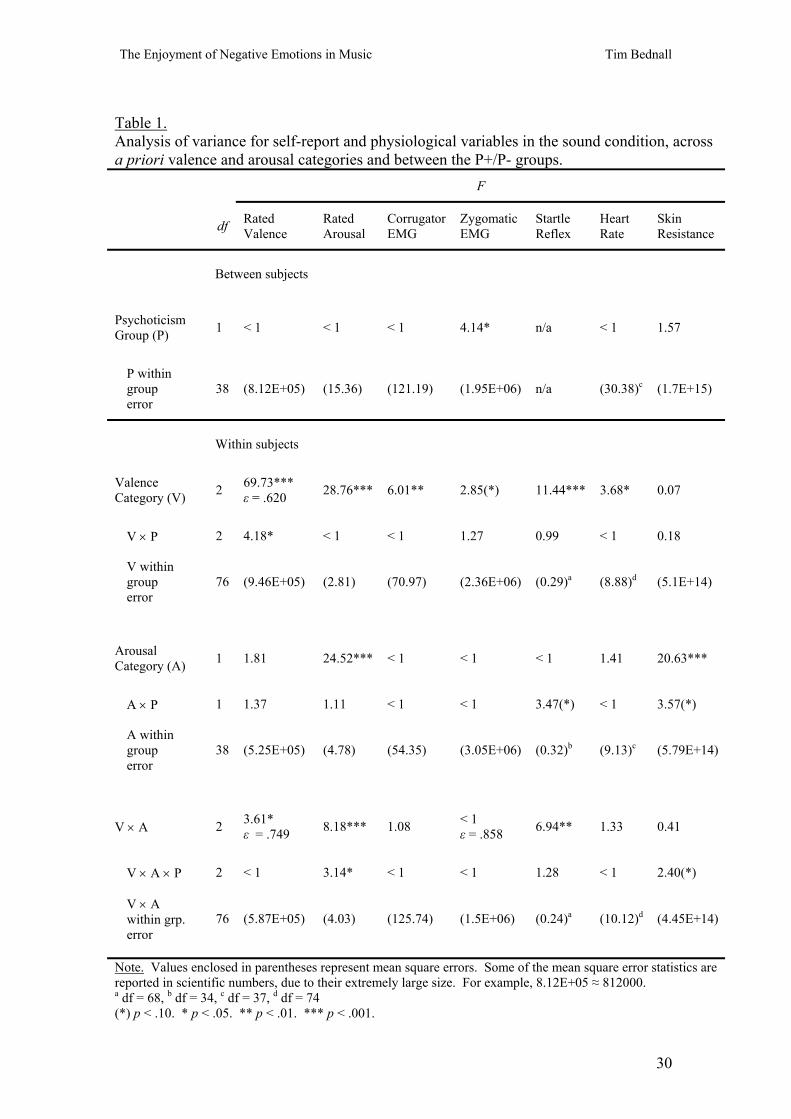
Comparisons Across A Priori Categories and Between P+/- Groups for Sounds
To assess the correspondences between the a priori categories and the self-
report / physiological measures, each variable was compared across the categories
using a series of 3 (valence) × 2 (arousal) repeated-measures analyses of variance
(ANOVA), with P as a between-groups factor. Independent-samples t-tests were used
to make direct comparisons between the P+/- groups within each a priori category,
where relevant to the research hypotheses (i.e. for the startle, heart rate and skin
resistance data).
28

The Enjoyment of Negative Emotions in Music Tim Bednall
The outcomes of each ANOVA are presented in Table 1. Figures 4 through 10
illustrate the relationships found in Table 1, as well as the between-group differences
within each a priori category. The category means for each variable are tabled in
Appendix 4, and the P+/- comparisons in Appendix 5.
29
The Enjoyment of Negative Emotions in Music Tim Bednall
Table 1. Analysis of variance for self-report and physiological variables in the sound condition, across a priori valence and arousal categories and between the P+/P- groups.
F
df Rated Valence
Rated Arousal
Corrugator EMG
Zygomatic EMG
Startle Reflex
Heart Rate
Skin Resistance
Between subjects
Psychoticism Group (P)
1 < 1 < 1 < 1 4.14* n/a < 1 1.57
P within group error
38 (8.12E+05) (15.36) (121.19) (1.95E+06) n/a (30.38)c (1.7E+15)
Within subjects
Valence Category (V)
2 69.73*** ε = .620 28.76*** 6.01** 2.85(*) 11.44*** 3.68* 0.07
V × P
2 4.18* < 1 < 1 1.27 0.99 < 1 0.18
V within group error
76 (9.46E+05) (2.81) (70.97) (2.36E+06) (0.29)a (8.88)d (5.1E+14)
Arousal Category (A)
1 1.81 24.52*** < 1 < 1 < 1 1.41 20.63***
A × P
1 1.37 1.11 < 1 < 1 3.47(*) < 1 3.57(*)
A within group error
38 (5.25E+05) (4.78) (54.35) (3.05E+06) (0.32)b (9.13)c (5.79E+14)
V × A
2 3.61* ε = .749 8.18*** 1.08 < 1
ε = .858 6.94** 1.33 0.41
V × A × P
2 < 1 3.14* < 1 < 1 1.28 < 1 2.40(*)
V × A within grp. error
76 (5.87E+05) (4.03) (125.74) (1.5E+06) (0.24)a (10.12)d (4.45E+14)
Note. Values enclosed in parentheses represent mean square errors. Some of the mean square error statistics are reported in scientific numbers, due to their extremely large size. For example, 8.12E+05 ≈ 812000. a df = 68, b df = 34, c df = 37, d df = 74 (*) p < .10. * p < .05. ** p < .01. *** p < .001.
30
The Enjoyment of Negative Emotions in Music Tim Bednall
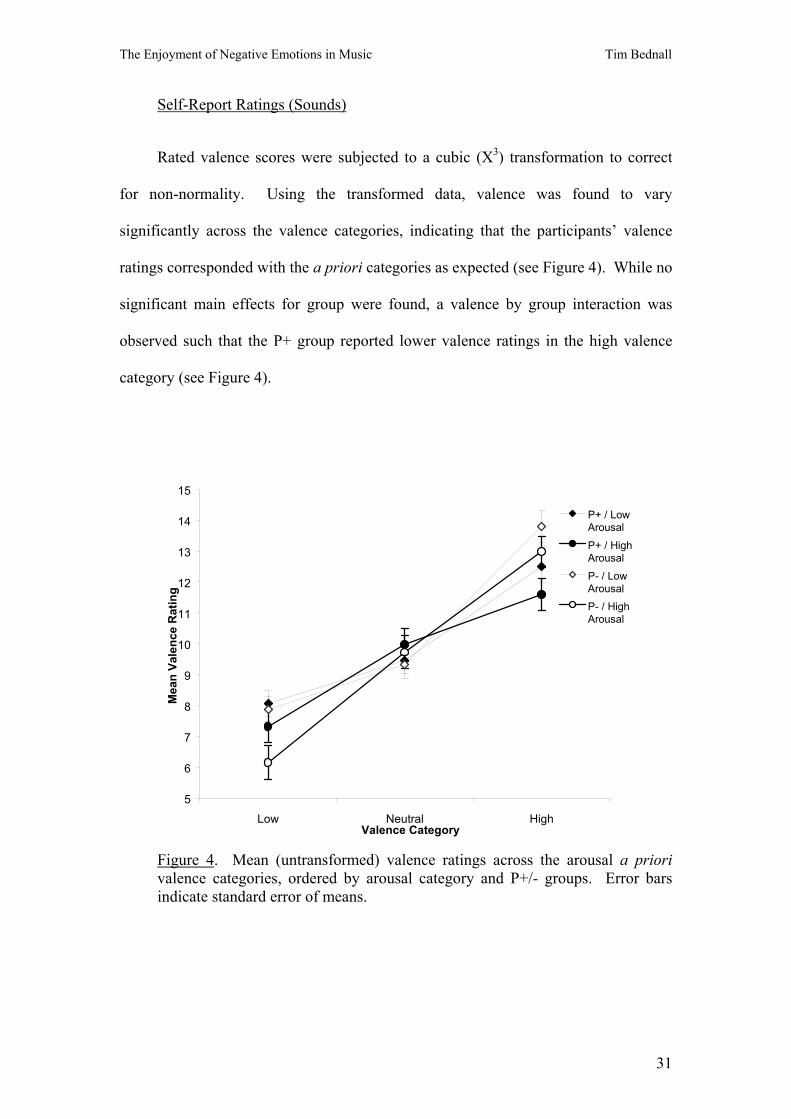
Self-Report Ratings (Sounds)
Rated valence scores were subjected to a cubic (X3) transformation to correct
for non-normality. Using the transformed data, valence was found to vary
significantly across the valence categories, indicating that the participants’ valence
ratings corresponded with the a priori categories as expected (see Figure 4). While no
significant main effects for group were found, a valence by group interaction was
observed such that the P+ group reported lower valence ratings in the high valence
category (see Figure 4).
5
6
7
8
9
10
11
12
13
14
15
Low Neutral HighValence Category
Mea
n Va
lenc
e R
atin
g
P+ / LowArousalP+ / HighArousalP- / LowArousalP- / HighArousal
Figure 4. Mean (untransformed) valence ratings across the arousal a priori valence categories, ordered by arousal category and P+/- groups. Error bars indicate standard error of means.
31
The Enjoyment of Negative Emotions in Music Tim Bednall
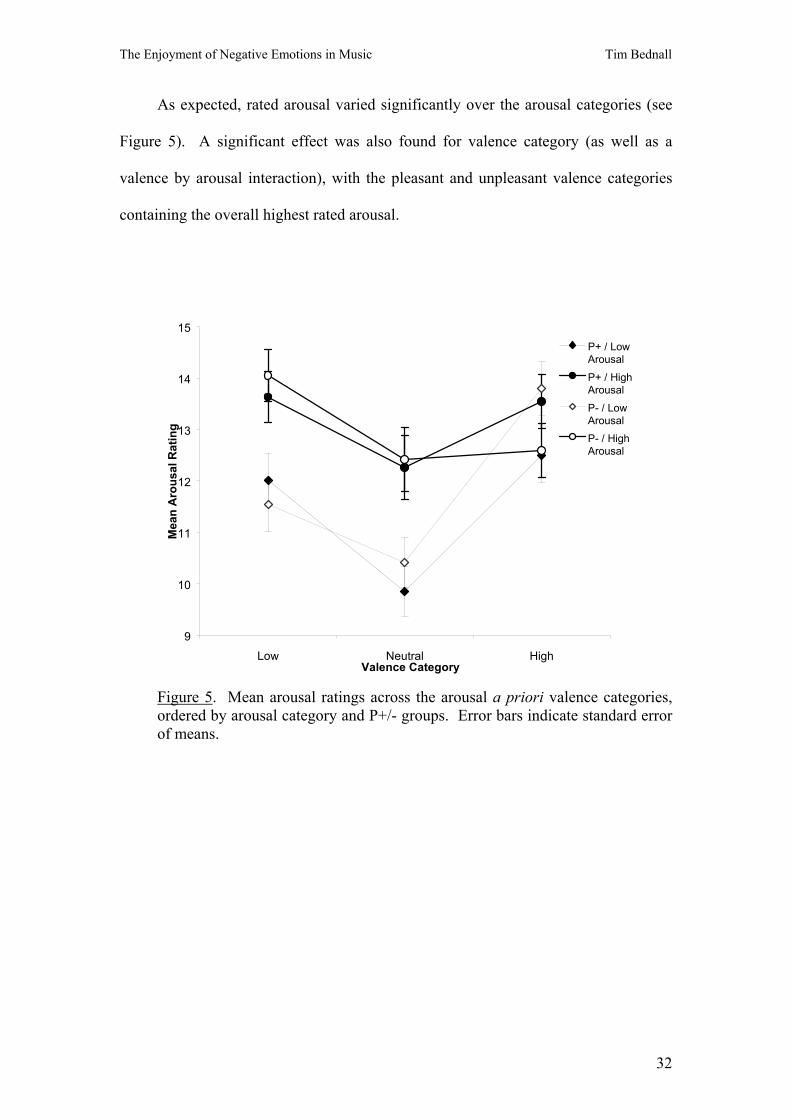
As expected, rated arousal varied significantly over the arousal categories (see
Figure 5). A significant effect was also found for valence category (as well as a
valence by arousal interaction), with the pleasant and unpleasant valence categories
containing the overall highest rated arousal.
9
10
11
12
13
14
15
Low Neutral HighValence Category
Mea
n A
rous
al R
atin
g
P+ / LowArousalP+ / HighArousalP- / LowArousalP- / HighArousal
Figure 5. Mean arousal ratings across the arousal a priori valence categories, ordered by arousal category and P+/- groups. Error bars indicate standard error of means.
32
The Enjoyment of Negative Emotions in Music Tim Bednall
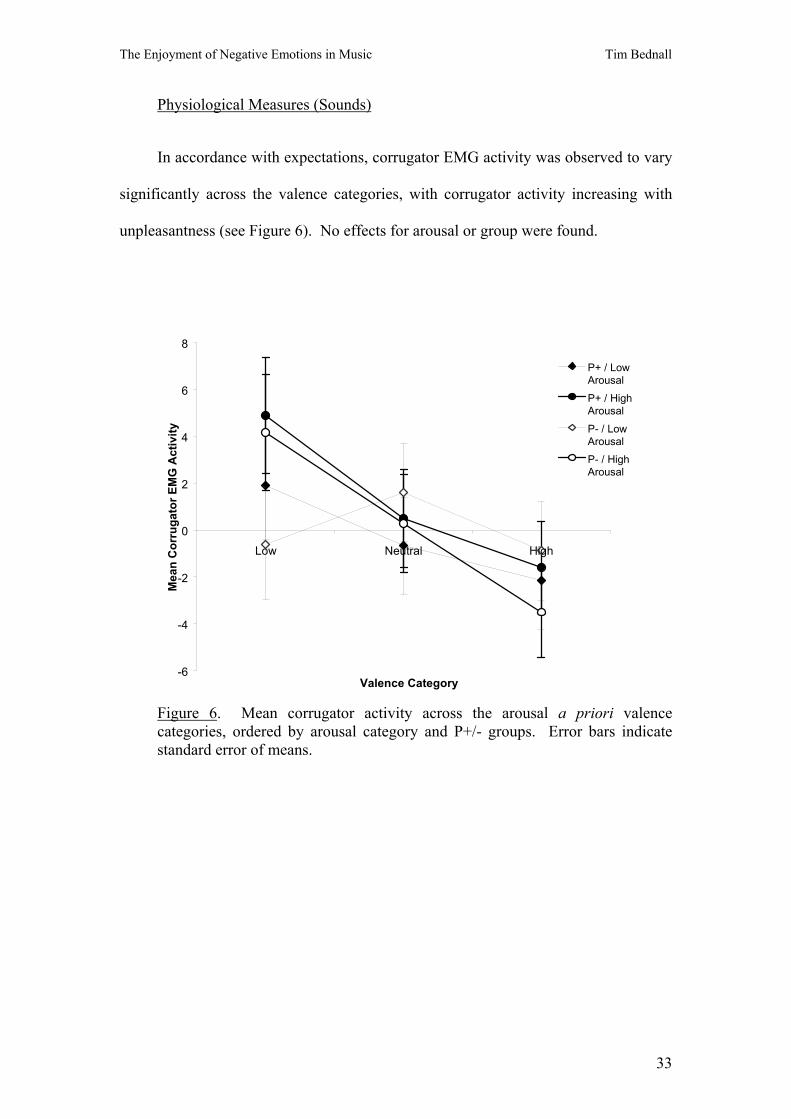
Physiological Measures (Sounds)
In accordance with expectations, corrugator EMG activity was observed to vary
significantly across the valence categories, with corrugator activity increasing with
unpleasantness (see Figure 6). No effects for arousal or group were found.
-6
-4
-2
0
2
4
6
8
Low Neutral High
Valence Category
Mea
n C
orru
gato
r EM
G A
ctiv
ity
P+ / LowArousalP+ / HighArousalP- / LowArousalP- / HighArousal
Figure 6. Mean corrugator activity across the arousal a priori valence categories, ordered by arousal category and P+/- groups. Error bars indicate standard error of means.
33

The Enjoyment of Negative Emotions in Music Tim Bednall
To correct for non-normality, zygomatic EMG change scores were squared
(following an additive transformation to eliminate negative values). Using the
transformed data, a non-significant trend was found for valence category, but a
planned quadratic contrast revealed a significant effect (F1,38 = 4.396, p = .043),
which was still consistent with expectations (see Figure 7). A significant group effect
was also observed, with the P- group showing higher overall activity.
-10
-5
0
5
10
15
Low Neutral High
Valence Category
Mea
n Zy
gom
atic
EM
G A
ctiv
ity
P+ / LowArousalP+ / HighArousalP- / LowArousalP- / HighArousal
Figure 7. Mean (untransformed) zygomatic activity across the arousal a priori valence categories, ordered by arousal category and P+/- groups. Error bars indicate standard error of means.
34

The Enjoyment of Negative Emotions in Music Tim Bednall
As expected, the standardised startle scores varied significantly over the valence
categories, with magnitudes increasing during unpleasant presentations. While no
significant effect was found for arousal category, a significant valence by arousal
interaction was discovered (see Figure 8). Independent-samples t-tests conducted on
the non-standardised data revealed a significant difference between the groups only in
the Neutral Valence-Low Arousal category (t34 = 2.152, p = .039), with the P+ group
exhibiting a greater blink magnitude.
-0.8
-0.6
-0.4
-0.2
0
0.2
0.4
0.6
0.8
Low Neutral High
Valence Category
Mea
n St
artle
Blin
k M
agni
tude
P+ / LowArousalP+ / HighArousalP- / LowArousalP- / HighArousal
Figure 8. Mean (standardised) startle blink magnitudes across the arousal a priori valence categories, ordered by arousal category and P+/- groups. Error bars indicate standard error of means.
35
The Enjoyment of Negative Emotions in Music Tim Bednall
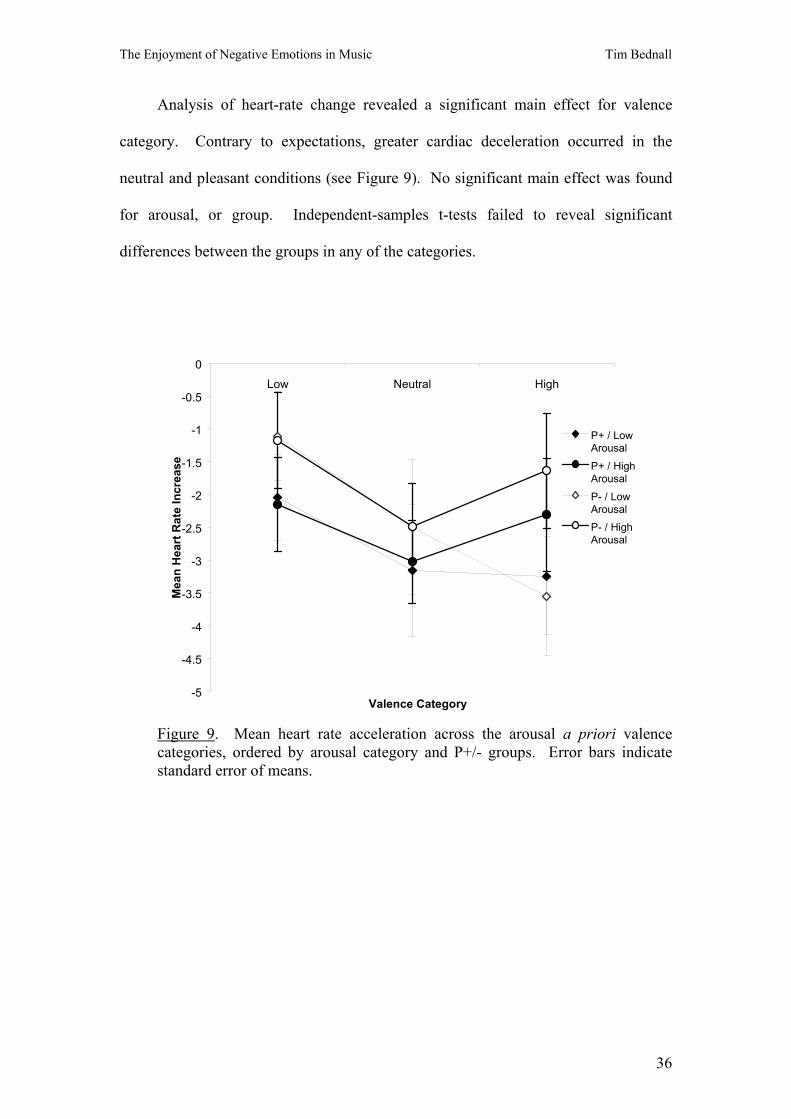
Analysis of heart-rate change revealed a significant main effect for valence
category. Contrary to expectations, greater cardiac deceleration occurred in the
neutral and pleasant conditions (see Figure 9). No significant main effect was found
for arousal, or group. Independent-samples t-tests failed to reveal significant
differences between the groups in any of the categories.
-5
-4.5
-4
-3.5
-3
-2.5
-2
-1.5
-1
-0.5
0Low Neutral High
Valence Category
Mea
n H
eart
Rat
e In
crea
se
P+ / LowArousalP+ / HighArousalP- / LowArousalP- / HighArousal
Figure 9. Mean heart rate acceleration across the arousal a priori valence categories, ordered by arousal category and P+/- groups. Error bars indicate standard error of means.
36
The Enjoyment of Negative Emotions in Music Tim Bednall
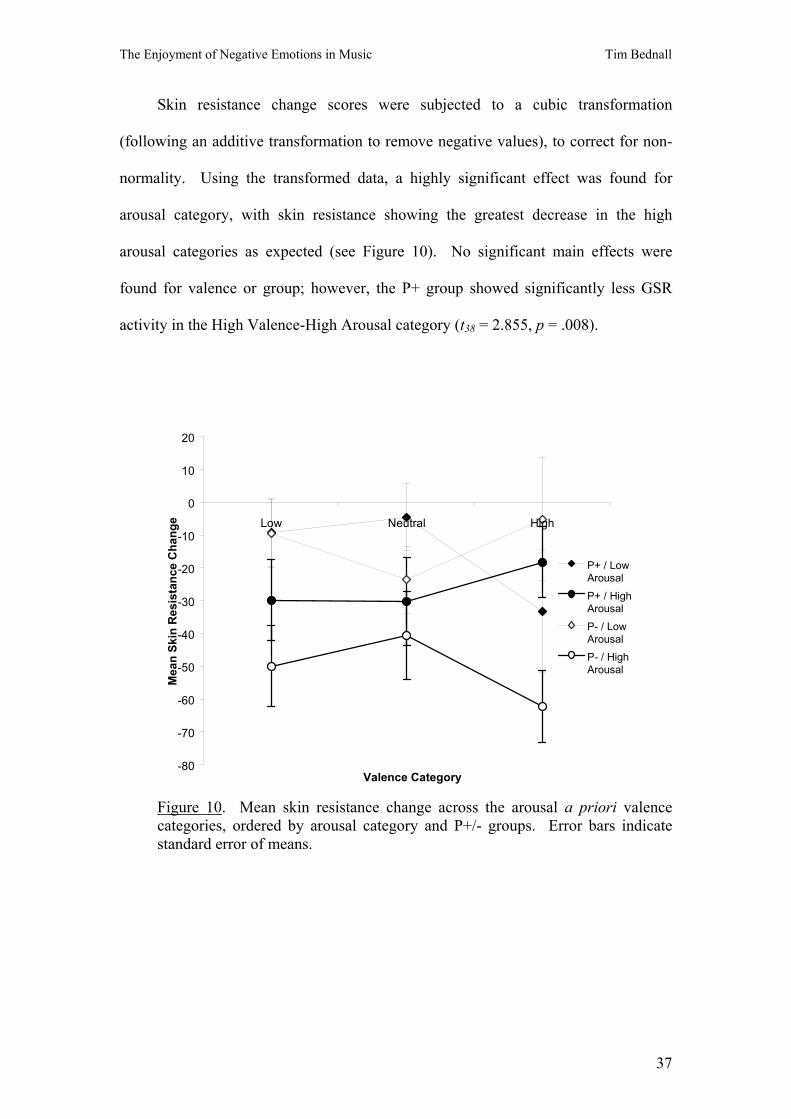
Skin resistance change scores were subjected to a cubic transformation
(following an additive transformation to remove negative values), to correct for non-
normality. Using the transformed data, a highly significant effect was found for
arousal category, with skin resistance showing the greatest decrease in the high
arousal categories as expected (see Figure 10). No significant main effects were
found for valence or group; however, the P+ group showed significantly less GSR
activity in the High Valence-High Arousal category (t38 = 2.855, p = .008).
-80
-70
-60
-50
-40
-30
-20
-10
0
10
20
Low Neutral High
Valence Category
Mea
n Sk
in R
esis
tanc
e C
hang
e
P+ / LowArousalP+ / HighArousalP- / LowArousalP- / HighArousal
Figure 10. Mean skin resistance change across the arousal a priori valence categories, ordered by arousal category and P+/- groups. Error bars indicate standard error of means.
37
The Enjoyment of Negative Emotions in Music Tim Bednall
Comparisons Across A Priori Categories and Between P+/- Groups for Music
A series of similar 3 × 2 repeated measures analyses of variance were performed
for the musical stimuli. Independent-samples t-tests were again used to make direct
comparisons between the P+/- groups within each category, for the startle, heart rate
and skin conductance measures, as well as the enjoyment ratings.
The outcomes of each ANOVA are presented in Table 2. Significant category
and between-group effects are illustrated in Figures 11 through 15. The category
means for each variable are presented in Appendix 4, and the P+/- comparisons in
Appendix 5.
38

The Enjoyment of Negative Emotions in Music Tim Bednall
Table 2. Analysis of variance for self-report and physiological variables in the music condition, across a priori valence and arousal categories and between the P+/P- groups.
F
df Rated Valence
Rated Arousal
Rated Enjoyment
Corrugator EMG
Zygomatic EMG
Startle Reflex
Heart Rate
Skin Resistance
Between subjects
Psychoticism Group (P)
1 5.05* 1.52 < 1 < 1 3.39(*) n/a < 1 < 1
P within group error
38 (10.92) (10.06) (18.23) (56.67) (156.38) n/a (16.95)c (3908.49)
Within subjects
Valence Category (V)
2 46.77*** ε = .719
< 1 ε = .783
16.67*** ε = .766 < 1 < 1
ε = .822 < 1 < 1 < 1
V × P
2 < 1 ε = .719
< 1 ε = .783
3.98* ε = .766 < 1 < 1
ε = .822 < 1 1.81 3.72*
V within group error
76 (3.92)
ε = .719 (2.95) ε = .783
(6.62) ε = .766 (81.51) (119.37)
ε = .822 (0.32)a (9.37)d (2099.94)
Arousal Category (A)
1 < 1 203.87*** 11.06** < 1 < 1 29.70*** < 1 5.18*
A × P
1 < 1 2.09 11.37** < 1 1.81 < 1 < 1 < 1
A within group error
38 (3.95) (13.19) (8.03) (56.98) (172.42) (0.33)b (6.11)c (1931.09)
V × A
2 6.46** < 1 15.33*** ε = .848 < 1 < 1 < 1 < 1
ε_=_.791 < 1
V × A × P
2 < 1 1.38 1.71 ε = .848 2.87(*) < 1 1.22 < 1
ε_=_.791 < 1
V × A within grp. error
76 (3.37) (2.38) (5.20)
ε = .848 (52.63) (165.29) (0.26)a (9.70)d
ε_=_.791 (1493.56)
Note. Values enclosed in parentheses represent mean square errors. a df = 64, b df = 32, c df = 37, d df = 74 (*) p < .10. * p < .05. ** p < .01. *** p < .001.
39
The Enjoyment of Negative Emotions in Music Tim Bednall
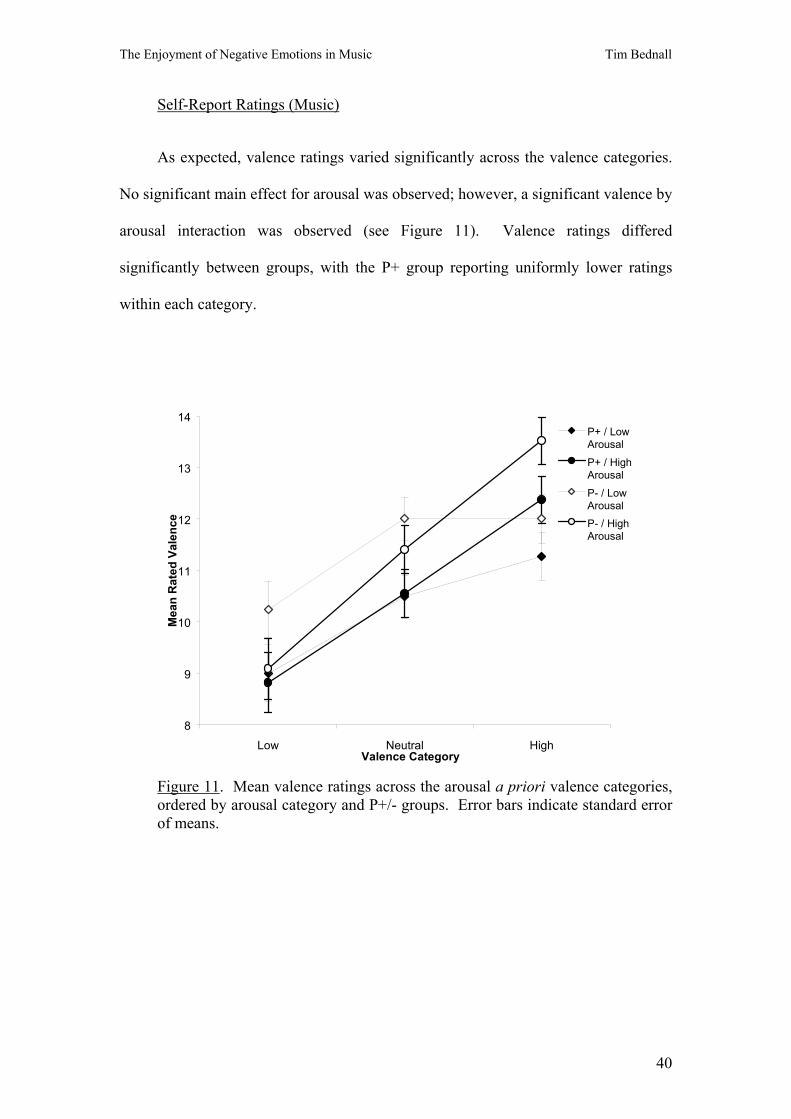
Self-Report Ratings (Music)
As expected, valence ratings varied significantly across the valence categories.
No significant main effect for arousal was observed; however, a significant valence by
arousal interaction was observed (see Figure 11). Valence ratings differed
significantly between groups, with the P+ group reporting uniformly lower ratings
within each category.
8
9
10
11
12
13
14
Low Neutral HighValence Category
Mea
n R
ated
Val
ence
P+ / LowArousalP+ / HighArousalP- / LowArousalP- / HighArousal
Figure 11. Mean valence ratings across the arousal a priori valence categories, ordered by arousal category and P+/- groups. Error bars indicate standard error of means.
40

The Enjoyment of Negative Emotions in Music Tim Bednall
Arousal ratings varied significantly across the a priori arousal categories, as
expected (see Figure 12). No significant main effects for valence category or group
were uncovered.
5
6
7
8
9
10
11
12
13
14
15
Low Neutral HighValence Category
Mea
n R
ated
Aro
usal
P+ / LowArousalP+ / HighArousalP- / LowArousalP- / HighArousal
Figure 12. Mean arousal ratings across the arousal a priori valence categories, ordered by arousal category and P+/- groups. Error bars indicate standard error of means.
41
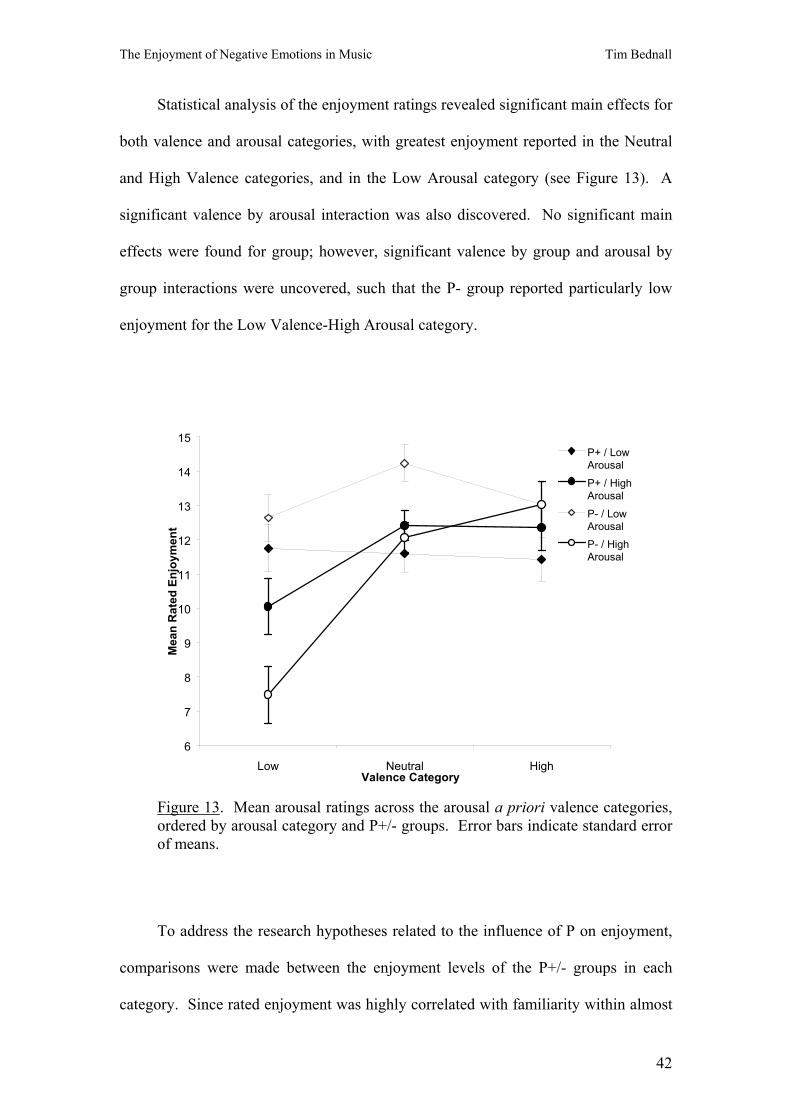
The Enjoyment of Negative Emotions in Music Tim Bednall
Statistical analysis of the enjoyment ratings revealed significant main effects for
both valence and arousal categories, with greatest enjoyment reported in the Neutral
and High Valence categories, and in the Low Arousal category (see Figure 13). A
significant valence by arousal interaction was also discovered. No significant main
effects were found for group; however, significant valence by group and arousal by
group interactions were uncovered, such that the P- group reported particularly low
enjoyment for the Low Valence-High Arousal category.
6
7
8
9
10
11
12
13
14
15
Low Neutral HighValence Category
Mea
n R
ated
Enj
oym
ent
P+ / LowArousalP+ / HighArousalP- / LowArousalP- / HighArousal
Figure 13. Mean arousal ratings across the arousal a priori valence categories, ordered by arousal category and P+/- groups. Error bars indicate standard error of means.
To address the research hypotheses related to the influence of P on enjoyment,
comparisons were made between the enjoyment levels of the P+/- groups in each
category. Since rated enjoyment was highly correlated with familiarity within almost
42
The Enjoyment of Negative Emotions in Music Tim Bednall
all of the categories (a table of these correlations is included in Appendix 7),
regression analyses were performed for each category, predicting enjoyment from
familiarity. From each analysis, residual values were extracted and compared
between the P+/- groups using independent-samples (one-tailed) t-tests.
As expected, the P+ group reported significantly less enjoyment in the Low
Arousal-Neutral Valence category (t38 = -3.944, p < .001), and the Low Arousal-High
Valence category (t38 = 2.014, p = .025). In addition, the P+ group reported
significantly greater enjoyment in the High Arousal-Low Valence category (t38 = -
1.956, p = .029), but not in the High-Arousal-Neutral Valence category (t38 = .748, p
= .230) or the High Arousal-High Valence (t38 = -.468, p = .322). A two-tailed test
was performed for the Low Arousal-Low Valence category, since it had been
concurrently predicted that the low arousal categories would stimulate less enjoyment
in the P+ group, and that the low valence categories would produce greater
enjoyment. This comparison was found to be non-significant (t38 = -.954, p = .346).
43
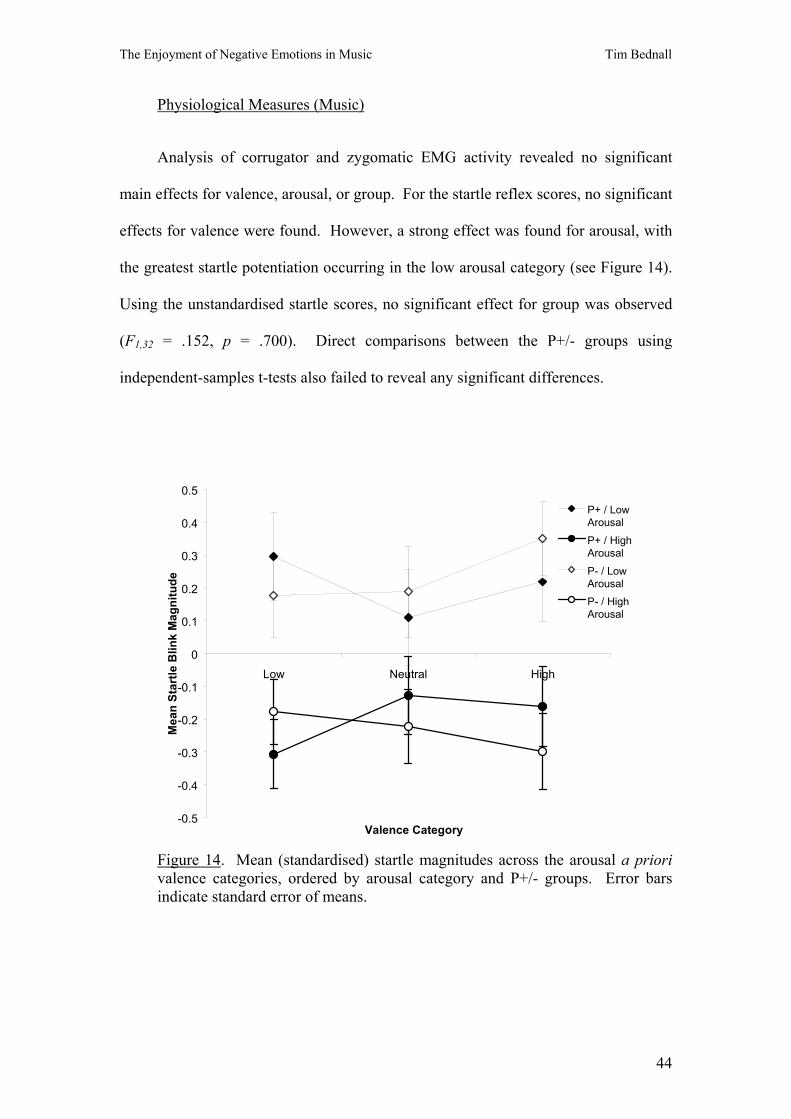
The Enjoyment of Negative Emotions in Music Tim Bednall
Physiological Measures (Music)
Analysis of corrugator and zygomatic EMG activity revealed no significant
main effects for valence, arousal, or group. For the startle reflex scores, no significant
effects for valence were found. However, a strong effect was found for arousal, with
the greatest startle potentiation occurring in the low arousal category (see Figure 14).
Using the unstandardised startle scores, no significant effect for group was observed
(F1,32 = .152, p = .700). Direct comparisons between the P+/- groups using
independent-samples t-tests also failed to reveal any significant differences.
-0.5
-0.4
-0.3
-0.2
-0.1
0
0.1
0.2
0.3
0.4
0.5
Low Neutral High
Valence Category
Mea
n St
artle
Blin
k M
agni
tude
P+ / LowArousalP+ / HighArousalP- / LowArousalP- / HighArousal
Figure 14. Mean (standardised) startle magnitudes across the arousal a priori valence categories, ordered by arousal category and P+/- groups. Error bars indicate standard error of means.
44

The Enjoyment of Negative Emotions in Music Tim Bednall
Statistical analyses of heart rate change also failed to show significant main
effects for valence, arousal, and group. Direct comparisons between groups also
failed to yield any significant differences for any of the categories.
For skin resistance, a significant main effect was found for arousal, with skin
resistance showing the greatest decrease in the high arousal category as expected. No
significant main effect was found for valence or group, however, a significant valence
by group interaction was discovered (see Figure 15). A one-tailed t-test revealed that
the P+ group showed significantly less GSR activity in the Low Valence-Low Arousal
category (t38 = 1.941, p = .031), however, this effect did not appear in any of the other
categories.
-50
-40
-30
-20
-10
0
10
20
Low Neutral High
Valence Category
Mea
n Sk
in R
esis
tanc
e C
hang
e
P+ / LowArousalP+ / HighArousalP- / LowArousalP- / HighArousal
Figure 15. Mean skin resistance change across the arousal a priori valence categories, ordered by arousal category and P+/- groups. Error bars indicate standard error of means.
45
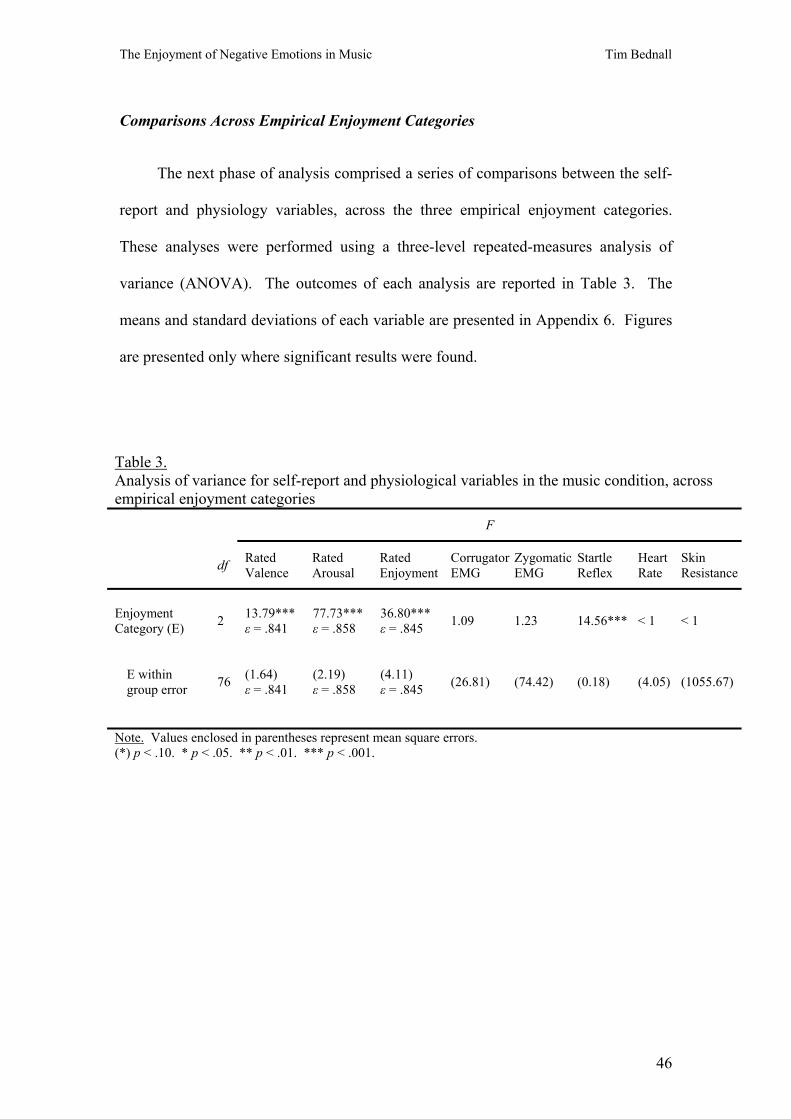
The Enjoyment of Negative Emotions in Music Tim Bednall
Comparisons Across Empirical Enjoyment Categories
The next phase of analysis comprised a series of comparisons between the self-
report and physiology variables, across the three empirical enjoyment categories.
These analyses were performed using a three-level repeated-measures analysis of
variance (ANOVA). The outcomes of each analysis are reported in Table 3. The
means and standard deviations of each variable are presented in Appendix 6. Figures
are presented only where significant results were found.
Table 3. Analysis of variance for self-report and physiological variables in the music condition, across empirical enjoyment categories
F
df Rated Valence
Rated Arousal
Rated Enjoyment
Corrugator EMG
Zygomatic EMG
Startle Reflex
Heart Rate
Skin Resistance
Enjoyment Category (E)
2 13.79*** ε = .841
77.73*** ε = .858
36.80*** ε = .845 1.09 1.23 14.56*** < 1 < 1
E within group error
76 (1.64) ε = .841
(2.19) ε = .858
(4.11) ε = .845 (26.81) (74.42) (0.18) (4.05) (1055.67)
Note. Values enclosed in parentheses represent mean square errors. (*) p < .10. * p < .05. ** p < .01. *** p < .001.
46
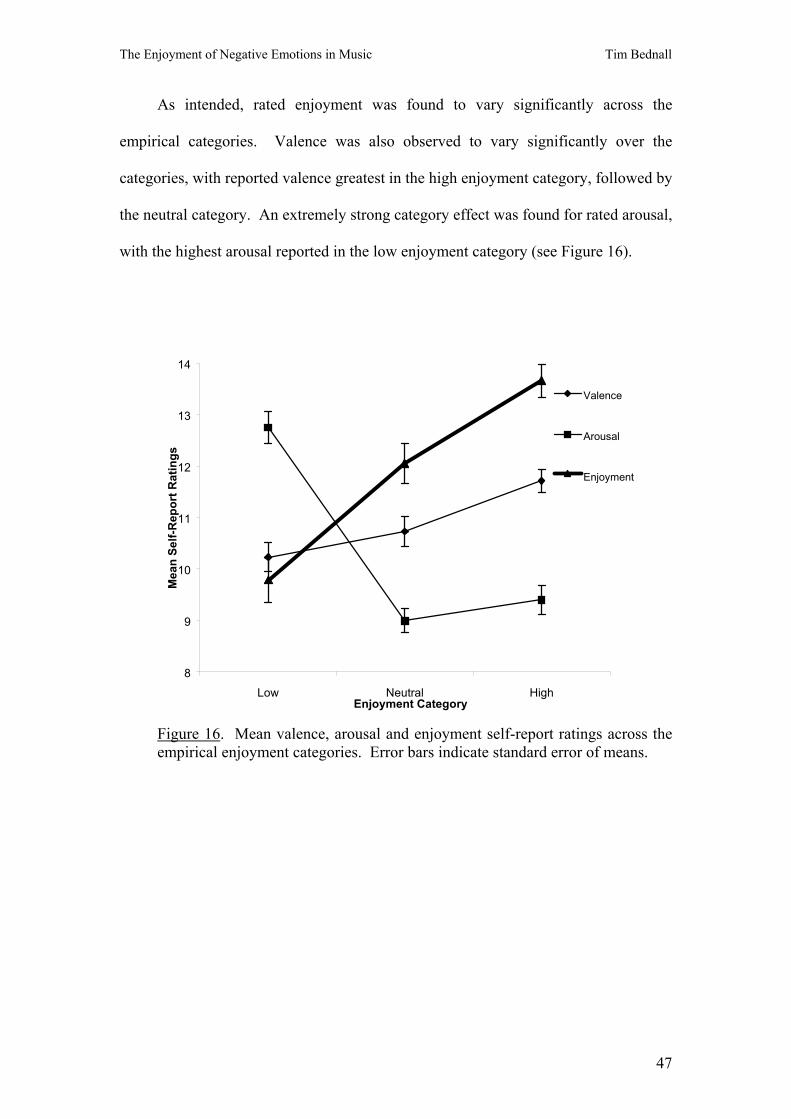
The Enjoyment of Negative Emotions in Music Tim Bednall
As intended, rated enjoyment was found to vary significantly across the
empirical categories. Valence was also observed to vary significantly over the
categories, with reported valence greatest in the high enjoyment category, followed by
the neutral category. An extremely strong category effect was found for rated arousal,
with the highest arousal reported in the low enjoyment category (see Figure 16).
8
9
10
11
12
13
14
Low Neutral HighEnjoyment Category
Mea
n Se
lf-R
epor
t Rat
ings
Valence
Arousal
Enjoyment
Figure 16. Mean valence, arousal and enjoyment self-report ratings across the empirical enjoyment categories. Error bars indicate standard error of means.
47
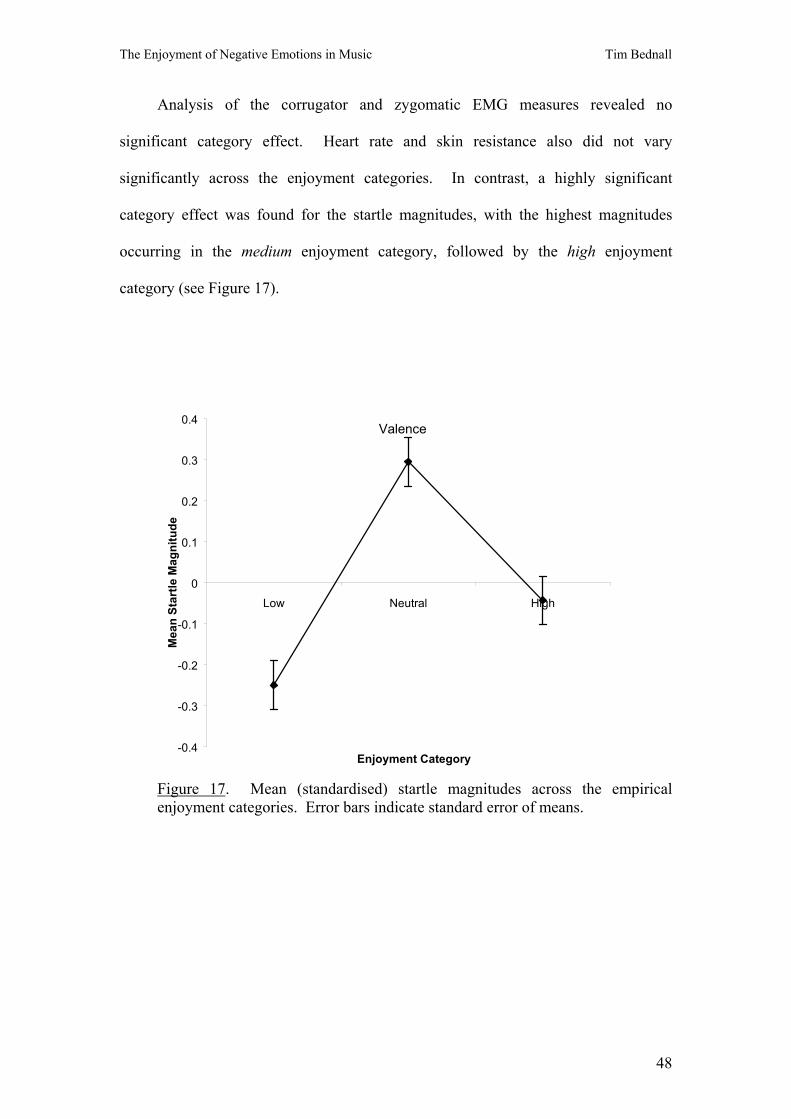
The Enjoyment of Negative Emotions in Music Tim Bednall
Analysis of the corrugator and zygomatic EMG measures revealed no
significant category effect. Heart rate and skin resistance also did not vary
significantly across the enjoyment categories. In contrast, a highly significant
category effect was found for the startle magnitudes, with the highest magnitudes
occurring in the medium enjoyment category, followed by the high enjoyment
category (see Figure 17).
Valence
-0.4
-0.3
-0.2
-0.1
0
0.1
0.2
0.3
0.4
Low Neutral High
Enjoyment Category
Mea
n St
artle
Mag
nitu
de
Figure 17. Mean (standardised) startle magnitudes across the empirical enjoyment categories. Error bars indicate standard error of means.
48

The Enjoyment of Negative Emotions in Music Tim Bednall
Comparing the overall tendencies of the P+/- groups to enjoy negative emotion in
music (and to dislike emotionally positive music)
High correlations were discovered between ratings of valence and enjoyment for
the majority of the musical categories (shown in Appendix 7), indicating that the
participants tended to show greater enjoyment for music that was emotionally
positive, and dislike for music expressing negative emotions. To compare this
tendency between groups, absolute difference scores were calculated between each
participant’s valence and enjoyment scores for every musical excerpt to obtain
discrepancy scores. The mean discrepancy scores of each participant were compared
across the P+/- groups using a one-way analysis of variance (ANOVA). This
analysis, however, did not reveal a significant difference between the groups (F1,38 =
1.83, p = .671).
49

The Enjoyment of Negative Emotions in Music Tim Bednall
Discussion
The first aim of the study was to address the issue of why it is possible to enjoy
the experience of negative emotions in music, by determining the nature of
participants’ emotional responses to music through the measurement of physiological
reactions. In response to the non-aesthetic (sound) stimuli, reliable physiological
changes were observed that varied with the pleasantness and intensity of the stimuli,
consistent with prior expectations. However, these associations were not present for
the musical stimuli, suggesting that music does not stimulate discernible emotional
reactions (as reflected by physiological changes) in the same manner as sounds.
These findings therefore supported the cognitivist explanation for the enjoyment of
negative emotions in music paradox.
The second goal was to determine whether Tough-mindedness influenced the
enjoyment of music with negative emotional content. The findings of this study
suggest that, compared to tender-minded individuals, highly tough-minded people
show a slight preference for unpleasant and highly arousing music, and a marked
dislike of emotionally ‘bland’ music. These differences in preference were not
reflected in any of the physiological measures.
Sounds – Relationships between valence/arousal and physiology
The relationships between the a priori categories and participants’ responses
generally conformed to our expectations. The participants’ ratings of valence and
arousal for each item were consistent with the categories to which the items had been
50

The Enjoyment of Negative Emotions in Music Tim Bednall
assigned, with significant differences observed across the valence and arousal
categories, respectively.
The physiological variables were also observed to vary significantly across the
categories, consistent with our expectations and previous psychophysiological studies
(e.g. Lang et al. 1993). Corrugator EMG activity was shown to increase during
presentations of unpleasant (low valence) sounds, and decrease for pleasant (high
valence) sounds. Zygomatic activity increased substantially during presentations of
pleasant stimuli, dropped below baseline levels for neutral stimuli, and showed a
slight increase for unpleasant stimuli. The startle blink decreased linearly with
valence, with the largest blinks occurring in the low valence category, and the
smallest in the high valence category. Skin resistance was greatest in the low arousal
category, and decreased in the high arousal category.
Heart rate was the only measure that deviated from our expectations, with the
greatest deceleration occurring in the neutral and high valence categories. This
outcome was contrary to the findings of earlier pictorial studies (Lang et al. 1993;
Bradley et al., 1990; Greenwald et al., 1989), which all reported greater deceleration
for low valence stimuli. Since the present study measured heart rate over a longer
duration (11.5s versus 6s), it is possible that our measurements were influenced by
changing cardiac activity in the later interval (e.g. relaxation following the recognition
of a stimulus).
The majority of these results were consistent with the findings of Bradley and
Lang’s (2000a) study that used similar auditory stimuli, as well as those of the
aforementioned pictorial studies. These findings suggest that the sounds used in this
51
The Enjoyment of Negative Emotions in Music Tim Bednall
experiment were successful in eliciting emotional reactions, as reflected by
physiological changes.
Music – Relationships between valence, arousal and enjoyment, and physiology
The participants’ self-report valence and arousal ratings generally conformed to
our prior expectations, with strong correspondences observed between the ratings and
the a priori categories. The ratings clearly distinguished the low/neutral/high valence
categories and the low/high arousal categories, indicating that the musical selections
were successful in representing the intended range of emotions. Enjoyment also
appeared to be strongly influenced by both sets of categories, with reported liking
increasing in the neutral/high valence and low arousal categories.
In contrast to the sound condition, the majority of the physiological measures
did not vary significantly across the a priori categories. Corrugator and zygomatic
EMG did not appear to be influenced by the valence categories, contrary to
expectations. Likewise, heart rate was not modulated by either the valence or arousal
categories. The only measure that conformed to our expectations was skin resistance,
which decreased significantly for items in the high arousal categories.
Interestingly, the startle blink appeared to be unaffected by valence and
modulated by arousal, with the largest blinks occurring in the low arousal category.
This finding could be due to the higher volumes of the arousing excerpts, which might
have diminished the impact of the startle probe. However, this explanation is
problematic, since the same effect was observed in Witvliet’s (1997) study, which
presented the probes after the stimuli. A second possibility is that the response was
modulated by attention, given that arousing stimuli are intrinsically engaging. Again,
52

The Enjoyment of Negative Emotions in Music Tim Bednall
this explanation is problematic, since blink responses have been evidenced to intensify
with increased attention to the sensory modality of the startle probe (Anthony &
Graham, 1985). A third possibility is that the arousing music evoked a unique
affective state that attenuated the startle blink, such as the inherently pleasurable
‘musical emotion’ suggested by proponents of the aestheticist position (Gurney, 1966;
Langer, 1942; Bell, 1914).
The empirical enjoyment categories also failed to distinguish levels of
physiological activity. Corrugator and zygomatic EMG, heart-rate and skin resistance
did not vary significantly between the conditions. The one exception was the startle
reflex, which varied significantly across the enjoyment categories – with the highest
magnitudes occurring in the neutral enjoyment category. Again, emotional arousal
(manifested in either strong disliking or enjoyment) appeared to be associated with
attenuated startle responses.
With regard to the three standpoints on the enjoyment of negative emotions in
music paradox, it was surmised that the physiological measures would substantiate the
emotivist account if they were found to be indexed by valence, the aestheticist
account if they were indexed by enjoyment, and the cognitivist account if no
correspondences were observed. Since the musical stimuli generally failed to elicit
distinctive physiological changes across the a priori and empirical categories, these
findings collectively support the cognitivist account – that emotion is perceived within
music, but not correspondingly experienced. This conclusion is strengthened by the
fact that the physiological measures were found to differ significantly across the
categories in the sound condition, suggesting that emotional sounds and music elicit
qualitatively different types of affective responses.
53
The Enjoyment of Negative Emotions in Music Tim Bednall
Tough-mindedness and musical preference
In comparing the P+/- groups, it was initially expected that the P+ group would
show a greater preference for music appearing in the low valence categories (owing to
the emotional resilience of high P individuals and the possible link between P and
psychopathy), and less enjoyment for music in the low arousal categories (due to the
association between P and sensation-seeking).
The P+ group reported slightly greater enjoyment for music within the Low
Valence-High Arousal a priori category. The outcome might be explained by the
resilience of high P individuals to emotional stressors (although no significant
physiological differences were observed between groups). Alternatively, the P+
group might simply have preferred the styles of music within this category (which
contained one heavy techno and two hard-rock excerpts). Since this reported
preference did not extend to the Low Valence-Low Arousal category, the prediction
that the P+ group would show a general preference for emotionally negative music
was not supported.
The most ostensible difference between the P+/- groups was found in the
Neutral Valence-Low Arousal category (which contained music that might be
considered emotionally ‘bland’), where the P+ group reported substantially less
enjoyment than the P- group. The high P group also reported less enjoyment for
music within the High Valence-Low Arousal category. These findings were
consistent with the evidence that high P individuals dislike less intense ‘easy-
listening’ music as suggested by Rawlings et al. (1995), and that sensation-seeking is
strongly associated with tough-mindedness (Eysenck & Zuckerman, 1978; Glicksohn
& Abulafia, 1997). While this outcome did not extend to the low valence category,
54
The Enjoyment of Negative Emotions in Music Tim Bednall
these results generally supported the prediction that the P+ group would show a
greater dislike for non-arousing music, and implies that high P individuals generally
require a higher level of stimulation to enjoy music.
The comparison of the valence/enjoyment discrepancy scores between the
groups suggested that high P individuals were generally not more likely to enjoy low
valence music or to dislike music of positive emotional content. Likewise, there was
little variation observed between the groups in the heart rate or skin resistance
measures within any of the categories.
The startle reflex also did not vary between groups for the music or sound
conditions. This result was inconsistent with the studies of Patrick et al. (1993) and
Levenston et al. (2000), which observed differences between the responses of
psychopaths and non-psychopaths to unpleasant stimuli. The failure to replicate this
finding raises some doubt about the link between psychopathy and P suggested by
Robinson and Zahn (1985). However, the inconsistency might be due to the fact that
both of the aforementioned studies used an all-male sample of criminal inmates,
whereas this study used a largely female sample.
In sum, these results suggest that the differences between P+/- preferences were
related principally to the arousing quality of music (and possibly musical style), and
less to the emotional pleasantness or unpleasantness of the excerpts.
Methodological Considerations
A number of methodological issues are considered within this section, related to
the ecological validity of the experimental setting, the limitations of emotional
measurement, and the sample used in the study.
55
The Enjoyment of Negative Emotions in Music Tim Bednall
An obvious criticism is the fact that the experimental procedure took place in an
unnatural setting, and hence, might not have produced emotional reactions normally
experienced while listening to music. In particular, since the musical stimuli were
brief, participants would have been forced to rely solely on instantaneous affective
cues to recognise emotions within each presentation, rather than slower emotional
build-ups over entire works. However, given that the sound stimuli were successful in
eliciting physiological responses under the same conditions, it is reasonable to assume
that the laboratory context was appropriate for prompting emotional responses to
musical stimuli. Therefore, the failure to do this was probably due to inherent
differences in the expressive qualities of sounds and music.
The failure of the musical stimuli to elicit physiological changes might also be
related to the fact that the a priori valence and empirical enjoyment categories did not
reflect the breadth of the valence and enjoyment scales (which ranged from 0 to 20).
The means of the low, medium and high categories were 9.3, 11.1 and 12.25 (for
valence), and 9.8, 12.1, and 13.7 (for enjoyment). Thus, most of the stimuli in the low
categories clustered around the middle of the valence and enjoyment scales,
suggesting the participants experienced medium affective valence and enjoyment,
rather than substantial unpleasantness and dislike as intended.
Another possibility is that the participants adopted a different rating strategy
within the music condition. For example, they might have mistakenly used the ratings
to indicate the emotions they perceived within the music (rather than their own
emotional experiences), or not understood the distinction between the valence and
enjoyment ratings. These scenarios are unlikely, given that specific verbal and
written directions were given to participants instructing them how rate the stimuli. In
56
The Enjoyment of Negative Emotions in Music Tim Bednall
addition, dummy familiarity and enjoyment scales were added to the sound condition,
to make the rating systems as similar as possible.
A limitation of this study was the fact that only short-term emotional responses
were considered. While music did not appear to prompt physiological reactions in the
same manner as sounds, it is nevertheless possible that the emotional content of music
exerts an effect on the listener’s mood. Short presentations were used in this study in
order to replicate the psychophysiological paradigm of Bradley and Lang (2000a), and
due to technological constraints. The brevity of the excerpts precluded a longer-term
examination of the emotional effects of music, and how emotions change over the
progression of a musical piece. Notably, Witvliet’s (1997) study evidenced
discernible physiological changes in response to music, using longer (26s) musical
samples. Future research might benefit from using longer samples, and measuring
physiological changes over an extended period.
Several issues are also related to the sample used in this study. First, the sample
size was comparatively small for a between-groups design, and several of the
participants’ startle data had to be discarded. As shown in the previous section,
several of the effects came close to statistical significance, which would likely have
been stronger with a larger sample. Second, the sample contained a greater proportion
of females, which may have implications for the generalisability of the results.
Finally, since the P groups were derived from extreme P-scale scores, it is possible
that the group differences were due to measurement error, rather than genuine
individual differences. This was considered unlikely, given that the P score means for
both groups fell within two standard deviations of the screening sample mean.
57
The Enjoyment of Negative Emotions in Music Tim Bednall
Conclusions
The findings of this study indicate that sounds stimulate physiological and
emotional responses in much the same way as affective pictures. In contrast,
physiological responses to musical stimuli do not appear to be indexed by valence or
enjoyment (although increased GSR activity was observed to occur with reports of
high arousal). The results of this study therefore support the cognitivist account – that
we do not experience the same emotions that we recognise in music.
The comparisons of the P groups suggest that low and high P individuals do not
differ in their physiological responses to music, but do vary in their enjoyment for
music of specific emotional content. Specifically, high P individuals show greater
enjoyment for unpleasant music that is highly stimulating, and a strong disliking for
emotionally ‘bland’ music. These findings were consistent with those that evidenced
a preference amongst high P individuals for hard-rock music (e.g. Rawlings et al.
1995), and further reaffirm the relationship between the constructs of sensation-
seeking and P.
Seen in this light, musical enjoyment is best conceptualised as a higher-order
cognition that is only loosely related to immediate emotional reactions.
58

The Enjoyment of Negative Emotions in Music Tim Bednall
References
Anthony, B. J., & Graham, F. K. (1985). Blink reflex modification by selective
attention: Evidence for the modulation of "automatic" processing. Biological
Psychology, 21, 43-59.
Averill, J. R. (1969). Autonomic response patterns during sadness and mirth.
Psychophysiology, 5, 399-414.
Balaban, M., Losito, B., Simons, R. F., & Graham, F. K. (1986). Off-line latency and
amplitude scoring of human reflex eyeblink with Fortran IV.
Psychophysiology, 23, 612.
Bell, C. (1914). Art. London.
Bishop, D. V. M. (1977). The P Scale and Psychosis. Journal of Abnormal
Psychology, 86(2), 127-134.
Block, J. (1977a). P Scale and Psychosis: Continued Concerns. Journal of Abnormal
Psychology, 86(4), 431-434.
Block, J. (1977b). The Eysencks and Psychoticism. Journal of Abnormal Psychology,
86(6), 653-654.
Bradley, M. M., Cuthbert, B. N., & Lang, P. J. (1990). Startle reflex modification:
Emotion or Attention. Psychophysiology, 27, 513-522.
Bradley, M. M., & Lang, P. J. (1999). International affective digitized sounds (IADS):
59

The Enjoyment of Negative Emotions in Music Tim Bednall
Stimuli, instruction manual and affective ratings. Gainesville, FL: The Center
for Research in Psychology, University of Florida.
Bradley, M. M., & Lang, P. J. (2000a). Affective reactions to acoustic stimuli.
Psychophysiology, 37, 204-215.
Bradley, M. M., & Lang, P. J. (2000b). Measuring emotion: Behavior, feeling, and
physiology. In R. Lane & L. Nadel (Eds.), Cognitive neuroscience of emotion
(pp. 242-276). New York: Oxford University.
Brevik, G., Roth, W. T., & Jørgsen, P. E. (1998). Personality, psychological states and
heart rate in novice and expert parachutists. Personality and Individual
Differences, 25, 365-380.
Cacioppo, J. T., & Tassinary, L. G. (1990). Principles of psychophysiology. New
York: Cambridge University Press.
Cacioppo, J. T., Klein, D. J., Berntson, G. G., & Hatfield, E. (1993). The
psychophysiology of emotion. In M. Lewis & J. M. Haviland (Eds.),
Handbook of emotions (pp. 119-142). New York: Guilford Press.
Cattell, R. B., & Saunders, D. (1954). Musical preferences and personality diagnosis.
Journal of Social Psychology, 39, 3-24.
Claridge, G. (1981). Psychoticism. In R. Lynn (Ed.), Dimensions of Personality (pp.
79-109). Oxford: Pergamon Press.
Cook, E. W. I. (2000). VPM reference manual. Birmingham, AL: Author.
Costa, P. T., & McCrae, R. R. (1985). Comparison of EPI and psychoticism scales
60
The Enjoyment of Negative Emotions in Music Tim Bednall
with measures of the five-factor model of personality. Personality and
Individual Differences, 6(5), 587-597.
Daoussis, L., & McKelvie, S. J. (1986). Musical preference and effects of music on a
reading comprehension test for extraverts and introverts. Perceptual and
Motor Skills, 62, 283-289.
Dowling, W. J., & Harwood, D. L. (1986). Music cognition. Orlando: Academic
Press.
Ekman, P., Levenson, R. W., & Friesen, W. V. (1983). Autonomic nervous system
activity distinguishes among emotions. Science, 221, 1208-1210.
Eysenck, H. J., & Eysenck, S. B. G. (1975). Manual of the Eysenck Personality
Questionnaire (Junior and Adult). London: Hodder & Stoughton.
Eysenck, H. J., & Eysenck, S. B. G. (1976). Psychoticism as a dimension of
personality. London: Hodder and Stoughton.
Eysenck, H. J. (1977). Comments - Block and Psychoticism. Journal of Abnormal
Psychology, 86(6), 651-652.
Eysenck, S. B. G., & Zuckerman, M. (1978). The relationship between sensation-
seeking and Eysenck's dimensions of personality. British Journal of
Psychology, 69, 483-487.
Eysenck, S. B. G., Eysenck, H. J., & Barrett, P. (1985). A revised version of the
psychoticism scale. Personality and Individual Differences, 6, 21-29.
Eysenck, H. J. (1992a). The definition and measurement of psychoticism. Personality
61
The Enjoyment of Negative Emotions in Music Tim Bednall
and Individual Differences, 13(7), 757-785.
Eysenck, H. J. (1992b). Four ways five factors are not basic. Personality and
Individual Differences, 13(6), 667-673.
Fowles, D. C. (1980). The three arousal model: Implications of Gray's two-factor
learning theory for heart rate, electrodermal activity, and psychopathy.
Psychophysiology, 17, 87-104.
Glicksohn, J., & Abulafia, J. (1998). Embedding sensation seeking within the big
three. Personality and Individual Differences, 25, 1085-1099.
Goldman, A. (1992). The Value of Music. The Journal of Aesthetics and Art
Criticism, 50(1), 35-44.
Greenwald, M. K., Cook, E. W., & Lang, P. J. (1989). Affective judgement and
psychophysiological response: Dimensional covariation in the evaluation of
pictorial stimuli. Journal of Psychophysiology, 3, 51-64.
Gross, J. J., & Levenson, R. W. (1995). Emotional elicitation using films. Cognition
and Emotion, 9, 87-108.
Gurney, E. (1966/1880). The power of sound. New York: Basic Books.
Hare, R. D., Wood, K., Britain, S., & Shadman, J. (1970). Autonomic responses to
affective visual stimuli. Psychophysiology, 7, 408-417.
Hare, R. D. (1970). Psychopathy: Theory and research. New York: Riley.
Izard, C. E. (1993). Four systems for emotional activation: Cognitive and
noncognitive processes. Psychological Review, 100, 68-90.
62
The Enjoyment of Negative Emotions in Music Tim Bednall
Kivy, P. (1990). Music alone : philosophical reflections on the purely musical
experience. Ithaca: Cornell University.
Konorski, J. (1967). Integrative activity of the brain: An interdisciplinary approach.
Chicago: University of Chicago Press.
Krumhansl, C. L. (1997). An Exploratory Study of Musical Emotions and
Psychophysiology. Canadian Journal of Experimental Psychology, 51(4),
336-352.
Lang, P. J. (1979). A bio-informational theory of emotional imagery.
Psychophysiology, 16, 495-512.
Lang, P. J., Bradley, M. M., & Cuthbert, B. N. (1990). Emotion, attention, and the
startle reflex. Psychological Review, 97, 377-398.
Lang, P. J., Greenwald, M. K., Bradley, M. M., & Hamm, A. O. (1993). Looking at
Pictures: Affective, facial, visceral, and behavioral reactions.
Psychophysiology, 30, 261-273.
Lang, P. J. (1993). The three-system approach to emotion. In N. Birbaumer & A.
Ohman (Eds.), The structure of emotions: Psychophysiological, cognitive, and
clinical aspects. Seattle: Hogrefe & Huber.
Lang, P. J. (1994). The motivational organization of emotion: Affect-reflex
connections. In S. V. Goozen & N. E. Van de Poll & J. A. Sergeant (Eds.),
Emotions: Essays on emotion theory. Hillsdale: Erlbaum.
Lang, P. J. (1995). The emotion probe: Studies of motivation and attention. American
Psychologist, 50, 372-285.
63
The Enjoyment of Negative Emotions in Music Tim Bednall
Langer, S. (1942). Philosophy in a New Key. Cambridge, Mass.: Harvard University
Press.
Levenston, G. K., Patrick, C. J., Bradley, M. M., & Lang, P. J. (2000). The
Psychopath as Observer: Emotion and Attention in Picture Processing. Journal
of Abnormal Psychology, 109(3), 373-385.
Levinson, J. (1990). Music, Art and Metaphysics: Essays in Philosophical Aesthetics.
Ithaca: Cornell University Press.
Litle, P., & Zuckerman, M. (1986). Sensation seeking and music preferences.
Personality and Individual Differences, 7(4), 575-577.
Looft, W. R., & Baranowski, M. D. (1971). An analysis of five measures of sensation
seeking and preference for complexity. Journal of General Psychology, 85,
307-313.
Lykken, D. T. (1957). A study of anxiety in the sociopathic personality. Journal of
Abnormal and Clinical Psychology, 55, 6-10.
Mandler, G. (1984). Mind and body: Psychology of emotions and stress. New York:
Norton.
McCown, W., Keiser, R., Mulhearn, S., & Williamson, D. (1997). The role of
personality and gender in preference for exaggerated bass in music.
Personality and Individual Differences, 23(4), 543-547.
McCrae, R. R., & Costa, P. T. (1985). Comparison of EPI and psychoticism scales
with measures of the five-factor model of personality. Personality and
Individual Differences, 6(5), 587-597.
64
The Enjoyment of Negative Emotions in Music Tim Bednall
Mehrabian, A., & Russell, J. (1974). An approach to environmental psychology.
Cambridge: Massachusetts Institute of Technology Press.
Meyer, L. B. (1956). Emotion and meaning in music. Chicago: University of Chicago
Press.
Osgood, C., Suci, G., & Tannenbaum, P. (1957). The measurement of meaning.
Urbana: University of Illinois Press.
Patrick, C. J., Bradley, M. M., & Lang, P. J. (1993). Emotion in the Criminal
Psychopath: Startle Reflex Modulation. Journal of Abnormal Psychology,
102(1), 82-92.
Payne, E. (1967). Musical Taste and Personality. British Journal of Psychology,
58(1,2), 133-138.
Payne, E. (1980). Towards an understanding of music appreciation. Psychology of
Music, 8, 31-41.
Rawlings, D., Hodge, M., Sherr, D., & Dempsey, A. (1995). Toughmindedness and
Preference for Musical Excerpts, Categories and Triads. Psychology of Music,
23, 63-80.
Rawlings, D., & Ciancarelli, V. (1997). Music Preference and the Five-Factor Model
of the NEO Personality Inventory. Psychology of Music, 25(2), 120-132.
Rawlings, D., Twomey, F., Burns, E., & Morris, S. (1998). Personality, creativity, and
aesthetic preference: comparing psychoticism, sensation seeking, schizotypy,
and openness to experience. Empirical Studies of the Arts, 16(2), 153-178.
65

The Enjoyment of Negative Emotions in Music Tim Bednall
Rawlings, D., Barrantes i Vidal, N., & Furnham, A. (2000). Personality and Aesthetic
Preference in Spain and England: Two Studies Relating Sensation Seeking and
Openness to Experience to Liking for Paintings and Music. European Journal
of Personality, 14, 553-576.
Robinson, T. N., & Zahn, T., P. (1985). Psychoticism and arousal: possible evidence
for a linkage of P and psychopathy. Personality and Individual Differences,
6(1), 47-66.
Robinson, T. O., Weaver, J. B., & Zillman, D. (1996). Exploring the relation between
personality and the appreciation of rock music. Psychological Reports, 78,
259-269.
Schachter, S., & Singer, J. E. (1962). Cognitive, social and physiological determinants
of emotional state. Psychological Review, 69, 379-399.
Schubert, E. (1996). Enjoyment of Negative Emotions in Music: An Associative
Network Explanation. Psychology of Music, 24, 18-28.
Scruton, R. (1983). The Aesthetic Understanding: Essays in the Philosophy of Art and
Culture. Manchester: Carcanet.
Stelmack, R. M., Plouffe, L., & Falkerberg, W. (1983). Extraversion, sensation
seeking and electrodermal response: Probing a paradox. Personality and
Individual Differences, 4(6), 607-614.
Stemmler, G. (1989). The autonomic differentiation of emotions revisited:
Convergent and discriminant validation. Psychophysiology, 26(6), 617-632.
Tellegen, A., & Waller, N. G. (1991). Exploring personality through test
66

The Enjoyment of Negative Emotions in Music Tim Bednall
constructions: Development of the Multidimensional Personality
Questionnaire. In S. R. Briggs & J. M. Checks (Eds.), Personality Measures:
Development and Evaluation (Vol. 1). Greenwich: JAI Press.
Tourangeau, R., & Ellsworth, P. C. (1979). The role of facial response in the
experience of emotion. Journal of Personality and Social Psychology, 37,
1519-1531.
Vrana, S. R., Spence, E. L., & Lang, P. J. (1988). The startle probe response: A new
measure of emotion? Journal of Abnormal Psychology, 97, 487-491.
Vrana, S. R., Cuthbert, B. N., & Lang, P. J. (1989). Processing fearful and neutral
sentences: Memory and heart rate change. Cognition and Emotion, 3, 179-195.
Watson, D., & Tellegen, A. (1985). Toward a consensual structure of mood.
Psychological Bulletin, 98, 219-235.
Wheeler, B. L. (1985). Relationships of personality characteristics to mood and
enjoyment after hearing live and recorded music and to musical taste.
Psychology of Music, 13, 81-92.
Witvliet, C. C. v. (1998). The impact of music-prompted emotional valence and
arousal on self-report, autonomic, facial EMG, and startle responses across
experimental contexts (Doctoral dissertation, Purdue University, 1997).
Dissertation Abstracts International - Section B: The Sciences and
Engineering, 58(12-B), 6832.
Zuckerman, M. (1979). Sensation seeking: Beyond the optimal level of arousal.
Hillsdale, NJ: Erlbaum.
67
The Enjoyment of Negative Emotions in Music Tim Bednall
Zuckerman, M. (1992). What is a basic factor and which factors are basic? Turtles all
the way down. Personality and Individual Differences, 13(675-681).
Zuckerman, M., Ulrich, R., S., & McLaughlin, J. (1993). Sensation seeking and
reactions to nature paintings. Personality and Individual Differences, 15(5),
563-576.
Zuckerman, M. (1994). Behavioral expressions and biosocial bases of sensation
seeking. Cambridge: Cambridge University Press.
68

The Enjoyment of Negative Emotions in Music Tim Bednall
Appendix 1
The Pilot Study
69

The Enjoyment of Negative Emotions in Music Tim Bednall
Details of the pilot study
The pilot study involved the testing of ten friends and colleagues of the
experimenter. These included 5 males and 5 females, of mean age 28.5 (sd = 14.58).
These volunteers were asked to listen to a series of 48 sound and 48 music clips
through headphones, and rate each on the 9-point SAM scales of valence and arousal
included within Bradley and Lang’s (1999) IADS Package.
Based on the average valence and arousal ratings across all volunteers, sound
and musical stimuli were selected for each of the six a priori valence/arousal
categories used in the current study. Valence ratings between 1-4 were assigned to a
‘low’ valence category, 4-6 to a ‘neutral’ category, and 6-9 to a ‘high’ category.
Arousal ratings between 1-5 (inclusive) were assigned to a ‘low’ category, and 5-9 to
a ‘high’ category.
The stimuli that were chosen for the present experiment are tabled on the
following page. Due to a computer malfunction, the titles and composers of each of
the musical pieces were unfortunately lost. (Interested parties should contact Tim
Bednall, Dr David Rawlings or Dr Nick Allen for a copy of the stimuli in .WAV
format.) The style of music, and whether each excerpt contained vocals is instead
listed.
The list order is the same as the order of presentation within the experiment.
The alternate order positions (used with one half of the participants), is listed in the
“Order 2” column of the table.
70
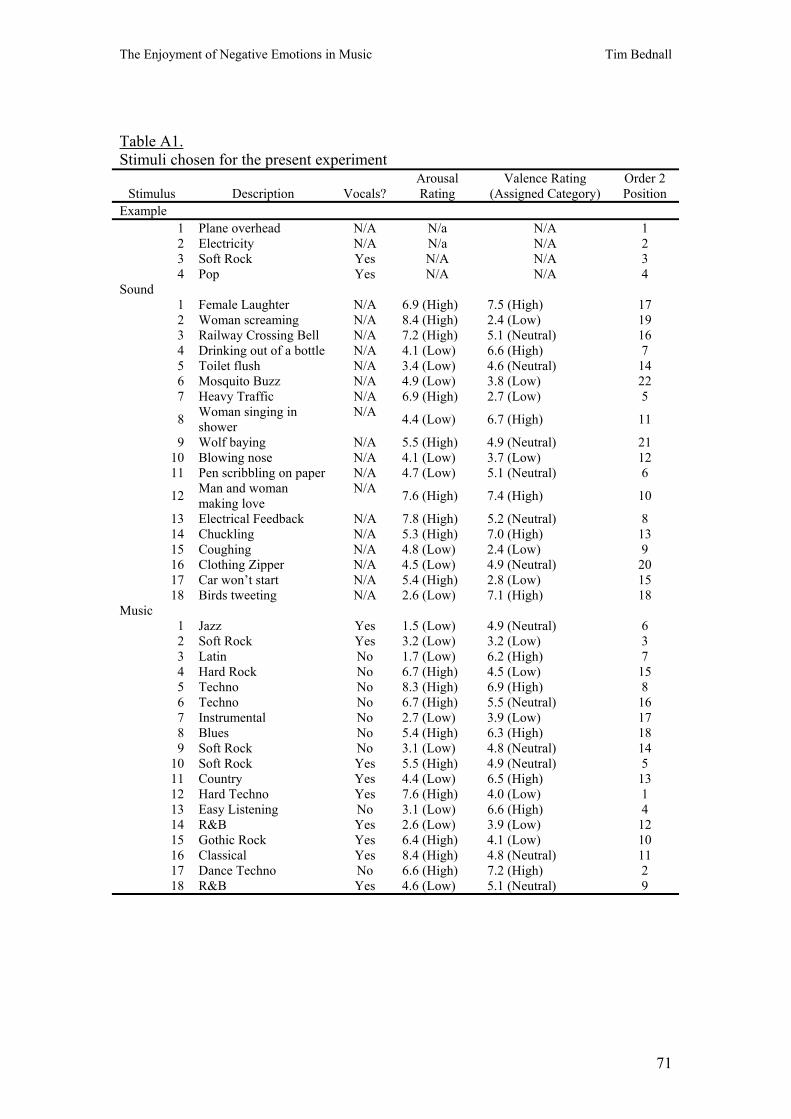
The Enjoyment of Negative Emotions in Music Tim Bednall
Table A1. Stimuli chosen for the present experiment
Stimulus Description Vocals? Arousal Rating
Valence Rating (Assigned Category)
Order 2 Position
Example 1 Plane overhead N/A N/a N/A 1 2 Electricity N/A N/a N/A 2 3 Soft Rock Yes N/A N/A 3 4 Pop Yes N/A N/A 4
Sound 1 Female Laughter N/A 6.9 (High) 7.5 (High) 17 2 Woman screaming N/A 8.4 (High) 2.4 (Low) 19 3 Railway Crossing Bell N/A 7.2 (High) 5.1 (Neutral) 16 4 Drinking out of a bottle N/A 4.1 (Low) 6.6 (High) 7 5 Toilet flush N/A 3.4 (Low) 4.6 (Neutral) 14 6 Mosquito Buzz N/A 4.9 (Low) 3.8 (Low) 22 7 Heavy Traffic N/A 6.9 (High) 2.7 (Low) 5
8 Woman singing in shower
N/A 4.4 (Low) 6.7 (High) 11
9 Wolf baying N/A 5.5 (High) 4.9 (Neutral) 21 10 Blowing nose N/A 4.1 (Low) 3.7 (Low) 12 11 Pen scribbling on paper N/A 4.7 (Low) 5.1 (Neutral) 6
12 Man and woman making love
N/A 7.6 (High) 7.4 (High) 10
13 Electrical Feedback N/A 7.8 (High) 5.2 (Neutral) 8 14 Chuckling N/A 5.3 (High) 7.0 (High) 13 15 Coughing N/A 4.8 (Low) 2.4 (Low) 9 16 Clothing Zipper N/A 4.5 (Low) 4.9 (Neutral) 20 17 Car won’t start N/A 5.4 (High) 2.8 (Low) 15 18 Birds tweeting N/A 2.6 (Low) 7.1 (High) 18
Music 1 Jazz Yes 1.5 (Low) 4.9 (Neutral) 6 2 Soft Rock Yes 3.2 (Low) 3.2 (Low) 3 3 Latin No 1.7 (Low) 6.2 (High) 7 4 Hard Rock No 6.7 (High) 4.5 (Low) 15 5 Techno No 8.3 (High) 6.9 (High) 8 6 Techno No 6.7 (High) 5.5 (Neutral) 16 7 Instrumental No 2.7 (Low) 3.9 (Low) 17 8 Blues No 5.4 (High) 6.3 (High) 18 9 Soft Rock No 3.1 (Low) 4.8 (Neutral) 14
10 Soft Rock Yes 5.5 (High) 4.9 (Neutral) 5 11 Country Yes 4.4 (Low) 6.5 (High) 13 12 Hard Techno Yes 7.6 (High) 4.0 (Low) 1 13 Easy Listening No 3.1 (Low) 6.6 (High) 4 14 R&B Yes 2.6 (Low) 3.9 (Low) 12 15 Gothic Rock Yes 6.4 (High) 4.1 (Low) 10 16 Classical Yes 8.4 (High) 4.8 (Neutral) 11 17 Dance Techno No 6.6 (High) 7.2 (High) 2 18 R&B Yes 4.6 (Low) 5.1 (Neutral) 9
71
The Enjoyment of Negative Emotions in Music Tim Bednall
Appendix 2
Instruction Sheet for Participants
72
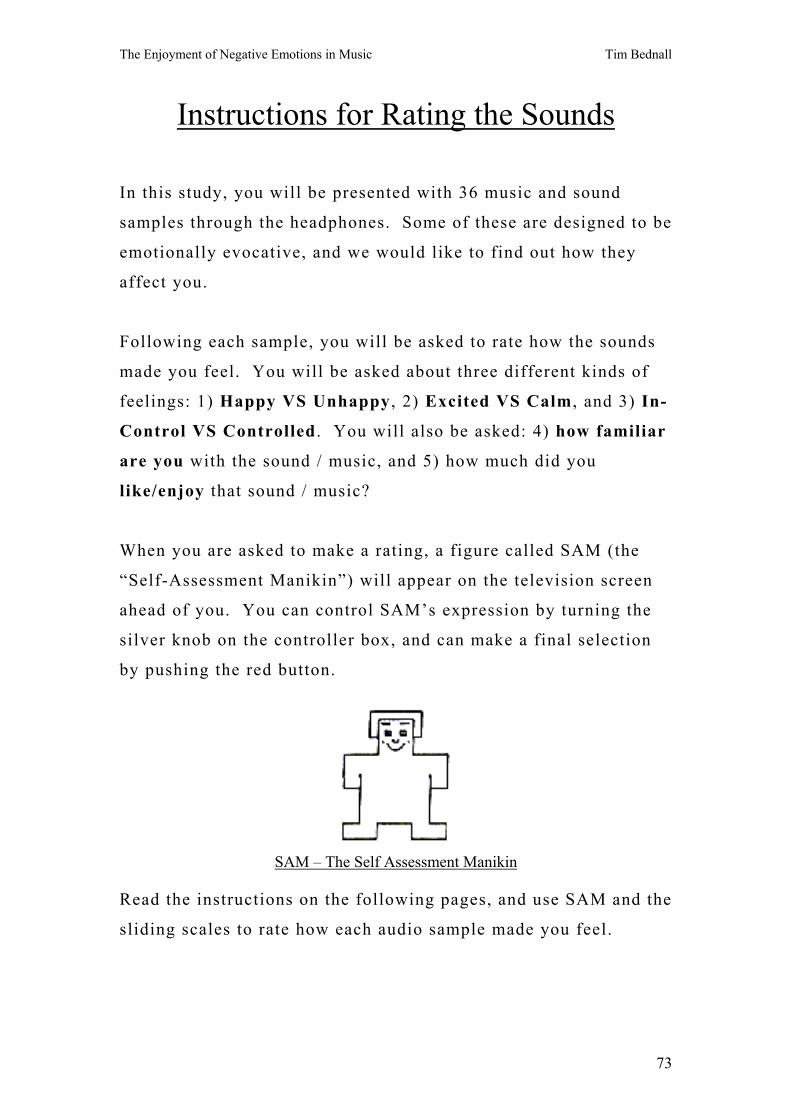
The Enjoyment of Negative Emotions in Music Tim Bednall
Instructions for Rating the Sounds
In this study, you will be presented with 36 music and sound
samples through the headphones. Some of these are designed to be
emotionally evocative, and we would like to find out how they
affect you.
Following each sample, you will be asked to rate how the sounds
made you feel. You will be asked about three different kinds of
feelings: 1) Happy VS Unhappy , 2) Excited VS Calm , and 3) In-
Control VS Controlled . You will also be asked: 4) how familiar
are you with the sound / music, and 5) how much did you
like/enjoy that sound / music?
When you are asked to make a rating, a figure called SAM (the
“Self-Assessment Manikin”) will appear on the television screen
ahead of you. You can control SAM’s expression by turning the
silver knob on the controller box, and can make a final selection
by pushing the red button.
SAM – The Self Assessment Manikin
Read the instructions on the following pages, and use SAM and the
sliding scales to rate how each audio sample made you feel.
73
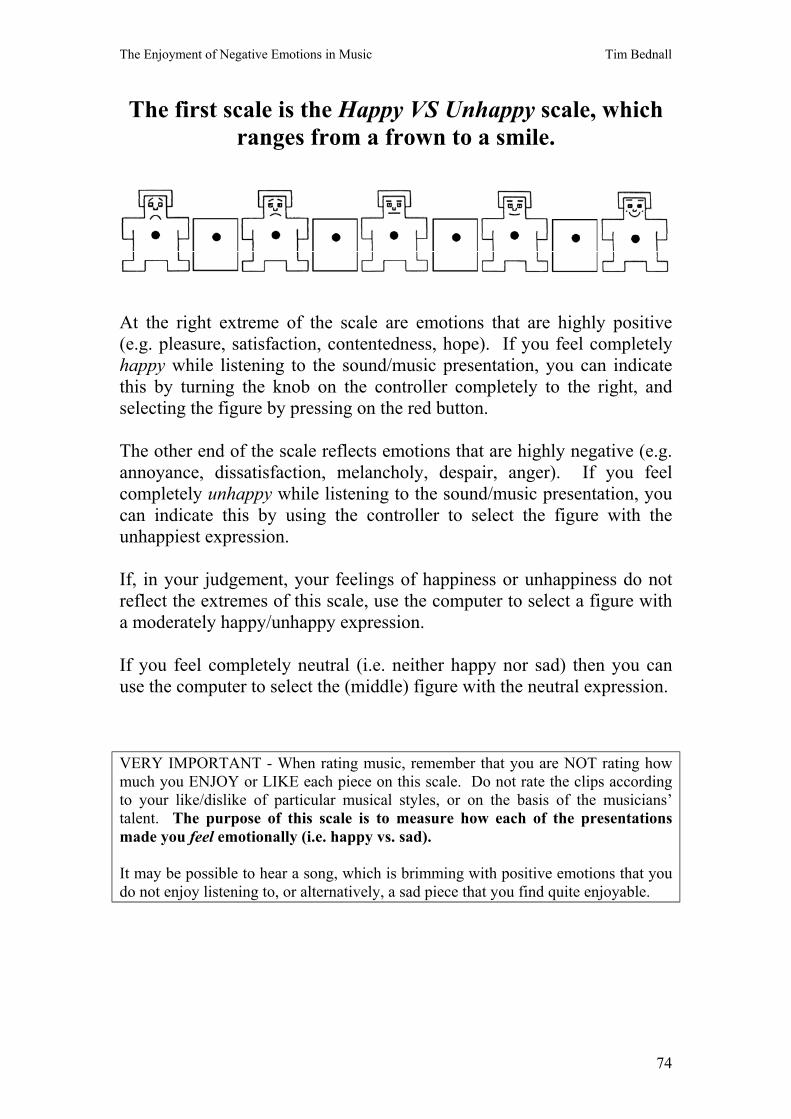
The Enjoyment of Negative Emotions in Music Tim Bednall
The first scale is the Happy VS Unhappy scale, which ranges from a frown to a smile.
At the right extreme of the scale are emotions that are highly positive (e.g. pleasure, satisfaction, contentedness, hope). If you feel completely happy while listening to the sound/music presentation, you can indicate this by turning the knob on the controller completely to the right, and selecting the figure by pressing on the red button. The other end of the scale reflects emotions that are highly negative (e.g. annoyance, dissatisfaction, melancholy, despair, anger). If you feel completely unhappy while listening to the sound/music presentation, you can indicate this by using the controller to select the figure with the unhappiest expression. If, in your judgement, your feelings of happiness or unhappiness do not reflect the extremes of this scale, use the computer to select a figure with a moderately happy/unhappy expression. If you feel completely neutral (i.e. neither happy nor sad) then you can use the computer to select the (middle) figure with the neutral expression. VERY IMPORTANT - When rating music, remember that you are NOT rating how much you ENJOY or LIKE each piece on this scale. Do not rate the clips according to your like/dislike of particular musical styles, or on the basis of the musicians’ talent. The purpose of this scale is to measure how each of the presentations made you feel emotionally (i.e. happy vs. sad). It may be possible to hear a song, which is brimming with positive emotions that you do not enjoy listening to, or alternatively, a sad piece that you find quite enjoyable.
74
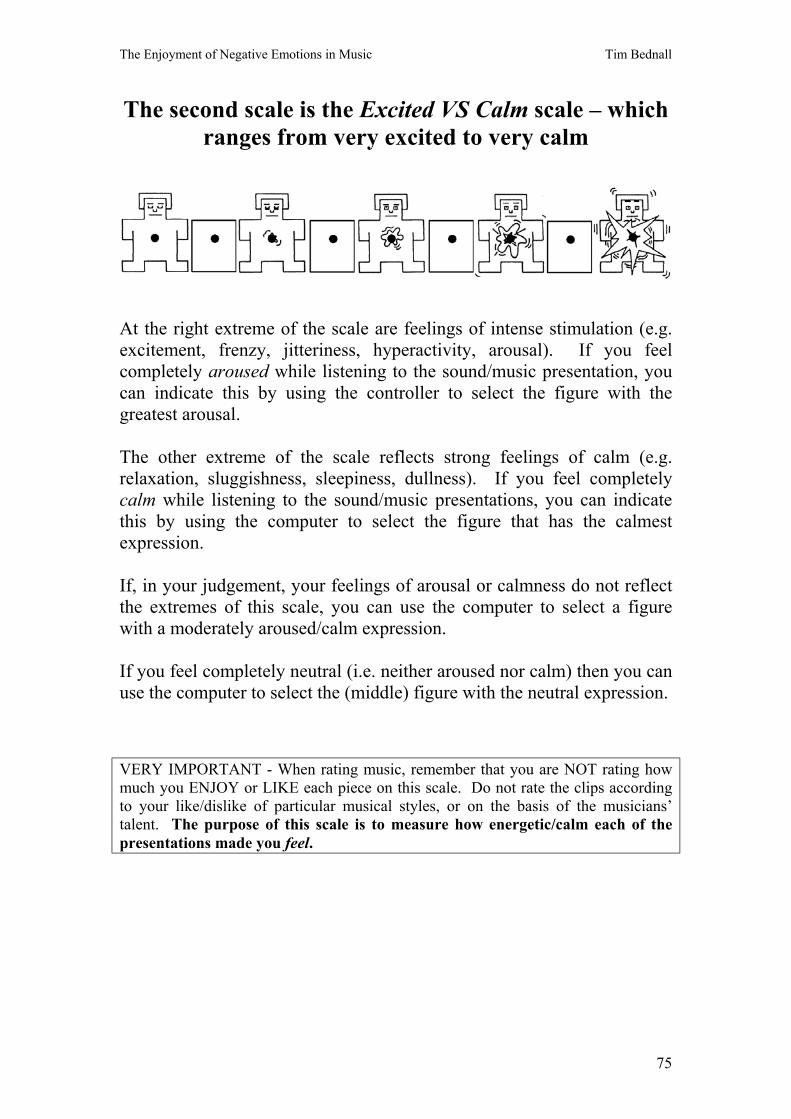
The Enjoyment of Negative Emotions in Music Tim Bednall
The second scale is the Excited VS Calm scale – which ranges from very excited to very calm
At the right extreme of the scale are feelings of intense stimulation (e.g. excitement, frenzy, jitteriness, hyperactivity, arousal). If you feel completely aroused while listening to the sound/music presentation, you can indicate this by using the controller to select the figure with the greatest arousal. The other extreme of the scale reflects strong feelings of calm (e.g. relaxation, sluggishness, sleepiness, dullness). If you feel completely calm while listening to the sound/music presentations, you can indicate this by using the computer to select the figure that has the calmest expression. If, in your judgement, your feelings of arousal or calmness do not reflect the extremes of this scale, you can use the computer to select a figure with a moderately aroused/calm expression. If you feel completely neutral (i.e. neither aroused nor calm) then you can use the computer to select the (middle) figure with the neutral expression. VERY IMPORTANT - When rating music, remember that you are NOT rating how much you ENJOY or LIKE each piece on this scale. Do not rate the clips according to your like/dislike of particular musical styles, or on the basis of the musicians’ talent. The purpose of this scale is to measure how energetic/calm each of the presentations made you feel.
75
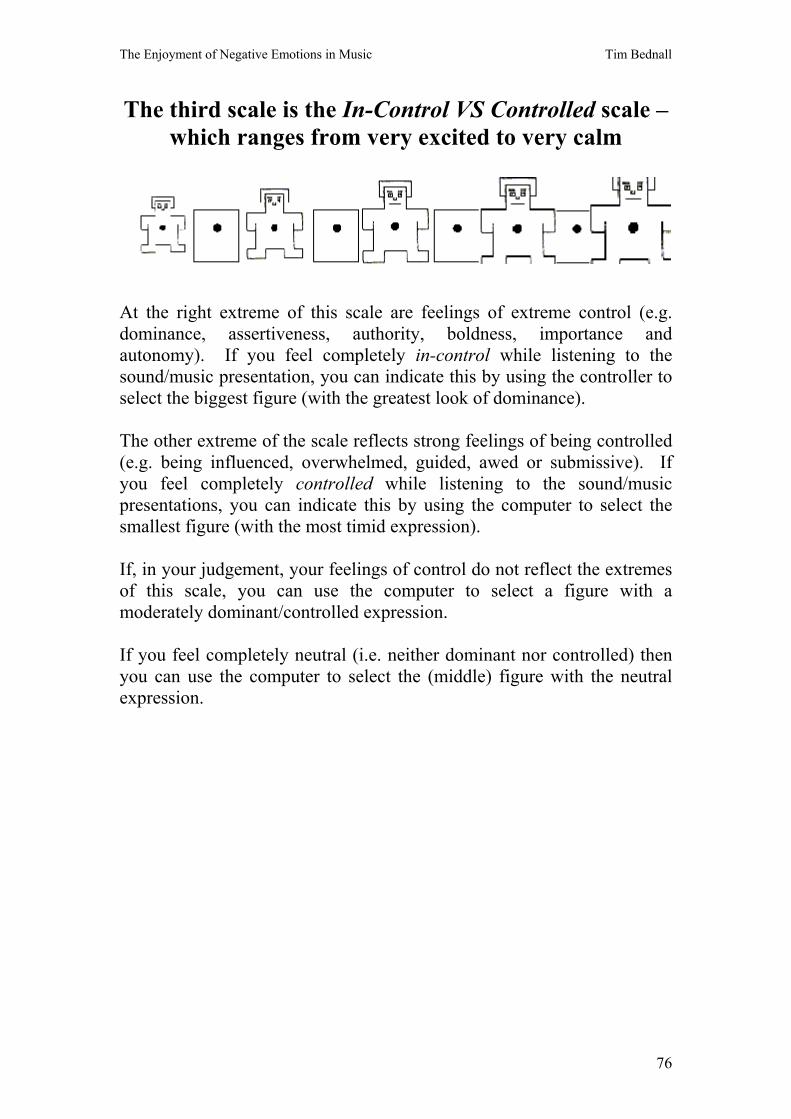
The Enjoyment of Negative Emotions in Music Tim Bednall
The third scale is the In-Control VS Controlled scale – which ranges from very excited to very calm
At the right extreme of this scale are feelings of extreme control (e.g. dominance, assertiveness, authority, boldness, importance and autonomy). If you feel completely in-control while listening to the sound/music presentation, you can indicate this by using the controller to select the biggest figure (with the greatest look of dominance). The other extreme of the scale reflects strong feelings of being controlled (e.g. being influenced, overwhelmed, guided, awed or submissive). If you feel completely controlled while listening to the sound/music presentations, you can indicate this by using the computer to select the smallest figure (with the most timid expression). If, in your judgement, your feelings of control do not reflect the extremes of this scale, you can use the computer to select a figure with a moderately dominant/controlled expression. If you feel completely neutral (i.e. neither dominant nor controlled) then you can use the computer to select the (middle) figure with the neutral expression.
76
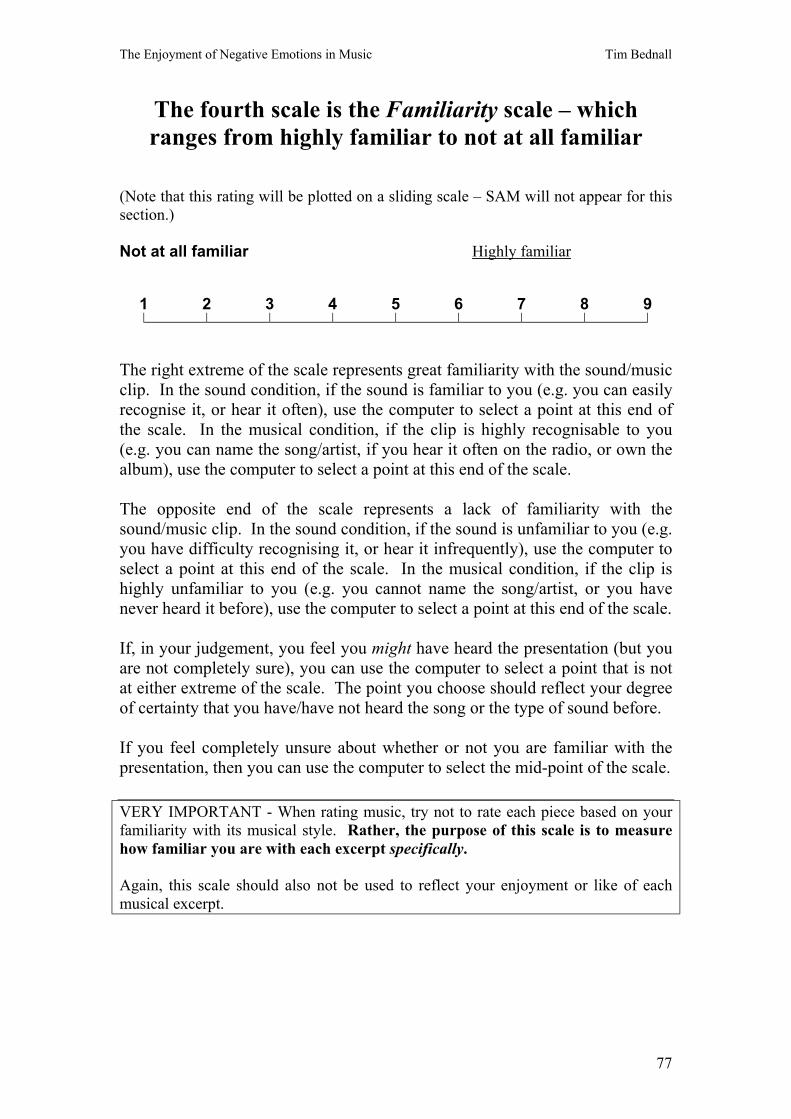
The Enjoyment of Negative Emotions in Music Tim Bednall
The fourth scale is the Familiarity scale – which ranges from highly familiar to not at all familiar
(Note that this rating will be plotted on a sliding scale – SAM will not appear for this section.) Not at all familiar Highly familiar
1 2 3 4 5 6 7 8 9
The right extreme of the scale represents great familiarity with the sound/music clip. In the sound condition, if the sound is familiar to you (e.g. you can easily recognise it, or hear it often), use the computer to select a point at this end of the scale. In the musical condition, if the clip is highly recognisable to you (e.g. you can name the song/artist, if you hear it often on the radio, or own the album), use the computer to select a point at this end of the scale. The opposite end of the scale represents a lack of familiarity with the sound/music clip. In the sound condition, if the sound is unfamiliar to you (e.g. you have difficulty recognising it, or hear it infrequently), use the computer to select a point at this end of the scale. In the musical condition, if the clip is highly unfamiliar to you (e.g. you cannot name the song/artist, or you have never heard it before), use the computer to select a point at this end of the scale. If, in your judgement, you feel you might have heard the presentation (but you are not completely sure), you can use the computer to select a point that is not at either extreme of the scale. The point you choose should reflect your degree of certainty that you have/have not heard the song or the type of sound before. If you feel completely unsure about whether or not you are familiar with the presentation, then you can use the computer to select the mid-point of the scale. VERY IMPORTANT - When rating music, try not to rate each piece based on your familiarity with its musical style. Rather, the purpose of this scale is to measure how familiar you are with each excerpt specifically. Again, this scale should also not be used to reflect your enjoyment or like of each musical excerpt.
77
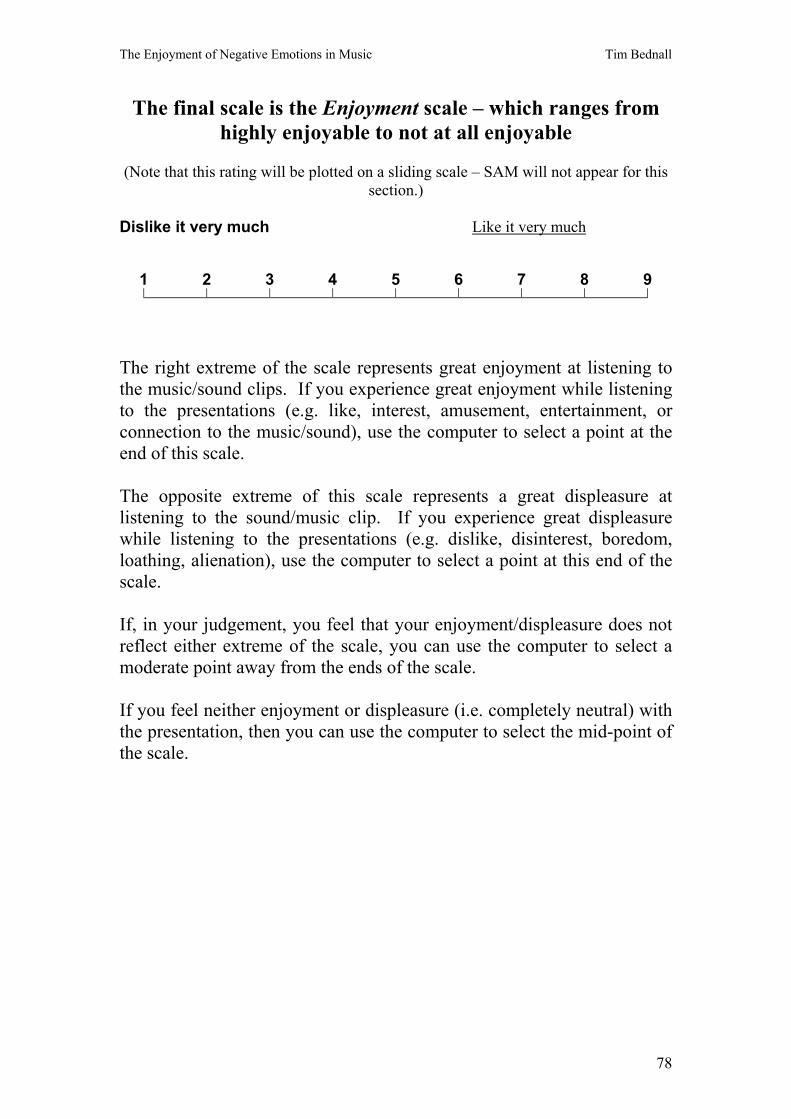
The Enjoyment of Negative Emotions in Music Tim Bednall
The final scale is the Enjoyment scale – which ranges from highly enjoyable to not at all enjoyable
(Note that this rating will be plotted on a sliding scale – SAM will not appear for this
section.) Dislike it very much Like it very much
1 2 3 4 5 6 7 8 9
The right extreme of the scale represents great enjoyment at listening to the music/sound clips. If you experience great enjoyment while listening to the presentations (e.g. like, interest, amusement, entertainment, or connection to the music/sound), use the computer to select a point at the end of this scale. The opposite extreme of this scale represents a great displeasure at listening to the sound/music clip. If you experience great displeasure while listening to the presentations (e.g. dislike, disinterest, boredom, loathing, alienation), use the computer to select a point at this end of the scale. If, in your judgement, you feel that your enjoyment/displeasure does not reflect either extreme of the scale, you can use the computer to select a moderate point away from the ends of the scale. If you feel neither enjoyment or displeasure (i.e. completely neutral) with the presentation, then you can use the computer to select the mid-point of the scale.
78
The Enjoyment of Negative Emotions in Music Tim Bednall
Appendix 3
Debriefing Form
79
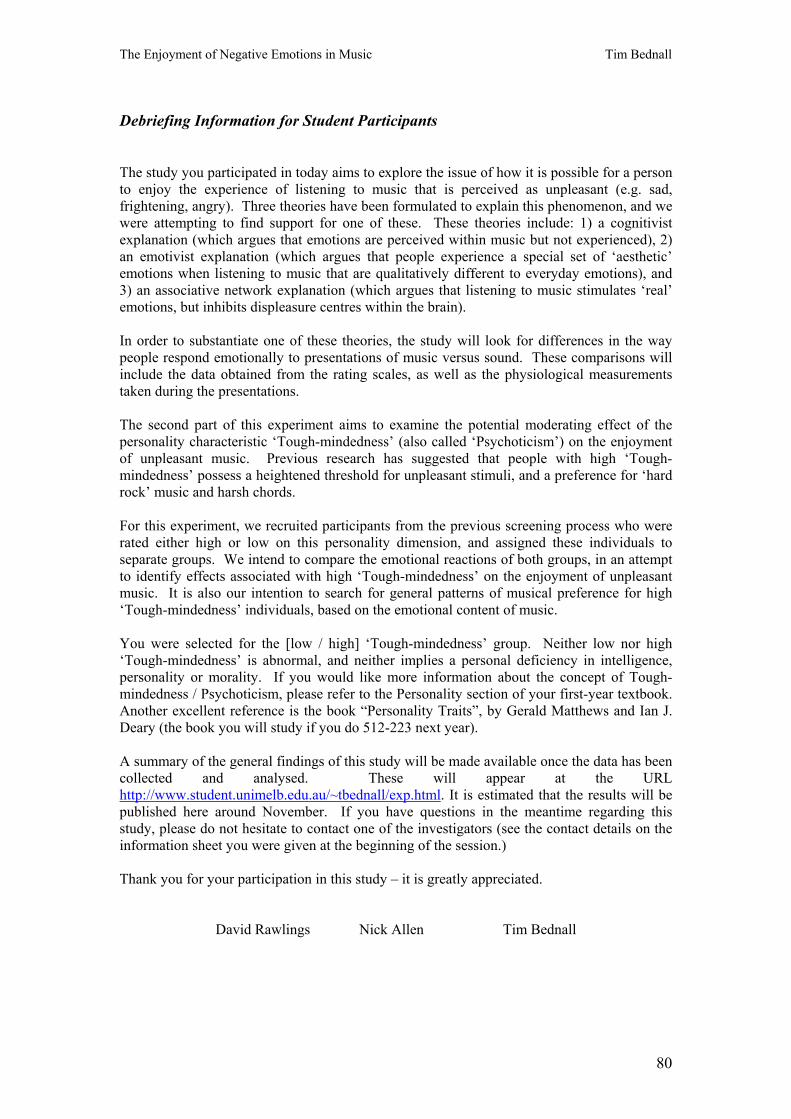
The Enjoyment of Negative Emotions in Music Tim Bednall
Debriefing Information for Student Participants
The study you participated in today aims to explore the issue of how it is possible for a person to enjoy the experience of listening to music that is perceived as unpleasant (e.g. sad, frightening, angry). Three theories have been formulated to explain this phenomenon, and we were attempting to find support for one of these. These theories include: 1) a cognitivist explanation (which argues that emotions are perceived within music but not experienced), 2) an emotivist explanation (which argues that people experience a special set of ‘aesthetic’ emotions when listening to music that are qualitatively different to everyday emotions), and 3) an associative network explanation (which argues that listening to music stimulates ‘real’ emotions, but inhibits displeasure centres within the brain). In order to substantiate one of these theories, the study will look for differences in the way people respond emotionally to presentations of music versus sound. These comparisons will include the data obtained from the rating scales, as well as the physiological measurements taken during the presentations. The second part of this experiment aims to examine the potential moderating effect of the personality characteristic ‘Tough-mindedness’ (also called ‘Psychoticism’) on the enjoyment of unpleasant music. Previous research has suggested that people with high ‘Tough-mindedness’ possess a heightened threshold for unpleasant stimuli, and a preference for ‘hard rock’ music and harsh chords. For this experiment, we recruited participants from the previous screening process who were rated either high or low on this personality dimension, and assigned these individuals to separate groups. We intend to compare the emotional reactions of both groups, in an attempt to identify effects associated with high ‘Tough-mindedness’ on the enjoyment of unpleasant music. It is also our intention to search for general patterns of musical preference for high ‘Tough-mindedness’ individuals, based on the emotional content of music. You were selected for the [low / high] ‘Tough-mindedness’ group. Neither low nor high ‘Tough-mindedness’ is abnormal, and neither implies a personal deficiency in intelligence, personality or morality. If you would like more information about the concept of Tough-mindedness / Psychoticism, please refer to the Personality section of your first-year textbook. Another excellent reference is the book “Personality Traits”, by Gerald Matthews and Ian J. Deary (the book you will study if you do 512-223 next year). A summary of the general findings of this study will be made available once the data has been collected and analysed. These will appear at the URL http://www.student.unimelb.edu.au/~tbednall/exp.html. It is estimated that the results will be published here around November. If you have questions in the meantime regarding this study, please do not hesitate to contact one of the investigators (see the contact details on the information sheet you were given at the beginning of the session.) Thank you for your participation in this study – it is greatly appreciated.
David Rawlings Nick Allen Tim Bednall
80

The Enjoyment of Negative Emotions in Music Tim Bednall
Appendix 4
Mean self-report ratings and physiology difference scores for each a priori valence/arousal category, in sound and
music conditions.
81
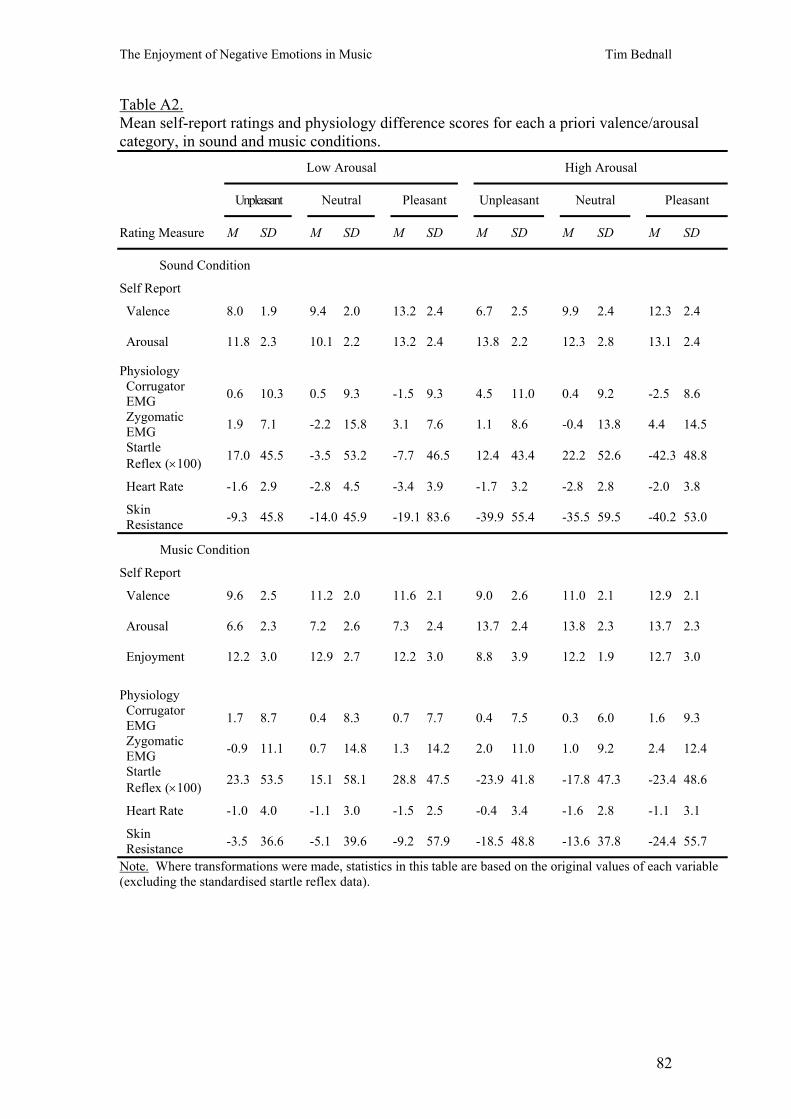
The Enjoyment of Negative Emotions in Music Tim Bednall
Table A2. Mean self-report ratings and physiology difference scores for each a priori valence/arousal category, in sound and music conditions.
Low Arousal High Arousal
Unpleasant Neutral Pleasant Unpleasant Neutral Pleasant
Rating Measure M SD M SD M SD M SD M SD M SD
Sound Condition
Self Report
Valence 8.0 1.9 9.4 2.0 13.2 2.4 6.7 2.5 9.9 2.4 12.3 2.4
Arousal 11.8 2.3 10.1 2.2 13.2 2.4 13.8 2.2 12.3 2.8 13.1 2.4
Physiology
Corrugator EMG
0.6 10.3 0.5 9.3 -1.5 9.3 4.5 11.0 0.4 9.2 -2.5 8.6
Zygomatic EMG
1.9 7.1 -2.2 15.8 3.1 7.6 1.1 8.6 -0.4 13.8 4.4 14.5
Startle Reflex (×100) 17.0 45.5 -3.5 53.2 -7.7 46.5 12.4 43.4 22.2 52.6 -42.3 48.8
Heart Rate -1.6 2.9 -2.8 4.5 -3.4 3.9 -1.7 3.2 -2.8 2.8 -2.0 3.8
Skin Resistance
-9.3 45.8 -14.0 45.9 -19.1 83.6 -39.9 55.4 -35.5 59.5 -40.2 53.0
Music Condition
Self Report
Valence 9.6 2.5 11.2 2.0 11.6 2.1 9.0 2.6 11.0 2.1 12.9 2.1
Arousal 6.6 2.3 7.2 2.6 7.3 2.4 13.7 2.4 13.8 2.3 13.7 2.3
Enjoyment 12.2 3.0 12.9 2.7 12.2 3.0 8.8 3.9 12.2 1.9 12.7 3.0
Physiology
Corrugator EMG
1.7 8.7 0.4 8.3 0.7 7.7 0.4 7.5 0.3 6.0 1.6 9.3
Zygomatic EMG
-0.9 11.1 0.7 14.8 1.3 14.2 2.0 11.0 1.0 9.2 2.4 12.4
Startle Reflex (×100)
23.3 53.5 15.1 58.1 28.8 47.5 -23.9 41.8 -17.8 47.3 -23.4 48.6
Heart Rate -1.0 4.0 -1.1 3.0 -1.5 2.5 -0.4 3.4 -1.6 2.8 -1.1 3.1
Skin Resistance
-3.5 36.6 -5.1 39.6 -9.2 57.9 -18.5 48.8 -13.6 37.8 -24.4 55.7
Note. Where transformations were made, statistics in this table are based on the original values of each variable (excluding the standardised startle reflex data).
82

The Enjoyment of Negative Emotions in Music Tim Bednall
Appendix 5
Mean Difference Scores (Self-Report and Physiology) between High-P and Low-P Participants for Sound
Presentations
83
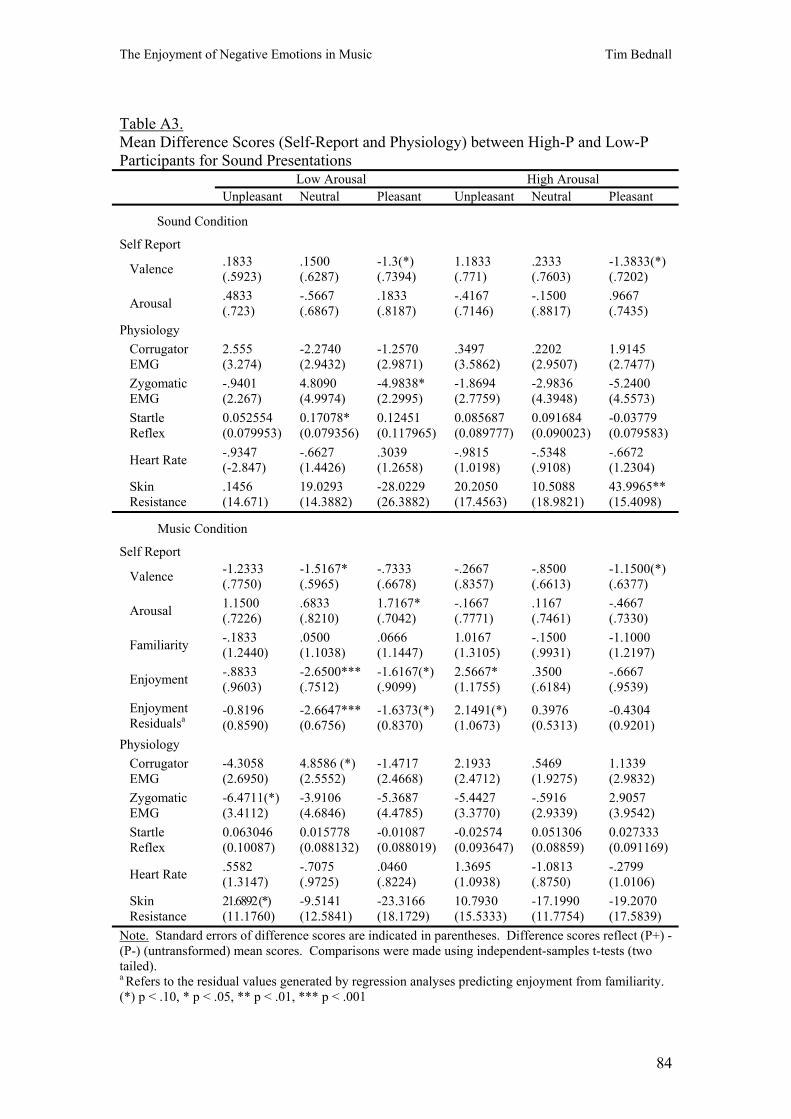
The Enjoyment of Negative Emotions in Music Tim Bednall
Table A3. Mean Difference Scores (Self-Report and Physiology) between High-P and Low-P Participants for Sound Presentations Low Arousal High Arousal Unpleasant Neutral Pleasant Unpleasant Neutral Pleasant
Sound Condition
Self Report
Valence .1833 (.5923)
.1500 (.6287)
-1.3(*) (.7394)
1.1833 (.771)
.2333 (.7603)
-1.3833(*) (.7202)
Arousal .4833 (.723)
-.5667 (.6867)
.1833 (.8187)
-.4167 (.7146)
-.1500 (.8817)
.9667 (.7435)
Physiology Corrugator EMG
2.555 (3.274)
-2.2740 (2.9432)
-1.2570 (2.9871)
.3497 (3.5862)
.2202 (2.9507)
1.9145 (2.7477)
Zygomatic EMG
-.9401 (2.267)
4.8090 (4.9974)
-4.9838* (2.2995)
-1.8694 (2.7759)
-2.9836 (4.3948)
-5.2400 (4.5573)
Startle Reflex
0.052554 (0.079953)
0.17078* (0.079356)
0.12451 (0.117965)
0.085687 (0.089777)
0.091684 (0.090023)
-0.03779 (0.079583)
Heart Rate -.9347 (-2.847)
-.6627 (1.4426)
.3039 (1.2658)
-.9815 (1.0198)
-.5348 (.9108)
-.6672 (1.2304)
Skin Resistance
.1456 (14.671)
19.0293 (14.3882)
-28.0229 (26.3882)
20.2050 (17.4563)
10.5088 (18.9821)
43.9965** (15.4098)
Music Condition
Self Report
Valence -1.2333 (.7750)
-1.5167* (.5965)
-.7333 (.6678)
-.2667 (.8357)
-.8500 (.6613)
-1.1500(*) (.6377)
Arousal 1.1500 (.7226)
.6833 (.8210)
1.7167* (.7042)
-.1667 (.7771)
.1167 (.7461)
-.4667 (.7330)
Familiarity -.1833 (1.2440)
.0500 (1.1038)
.0666 (1.1447)
1.0167 (1.3105)
-.1500 (.9931)
-1.1000 (1.2197)
Enjoyment -.8833 (.9603)
-2.6500*** (.7512)
-1.6167(*) (.9099)
2.5667* (1.1755)
.3500 (.6184)
-.6667 (.9539)
Enjoyment Residualsa
-0.8196 (0.8590)
-2.6647*** (0.6756)
-1.6373(*) (0.8370)
2.1491(*) (1.0673) (0.5313)
-0.4304 (0.9201)
Physiology Corrugator EMG
-4.3058 (2.6950)
4.8586 (*) (2.5552)
-1.4717 (2.4668)
2.1933 (2.4712)
.5469 (1.9275)
1.1339 (2.9832)
Zygomatic EMG
-6.4711(*) (3.4112)
-3.9106 (4.6846)
-5.3687 (4.4785)
-5.4427 (3.3770)
-.5916 (2.9339)
2.9057 (3.9542)
Startle Reflex
0.063046 (0.10087)
0.015778 (0.088132)
-0.01087 (0.088019)
-0.02574 (0.093647)
0.051306 (0.08859)
0.027333 (0.091169)
Heart Rate .5582 (1.3147)
-.7075 (.9725)
.0460 (.8224)
1.3695 (1.0938)
-1.0813 (.8750)
-.2799 (1.0106)
Skin Resistance
21.6892 (*) (11.1760)
-9.5141 (12.5841)
-23.3166 (18.1729)
10.7930 (15.5333)
-17.1990 (11.7754)
-19.2070 (17.5839)
Note. Standard errors of difference scores are indicated in parentheses. Difference scores reflect (P+) - (P-) (untransformed) mean scores. Comparisons were made using independent-samples t-tests (two tailed). a Refers to the residual values generated by regression analyses predicting enjoyment from familiarity.
(*) p < .10, * p < .05, ** p < .01, *** p < .001
0.3976
84

The Enjoyment of Negative Emotions in Music Tim Bednall
Appendix 6
Mean self-report and physiology difference scores for music, in empirical enjoyment categories
85

The Enjoyment of Negative Emotions in Music Tim Bednall
Table A4. Mean self-report and physiology difference scores for music, in empirical enjoyment categories Low Enjoyment Medium Enjoyment High Enjoyment M SD M SD M SD Self Report
Valence 10.2 1.8 10.7 1.9 11.7 1.6
Arousal 12.8 2.0 9.0 1.5 9.4 1.8
Enjoyment 9.8 2.7 12.1 2.5 13.7 2.1
Physiology
Corrugator EMG
0.0 5.1 1.7 5.4 1.0 5.1
Zygomatic EMG
2.0 9.4 -0.7 8.6 1.9 8.2
Startle Reflex (×100)
-25.0 34.0 29.0 34.6 -4.1 33.7
Heart Rate -1.0 2.6 -1.0 2.4 -1.3 1.9
Skin Resistance
-14.0 35.4 -8.8 43.4 -14.3 29.7
86

The Enjoyment of Negative Emotions in Music Tim Bednall
Appendix 7
Correlations between reported enjoyment and other self-report ratings for each a priori music category
87
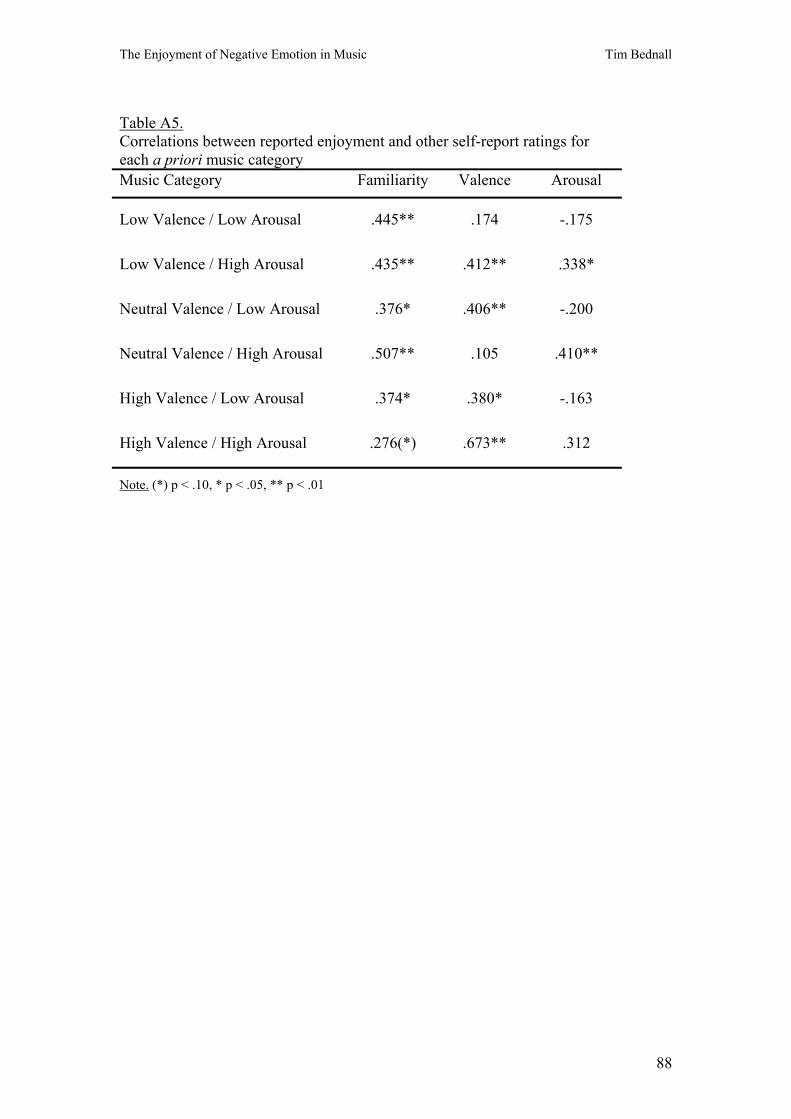
The Enjoyment of Negative Emotion in Music Tim Bednall
Table A5. Correlations between reported enjoyment and other self-report ratings for each a priori music category Music Category Familiarity Valence Arousal
Low Valence / Low Arousal
.445** .174 -.175
Low Valence / High Arousal
.435** .412** .338*
Neutral Valence / Low Arousal
.376* .406** -.200
Neutral Valence / High Arousal
.507** .105 .410**
High Valence / Low Arousal
.374* .380* -.163
High Valence / High Arousal
.276(*) .673** .312
Note. (*) p < .10, * p < .05, ** p < .01
88

Minerva Access is the Institutional Repository of The University of Melbourne
Author/s:
Bednall, Timothy Colin
Title:
Tough-mindedness and the enjoyment of negative emotions in music: a psychophysiological
investigation
Date:
2001
Citation:
Bednall, T. C. (2001). Tough-mindedness and the enjoyment of negative emotions in music:
a psychophysiological investigation . Honours thesis, School of Behavioural Science, The
University of Melbourne.
Publication Status:
Unpublished
Persistent Link:
http://hdl.handle.net/11343/38089
File Description:
Tough-mindedness and the enjoyment of negative emotions in music: a psychophysiological
investigation
Terms and Conditions:
Terms and Conditions: Copyright in works deposited in Minerva Access is retained by the
copyright owner. The work may not be altered without permission from the copyright owner.
Readers may only download, print and save electronic copies of whole works for their own
personal non-commercial use. Any use that exceeds these limits requires permission from
the copyright owner. Attribution is essential when quoting or paraphrasing from these works.


![1 Katharine Bailey Evaluating international-mindedness in a school context Towards a definition of ‘international-mindedness’ [‘global consciousness’]](https://img.pdfslide.us/doc/110x75/56649ddb5503460f94ad1fa5/1-katharine-bailey-evaluating-international-mindedness-in-a-school-context.jpg)