Embed Size (px)
Citation preview
TOTS to Tweens Study: Evaluating the Dental Health
Status of NW Tribal Children Age 11-13 Years
Northwest Tribal Dental Support Center MeetingMay 16, 2019
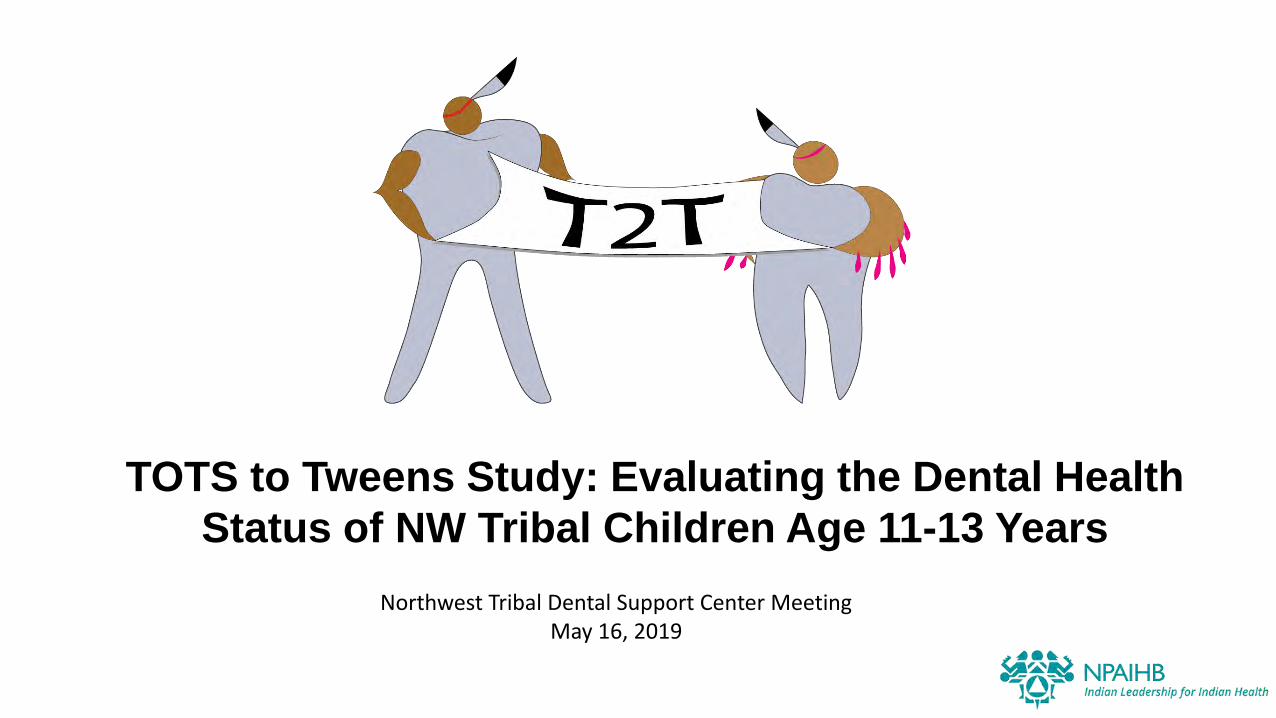
Tam se ne snat
Nicole Smith
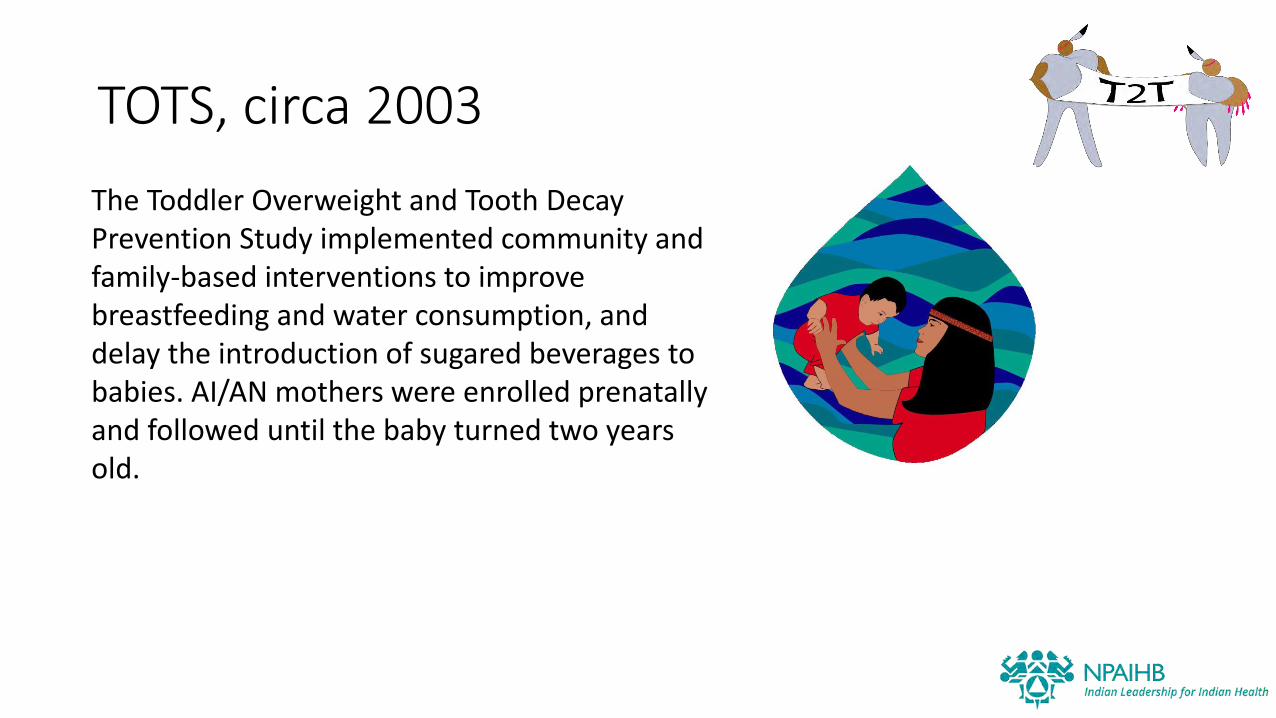
TOTS, circa 2003
The Toddler Overweight and Tooth Decay Prevention Study implemented community and family-based interventions to improve breastfeeding and water consumption, and delay the introduction of sugared beverages to babies. AI/AN mothers were enrolled prenatally and followed until the baby turned two years old.
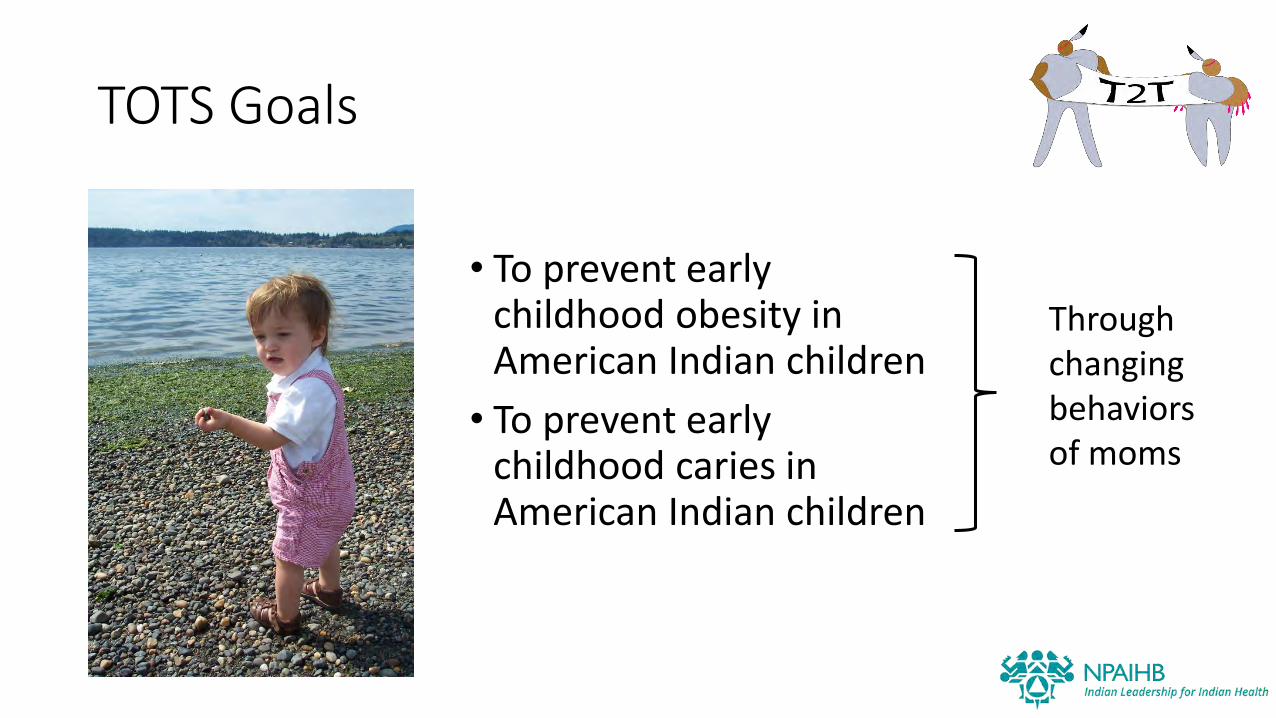
TOTS Goals
• To prevent early childhood obesity in American Indian children
• To prevent early childhood caries in American Indian children
Through changing behaviors of moms
Cohort Study Design
• The intervention cohort was children born in three communities during 12 months; expectant mothers were identified through prenatal visits and recruited by tribal coordinators
• The local comparison cohorts were children in those communities who were 18–30 months at study start
• A control longitudinal cohort consisted of annual samples of children aged 18–30 months in a fourth community, supplying secular trends
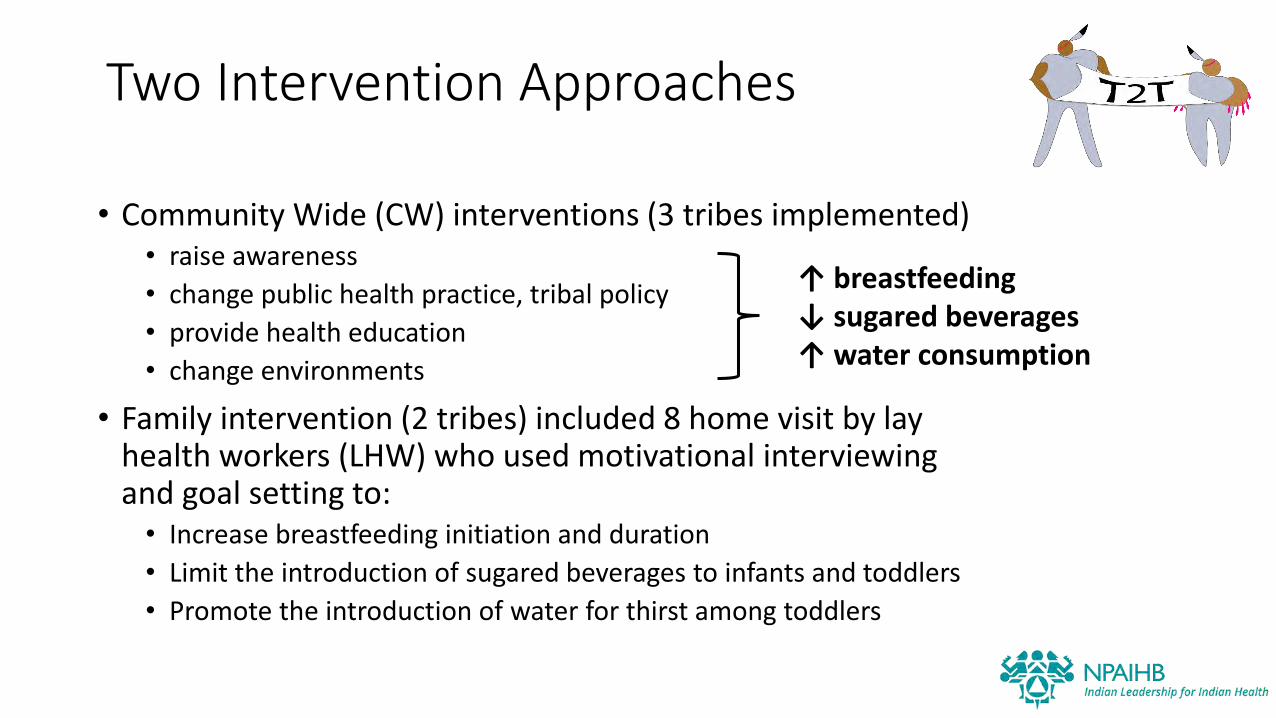
Two Intervention Approaches
• Community Wide (CW) interventions (3 tribes implemented)• raise awareness
• change public health practice, tribal policy
• provide health education
• change environments
• Family intervention (2 tribes) included 8 home visit by lay health workers (LHW) who used motivational interviewing and goal setting to:
• Increase breastfeeding initiation and duration
• Limit the introduction of sugared beverages to infants and toddlers
• Promote the introduction of water for thirst among toddlers
↑ breastfeeding↓ sugared beverages↑ water consumption
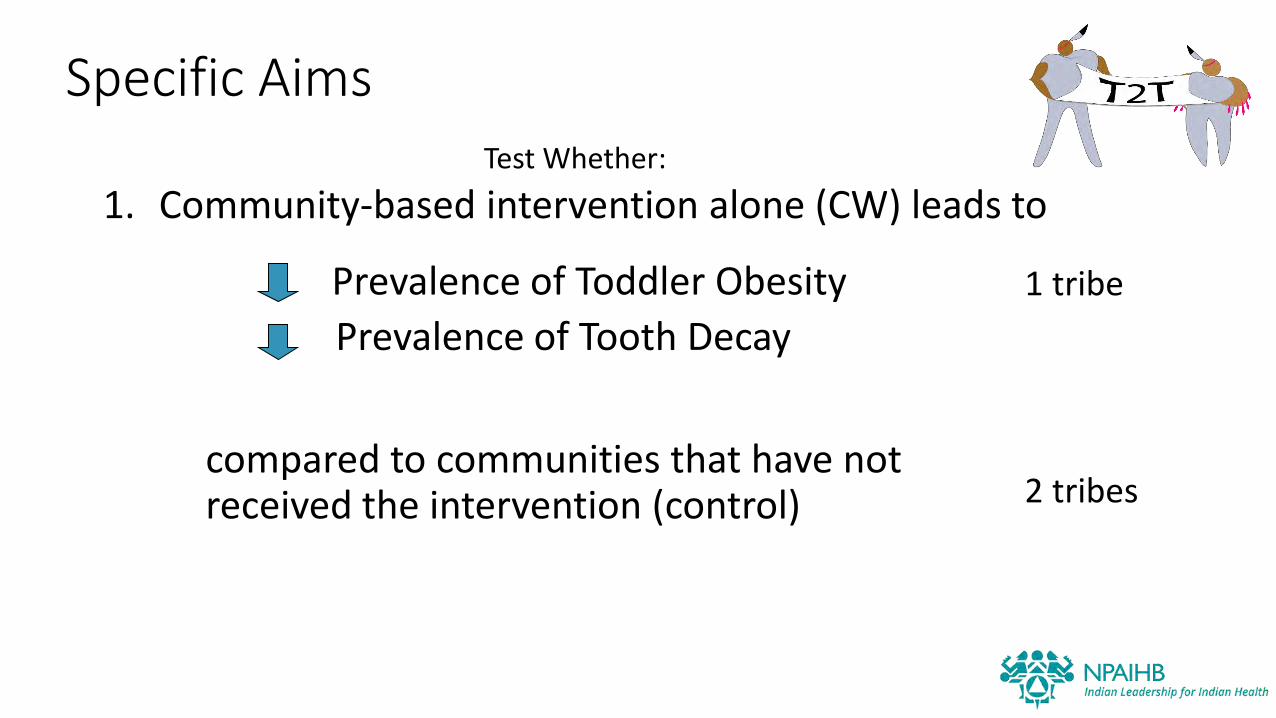
Specific AimsTest Whether:
1. Community-based intervention alone (CW) leads to
Prevalence of Toddler Obesity
Prevalence of Tooth Decay
compared to communities that have not received the intervention (control)
1 tribe
2 tribes
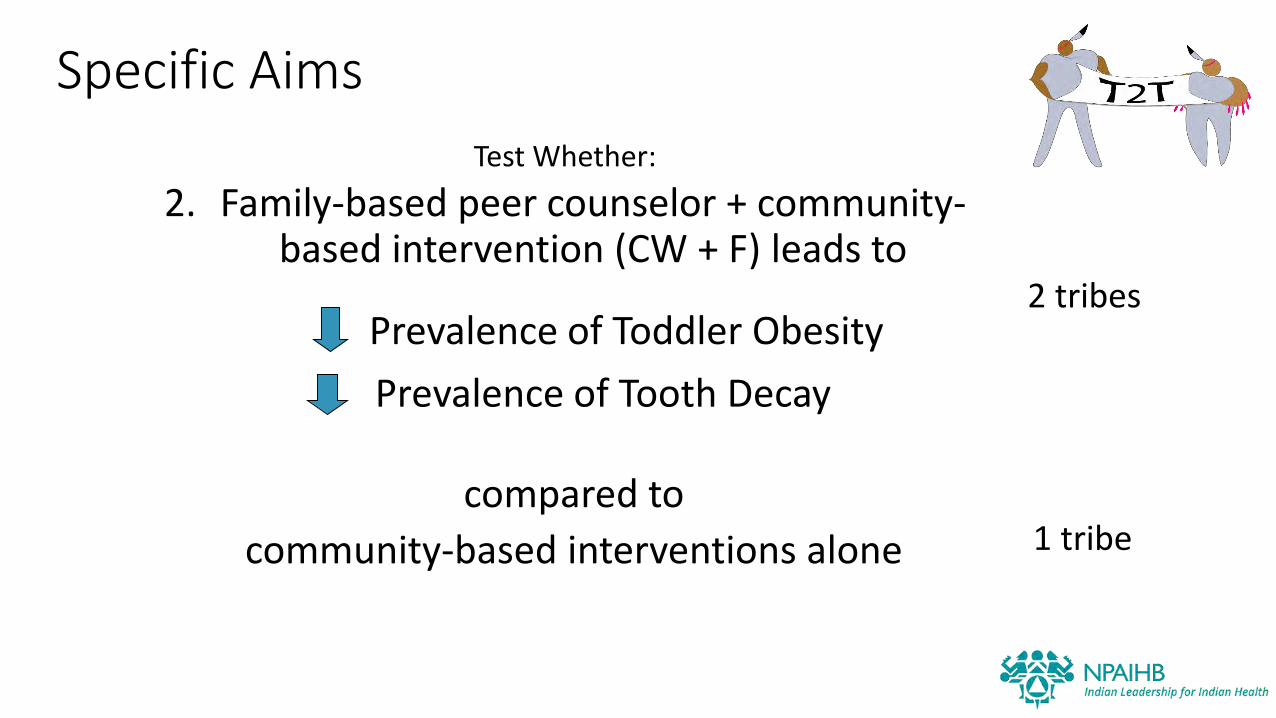
Specific Aims
Test Whether:
2. Family-based peer counselor + community-based intervention (CW + F) leads to
Prevalence of Toddler Obesity
Prevalence of Tooth Decay
compared to
community-based interventions alone
2 tribes
1 tribe
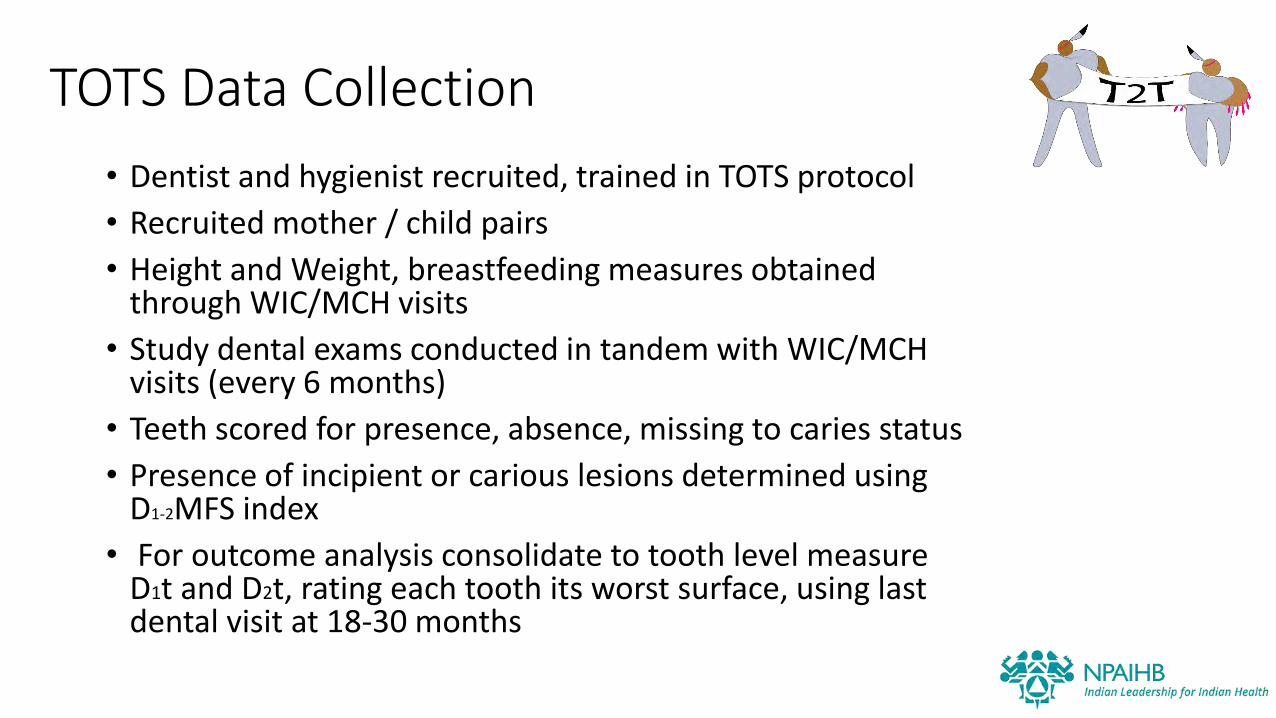
TOTS Data Collection
• Dentist and hygienist recruited, trained in TOTS protocol
• Recruited mother / child pairs
• Height and Weight, breastfeeding measures obtained through WIC/MCH visits
• Study dental exams conducted in tandem with WIC/MCH visits (every 6 months)
• Teeth scored for presence, absence, missing to caries status
• Presence of incipient or carious lesions determined using D1-2MFS index
• For outcome analysis consolidate to tooth level measure D1t and D2t, rating each tooth its worst surface, using last dental visit at 18-30 months
Community Interventions Implemented
• Resolutions passed to limit purchasing sugared-beverages for community events
• Strategic placement water in or by vending machines• Subsidizing the sale of water• Workplace policies to allow longer breaks to pump• Peer Mom gathering to discuss breastfeeding• Advocacy at local hospitals for mothers intending to breastfeed• Creation of Tribal workplace breastfeeding rooms• Community-wide baby showers• Collaboration with daycares• Local media
Outcomes
• Breastfeeding rates higher by 14% (CW), 15% (CW+F) at 6 months than national AI rates
• Breastfeeding rates comparable at 12 months
• Parents expressed confidence in ability to curtail family consumption of sugared beverages
• BMI Z scores at 24 months increased in all three intervention tribes
• BMI Z scores increased less in CW+F Tribes
• Difference in height and weight for age not significant
• Simple intervention can mitigate rapid increase in BMI without compromising toddler growth

TOTS Impact Evaluation
Dental Results
• Overall levels of disease were high
• Significant secular rises for both incipient (D1t) and carious lesions (D2t) in the control communities
• In terms of presence of D1t or D2t, there were statistically significant downward intervention effects in both CW and CW + F Tribes
• Children in intervention communities had fewer detectable carious lesion and those who developed carious lesions had incipient caries more often than cavitated decay

TOTS Dental Results
Community A Community B Community C Community D
Pre-intervention sample
d1t 0.448 (0.506) 0.128 (0.339) 0.656 (0.483) 0.444 (0.511)
d2t 0.414 (0.501) 0.128 (0.339) 0.531 (0.507) 0.278 0.461)
Post-intervention sample
d1t 0.340 (0.479) 0.297 (0.463) 0.420 (0.499) 0.595 (0.497)
d2t 0.234 (0.428) 0.000 (0.000) 0.340 (0.479) 0.429 (0.501)
Table 3Mean (SD) of fraction of affected toddlers in each community and time period

TOTS Dental Results
Community ACW + F
Community BCW
Community CCW + F
Community DControl
Pre-intervention sample
Incipient decay d1t 0.448 (0.506) 0.128 (0.339) 0.656 (0.483) 0.444 (0.511)
Cavitated decay d2t 0.414 (0.501) 0.128 (0.339) 0.531 (0.507) 0.278 0.461)
Post-intervention sample
Less decay Less decay Less decay Increase in decay
Incipient decay d1t 0.340 (0.479) 0.297 (0.463) 0.420 (0.499) 0.595 (0.497)
Cavitated decay d2t 0.234 (0.428) 0.000 (0.000) 0.340 (0.479) 0.429 (0.501)
Table 3Mean (SD) of fraction of affected toddlers in each community and time period
TOTS Goals Revisited
• Did we prevent early childhood obesity in American Indian children? –No, but we staved off an increase
• Did we prevent early childhood caries in American Indian children? – Yes!
• Did we change behaviors of moms? – Yes, ↑ breastfeeding; - Yes, ↓introduction of sugared beverages
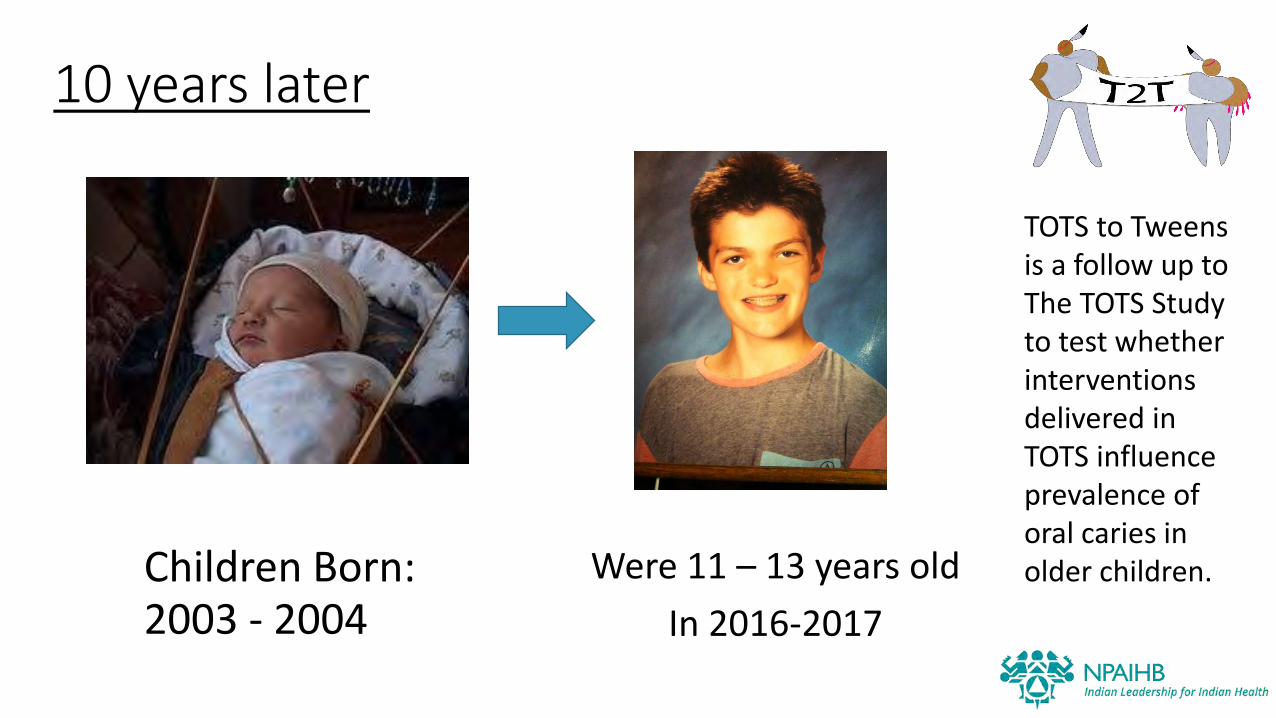
10 years later
Children Born:2003 - 2004
Were 11 – 13 years old
In 2016-2017
TOTS to Tweens is a follow up to The TOTS Study to test whether interventions delivered in TOTS influence prevalence of oral caries in older children.
They’re Back….
At the Helm
• Tom Becker, MD, PhD, Co-PI
• Tam Lutz (Lummi Nation)MPH, MHA, Co-PI
Co-Investigators – Experts in Oral Health
• Gerardo Maupomé, BDS, MSc, DDPH, PhD, Maxine Brings Him Back Janis, MPH, RDH
• Eli Schwarz, DDS, MPH, PhD
Co- Investigators – Experts in Biostatistics
• Jodi Lapidus, PhD
• Nicole Smith, MPH
Project Support with history of serving Tribes
• Candice Jimenez (Warm Springs), MPH, GRA
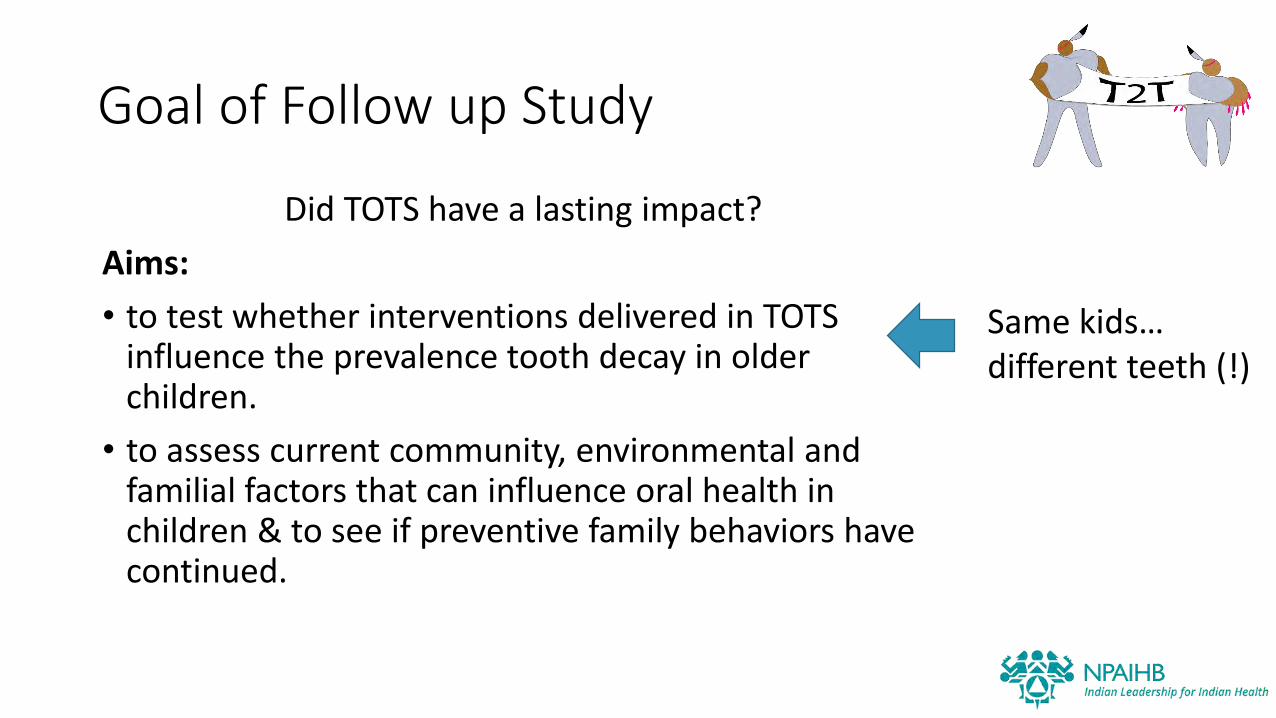
Goal of Follow up Study
Did TOTS have a lasting impact?
Aims:
• to test whether interventions delivered in TOTS influence the prevalence tooth decay in older children.
• to assess current community, environmental and familial factors that can influence oral health in children & to see if preventive family behaviors have continued.
Same kids…different teeth (!)
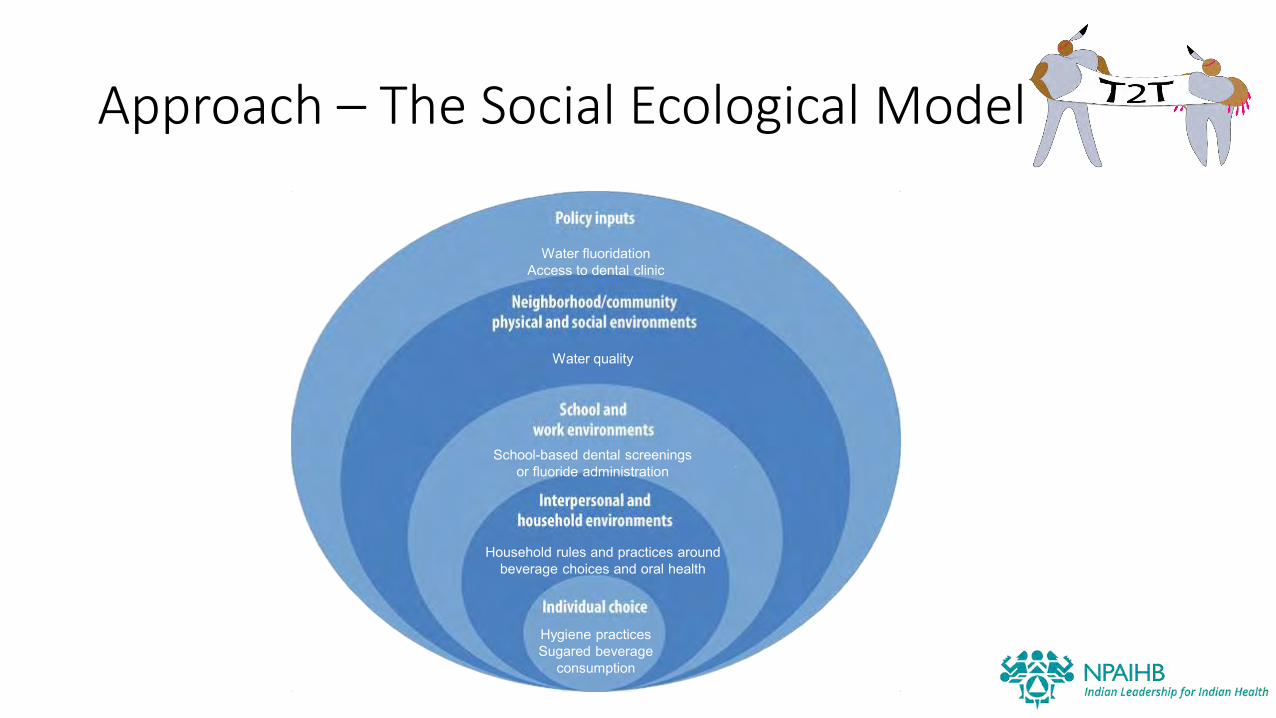
Approach – The Social Ecological Model
Hygiene practices Sugared beverage
consumption
Water fluoridationAccess to dental clinic
School-based dental screenings or fluoride administration
Water quality
Household rules and practices around beverage choices and oral health
Hypotheses
1. Children age 10.5-12.5 who received the TOTS intervention will have a 25% lower DMFT (decayed, missing, or filled teeth) score than children in the non-intervention sites
2. TOTS children will have less decay than fellow tribal member children who did not participate in TOTS
3. Children with the least decay at age 2 will have the least decay in the follow-up screening
4. Mothers/caregivers who participated in TOTS will have more favorable knowledge, attitudes, and behaviors related to oral health than those who did not receive TOTS
Methods
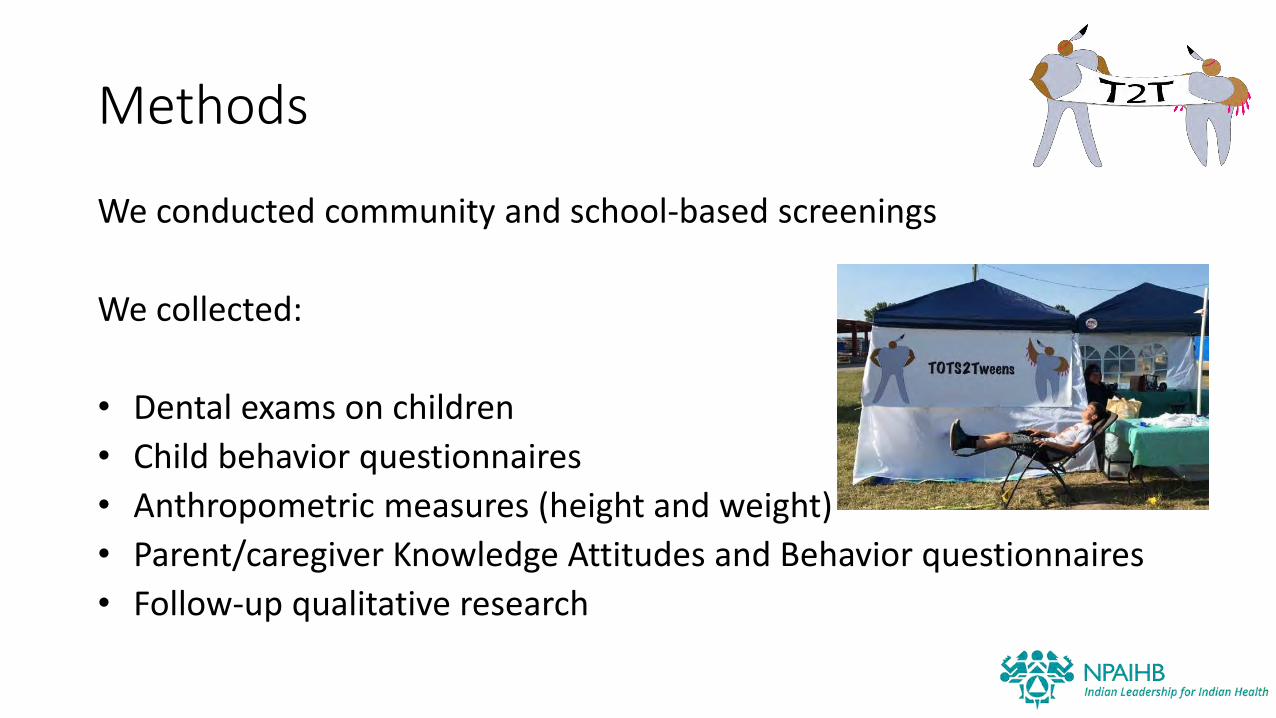
We conducted community and school-based screenings
We collected:
• Dental exams on children
• Child behavior questionnaires
• Anthropometric measures (height and weight)
• Parent/caregiver Knowledge Attitudes and Behavior questionnaires
• Follow-up qualitative research

Recruitment & Consent Methods
• Tribal site coordinators used TOTS enrollment lists to contact parents/guardians for consent for the child to participate
• At data collection, children who had participated in the TOTS study were age 11-13 years
• Coordinators used school enrollment lists to recruit children age 11-13 who did not participate in the TOTS study
• At the data collection event, we verified parental consent and obtained child’s assent to have teeth examined, measure height and weight and ask the child questions.
Examiner Methods
• Two dentists and one dental hygienist were trained prior to data collection and calibrated for agreement at the first event.
• Two examiners collected data for TOTS
• We adapted the World Health Organization (WHO) oral health assessment form for children and collected tooth-level data for both primary and secondary teeth.
• A tooth was scored as unerupted, sound, carries, filled (w/caries), filled (no caries), missing, sealed, or fixed dental prosthesis.
• In cases of severe decay, we used the PUFA index to record presence of pulpal involvement (P), ulceration (U), fistula (F), and abscess (A).

Child Questionnaire
• We measured each child’s height and weight and administered a questionnaire, adapted from WHO Oral Health Questionnaire for Children.
• We asked about hygiene practices, mouth pain, tobacco use, and beverage consumption.
• Collected on tablets via Epi Info app
Parent KAB Questionnaire
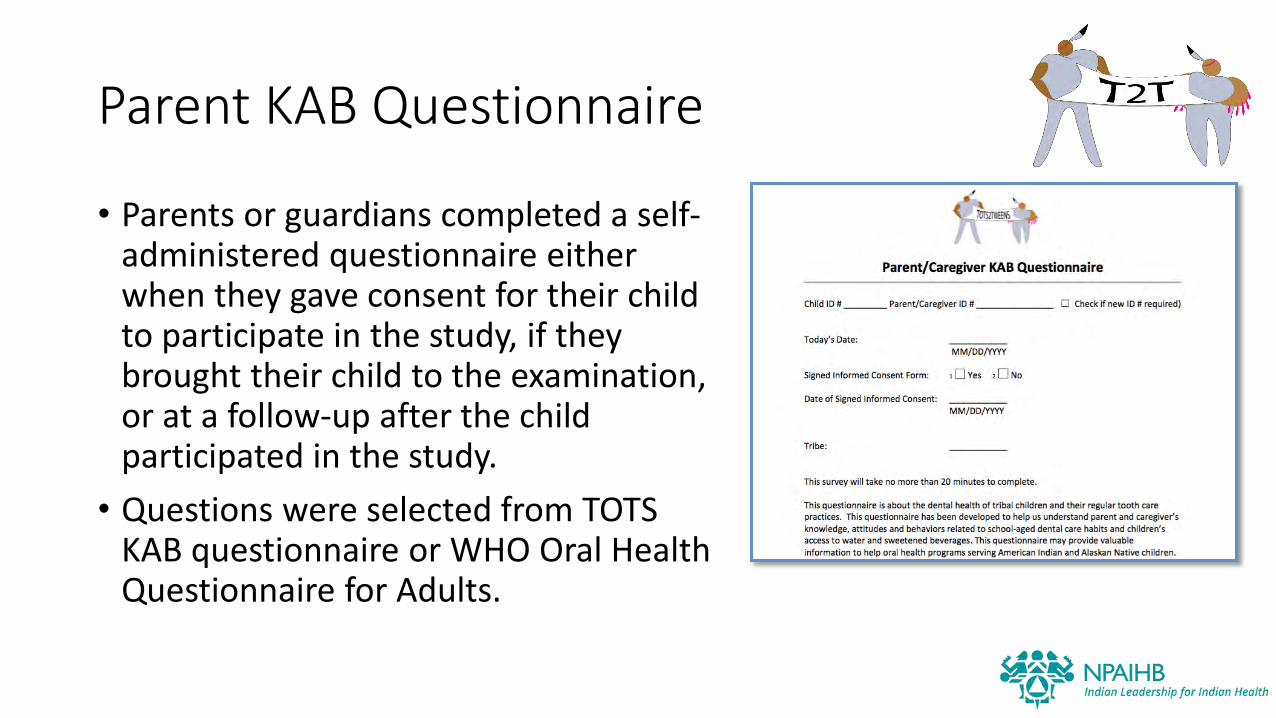
• Parents or guardians completed a self-administered questionnaire either when they gave consent for their child to participate in the study, if they brought their child to the examination, or at a follow-up after the child participated in the study.
• Questions were selected from TOTS KAB questionnaire or WHO Oral Health Questionnaire for Adults.
Statistical Methods
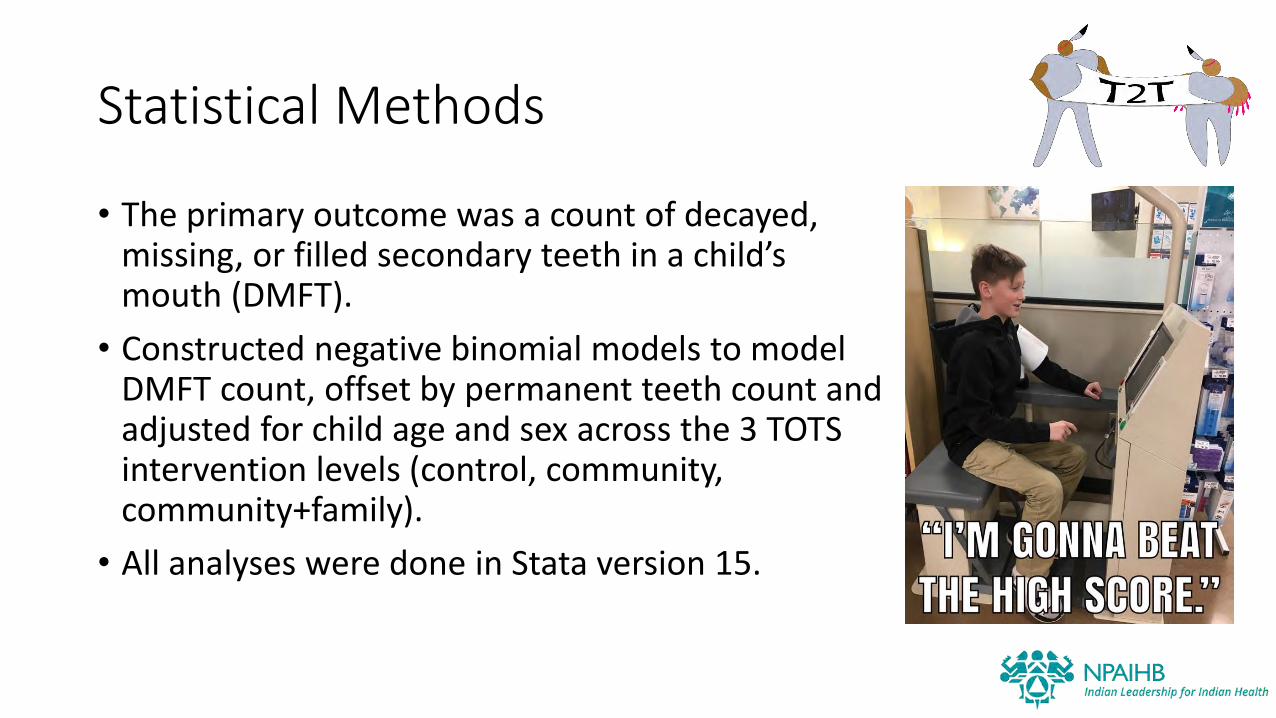
• The primary outcome was a count of decayed, missing, or filled secondary teeth in a child’s mouth (DMFT).
• Constructed negative binomial models to model DMFT count, offset by permanent teeth count and adjusted for child age and sex across the 3 TOTS intervention levels (control, community, community+family).
• All analyses were done in Stata version 15.
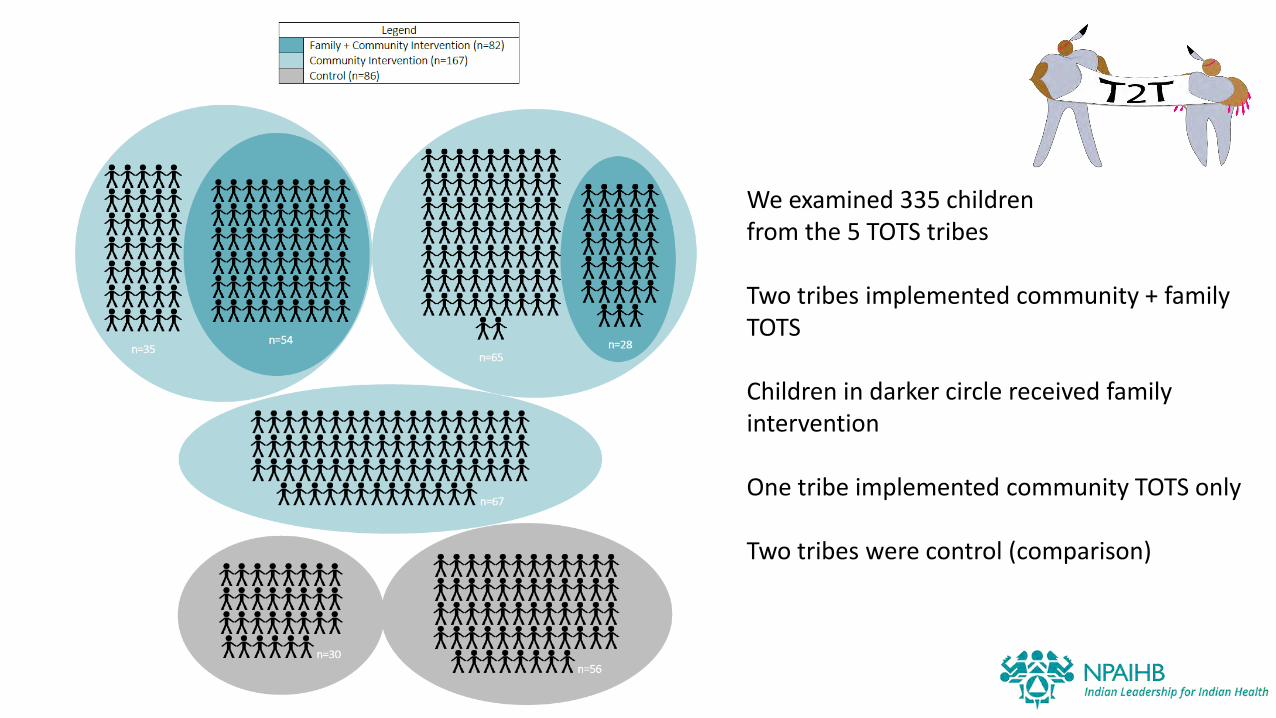
We examined 335 children from the 5 TOTS tribes
Two tribes implemented community + family TOTS
Children in darker circle received family intervention
One tribe implemented community TOTS only
Two tribes were control (comparison)
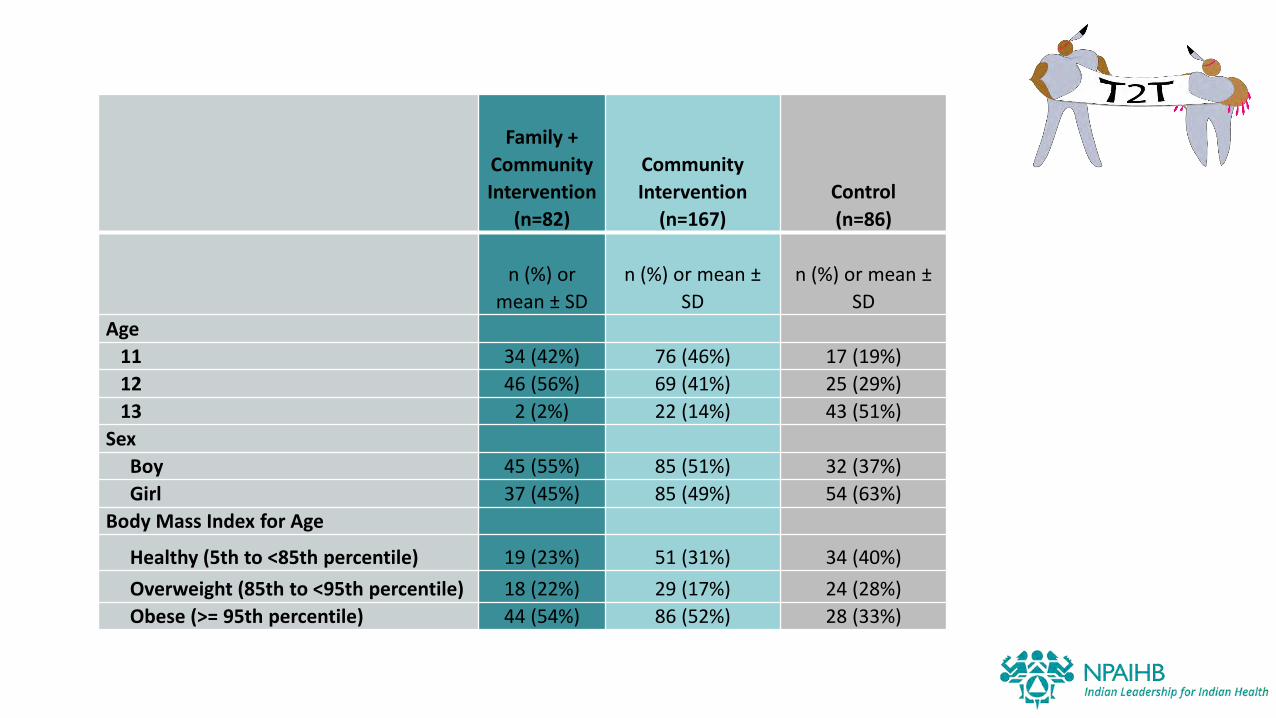
Family +
Community
Intervention
(n=82)
Community
Intervention
(n=167)
Control
(n=86)
n (%) or
mean ± SD
n (%) or mean ±
SD
n (%) or mean ±
SD
Age
11 34 (42%) 76 (46%) 17 (19%)
12 46 (56%) 69 (41%) 25 (29%)
13 2 (2%) 22 (14%) 43 (51%)
Sex
Boy 45 (55%) 85 (51%) 32 (37%)
Girl 37 (45%) 85 (49%) 54 (63%)
Body Mass Index for Age
Healthy (5th to <85th percentile) 19 (23%) 51 (31%) 34 (40%)
Overweight (85th to <95th percentile) 18 (22%) 29 (17%) 24 (28%)
Obese (>= 95th percentile) 44 (54%) 86 (52%) 28 (33%)
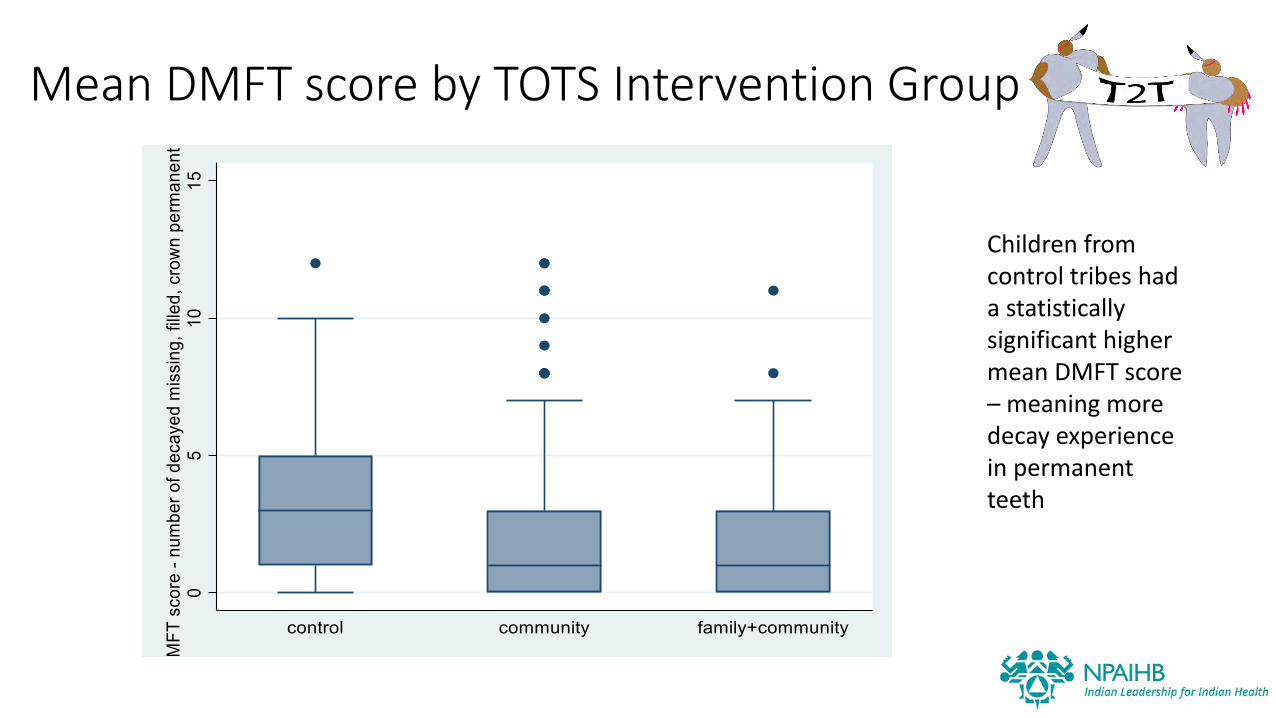
Mean DMFT score by TOTS Intervention Group
Children from control tribes had a statistically significant higher mean DMFT score – meaning more decay experience in permanent teeth
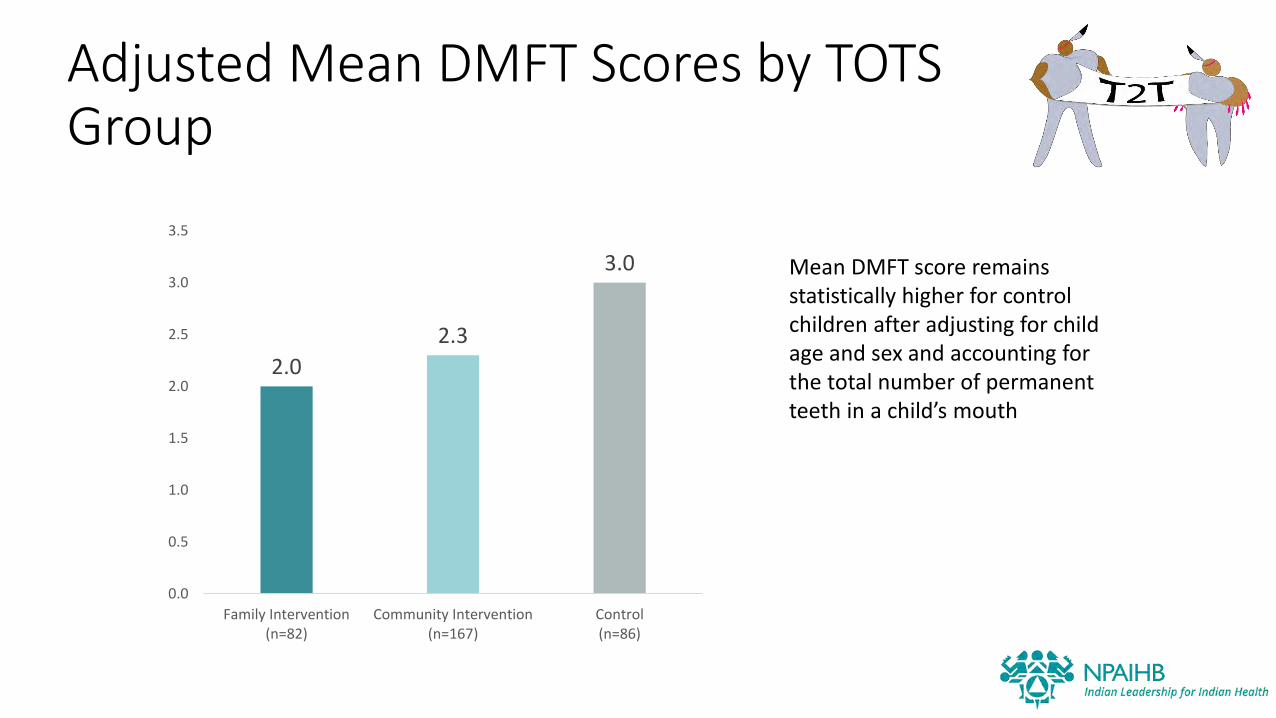
Adjusted Mean DMFT Scores by TOTS Group
2.0
2.3
3.0
0.0
0.5
1.0
1.5
2.0
2.5
3.0
3.5
Family Intervention(n=82)
Community Intervention(n=167)
Control(n=86)
Mean DMFT score remains statistically higher for control children after adjusting for child age and sex and accounting for the total number of permanent teeth in a child’s mouth

0.25 0.50 0.75 1.00 1.25
H1: Children who received the TOTS intervention will have a 25% lower DMFT score than children in the non-intervention sites
RR 95% CI p-valueTOTS Group
Community (vs control) 0.75 (0.55,1.02) 0.071Community + family (vs control) 0.67 (0.46,0.96) 0.030
DMFT risk by TOTS intervention group, adjusted for child age and sex and accounting for permanent teeth count
Compared to control, community intervention kids had less risk of decay. This was marginally significant.
C+F children had significantly less risk of decay than control children.
Results are similar when we look at mixed dentition.
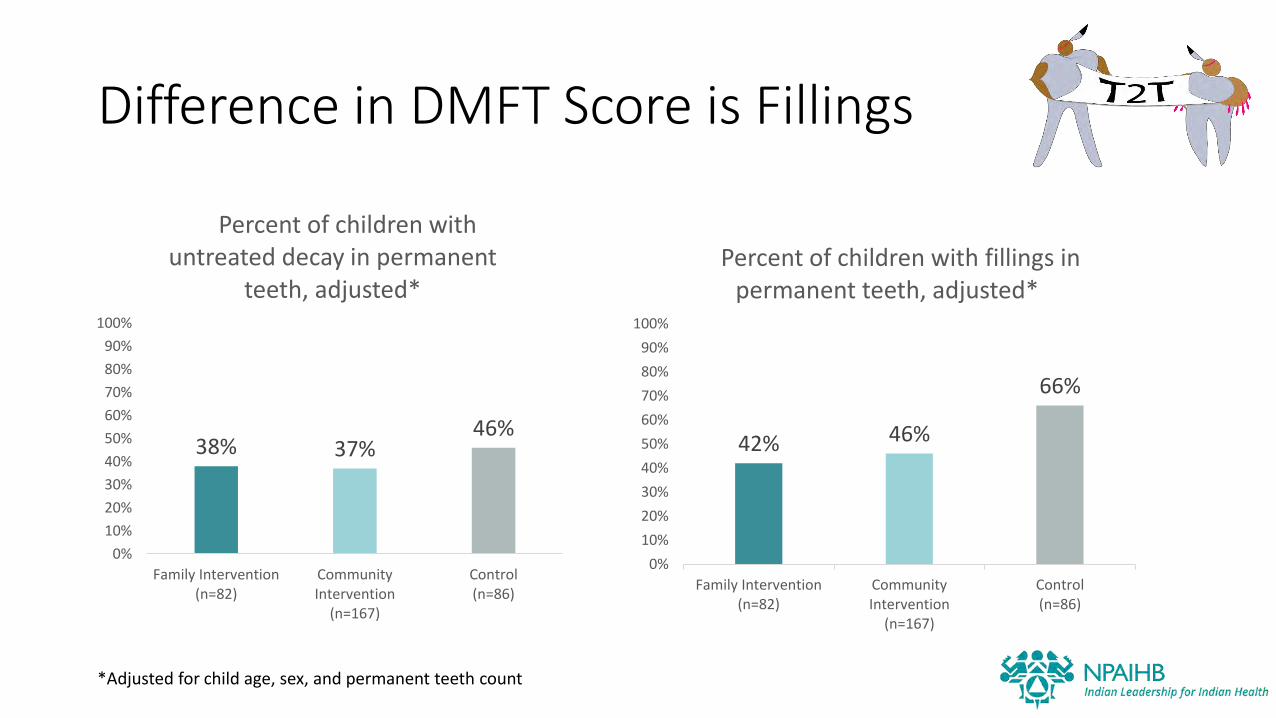
Difference in DMFT Score is Fillings
38% 37%46%
0%
10%
20%
30%
40%
50%
60%
70%
80%
90%
100%
Family Intervention(n=82)
CommunityIntervention
(n=167)
Control(n=86)
Percent of children with untreated decay in permanent
teeth, adjusted*
42% 46%
66%
0%
10%
20%
30%
40%
50%
60%
70%
80%
90%
100%
Family Intervention(n=82)
CommunityIntervention
(n=167)
Control(n=86)
Percent of children with fillings in permanent teeth, adjusted*
*Adjusted for child age, sex, and permanent teeth count
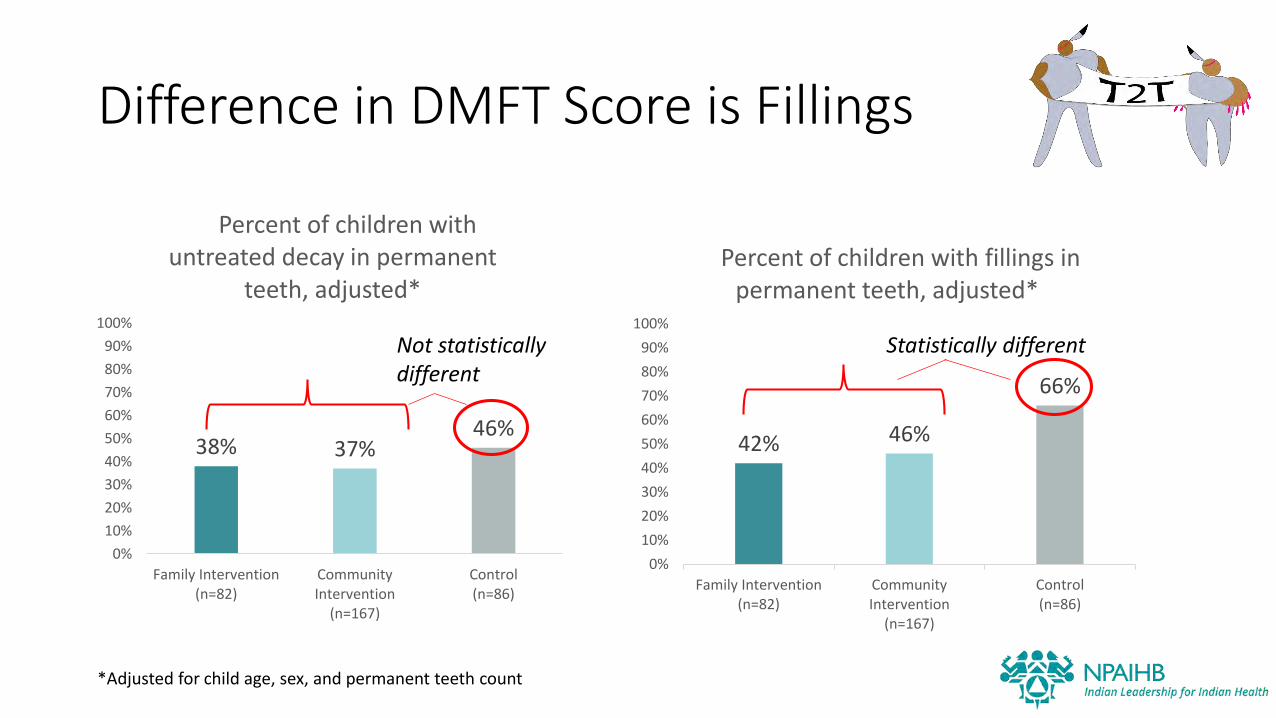
Not statistically different
Statistically different
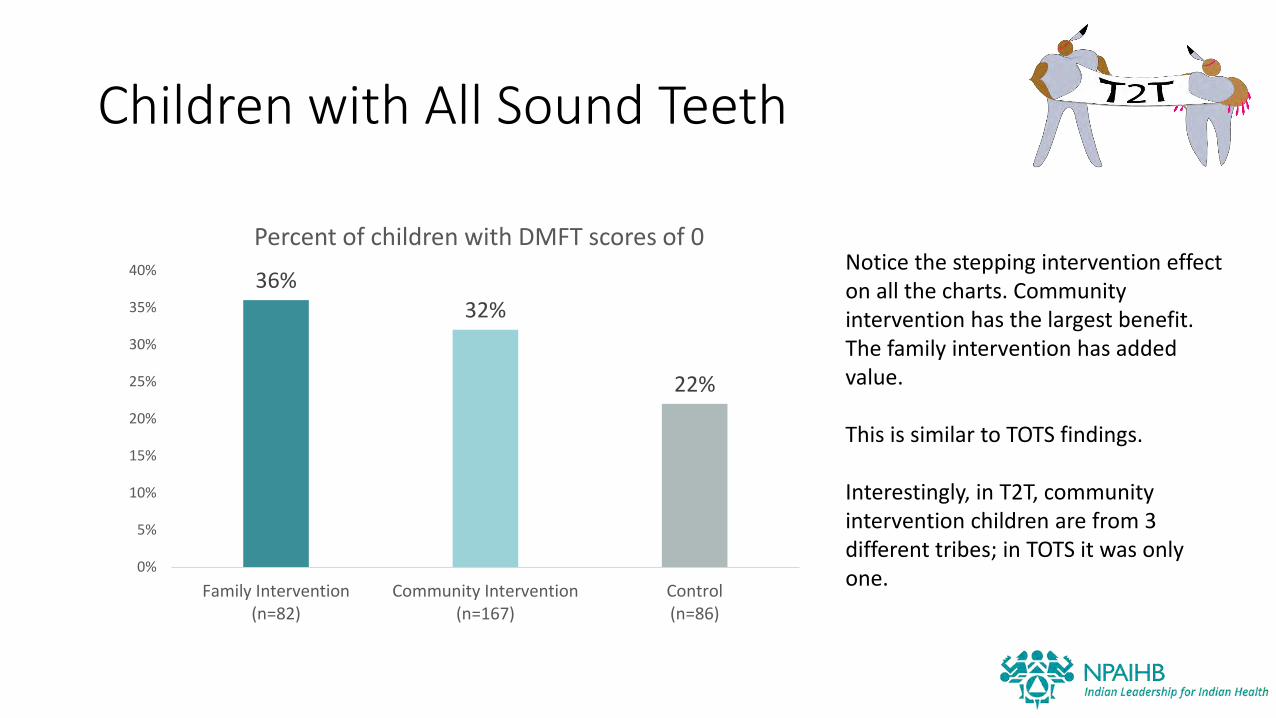
Children with All Sound Teeth
36%32%
22%
0%
5%
10%
15%
20%
25%
30%
35%
40%
Family Intervention(n=82)
Community Intervention(n=167)
Control(n=86)
Percent of children with DMFT scores of 0Notice the stepping intervention effect on all the charts. Community intervention has the largest benefit. The family intervention has added value.
This is similar to TOTS findings.
Interestingly, in T2T, community intervention children are from 3 different tribes; in TOTS it was only one.

Sealants
74% 77%69%
0%
10%
20%
30%
40%
50%
60%
70%
80%
90%
100%
Family Intervention(n=82)
CommunityIntervention
(n=167)
Control(n=86)
Percent of children with any sealed permanent teeth
Most children had one or more sealants on permanent teeth
Percent of children with any sealants on permanent teeth was not different by TOTS group
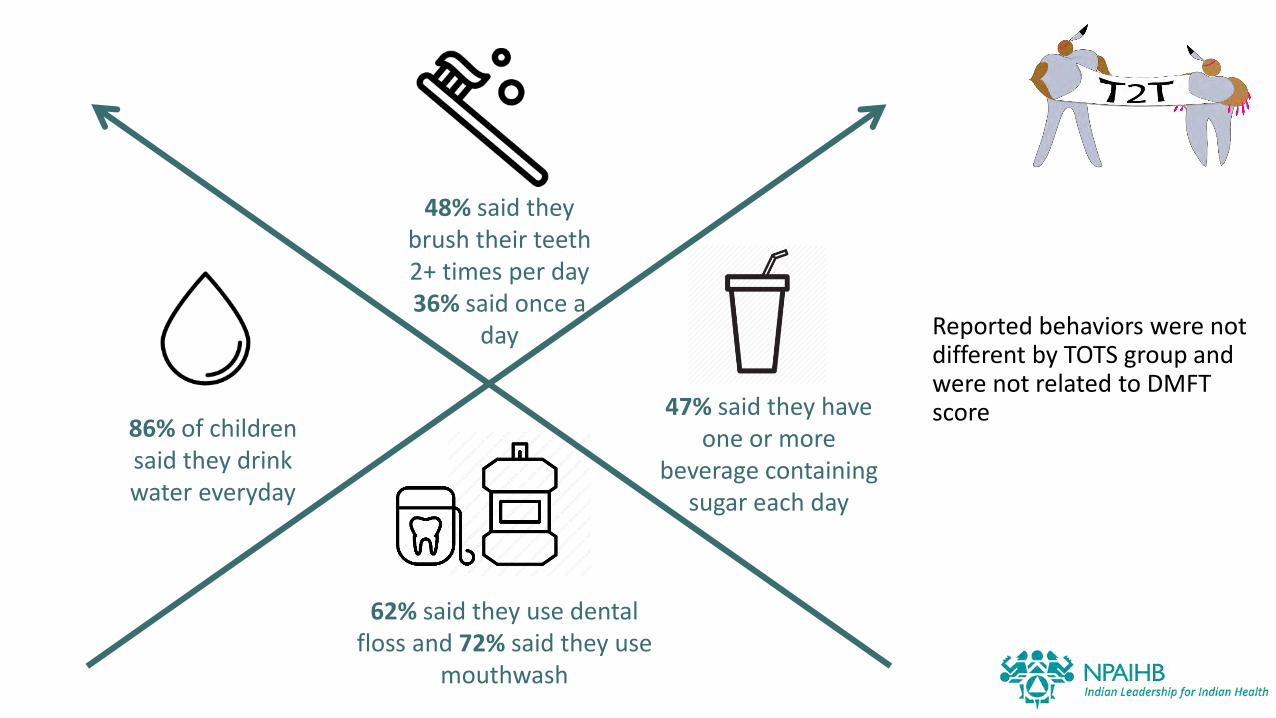
Reported behaviors were not different by TOTS group and were not related to DMFT score
48% said they brush their teeth 2+ times per day36% said once a
day
62% said they use dental floss and 72% said they use
mouthwash
86% of children said they drink water everyday
47% said they have one or more
beverage containing sugar each day
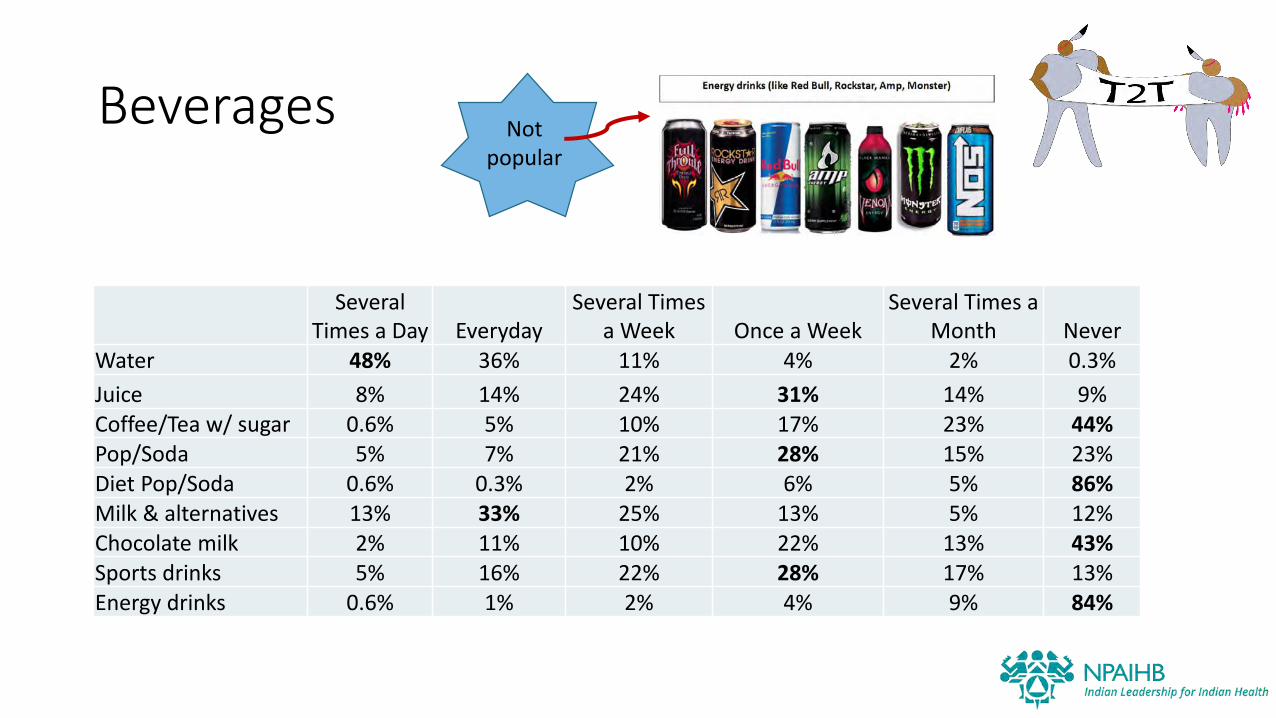
Beverages
Several Times a Day Everyday
Several Times a Week Once a Week
Several Times a Month Never
Water 48% 36% 11% 4% 2% 0.3%
Juice 8% 14% 24% 31% 14% 9%Coffee/Tea w/ sugar 0.6% 5% 10% 17% 23% 44%Pop/Soda 5% 7% 21% 28% 15% 23%Diet Pop/Soda 0.6% 0.3% 2% 6% 5% 86%Milk & alternatives 13% 33% 25% 13% 5% 12%Chocolate milk 2% 11% 10% 22% 13% 43%Sports drinks 5% 16% 22% 28% 17% 13%Energy drinks 0.6% 1% 2% 4% 9% 84%
Not popular
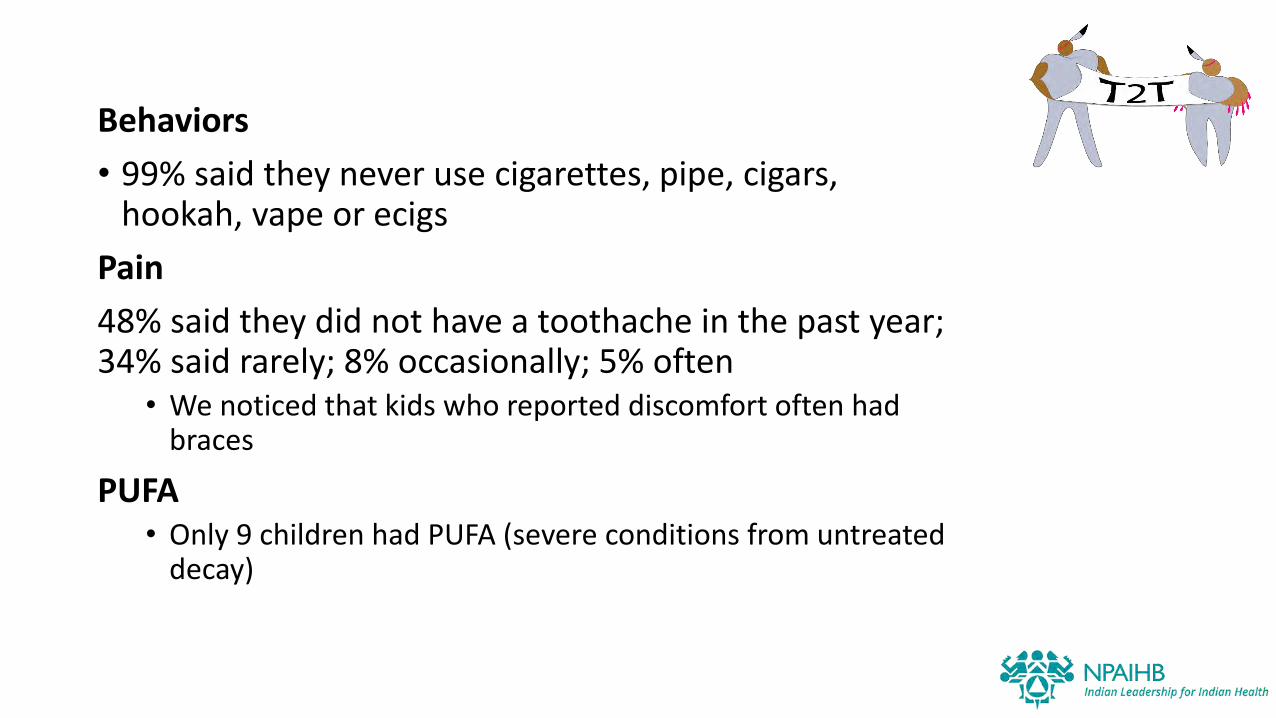
Behaviors
• 99% said they never use cigarettes, pipe, cigars, hookah, vape or ecigs
Pain
48% said they did not have a toothache in the past year; 34% said rarely; 8% occasionally; 5% often
• We noticed that kids who reported discomfort often had braces
PUFA• Only 9 children had PUFA (severe conditions from untreated
decay)
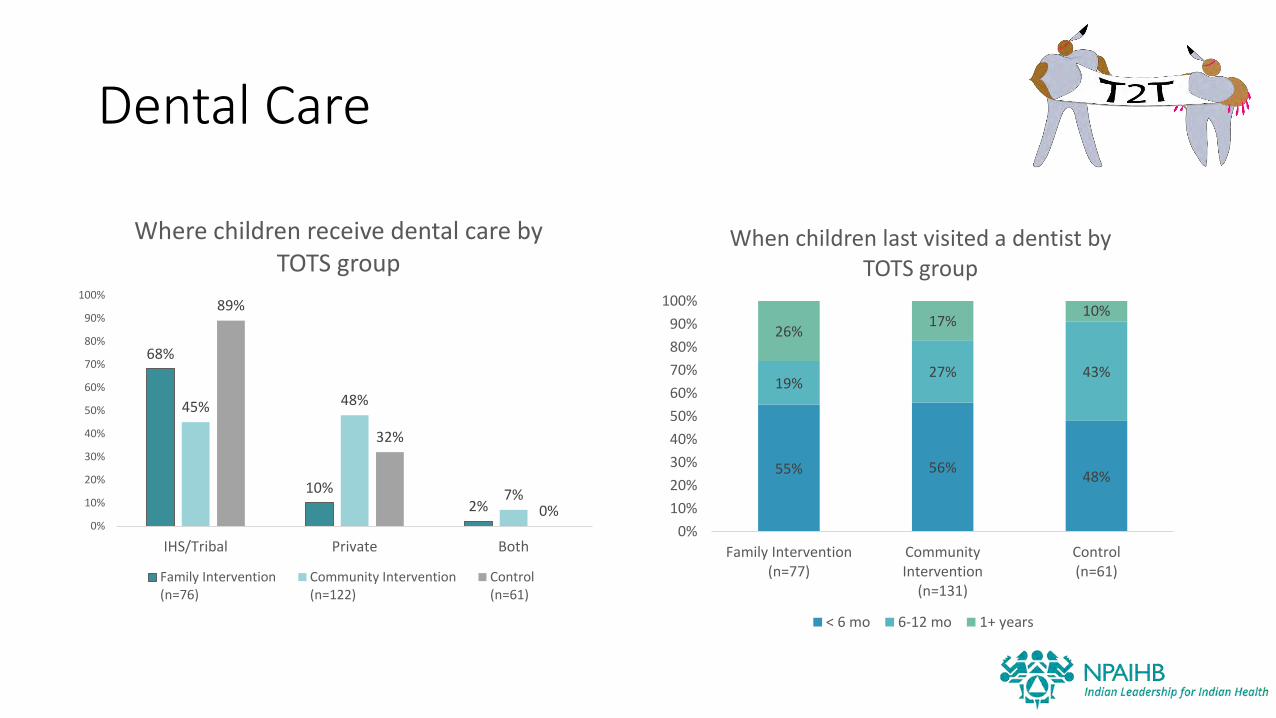
Dental Care
68%
10%2%
45% 48%
7%
89%
32%
0%0%
10%
20%
30%
40%
50%
60%
70%
80%
90%
100%
IHS/Tribal Private Both
Where children receive dental care by TOTS group
Family Intervention(n=76)
Community Intervention(n=122)
Control(n=61)
55% 56%48%
19%27% 43%
26%17%
10%
0%
10%
20%
30%
40%
50%
60%
70%
80%
90%
100%
Family Intervention(n=77)
CommunityIntervention
(n=131)
Control(n=61)
When children last visited a dentist by TOTS group
< 6 mo 6-12 mo 1+ years
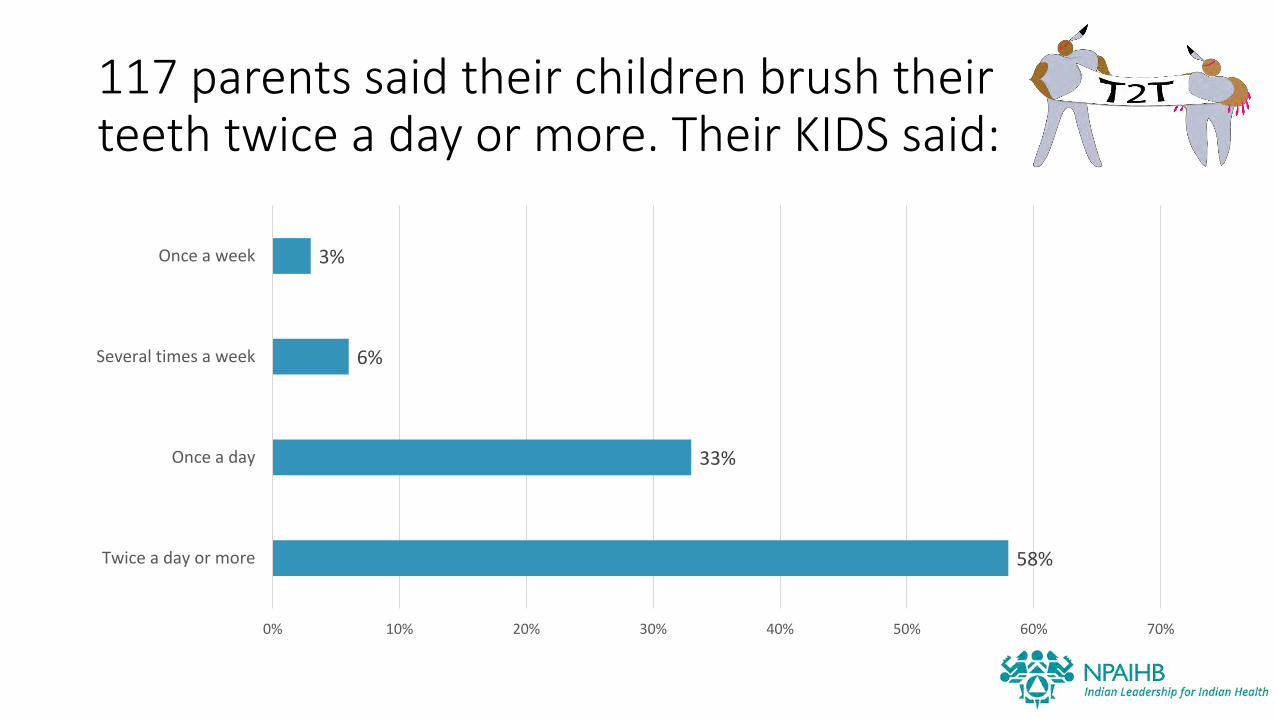
117 parents said their children brush their teeth twice a day or more. Their KIDS said:
58%
33%
6%
3%
0% 10% 20% 30% 40% 50% 60% 70%
Twice a day or more
Once a day
Several times a week
Once a week
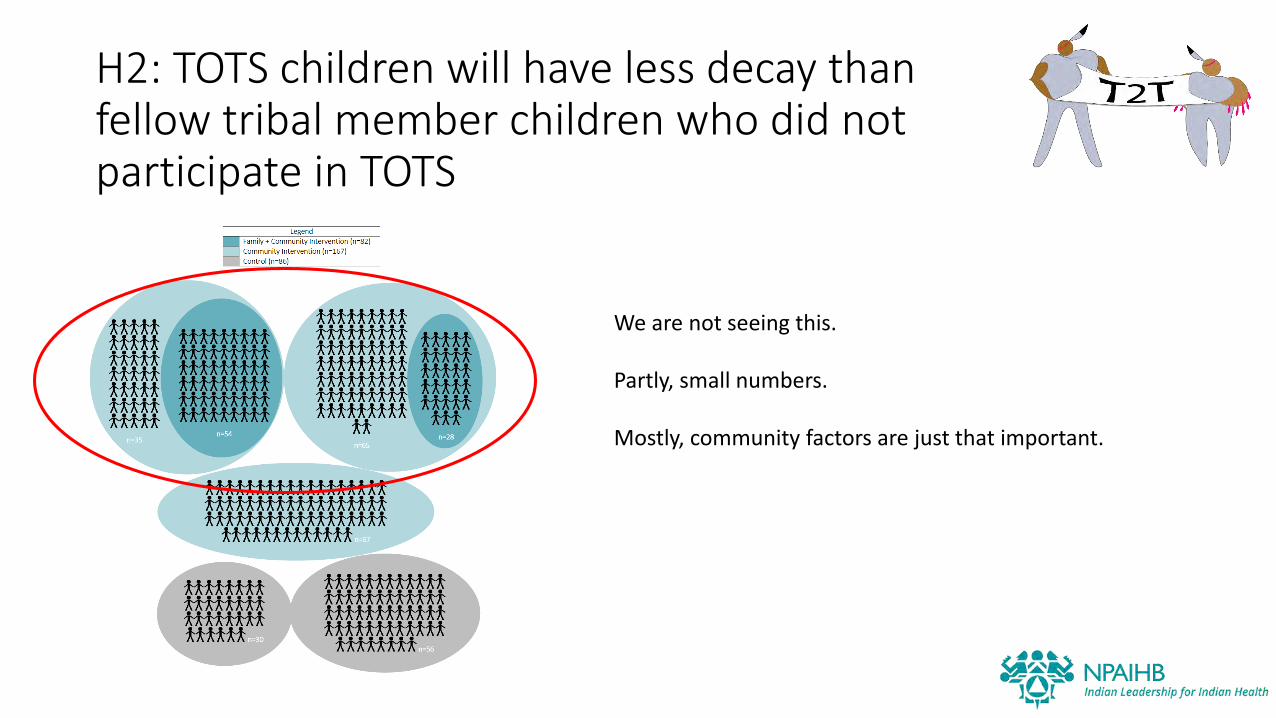
H2: TOTS children will have less decay than fellow tribal member children who did not participate in TOTS
We are not seeing this.
Partly, small numbers.
Mostly, community factors are just that important.
H3: Children with the least decay at age 2 will have the least decay in the follow-up screening
We may or may not do this analysis.
We did not see as many TOTS kids as we hoped.
Same kids, different teeth. Not truly longitudinal.
H4: Mothers/caregivers who participated in TOTS will have more favorable knowledge, attitudes, and behaviors related to oral health than those who did not receive TOTS
Analysis is forthcoming

Qualitative themes from parents
Facilitators
• Appreciation for bringing dental health programming out into community: health fairs, school events, open houses
• School-based screenings for all ages
• Ease of receiving oral health products from dental program or buying these types of products in bulk for entire family
Barriers
• Loss of control over food available including school lunches, nearby stores, vending machines, energy drink presence, coffee stands
• Challenges in setting routine oral health appointments in a timely manner rather than months down the road (2 months seemed to be mentioned a lot)
Context
• Ability to let go of control as children reach adolescence with respect to watching over daily brushing, flossing (parents tend to assume it’s getting done)
• Many families provide water as a main beverage and have a good view of the drinking water quality
Wish list
• Would like to see more ‘kid friendly’ dental providers
• Need for more media related oral health content in community; newspapers, social media, clinic, early learning centers, community stores, etc.
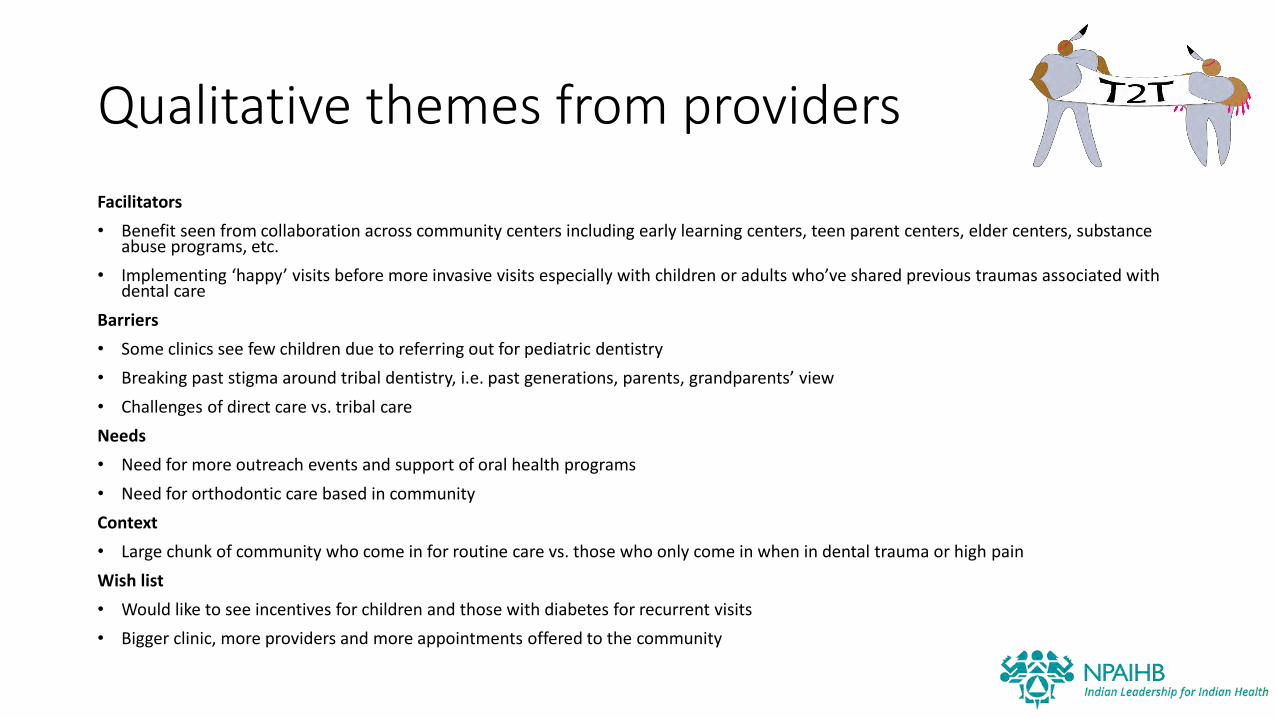
Qualitative themes from providers
Facilitators
• Benefit seen from collaboration across community centers including early learning centers, teen parent centers, elder centers, substance abuse programs, etc.
• Implementing ‘happy’ visits before more invasive visits especially with children or adults who’ve shared previous traumas associated with dental care
Barriers
• Some clinics see few children due to referring out for pediatric dentistry
• Breaking past stigma around tribal dentistry, i.e. past generations, parents, grandparents’ view
• Challenges of direct care vs. tribal care
Needs
• Need for more outreach events and support of oral health programs
• Need for orthodontic care based in community
Context
• Large chunk of community who come in for routine care vs. those who only come in when in dental trauma or high pain
Wish list
• Would like to see incentives for children and those with diabetes for recurrent visits
• Bigger clinic, more providers and more appointments offered to the community
Clinics are AWESOME
• Kids are receiving treatment for decay
• Preventive care is high – sealants
• Study is good news for public health – community level factors more important than individual level factors
Acknowledgements
Makah Tribe
Native American Research Centers for Health (NARCH)