Embed Size (px)
Citation preview

FINAL
Gunpowder River and Bird River PCB TMDL Report Document version: October, 2015
Total Maximum Daily Load of Polychlorinated Biphenyls in the Gunpowder River and Bird River Subsegments of the
Gunpowder River Oligohaline Segment, Baltimore County and Harford County, Maryland
FINAL
DEPARTMENT OF THE ENVIRONMENT
1800 Washington Boulevard, Suite 540 Baltimore MD 21230-1718
Submitted to:
Watershed Protection Division
U.S. Environmental Protection Agency, Region III 1650 Arch Street
Philadelphia, PA 19103-2029
October, 2015
EPA Submittal Date: October 30, 2015 EPA Approval Date: October 3, 2016
FINAL
Gunpowder River and Bird River PCB TMDL Report Document version: October, 2015
Table of Contents
List of Figures .............................................................................................................................. i List of Tables .............................................................................................................................. ii List of Abbreviations ................................................................................................................. iii EXECUTIVE SUMMARY ........................................................................................................ v 1.0 INTRODUCTION ............................................................................................................ 1 2.0 SETTING AND WATER QUALITY DESCRIPTION ................................................... 3
2.1 General Setting ............................................................................................................. 3 2.2 Water Quality Characterization and Impairment ......................................................... 9
3.0 TARGETED WATER COLUMN AND SEDIMENT TMDL ENDPOINTS ............... 14 4.0 SOURCE ASSESSMENT .............................................................................................. 17
4.1 Nonpoint Sources ........................................................................................................ 18 4.2 Point Sources .............................................................................................................. 22 4.3 Source Assessment Summary ..................................................................................... 25
5.0 TOTAL MAXIMUM DAILY LOADS AND LOAD ALLOCATION ......................... 27 5.1 Overview .................................................................................................................... 27 5.2 Analysis Framework .................................................................................................. 27 5.3 Critical Condition and Seasonality ............................................................................ 32 5.4 TMDL Allocations ..................................................................................................... 32 5.5 Margin of Safety (MOS) ............................................................................................ 34 5.6 Maximum Daily Loads .............................................................................................. 34 5.7 TMDL Summary ........................................................................................................ 34
6.0 ASSURANCE OF IMPLEMENTATION ..................................................................... 36 Appendix A: List of Identified PCB Congeners ..................................................................... A-1 Appendix B: Derivation of Adj-tBAF and Adj-SediBAF ...................................................... B-1 Appendix C: Method Used to Estimate Watershed tPCB Load ............................................. C-1 Appendix D: Multi-Segment Tidally-Averaged One-Dimensional Transport Model ............ D-1 Appendix E: Technical Approach Used to Generate Maximum Daily Loads ......................... E-1 Appendix F: List of NPDES Regulated Stormwater Permits .................................................. F-1 Appendix G: Total PCB Concentrations and Locations of the PCB Monitoring Stations ..... G-1
FINAL
i Gunpowder River and Bird River PCB TMDL Report Document version: October, 2015
List of Figures
Figure 1: Location Map of the Gunpowder River and Bird River Watersheds .............................. 4 Figure 2: Land Use of the Gunpowder River Watershed ............................................................... 5 Figure 3: Land Use Distribution in the Gunpowder River Watershed ........................................... 6 Figure 4: Land Use of the Bird River Watershed ........................................................................... 7 Figure 5: Land Use Distribution in the Bird River Watershed ....................................................... 8 Figure 6: Water Quality Monitoring Stations in the Gunpowder River and Bird River .............. 13 Figure 7: Conceptual Model of the Key Transport and Transformation Processes of
PCBs in Surface Water and Bottom Sediments of the Gunpowder River and the Bird River and Entry Points to the Food Chain .......................................................... 18
Figure 8: Industrial Point Source Location in the Gunpowder River Watershed ........................ 23 Figure 9: Change of Water Column and Bottom Sediment tPCB Concentrations with
Time within the Gunpowder River (natural attenuation) .................................................. 29 Figure 10: Change of Water Column and Bottom Sediment tPCB Concentrations with
Time within the Gunpowder River (100% load reduction to Watershed Load, WWTP load, & Atmospheric Deposition) ........................................................................ 30
Figure 11: Change of Water Column and Bottom Sediment tPCB Concentrations with Time within the Bird River (70% watershed load reduction) ........................................... 31
Figure C-1: PCB Water Quality Monitoring Stations/ USGS Station in the Gunpowder and Bird River Watersheds ............................................................................................. C-2
Figure C-2: Relative Locations of PCB Water Column Measurement Station Sampling Date Flow on the Flow Duration Curve .......................................................................... C-3
Figure D-1: Model Segments and Subwatersheds of the Gunpowder and Bird Rivers.............. D-5
FINAL
ii Gunpowder River and Bird River PCB TMDL Report Document version: October, 2015
List of Tables Table ES-1: Summary of Baseline tPCB Baseline Loads, TMDL Allocations, Load Reductions, and
MDLs in the Gunpowder River ....................................................................................................... x Table ES-2: Summary of Baseline tPCB Baseline Loads, TMDL Allocations, Load Reductions, and
MDLs in the Bird River .................................................................................................................. xi Table 1: Land Use Distributions in the Gunpowder River Watershed ......................................................... 6 Table 2: Land Use Distributions in the Bird River Watershed ..................................................................... 7 Table 3: Water Column tPCB Criteria and tPCB Fish Tissue Listing Threshold ......................................... 9 Table 4: Summary of Fish Tissue, Water Column, and Sediment tPCB Data in the Gunpowder River .... 11 Table 5: Summary of Fish Tissue, Water Column, and Sediment tPCB Data in the Bird River ................ 11 Table 6: Summary of Industrial Facility tPCB Baseline Loads .................................................................. 22 Table 7: Stormwater tPCB Baseline Loads in the Gunpowder and Bird Rivers ......................................... 24 Table 8: Summary of tPCB Baseline Loads in the Gunpowder River ........................................................ 26 Table 9: Summary of tPCB Baseline Loads in the Bird River ................................................................... 26 Table 10: Summary of tPCB Baseline Loads, TMDL Allocations, MDL, and Associated Percent
Reductions in the Gunpowder River .............................................................................................. 35 Table 11: Summary of tPCB Baseline Loads, TMDL Allocations, MDL, and Associated Percent
Reductions in the Bird River .......................................................................................................... 35 Table A-1: List of Identified PCB Congeners .......................................................................................... A-1 Table B-1: Species Trophic Levels and Home Ranges in the Gunpowder River ..................................... B-1 Table B-2: Species Trophic Levels and Home Ranges in the Bird River ................................................. B-1 Table B-3: Kow Values of Homologs Used in the Baseline BAF Calculation ........................................... B-2 Table B-4: tBAF, Baseline BAF, Adj-tBAF, and Water Column TMDL Endpoint tPCB
Concentrations for Each Species in the Gunpowder River .......................................................... B-3 Table B-5: Individual Fish Lengths and Weights for the Bluegill Composites from the
Gunpowder River ......................................................................................................................... B-4 Table B-6: tBAF, Baseline BAF, Adj-tBAF, and Water Column TMDL Endpoint tPCB
Concentrations for Each Species in the Bird River ...................................................................... B-4 Table B-7: Individual Fish Lengths and Weights for the Channel Catfish Composites from the
Bird River .................................................................................................................................... B-5 Table B-8: BSAF, Adj-SedBAF, and Sediment TMDL Endpoint tPCB Concentrations in the
Gunpowder River ......................................................................................................................... B-6 Table B-9: BSAF, Adj-SedBAF, and Sediment TMDL Endpoint tPCB Concentrations in the
Bird River .................................................................................................................................... B-6 Table C-1: Flow and tPCB baseline loads from Subwatersheds of the Gunpowder and Bird Rivers ...... C-1 Table D-1: Physical Parameters of the Model for Each Segment ............................................................. D-4 Table E-1: Summary of tPCB Maximum Daily Load in the Gunpowder River ....................................... E-5 Table E-2: Summary of tPCB Maximum Daily Load in the Bird River................................................... E-5 Table F-1: NPDES Regulated Stormwater Permit Summary for the Gunpowder River .......................... F-1 Table F-2: NPDES Regulated Stormwater Permit Summary for the Bird River ...................................... F-2 Table G-1: Sediment tPCB Concentrations (ng/g) in the Gunpowder River ............................................ G-1 Table G-2: Sediment tPCB Concentrations (ng/g) in the Bird River ........................................................ G-1 Table G-3: Fish Tissue tPCB Concentrations (ng/g) in the Gunpowder River ......................................... G-2 Table G-4: Fish Tissue tPCB Concentrations (ng/g) in the Bird River .................................................... G-3 Table G-5: Water Column tPCB Concentrations (ng/L) in the Gunpowder River ................................... G-4 Table G-6: Water Column tPCB Concentrations (ng/L) in the Bird River ............................................... G-5
FINAL
iii Gunpowder River and Bird River PCB TMDL Report Document version: October, 2015
List of Abbreviations
Adj-SediBAF Adjusted Sediment Bioaccumulation Factor Adj-tBAF Adjusted Total Bioaccumulation Factor BAF Bioaccumulation Factor BCF Bioconcentration Factor BMP Best Management Practice BSAF Biota-sediment accumulation factor CBP Chesapeake Bay Program CFR Code of Federal Regulations COMAR Code of Maryland Regulations CSF Cancer Slope Factor CV Coefficient of Variation CWA Clean Water Act DEM Digital Elevation Model DMR Discharge Monitoring Report DOC Dissolved Organic Carbon DRBC Delaware River Basin Commission EOF Edge of Field EOS Edge of Stream EPA U.S. Environmental Protection Agency FIBI Fish Index of Biotic Integrity ft Feet GIS Geographic Information System g Gram kg Kilogram km2 Square Kilometer
Koc PCB Organic Carbon-Water Partition Coefficient Kow PCB Octanol-Water Partition Coefficient L Liter lbs Pounds LA Load Allocation LMA Land Management Administration LRP-MAP Land Restoration Program Geospatial Database m Meter m2 Square meter m3 Cubic meter MD Maryland
FINAL
iv Gunpowder River and Bird River PCB TMDL Report Document version: October, 2015
MDE Maryland Department of the Environment MDL Maximum Daily Load mg Milligram MOS Margin of Safety MS4 Municipal Separate Storm Sewer Systems ng Nanogram NOAA National Oceanic & Atmospheric Administration NPDES National Pollutant Discharge Elimination System NRCS Natural Resources Conservation Service PCB Polychlorinated Biphenyl POC Particulate Organic Carbon ppb Parts per billion ppt Parts per trillion RUSLE2 Revised Universal Soil Loss Equation Version II SediBAF Sediment Bioaccumulation Factor SIC Standard Industrial Classification TMDL Total Maximum Daily Load tBAF Total Bioaccumulation Factor tPCB Total PCB TSD Technical Support Document TSS Total Suspended Solids UMCES University of Maryland Center for Environmental Science USDA United States Department of Agriculture USGS United States Geological Survey VA Virginia VCP Voluntary Cleanup Program WLA Wasteload Allocation WQA Water Quality Analysis WQBEL Water Quality Based Effluent Limit WQLS Water Quality Limited Segment WQS Water Quality Standard WWTP Waste Water Treatment Plant µg Microgram
FINAL
v Gunpowder River and Bird River PCB TMDL Report Document version: October, 2015
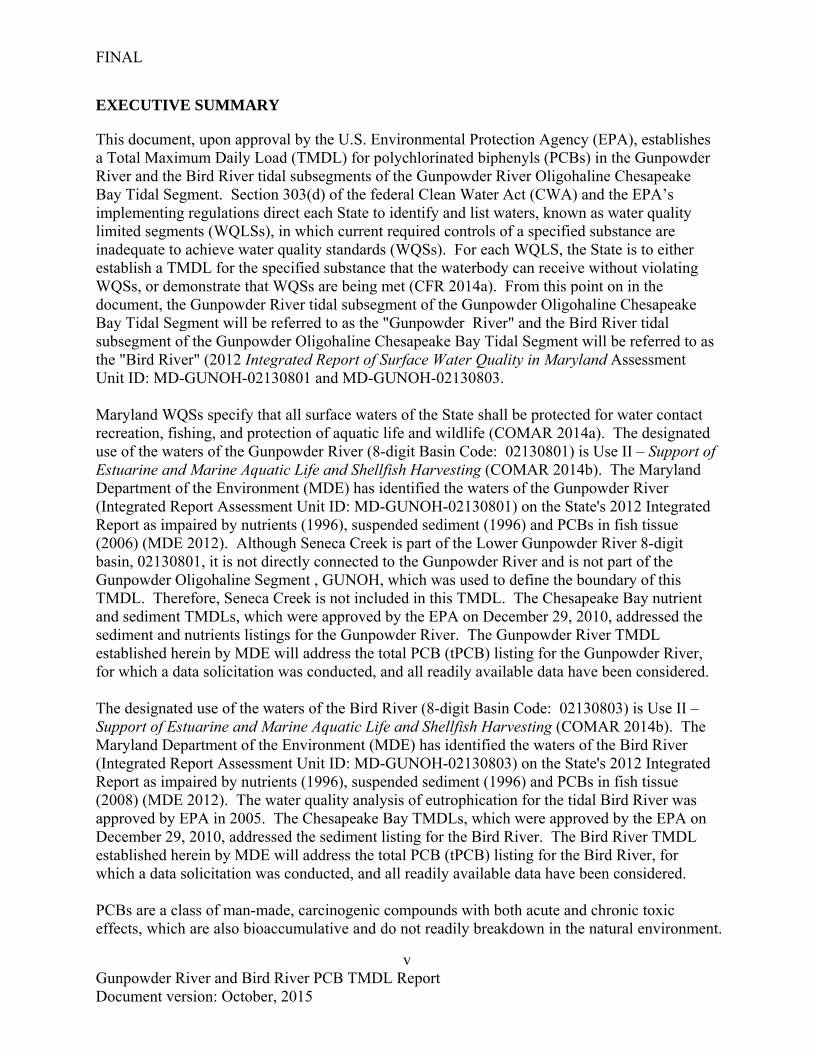
EXECUTIVE SUMMARY
This document, upon approval by the U.S. Environmental Protection Agency (EPA), establishes a Total Maximum Daily Load (TMDL) for polychlorinated biphenyls (PCBs) in the Gunpowder River and the Bird River tidal subsegments of the Gunpowder River Oligohaline Chesapeake Bay Tidal Segment. Section 303(d) of the federal Clean Water Act (CWA) and the EPA’s implementing regulations direct each State to identify and list waters, known as water quality limited segments (WQLSs), in which current required controls of a specified substance are inadequate to achieve water quality standards (WQSs). For each WQLS, the State is to either establish a TMDL for the specified substance that the waterbody can receive without violating WQSs, or demonstrate that WQSs are being met (CFR 2014a). From this point on in the document, the Gunpowder River tidal subsegment of the Gunpowder Oligohaline Chesapeake Bay Tidal Segment will be referred to as the "Gunpowder River" and the Bird River tidal subsegment of the Gunpowder Oligohaline Chesapeake Bay Tidal Segment will be referred to as the "Bird River" (2012 Integrated Report of Surface Water Quality in Maryland Assessment Unit ID: MD-GUNOH-02130801 and MD-GUNOH-02130803. Maryland WQSs specify that all surface waters of the State shall be protected for water contact recreation, fishing, and protection of aquatic life and wildlife (COMAR 2014a). The designated use of the waters of the Gunpowder River (8-digit Basin Code: 02130801) is Use II – Support of Estuarine and Marine Aquatic Life and Shellfish Harvesting (COMAR 2014b). The Maryland Department of the Environment (MDE) has identified the waters of the Gunpowder River (Integrated Report Assessment Unit ID: MD-GUNOH-02130801) on the State's 2012 Integrated Report as impaired by nutrients (1996), suspended sediment (1996) and PCBs in fish tissue (2006) (MDE 2012). Although Seneca Creek is part of the Lower Gunpowder River 8-digit basin, 02130801, it is not directly connected to the Gunpowder River and is not part of the Gunpowder Oligohaline Segment , GUNOH, which was used to define the boundary of this TMDL. Therefore, Seneca Creek is not included in this TMDL. The Chesapeake Bay nutrient and sediment TMDLs, which were approved by the EPA on December 29, 2010, addressed the sediment and nutrients listings for the Gunpowder River. The Gunpowder River TMDL established herein by MDE will address the total PCB (tPCB) listing for the Gunpowder River, for which a data solicitation was conducted, and all readily available data have been considered. The designated use of the waters of the Bird River (8-digit Basin Code: 02130803) is Use II – Support of Estuarine and Marine Aquatic Life and Shellfish Harvesting (COMAR 2014b). The Maryland Department of the Environment (MDE) has identified the waters of the Bird River (Integrated Report Assessment Unit ID: MD-GUNOH-02130803) on the State's 2012 Integrated Report as impaired by nutrients (1996), suspended sediment (1996) and PCBs in fish tissue (2008) (MDE 2012). The water quality analysis of eutrophication for the tidal Bird River was approved by EPA in 2005. The Chesapeake Bay TMDLs, which were approved by the EPA on December 29, 2010, addressed the sediment listing for the Bird River. The Bird River TMDL established herein by MDE will address the total PCB (tPCB) listing for the Bird River, for which a data solicitation was conducted, and all readily available data have been considered. PCBs are a class of man-made, carcinogenic compounds with both acute and chronic toxic effects, which are also bioaccumulative and do not readily breakdown in the natural environment.
FINAL
vi Gunpowder River and Bird River PCB TMDL Report Document version: October, 2015
There are 209 possible chemical arrangements of PCBs known as congeners, which consist of two phenyl groups and one to ten chlorine atoms. The congeners differ in the number and position of chlorine atoms along the phenyl groups. PCBs were manufactured and used for a variety of industrial applications and sold as mixtures under various trade names commonly known as Aroclors (QEA 1999). Sixteen different Aroclor mixtures were produced, each formulated based on a specific chlorine composition by mass. PCBs are a concern to human health, as regular consumption of fish containing elevated levels of PCBs will cause bioaccumulation within the fatty tissues of humans, which can potentially lead to the development of cancer. Since the Gunpowder River and Bird River were identified as impaired for PCBs in fish tissue, the overall objective of the tPCB TMDL established in this document is to ensure that the “fishing” designated use, which is protective of human health related to the consumption of fish, is supported. However, this TMDL will also ensure the protection of all other applicable designated uses within the river. This objective was achieved via the use of field observations and a multiple-segment water quality model. Since the Bird River is connected to the Gunpowder River, the model simulates them as one system. The model incorporates the influences of tide, atmospheric deposition, freshwater inputs, and exchanges between the water column and bottom sediments, thereby representing realistic dynamic transport within the area.
The water quality model is used to:
1. Estimate and predict PCB transport and fate based on observed tPCB concentrations in the water column and bottom sediments of the Gunpowder River and the Bird River;
2. Simulate long-term tPCB concentrations in the water column and bottom sediments; 3. Estimate the load reductions necessary to meet the TMDL water column and sediment
endpoint concentrations, which are derived from the Integrated Report fish tissue listing threshold and site specific total Bioaccumulation Factors (tBAFs);
4. Estimate the amount of time necessary for tPCB concentrations to reach the TMDL water column and sediment endpoints, given the required load reductions from the individual source sectors and an estimated rate of decline in the tPCB concentrations at the boundary between the Gunpowder River and the Chesapeake Bay mainstem.
The CWA, as recently interpreted by the United States District Court for the District of Columbia, requires TMDLs to be protective of all the designated uses applicable to a particular waterbody (US District Court for the District of Columbia, 2011). Within the Gunpowder River and Bird River , these designated uses, as described previously, include “water contact recreation,” “fishing,” “the protection of aquatic life and wildlife,” and “Support of Estuarine and Marine Aquatic Life and Shellfish Harvesting”. The TMDLs presented herein were developed specifically to be supportive of the “fishing” designated use, ensuring that the consumption of fish does not impact human health, thus addressing the impairment listings for “PCBs in fish tissue”. The water column and sediment TMDL endpoint tPCB concentrations applied within this analysis are derived from Maryland’s Integrated Report fish tissue listing threshold tPCB concentration and site specific tBAFs. In the Gunpowder River and the Bird River, the tPCB endpoint concentrations are lower than: 1) EPA’s human health criterion tPCB water column
FINAL
vii Gunpowder River and Bird River PCB TMDL Report Document version: October, 2015
concentration relative to fish consumption, and 2) both Maryland’s freshwater and saltwater chronic criteria tPCB water column concentrations (i.e., water column TMDL endpoint tPCB concentrations < freshwater chronic tPCB criterion). This indicates that the TMDL is not only protective of the “fishing” designated use but also the “aquatic life” designated use, specifically the protection of “Support of Estuarine and Marine Aquatic Life and Shellfish Harvesting”. Lastly, the designated use for "water contact recreation" is not associated with any potential human health risks due to PCB exposure. Dermal contact and consumption of water from activities associated with "water contact recreation" are not significant pathways for the uptake of PCBs. The EPA human health criterion was developed solely based on organism consumption, as drinking water consumption does not pose any risk for cancer development at environmentally relevant levels. The only human health risk associated with PCB exposure is through the consumption of aquatic organisms, which is addressed by the water column and sediment tPCB endpoint concentrations applied within this TMDL developed to be supportive of the "fishing" designated use. As part of this analysis, both point and nonpoint sources of PCBs have been identified throughout the direct drainage watersheds of the Gunpowder and Bird Rivers. Under the framework of this analysis, sources within the direct drainage portion of the Gunpowder River and Bird River watersheds will be included in the Gunpowder River TMDL equation. For the Gunpowder River, nonpoint sources include direct atmospheric deposition to the Gunpowder and Bird Rivers, runoff from non-regulated watershed areas, discharges from Gunpowder Falls and Little Gunpowder Falls (outside of the direct drainage area), and tidal influence from the Chesapeake Bay mainstem. Point sources include National Pollutant Discharge Elimination System (NPDES) regulated stormwater runoff within the watershed and an industrial facility discharge. For the Bird River TMDL equation, only sources from within the Bird River and its watershed will be included. For the Bird River, nonpoint sources include loads from tidal exchange with the Gunpowder River, direct atmospheric deposition to the river and runoff from non-regulated watershed areas. The only point source is National Pollutant Discharge Elimination System (NPDES) regulated stormwater runoff within the watershed. No NPDES municipal wastewater treatment plants (WWTPs) were identified within either watershed. The transport of PCBs from bottom sediments to the water column through resuspension and diffusion can also be a major source of PCBs in estuarine systems; however, under the framework of this TMDL it is not considered a source. The water quality model developed for this TMDL simulates conditions within the water column and sediment as a single system. Therefore exchanges between the sediment and water column are considered an internal loading. Only external sources to the system are assigned a baseline load or allocation within a TMDL. Therefore, PCB transport from bottom sediments through resuspension and diffusion will not be assigned a baseline load or allocation. The objective of the TMDL established herein is to reduce current tPCB loads to the Gunpowder River and Bird River so that the water column and sediment TMDL endpoint tPCB concentrations are achieved. All TMDLs need to be presented as a sum of Wasteload Allocations (WLAs) for the identified point sources, Load Allocations (LAs) for nonpoint source loads generated within the assessment unit, and where applicable, natural background, tributary,
FINAL
viii Gunpowder River and Bird River PCB TMDL Report Document version: October, 2015
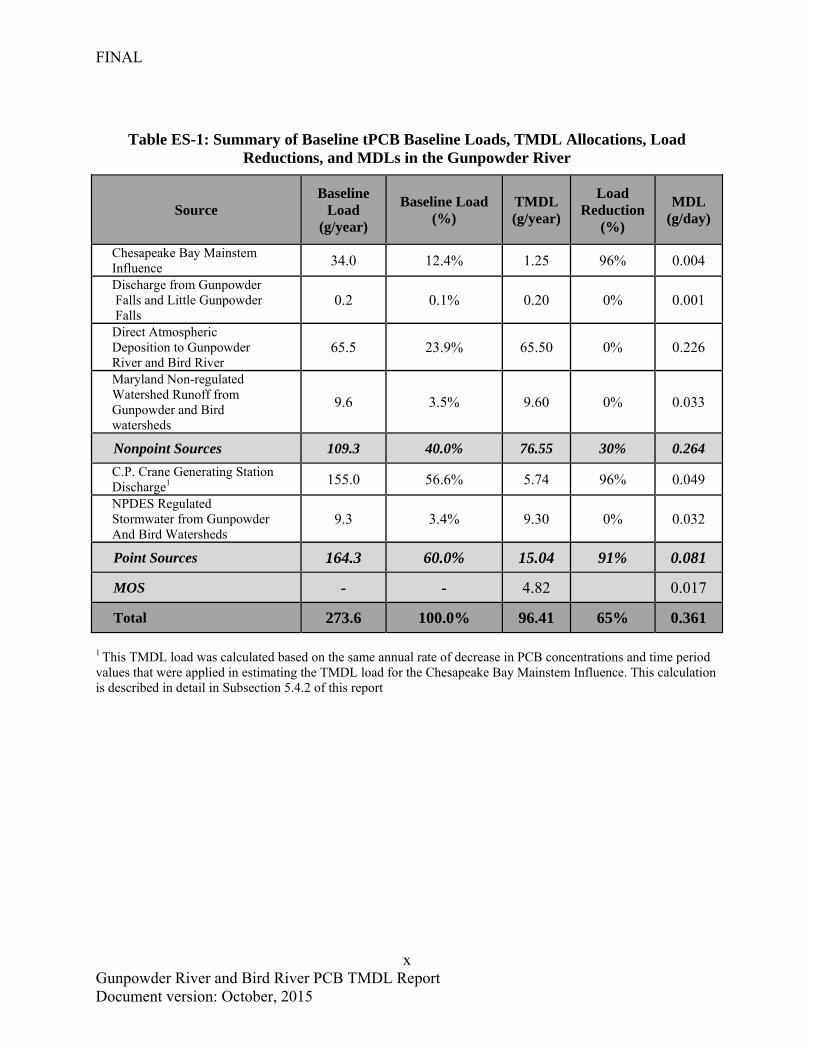
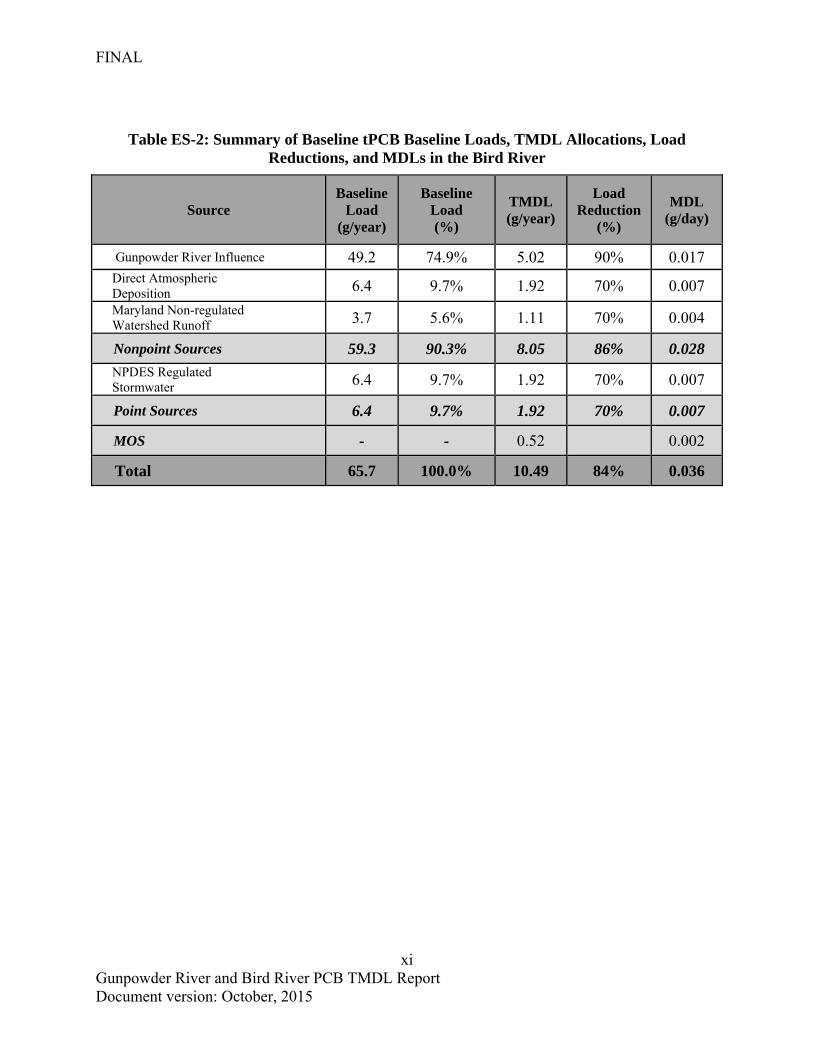
and adjacent segment loads. Furthermore, all TMDLs must include a margin of safety (MOS) to account for lack of knowledge and the many uncertainties in the understanding and simulation of water quality parameters in natural systems (i.e., the relationship between modeled loads and water quality) (CFR 2014a). The MOS is intended to account for such uncertainties in a manner that is conservative from the standpoint of environmental protection. An explicit MOS of 5% was incorporated into the analysis to account for such uncertainty. Summaries of the baseline loads, TMDLs, and maximum daily loads (MDLs) for the Gunpowder River and Bird River are presented in Table ES-1 and Table ES-2, respectively. When implemented, these TMDLs will ensure that the resulting tPCB concentrations in the sediment and water column are at levels supportive of the “fishing” designated use in the Gunpowder River and the Bird River. The transport of PCBs to the rivers from bottom sediment via resuspension and diffusion is currently estimated to be the major source of PCBs. However, within this TMDL, as stated previously, the transport of PCBs from bottom sediments through resuspension and diffusion will not be assigned a tPCB baseline load or TMDL allocation. The water quality model developed for simulating ambient sediment and water column tPCB concentrations within the Gunpowder River and the Bird River was used to determine the specific load reductions for each controllable source category that would result in simulated tPCB concentrations in the sediment and water column that meet the TMDL endpoints. The results of this scenario establish the load reductions per source category and the associated WLAs and LAs necessary to achieve the TMDLs. The primary source of PCBs to the atmosphere is from volatilization of PCB contaminated land sources, which will be eliminated as these sources are remediated through implementation of the non-regulated watershed runoff LA and NPDES regulated stormwater WLA. For the Gunpowder River and the Bird River, model scenarios were used to develop the load reductions, WLAs, and LAs for non-regulated watershed runoff and NPDES-regulated stormwater source categories. As previously applied in other PCB TMDLs developed by Maryland in the Chesapeake Bay region, the model assumes that water column tPCB concentration decreases at a rate of 6.5% per year at the tidal boundary between the Gunpowder River and the Chesapeake Bay mainstem (e.g., MDE 2009a, 2009b). In the Gunpowder River, it will take approximately 49 years to achieve the sediment and water column TMDL endpoint tPCB concentrations with natural attenuation of tPCB concentration in the Chesapeake Bay mainstem. No reduction is necessary to the loads from the watershed, which include non-point and point sources and atmospheric deposition, in order to achieve the TMDL. When the targets are met, the tPCB loads from the Chesapeake Bay mainstem entering the embayment will be reduced by about 96%. At that time, the total load will be reduced by 65% from its baseline load. In the Bird River, the resultant TMDL scenario requires 70% load reductions from the direct drainage portions of the Bird River and from direct atmospheric deposition to the Bird River, and it will take approximately 93 years in order to achieve the sediment and water column TMDL endpoint tPCB concentrations. The reductions specified in the TMDLs for the Gunpowder and Bird Rivers are shown in Table ES-1 and ES-2, respectively. In addition, one industrial facility, a power generating station, is located in the Gunpowder River. This facility intakes water from Seneca Creek, a small estuary with a wide open mouth
FINAL
ix Gunpowder River and Bird River PCB TMDL Report Document version: October, 2015
connecting it to the Bay mainstem, and it discharges into Saltpeter Creek, a tidal tributary of the Gunpowder River. Given that the tPCB concentrations in the Bay decline at a rate of 6.5% per year and this discharge is from a once-through cooling system of water from the creek, it is assumed that the tPCB concentration in the water discharged from this facility would decline at the same rate of 6.5% per year. When the TMDL endpoints in the Gunpowder River are met, the tPCB load from this cooling system will be reduced by 96% from its baseline. Federal regulations require that TMDL analyses take into account the impact of critical conditions and seasonality on water quality (CFR 2014b). The intent of these requirements is to ensure that load reductions required by this TMDL, when implemented, will produce water quality conditions supportive of the designated use at all times. PCB levels in fish tissue become elevated due to long term exposure primarily through consumption of lower trophic level organisms, rather than a critical condition defined by acute exposure to temporary fluctuations in water column tPCB concentrations. Therefore, the selection of the annual average tPCB water column and sediment concentrations for comparison to the TMDL endpoints adequately considers the impact of seasonal variations and critical conditions on the “fishing” designated use in the Gunpowder and Bird Rivers. Thus, the TMDL implicitly accounts for seasonal variations as well as critical conditions. Despite the fact that PCB loads from resuspension and diffusion are not considered to be directly controllable, these load contributions are still expected to decrease over time as the result of the natural attenuation of PCBs in the environment. In addition, discovering and remediating any existing PCB land sources throughout the upstream Chesapeake Bay watershed via future TMDL development and implementation will further aid in the decline of the boundary condition tPCB concentrations and in meeting water quality goals in the river. MDE also monitors and evaluates concentrations of contaminants in recreationally caught fish, shellfish, and crabs throughout Maryland. MDE will use these monitoring programs to evaluate progress towards meeting the “fishing” designated use in the Gunpowder River and the Bird River.
FINAL
x Gunpowder River and Bird River PCB TMDL Report Document version: October, 2015
Table ES-1: Summary of Baseline tPCB Baseline Loads, TMDL Allocations, Load Reductions, and MDLs in the Gunpowder River
Source Baseline
Load (g/year)
Baseline Load (%)
TMDL (g/year)
Load Reduction
(%)
MDL (g/day)
Chesapeake Bay Mainstem Influence 34.0 12.4% 1.25 96% 0.004
Discharge from Gunpowder Falls and Little Gunpowder Falls
0.2 0.1% 0.20 0% 0.001
Direct Atmospheric Deposition to Gunpowder River and Bird River
65.5 23.9% 65.50 0% 0.226
Maryland Non-regulated Watershed Runoff from Gunpowder and Bird watersheds
9.6 3.5% 9.60 0% 0.033
Nonpoint Sources 109.3 40.0% 76.55 30% 0.264
C.P. Crane Generating Station Discharge1 155.0 56.6% 5.74 96% 0.049
NPDES Regulated Stormwater from Gunpowder And Bird Watersheds
9.3 3.4% 9.30 0% 0.032
Point Sources 164.3 60.0% 15.04 91% 0.081
MOS - - 4.82 0.017
Total 273.6 100.0% 96.41 65% 0.361
1 This TMDL load was calculated based on the same annual rate of decrease in PCB concentrations and time period values that were applied in estimating the TMDL load for the Chesapeake Bay Mainstem Influence. This calculation is described in detail in Subsection 5.4.2 of this report
FINAL
xi Gunpowder River and Bird River PCB TMDL Report Document version: October, 2015
Table ES-2: Summary of Baseline tPCB Baseline Loads, TMDL Allocations, Load Reductions, and MDLs in the Bird River
Source Baseline
Load (g/year)
Baseline Load (%)
TMDL (g/year)
Load Reduction
(%)
MDL (g/day)
Gunpowder River Influence 49.2 74.9% 5.02 90% 0.017 Direct Atmospheric Deposition 6.4 9.7% 1.92 70% 0.007
Maryland Non-regulated Watershed Runoff 3.7 5.6% 1.11 70% 0.004
Nonpoint Sources 59.3 90.3% 8.05 86% 0.028
NPDES Regulated Stormwater 6.4 9.7% 1.92 70% 0.007
Point Sources 6.4 9.7% 1.92 70% 0.007
MOS - - 0.52 0.002
Total 65.7 100.0% 10.49 84% 0.036
FINAL
1 Gunpowder River and Bird River PCB TMDL Report Document version: October, 2015
1.0 INTRODUCTION
This document, upon approval by the U.S. Environmental Protection Agency (EPA), establishes a Total Maximum Daily Load (TMDL) for polychlorinated biphenyls (PCBs) in the Gunpowder River and the Bird River tidal subsegments of the Gunpowder River Oligohaline Chesapeake Bay Tidal Segment. Section 303(d) of the federal Clean Water Act (CWA) and the EPA’s implementing regulations direct each State to identify and list waters, known as water quality limited segments (WQLSs), in which current required controls of a specified substance are inadequate to achieve water quality standards (WQSs). For each WQLS, the State is to either establish a TMDL for the specified substance that the waterbody can receive without violating WQSs, or demonstrate that WQSs are being met (CFR 2014a). From this point on in the document, the Gunpowder River tidal subsegment of the Gunpowder Oligohaline Chesapeake Bay Tidal Segment will be referred to as the "Gunpowder River" and the Bird River tidal subsegment of the Gunpowder Oligohaline Chesapeake Bay Tidal Segment will be referred to as the "Bird River" (2012 Integrated Report of Surface Water Quality in Maryland Assessment Unit ID: MD-GUNOH-02130801 and MD-GUNOH-02130803). TMDLs are established to determine the pollutant load reductions required to achieve and maintain WQSs. A WQS is the combination of a designated use for a particular body of water and the water quality criteria designed to protect that use. Designated uses include activities such as swimming, drinking water supply, protection of aquatic life, fish and shellfish propagation and harvest, etc. Water quality criteria consist of narrative statements and numeric values designed to protect the designated uses. Criteria may differ among waters with different designated uses. Maryland WQSs specify that all surface waters of the State shall be protected for water contact recreation, fishing, and protection of aquatic life and wildlife (COMAR 2014a). The designated use of the waters of the Gunpowder River (8-digit Basin Code: 02130801) is Use II – Support of Estuarine and Marine Aquatic Life and Shellfish Harvesting (COMAR 2014b). The Maryland Department of the Environment (MDE) has identified the waters of the Gunpowder River (Integrated Report Assessment Unit ID: MD-GUNOH-02130801) on the State's 2012 Integrated Report as impaired by nutrients (1996), suspended sediment (1996) and PCBs in fish tissue (2006) (MDE 2012). Although Seneca Creek is part of the Lower Gunpowder River 8-digit basin, 02130801, it is not directly connected to the Gunpowder River and is not part of the Gunpowder Oligohaline Segment, GUNOH, which was used to define the boundary of this TMDL. Therefore, Seneca Creek is not included in this TMDL. The Chesapeake Bay TMDLs, which were approved by the EPA on December 29, 2010, addressed the sediment and nutrients listings for the Gunpowder River. The TMDL established herein by MDE will address the total PCB (tPCB) listing for the Gunpowder River, for which a data solicitation was conducted, and all readily available data have been considered. The designated use of the waters of the Bird River (8-digit Basin Code: 02130803) is Use II – Support of Estuarine and Marine Aquatic Life and Shellfish Harvesting (COMAR 2014b). The Maryland Department of the Environment (MDE) has identified the waters of the Bird River (Integrated Report Assessment Unit ID: MD-GUNOH-02130803) on the State's 2012 Integrated Report as impaired by nutrients (1996), suspended sediment (1996) and PCBs in fish tissue
FINAL
2 Gunpowder River and Bird River PCB TMDL Report Document version: October, 2015
(2008) (MDE 2012). A water quality analysis of eutrophication for the tidal Bird River was approved by EPA in 2005. The Chesapeake Bay TMDLs, which were approved by the EPA on December 29, 2010, addressed the sediment listing for the Bird River. The TMDL established herein by MDE will address the total PCB (tPCB) listing for the Bird River, for which a data solicitation was conducted, and all readily available data have been considered. PCBs are a class of man-made compounds that were manufactured and used for a variety of industrial applications. They consist of 209 related chemical compounds (congeners) that were manufactured and sold as mixtures under various trade names, commonly referred to as Aroclors (sixteen different Aroclor mixtures were produced, each formulated based on a specific chlorine composition by mass) (QEA 1999). Each of the 209 possible PCB compounds consists of two phenyl groups and one to ten chlorine atoms. The congeners differ in the number and position of the chlorine atoms along the phenyl group. From the 1940s to the 1970s, they were extensively used as heat transfer fluids, flame retardants, hydraulic fluids, and dielectric fluids because of their dielectric and flame resistant properties. They have been identified as a pollutant of concern due to the following: 1. They are bioaccumulative and can cause both acute and chronic toxic effects; 2. They have carcinogenic properties; 3. They are persistent organic pollutants that do not readily breakdown in the environment. In the late 1970s, concerns regarding potential human health effects led the U.S. government to take action to cease PCB production, restrict PCB use, and regulate the storage and disposal of PCBs. Despite these actions, PCBs are still being released into the environment through fires or leaks from old PCB containing equipment, accidental spills, burning of PCB containing oils, leaks from hazardous waste sites or the inadvertent production during manufacturing processes. Since PCBs tend to bioaccumulate in aquatic organisms, including fish, people who consume fish may become exposed to PCBs. In fact, elevated levels of PCBs in edible parts of fish tissue are one of the leading causes of fish consumption advisories in the U.S. The Gunpowder River and the Bird River were originally identified as impaired by PCBs in fish tissue on Maryland’s 2006 and 2008 Integrated Reports, respectively, based on fish tissue tPCB data from MDE’s monitoring program that exceeded the tPCB fish tissue listing threshold of 39 ng/g, or ppb – (wet weight) based on 4 meals per month by a 76 kg individual (MDE 2012). In addition to identifying impaired waterbodies on the State’s Integrated Report, MDE also issues statewide and site specific fish consumption advisories (ranging from 0 to 4 meals per month) and recommendations (ranging from 4 to 8 meals per month). Current recreational fish consumption advisories suggest limiting the consumption of the following fish species caught in the Gunpowder River system: channel catfish (1 meal every other month), carp (avoid), white perch (5 meals per month) and yellow perch (1 meal per month) (MDE 2014a).
FINAL
3 Gunpowder River and Bird River PCB TMDL Report Document version: October, 2015
2.0 SETTING AND WATER QUALITY DESCRIPTION
2.1 General Setting
Location
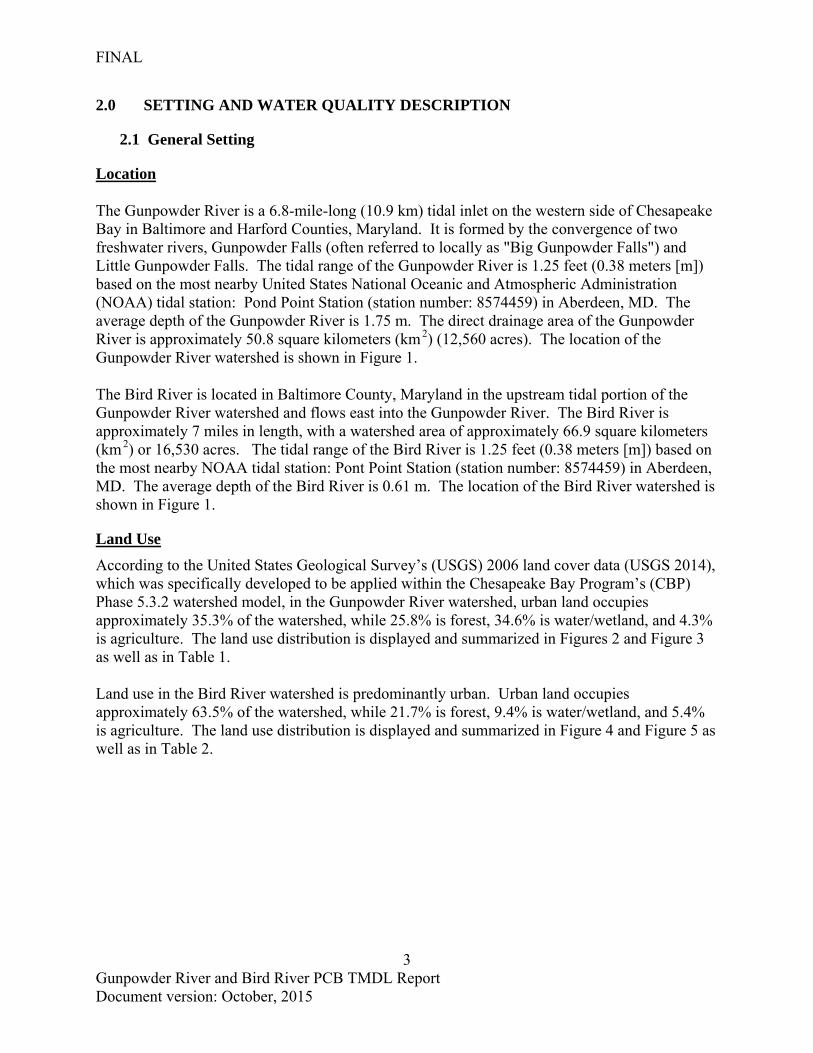
The Gunpowder River is a 6.8-mile-long (10.9 km) tidal inlet on the western side of Chesapeake Bay in Baltimore and Harford Counties, Maryland. It is formed by the convergence of two freshwater rivers, Gunpowder Falls (often referred to locally as "Big Gunpowder Falls") and Little Gunpowder Falls. The tidal range of the Gunpowder River is 1.25 feet (0.38 meters [m]) based on the most nearby United States National Oceanic and Atmospheric Administration (NOAA) tidal station: Pond Point Station (station number: 8574459) in Aberdeen, MD. The average depth of the Gunpowder River is 1.75 m. The direct drainage area of the Gunpowder River is approximately 50.8 square kilometers (km 2) (12,560 acres). The location of the Gunpowder River watershed is shown in Figure 1.
The Bird River is located in Baltimore County, Maryland in the upstream tidal portion of the Gunpowder River watershed and flows east into the Gunpowder River. The Bird River is approximately 7 miles in length, with a watershed area of approximately 66.9 square kilometers (km 2) or 16,530 acres. The tidal range of the Bird River is 1.25 feet (0.38 meters [m]) based on the most nearby NOAA tidal station: Pont Point Station (station number: 8574459) in Aberdeen, MD. The average depth of the Bird River is 0.61 m. The location of the Bird River watershed is shown in Figure 1.
Land Use
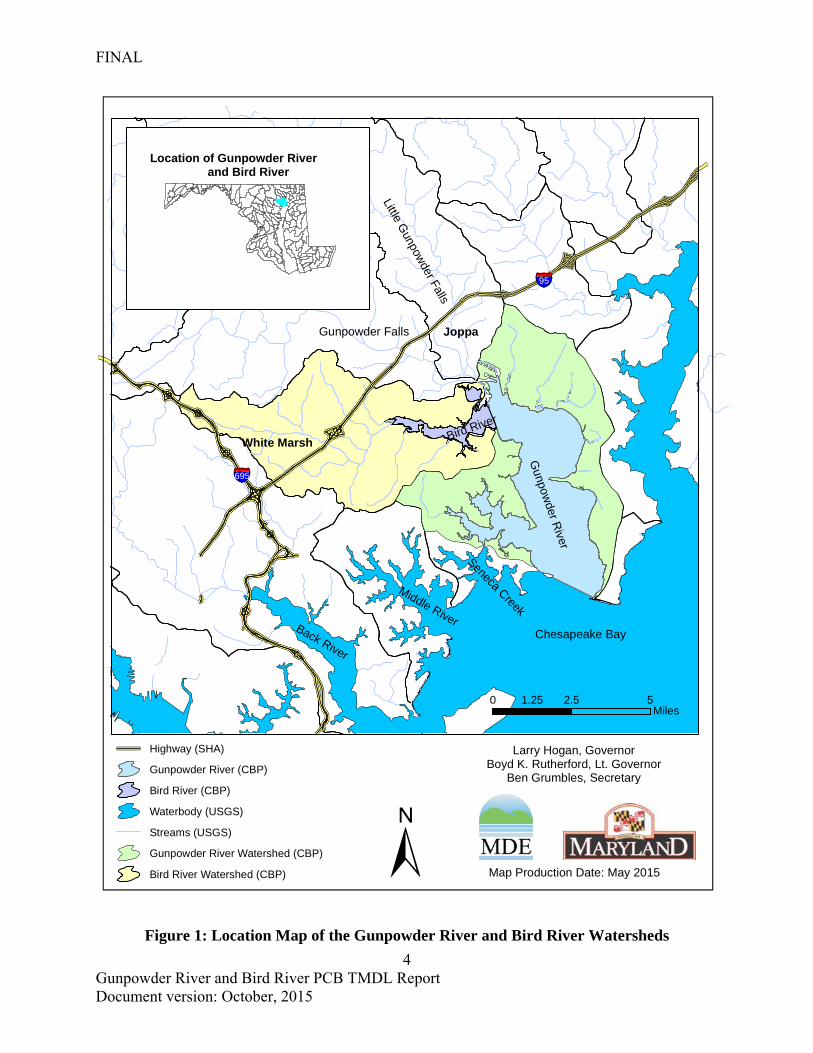
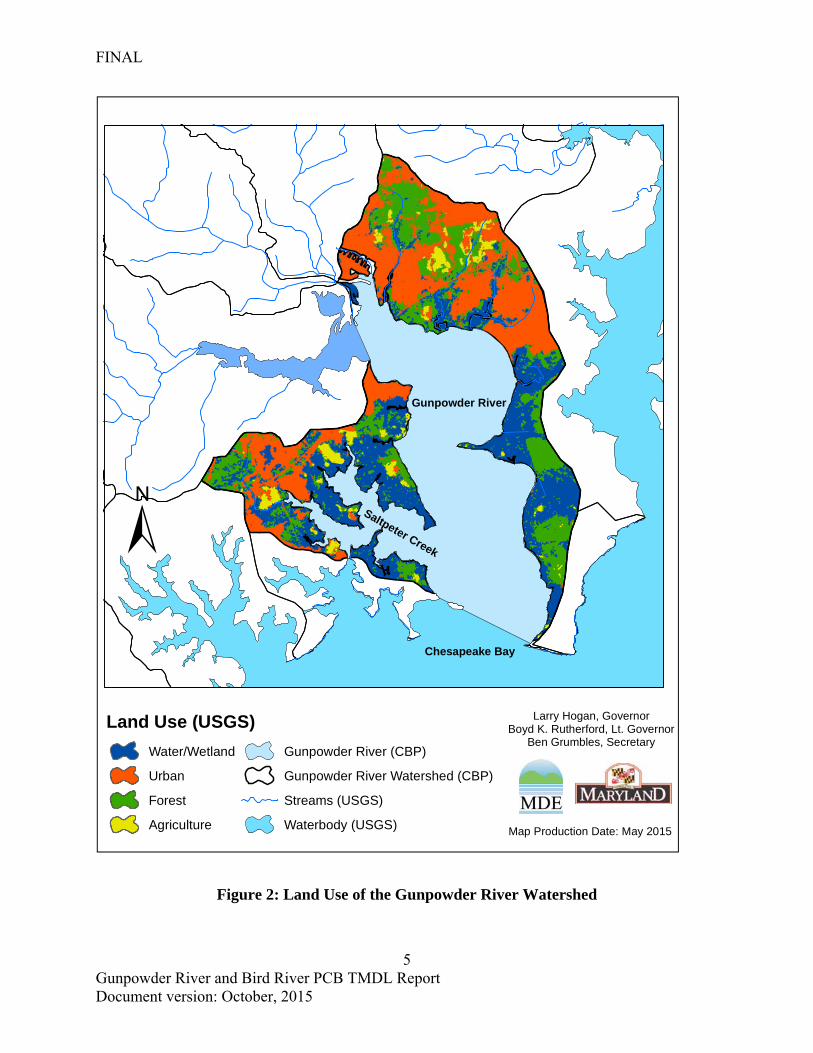
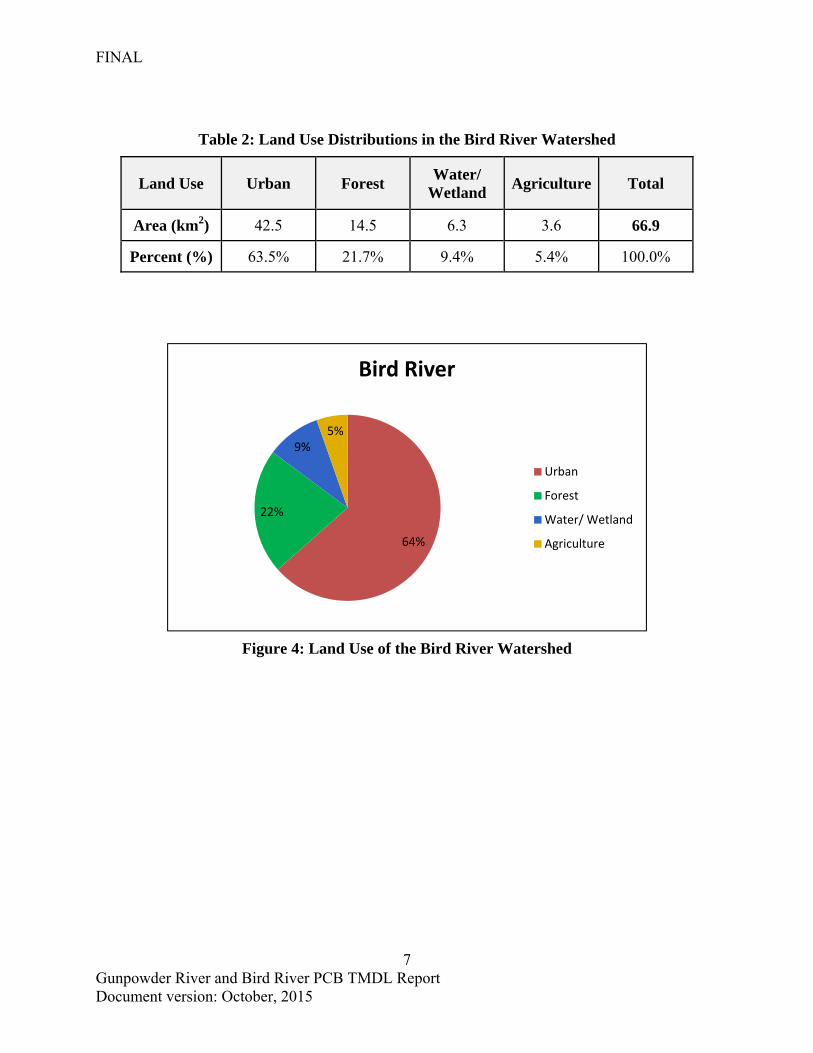
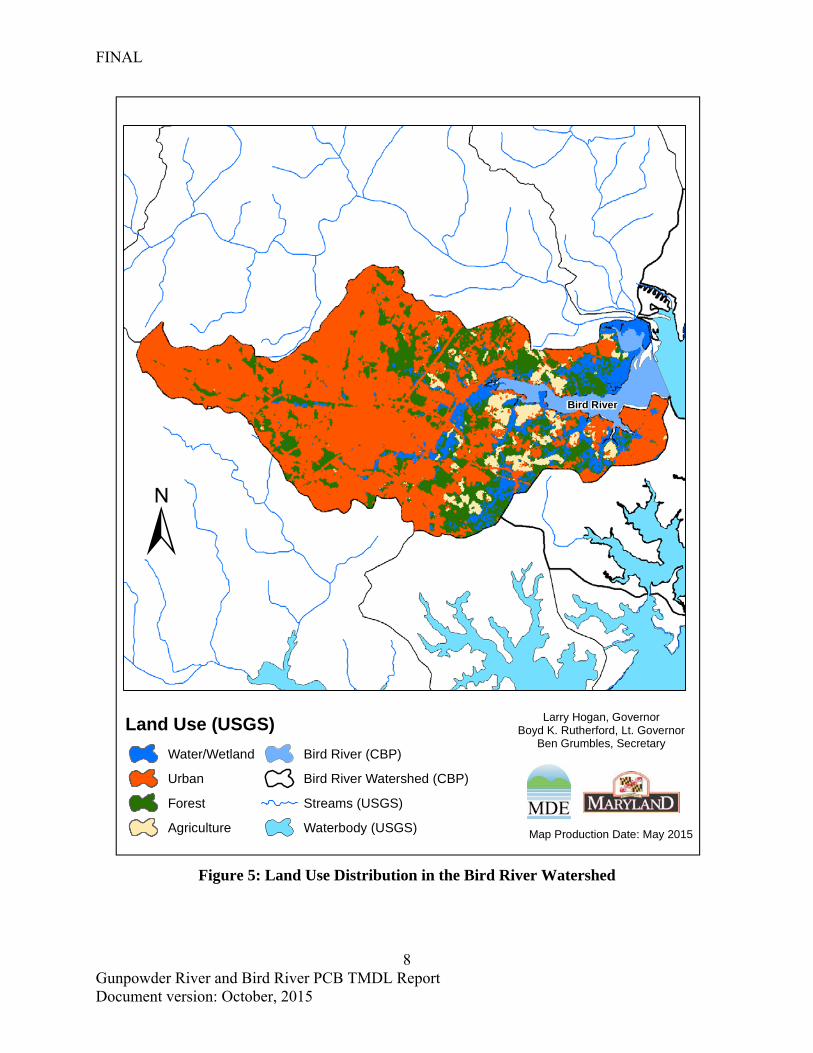
According to the United States Geological Survey’s (USGS) 2006 land cover data (USGS 2014), which was specifically developed to be applied within the Chesapeake Bay Program’s (CBP) Phase 5.3.2 watershed model, in the Gunpowder River watershed, urban land occupies approximately 35.3% of the watershed, while 25.8% is forest, 34.6% is water/wetland, and 4.3% is agriculture. The land use distribution is displayed and summarized in Figures 2 and Figure 3 as well as in Table 1. Land use in the Bird River watershed is predominantly urban. Urban land occupies approximately 63.5% of the watershed, while 21.7% is forest, 9.4% is water/wetland, and 5.4% is agriculture. The land use distribution is displayed and summarized in Figure 4 and Figure 5 as well as in Table 2.
FINAL
4 Gunpowder River and Bird River PCB TMDL Report Document version: October, 2015
Figure 1: Location Map of the Gunpowder River and Bird River Watersheds
Chesapeake Bay
Gunpow
der River
§̈¦95
Bird River
§̈¦695
Joppa
White Marsh
Middle RiverBack River
Seneca Creek
Gunpowder Falls
Little Gunpow
der Falls
0 2.5 51.25Miles
Location of Gunpowder River and Bird River
Highway (SHA)
Gunpowder River (CBP)
Bird River (CBP)
Waterbody (USGS)
Streams (USGS)
Gunpowder River Watershed (CBP)
Bird River Watershed (CBP) Map Production Date: May 2015
Larry Hogan, GovernorBoyd K. Rutherford, Lt. Governor
Ben Grumbles, Secretary
±
FINAL
5 Gunpowder River and Bird River PCB TMDL Report Document version: October, 2015
Figure 2: Land Use of the Gunpowder River Watershed
Chesapeake Bay
Saltpeter Creek
Gunpowder River
Map Production Date: May 2015
Larry Hogan, GovernorBoyd K. Rutherford, Lt. Governor
Ben Grumbles, Secretary
±
Land Use (USGS)
Water/Wetland
Urban
Forest
Agriculture
Gunpowder River (CBP)
Gunpowder River Watershed (CBP)
Streams (USGS)
Waterbody (USGS)
FINAL
6 Gunpowder River and Bird River PCB TMDL Report Document version: October, 2015
Table 1: Land Use Distributions in the Gunpowder River Watershed
Land Use Urban Forest Water/
Wetland Agriculture Total
Area (km2) 17.9 13.1 17.6 2.2 50.8
Percent (%) 35.3% 25.8% 34.6% 4.3% 100.0%
Figure 3: Land Use Distribution in the Gunpowder River Watershed
35%
26%
35%
4%
Gunpowder River
Urban
Forest
Water/ Wetland
Agriculture
FINAL
7 Gunpowder River and Bird River PCB TMDL Report Document version: October, 2015
Table 2: Land Use Distributions in the Bird River Watershed
Land Use Urban Forest Water/
Wetland Agriculture Total
Area (km2) 42.5 14.5 6.3 3.6 66.9
Percent (%) 63.5% 21.7% 9.4% 5.4% 100.0%
Figure 4: Land Use of the Bird River Watershed
64%
22%
9%5%
Bird River
Urban
Forest
Water/ Wetland
Agriculture
FINAL
8 Gunpowder River and Bird River PCB TMDL Report Document version: October, 2015
Figure 5: Land Use Distribution in the Bird River Watershed
Bird River
Map Production Date: May 2015
Larry Hogan, GovernorBoyd K. Rutherford, Lt. Governor
Ben Grumbles, Secretary
±
Land Use (USGS)
Water/Wetland
Urban
Forest
Agriculture
Bird River (CBP)
Bird River Watershed (CBP)
Streams (USGS)
Waterbody (USGS)
FINAL
9 Gunpowder River and Bird River PCB TMDL Report Document version: October, 2015
2.2 Water Quality Characterization and Impairment
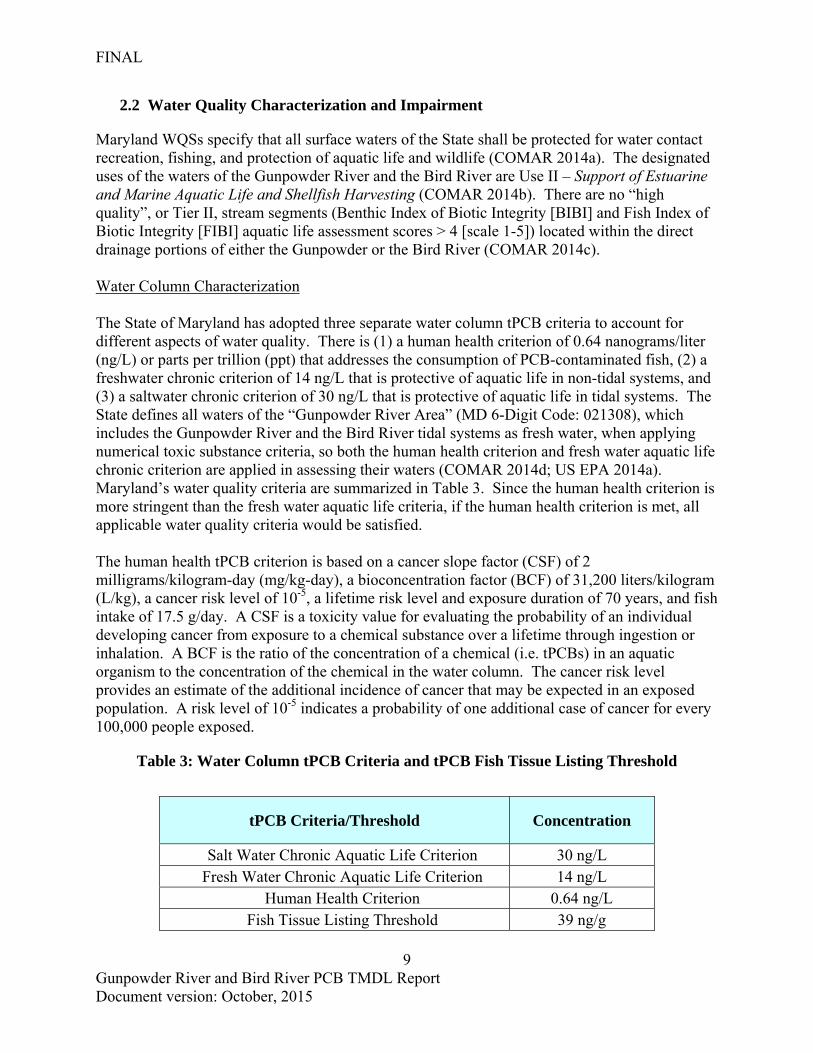
Maryland WQSs specify that all surface waters of the State shall be protected for water contact recreation, fishing, and protection of aquatic life and wildlife (COMAR 2014a). The designated uses of the waters of the Gunpowder River and the Bird River are Use II – Support of Estuarine and Marine Aquatic Life and Shellfish Harvesting (COMAR 2014b). There are no “high quality”, or Tier II, stream segments (Benthic Index of Biotic Integrity [BIBI] and Fish Index of Biotic Integrity [FIBI] aquatic life assessment scores > 4 [scale 1-5]) located within the direct drainage portions of either the Gunpowder or the Bird River (COMAR 2014c). Water Column Characterization The State of Maryland has adopted three separate water column tPCB criteria to account for different aspects of water quality. There is (1) a human health criterion of 0.64 nanograms/liter (ng/L) or parts per trillion (ppt) that addresses the consumption of PCB-contaminated fish, (2) a freshwater chronic criterion of 14 ng/L that is protective of aquatic life in non-tidal systems, and (3) a saltwater chronic criterion of 30 ng/L that is protective of aquatic life in tidal systems. The State defines all waters of the “Gunpowder River Area” (MD 6-Digit Code: 021308), which includes the Gunpowder River and the Bird River tidal systems as fresh water, when applying numerical toxic substance criteria, so both the human health criterion and fresh water aquatic life chronic criterion are applied in assessing their waters (COMAR 2014d; US EPA 2014a). Maryland’s water quality criteria are summarized in Table 3. Since the human health criterion is more stringent than the fresh water aquatic life criteria, if the human health criterion is met, all applicable water quality criteria would be satisfied. The human health tPCB criterion is based on a cancer slope factor (CSF) of 2 milligrams/kilogram-day (mg/kg-day), a bioconcentration factor (BCF) of 31,200 liters/kilogram (L/kg), a cancer risk level of 10-5, a lifetime risk level and exposure duration of 70 years, and fish intake of 17.5 g/day. A CSF is a toxicity value for evaluating the probability of an individual developing cancer from exposure to a chemical substance over a lifetime through ingestion or inhalation. A BCF is the ratio of the concentration of a chemical (i.e. tPCBs) in an aquatic organism to the concentration of the chemical in the water column. The cancer risk level provides an estimate of the additional incidence of cancer that may be expected in an exposed population. A risk level of 10-5 indicates a probability of one additional case of cancer for every 100,000 people exposed.
Table 3: Water Column tPCB Criteria and tPCB Fish Tissue Listing Threshold
tPCB Criteria/Threshold Concentration
Salt Water Chronic Aquatic Life Criterion 30 ng/L Fresh Water Chronic Aquatic Life Criterion 14 ng/L
Human Health Criterion 0.64 ng/L Fish Tissue Listing Threshold 39 ng/g
FINAL
10 Gunpowder River and Bird River PCB TMDL Report Document version: October, 2015
In 2012 and 2013, monitoring surveys were conducted by MDE to measure water column tPCB concentrations in the Gunpowder and Bird Rivers. Tidal monitoring was conducted at five stations in the Gunpowder River and two stations in the Bird River. The water column mean tPCB concentrations in the Gunpowder River and the Bird River do not exceed the human health tPCB criterion, meaning that all applicable water column criteria are met in both rivers. In addition to providing assessment data, the monitoring plan was developed in order to fully characterize the impairment and inform model development. One of the tidal stations was located at the boundary between the Gunpowder River and the main stem of the Chesapeake Bay, to evaluate the tidal influences from the Bay. Sediment samples were also collected at each tidal station, including the boundary station, to characterize tPCB sediment concentrations. Non-tidal water column monitoring was conducted concurrently with the tidal monitoring at one station in the direct drainage watershed of Gunpowder River and four non-tidal stations in the Bird River watershed. These data were required to estimate loadings from the watershed. Water column tPCB data were also taken from two non-tidal stations in the Little Gunpowder Falls and Lower Gunpowder Falls to characterize upstream loads from these rivers. Figure 6 provides a location map of the water column and sediment monitoring station locations. Summaries of water column and sediment data from the Gunpowder River and the Bird River are provided in Table 4 and Table 5, respectively. Fish Tissue Characterization In addition to the water column criteria described above, fish tissue monitoring is also used as an indicator of PCB water quality conditions. Maryland regularly collects and analyzes fish tissue monitoring data in order to issue fish consumption advisories and recommendations, and determine whether Maryland waterbodies are meeting the “fishing” designated use. The State’s tPCB fish tissue listing threshold of 39 ng/g is based on a fish consumption limit of 4, 8-ounce meals per month, and is applied to the skinless fillet of the fish, the edible portion typically consumed by humans. When tPCB fish tissue concentrations exceed this threshold, the waterbody is listed as impaired for PCBs in fish tissue in Maryland’s Integrated Report as it is not supportive of the “fishing” designated use (MDE 2012).
FINAL
11 Gunpowder River and Bird River PCB TMDL Report Document version: October, 2015
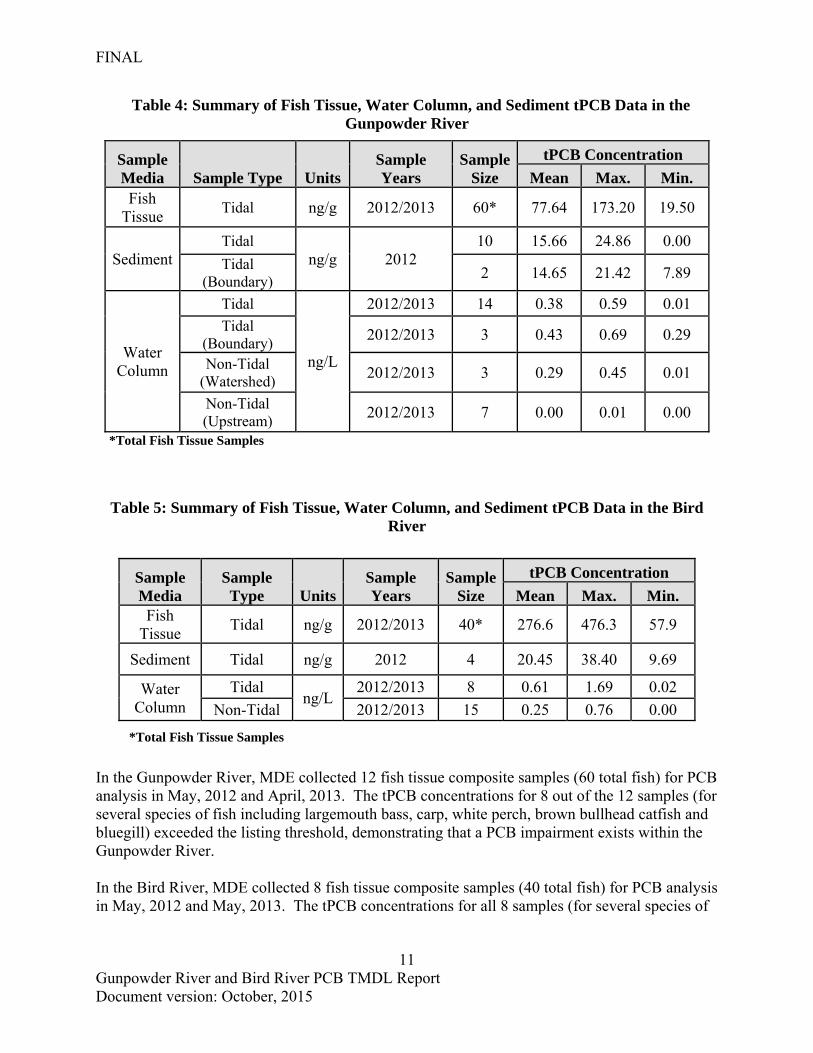
Table 4: Summary of Fish Tissue, Water Column, and Sediment tPCB Data in the Gunpowder River
Sample Media Sample Type Units
Sample Years
Sample Size
tPCB Concentration
Mean Max. Min. Fish
Tissue Tidal ng/g 2012/2013 60* 77.64 173.20 19.50
Sediment Tidal
ng/g 2012 10 15.66 24.86 0.00
Tidal (Boundary)
2 14.65 21.42 7.89
Water Column
Tidal
ng/L
2012/2013 14 0.38 0.59 0.01 Tidal
(Boundary) 2012/2013 3 0.43 0.69 0.29
Non-Tidal (Watershed)
2012/2013 3 0.29 0.45 0.01
Non-Tidal (Upstream)
2012/2013 7 0.00 0.01 0.00
*Total Fish Tissue Samples
Table 5: Summary of Fish Tissue, Water Column, and Sediment tPCB Data in the Bird River
Sample Media
Sample Type Units
Sample Years
Sample Size
tPCB Concentration
Mean Max. Min. Fish
Tissue Tidal ng/g 2012/2013 40* 276.6 476.3 57.9
Sediment Tidal ng/g 2012 4 20.45 38.40 9.69
Water Column
Tidal ng/L
2012/2013 8 0.61 1.69 0.02
Non-Tidal 2012/2013 15 0.25 0.76 0.00
*Total Fish Tissue Samples
In the Gunpowder River, MDE collected 12 fish tissue composite samples (60 total fish) for PCB analysis in May, 2012 and April, 2013. The tPCB concentrations for 8 out of the 12 samples (for several species of fish including largemouth bass, carp, white perch, brown bullhead catfish and bluegill) exceeded the listing threshold, demonstrating that a PCB impairment exists within the Gunpowder River. In the Bird River, MDE collected 8 fish tissue composite samples (40 total fish) for PCB analysis in May, 2012 and May, 2013. The tPCB concentrations for all 8 samples (for several species of
FINAL
12 Gunpowder River and Bird River PCB TMDL Report Document version: October, 2015
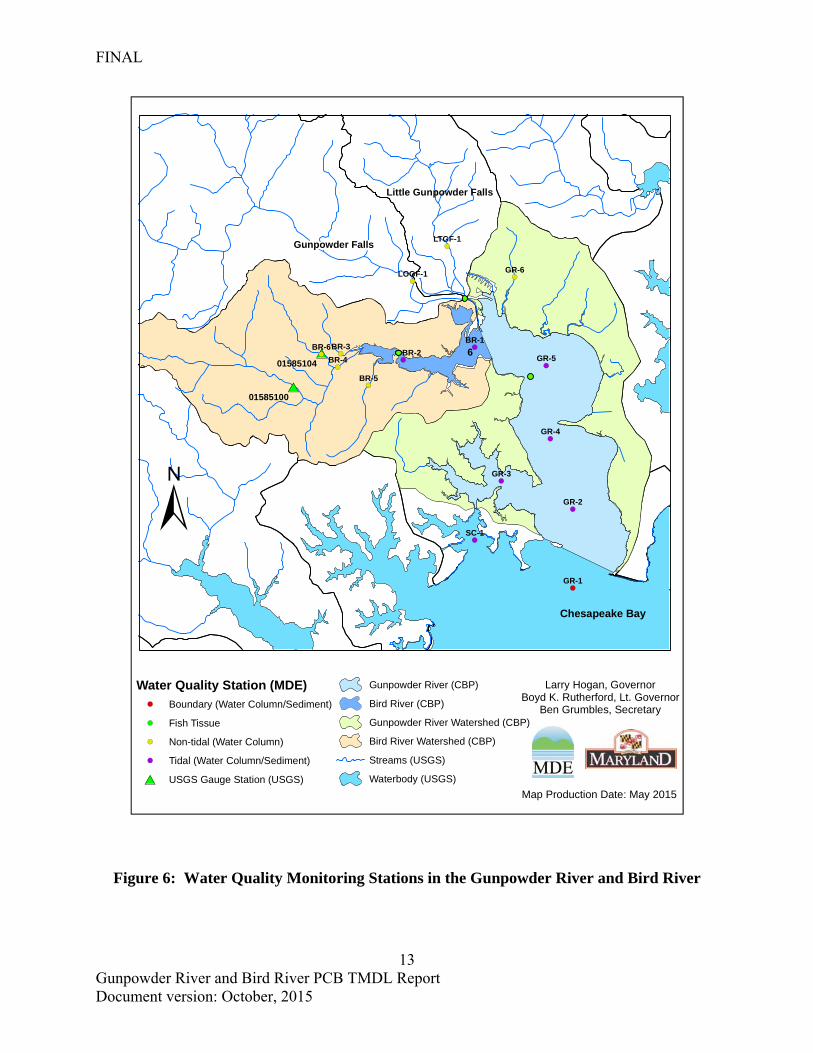
fish including channel catfish, brown bullhead, white perch and carp) exceeded the listing threshold, demonstrating that a PCB impairment exists within the Bird River. A location map of the fish sampling stations is shown in Figure 6. A summary of the fish tissue sampling data is provided in for the Gunpowder River in Table 4, and for the Bird River in Table 5. Appendix G contains tables of all the water column, sediment and fish tissue tPCB data in the Gunpowder River and the Bird River. Analytical Methods PCB analytical services were provided by the University of Maryland Center for Environmental Science (UMCES), using a slightly modified version of the PCB congener specific method described in Ashley and Baker (1999), in which the identities and concentrations of each congener in a mixed Aroclor standard are determined based on their chromatographic retention times relative to the internal standards. This approach was based on the approved EPA Method 8082 which was developed in 1996. A detailed description of this method is provided in Appendix A.
FINAL
13 Gunpowder River and Bird River PCB TMDL Report Document version: October, 2015
Figure 6: Water Quality Monitoring Stations in the Gunpowder River and Bird River
#*
#*!(
!(!(
!(
!(
!(
!(
!(
!(
!(
!(
!(!(
!(
!(
Little Gunpowder Falls
Chesapeake Bay
Gunpowder Falls
601585104
01585100
SC-1
GR-6
GR-5
GR-4
GR-3
GR-2
GR-1
BR-6
BR-5
BR-4
BR-3BR-2
BR-1
LTGF-1
LOGF-1
Map Production Date: May 2015
Larry Hogan, GovernorBoyd K. Rutherford, Lt. Governor
Ben Grumbles, Secretary
±
Water Quality Station (MDE)!( Boundary (Water Column/Sediment)
!( Fish Tissue
!( Non-tidal (Water Column)
!( Tidal (Water Column/Sediment)
#* USGS Gauge Station (USGS)
Gunpowder River (CBP)
Bird River (CBP)
Gunpowder River Watershed (CBP)
Bird River Watershed (CBP)
Streams (USGS)
Waterbody (USGS)
FINAL
14 Gunpowder River and Bird River PCB TMDL Report Document version: October, 2015
3.0 TARGETED WATER COLUMN AND SEDIMENT TMDL ENDPOINTS
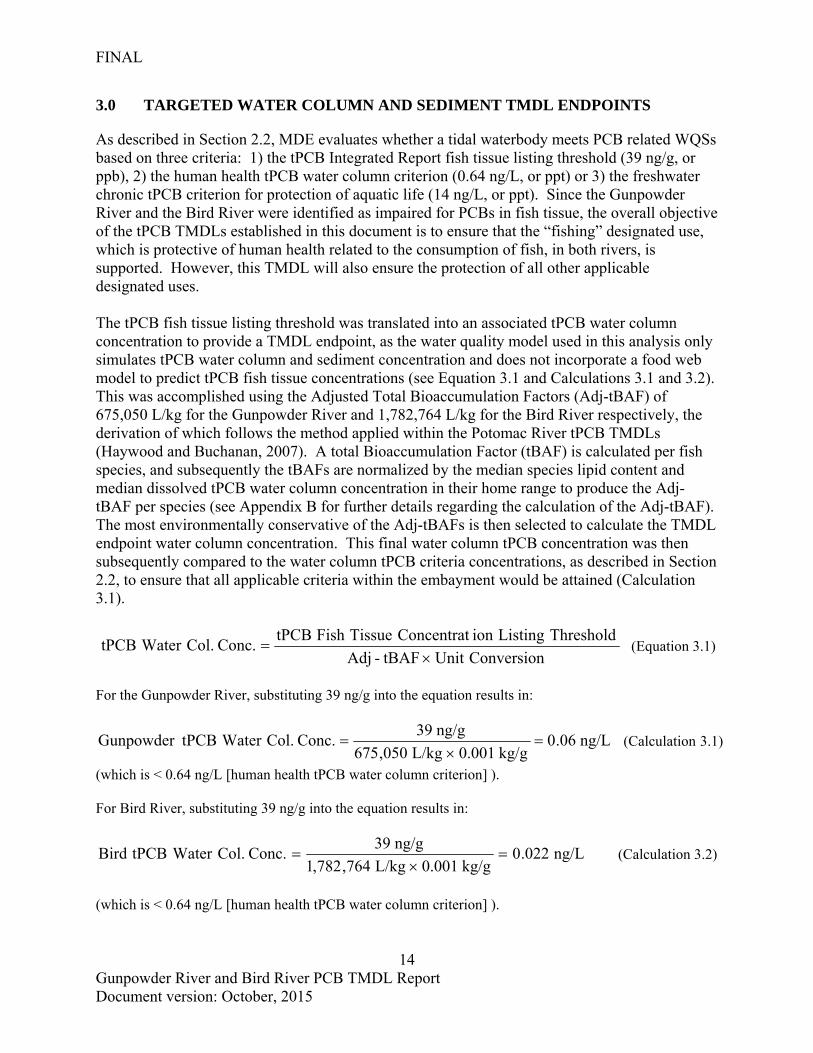
As described in Section 2.2, MDE evaluates whether a tidal waterbody meets PCB related WQSs based on three criteria: 1) the tPCB Integrated Report fish tissue listing threshold (39 ng/g, or ppb), 2) the human health tPCB water column criterion (0.64 ng/L, or ppt) or 3) the freshwater chronic tPCB criterion for protection of aquatic life (14 ng/L, or ppt). Since the Gunpowder River and the Bird River were identified as impaired for PCBs in fish tissue, the overall objective of the tPCB TMDLs established in this document is to ensure that the “fishing” designated use, which is protective of human health related to the consumption of fish, in both rivers, is supported. However, this TMDL will also ensure the protection of all other applicable designated uses. The tPCB fish tissue listing threshold was translated into an associated tPCB water column concentration to provide a TMDL endpoint, as the water quality model used in this analysis only simulates tPCB water column and sediment concentration and does not incorporate a food web model to predict tPCB fish tissue concentrations (see Equation 3.1 and Calculations 3.1 and 3.2). This was accomplished using the Adjusted Total Bioaccumulation Factors (Adj-tBAF) of 675,050 L/kg for the Gunpowder River and 1,782,764 L/kg for the Bird River respectively, the derivation of which follows the method applied within the Potomac River tPCB TMDLs (Haywood and Buchanan, 2007). A total Bioaccumulation Factor (tBAF) is calculated per fish species, and subsequently the tBAFs are normalized by the median species lipid content and median dissolved tPCB water column concentration in their home range to produce the Adj-tBAF per species (see Appendix B for further details regarding the calculation of the Adj-tBAF). The most environmentally conservative of the Adj-tBAFs is then selected to calculate the TMDL endpoint water column concentration. This final water column tPCB concentration was then subsequently compared to the water column tPCB criteria concentrations, as described in Section 2.2, to ensure that all applicable criteria within the embayment would be attained (Calculation 3.1).
ConversionUnit tBAF-Adj
Threshold Listingion Concentrat TissueFish tPCBConc. Col. Water tPCB
(Equation 3.1)
For the Gunpowder River, substituting 39 ng/g into the equation results in:
ng/L .060kg/g 0.001L/kg 050,675
ng/g 39Conc. Col. Water tPCBGunpowder
(Calculation 3.1)
(which is < 0.64 ng/L [human health tPCB water column criterion] ). For Bird River, substituting 39 ng/g into the equation results in:
ng/L .0220kg/g 0.001L/kg 764,782,1
ng/g 39Conc. Col. Water tPCBBird
(Calculation 3.2)
(which is < 0.64 ng/L [human health tPCB water column criterion] ).
FINAL
15 Gunpowder River and Bird River PCB TMDL Report Document version: October, 2015
Based on this analysis, the water column tPCB concentrations of 0.06 ng/L and 0.022 ng/L, derived from the tPCB fish tissue listing threshold, are selected as the TMDL endpoints for the Gunpowder River and the Bird River respectively. These endpoints are more stringent than the value of 0.64 ng/L for human health and the freshwater chronic aquatic life tPCB criterion of 14 ng/L. Similarly, in order to establish tPCB TMDL endpoints for the sediment in the rivers, a target tPCB sediment concentration was derived from the tPCB fish tissue listing threshold as the water quality model used in this analysis only simulates tPCB sediment concentrations and not tPCB fish tissue concentrations to apply within this analysis as the sediment TMDL endpoint concentration (see Equation 3.2 and Calculations 3.3 and 3.4). This was done using the Adjusted Sediment Bioaccumulation Factor (Adj-SediBAF) of 24.92 (unitless) for the Gunpowder River and 34.45 (unitless) for the Bird River, respectively, the derivation of which follows the method applied within the Potomac River tPCB TMDLs (Haywood and Buchanan 2007). Similar to the calculation of the water column Adj-tBAF, a sediment Bioaccumulation Factor (SediBAF) is calculated per fish species, and subsequently the SediBAFs are normalized by the median species lipid content and median organic carbon tPCB sediment concentration in their home range to produce the Adj-SediBAF per species (see Appendix B for further details regarding the calculation of the Adj-SediBAF). The most environmentally conservative of the Adj-SediBAFs is then selected to calculate the sediment TMDL endpoint tPCB concentration.
SediBAF-Adj
Threshold ListingionConcentrat Tissue FishtPCBionConcentratSediment tPCB (Equation 3.2)
For the Gunpowder River, substituting 39 ng/g into the equation results in:
ng/g 56.124.92
ng/g 39Conc.Sediment tPCBGunpowder (Calculation 3.3)
For the Bird River, substituting 39 ng/g into the equation results in:
ng/g 13.134.45
ng/g 39Conc.Sediment River tPCB Bird (Calculation 3.4)
Based on this analysis, the tPCB levels of 1.56 ng/g and 1.13 ng/g derived from the fish tissue listing threshold are set as the sediment TMDL endpoints in the Gunpowder River and the Bird River, respectively. The CWA, as recently interpreted by the United States District Court for the District of Columbia, requires TMDLs to be protective of all the designated uses applicable to a particular waterbody (US District Court for the District of Columbia 2011). In addition to the “fishing” designated use, the TMDL presented herein is also supportive of the other applicable designated uses within the impaired waters, as described in the Introduction to this report and in Section 2.2. These include “marine and estuarine aquatic life”, “shellfish harvesting”, and “water contact recreation”. The water column endpoint tPCB concentrations that will be used in this TMDL analysis and derived as described above, are more stringent than Maryland’s freshwater aquatic
FINAL
16 Gunpowder River and Bird River PCB TMDL Report Document version: October, 2015
life chronic criterion tPCB water column concentration. This indicates that the TMDLs are protective of the “aquatic life” designated use, specifically the protection of “marine and estuarine aquatic life and shellfish harvesting”. Lastly, the designated use for "water contact recreation" is not associated with any potential human health risks due to PCB exposure. Dermal contact and accidental consumption of water from activities associated with "water contact recreation" is not a significant pathway for the uptake of PCBs. The EPA human health criterion was developed solely based on aquatic organism (e.g. fish or shellfish) consumption, as drinking water consumption does not pose any risk for cancer development at environmentally relevant levels. The only human health risk associated with PCB exposure is through the consumption of aquatic organisms.
FINAL
17 Gunpowder River and Bird River PCB TMDL Report Document version: October, 2015
4.0 SOURCE ASSESSMENT
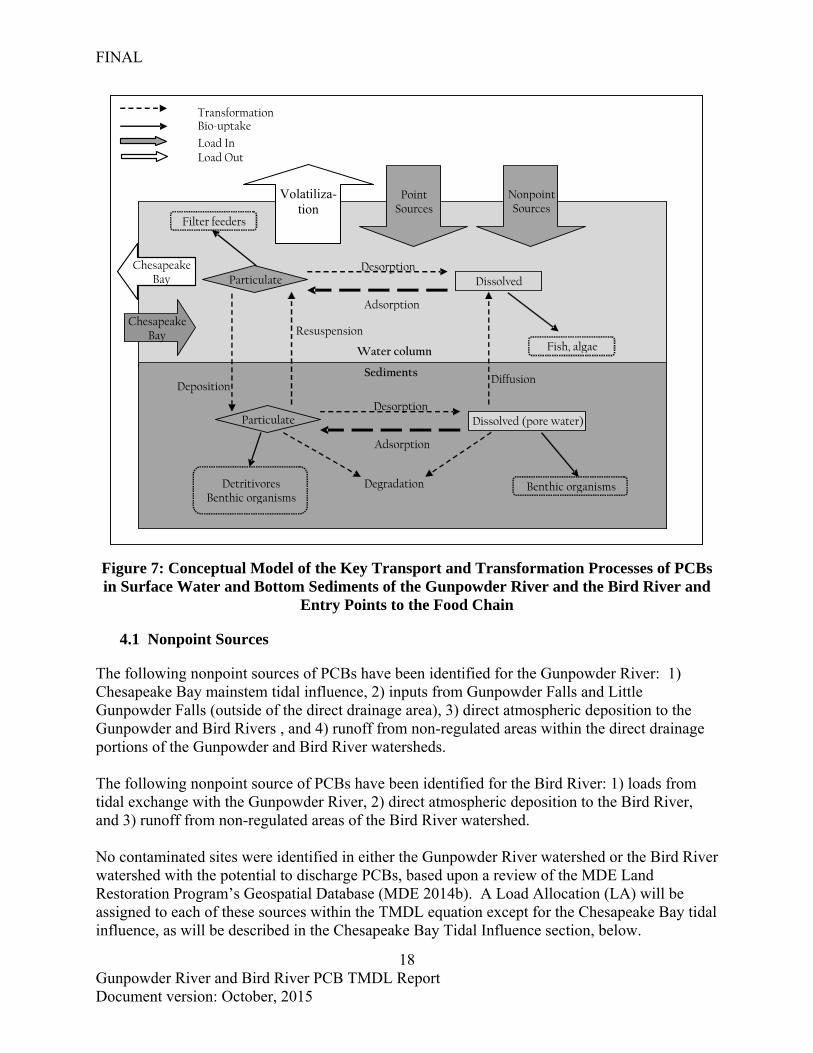
PCBs do not occur naturally in the environment. Therefore, unless existing or historical anthropogenic sources are present, their natural background levels are expected to be zero. Although PCBs are no longer manufactured in the United States, they are still being released to the environment via accidental fires, leaks, or spills from PCB-containing equipment; potential leaks from hazardous waste sites that contain PCBs; illegal or improper dumping; disposal of PCB-containing products (e.g., transformers, old fluorescent lighting fixtures, electrical devices or appliances containing PCB capacitors, old microscope oil, and old hydraulic oil) into landfills not designed to handle hazardous waste; and through inadvertent production during manufacturing processes. Once in the environment, PCBs do not readily break down and tend to cycle between various environmental media such as air, water, and soil. PCBs exhibit low water solubility, are moderately volatile, strongly adsorb to organics, and preferentially partition to upland and bottom sediments. The major fate process for PCBs in water is adsorption to sediment or other organic matter. Adsorption and subsequent sedimentation may immobilize PCBs for relatively long periods of time. However, desorption into the water column may also occur; PCBs contained in layers near the sediment surface may be slowly released over time, while concentrations present in the lower layers may be effectively sequestered from environmental distribution (RETEC 2002). The linkage between the “fishing” designated use and PCB concentrations in the water column is via the uptake and bioaccumulation of PCBs by aquatic organisms. Bioaccumulation occurs when the combined uptake rate of a given chemical from food, water, and/or sediment by an organism exceeds the organism’s ability to remove the chemical through metabolic functions, dilution, or excretion, resulting in excess concentrations of the chemical being stored in the body of the organism. Depending on the life cycle and feeding patterns, aquatic organisms can bioaccumulate PCBs via exposure to concentrations present in the water column (in dissolved and/or particulate form) and sediments, as well as from consumption of other organisms resulting in the biomagnification of PCBs within the food chain (RETEC 2002). Humans can be exposed to PCBs via consumption of aquatic organisms, which over time have bioaccumulated PCBs. A simplified conceptual model of PCB fate and transport in the Gunpowder River and the Bird River is diagramed in Figure 7. PCB sources, resulting primarily from historical uses of these compounds and potential releases to the environment as described above, include point and nonpoint sources. This section provides a summary of these existing nonpoint and point sources that have been identified as contributing tPCB loads to the impaired waters. The modeling framework for the Gunpowder River PCBs TMDL considers all direct drainage areas within both the Gunpowder and Bird River watersheds. The modeling framework for the Bird River considers only areas within the Bird River watershed.
FINAL
18 Gunpowder River and Bird River PCB TMDL Report Document version: October, 2015
Figure 7: Conceptual Model of the Key Transport and Transformation Processes of PCBs in Surface Water and Bottom Sediments of the Gunpowder River and the Bird River and
Entry Points to the Food Chain
4.1 Nonpoint Sources
The following nonpoint sources of PCBs have been identified for the Gunpowder River: 1) Chesapeake Bay mainstem tidal influence, 2) inputs from Gunpowder Falls and Little Gunpowder Falls (outside of the direct drainage area), 3) direct atmospheric deposition to the Gunpowder and Bird Rivers , and 4) runoff from non-regulated areas within the direct drainage portions of the Gunpowder and Bird River watersheds. The following nonpoint source of PCBs have been identified for the Bird River: 1) loads from tidal exchange with the Gunpowder River, 2) direct atmospheric deposition to the Bird River, and 3) runoff from non-regulated areas of the Bird River watershed. No contaminated sites were identified in either the Gunpowder River watershed or the Bird River watershed with the potential to discharge PCBs, based upon a review of the MDE Land Restoration Program’s Geospatial Database (MDE 2014b). A Load Allocation (LA) will be assigned to each of these sources within the TMDL equation except for the Chesapeake Bay tidal influence, as will be described in the Chesapeake Bay Tidal Influence section, below.
Filter feeders
Fish, algae
DissolvedParticulate
Adsorption
Desorption
Nonpoint Sources
PointSources
Water column
Sediments
Benthic organisms
Dissolved (pore water)Particulate Desorption
Adsorption
Deposition
Resuspension
Degradation
Chesapeake Bay Conowingo
Dam
Detritivores Benthic organisms
Transformation Bio -uptake
Load In Load Out
Diffusion
Chesapeake Bay
Filter feeders
Fish, algae
DissolvedParticulate
Adsorption
Desorption
Nonpoint Sources
PointSources
Water column
Sediments
Benthic organisms
Dissolved (pore water)Particulate Desorption
Adsorption
Deposition
Resuspension
Degradation
Chesapeake Bay
Detritivores Benthic organisms
Transformation Bio -uptake
Load In Load Out
Diffusion
Chesapeake Bay
Volatiliza-tion
FINAL
19 Gunpowder River and Bird River PCB TMDL Report Document version: October, 2015
The transport of PCBs from bottom sediments to the water column through resuspension and diffusion can also be a major source of PCBs in estuarine systems. However, as will be discussed in the Resuspension and Diffusion of Bottom Sediments section, this is not considered a source under the framework of this TMDL.
Chesapeake Bay Mainstem Tidal Influence
The water quality model, applying the observed tPCB concentrations measured near the mouth of the Gunpowder River, predicts a gross tPCB input of 34 g/year from the Chesapeake Bay to the Gunpowder River and a gross tPCB output of 223 g/year from the Gunpowder River to the Bay. These loads result in a net tPCB transport of 189 g/year from the Gunpowder River to the Bay.
Exchanges between the Gunpowder River and the Bird River
The Bird River flows into the upstream portion of the Gunpowder River. The water quality model simulates the Bird River and the Gunpowder River as one system. Applying the observed tPCB concentrations, the model predict a gross tPCB load of 49g/year from the Gunpowder River to the Bird River and a gross tPCB load of 143g/year from the Bird River to the Gunpowder River. For the Gunpowder TMDL, loads from the exchange with the Bird River will be incorporated as explicit loads from the Bird River watershed runoff and direct atmospheric deposition to the Bird River surface, so loads from this boundary will not be included in the equation.
Inputs from Gunpowder Falls and Little Gunpowder Falls
Gunpowder Falls and Little Gunpowder Falls flow directly into the upstream section of the Gunpowder River. Based on the flow and measured tPCB concentrations at these two rivers, their combined baseline tPCB loads are estimated to be 0.24 g/year. This upstream load estimate represents an aggregate loading from all potential source sectors including urban stormwater, agriculture and wastewater treatment plants (WWTPs). Loads from specific sources into these upstream watersheds are not individually quantified and described in this document.
Atmospheric Deposition
PCBs enter the atmosphere through volatilization. There is no recent study of the atmospheric deposition of PCBs to the surface of the Gunpowder River and the Bird River. An Atmospheric Deposition Study by the CBP (US EPA 1999) estimated a net deposition of 16.3 micrograms/square meter/year (µg/m2/year) of tPCBs for urban areas and a net deposition of 1.6 µg/m2/year of tPCBs for regional (non urban) areas. The urban deposition rate defined in CBP’s study is a result of heavily urbanized areas comprised primarily of high density residential, industrial and commercial land uses, so the non urban deposition rate is considered to be more representative of deposition in lower density urban or suburban areas. In the Delaware River estuary, an extensive atmospheric deposition monitoring program conducted by the Delaware River Basin Commission (DRBC) found PCB deposition rates ranging from 1.3 (non urban) to 17.5 (urban) µg/m2/year of tPCBs (DRBC 2003).
FINAL
20 Gunpowder River and Bird River PCB TMDL Report Document version: October, 2015
For the Gunpowder River watershed, urban land use accounts for about 35.3% of the watershed. Since this is largely low- to medium-density residential, the 1.6 µg/m2/year tPCB depositional rate for non urban areas resultant from CBP’s 1999 study will be applied. For the Bird River watershed, while urban land use accounts for about 63.5% of the watershed, the land area is also comprised primarily of low- and medium-density residential land uses. For this watershed, the 1.6 µg/m2/year tPCB depositional rate for non urban areas will again be applied. Therefore, the atmospheric deposition load to the direct watershed can be calculated by multiplying 1.6 µg/m2/year by the Gunpowder River watershed area of 50.8 km2 and the Bird River watershed area of 66.9 km2, which results in a load of 81 g/year for Gunpowder River and a load of 107 g/year for the Bird River. However, according to Totten et al. (2006), only a portion of the atmospherically deposited tPCB load to the terrestrial part of the watershed is expected to be delivered to the embayment. Applying the PCB pass-through efficiency estimated by Totten et al. (2006) for the Delaware River watershed of approximately 1%, the atmospheric deposition load to the Gunpowder River and the Bird River from the watershed is approximately 0.8 g/year and 1 g/year, respectively. This load is accounted for within the loading from the watershed and is inherently modeled as part of the non-regulated watershed runoff and the National Pollutant Discharge Elimination System (NPDES) Regulated Stormwater loads described below and in Section 4.2. Similarly, the direct atmospheric deposition load to the surface of the Gunpowder river of 59.1 g/year was calculated by multiplying the surface area of the river (36.9 km2) and the deposition rate of 1.6 µg/m2/year. The direct atmospheric deposition load to the surface of the Bird river of 6.4 g/year was calculated by multiplying the surface area of the river (4 km2) and the deposition rate of 1.6 µg/m2/year. Watershed Sources: Non-regulated Watershed Runoff The non-regulated watershed runoff tPCB load corresponds to the non-urbanized areas (i.e., primarily forest and wetland areas) of the watershed. The load associated with the urbanized area of the watershed represents the NPDES Regulated Stormwater tPCB load, which is presented in Section 4.2 under Point Sources. MDE collected water column samples for PCB analysis at one non-tidal watershed monitoring station in the Gunpowder River and four non-tidal watershed monitoring stations in the Bird River during May, July, October of 2012 and January 2013 (See Appendix G). To calculate the watershed flow, the daily flow rates from October 1, 1998 to September 30, 2013 at the nearest two United States Geological Survey (USGS) stations located at White Marsh Run (USGS 01585100) and Honeygo Run (USGS 01585104) (see Figure 6) in the Bird River watershed were averaged. The unit flow from the Gunpowder River and the Bird River watersheds (1.75 cubic feet per second per square mile) was the average unit flow of above two USGS stations. The flow from each subwatershed of the Gunpowder River and the Bird River watersheds was calculated by multiplying the unit flow by the subwatershed area (Equation 4.1).
Area Watershed Flow Unit Flow Watershed (Equation 4.1) The Gunpowder River watershed baseline tPCB loading (8.9 g/year) is the sum of loads from each subwatershed calculated by multiplying the subwatershed flow with the average of the
FINAL
21 Gunpowder River and Bird River PCB TMDL Report Document version: October, 2015
measured tPCB concentration (0.29 ng/L) at the non-tidal station located at the Gunpowder River watershed. Similarly, the Bird River watershed baseline tPCB loading (10.1 g/year) is calculated by multiplying the watershed flow with the mean measured tPCB concentration (0.25 ng/L). The mean measured tPCB concentration is the average of all the concentration data for the four non-tidal watershed monitoring stations located at the Bird River watershed. As mentioned above, about 0.8 g/year of the Gunpowder River watershed’s baseline load and 1 g/year of the Bird River watershed’s baseline load are attributed to atmospheric deposition to the land surface of the direct drainage, and are inherently captured within the total watershed tPCB baseline loads of 8.9 g/year and 10.1 g/year, respectively. As previously discussed, the non-regulated watershed runoff tPCB load only corresponds to the non-urbanized areas (i.e., primarily forest and agricultural areas) within the direct drainage portion of the Gunpowder River and the Bird River watersheds. The loads associated with the urbanized area of the Gunpowder River and the Bird River watersheds represent the NPDES Regulated Stormwater tPCB baseline loads. The non-regulated watershed runoff tPCB baseline loads were estimated by multiplying the percentage of non-urban land use within the direct drainage portion of the watersheds by the total direct drainage watershed tPCB baseline loads for the Gunpowder River and the Bird River. The non-regulated watershed runoff tPCB baseline loads for the Gunpowder River and the Bird River watersheds are 5.9 g/year and 3.7 g/year, respectively.
Resuspension and Diffusion from Bottom Sediments
The transport of PCBs from bottom sediments to the water column through resuspension and diffusion can be a major source of PCBs in estuarine systems; however, under the framework of this TMDL it is not considered a non-point source. The water quality model developed for this TMDL simulates conditions within the water column and sediment as a single system. Therefore exchanges between the sediment and water column are considered an internal loading. Only external sources to the system are assigned baseline loads within a TMDL. As PCBs bind to the organic carbon fraction of suspended sediment in the water column and settle onto the embayment floor, a large portion of the tPCB loads delivered from various point and non-point sources to the embayment, deposits within the bottom sediments. This accumulation of PCBs can subsequently become a significant source of PCBs to the water column via the disturbance and resuspension of sediments. Dissolved tPCB concentrations in sediment pore water will also diffuse into the water column.
The water quality model, applying observed tPCB concentrations in the water column and sediment, predicts a net tPCB load of 2,457 g/year and 303 g/year from bottom sediment to the water column through resuspension and diffusion in the Gunpowder River and the Bird River, respectively. Although the transport of PCBs to the river from bottom sediment via resuspension and diffusion is currently estimated to be the major source of PCBs, this load contribution is resultant from other point and nonpoint source inputs (both historic and current) and is not considered to be directly controllable source. Therefore, this load will not be assigned a baseline load or allocation.
FINAL
22 Gunpowder River and Bird River PCB TMDL Report Document version: October, 2015
4.2 Point Sources
Point Sources in the Gunpowder River watershed include NPDES-regulated industrial process water facilities and stormwater discharges regulated under Phase I and Phase II of the NPDES stormwater program. Point Sources in the Bird River watershed include stormwater discharges regulated under Phase I and Phase II of the NPDES stormwater program. No NPDES regulated municipal WWTPs were identified within the direct drainage portions of the Gunpowder River and the Bird River watersheds. This section provides detailed explanations regarding the calculation of the point source tPCB baseline loads.
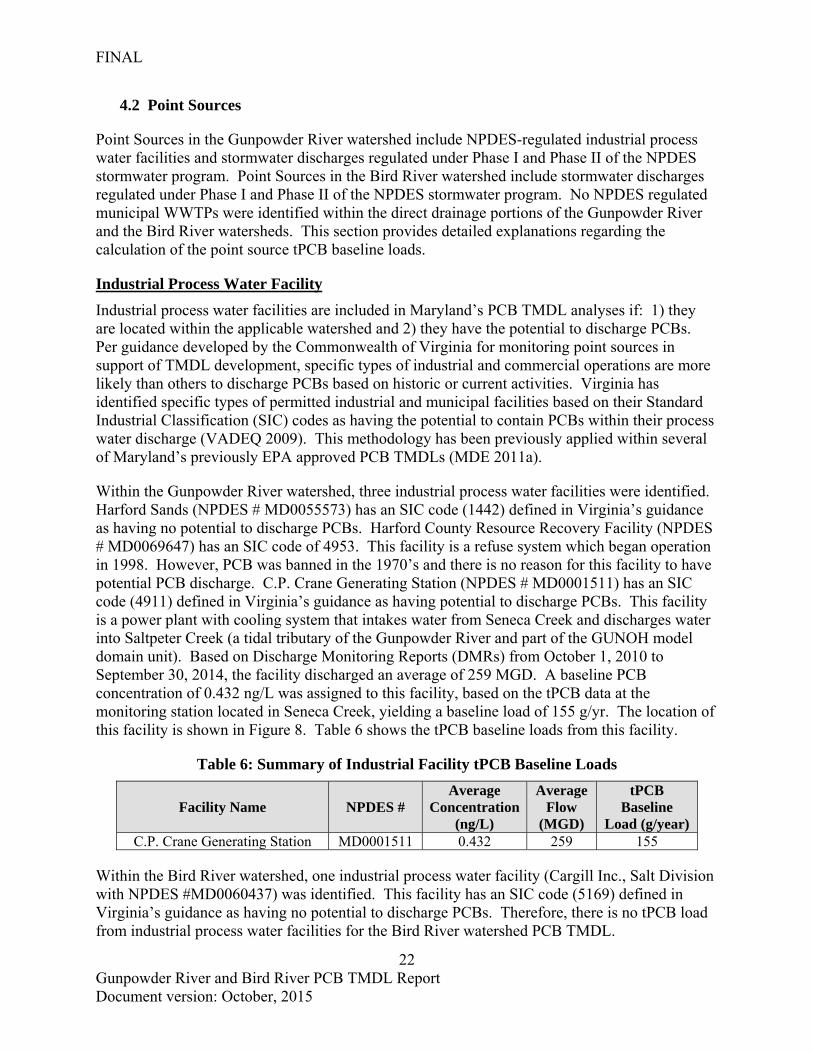
Industrial Process Water Facility
Industrial process water facilities are included in Maryland’s PCB TMDL analyses if: 1) they are located within the applicable watershed and 2) they have the potential to discharge PCBs. Per guidance developed by the Commonwealth of Virginia for monitoring point sources in support of TMDL development, specific types of industrial and commercial operations are more likely than others to discharge PCBs based on historic or current activities. Virginia has identified specific types of permitted industrial and municipal facilities based on their Standard Industrial Classification (SIC) codes as having the potential to contain PCBs within their process water discharge (VADEQ 2009). This methodology has been previously applied within several of Maryland’s previously EPA approved PCB TMDLs (MDE 2011a).
Within the Gunpowder River watershed, three industrial process water facilities were identified. Harford Sands (NPDES # MD0055573) has an SIC code (1442) defined in Virginia’s guidance as having no potential to discharge PCBs. Harford County Resource Recovery Facility (NPDES # MD0069647) has an SIC code of 4953. This facility is a refuse system which began operation in 1998. However, PCB was banned in the 1970’s and there is no reason for this facility to have potential PCB discharge. C.P. Crane Generating Station (NPDES # MD0001511) has an SIC code (4911) defined in Virginia’s guidance as having potential to discharge PCBs. This facility is a power plant with cooling system that intakes water from Seneca Creek and discharges water into Saltpeter Creek (a tidal tributary of the Gunpowder River and part of the GUNOH model domain unit). Based on Discharge Monitoring Reports (DMRs) from October 1, 2010 to September 30, 2014, the facility discharged an average of 259 MGD. A baseline PCB concentration of 0.432 ng/L was assigned to this facility, based on the tPCB data at the monitoring station located in Seneca Creek, yielding a baseline load of 155 g/yr. The location of this facility is shown in Figure 8. Table 6 shows the tPCB baseline loads from this facility.
Table 6: Summary of Industrial Facility tPCB Baseline Loads
Facility Name NPDES # Average
Concentration (ng/L)
Average Flow
(MGD)
tPCB Baseline
Load (g/year) C.P. Crane Generating Station MD0001511 0.432 259 155
Within the Bird River watershed, one industrial process water facility (Cargill Inc., Salt Division with NPDES #MD0060437) was identified. This facility has an SIC code (5169) defined in Virginia’s guidance as having no potential to discharge PCBs. Therefore, there is no tPCB load from industrial process water facilities for the Bird River watershed PCB TMDL.
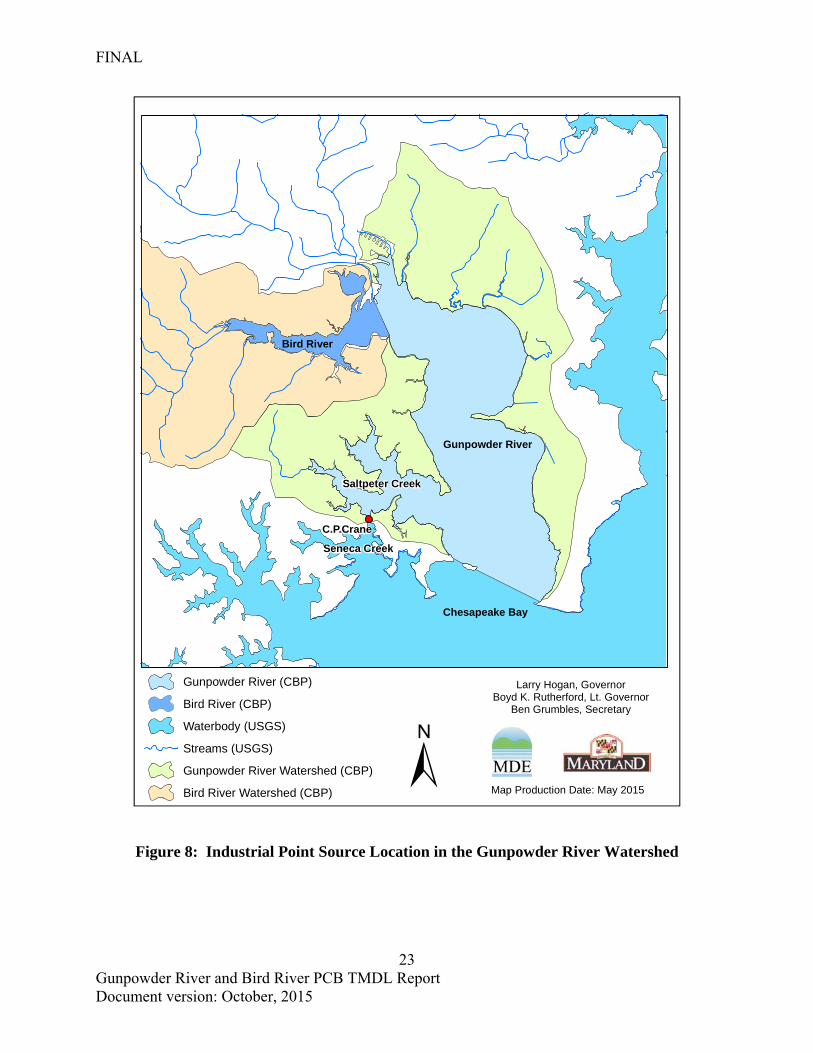
FINAL
23 Gunpowder River and Bird River PCB TMDL Report Document version: October, 2015
Figure 8: Industrial Point Source Location in the Gunpowder River Watershed
Gunpowder River
Chesapeake Bay
Saltpeter Creek
Seneca Creek
Bird River
C.P.Crane
Map Production Date: May 2015
Larry Hogan, GovernorBoyd K. Rutherford, Lt. Governor
Ben Grumbles, Secretary
±Gunpowder River (CBP)
Bird River (CBP)
Waterbody (USGS)
Streams (USGS)
Gunpowder River Watershed (CBP)
Bird River Watershed (CBP)
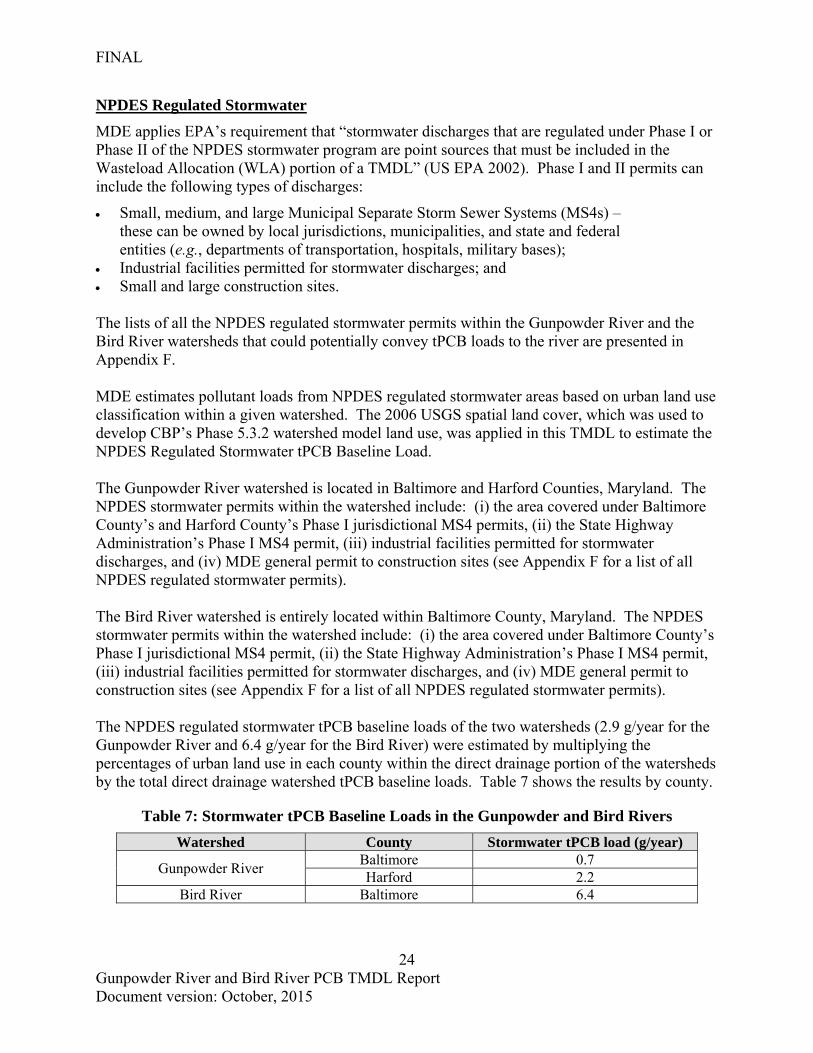
FINAL
24 Gunpowder River and Bird River PCB TMDL Report Document version: October, 2015
NPDES Regulated Stormwater
MDE applies EPA’s requirement that “stormwater discharges that are regulated under Phase I or Phase II of the NPDES stormwater program are point sources that must be included in the Wasteload Allocation (WLA) portion of a TMDL” (US EPA 2002). Phase I and II permits can include the following types of discharges:
Small, medium, and large Municipal Separate Storm Sewer Systems (MS4s) – these can be owned by local jurisdictions, municipalities, and state and federal entities (e.g., departments of transportation, hospitals, military bases);
Industrial facilities permitted for stormwater discharges; and Small and large construction sites. The lists of all the NPDES regulated stormwater permits within the Gunpowder River and the Bird River watersheds that could potentially convey tPCB loads to the river are presented in Appendix F. MDE estimates pollutant loads from NPDES regulated stormwater areas based on urban land use classification within a given watershed. The 2006 USGS spatial land cover, which was used to develop CBP’s Phase 5.3.2 watershed model land use, was applied in this TMDL to estimate the NPDES Regulated Stormwater tPCB Baseline Load. The Gunpowder River watershed is located in Baltimore and Harford Counties, Maryland. The NPDES stormwater permits within the watershed include: (i) the area covered under Baltimore County’s and Harford County’s Phase I jurisdictional MS4 permits, (ii) the State Highway Administration’s Phase I MS4 permit, (iii) industrial facilities permitted for stormwater discharges, and (iv) MDE general permit to construction sites (see Appendix F for a list of all NPDES regulated stormwater permits). The Bird River watershed is entirely located within Baltimore County, Maryland. The NPDES stormwater permits within the watershed include: (i) the area covered under Baltimore County’s Phase I jurisdictional MS4 permit, (ii) the State Highway Administration’s Phase I MS4 permit, (iii) industrial facilities permitted for stormwater discharges, and (iv) MDE general permit to construction sites (see Appendix F for a list of all NPDES regulated stormwater permits). The NPDES regulated stormwater tPCB baseline loads of the two watersheds (2.9 g/year for the Gunpowder River and 6.4 g/year for the Bird River) were estimated by multiplying the percentages of urban land use in each county within the direct drainage portion of the watersheds by the total direct drainage watershed tPCB baseline loads. Table 7 shows the results by county.
Table 7: Stormwater tPCB Baseline Loads in the Gunpowder and Bird Rivers
Watershed County Stormwater tPCB load (g/year)
Gunpowder River Baltimore 0.7 Harford 2.2
Bird River Baltimore 6.4
FINAL
25 Gunpowder River and Bird River PCB TMDL Report Document version: October, 2015
4.3 Source Assessment Summary
From this source assessment all point and nonpoint sources of PCBs to the Gunpowder River watershed and the Bird River watershed have been identified and characterized. Nonpoint sources of PCBs have been identified for the Gunpowder River: 1) Chesapeake Bay mainstem tidal influence, 2) inputs from Gunpowder Falls and Little Gunpowder Falls (outside of the direct drainage area), 3) direct atmospheric deposition to the Gunpowder and Bird Rivers, and 4) runoff from non-regulated watershed areas in the direct drainage portions of the Gunpowder and Bird River watersheds. In the Gunpowder River watershed, point sources include NPDES-regulated stormwater runoff and discharge from one industrial process water facility: C.P. Crane Generating Station. The following nonpoint sources of PCBs have been identified for the Bird River: 1) exchanges with the Gunpowder River, 2) direct atmospheric deposition to the Bird River, and 3) runoff from non-regulated watershed areas of the Bird River watershed. In the Bird River watershed, point sources include only NPDES regulated stormwater runoff. No NPDES regulated municipal WWTPs facilities were identified within either watershed. Estimated tPCB loads from these point and nonpoint sources represent the baseline conditions for the watershed. A summary of the tPCB baseline loads for the Gunpowder River and the Bird River are presented in Table 8 and Table 9. The total tPCB load to the Gunpowder River embayment is 273.6 g/year. The total tPCB load to the Bird River embayment is 65.7 g/year. In order to address the long term PCB load variation, the loads for this model are calculated using a 15-year mean flow from October 1, 1998 to September 30, 2013 (PCB data was taken in 2012 and 2013). As explained in Section 4.1, loads associated with resuspension and diffusion from sediments are not considered to be directly controllable (reducible) within the framework of the TMDL and are thus not assigned baseline loads or allocations.
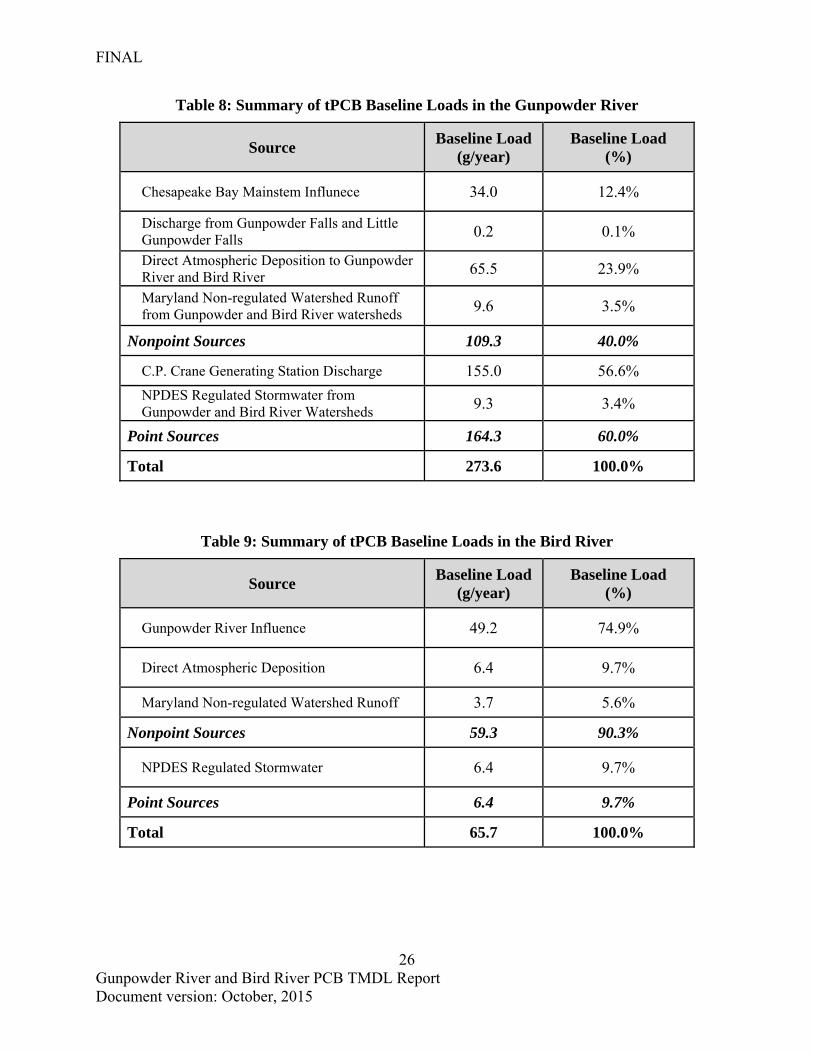
FINAL
26 Gunpowder River and Bird River PCB TMDL Report Document version: October, 2015
Table 8: Summary of tPCB Baseline Loads in the Gunpowder River
Source Baseline Load
(g/year) Baseline Load
(%)
Chesapeake Bay Mainstem Influnece 34.0 12.4%
Discharge from Gunpowder Falls and Little Gunpowder Falls 0.2 0.1%
Direct Atmospheric Deposition to Gunpowder River and Bird River 65.5 23.9%
Maryland Non-regulated Watershed Runoff from Gunpowder and Bird River watersheds 9.6 3.5%
Nonpoint Sources 109.3 40.0%
C.P. Crane Generating Station Discharge 155.0 56.6%
NPDES Regulated Stormwater from Gunpowder and Bird River Watersheds 9.3 3.4%
Point Sources 164.3 60.0%
Total 273.6 100.0%
Table 9: Summary of tPCB Baseline Loads in the Bird River
Source Baseline Load
(g/year) Baseline Load
(%)
Gunpowder River Influence 49.2 74.9%
Direct Atmospheric Deposition 6.4 9.7%
Maryland Non-regulated Watershed Runoff 3.7 5.6%
Nonpoint Sources 59.3 90.3%
NPDES Regulated Stormwater 6.4 9.7%
Point Sources 6.4 9.7%
Total 65.7 100.0%
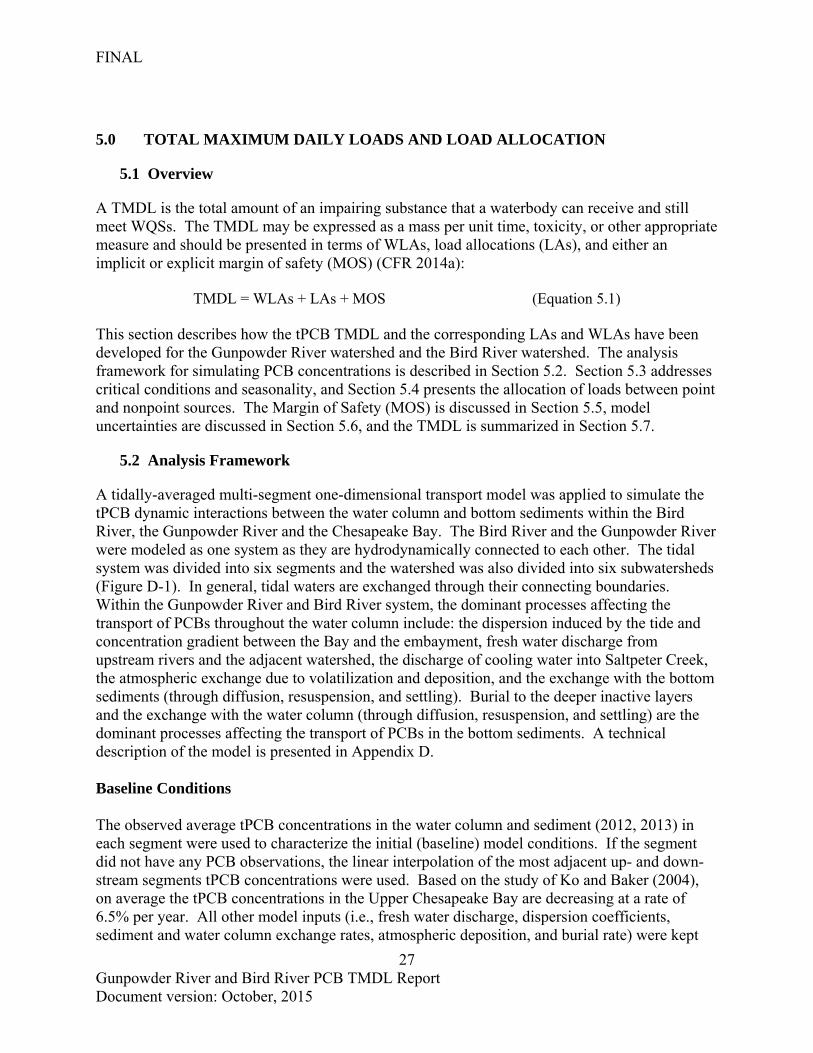
FINAL
27 Gunpowder River and Bird River PCB TMDL Report Document version: October, 2015
5.0 TOTAL MAXIMUM DAILY LOADS AND LOAD ALLOCATION
5.1 Overview
A TMDL is the total amount of an impairing substance that a waterbody can receive and still meet WQSs. The TMDL may be expressed as a mass per unit time, toxicity, or other appropriate measure and should be presented in terms of WLAs, load allocations (LAs), and either an implicit or explicit margin of safety (MOS) (CFR 2014a):
TMDL = WLAs + LAs + MOS (Equation 5.1) This section describes how the tPCB TMDL and the corresponding LAs and WLAs have been developed for the Gunpowder River watershed and the Bird River watershed. The analysis framework for simulating PCB concentrations is described in Section 5.2. Section 5.3 addresses critical conditions and seasonality, and Section 5.4 presents the allocation of loads between point and nonpoint sources. The Margin of Safety (MOS) is discussed in Section 5.5, model uncertainties are discussed in Section 5.6, and the TMDL is summarized in Section 5.7.
5.2 Analysis Framework
A tidally-averaged multi-segment one-dimensional transport model was applied to simulate the tPCB dynamic interactions between the water column and bottom sediments within the Bird River, the Gunpowder River and the Chesapeake Bay. The Bird River and the Gunpowder River were modeled as one system as they are hydrodynamically connected to each other. The tidal system was divided into six segments and the watershed was also divided into six subwatersheds (Figure D-1). In general, tidal waters are exchanged through their connecting boundaries. Within the Gunpowder River and Bird River system, the dominant processes affecting the transport of PCBs throughout the water column include: the dispersion induced by the tide and concentration gradient between the Bay and the embayment, fresh water discharge from upstream rivers and the adjacent watershed, the discharge of cooling water into Saltpeter Creek, the atmospheric exchange due to volatilization and deposition, and the exchange with the bottom sediments (through diffusion, resuspension, and settling). Burial to the deeper inactive layers and the exchange with the water column (through diffusion, resuspension, and settling) are the dominant processes affecting the transport of PCBs in the bottom sediments. A technical description of the model is presented in Appendix D. Baseline Conditions The observed average tPCB concentrations in the water column and sediment (2012, 2013) in each segment were used to characterize the initial (baseline) model conditions. If the segment did not have any PCB observations, the linear interpolation of the most adjacent up- and down-stream segments tPCB concentrations were used. Based on the study of Ko and Baker (2004), on average the tPCB concentrations in the Upper Chesapeake Bay are decreasing at a rate of 6.5% per year. All other model inputs (i.e., fresh water discharge, dispersion coefficients, sediment and water column exchange rates, atmospheric deposition, and burial rate) were kept
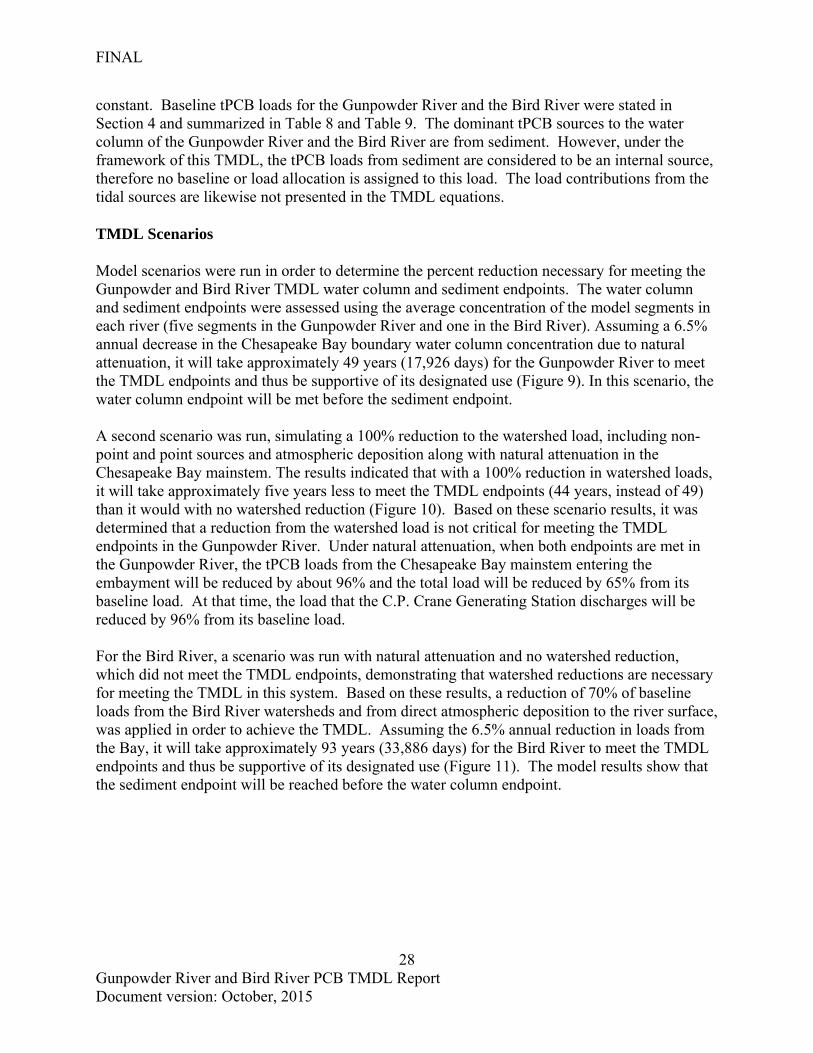
FINAL
28 Gunpowder River and Bird River PCB TMDL Report Document version: October, 2015
constant. Baseline tPCB loads for the Gunpowder River and the Bird River were stated in Section 4 and summarized in Table 8 and Table 9. The dominant tPCB sources to the water column of the Gunpowder River and the Bird River are from sediment. However, under the framework of this TMDL, the tPCB loads from sediment are considered to be an internal source, therefore no baseline or load allocation is assigned to this load. The load contributions from the tidal sources are likewise not presented in the TMDL equations.
TMDL Scenarios
Model scenarios were run in order to determine the percent reduction necessary for meeting the Gunpowder and Bird River TMDL water column and sediment endpoints. The water column and sediment endpoints were assessed using the average concentration of the model segments in each river (five segments in the Gunpowder River and one in the Bird River). Assuming a 6.5% annual decrease in the Chesapeake Bay boundary water column concentration due to natural attenuation, it will take approximately 49 years (17,926 days) for the Gunpowder River to meet the TMDL endpoints and thus be supportive of its designated use (Figure 9). In this scenario, the water column endpoint will be met before the sediment endpoint. A second scenario was run, simulating a 100% reduction to the watershed load, including non-point and point sources and atmospheric deposition along with natural attenuation in the Chesapeake Bay mainstem. The results indicated that with a 100% reduction in watershed loads, it will take approximately five years less to meet the TMDL endpoints (44 years, instead of 49) than it would with no watershed reduction (Figure 10). Based on these scenario results, it was determined that a reduction from the watershed load is not critical for meeting the TMDL endpoints in the Gunpowder River. Under natural attenuation, when both endpoints are met in the Gunpowder River, the tPCB loads from the Chesapeake Bay mainstem entering the embayment will be reduced by about 96% and the total load will be reduced by 65% from its baseline load. At that time, the load that the C.P. Crane Generating Station discharges will be reduced by 96% from its baseline load. For the Bird River, a scenario was run with natural attenuation and no watershed reduction, which did not meet the TMDL endpoints, demonstrating that watershed reductions are necessary for meeting the TMDL in this system. Based on these results, a reduction of 70% of baseline loads from the Bird River watersheds and from direct atmospheric deposition to the river surface, was applied in order to achieve the TMDL. Assuming the 6.5% annual reduction in loads from the Bay, it will take approximately 93 years (33,886 days) for the Bird River to meet the TMDL endpoints and thus be supportive of its designated use (Figure 11). The model results show that the sediment endpoint will be reached before the water column endpoint.
FINAL
29 Gunpowder River and Bird River PCB TMDL Report Document version: October, 2015
Figure 9: Change of Water Column and Bottom Sediment tPCB Concentrations with Time within the Gunpowder River (natural attenuation)
0 0.5 1 1.5 2 2.5 3 3.5 40
2
4
6
8
10
12
14
16
18
Time (*104 Day)
Sed
imen
t P
CB
Con
cent
ratio
n (n
g/g)
Day = 17926
Sediment Target: 1.56 ng/g
Predicted Concentration
0 0.5 1 1.5 2 2.5 3 3.5 40
0.1
0.2
0.3
0.4
0.5
0.6
0.7
When Day = 17926 C= 0.0567ng/L
Time (*104 Day)
Wat
er C
olum
n P
CB
Con
cent
ratio
n (n
g/L)
Water Column Target: 0.06 ng/L
Predicted Concentration
FINAL
30 Gunpowder River and Bird River PCB TMDL Report Document version: October, 2015
Figure 10: Change of Water Column and Bottom Sediment tPCB Concentrations with Time within the Gunpowder River (100% load reduction to Watershed Load, including
non-point and point sources and atmospheric deposition)
0 0.5 1 1.5 2 2.5 3 3.5 40
2
4
6
8
10
12
14
16
18
Time (*104 Day)
Sed
imen
t P
CB
Con
cent
ratio
n (n
g/g)
Day = 15972
Sediment Target: 1.56 ng/g
Predicted Concentration
0 0.5 1 1.5 2 2.5 3 3.5 40
0.1
0.2
0.3
0.4
0.5
0.6
0.7
When Day = 15972 C= 0.048ng/L
Time (*104 Day)
Wat
er C
olum
n P
CB
Con
cent
ratio
n (n
g/L)
Water Column Target: 0.06 ng/L
Predicted Concentration
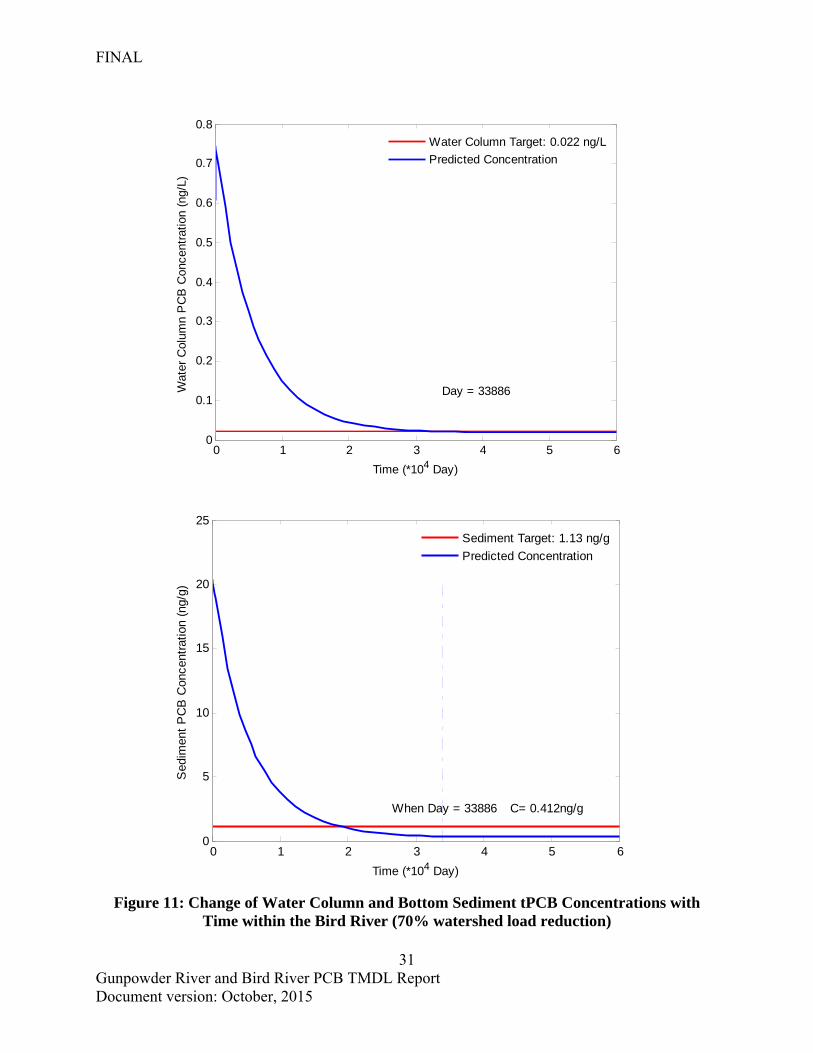
FINAL
31 Gunpowder River and Bird River PCB TMDL Report Document version: October, 2015
Figure 11: Change of Water Column and Bottom Sediment tPCB Concentrations with Time within the Bird River (70% watershed load reduction)
0 1 2 3 4 5 60
0.1
0.2
0.3
0.4
0.5
0.6
0.7
0.8
Time (*104 Day)
Wat
er C
olum
n P
CB
Con
cent
ratio
n (n
g/L)
Day = 33886
Water Column Target: 0.022 ng/L
Predicted Concentration
0 1 2 3 4 5 60
5
10
15
20
25
When Day = 33886 C= 0.412ng/g
Time (*104 Day)
Sed
imen
t P
CB
Con
cent
ratio
n (n
g/g)
Sediment Target: 1.13 ng/g
Predicted Concentration
FINAL
32 Gunpowder River and Bird River PCB TMDL Report Document version: October, 2015
5.3 Critical Condition and Seasonality
Federal regulations require TMDL analysis to take into account the impact of critical conditions and seasonality on water quality (CFR 2014a). The intent of this requirement is to ensure that water quality is protected when it is most vulnerable. This TMDL is protective of human health at all times; thus, it implicitly accounts for seasonal variations as well as critical conditions. Achievement of the TMDL endpoints for sediment and water column through the implementation of load reductions will result in PCB levels in fish tissue acceptable for human consumption without posing a risk for development of cancer. Bioaccumulation of PCBs in fish is driven by long-term exposure through respiration, dermal contact, and consumption of lower order trophic level organisms. The critical condition defined by acute exposure to temporary fluctuations in PCB water column concentrations during storm events is not a significant pathway for uptake of PCBs. Monitoring of PCBs was conducted on a quarterly basis to account for seasonal variation in establishing the baseline condition for ambient water quality in the Gunpowder River and the Bird River and estimation of watershed loadings. Since PCB levels in fish tissue become elevated due to long-term exposure, the selection of the annual average tPCB water column and sediment concentrations for comparison to the endpoints applied within the TMDL adequately considers the impact of seasonal variations and critical conditions on the “fishing” designated use in the Gunpowder River and the Bird River. Furthermore, the water column TMDL endpoint is also supportive of the “protection of aquatic life” designated use at all times as it is more stringent than the freshwater and saltwater chronic tPCB criteria.
5.4 TMDL Allocations
All TMDLs need to be presented as a sum of WLAs for point sources and LAs for nonpoint source loads generated within the assessment unit, and if applicable LAs for the natural background, tributary, and adjacent segment loads (CFR 2014b). The State reserves the right to revise these allocations provided the revisions are consistent with achieving WQSs. The allocations described in this section summarize the tPCB TMDL established to meet the “fishing” designated use in the Gunpowder River and the Bird River. These allocations are also supportive of the ‘protection of aquatic life” designated use as explained above.
5.4.1 Load Allocations
For Gunpowder River, in order to support the “fishing” designated use, it will take approximately 49 yrs to meet both water column and sediment tPCB endpoints under natural attenuation of PCB concentration at Chesapeake Bay mainstem. When both endpoints met in the Gunpowder River, the tPCB loads from the Chesapeake Bay mainstem entering the embayment will be reduced by about 96% and the total load will be reduced by 65% from its baseline load. Therefore, no tPCB load reductions from the Gunpowder and Bird River watersheds and from direct atmosphere deposition to the Gunpowder and Bird River surface are required. For Bird River, a tPCB load reduction of 70% from the Bird River direct drainage and from direct atmosphere deposition to the Bird River surface are required to achieve the TMDL.
FINAL
33 Gunpowder River and Bird River PCB TMDL Report Document version: October, 2015
As explained in Section 4.1, loads associated with resuspension and diffusion from sediments and tidal influences from the Chesapeake Bay mainstem are not considered to be directly controllable (reducible) within the framework of the TMDL and are thus not assigned baseline loads or allocations.
5.4.2 Wasteload Allocations
Industrial Process Water Facility
Within the Gunpowder River watershed, one facility, C.P. Crane Generating Station, has been identified as discharging significant loads of PCBs. This facility is a power plant with a cooling system that withdraws water from Seneca Creek, a tidal tributary of the Chesapeake Bay mainstem. The tributary has a wide open mouth and a small drainage area, and is considered well-mixed with water from the Bay. The plant's cooling water is discharged into a different waterbody, Saltpeter Creek, which is a tidal tributary of the Gunpowder River. Although this discharge is considered non-contact cooling water, it is a significant discharge into the Gunpowder River system. Historically, there has been significant inter-annual variability in outflow from the plant, but for the purposes of modeling, a constant annual flow of 259 MGD was selected, based on the average daily flow from October 1, 2010 to September 30, 2014. A constant flow was assumed since there is no reliable way to predict future flows. Since the effects of PCBs are based on long-term bioaccumulation in fish tissue, and the TMDL was not developed based on acute toxicity, the assumption of constant flow is reasonable. A baseline PCB concentration of 0.432 ng/L was assigned to this facility based on the tPCB data at the monitoring station located in Seneca Creek. The model assumes that the facility is withdrawing water almost directly from the Chesapeake Bay and that PCB concentrations from this point source will decrease annually at the same 6.5% rate as the rest of the water from the Bay. Under this assumption, the tPCB concentration from this plant’s discharge will be about 0.016 ng/L and the load will be 5.74 g/year when the PCB TMDL endpoint the Gunpowder River system is met. This will result in a 96% reduction from the baseline load of 155 g/year from this facility.
NPDES Regulated Stormwater
Per EPA Requirements: “stormwater discharges that are regulated under Phase I or Phase II of the NPDES stormwater program are point sources that must be included in the WLA portion of a TMDL.” EPA recognizes that available data and information are usually not detailed enough to determine WLAs for NPDES regulated stormwater discharges on an outfall-specific basis (US EPA 2002). Therefore, NPDES regulated stormwater allocations to the Gunpowder River and the Bird River will be expressed as single, aggregate WLAs. Upon approval of the TMDL, “NPDES-regulated municipal storm water and small construction storm water discharges effluent limits should be expressed as Best Management Practices (BMPs) or other similar requirements, rather than as numeric effluent limits” (US EPA 2002). The NPDES Regulated Stormwater WLA was established by reducing the NPDES Regulated Stormwater Baseline Loads the same percentages as to the Non-regulated Watershed Runoff Baseline Loads in both watersheds. For more information on methods used to calculate the NPDES Regulated Stormwater PCB Baseline Load, please see Section 4.2. The NPDES-
FINAL
34 Gunpowder River and Bird River PCB TMDL Report Document version: October, 2015
Regulated Stormwater WLA may include any or all of the NPDES stormwater discharges listed in Section 4.2 (see Appendix F for a complete list of stormwater permits As stormwater assessment and/or other program monitoring efforts result in a more refined source assessment, MDE reserves the right to revise the current NPDES-Regulated Stormwater WLA provided the revisions are protective of the “fishing” designated use in the Gunpowder River and the Bird River. The NPDES-Regulated Stormwater Baseline Load requires 0% and 70% reductions for the Gunpowder River and the Bird River, respectively.
5.5 Margin of Safety (MOS)
All TMDLs must include a MOS to account for the lack of knowledge and the many uncertainties in the understanding and simulation of water quality parameters in natural systems (i.e., the relationship between modeled loads and water quality). The MOS is intended to account for such uncertainties in a manner that is conservative from the standpoint of environmental protection. Uncertainty within the model framework includes the estimated rate of decline in tPCB concentrations within the Chesapeake Bay mainstem, as well as the initial condition of mean tPCB concentrations that was selected for the model. In order to account for these uncertainties, MDE applied an explicit 5% MOS, in order to provide an adequate and environmentally protective TMDL.
5.6 Maximum Daily Loads
All TMDLs must include maximum daily loads (MDLs) consistent with the average annual TMDL. For this TMDL, tPCB MDLs are developed for each source category by converting daily time-series loads into TMDL values consistent with available EPA guidance on generating daily loads for TMDLs (US EPA 2007). The approach builds upon the TMDL modeling analysis that was conducted to ensure that average annual load targets result in compliance with the TMDL endpoint tPCB concentrations and considers a daily load level of a resolution based on specific data for each source category. The detailed calculation of MDLs is reported in Appendix E and the results are shown in Table 10 and Table 11.
5.7 TMDL Summary
Table 10 and Table 11 summarize the tPCB baseline loads, TMDL allocations, load reductions, and maximum daily loads (MDLs) for the Gunpowder River and the Bird River, respectively.
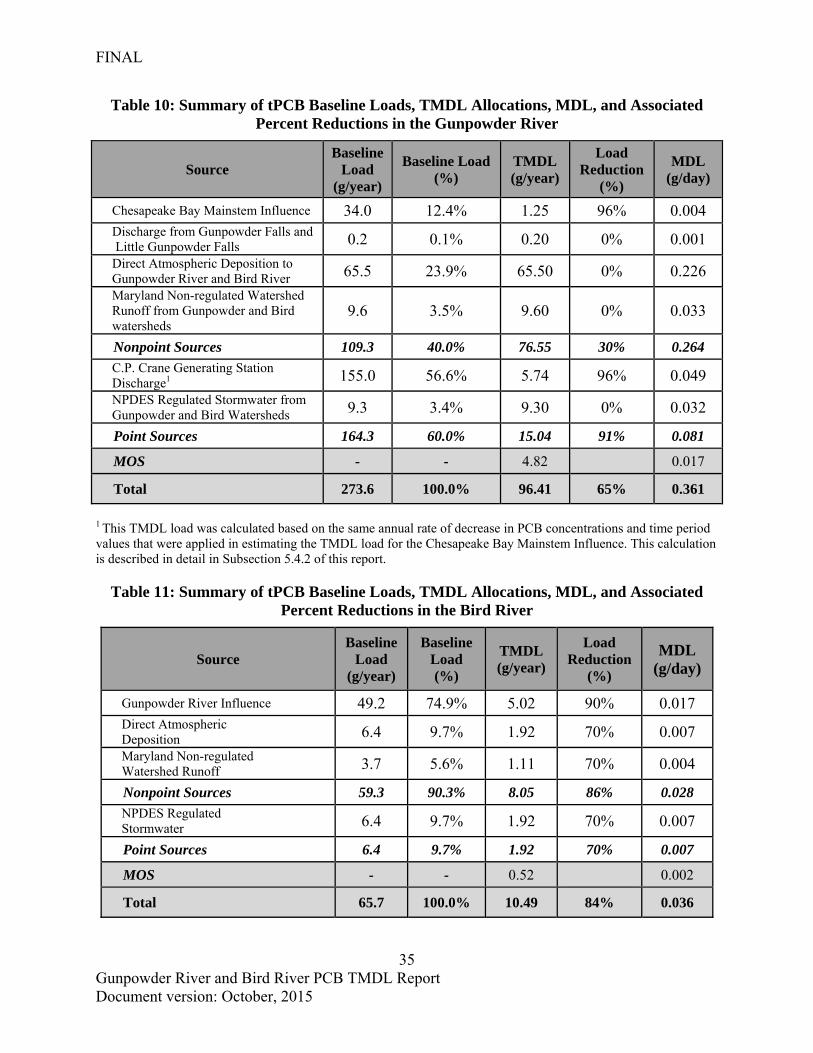
FINAL
35 Gunpowder River and Bird River PCB TMDL Report Document version: October, 2015
Table 10: Summary of tPCB Baseline Loads, TMDL Allocations, MDL, and Associated Percent Reductions in the Gunpowder River
Source Baseline
Load (g/year)
Baseline Load (%)
TMDL (g/year)
Load Reduction
(%)
MDL (g/day)
Chesapeake Bay Mainstem Influence 34.0 12.4% 1.25 96% 0.004 Discharge from Gunpowder Falls and Little Gunpowder Falls 0.2 0.1% 0.20 0% 0.001
Direct Atmospheric Deposition to Gunpowder River and Bird River 65.5 23.9% 65.50 0% 0.226
Maryland Non-regulated Watershed Runoff from Gunpowder and Bird watersheds
9.6 3.5% 9.60 0% 0.033
Nonpoint Sources 109.3 40.0% 76.55 30% 0.264
C.P. Crane Generating Station Discharge1 155.0 56.6% 5.74 96% 0.049
NPDES Regulated Stormwater from Gunpowder and Bird Watersheds 9.3 3.4% 9.30 0% 0.032
Point Sources 164.3 60.0% 15.04 91% 0.081
MOS - - 4.82 0.017
Total 273.6 100.0% 96.41 65% 0.361
1 This TMDL load was calculated based on the same annual rate of decrease in PCB concentrations and time period values that were applied in estimating the TMDL load for the Chesapeake Bay Mainstem Influence. This calculation is described in detail in Subsection 5.4.2 of this report.
Table 11: Summary of tPCB Baseline Loads, TMDL Allocations, MDL, and Associated Percent Reductions in the Bird River
Source Baseline
Load (g/year)
Baseline Load (%)
TMDL (g/year)
Load Reduction
(%)
MDL (g/day)
Gunpowder River Influence 49.2 74.9% 5.02 90% 0.017 Direct Atmospheric Deposition 6.4 9.7% 1.92 70% 0.007
Maryland Non-regulated Watershed Runoff 3.7 5.6% 1.11 70% 0.004
Nonpoint Sources 59.3 90.3% 8.05 86% 0.028
NPDES Regulated Stormwater 6.4 9.7% 1.92 70% 0.007
Point Sources 6.4 9.7% 1.92 70% 0.007
MOS - - 0.52 0.002
Total 65.7 100.0% 10.49 84% 0.036
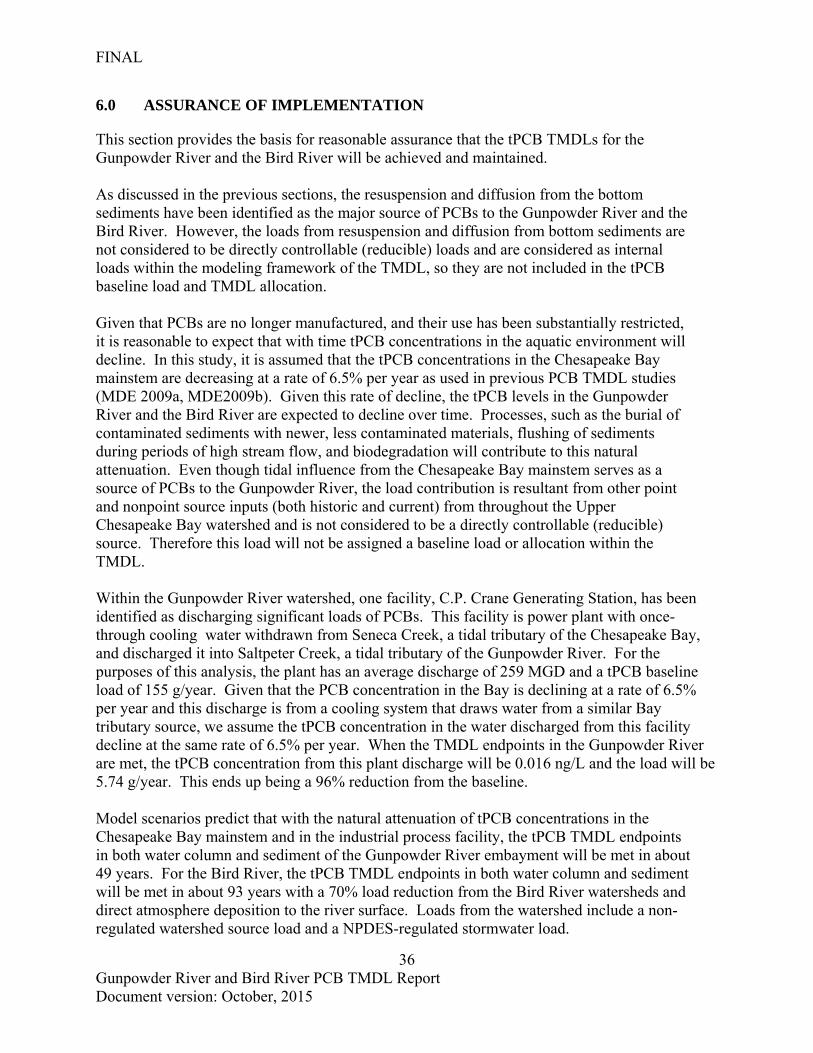
FINAL
36 Gunpowder River and Bird River PCB TMDL Report Document version: October, 2015
6.0 ASSURANCE OF IMPLEMENTATION
This section provides the basis for reasonable assurance that the tPCB TMDLs for the Gunpowder River and the Bird River will be achieved and maintained. As discussed in the previous sections, the resuspension and diffusion from the bottom sediments have been identified as the major source of PCBs to the Gunpowder River and the Bird River. However, the loads from resuspension and diffusion from bottom sediments are not considered to be directly controllable (reducible) loads and are considered as internal loads within the modeling framework of the TMDL, so they are not included in the tPCB baseline load and TMDL allocation. Given that PCBs are no longer manufactured, and their use has been substantially restricted, it is reasonable to expect that with time tPCB concentrations in the aquatic environment will decline. In this study, it is assumed that the tPCB concentrations in the Chesapeake Bay mainstem are decreasing at a rate of 6.5% per year as used in previous PCB TMDL studies (MDE 2009a, MDE2009b). Given this rate of decline, the tPCB levels in the Gunpowder River and the Bird River are expected to decline over time. Processes, such as the burial of contaminated sediments with newer, less contaminated materials, flushing of sediments during periods of high stream flow, and biodegradation will contribute to this natural attenuation. Even though tidal influence from the Chesapeake Bay mainstem serves as a source of PCBs to the Gunpowder River, the load contribution is resultant from other point and nonpoint source inputs (both historic and current) from throughout the Upper Chesapeake Bay watershed and is not considered to be a directly controllable (reducible) source. Therefore this load will not be assigned a baseline load or allocation within the TMDL. Within the Gunpowder River watershed, one facility, C.P. Crane Generating Station, has been identified as discharging significant loads of PCBs. This facility is power plant with once-through cooling water withdrawn from Seneca Creek, a tidal tributary of the Chesapeake Bay, and discharged it into Saltpeter Creek, a tidal tributary of the Gunpowder River. For the purposes of this analysis, the plant has an average discharge of 259 MGD and a tPCB baseline load of 155 g/year. Given that the PCB concentration in the Bay is declining at a rate of 6.5% per year and this discharge is from a cooling system that draws water from a similar Bay tributary source, we assume the tPCB concentration in the water discharged from this facility decline at the same rate of 6.5% per year. When the TMDL endpoints in the Gunpowder River are met, the tPCB concentration from this plant discharge will be 0.016 ng/L and the load will be 5.74 g/year. This ends up being a 96% reduction from the baseline. Model scenarios predict that with the natural attenuation of tPCB concentrations in the Chesapeake Bay mainstem and in the industrial process facility, the tPCB TMDL endpoints in both water column and sediment of the Gunpowder River embayment will be met in about 49 years. For the Bird River, the tPCB TMDL endpoints in both water column and sediment will be met in about 93 years with a 70% load reduction from the Bird River watersheds and direct atmosphere deposition to the river surface. Loads from the watershed include a non-regulated watershed source load and a NPDES-regulated stormwater load.
FINAL
37 Gunpowder River and Bird River PCB TMDL Report Document version: October, 2015
A new Chesapeake Bay Watershed Agreement was signed on June 16, 2014, which includes goals and outcomes for toxic contaminants including PCBs (CBP 2014). The toxic contaminant goal is to “ensure that the Bay and its rivers are free of effects of toxic contaminants on living resources and human health.” Objectives for the toxic contaminant outcomes regarding PCBs include: 1) characterizing the occurrence, concentrations, sources and effects of PCBs, 2) identifying best management practices (BMPs) that may provide benefits for reducing toxic contaminants in waterways, 3) improving practices and controls that reduce and prevent the effects of toxic contaminants, and 4) building on existing programs to reduce the amount and effects of PCBs in the Bay and watershed. Implementation of the toxic contaminant goal and outcomes under the new Bay agreement, as well as discovering and minimizing any existing PCB land sources throughout the Chesapeake Bay watershed via future TMDL development and implementation efforts, could further help to meet water quality goals in the Gunpowder River and the Bird River. Aside from the processes of natural attenuation, an alternative approach that can assist in reducing the tPCB concentrations in the water column, is the physical removal of the PCB-contaminated sediments (i.e., dredging). This process would minimize one of the primary, potential sources of tPCBs to the water column. If PCB-contaminated sediments were removed, load reductions would still be required under the TMDL, though water quality supportive of the “fishing” designated use would be achieved in a much shorter time frame. When considering dredging as an option, the risk versus benefit must be weighed, as the removal of contaminated sediment may potentially damage the habitat and health of the existing benthic community. The process of stirring up suspended sediments during dredging may damage the gills and/or sensory organs of benthic macroinvertebrates and fish. Suspended sediments can also affect the prey gathering ability of sight-feeding fish during dredging operations. In addition, the resuspension of contaminated sediments causes additional exposure of PCBs to aquatic organisms. PCBs are still being released to the environment via accidental fires, leaks, or spills from older PCB-containing equipment; potential leaks from hazardous waste sites that contain PCBs; illegal or improper dumping; and disposal of PCB containing products (e.g., transformers, old fluorescent lighting fixtures, electrical devices, or appliances containing PCB capacitors, old microscope oil, and old hydraulic oil) into landfills that are not designed to handle hazardous waste. Due to the potential existence of unidentified sources of PCB contamination through the watershed and the significant watershed load reductions required to meet the TMDL endpoints, an adaptive approach of implementation is anticipated, with subsequent monitoring to assess the effectiveness of the ongoing implementation efforts to manage potential risks to both recreational and subsistence fish consumers. The success of the implementation process will depend in large part on the feasibility of locating and evaluating opportunities to control on-land PCB sources, such as unidentified contaminated sites, leaky equipment, and contaminated soil or sediment. A collaborative approach involving all related jurisdictions and the identified NPDES permit holders as well as those responsible for nonpoint PCB runoff throughout the Gunpowder River and the Bird River watersheds will be used to work toward attaining the WLAs and LAs presented in this report. The reductions will be implemented in an adaptive and iterative process that will: 1) identify specific sources or
FINAL
38 Gunpowder River and Bird River PCB TMDL Report Document version: October, 2015
areas of PCB contamination, within the impoundment’s watershed; and 2) target remedial action to those sources with the largest impact on water quality, while giving consideration to the relative cost and ease of implementation. The implementation efforts will be periodically evaluated, and if necessary, improved, in order to further progress toward achieving the water quality goals. Any future monitoring should include congener-specific analytical methods. Ideally, a method capable of providing low-detection level, congener-specific results, similar to the analytical method described in Appendix A of this TMDL, should be used. In establishing the necessity and extent of data collection, MDE will collaborate with the affected stakeholders, and take into account data that is already available, as well as the proper characterization of intake (or pass through) conditions, consistent with NPDES program “reasonable potential” determinations and the applicable provisions of the Environment Article and COMAR for permitted facilities. Similar approaches may be applicable for all upstream jurisdictions with regards to PCB monitoring and stakeholder collaboration. Under certain conditions, EPA’s NPDES regulations allow the use of non-numeric, BMP water quality based effluent limits (WQBELs). BMP WQBELs can be used where “numeric effluent limitations are infeasible; or the practices are reasonably necessary to achieve effluent limitations and standards or to carry out the purposes and intent of the CWA” (CFR 2013c). In addition, impervious surface restoration efforts have been known to result in total suspended solids (TSS) reduction efficiencies. Since PCBs are known to adsorb to sediments and their concentrations correlate with TSS concentrations, any significant restoration requirements, which will lead to a reduction in sediment loads entering the Gunpowder River and the Bird River, will also contribute toward tPCB load reductions and meeting PCB water quality goals. Other BMPs that focus on PCB source tracking and elimination at the source rather than end-of-pipe controls are also warranted. Where necessary, the source characterization efforts will be followed with pollution minimization and reduction measures that will include BMPs for reducing runoff from urban areas, identification and termination of ongoing sources (e.g., industrial uses of equipment that contain PCBs), etc. The identified NPDES regulated WWTP and stormwater control agency permits will be expected to be consistent with the WLAs presented in this report. Numerous stormwater dischargers are located in the Gunpowder River and the Bird River watersheds including two Municipal Phase I MS4s, the SHA Phase I MS4, industrial facilities, and any construction activities on area greater than 1 acre (see Appendix F of this document to view the current list of known NPDES stormwater dischargers). Given the persistent nature of PCBs, the difficulty in removing them from the environment and the significant watershed load reductions necessary in order to achieve water quality goals in the Gunpowder River and the Bird River, effectiveness of the implementation effort will need to be reevaluated throughout the process to ensure progress is being made towards reaching the TMDLs. MDE also periodically monitors and evaluates concentrations of contaminants in recreationally caught fish, shellfish, and crabs throughout Maryland. MDE will use these monitoring programs to evaluate progress towards meeting the “fishing” designated use.
FINAL
39 Gunpowder River and Bird River PCB TMDL Report Document version: October, 2015
REFERENCES
Ayris, S., Currado, G. M., Smith, D., and Harrad, S. 1997. GC/MS Procedures for the Determination of PCBs in Environmental Matrices. Chemosphere 35(5): 905-917.
Ashley, J. T. F., and J. E. Baker. 1999. Hydrophobic Organic Contaminants in Surficial Sediments of Baltimore Harbor: Inventories and Sources. Environmental Toxicology and Chemistry 18(5): 838-849.
CBP (Chesapeake Bay Program). 2014. Chesapeake Bay Watershed Agreement. http://www.chesapeakebay.net/documents/FINAL_Ches_Bay_Watershed_Agreement.withsignatures-HIres.pdf (Accessed July 2014).
CFR (Code of Federal Regulations). 2014a. 40 CFR 130.2. http://www.gpo.gov/fdsys/pkg/CFR-2002-title40-vol18/pdf/CFR-2002-title40-vol18-sec130-2.pdf (Accessed April, 2014).
____________. 2014b. 40 CFR 130.7. http://www.gpo.gov/fdsys/pkg/CFR-2011-title40-vol22/pdf/CFR-2011-title40-vol22-sec130-7.pdf (Accessed April, 2014).
____________. 2014c. 40 CFR 122.44(k). http://www.gpo.gov/fdsys/pkg/CFR-2011-title40-vol22/pdf/CFR-2011-title40-vol22-sec122-44.pdf (Accessed April, 2014).
Chapra, S.C. 1997. Surface Water-Quality Modeling. McGraw-Hill, New York, USA, pp. 844.
COMAR (Code of Maryland Regulations). 2014a. 26.08.02.07. http://www.dsd.state.md.us/comar/comarhtml/26/26.08.02.07.htm (Accessed April, 2014).
____________. 2014b. 26.08.02.08 B(2)(a). http://www.dsd.state.md.us/comar/comarhtml/26/26.08.02.08.htm (Accessed April, 2014).
____________. 2014c. 26.08.02.04-1.
http://www.dsd.state.md.us/comar/comarhtml/26/26.08.02.04-1.htm (Accessed April, 2014).
____________. 2014d. 26.08.02.03-1 G (4). http://www.dsd.state.md.us/comar/comarhtml/26/26.08.02.03-1.htm (Accessed October, 2015).
____________. 2014e. 26.14.02.03. http://www.dsd.state.md.us/comar/getfile.aspx?file=26.14.02.03.htm (Accessed April, 2014).
De Bruijn, J., Busser, F., Seinen, W. and Hermens, J. 1989. Determination of Octanol/Water Partition Coefficients for Hydrophobic Organic Chemicals with the “Slow-Stirring” Method. Environmental Toxicology and Chemistry 8(6): 499-512.
DRBC (Delaware River Basin Commission). 2003. PCB Water Quality Model for Delaware Estuary (DELPCB). West Trenton, NJ: Delaware River Basin Commission.
Haywood, H. C., and Buchanan, C. 2007. Total Maximum Daily Loads of Polychlorinated Biphenyls (PCBs) for Tidal Portions of the Potomac and Anacostia Rivers in the District
FINAL
40 Gunpowder River and Bird River PCB TMDL Report Document version: October, 2015
of Columbia, Maryland, and Virginia. Rockville, MD: Interstate Commission on the Potomac River Basin.
Hoke, R. A., Ankley, G. T., Cotter, A. M., Goldstein, T., Kosian, P. A., Phipps, G. L. and VanderMeiden, F. M. 1994. Evaluation of Equilibrium Partitioning Theory for Predicting Acute Toxicity to Field Collected Sediments Contaminated with DDT, DDE and DDD to the Amphipod Hyalella Azteca. Environmental Toxicology and Chemistry 13(1): 157-166.
Ko F. C., and Baker, J. E. 2004. Seasonal and Annual Loads of Hydrophobic Organic Contaminants from the Susquehanna River Basin to the Chesapeake Bay. Marine Pollution Bulletin 48(9-10): 840–851.
Konieczka, P., and Namiesnik, J. 2008. Determination of PCBs in Marine Sediment Using Pressurised Liquid Extraction-Gas Chromatography-Isotope Dilution Mass Spectrometry-Method Validation. Chemical Analysis 53(6): 785-796.
Kuo, A., K. Park, S. Kim, and J. Lin. 2005. A tidal Prism Water Quality Model for Small Coastal Basins. Coastal Management 33: 101-117.
MDE (Maryland Department of the Environment). 2005. Total Maximum Daily Loads of Fecal Coliform for Restricted Shellfish Harvesting Areas in the Wicomico River Watershed Basin (Charleston Creek and Chaptico Bay) in Charles and St. Mary's Counties, Maryland. Baltimore, MD: Maryland Department of the Environment.
____________. 2009a. Total Maximum daily loads of Polychlorinated Biphenyls in Northwest River Embayment, Cecil County, Maryland. Baltimore, MD: Maryland Department of the Environment.
____________. 2009b. Total Maximum Daily Loads of Polychlorinated Biphenyls in the Bohemia River, Oligohaline Segment, Cecil County, Maryland. Baltimore, MD: Maryland Department of the Environment.
____________. 2011a. Total Maximum Daily Loads of Polychlorinated Biphenyls in Baltimore Harbor, Curtis Creek/Bay, and Bear Creek Portions of Patapsco River Mesohaline Tidal Chesapeake Bay Segment, Maryland. Baltimore, MD: Maryland Department of the Environment.
____________. 2011b. Total Maximum Daily Loads of Polychlorinated Biphenyls in Back River Oligohaline Tidal Chesapeake Bay Segment, Maryland. Baltimore, MD: Maryland Department of the Environment.
____________. 2012. The 2012 Integrated Report of Surface Water Quality in Maryland. Baltimore, MD: Maryland Department of the Environment. Also Available at: http://www.mde.maryland.gov/programs/water/tmdl/integrated303dreports/pages/2012_ir.aspx. (Accessed April 2014)
____________. 2014a. Statewide Fish Consumption Guidelines for All Ages: Table. http://mde.maryland.gov/programs/Marylander/CitizensInfoCenterHome/Documents/Fish%20Consumption%20Docs/Maryland_Fish_Advisories_2014_Web_bluecatedit.pdf (Accessed April, 2014)
FINAL
41 Gunpowder River and Bird River PCB TMDL Report Document version: October, 2015
____________. 2014b. Land Restoration Program's Geospatial Database (LRP-MAP). Baltimore, MD: Maryland Department of the Environment. http://167.102.241.76/mde_lrp (Accessed April, 2014).
Mydlova-Memersheimerova, J., Tienpont, B., David, F., Krupcik, J., and Sandra, P. 2009. Gas Chromatography of 209 Polychlorinated Biphenyl Congeners on An Extremely Efficient Nonselective Capillary Column. Journal of Chromatography A 1216(32): 6043-6062.
QEA (Quantitative Environmental Analysis, LLC). 1999. PCBs in the Upper Hudson River – Volume I, Historical Perspective and Model Overview. Albany, NY: Quantitative Environmental Analysis, LLC.
RETEC (The RETEC Group, Inc.). 2002. Remedial Investigation Report Lower Fox River and Green Bay, Wisconsin - Prepared for Wisconsin Department of Natural Resources.
Thomann R. V., and Mueller, J. A. 1987. Principles of Surface Water Quality Modeling and Control. New York City, NY: Harper & Row.
Totten, L. A., Panangadan, M., Eisenreich, S. J., Cavallo, G. J. and Fikslin, T. J. 2006. Direct and Indirect Atmospheric Deposition of PCBs to the Delaware River Watershed. Environmental Science and Technology. 40(7): 2171-2176.
US District Court for the District of Columbia. 2011. Anacostia Riverkeeper Inc., et al., Plaintiffs, v. Lisa Jackson, Administrator, United States Environmental Protection Agency, et al., Defendants: Order and Judgment. Washington, DC: US District Court of the District of Columbia.
US EPA (US Environmental Protection Agency). 1991. Technical Support Document (TSD) for Water Quality-based Toxics Control. Washington, DC: U.S. Environmental Protection Agency. Also Available at http://www.epa.gov/npdes/pubs/owm0264.pdf.
____________. 1999. Chesapeake Bay Basin Toxics Load and Release Inventory. Annapolis, MD: U.S. Environmental Protection Agency with Chesapeake Bay Program.
____________. 2002. Establishing Total Maximum Daily Load (TMDL) Wasteload Allocations (WLAs) for Storm Water Sources and NPDES Permit Requirements Based on Those WLAs. Washington, DC: U.S. Environmental Protection Agency.
____________. 2003. Methodology for Deriving Ambient Water Quality Criteria for the Protection of Human Health. Washington, DC: U.S. Environmental Protection Agency.
____________. 2004. The Incidence and Severity of Sediment Contamination in Surface Waters of the United States: National Sediment Quality Survey, 2nd Edition. Washington, D.C: US EPA, Office of Science and Technology.
____________. 2007. Options for Expressing Daily Loads in TMDLs. U.S. Environmental Protection Agency, Office of Wetlands, Oceans & Watersheds. http://water.epa.gov/lawsregs/lawsguidance/cwa/tmdl/upload/2007_06_26_tmdl_draft_daily_loads_tech-2.pdf (Accessed April, 2014).
____________. 2014a. National Recommended Water Quality Criteria. Washington, D.C: U.S. Environmental Protection Agency, Office of Science and Technology.
FINAL
42 Gunpowder River and Bird River PCB TMDL Report Document version: October, 2015
http://water.epa.gov/scitech/swguidance/standards/criteria/current/index.cfm (Accessed April, 2014)
____________. 2014b. Superfund Site Information Database. http://cfpub.epa.gov/supercpad/cursites/srchsites.cfm (Accessed April, 2014).
USGS (United States Geological Survey). 2014. 2006 National Land Cover Dataset Chesapeake Bay Area, Modified Version 2.0. Annapolis, MD: United States Geological Survey, Chesapeake Bay Program Office.
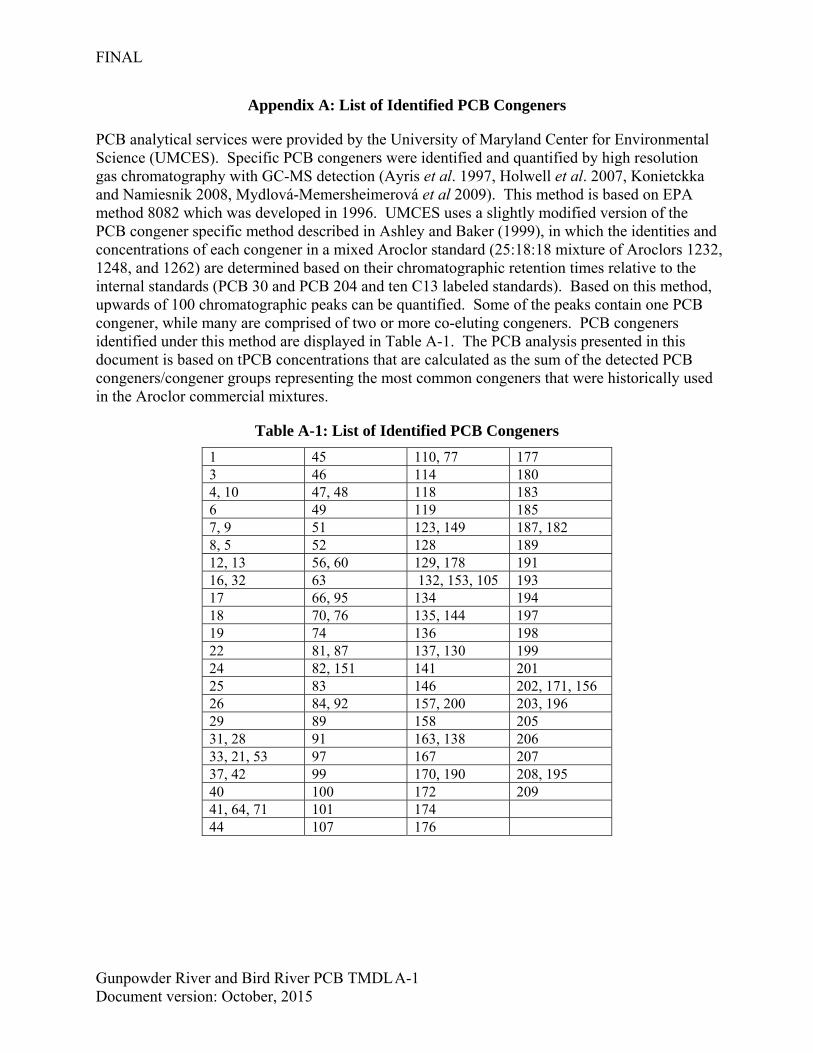
FINAL
Gunpowder River and Bird River PCB TMDL Document version: October, 2015
A-1
Appendix A: List of Identified PCB Congeners
PCB analytical services were provided by the University of Maryland Center for Environmental Science (UMCES). Specific PCB congeners were identified and quantified by high resolution gas chromatography with GC-MS detection (Ayris et al. 1997, Holwell et al. 2007, Konietckka and Namiesnik 2008, Mydlová-Memersheimerová et al 2009). This method is based on EPA method 8082 which was developed in 1996. UMCES uses a slightly modified version of the PCB congener specific method described in Ashley and Baker (1999), in which the identities and concentrations of each congener in a mixed Aroclor standard (25:18:18 mixture of Aroclors 1232, 1248, and 1262) are determined based on their chromatographic retention times relative to the internal standards (PCB 30 and PCB 204 and ten C13 labeled standards). Based on this method, upwards of 100 chromatographic peaks can be quantified. Some of the peaks contain one PCB congener, while many are comprised of two or more co-eluting congeners. PCB congeners identified under this method are displayed in Table A-1. The PCB analysis presented in this document is based on tPCB concentrations that are calculated as the sum of the detected PCB congeners/congener groups representing the most common congeners that were historically used in the Aroclor commercial mixtures.
Table A-1: List of Identified PCB Congeners
1 45 110, 77 177 3 46 114 180 4, 10 47, 48 118 183 6 49 119 185 7, 9 51 123, 149 187, 182 8, 5 52 128 189 12, 13 56, 60 129, 178 191 16, 32 63 132, 153, 105 193 17 66, 95 134 194 18 70, 76 135, 144 197 19 74 136 198 22 81, 87 137, 130 199 24 82, 151 141 201 25 83 146 202, 171, 156 26 84, 92 157, 200 203, 196 29 89 158 205 31, 28 91 163, 138 206 33, 21, 53 97 167 207 37, 42 99 170, 190 208, 195 40 100 172 209 41, 64, 71 101 174 44 107 176
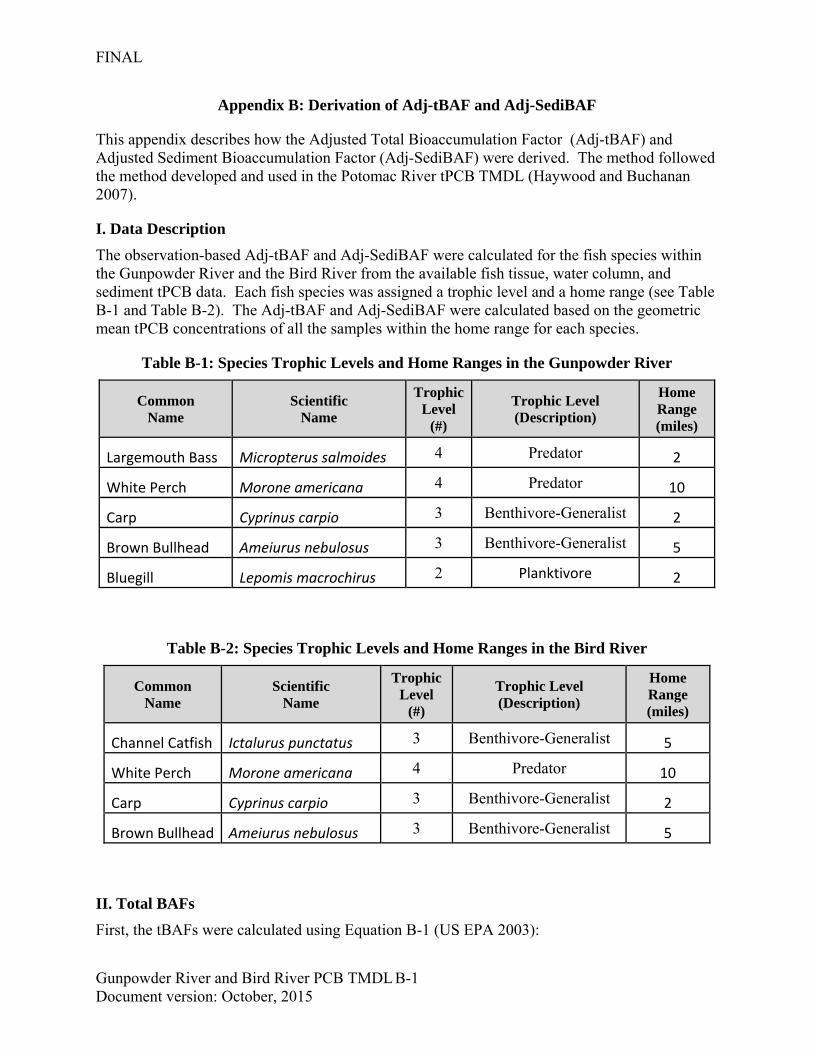
FINAL
Gunpowder River and Bird River PCB TMDL Document version: October, 2015
B-1
Appendix B: Derivation of Adj-tBAF and Adj-SediBAF
This appendix describes how the Adjusted Total Bioaccumulation Factor (Adj-tBAF) and Adjusted Sediment Bioaccumulation Factor (Adj-SediBAF) were derived. The method followed the method developed and used in the Potomac River tPCB TMDL (Haywood and Buchanan 2007).
I. Data Description
The observation-based Adj-tBAF and Adj-SediBAF were calculated for the fish species within the Gunpowder River and the Bird River from the available fish tissue, water column, and sediment tPCB data. Each fish species was assigned a trophic level and a home range (see Table B-1 and Table B-2). The Adj-tBAF and Adj-SediBAF were calculated based on the geometric mean tPCB concentrations of all the samples within the home range for each species.
Table B-1: Species Trophic Levels and Home Ranges in the Gunpowder River
Common Name
Scientific Name
Trophic Level
(#)
Trophic Level (Description)
Home Range (miles)
Largemouth Bass Micropterus salmoides 4 Predator 2
White Perch Morone americana 4 Predator 10
Carp Cyprinus carpio 3 Benthivore-Generalist 2
Brown Bullhead Ameiurus nebulosus 3 Benthivore-Generalist 5
Bluegill Lepomis macrochirus 2 Planktivore 2
Table B-2: Species Trophic Levels and Home Ranges in the Bird River
Common Name
Scientific Name
Trophic Level
(#)
Trophic Level (Description)
Home Range (miles)
Channel Catfish Ictalurus punctatus 3 Benthivore-Generalist 5
White Perch Morone americana 4 Predator 10
Carp Cyprinus carpio 3 Benthivore-Generalist 2
Brown Bullhead Ameiurus nebulosus 3 Benthivore-Generalist 5
II. Total BAFs
First, the tBAFs were calculated using Equation B-1 (US EPA 2003):
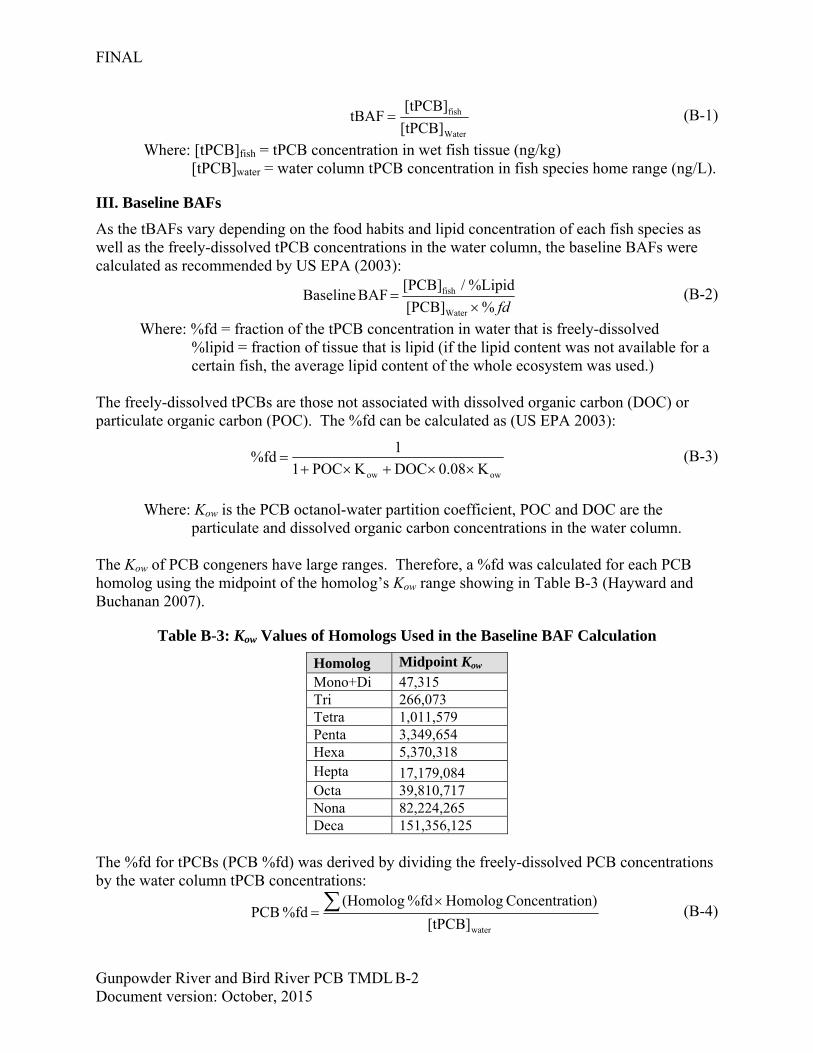
FINAL
Gunpowder River and Bird River PCB TMDL Document version: October, 2015
B-2
Water
fish
[tPCB]
[tPCB]tBAF (B-1)
Where: [tPCB]fish = tPCB concentration in wet fish tissue (ng/kg) [tPCB]water = water column tPCB concentration in fish species home range (ng/L).
III. Baseline BAFs
As the tBAFs vary depending on the food habits and lipid concentration of each fish species as well as the freely-dissolved tPCB concentrations in the water column, the baseline BAFs were calculated as recommended by US EPA (2003):
fd%[PCB]
%Lipid / [PCB]BAF Baseline
Water
fish
(B-2)
Where: %fd = fraction of the tPCB concentration in water that is freely-dissolved %lipid = fraction of tissue that is lipid (if the lipid content was not available for a certain fish, the average lipid content of the whole ecosystem was used.)
The freely-dissolved tPCBs are those not associated with dissolved organic carbon (DOC) or particulate organic carbon (POC). The %fd can be calculated as (US EPA 2003):
owow K0.08DOCKPOC1
1%fd
(B-3)
Where: Kow is the PCB octanol-water partition coefficient, POC and DOC are the particulate and dissolved organic carbon concentrations in the water column.
The Kow of PCB congeners have large ranges. Therefore, a %fd was calculated for each PCB homolog using the midpoint of the homolog’s Kow range showing in Table B-3 (Hayward and Buchanan 2007).
Table B-3: Kow Values of Homologs Used in the Baseline BAF Calculation
Homolog Midpoint Kow
Mono+Di 47,315 Tri 266,073 Tetra 1,011,579 Penta 3,349,654 Hexa 5,370,318 Hepta 17,179,084 Octa 39,810,717 Nona 82,224,265 Deca 151,356,125
The %fd for tPCBs (PCB %fd) was derived by dividing the freely-dissolved PCB concentrations by the water column tPCB concentrations:
water[tPCB]
ion)Concentrat Homolog %fd (Homolog %fd PCB (B-4)
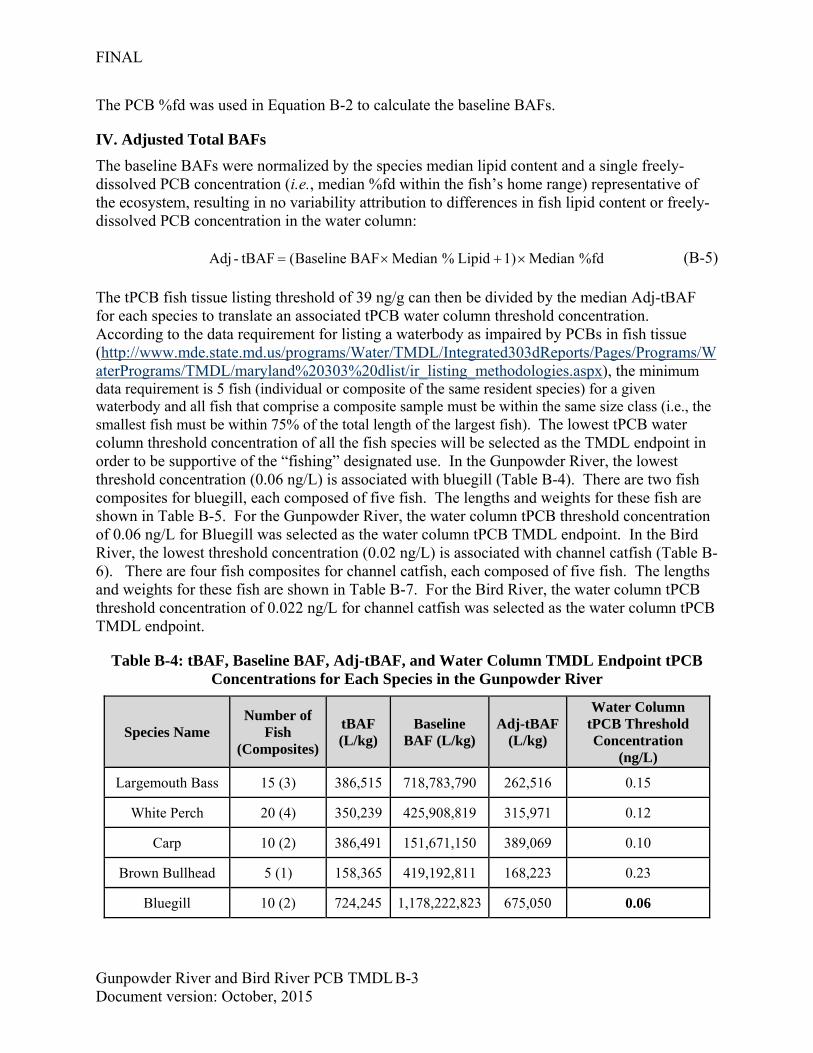
FINAL
Gunpowder River and Bird River PCB TMDL Document version: October, 2015
B-3
The PCB %fd was used in Equation B-2 to calculate the baseline BAFs.
IV. Adjusted Total BAFs
The baseline BAFs were normalized by the species median lipid content and a single freely-dissolved PCB concentration (i.e., median %fd within the fish’s home range) representative of the ecosystem, resulting in no variability attribution to differences in fish lipid content or freely-dissolved PCB concentration in the water column:
%fdMedian 1)Lipid %Median BAF Baseline( tBAF-Adj (B-5) The tPCB fish tissue listing threshold of 39 ng/g can then be divided by the median Adj-tBAF for each species to translate an associated tPCB water column threshold concentration. According to the data requirement for listing a waterbody as impaired by PCBs in fish tissue (http://www.mde.state.md.us/programs/Water/TMDL/Integrated303dReports/Pages/Programs/WaterPrograms/TMDL/maryland%20303%20dlist/ir_listing_methodologies.aspx), the minimum data requirement is 5 fish (individual or composite of the same resident species) for a given waterbody and all fish that comprise a composite sample must be within the same size class (i.e., the smallest fish must be within 75% of the total length of the largest fish). The lowest tPCB water column threshold concentration of all the fish species will be selected as the TMDL endpoint in order to be supportive of the “fishing” designated use. In the Gunpowder River, the lowest threshold concentration (0.06 ng/L) is associated with bluegill (Table B-4). There are two fish composites for bluegill, each composed of five fish. The lengths and weights for these fish are shown in Table B-5. For the Gunpowder River, the water column tPCB threshold concentration of 0.06 ng/L for Bluegill was selected as the water column tPCB TMDL endpoint. In the Bird River, the lowest threshold concentration (0.02 ng/L) is associated with channel catfish (Table B-6). There are four fish composites for channel catfish, each composed of five fish. The lengths and weights for these fish are shown in Table B-7. For the Bird River, the water column tPCB threshold concentration of 0.022 ng/L for channel catfish was selected as the water column tPCB TMDL endpoint.
Table B-4: tBAF, Baseline BAF, Adj-tBAF, and Water Column TMDL Endpoint tPCB Concentrations for Each Species in the Gunpowder River
Species Name Number of
Fish (Composites)
tBAF (L/kg)
Baseline BAF (L/kg)
Adj-tBAF (L/kg)
Water Column tPCB Threshold Concentration
(ng/L)
Largemouth Bass 15 (3) 386,515 718,783,790 262,516 0.15
White Perch 20 (4) 350,239 425,908,819 315,971 0.12
Carp 10 (2) 386,491 151,671,150 389,069 0.10
Brown Bullhead 5 (1) 158,365 419,192,811 168,223 0.23
Bluegill 10 (2) 724,245 1,178,222,823 675,050 0.06
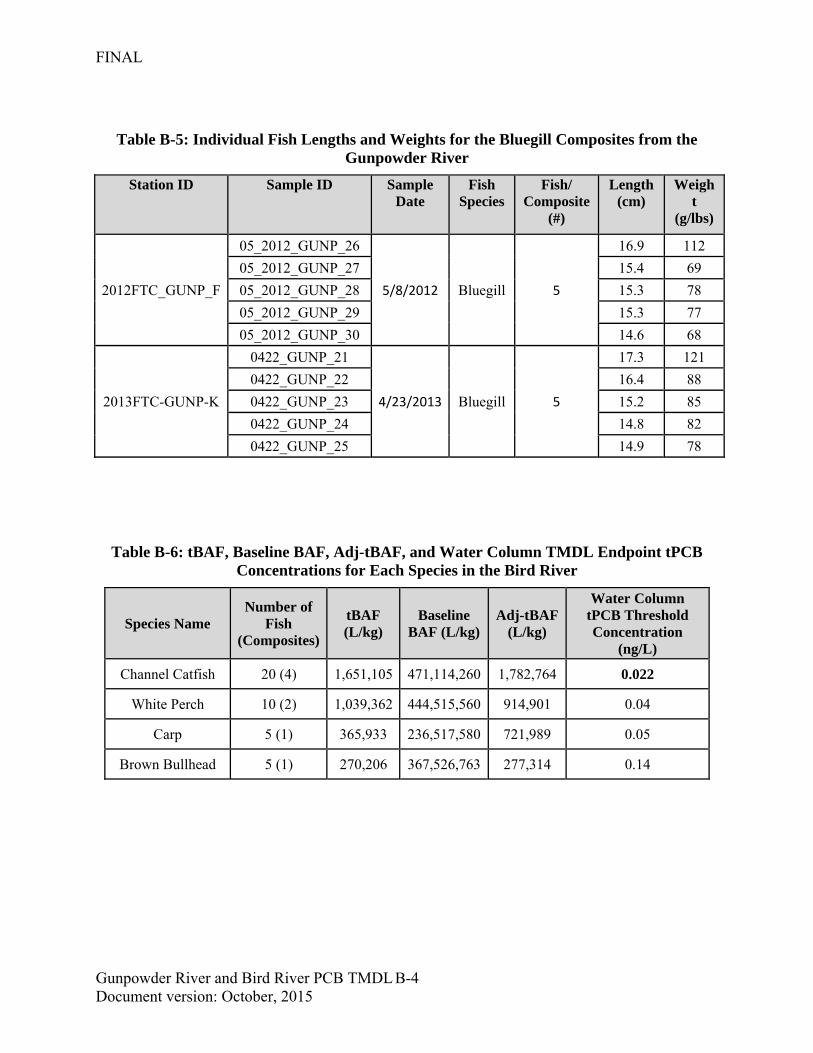
FINAL
Gunpowder River and Bird River PCB TMDL Document version: October, 2015
B-4
Table B-5: Individual Fish Lengths and Weights for the Bluegill Composites from the Gunpowder River
Station ID Sample ID Sample Date
Fish Species
Fish/ Composite
(#)
Length (cm)
Weight
(g/lbs)
2012FTC_GUNP_F
05_2012_GUNP_26
5/8/2012 Bluegill 5
16.9 112
05_2012_GUNP_27 15.4 69
05_2012_GUNP_28 15.3 78
05_2012_GUNP_29 15.3 77
05_2012_GUNP_30 14.6 68
2013FTC-GUNP-K
0422_GUNP_21
4/23/2013 Bluegill 5
17.3 121
0422_GUNP_22 16.4 88
0422_GUNP_23 15.2 85
0422_GUNP_24 14.8 82
0422_GUNP_25 14.9 78
Table B-6: tBAF, Baseline BAF, Adj-tBAF, and Water Column TMDL Endpoint tPCB Concentrations for Each Species in the Bird River
Species Name Number of
Fish (Composites)
tBAF (L/kg)
Baseline BAF (L/kg)
Adj-tBAF (L/kg)
Water Column tPCB Threshold Concentration
(ng/L)
Channel Catfish 20 (4) 1,651,105 471,114,260 1,782,764 0.022
White Perch 10 (2) 1,039,362 444,515,560 914,901 0.04
Carp 5 (1) 365,933 236,517,580 721,989 0.05
Brown Bullhead 5 (1) 270,206 367,526,763 277,314 0.14
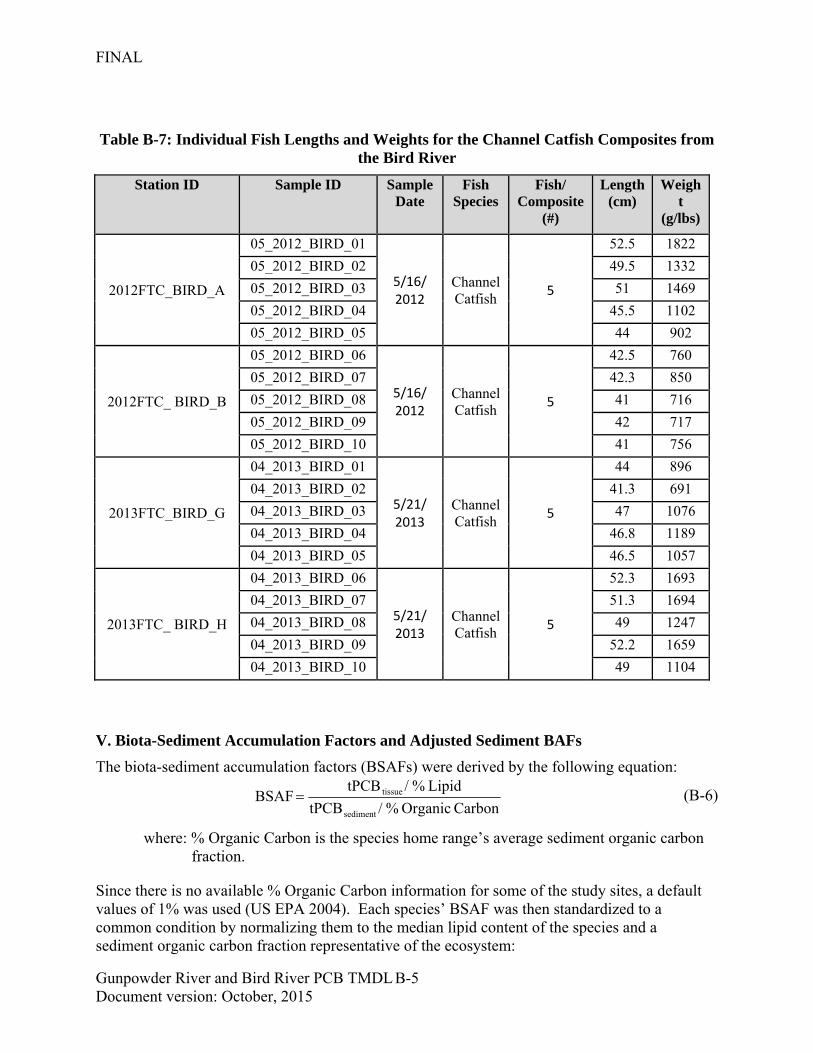
FINAL
Gunpowder River and Bird River PCB TMDL Document version: October, 2015
B-5
Table B-7: Individual Fish Lengths and Weights for the Channel Catfish Composites from the Bird River
Station ID Sample ID Sample Date
Fish Species
Fish/ Composite
(#)
Length (cm)
Weight
(g/lbs)
2012FTC_BIRD_A
05_2012_BIRD_01
5/16/ 2012
Channel Catfish
5
52.5 1822
05_2012_BIRD_02 49.5 1332
05_2012_BIRD_03 51 1469
05_2012_BIRD_04 45.5 1102
05_2012_BIRD_05 44 902
2012FTC_ BIRD_B
05_2012_BIRD_06
5/16/ 2012
Channel Catfish
5
42.5 760
05_2012_BIRD_07 42.3 850
05_2012_BIRD_08 41 716
05_2012_BIRD_09 42 717
05_2012_BIRD_10 41 756
2013FTC_BIRD_G
04_2013_BIRD_01
5/21/ 2013
Channel Catfish
5
44 896
04_2013_BIRD_02 41.3 691
04_2013_BIRD_03 47 1076
04_2013_BIRD_04 46.8 1189
04_2013_BIRD_05 46.5 1057
2013FTC_ BIRD_H
04_2013_BIRD_06
5/21/ 2013
Channel Catfish
5
52.3 1693
04_2013_BIRD_07 51.3 1694
04_2013_BIRD_08 49 1247
04_2013_BIRD_09 52.2 1659
04_2013_BIRD_10 49 1104
V. Biota-Sediment Accumulation Factors and Adjusted Sediment BAFs
The biota-sediment accumulation factors (BSAFs) were derived by the following equation:
Carbon Organic %/ tPCB
Lipid %/ tPCB BSAF
sediment
tissue (B-6)
where: % Organic Carbon is the species home range’s average sediment organic carbon fraction.
Since there is no available % Organic Carbon information for some of the study sites, a default values of 1% was used (US EPA 2004). Each species’ BSAF was then standardized to a common condition by normalizing them to the median lipid content of the species and a sediment organic carbon fraction representative of the ecosystem:
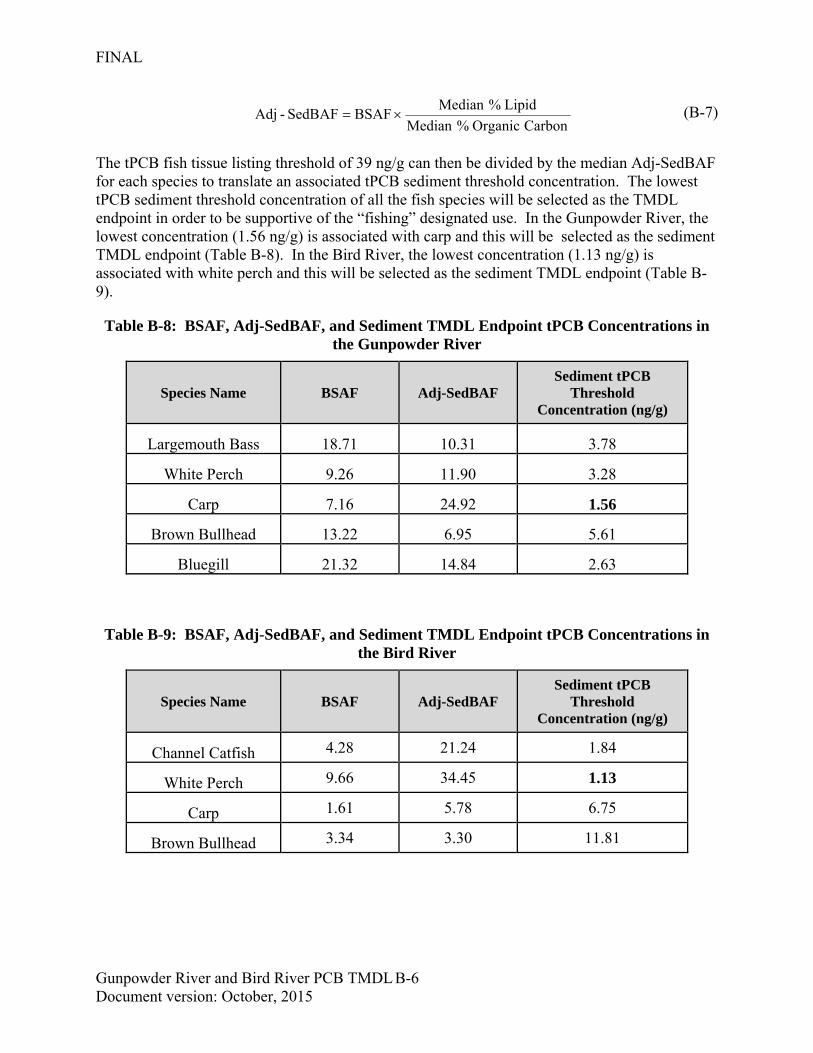
FINAL
Gunpowder River and Bird River PCB TMDL Document version: October, 2015
B-6
Carbon Organic %Median
Lipid %Median BSAFSedBAF-Adj (B-7)
The tPCB fish tissue listing threshold of 39 ng/g can then be divided by the median Adj-SedBAF for each species to translate an associated tPCB sediment threshold concentration. The lowest tPCB sediment threshold concentration of all the fish species will be selected as the TMDL endpoint in order to be supportive of the “fishing” designated use. In the Gunpowder River, the lowest concentration (1.56 ng/g) is associated with carp and this will be selected as the sediment TMDL endpoint (Table B-8). In the Bird River, the lowest concentration (1.13 ng/g) is associated with white perch and this will be selected as the sediment TMDL endpoint (Table B-9).
Table B-8: BSAF, Adj-SedBAF, and Sediment TMDL Endpoint tPCB Concentrations in the Gunpowder River
Species Name BSAF Adj-SedBAF Sediment tPCB
Threshold Concentration (ng/g)
Largemouth Bass 18.71 10.31 3.78
White Perch 9.26 11.90 3.28
Carp 7.16 24.92 1.56
Brown Bullhead 13.22 6.95 5.61
Bluegill 21.32 14.84 2.63
Table B-9: BSAF, Adj-SedBAF, and Sediment TMDL Endpoint tPCB Concentrations in the Bird River
Species Name BSAF Adj-SedBAF Sediment tPCB
Threshold Concentration (ng/g)
Channel Catfish 4.28 21.24 1.84
White Perch 9.66 34.45 1.13
Carp 1.61 5.78 6.75
Brown Bullhead 3.34 3.30 11.81
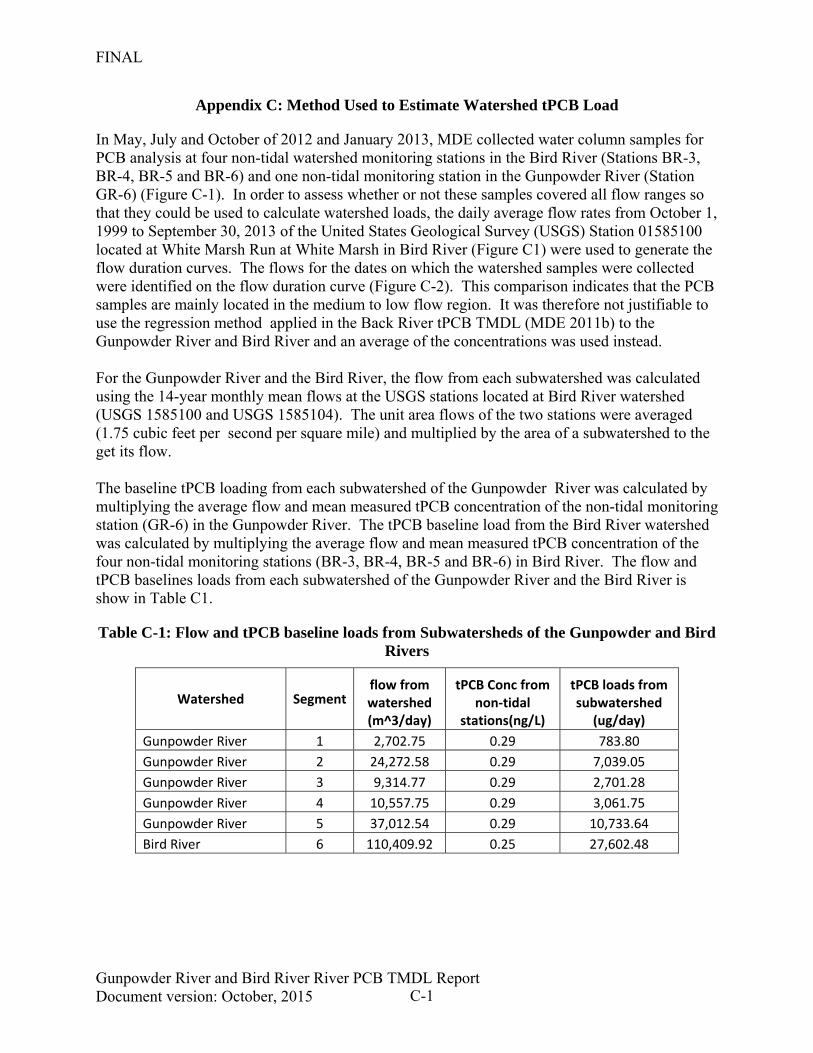
FINAL
Gunpowder River and Bird River River PCB TMDL Report Document version: October, 2015 C-1
Appendix C: Method Used to Estimate Watershed tPCB Load
In May, July and October of 2012 and January 2013, MDE collected water column samples for PCB analysis at four non-tidal watershed monitoring stations in the Bird River (Stations BR-3, BR-4, BR-5 and BR-6) and one non-tidal monitoring station in the Gunpowder River (Station GR-6) (Figure C-1). In order to assess whether or not these samples covered all flow ranges so that they could be used to calculate watershed loads, the daily average flow rates from October 1, 1999 to September 30, 2013 of the United States Geological Survey (USGS) Station 01585100 located at White Marsh Run at White Marsh in Bird River (Figure C1) were used to generate the flow duration curves. The flows for the dates on which the watershed samples were collected were identified on the flow duration curve (Figure C-2). This comparison indicates that the PCB samples are mainly located in the medium to low flow region. It was therefore not justifiable to use the regression method applied in the Back River tPCB TMDL (MDE 2011b) to the Gunpowder River and Bird River and an average of the concentrations was used instead. For the Gunpowder River and the Bird River, the flow from each subwatershed was calculated using the 14-year monthly mean flows at the USGS stations located at Bird River watershed (USGS 1585100 and USGS 1585104). The unit area flows of the two stations were averaged (1.75 cubic feet per second per square mile) and multiplied by the area of a subwatershed to the get its flow. The baseline tPCB loading from each subwatershed of the Gunpowder River was calculated by multiplying the average flow and mean measured tPCB concentration of the non-tidal monitoring station (GR-6) in the Gunpowder River. The tPCB baseline load from the Bird River watershed was calculated by multiplying the average flow and mean measured tPCB concentration of the four non-tidal monitoring stations (BR-3, BR-4, BR-5 and BR-6) in Bird River. The flow and tPCB baselines loads from each subwatershed of the Gunpowder River and the Bird River is show in Table C1.
Table C-1: Flow and tPCB baseline loads from Subwatersheds of the Gunpowder and Bird Rivers
Watershed Segmentflow from watershed (m^3/day)
tPCB Conc from non‐tidal
stations(ng/L)
tPCB loads from subwatershed
(ug/day)
Gunpowder River 1 2,702.75 0.29 783.80
Gunpowder River 2 24,272.58 0.29 7,039.05
Gunpowder River 3 9,314.77 0.29 2,701.28
Gunpowder River 4 10,557.75 0.29 3,061.75
Gunpowder River 5 37,012.54 0.29 10,733.64
Bird River 6 110,409.92 0.25 27,602.48
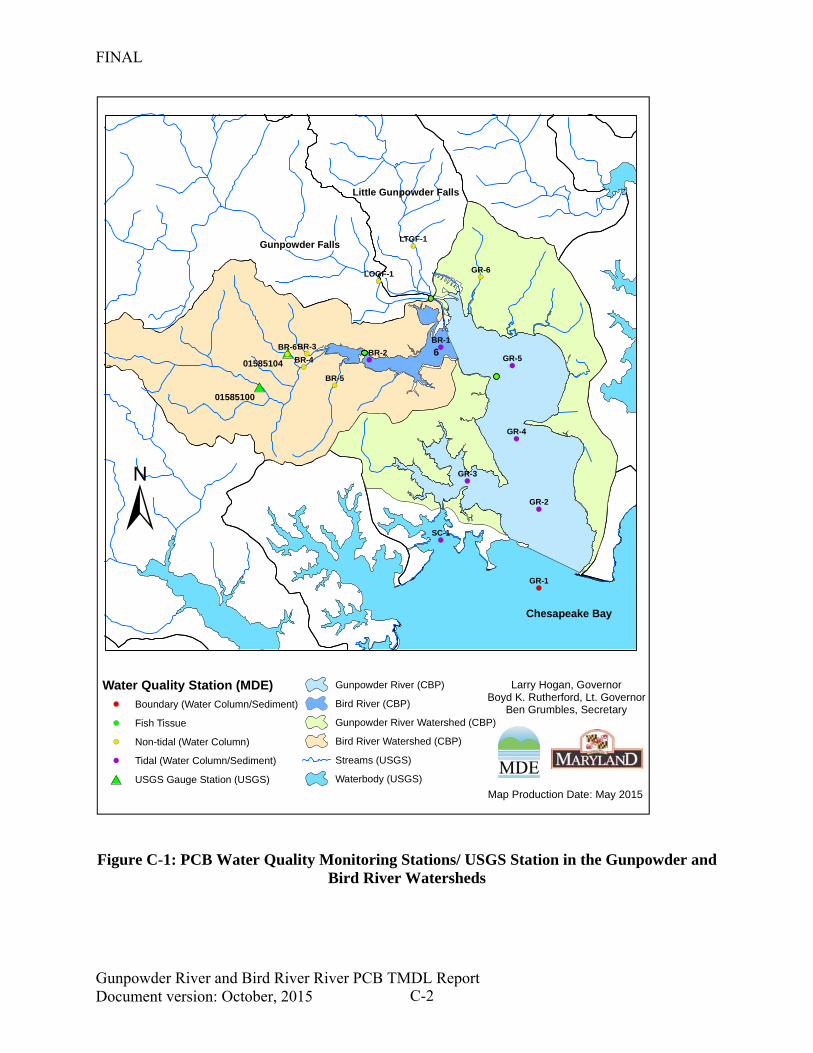
FINAL
Gunpowder River and Bird River River PCB TMDL Report Document version: October, 2015 C-2
Figure C-1: PCB Water Quality Monitoring Stations/ USGS Station in the Gunpowder and Bird River Watersheds
#*
#*!(
!(!(
!(
!(
!(
!(
!(
!(
!(
!(
!(!(
!(
!(
Little Gunpowder Falls
Chesapeake Bay
Gunpowder Falls
601585104
01585100
SC-1
GR-6
GR-5
GR-4
GR-3
GR-2
GR-1
BR-6
BR-5
BR-4
BR-3BR-2
BR-1
LTGF-1
LOGF-1
Map Production Date: May 2015
Larry Hogan, GovernorBoyd K. Rutherford, Lt. Governor
Ben Grumbles, Secretary
±
Water Quality Station (MDE)!( Boundary (Water Column/Sediment)
!( Fish Tissue
!( Non-tidal (Water Column)
!( Tidal (Water Column/Sediment)
#* USGS Gauge Station (USGS)
Gunpowder River (CBP)
Bird River (CBP)
Gunpowder River Watershed (CBP)
Bird River Watershed (CBP)
Streams (USGS)
Waterbody (USGS)
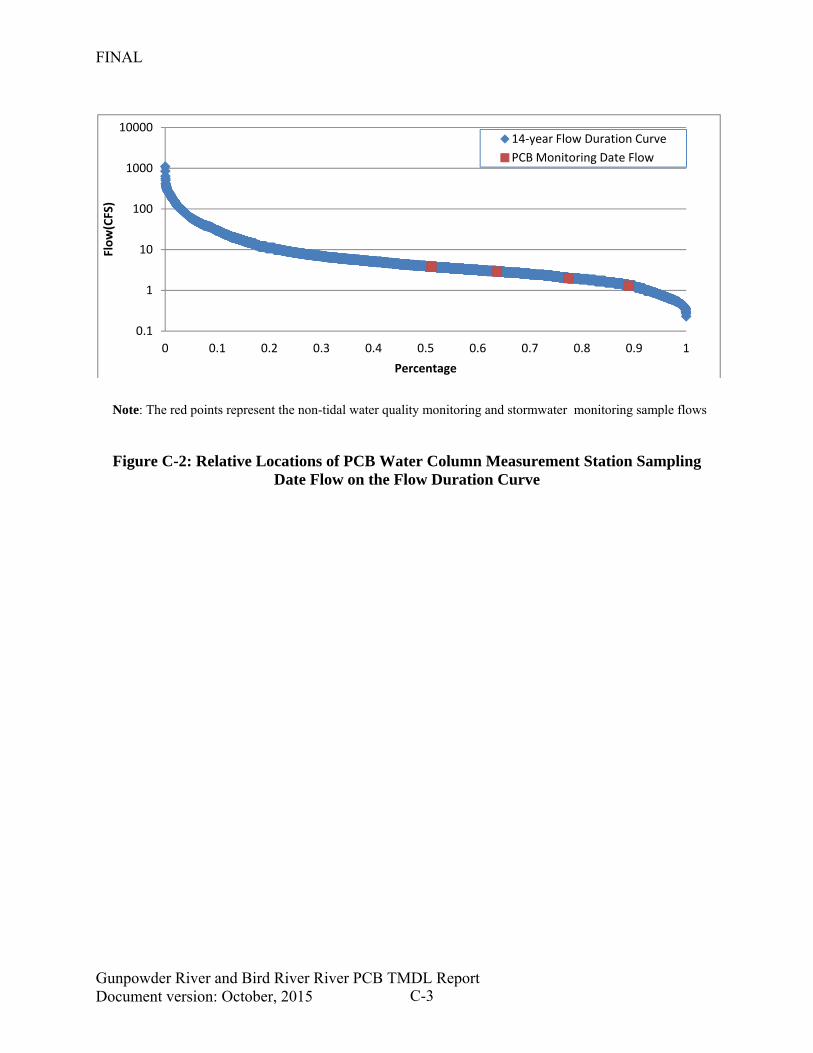
FINAL
Gunpowder River and Bird River River PCB TMDL Report Document version: October, 2015 C-3
Note: The red points represent the non-tidal water quality monitoring and stormwater monitoring sample flows
Figure C-2: Relative Locations of PCB Water Column Measurement Station Sampling Date Flow on the Flow Duration Curve
0.1
1
10
100
1000
10000
0 0.1 0.2 0.3 0.4 0.5 0.6 0.7 0.8 0.9 1
Flow(CFS)
Percentage
14‐year Flow Duration Curve
PCB Monitoring Date Flow
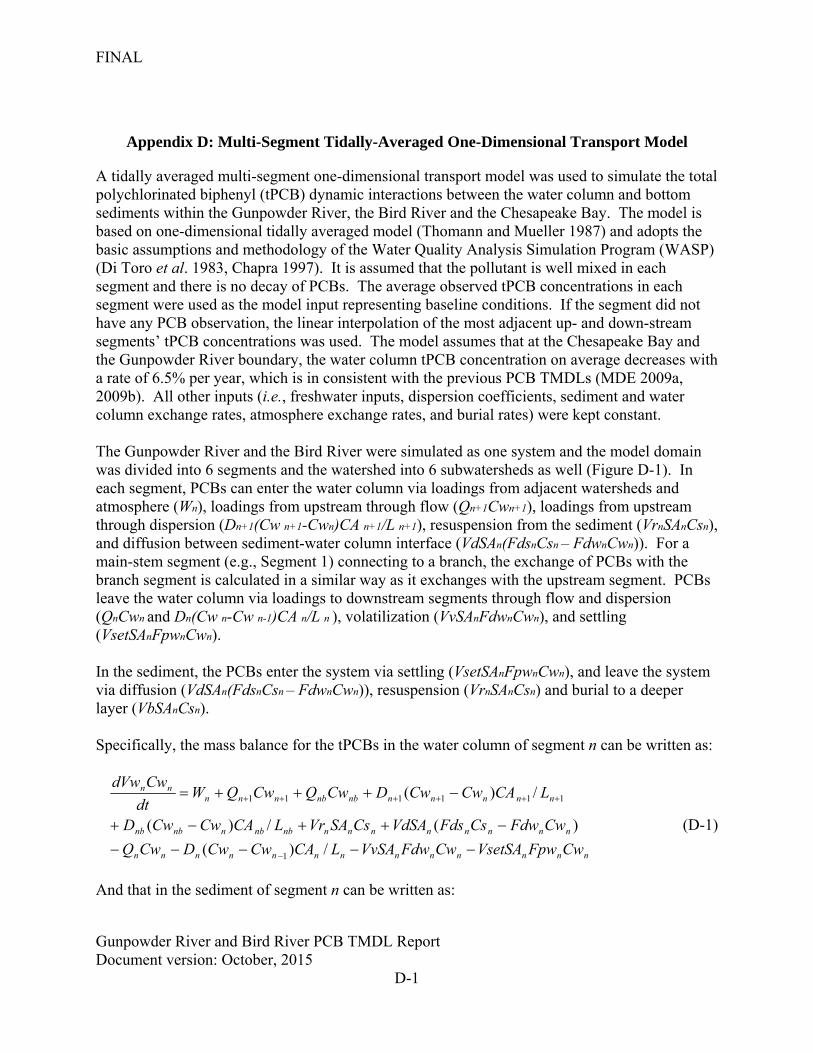
FINAL
Gunpowder River and Bird River PCB TMDL Report Document version: October, 2015
D-1
Appendix D: Multi-Segment Tidally-Averaged One-Dimensional Transport Model
A tidally averaged multi-segment one-dimensional transport model was used to simulate the total polychlorinated biphenyl (tPCB) dynamic interactions between the water column and bottom sediments within the Gunpowder River, the Bird River and the Chesapeake Bay. The model is based on one-dimensional tidally averaged model (Thomann and Mueller 1987) and adopts the basic assumptions and methodology of the Water Quality Analysis Simulation Program (WASP) (Di Toro et al. 1983, Chapra 1997). It is assumed that the pollutant is well mixed in each segment and there is no decay of PCBs. The average observed tPCB concentrations in each segment were used as the model input representing baseline conditions. If the segment did not have any PCB observation, the linear interpolation of the most adjacent up- and down-stream segments’ tPCB concentrations was used. The model assumes that at the Chesapeake Bay and the Gunpowder River boundary, the water column tPCB concentration on average decreases with a rate of 6.5% per year, which is in consistent with the previous PCB TMDLs (MDE 2009a, 2009b). All other inputs (i.e., freshwater inputs, dispersion coefficients, sediment and water column exchange rates, atmosphere exchange rates, and burial rates) were kept constant. The Gunpowder River and the Bird River were simulated as one system and the model domain was divided into 6 segments and the watershed into 6 subwatersheds as well (Figure D-1). In each segment, PCBs can enter the water column via loadings from adjacent watersheds and atmosphere (Wn), loadings from upstream through flow (Qn+1Cwn+1), loadings from upstream through dispersion (Dn+1(Cw n+1-Cwn)CA n+1/L n+1), resuspension from the sediment (VrnSAnCsn), and diffusion between sediment-water column interface (VdSAn(FdsnCsn – FdwnCwn)). For a main-stem segment (e.g., Segment 1) connecting to a branch, the exchange of PCBs with the branch segment is calculated in a similar way as it exchanges with the upstream segment. PCBs leave the water column via loadings to downstream segments through flow and dispersion (QnCwn and Dn(Cw n-Cw n-1)CA n/L n ), volatilization (VvSAnFdwnCwn), and settling (VsetSAnFpwnCwn). In the sediment, the PCBs enter the system via settling (VsetSAnFpwnCwn), and leave the system via diffusion (VdSAn(FdsnCsn – FdwnCwn)), resuspension (VrnSAnCsn) and burial to a deeper layer (VbSAnCsn). Specifically, the mass balance for the tPCBs in the water column of segment n can be written as:
nnnnnnnnnnnnn
nnnnnnnnnbnbnnbnb
nnnnnnbnbnnnnn
CwFpwVsetSACwFdwVvSALCACwCwDCwQ
CwFdwCsFdsVdSACsSAVrLCACwCwD
LCACwCwDCwQCwQWdt
CwdVw
/)(
)(/)(
/)(
1
111111
(D-1)
And that in the sediment of segment n can be written as:
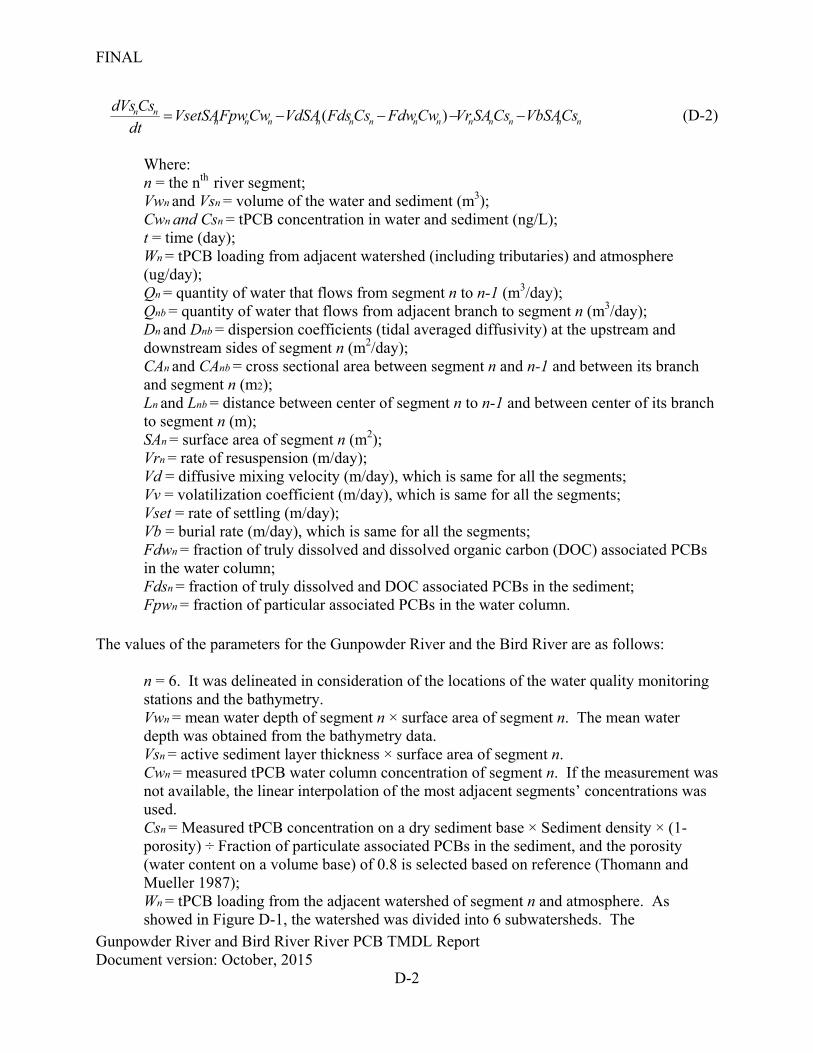
FINAL
Gunpowder River and Bird River River PCB TMDL Report Document version: October, 2015
D-2
nnnnnnnnnnnnnnn CsVbSACsSAVrCwFdwCsFdsVdSACwFpwVsetSA
dt
CsdVs )( (D-2)
Where: n = the nth
river segment; Vwn and Vsn = volume of the water and sediment (m3); Cwn and Csn = tPCB concentration in water and sediment (ng/L); t = time (day); Wn = tPCB loading from adjacent watershed (including tributaries) and atmosphere (ug/day); Qn = quantity of water that flows from segment n to n-1 (m3/day); Qnb = quantity of water that flows from adjacent branch to segment n (m3/day); Dn and Dnb = dispersion coefficients (tidal averaged diffusivity) at the upstream and downstream sides of segment n (m2/day); CAn and CAnb = cross sectional area between segment n and n-1 and between its branch and segment n (m2); Ln and Lnb = distance between center of segment n to n-1 and between center of its branch to segment n (m); SAn = surface area of segment n (m2); Vrn = rate of resuspension (m/day); Vd = diffusive mixing velocity (m/day), which is same for all the segments; Vv = volatilization coefficient (m/day), which is same for all the segments; Vset = rate of settling (m/day); Vb = burial rate (m/day), which is same for all the segments; Fdwn = fraction of truly dissolved and dissolved organic carbon (DOC) associated PCBs in the water column; Fdsn = fraction of truly dissolved and DOC associated PCBs in the sediment; Fpwn = fraction of particular associated PCBs in the water column.
The values of the parameters for the Gunpowder River and the Bird River are as follows:
n = 6. It was delineated in consideration of the locations of the water quality monitoring stations and the bathymetry. Vwn = mean water depth of segment n × surface area of segment n. The mean water depth was obtained from the bathymetry data. Vsn = active sediment layer thickness × surface area of segment n. Cwn = measured tPCB water column concentration of segment n. If the measurement was not available, the linear interpolation of the most adjacent segments’ concentrations was used. Csn = Measured tPCB concentration on a dry sediment base × Sediment density × (1-porosity) ÷ Fraction of particulate associated PCBs in the sediment, and the porosity (water content on a volume base) of 0.8 is selected based on reference (Thomann and Mueller 1987); Wn = tPCB loading from the adjacent watershed of segment n and atmosphere. As showed in Figure D-1, the watershed was divided into 6 subwatersheds. The
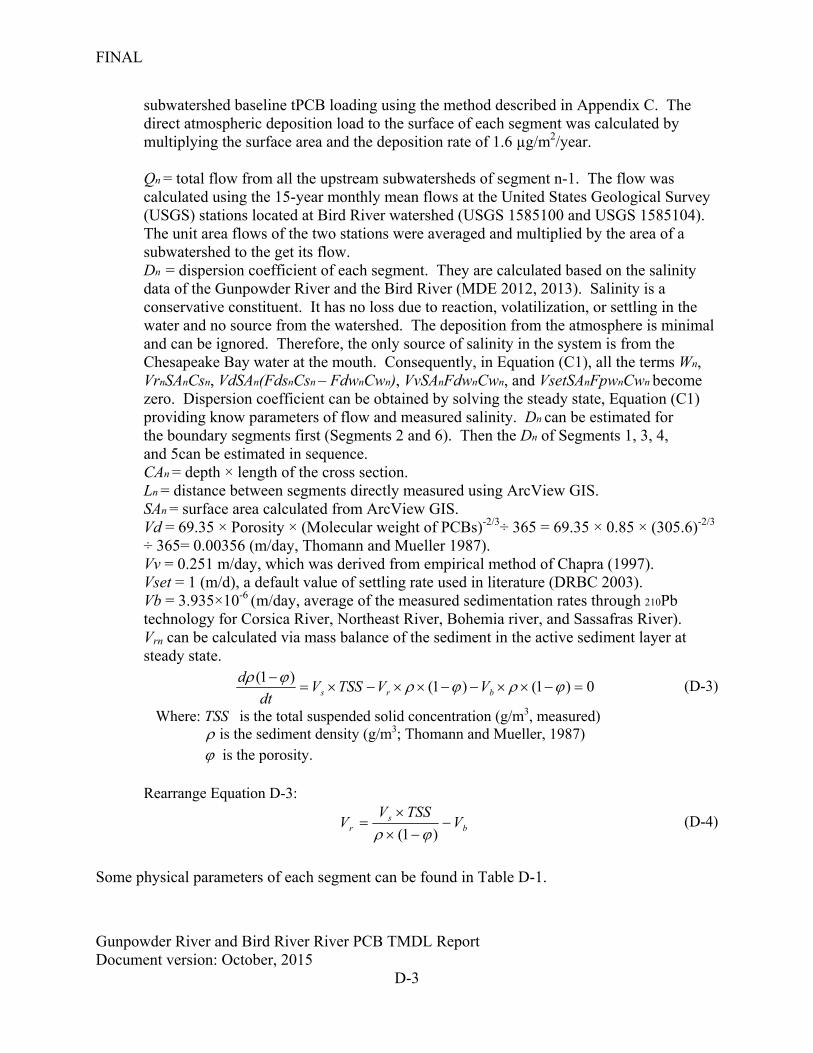
FINAL
Gunpowder River and Bird River River PCB TMDL Report Document version: October, 2015
D-3
subwatershed baseline tPCB loading using the method described in Appendix C. The direct atmospheric deposition load to the surface of each segment was calculated by multiplying the surface area and the deposition rate of 1.6 µg/m2/year.
Qn = total flow from all the upstream subwatersheds of segment n-1. The flow was calculated using the 15-year monthly mean flows at the United States Geological Survey (USGS) stations located at Bird River watershed (USGS 1585100 and USGS 1585104). The unit area flows of the two stations were averaged and multiplied by the area of a subwatershed to the get its flow.
Dn = dispersion coefficient of each segment. They are calculated based on the salinity data of the Gunpowder River and the Bird River (MDE 2012, 2013). Salinity is a conservative constituent. It has no loss due to reaction, volatilization, or settling in the water and no source from the watershed. The deposition from the atmosphere is minimal and can be ignored. Therefore, the only source of salinity in the system is from the Chesapeake Bay water at the mouth. Consequently, in Equation (C1), all the terms Wn,
VrnSAnCsn, VdSAn(FdsnCsn – FdwnCwn), VvSAnFdwnCwn, and VsetSAnFpwnCwn become zero. Dispersion coefficient can be obtained by solving the steady state, Equation (C1)
providing know parameters of flow and measured salinity. Dn can be estimated for the boundary segments first (Segments 2 and 6). Then the Dn of Segments 1, 3, 4, and 5can be estimated in sequence.
CAn = depth × length of the cross section. Ln = distance between segments directly measured using ArcView GIS. SAn = surface area calculated from ArcView GIS. Vd = 69.35 × Porosity × (Molecular weight of PCBs)-2/3÷ 365 = 69.35 × 0.85 × (305.6)-2/3
÷ 365= 0.00356 (m/day, Thomann and Mueller 1987). Vv = 0.251 m/day, which was derived from empirical method of Chapra (1997). Vset = 1 (m/d), a default value of settling rate used in literature (DRBC 2003). Vb = 3.935×10⁻⁶
(m/day, average of the measured sedimentation rates through 210Pb technology for Corsica River, Northeast River, Bohemia river, and Sassafras River). Vrn can be calculated via mass balance of the sediment in the active sediment layer at steady state.
0)1()1()1(
brs VVTSSVdt
d (D-3)
Where: TSS is the total suspended solid concentration (g/m3, measured) is the sediment density (g/m3; Thomann and Mueller, 1987)
is the porosity.
Rearrange Equation D-3:
bs
r VTSSV
V
)1( (D-4)
Some physical parameters of each segment can be found in Table D-1.
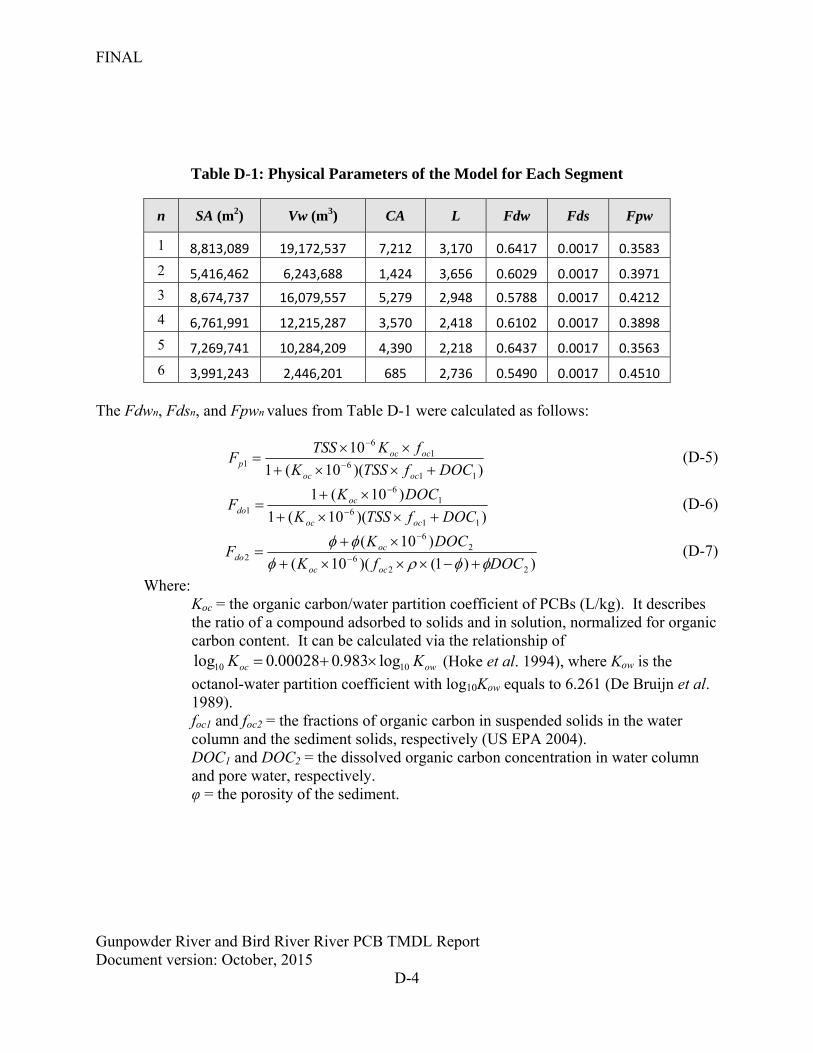
FINAL
Gunpowder River and Bird River River PCB TMDL Report Document version: October, 2015
D-4
Table D-1: Physical Parameters of the Model for Each Segment
n SA (m2) Vw (m3) CA L Fdw Fds Fpw
1 8,813,089 19,172,537 7,212 3,170 0.6417 0.0017 0.3583
2 5,416,462 6,243,688 1,424 3,656 0.6029 0.0017 0.3971
3 8,674,737 16,079,557 5,279 2,948 0.5788 0.0017 0.4212
4 6,761,991 12,215,287 3,570 2,418 0.6102 0.0017 0.3898
5 7,269,741 10,284,209 4,390 2,218 0.6437 0.0017 0.3563
6 3,991,243 2,446,201 685 2,736 0.5490 0.0017 0.4510
The Fdwn, Fdsn, and Fpwn values from Table D-1 were calculated as follows:
))(10(1
10
116
16
1 DOCfTSSK
fKTSSF
ococ
ococp
(D-5)
))(10(1
)10(1
116
16
1 DOCfTSSK
DOCKF
ococ
ocdo
(D-6)
))1()(10(
)10(
226
26
2 DOCfK
DOCKF
ococ
ocdo
(D-7)
Where: Koc = the organic carbon/water partition coefficient of PCBs (L/kg). It describes the ratio of a compound adsorbed to solids and in solution, normalized for organic carbon content. It can be calculated via the relationship of
owoc KK 1010 log983.000028.0log (Hoke et al. 1994), where Kow is the
octanol-water partition coefficient with log10Kow equals to 6.261 (De Bruijn et al. 1989). foc1 and foc2 = the fractions of organic carbon in suspended solids in the water column and the sediment solids, respectively (US EPA 2004). DOC1 and DOC2 = the dissolved organic carbon concentration in water column and pore water, respectively. φ = the porosity of the sediment.
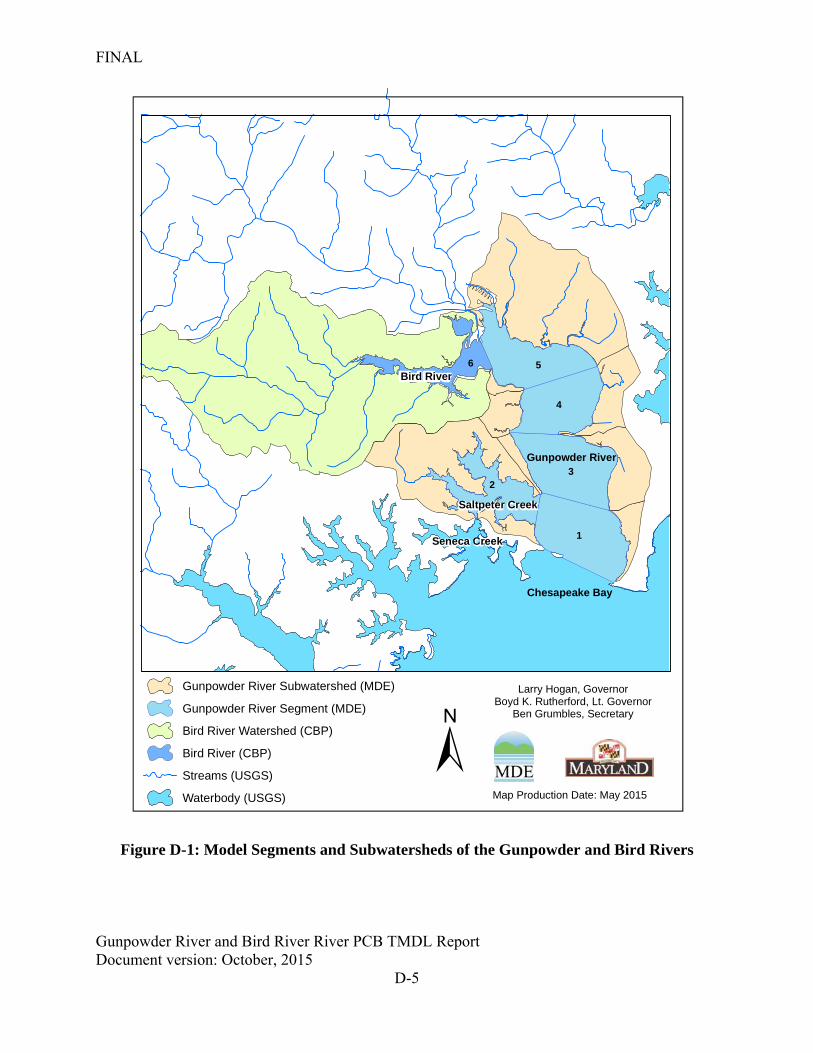
FINAL
Gunpowder River and Bird River River PCB TMDL Report Document version: October, 2015
D-5
Figure D-1: Model Segments and Subwatersheds of the Gunpowder and Bird Rivers
Gunpowder River
Chesapeake Bay
Saltpeter Creek
Seneca Creek
Bird River6
1
3
5
4
2
Map Production Date: May 2015
Larry Hogan, GovernorBoyd K. Rutherford, Lt. Governor
Ben Grumbles, Secretary
±Gunpowder River Subwatershed (MDE)
Gunpowder River Segment (MDE)
Bird River Watershed (CBP)
Bird River (CBP)
Streams (USGS)
Waterbody (USGS)
FINAL
Gunpowder River and Bird River PCB TMDL Report Document version: October, 2015 E-1
Appendix E: Technical Approach Used to Generate Maximum Daily Loads
I. Summary
This appendix documents the technical approach used to define MDLs of tPCBs consistent with the average annual TMDL, which is protective of the “fishing” designated use, which is protective of human health related to the consumption of fish, in the Gunpowder River and the Bird River. The approach builds upon the modeling analysis that was conducted to determine the loads of tPCBs and can be summarized as follows:
The approach defines MDLs for each of the source categories;
The approach builds upon the TMDL modeling analysis that was conducted to ensure that average annual load targets result in compliance with the TMDL endpoint tPCB concentrations;
The approach converts daily time-series loads into TMDL values in a manner that is consistent with available EPA guidance on generating daily loads for TMDLs;
The approach considers a daily load level of a resolution based on the specific data that exists for each source category.
II. Introduction
This appendix documents the development and application of the approach used to define TMDLs on a daily basis. It is divided into sections discussing:
Basis for approach,
Options considered,
Selected approach,
Results of approach.
III. Basis for Approach
The overall approach for the development of daily loads was based upon the following factors:
Average Annual TMDL: The basis of the average annual tPCB TMDL is that the baseline tPCB load rates result in tPCB levels in fish tissue that exceed the tPCB fish tissue listing threshold. Thus, the average annual tPCB TMDL was calculated to be protective of the “fishing” designated use, which is protective of human health related to the consumption of fish.
Draft EPA guidance document entitled Developing Daily Loads for Load-based TMDLs: This guidance provides options for defining MDLs when using TMDL approaches that generate daily output.
The rationale for developing TMDLs expressed as daily loads was to accept the existing average annual TMDL, but then develop a method for converting this value to a MDL – in a manner consistent with EPA guidance and available information.
FINAL
Gunpowder River and Bird River PCB TMDL Report Document version: October, 2015 E-2
VI. Options Considered
The draft EPA guidance document for developing daily loads does not specify a single approach that must be adhered to, but rather, it contains a range of acceptable options. The selection of a specific method for translating a time-series of allowable loads into the expression of a TMDL requires decisions regarding both the level of resolution (e.g., single daily load for all conditions vs. loads that vary with environmental conditions) and level of probability associated with the TMDL.
This section describes the range of options that were considered when developing methods to calculate the MDL for the Gunpowder River and the Bird River.
Level of Resolution
The level of resolution pertains to the amount of detail used in specifying the MDL. The draft EPA guidance on daily loads provides three categories of options for level of resolution, all of which are potentially applicable for the Gunpowder River and the Bird River:
1. Representative daily load: In this option, a single daily load (or multiple representative daily loads) is specified that covers all time periods and environmental conditions;
2. Flow-variable daily load: This option allows the MDL to vary based upon the observed flow condition;
3. Temporally-variable daily load: This option allows the MDL to vary based upon seasons or times of varying source or water body behavior.
Probability Level
All TMDLs have some probability of being exceeded, with the specific probability being explicitly specified or implicitly assumed. This level of probability directly or indirectly reflects two separate phenomena:
1. Water quality criteria consist of components describing acceptable magnitude, duration, and frequency. The frequency component addresses how often conditions can allowably surpass the combined magnitude and duration components.
2. Pollutant loads, especially from wet weather sources, typically exhibit a large degree of variability over time. It is rarely practical to specify a “never to be exceeded value” for a daily load, as essentially any load value has some finite probability of being exceeded.
The draft daily load guidance document states that the probability component of the MDL should be “based on a representative statistical measure” that is dependent upon the specific TMDL and best professional judgment of the developers. This statistical measure represents how often the MDL is expected/allowed to be exceeded. The primary options for selecting this level of protection would be:
1. The MDL reflects some central tendency: In this option, the MDL is based upon the mean or median value of the range of loads expected to occur. The variability in the actual loads is not addressed.
2. The MDL reflects a level of protection implicitly provided by the selection of some “critical” period: In this option, the MDL is based upon the allowable load that is
FINAL
Gunpowder River and Bird River PCB TMDL Report Document version: October, 2015 E-3
predicted to occur during some critical period examined during the analysis. The developer does not explicitly specify the probability of occurrence.
3. The MDL is a value that will be exceeded with a pre-defined probability: In this option, a “reasonable” upper bound percentile is selected for the MDL based upon a characterization of the variability of daily loads. For example, selection of the 95th percentile value would result in a MDL that would be exceeded 5% of the time.
V. Selected Approach
The approach selected for defining the Gunpowder River and the Bird River MDLs was based upon the specific data that exists for each source category. The approach consists of unique methods for each of the following categories of sources:
Approach for Nonpoint Sources and NPDES Regulated Stormwater Point Sources;
Approach for WWTPs.
VI. Approach for Nonpoint Sources and NPDES Regulated Stormwater Point Sources
The level of resolution selected for the Gunpowder River and the Bird River MDLs was a representative daily load, expressed as a single daily load for each load source. This approach was chosen due to the nature of PCBs and the focus of this study on a TMDL endpoint protective of the “fishing” designated use. Daily flow and temporal variability do not affect the rate of PCB bioaccumulation in fish tissue over the long term thus establishing no influence on achievement of the TMDL endpoint. A MDL at this level of resolution is unwarranted. The MDL was estimated based on three factors: a specified probability level, the average annual tPCB TMDL, and the coefficient of variation (CV) of the initial condition for ambient water column tPCB concentrations in the Gunpowder River and the Bird River. The probability level (or exceedance frequency) is based upon guidance from US EPA (1991) where examples suggest that when converting from a long-term average to a daily value, the z-score corresponding to the 99th percentile of the log-normal probability distribution should be used. The CV was calculated using the arithmetic mean and standard deviation of the baseline ambient water column tPCB concentrations in the Gunpowder River and the Bird River. The resulting CV of 0.325 was calculated using the following equation:
CV (Equation E-1)
Where, CV = coefficient of variation
α = mean (arithmetic) β = standard deviation (arithmetic)
The maximum “daily” load for each contributing source is estimated as the long-term average annual load multiplied by a factor that accounts for expected variability of daily load values. The equation is as follows:
FINAL
Gunpowder River and Bird River PCB TMDL Report Document version: October, 2015 E-4
)5.0( 2
* zeLTAMDL (Equation E-2)
Where, MDL = Maximum daily load LTA = Long-term average (average annual load) Z = z-score associated with target probability level σ = ln(CV2+1) CV = Coefficient of variation based on arithmetic mean and standard deviation
Using a z-score associated with the 99th percent probability of 2.33, a CV of 0.325, and consistent units, the resulting dimensionless conversion factor from long-term average loads to a maximum daily value is 1.258. The average annual tPCB TMDLs in the Gunpowder River and Bird River are reported in g/year, and the conversion from g/year to a maximum daily load in g/day is 0.0034 (e.g. 1.258/365).
VIII. Approach for Industrial facility
The TMDL also considers contributions from NPDES permitted industrial facilities that discharge quantifiable concentrations of tPCBs to the Gunpowder River watershed. The MDLs were calculated for these facilities based on the guidance provided in the Technical Support Document (TSD) for Water Quality-based Toxics Control (US EPA 1991). The long-term average annual TMDL was converted to maximum daily limits using Table 5-2 of the TSD assuming a coefficient of variation of 0.6 and a 99th percentile probability. This results in a dimensionless multiplication factor of 3.11. The average annual Gunpowder River TMDL of PCBs is reported in g/year, and the conversion from g/year to a maximum daily load in g/day is 0.0085 (i.e. 3.11/365).
IX. Results of Approach
Table E-1 and Table E-2 lists the results of the selected approach to define the Gunpowder River and Bird River MDLs
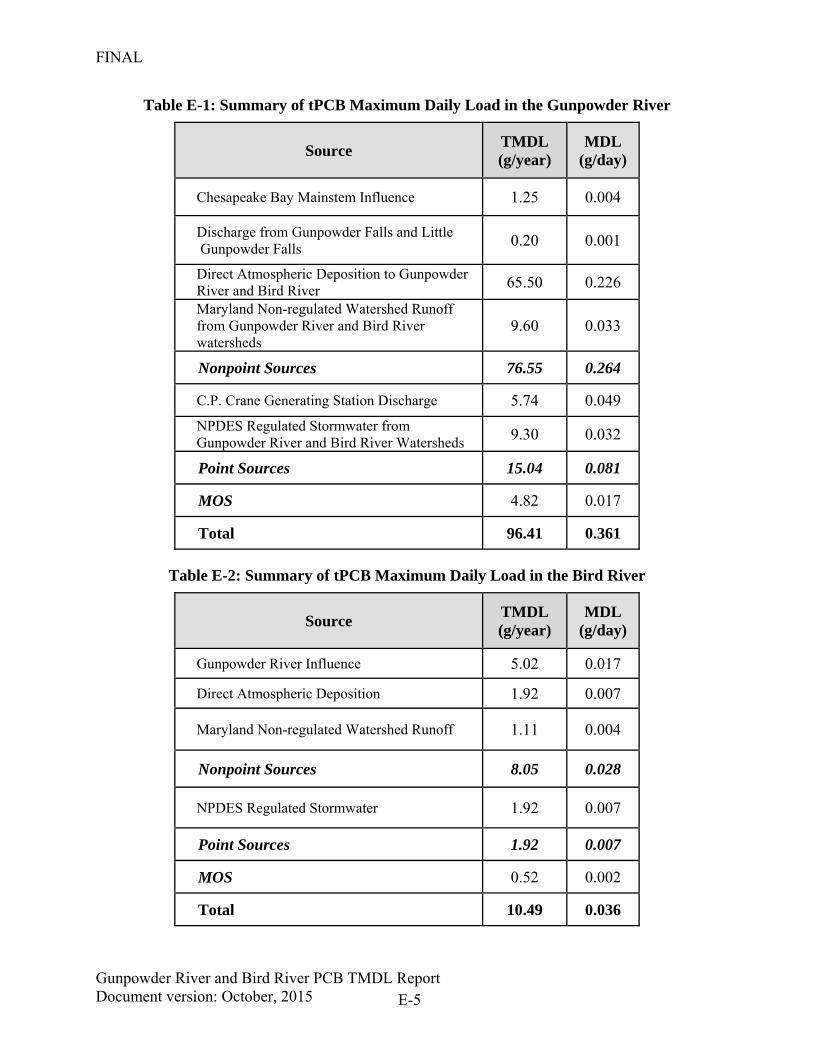
FINAL
Gunpowder River and Bird River PCB TMDL Report Document version: October, 2015 E-5
Table E-1: Summary of tPCB Maximum Daily Load in the Gunpowder River
Source TMDL (g/year)
MDL (g/day)
Chesapeake Bay Mainstem Influence 1.25 0.004
Discharge from Gunpowder Falls and Little Gunpowder Falls 0.20 0.001
Direct Atmospheric Deposition to Gunpowder River and Bird River 65.50 0.226
Maryland Non-regulated Watershed Runoff from Gunpowder River and Bird River watersheds
9.60 0.033
Nonpoint Sources 76.55 0.264
C.P. Crane Generating Station Discharge 5.74 0.049
NPDES Regulated Stormwater from Gunpowder River and Bird River Watersheds 9.30 0.032
Point Sources 15.04 0.081
MOS 4.82 0.017
Total 96.41 0.361
Table E-2: Summary of tPCB Maximum Daily Load in the Bird River
Source TMDL (g/year)
MDL (g/day)
Gunpowder River Influence 5.02 0.017
Direct Atmospheric Deposition 1.92 0.007
Maryland Non-regulated Watershed Runoff 1.11 0.004
Nonpoint Sources 8.05 0.028
NPDES Regulated Stormwater 1.92 0.007
Point Sources 1.92 0.007
MOS 0.52 0.002
Total 10.49 0.036

FINAL
Gunpowder River and Bird River PCB TMDL Report Document version: October, 2015
F-1
Appendix F: List of NPDES Regulated Stormwater Permits
Table F-1: NPDES Regulated Stormwater Permit Summary for the Gunpowder River1
MDE Permit
NPDES Facility County Type TMDL Watershed
11-DP-3313 MD0068276 State Highway Administration(MS4) All Phase I
(Baltimore, Harford) WM6 Stormwater WLA Gunpowder River
14GP MDRC MDE General Permit to Construct All Stormwater WLA Gunpowder River
11-DP-3317 MD0068314 Baltimore County Phase I MS4 Baltimore WM6 Stormwater WLA Gunpowder River
11-DP-3310 MD0068268 Harford County Phase I MS4 Harford WM6 Stormwater WLA Gunpowder River
10-MA-9321 MDG999321 Baltimore Boating Center, Llc Baltimore WMA
5 Stormwater WLA Gunpowder River
12-SW-1498 MDR001498 C. D. Thomas Company, Inc. Baltimore WMA
5 Stormwater WLA Gunpowder River
11-HT-5066 MDG675066 C.P. Crane Generating Station Baltimore WMA
5 Stormwater WLA Gunpowder River
12-SW-1776 MDR001776 Doug's Auto Recycling, Inc. Baltimore WMA
5 Stormwater WLA Gunpowder River
12-SW-0399 MDR000399 Harford County Resource Recovery
Facility Harford
WMA5
Stormwater WLA Gunpowder River
10-MM-9710
MDG499710 Lafarge Mid-Atlantic Joppa Ready
Mix Harford
WMA5
Stormwater WLA Gunpowder River
10-MA-9337 MDG999337 Long Beach Marina Llc/bulkhead And
Pier Baltimore
WMA5
Stormwater WLA Gunpowder River
12-SI-6424 MDG766424 Magnolia Middle School Harford WMA
5 Stormwater WLA Gunpowder River
10-MA-9306 MDG999306 Marinemax Northeast. Llc Harford WMA
5 Stormwater WLA Gunpowder River
12-SI-6302 MDG766302 Porters Seneca Park Marina Baltimore WMA
5 Stormwater WLA Gunpowder River
10-MA-9117 MDG999117 Seneca River Boat Yard Baltimore WMA
5 Stormwater WLA Gunpowder River
10-NE-1355 MDR001355 Schneider Property, LLC - Glen Arm Baltimore WMA
5 Stormwater WLA Gunpowder River
12-SR-1831 MDR001831 Wirtz & Daughters, Inc. Baltimore WMA
5 Stormwater WLA Gunpowder River
Note: 1 Although not listed in this table, some individual process water permits incorporate stormwater requirements and are accounted for within the NPDES Stormwater WLA, as well as additional Phase II permitted MS4s, such as military bases, hospitals, etc.
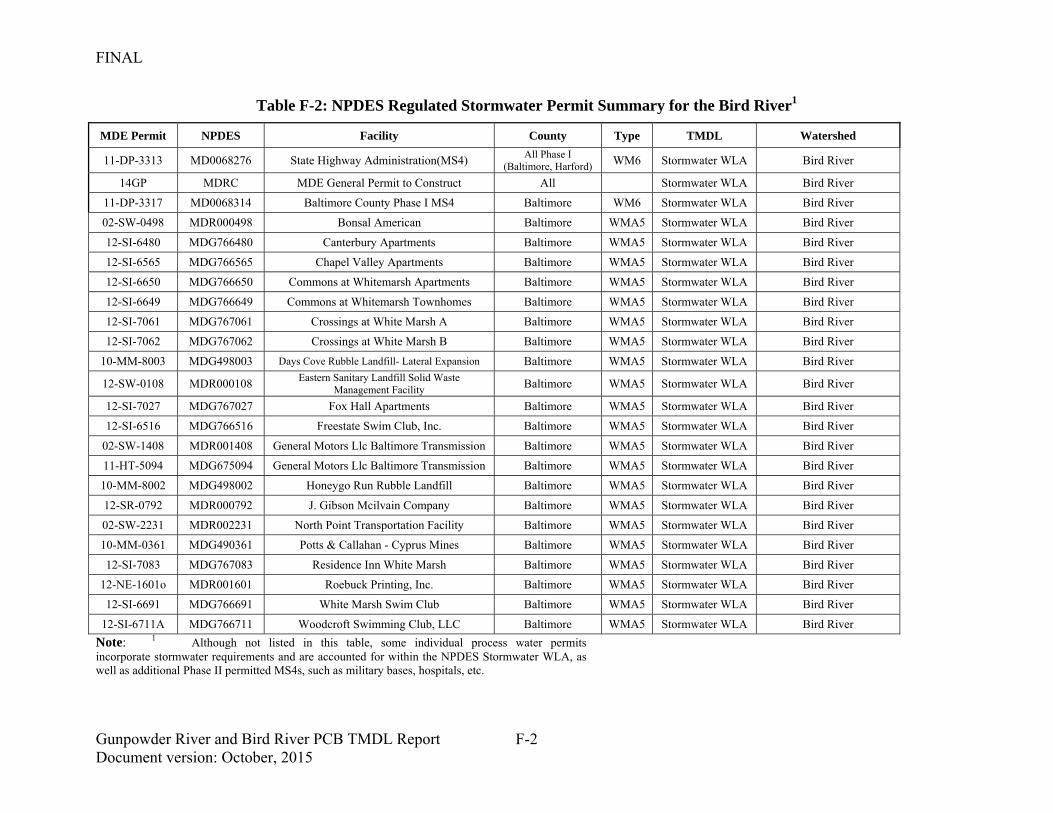
FINAL
Gunpowder River and Bird River PCB TMDL Report Document version: October, 2015
F-2
Table F-2: NPDES Regulated Stormwater Permit Summary for the Bird River1
MDE Permit NPDES Facility County Type TMDL Watershed
11-DP-3313 MD0068276 State Highway Administration(MS4) All Phase I (Baltimore, Harford) WM6 Stormwater WLA Bird River
14GP MDRC MDE General Permit to Construct All Stormwater WLA Bird River
11-DP-3317 MD0068314 Baltimore County Phase I MS4 Baltimore WM6 Stormwater WLA Bird River
02-SW-0498 MDR000498 Bonsal American Baltimore WMA5 Stormwater WLA Bird River
12-SI-6480 MDG766480 Canterbury Apartments Baltimore WMA5 Stormwater WLA Bird River
12-SI-6565 MDG766565 Chapel Valley Apartments Baltimore WMA5 Stormwater WLA Bird River
12-SI-6650 MDG766650 Commons at Whitemarsh Apartments Baltimore WMA5 Stormwater WLA Bird River
12-SI-6649 MDG766649 Commons at Whitemarsh Townhomes Baltimore WMA5 Stormwater WLA Bird River
12-SI-7061 MDG767061 Crossings at White Marsh A Baltimore WMA5 Stormwater WLA Bird River
12-SI-7062 MDG767062 Crossings at White Marsh B Baltimore WMA5 Stormwater WLA Bird River
10-MM-8003 MDG498003 Days Cove Rubble Landfill- Lateral Expansion Baltimore WMA5 Stormwater WLA Bird River
12-SW-0108 MDR000108 Eastern Sanitary Landfill Solid Waste Management Facility Baltimore WMA5 Stormwater WLA Bird River
12-SI-7027 MDG767027 Fox Hall Apartments Baltimore WMA5 Stormwater WLA Bird River
12-SI-6516 MDG766516 Freestate Swim Club, Inc. Baltimore WMA5 Stormwater WLA Bird River
02-SW-1408 MDR001408 General Motors Llc Baltimore Transmission Baltimore WMA5 Stormwater WLA Bird River
11-HT-5094 MDG675094 General Motors Llc Baltimore Transmission Baltimore WMA5 Stormwater WLA Bird River
10-MM-8002 MDG498002 Honeygo Run Rubble Landfill Baltimore WMA5 Stormwater WLA Bird River
12-SR-0792 MDR000792 J. Gibson Mcilvain Company Baltimore WMA5 Stormwater WLA Bird River
02-SW-2231 MDR002231 North Point Transportation Facility Baltimore WMA5 Stormwater WLA Bird River
10-MM-0361 MDG490361 Potts & Callahan - Cyprus Mines Baltimore WMA5 Stormwater WLA Bird River
12-SI-7083 MDG767083 Residence Inn White Marsh Baltimore WMA5 Stormwater WLA Bird River
12-NE-1601o MDR001601 Roebuck Printing, Inc. Baltimore WMA5 Stormwater WLA Bird River
12-SI-6691 MDG766691 White Marsh Swim Club Baltimore WMA5 Stormwater WLA Bird River
12-SI-6711A MDG766711 Woodcroft Swimming Club, LLC Baltimore WMA5 Stormwater WLA Bird River
Note: 1 Although not listed in this table, some individual process water permits incorporate stormwater requirements and are accounted for within the NPDES Stormwater WLA, as well as additional Phase II permitted MS4s, such as military bases, hospitals, etc.
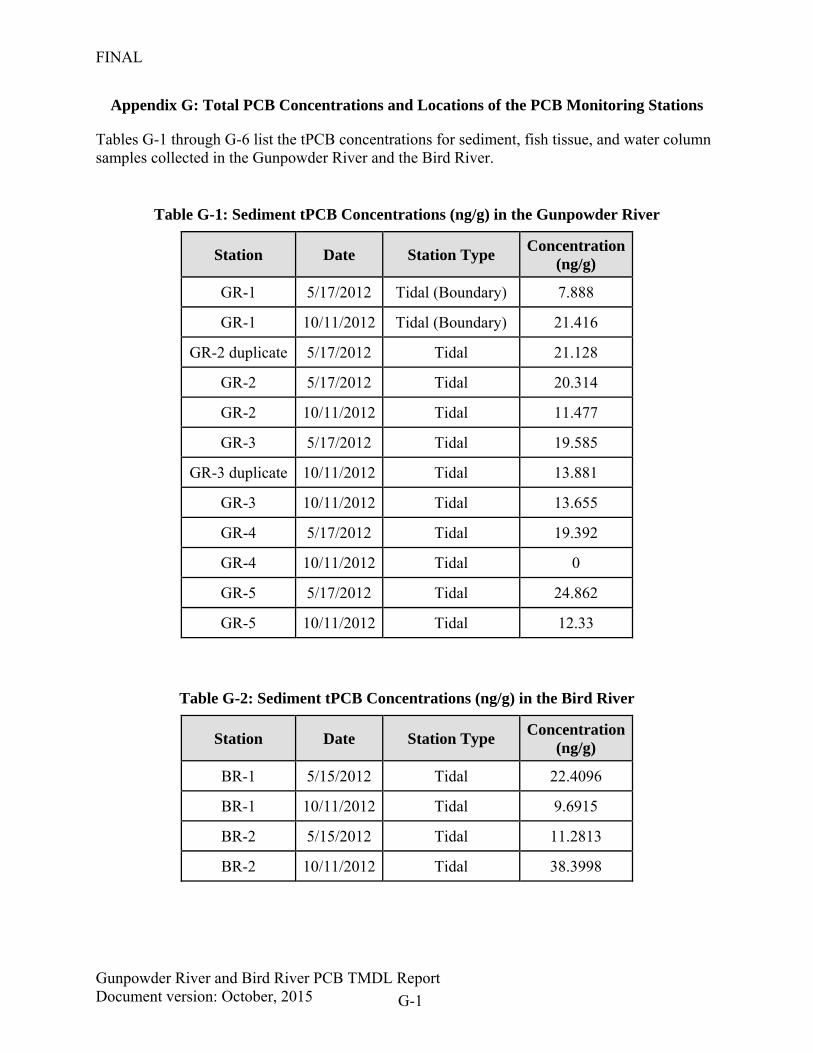
FINAL
Gunpowder River and Bird River PCB TMDL Report Document version: October, 2015 G-1
Appendix G: Total PCB Concentrations and Locations of the PCB Monitoring Stations
Tables G-1 through G-6 list the tPCB concentrations for sediment, fish tissue, and water column samples collected in the Gunpowder River and the Bird River.
Table G-1: Sediment tPCB Concentrations (ng/g) in the Gunpowder River
Station Date Station Type Concentration
(ng/g)
GR-1 5/17/2012 Tidal (Boundary) 7.888
GR-1 10/11/2012 Tidal (Boundary) 21.416
GR-2 duplicate 5/17/2012 Tidal 21.128
GR-2 5/17/2012 Tidal 20.314
GR-2 10/11/2012 Tidal 11.477
GR-3 5/17/2012 Tidal 19.585
GR-3 duplicate 10/11/2012 Tidal 13.881
GR-3 10/11/2012 Tidal 13.655
GR-4 5/17/2012 Tidal 19.392
GR-4 10/11/2012 Tidal 0
GR-5 5/17/2012 Tidal 24.862
GR-5 10/11/2012 Tidal 12.33
Table G-2: Sediment tPCB Concentrations (ng/g) in the Bird River
Station Date Station Type Concentration
(ng/g)
BR-1 5/15/2012 Tidal 22.4096
BR-1 10/11/2012 Tidal 9.6915
BR-2 5/15/2012 Tidal 11.2813
BR-2 10/11/2012 Tidal 38.3998
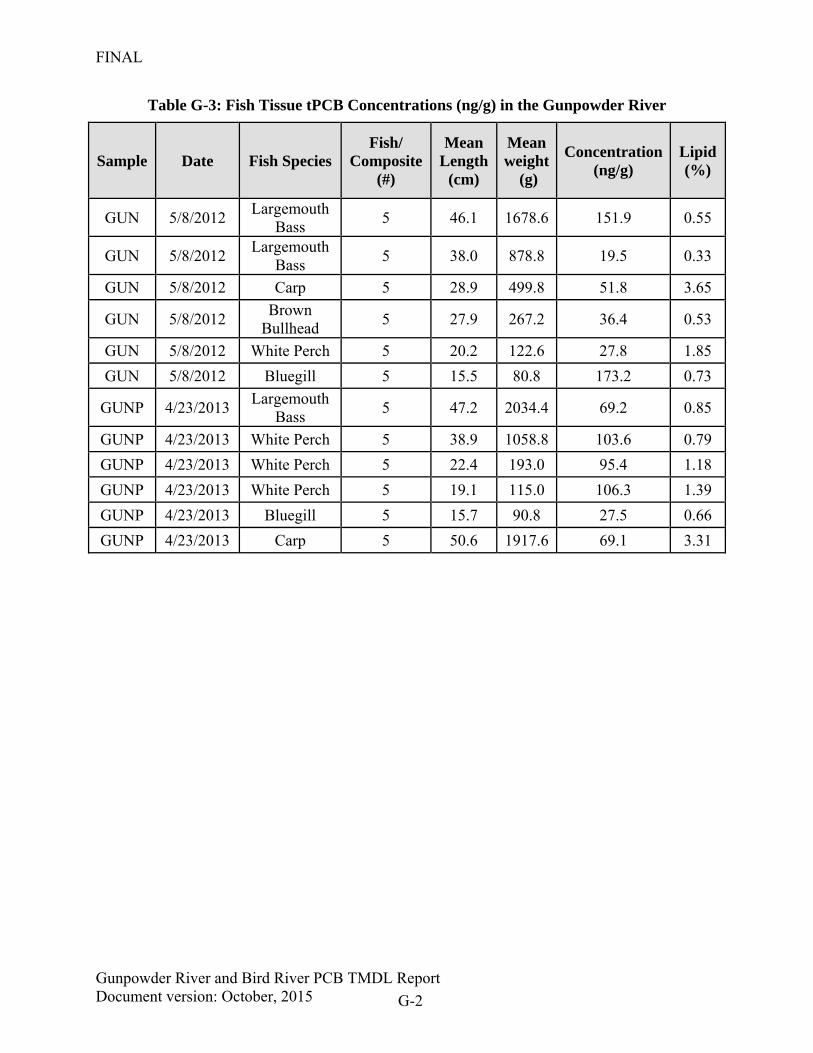
FINAL
Gunpowder River and Bird River PCB TMDL Report Document version: October, 2015 G-2
Table G-3: Fish Tissue tPCB Concentrations (ng/g) in the Gunpowder River
Sample Date Fish Species Fish/
Composite (#)
Mean Length
(cm)
Mean weight
(g)
Concentration (ng/g)
Lipid(%)
GUN 5/8/2012 Largemouth
Bass 5 46.1 1678.6 151.9 0.55
GUN 5/8/2012 Largemouth
Bass 5 38.0 878.8 19.5 0.33
GUN 5/8/2012 Carp 5 28.9 499.8 51.8 3.65
GUN 5/8/2012 Brown
Bullhead 5 27.9 267.2 36.4 0.53
GUN 5/8/2012 White Perch 5 20.2 122.6 27.8 1.85
GUN 5/8/2012 Bluegill 5 15.5 80.8 173.2 0.73
GUNP 4/23/2013 Largemouth
Bass 5 47.2 2034.4 69.2 0.85
GUNP 4/23/2013 White Perch 5 38.9 1058.8 103.6 0.79
GUNP 4/23/2013 White Perch 5 22.4 193.0 95.4 1.18
GUNP 4/23/2013 White Perch 5 19.1 115.0 106.3 1.39
GUNP 4/23/2013 Bluegill 5 15.7 90.8 27.5 0.66
GUNP 4/23/2013 Carp 5 50.6 1917.6 69.1 3.31
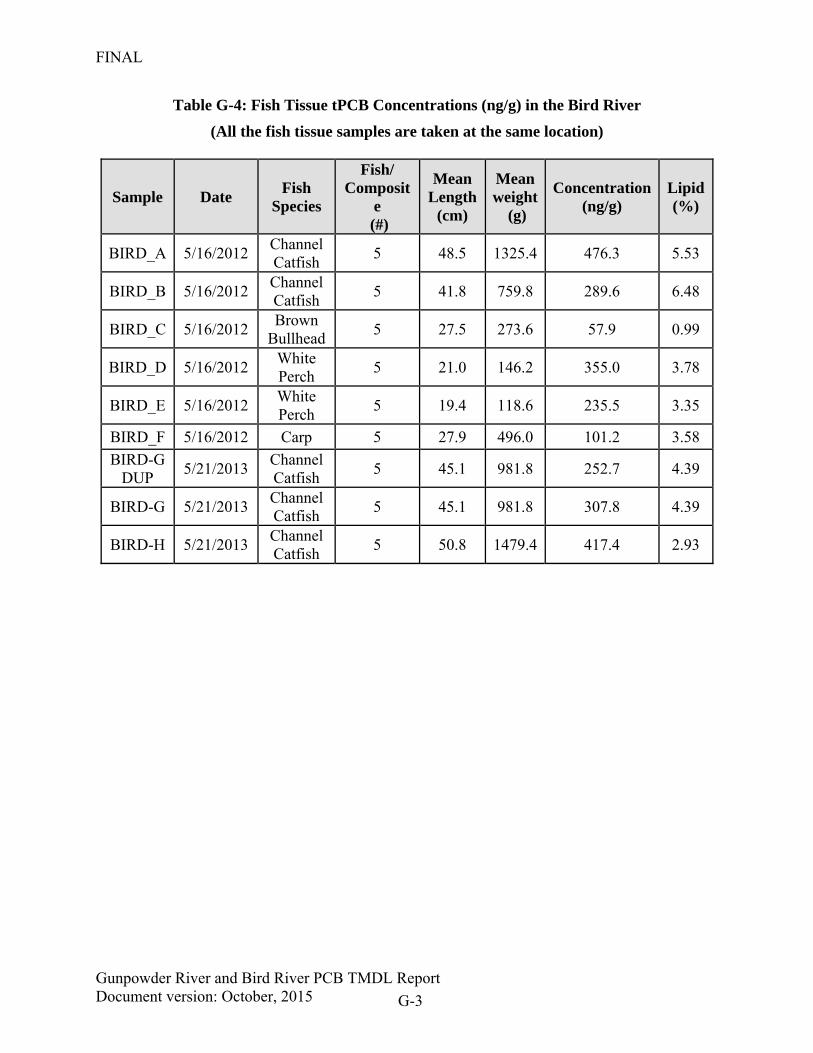
FINAL
Gunpowder River and Bird River PCB TMDL Report Document version: October, 2015 G-3
Table G-4: Fish Tissue tPCB Concentrations (ng/g) in the Bird River
(All the fish tissue samples are taken at the same location)
Sample Date Fish
Species
Fish/ Composit
e (#)
Mean Length
(cm)
Mean weight
(g)
Concentration (ng/g)
Lipid(%)
BIRD_A 5/16/2012 Channel Catfish
5 48.5 1325.4 476.3 5.53
BIRD_B 5/16/2012 Channel Catfish
5 41.8 759.8 289.6 6.48
BIRD_C 5/16/2012 Brown
Bullhead 5 27.5 273.6 57.9 0.99
BIRD_D 5/16/2012 White Perch
5 21.0 146.2 355.0 3.78
BIRD_E 5/16/2012 White Perch
5 19.4 118.6 235.5 3.35
BIRD_F 5/16/2012 Carp 5 27.9 496.0 101.2 3.58
BIRD-G DUP
5/21/2013 Channel Catfish
5 45.1 981.8 252.7 4.39
BIRD-G 5/21/2013 Channel Catfish
5 45.1 981.8 307.8 4.39
BIRD-H 5/21/2013 Channel Catfish
5 50.8 1479.4 417.4 2.93
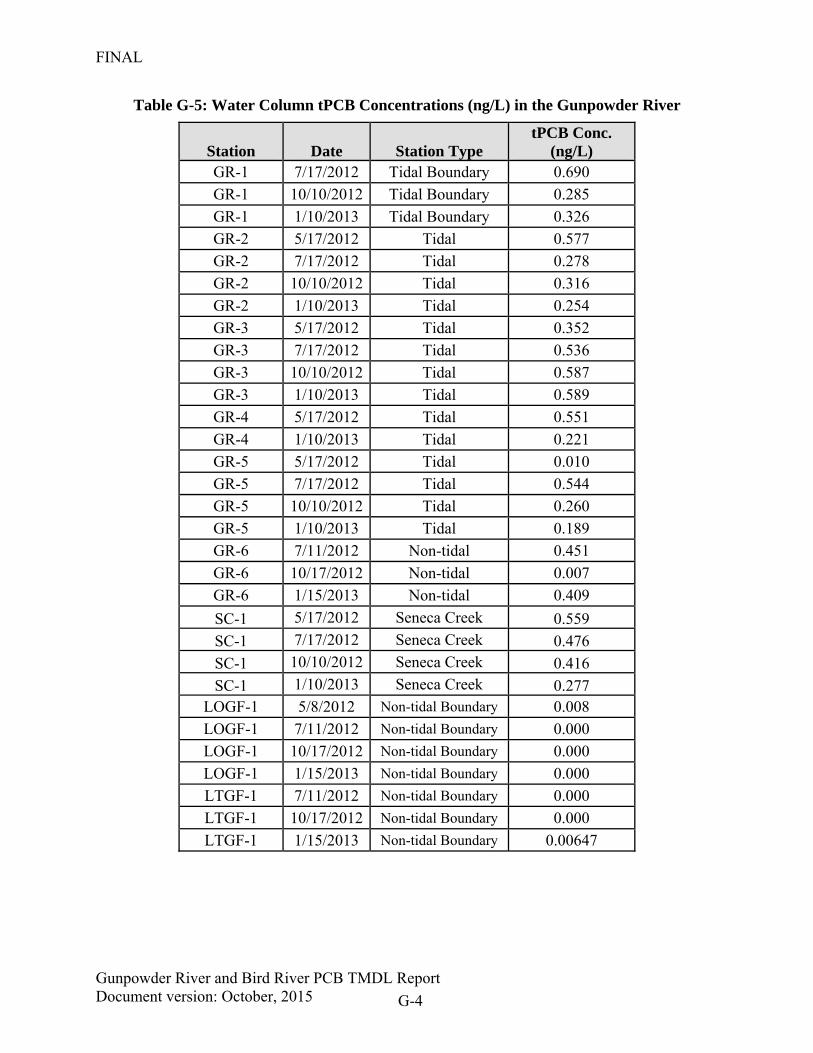
FINAL
Gunpowder River and Bird River PCB TMDL Report Document version: October, 2015 G-4
Table G-5: Water Column tPCB Concentrations (ng/L) in the Gunpowder River
Station Date Station Type tPCB Conc.
(ng/L) GR-1 7/17/2012 Tidal Boundary 0.690
GR-1 10/10/2012 Tidal Boundary 0.285
GR-1 1/10/2013 Tidal Boundary 0.326
GR-2 5/17/2012 Tidal 0.577
GR-2 7/17/2012 Tidal 0.278
GR-2 10/10/2012 Tidal 0.316
GR-2 1/10/2013 Tidal 0.254
GR-3 5/17/2012 Tidal 0.352
GR-3 7/17/2012 Tidal 0.536
GR-3 10/10/2012 Tidal 0.587
GR-3 1/10/2013 Tidal 0.589
GR-4 5/17/2012 Tidal 0.551
GR-4 1/10/2013 Tidal 0.221
GR-5 5/17/2012 Tidal 0.010
GR-5 7/17/2012 Tidal 0.544
GR-5 10/10/2012 Tidal 0.260
GR-5 1/10/2013 Tidal 0.189
GR-6 7/11/2012 Non-tidal 0.451
GR-6 10/17/2012 Non-tidal 0.007
GR-6 1/15/2013 Non-tidal 0.409
SC-1 5/17/2012 Seneca Creek 0.559
SC-1 7/17/2012 Seneca Creek 0.476
SC-1 10/10/2012 Seneca Creek 0.416
SC-1 1/10/2013 Seneca Creek 0.277 LOGF-1 5/8/2012 Non-tidal Boundary 0.008
LOGF-1 7/11/2012 Non-tidal Boundary 0.000
LOGF-1 10/17/2012 Non-tidal Boundary 0.000
LOGF-1 1/15/2013 Non-tidal Boundary 0.000
LTGF-1 7/11/2012 Non-tidal Boundary 0.000
LTGF-1 10/17/2012 Non-tidal Boundary 0.000
LTGF-1 1/15/2013 Non-tidal Boundary 0.00647
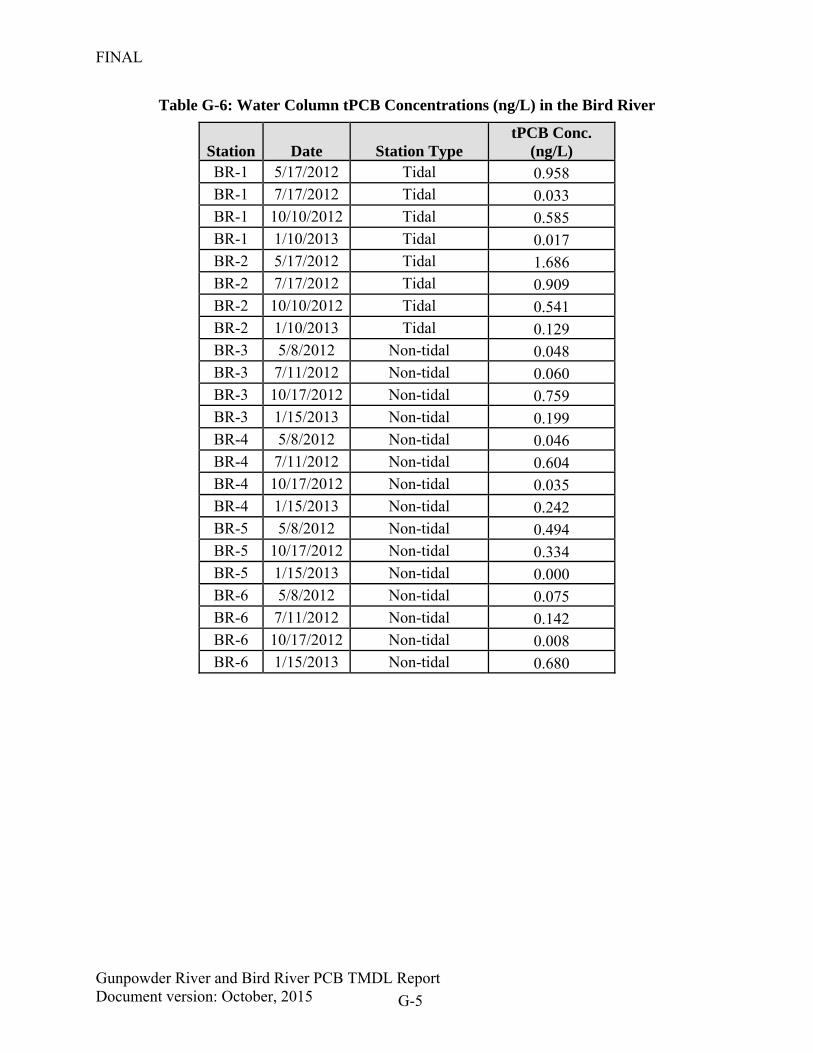
FINAL
Gunpowder River and Bird River PCB TMDL Report Document version: October, 2015 G-5
Table G-6: Water Column tPCB Concentrations (ng/L) in the Bird River
Station Date Station Type tPCB Conc.
(ng/L) BR-1 5/17/2012 Tidal 0.958 BR-1 7/17/2012 Tidal 0.033 BR-1 10/10/2012 Tidal 0.585 BR-1 1/10/2013 Tidal 0.017 BR-2 5/17/2012 Tidal 1.686 BR-2 7/17/2012 Tidal 0.909 BR-2 10/10/2012 Tidal 0.541 BR-2 1/10/2013 Tidal 0.129 BR-3 5/8/2012 Non-tidal 0.048 BR-3 7/11/2012 Non-tidal 0.060 BR-3 10/17/2012 Non-tidal 0.759 BR-3 1/15/2013 Non-tidal 0.199 BR-4 5/8/2012 Non-tidal 0.046 BR-4 7/11/2012 Non-tidal 0.604 BR-4 10/17/2012 Non-tidal 0.035 BR-4 1/15/2013 Non-tidal 0.242 BR-5 5/8/2012 Non-tidal 0.494 BR-5 10/17/2012 Non-tidal 0.334 BR-5 1/15/2013 Non-tidal 0.000 BR-6 5/8/2012 Non-tidal 0.075 BR-6 7/11/2012 Non-tidal 0.142 BR-6 10/17/2012 Non-tidal 0.008 BR-6 1/15/2013 Non-tidal 0.680