Embed Size (px)
Citation preview
Total financial statements Consolidated accounts in US Dollars, IFRS
2011, 2012 and 2013 annual and 2013 quarters
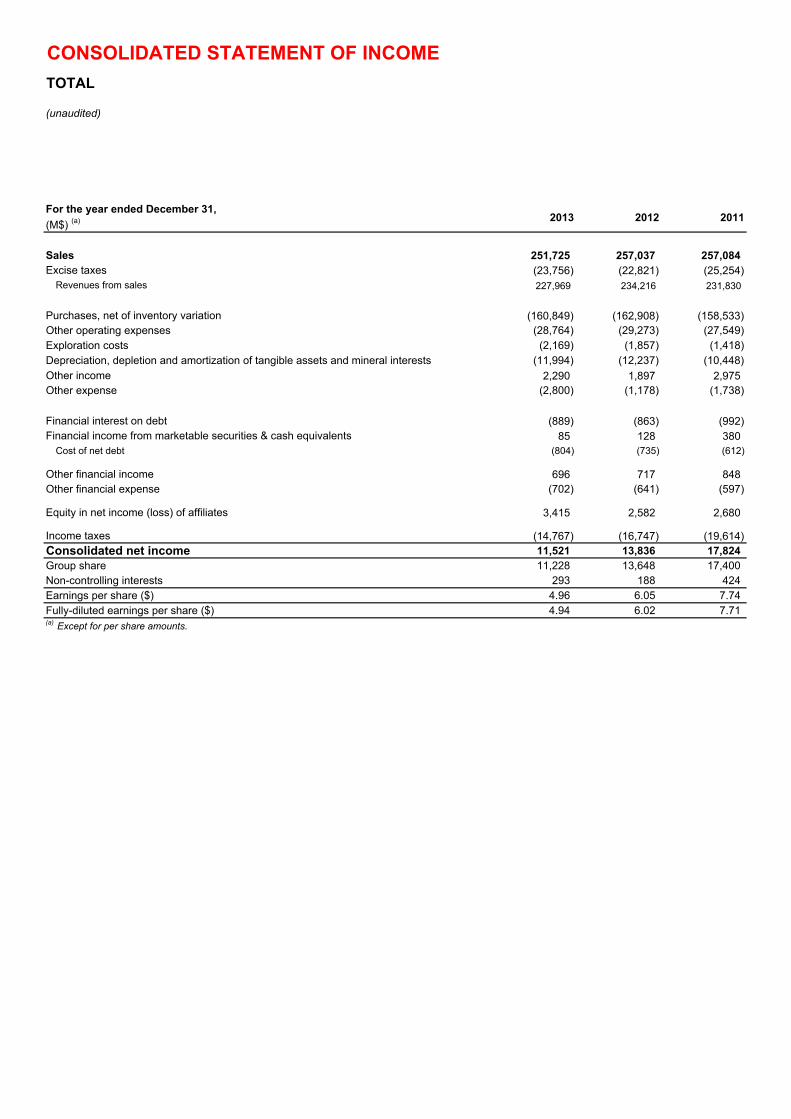
CONSOLIDATED STATEMENT OF INCOME
TOTAL
(unaudited)
For the year ended December 31,
(M$) (a) 2013 2012 2011
Sales 251,725 257,037 257,084Excise taxes (23,756) (22,821) (25,254)
Revenues from sales 227,969 234,216 231,830
Purchases, net of inventory variation (160,849) (162,908) (158,533)Other operating expenses (28,764) (29,273) (27,549)Exploration costs (2,169) (1,857) (1,418)Depreciation, depletion and amortization of tangible assets and mineral interests (11,994) (12,237) (10,448)
Other income 2,290 1,897 2,975Other expense (2,800) (1,178) (1,738)
Financial interest on debt (889) (863) (992)Financial income from marketable securities & cash equivalents 85 128 380
Cost of net debt (804) (735) (612)
Other financial income 696 717 848Other financial expense (702) (641) (597)
Equity in net income (loss) of affiliates 3,415 2,582 2,680
Income taxes (14,767) (16,747) (19,614)Consolidated net income 11,521 13,836 17,824Group share 11,228 13,648 17,400Non-controlling interests 293 188 424Earnings per share ($) 4.96 6.05 7.74 Fully-diluted earnings per share ($) 4.94 6.02 7.71 (a) Except for per share amounts.
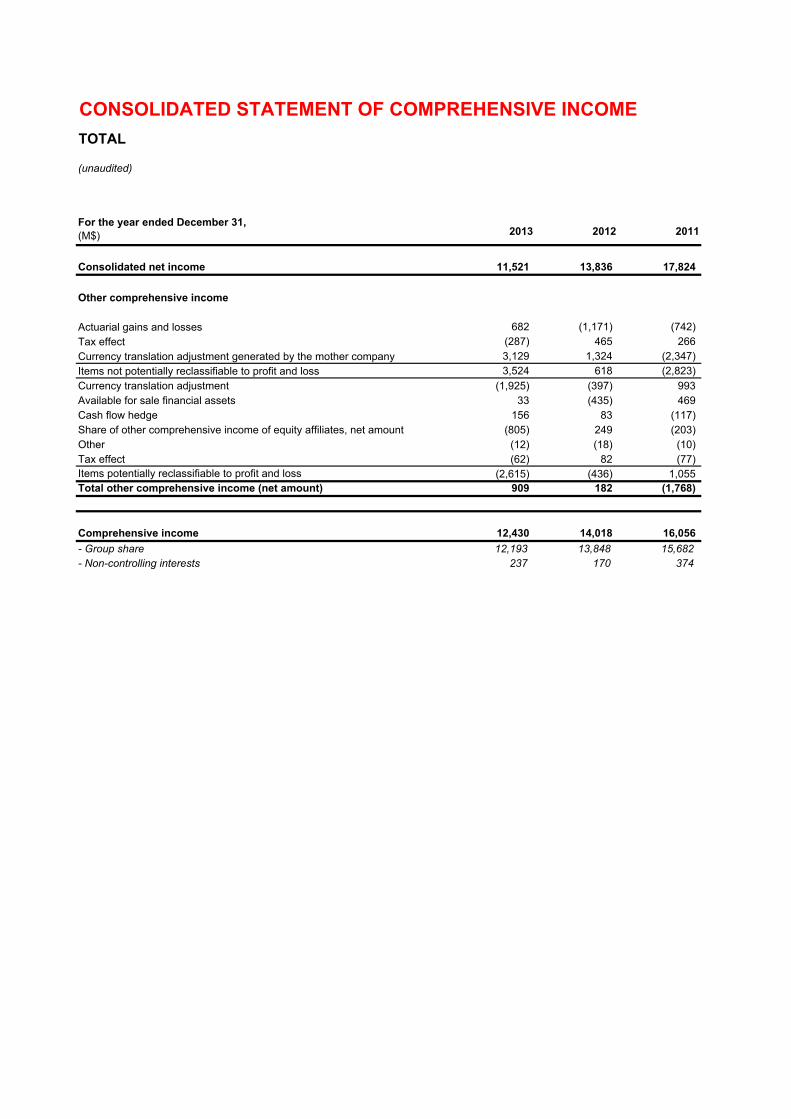
CONSOLIDATED STATEMENT OF COMPREHENSIVE INCOME
TOTAL
(unaudited)
For the year ended December 31,(M$) 2013 2012 2011
Consolidated net income 11,521 13,836 17,824
Other comprehensive income
Actuarial gains and losses 682 (1,171) (742)
Tax effect (287) 465 266
Currency translation adjustment generated by the mother company 3,129 1,324 (2,347)
Items not potentially reclassifiable to profit and loss 3,524 618 (2,823)
Currency translation adjustment (1,925) (397) 993Available for sale financial assets 33 (435) 469Cash flow hedge 156 83 (117)Share of other comprehensive income of equity affiliates, net amount (805) 249 (203)Other (12) (18) (10)Tax effect (62) 82 (77)Items potentially reclassifiable to profit and loss (2,615) (436) 1,055Total other comprehensive income (net amount) 909 182 (1,768)
Comprehensive income 12,430 14,018 16,056
- Group share 12,193 13,848 15,682- Non-controlling interests 237 170 374

CONSOLIDATED BALANCE SHEET
TOTAL
(unaudited)
As of December 31,(M$)
2013 2012 2011
ASSETS
Non-current assetsIntangible assets, net 18,395 16,965 16,062Property, plant and equipment, net 104,480 91,477 83,400Equity affiliates : investments and loans 20,417 18,153 16,814Other investments 1,666 1,571 4,755Hedging instruments of non-current financial debt 1,418 2,145 2,557Deferred income taxes 3,838 2,982 2,653Other non-current assets 4,406 3,513 3,179
Total non-current assets 154,620 136,806 129,420
Current assetsInventories, net 22,097 22,954 23,447Accounts receivable, net 23,422 25,339 25,941Other current assets 14,892 13,307 13,932Current financial assets 739 2,061 906Cash and cash equivalents 20,200 20,409 18,147Assets classified as held for sale 3,253 5,010 -
Total current assets 84,603 89,080 82,373
Total assets 239,223 225,886 211,793
LIABILITIES & SHAREHOLDERS' EQUITY
Shareholders' equityCommon shares 7,493 7,454 7,447Paid-in surplus and retained earnings 98,254 92,485 86,461Currency translation adjustment (1,203) (1,696) (2,884)Treasury shares (4,303) (4,274) (4,357)
Total shareholders' equity - Group Share 100,241 93,969 86,667
Non-controlling interests 3,138 1,689 1,749
Total shareholders' equity 103,379 95,658 88,416
Non-current liabilitiesDeferred income taxes 17,850 16,006 15,340Employee benefits 4,235 4,939 4,380Provisions and other non-current liabilities 17,517 15,285 14,114Non-current financial debt 34,574 29,392 29,186
Total non-current liabilities 74,176 65,622 63,020
Current liabilitiesAccounts payable 30,282 28,563 28,577Other creditors and accrued liabilities 18,948 19,316 19,045Current borrowings 11,193 14,535 12,519Other current financial liabilities 381 232 216Liabilities directly associated with the assets classified as held for sale 864 1,960 -
Total current liabilities 61,668 64,606 60,357
Total liabilities and shareholders' equity 239,223 225,886 211,793

CONSOLIDATED STATEMENT OF CASH FLOW
TOTAL
(unaudited)
For the year ended December 31,(M$)
2013 2012 2011
CASH FLOW FROM OPERATING ACTIVITIES
Consolidated net income 11,521 13,836 17,824Depreciation, depletion and amortization 13,358 13,466 12,010Non-current liabilities, valuation allowances and deferred taxes 1,567 1,889 2,272Impact of coverage of pension benefit plans - (465) -(Gains) losses on disposals of assets (80) (1,715) (2,479)Undistributed affiliates' equity earnings (775) 272 (149)(Increase) decrease in working capital 2,525 1,392 (2,421)Other changes, net 397 183 136Cash flow from operating activities 28,513 28,858 27,193
CASH FLOW USED IN INVESTING ACTIVITIES
Intangible assets and property, plant and equipment additions (29,748) (25,574) (24,986)Acquisitions of subsidiaries, net of cash acquired (21) (245) (1,189)Investments in equity affiliates and other securities (1,756) (1,152) (6,299)Increase in non-current loans (2,906) (2,504) (1,687)Total expenditures (34,431) (29,475) (34,161)Proceeds from disposals of intangible assets and property, plant and equipment 1,766 1,822 2,003Proceeds from disposals of subsidiaries, net of cash sold 2,654 452 800Proceeds from disposals of non-current investments 330 3,618 7,922Repayment of non-current loans 1,649 1,651 1,215Total divestments 6,399 7,543 11,940Cash flow used in investing activities (28,032) (21,932) (22,221)
CASH FLOW USED IN FINANCING ACTIVITIES
Issuance (repayment) of shares: - Parent company shareholders 485 41 670 - Treasury shares (238) (88) -Dividends paid: - Parent company shareholders (7,128) (6,660) (7,155) - Non-controlling interests (156) (133) (239)Other transactions with non-controlling interests 2,153 - (798)Net issuance (repayment) of non-current debt 11,102 6,780 5,664Increase (decrease) in current borrowings (9,037) (3,540) (5,387)Increase (decrease) in current financial assets and liabilities 1,298 (1,217) 1,247Cash flow used in financing activities (1,521) (4,817) (5,998)Net increase (decrease) in cash and cash equivalents (1,040) 2,109 (1,026)Effect of exchange rates 831 153 (187)Cash and cash equivalents at the beginning of the period 20,409 18,147 19,360Cash and cash equivalents at the end of the period 20,200 20,409 18,147
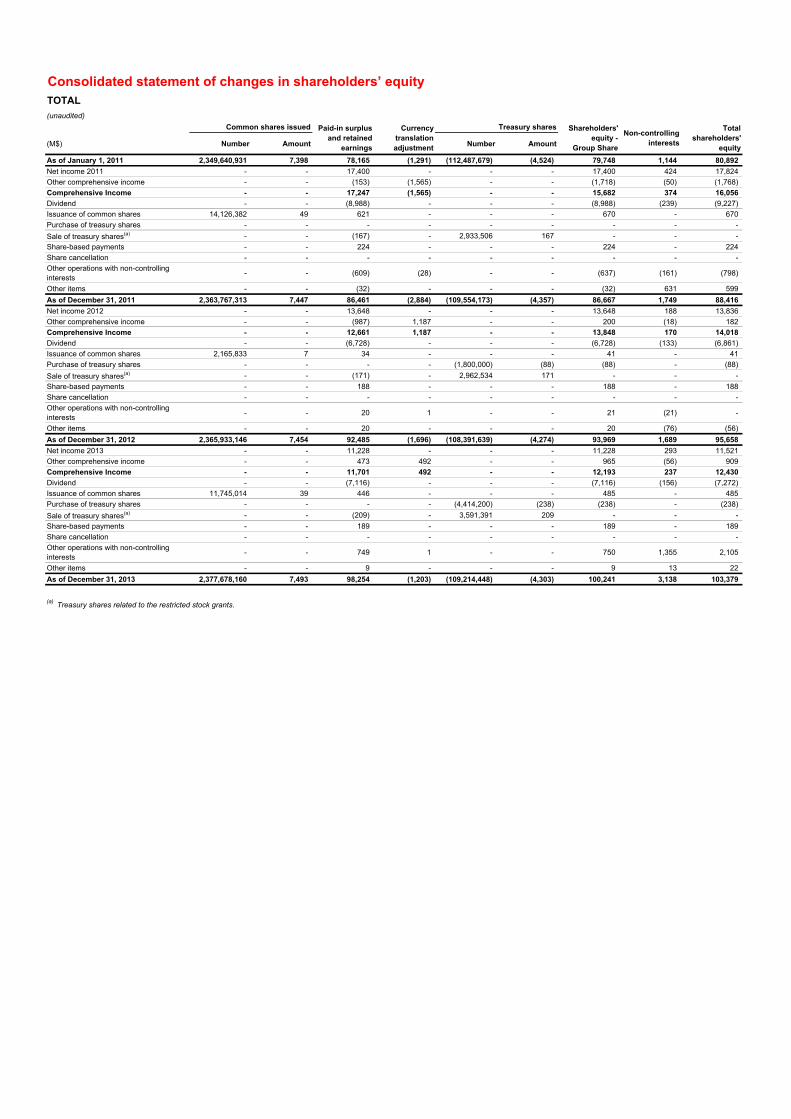
Consolidated statement of changes in shareholders’ equityTOTAL
(unaudited)
(M$) Number Amount Number Amount
As of January 1, 2011 2,349,640,931 7,398 78,165 (1,291) (112,487,679) (4,524) 79,748 1,144 80,892
Net income 2011 - - 17,400 - - - 17,400 424 17,824
Other comprehensive income - - (153) (1,565) - - (1,718) (50) (1,768)
Comprehensive Income - - 17,247 (1,565) - - 15,682 374 16,056
Dividend - - (8,988) - - - (8,988) (239) (9,227)
Issuance of common shares 14,126,382 49 621 - - - 670 - 670
Purchase of treasury shares - - - - - - - - -
Sale of treasury shares(a) - - (167) - 2,933,506 167 - - -
Share-based payments - - 224 - - - 224 - 224
Share cancellation - - - - - - - - -
Other operations with non-controlling interests
- - (609) (28) - - (637) (161) (798)
Other items - - (32) - - - (32) 631 599
As of December 31, 2011 2,363,767,313 7,447 86,461 (2,884) (109,554,173) (4,357) 86,667 1,749 88,416
Net income 2012 - - 13,648 - - - 13,648 188 13,836
Other comprehensive income - - (987) 1,187 - - 200 (18) 182
Comprehensive Income - - 12,661 1,187 - - 13,848 170 14,018
Dividend - - (6,728) - - - (6,728) (133) (6,861)
Issuance of common shares 2,165,833 7 34 - - - 41 - 41
Purchase of treasury shares - - - - (1,800,000) (88) (88) - (88)
Sale of treasury shares(a) - - (171) - 2,962,534 171 - - -
Share-based payments - - 188 - - - 188 - 188
Share cancellation - - - - - - - - -
Other operations with non-controlling interests
- - 20 1 - - 21 (21) -
Other items - - 20 - - - 20 (76) (56)
As of December 31, 2012 2,365,933,146 7,454 92,485 (1,696) (108,391,639) (4,274) 93,969 1,689 95,658
Net income 2013 - - 11,228 - - - 11,228 293 11,521
Other comprehensive income - - 473 492 - - 965 (56) 909
Comprehensive Income - - 11,701 492 - - 12,193 237 12,430
Dividend - - (7,116) - - - (7,116) (156) (7,272)
Issuance of common shares 11,745,014 39 446 - - - 485 - 485
Purchase of treasury shares - - - - (4,414,200) (238) (238) - (238)
Sale of treasury shares(a) - - (209) - 3,591,391 209 - - -
Share-based payments - - 189 - - - 189 - 189
Share cancellation - - - - - - - - -
Other operations with non-controlling interests
- - 749 1 - - 750 1,355 2,105
Other items - - 9 - - - 9 13 22
As of December 31, 2013 2,377,678,160 7,493 98,254 (1,203) (109,214,448) (4,303) 100,241 3,138 103,379
(a) Treasury shares related to the restricted stock grants.
Total shareholders'
equity
Common shares issued Paid-in surplus and retained
earnings
Currency translation adjustment
Treasury shares Shareholders' equity -
Group Share
Non-controlling interests
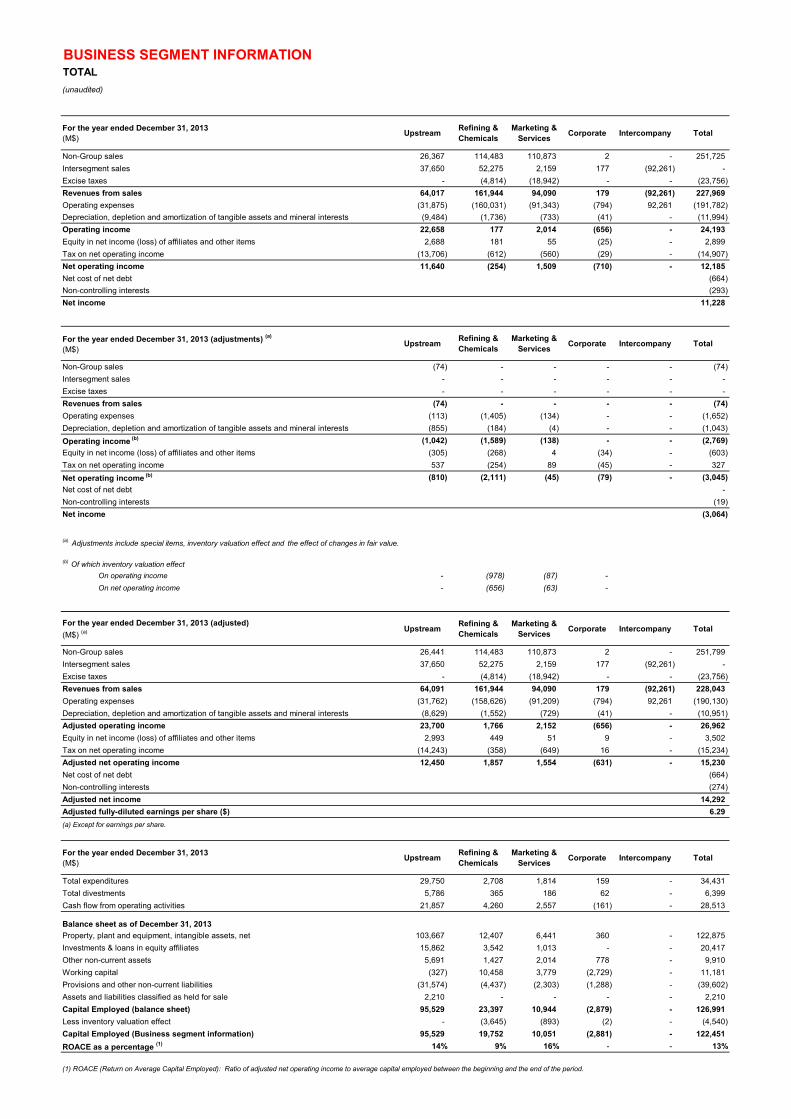
BUSINESS SEGMENT INFORMATIONTOTAL
(unaudited)
For the year ended December 31, 2013(M$)
UpstreamRefining & Chemicals
Marketing & Services
Corporate Intercompany Total
Non-Group sales 26,367 114,483 110,873 2 - 251,725
Intersegment sales 37,650 52,275 2,159 177 (92,261) -
Excise taxes - (4,814) (18,942) - - (23,756)
Revenues from sales 64,017 161,944 94,090 179 (92,261) 227,969
Operating expenses (31,875) (160,031) (91,343) (794) 92,261 (191,782)
Depreciation, depletion and amortization of tangible assets and mineral interests (9,484) (1,736) (733) (41) - (11,994)
Operating income 22,658 177 2,014 (656) - 24,193
Equity in net income (loss) of affiliates and other items 2,688 181 55 (25) - 2,899
Tax on net operating income (13,706) (612) (560) (29) - (14,907)
Net operating income 11,640 (254) 1,509 (710) - 12,185
Net cost of net debt (664)
Non-controlling interests (293)
Net income 11,228
For the year ended December 31, 2013 (adjustments) (a)
(M$)Upstream
Refining & Chemicals
Marketing & Services
Corporate Intercompany Total
Non-Group sales (74) - - - - (74)
Intersegment sales - - - - - -
Excise taxes - - - - - -
Revenues from sales (74) - - - - (74)
Operating expenses (113) (1,405) (134) - - (1,652)
Depreciation, depletion and amortization of tangible assets and mineral interests (855) (184) (4) - - (1,043)
Operating income (b) (1,042) (1,589) (138) - - (2,769)
Equity in net income (loss) of affiliates and other items (305) (268) 4 (34) - (603)
Tax on net operating income 537 (254) 89 (45) - 327
Net operating income (b) (810) (2,111) (45) (79) - (3,045)
Net cost of net debt -
Non-controlling interests (19)
Net income (3,064)
(a) Adjustments include special items, inventory valuation effect and the effect of changes in fair value.
On operating income - (978) (87) -
On net operating income - (656) (63) -
- - - -
For the year ended December 31, 2013 (adjusted)
(M$) (a) UpstreamRefining & Chemicals
Marketing & Services
Corporate Intercompany Total
Non-Group sales 26,441 114,483 110,873 2 - 251,799
Intersegment sales 37,650 52,275 2,159 177 (92,261) -
Excise taxes - (4,814) (18,942) - - (23,756)
Revenues from sales 64,091 161,944 94,090 179 (92,261) 228,043
Operating expenses (31,762) (158,626) (91,209) (794) 92,261 (190,130)
Depreciation, depletion and amortization of tangible assets and mineral interests (8,629) (1,552) (729) (41) - (10,951)
Adjusted operating income 23,700 1,766 2,152 (656) - 26,962
Equity in net income (loss) of affiliates and other items 2,993 449 51 9 - 3,502
Tax on net operating income (14,243) (358) (649) 16 - (15,234)
Adjusted net operating income 12,450 1,857 1,554 (631) - 15,230
Net cost of net debt (664)
Non-controlling interests (274)
Adjusted net income 14,292
Adjusted fully-diluted earnings per share ($) 6.29
(a) Except for earnings per share.
For the year ended December 31, 2013(M$)
UpstreamRefining & Chemicals
Marketing & Services
Corporate Intercompany Total
Total expenditures 29,750 2,708 1,814 159 - 34,431
Total divestments 5,786 365 186 62 - 6,399
Cash flow from operating activities 21,857 4,260 2,557 (161) - 28,513
Balance sheet as of December 31, 2013
Property, plant and equipment, intangible assets, net 103,667 12,407 6,441 360 - 122,875
Investments & loans in equity affiliates 15,862 3,542 1,013 - - 20,417
Other non-current assets 5,691 1,427 2,014 778 - 9,910
Working capital (327) 10,458 3,779 (2,729) - 11,181
Provisions and other non-current liabilities (31,574) (4,437) (2,303) (1,288) - (39,602)
Assets and liabilities classified as held for sale 2,210 - - - - 2,210
Capital Employed (balance sheet) 95,529 23,397 10,944 (2,879) - 126,991
Less inventory valuation effect - (3,645) (893) (2) - (4,540)
Capital Employed (Business segment information) 95,529 19,752 10,051 (2,881) - 122,451
ROACE as a percentage (1) 14% 9% 16% - - 13%
(b) Of which inventory valuation effect
(1) ROACE (Return on Average Capital Employed): Ratio of adjusted net operating income to average capital employed between the beginning and the end of the period.
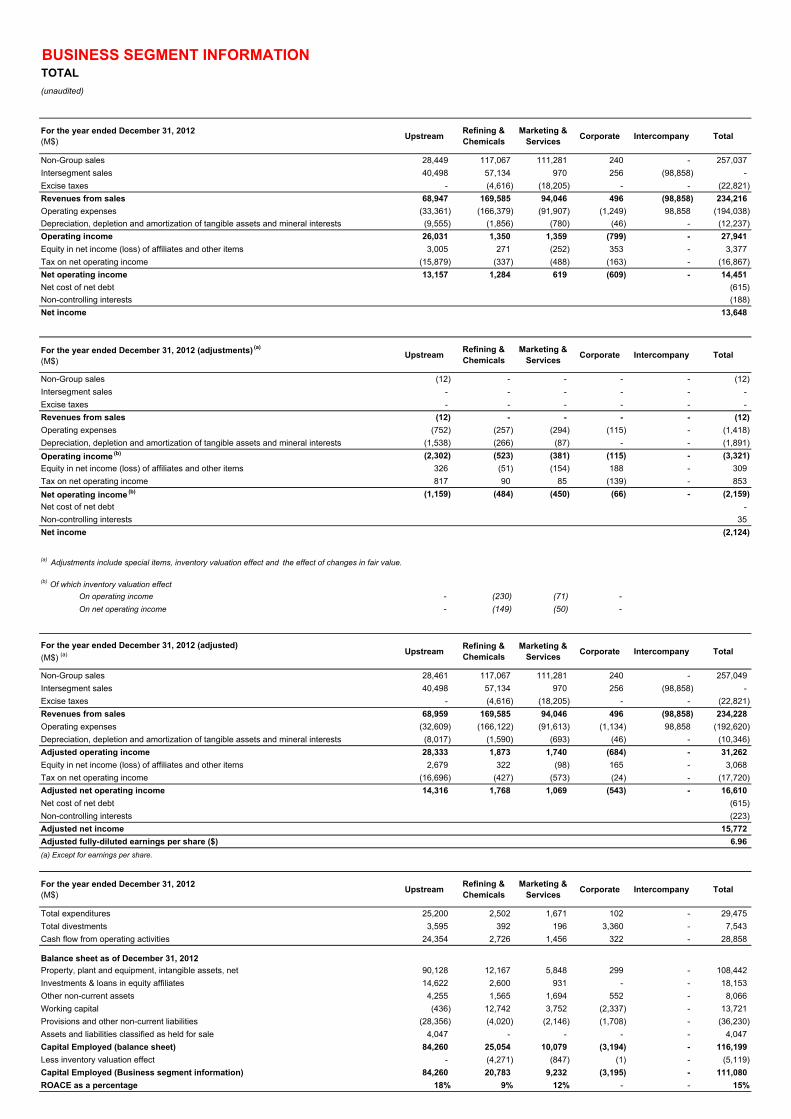
BUSINESS SEGMENT INFORMATIONTOTAL
(unaudited)
For the year ended December 31, 2012(M$)
UpstreamRefining & Chemicals
Marketing & Services
Corporate Intercompany Total
Non-Group sales 28,449 117,067 111,281 240 - 257,037
Intersegment sales 40,498 57,134 970 256 (98,858) -
Excise taxes - (4,616) (18,205) - - (22,821)
Revenues from sales 68,947 169,585 94,046 496 (98,858) 234,216
Operating expenses (33,361) (166,379) (91,907) (1,249) 98,858 (194,038)
Depreciation, depletion and amortization of tangible assets and mineral interests (9,555) (1,856) (780) (46) - (12,237)
Operating income 26,031 1,350 1,359 (799) - 27,941
Equity in net income (loss) of affiliates and other items 3,005 271 (252) 353 - 3,377
Tax on net operating income (15,879) (337) (488) (163) - (16,867)
Net operating income 13,157 1,284 619 (609) - 14,451
Net cost of net debt (615)
Non-controlling interests (188)
Net income 13,648
For the year ended December 31, 2012 (adjustments) (a)
(M$)Upstream
Refining & Chemicals
Marketing & Services
Corporate Intercompany Total
Non-Group sales (12) - - - - (12)
Intersegment sales - - - - - -
Excise taxes - - - - - -
Revenues from sales (12) - - - - (12)
Operating expenses (752) (257) (294) (115) - (1,418)
Depreciation, depletion and amortization of tangible assets and mineral interests (1,538) (266) (87) - - (1,891)
Operating income (b) (2,302) (523) (381) (115) - (3,321)
Equity in net income (loss) of affiliates and other items 326 (51) (154) 188 - 309
Tax on net operating income 817 90 85 (139) - 853
Net operating income (b) (1,159) (484) (450) (66) - (2,159)
Net cost of net debt -
Non-controlling interests 35
Net income (2,124)
On operating income - (230) (71) -
On net operating income - (149) (50) -
- - - -
For the year ended December 31, 2012 (adjusted)
(M$) (a) UpstreamRefining & Chemicals
Marketing & Services
Corporate Intercompany Total
Non-Group sales 28,461 117,067 111,281 240 - 257,049
Intersegment sales 40,498 57,134 970 256 (98,858) -
Excise taxes - (4,616) (18,205) - - (22,821)
Revenues from sales 68,959 169,585 94,046 496 (98,858) 234,228
Operating expenses (32,609) (166,122) (91,613) (1,134) 98,858 (192,620)
Depreciation, depletion and amortization of tangible assets and mineral interests (8,017) (1,590) (693) (46) - (10,346)
Adjusted operating income 28,333 1,873 1,740 (684) - 31,262
Equity in net income (loss) of affiliates and other items 2,679 322 (98) 165 - 3,068
Tax on net operating income (16,696) (427) (573) (24) - (17,720)
Adjusted net operating income 14,316 1,768 1,069 (543) - 16,610
Net cost of net debt (615)
Non-controlling interests (223)
Adjusted net income 15,772
Adjusted fully-diluted earnings per share ($) 6.96
(a) Except for earnings per share.
For the year ended December 31, 2012(M$)
UpstreamRefining & Chemicals
Marketing & Services
Corporate Intercompany Total
Total expenditures 25,200 2,502 1,671 102 - 29,475
Total divestments 3,595 392 196 3,360 - 7,543
Cash flow from operating activities 24,354 2,726 1,456 322 - 28,858
Balance sheet as of December 31, 2012
Property, plant and equipment, intangible assets, net 90,128 12,167 5,848 299 - 108,442
Investments & loans in equity affiliates 14,622 2,600 931 - - 18,153
Other non-current assets 4,255 1,565 1,694 552 - 8,066
Working capital (436) 12,742 3,752 (2,337) - 13,721
Provisions and other non-current liabilities (28,356) (4,020) (2,146) (1,708) - (36,230)
Assets and liabilities classified as held for sale 4,047 - - - - 4,047
Capital Employed (balance sheet) 84,260 25,054 10,079 (3,194) - 116,199
Less inventory valuation effect - (4,271) (847) (1) - (5,119)
Capital Employed (Business segment information) 84,260 20,783 9,232 (3,195) - 111,080
ROACE as a percentage 18% 9% 12% - - 15%
(a) Adjustments include special items, inventory valuation effect and the effect of changes in fair value.
(b) Of which inventory valuation effect
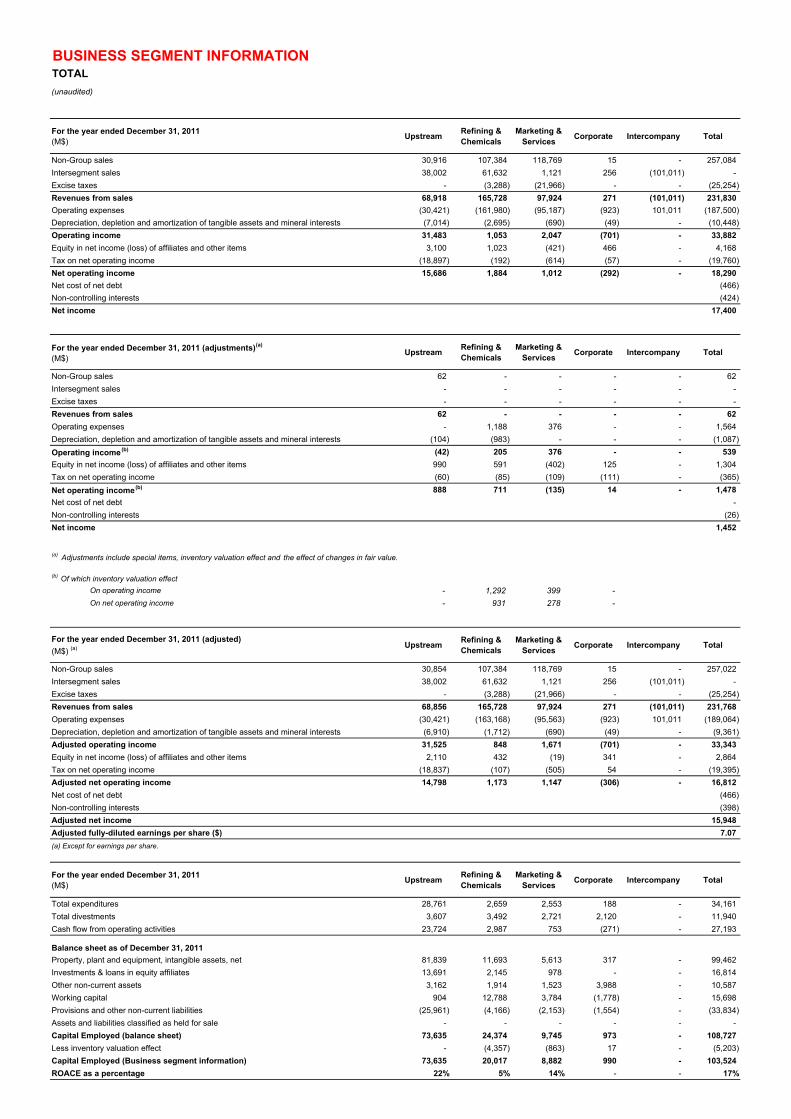
BUSINESS SEGMENT INFORMATIONTOTAL
(unaudited)
For the year ended December 31, 2011(M$)
UpstreamRefining & Chemicals
Marketing & Services
Corporate Intercompany Total
Non-Group sales 30,916 107,384 118,769 15 - 257,084
Intersegment sales 38,002 61,632 1,121 256 (101,011) -
Excise taxes - (3,288) (21,966) - - (25,254)
Revenues from sales 68,918 165,728 97,924 271 (101,011) 231,830
Operating expenses (30,421) (161,980) (95,187) (923) 101,011 (187,500)
Depreciation, depletion and amortization of tangible assets and mineral interests (7,014) (2,695) (690) (49) - (10,448)
Operating income 31,483 1,053 2,047 (701) - 33,882
Equity in net income (loss) of affiliates and other items 3,100 1,023 (421) 466 - 4,168
Tax on net operating income (18,897) (192) (614) (57) - (19,760)
Net operating income 15,686 1,884 1,012 (292) - 18,290
Net cost of net debt (466)
Non-controlling interests (424)
Net income 17,400
For the year ended December 31, 2011 (adjustments) (a)
(M$)Upstream
Refining & Chemicals
Marketing & Services
Corporate Intercompany Total
Non-Group sales 62 - - - - 62
Intersegment sales - - - - - -
Excise taxes - - - - - -
Revenues from sales 62 - - - - 62
Operating expenses - 1,188 376 - - 1,564
Depreciation, depletion and amortization of tangible assets and mineral interests (104) (983) - - - (1,087)
Operating income (b) (42) 205 376 - - 539
Equity in net income (loss) of affiliates and other items 990 591 (402) 125 - 1,304
Tax on net operating income (60) (85) (109) (111) - (365)
Net operating income (b) 888 711 (135) 14 - 1,478
Net cost of net debt -
Non-controlling interests (26)
Net income 1,452
On operating income - 1,292 399 -
On net operating income - 931 278 -
- - - -
For the year ended December 31, 2011 (adjusted)
(M$) (a) UpstreamRefining & Chemicals
Marketing & Services
Corporate Intercompany Total
Non-Group sales 30,854 107,384 118,769 15 - 257,022
Intersegment sales 38,002 61,632 1,121 256 (101,011) -
Excise taxes - (3,288) (21,966) - - (25,254)
Revenues from sales 68,856 165,728 97,924 271 (101,011) 231,768
Operating expenses (30,421) (163,168) (95,563) (923) 101,011 (189,064)
Depreciation, depletion and amortization of tangible assets and mineral interests (6,910) (1,712) (690) (49) - (9,361)
Adjusted operating income 31,525 848 1,671 (701) - 33,343
Equity in net income (loss) of affiliates and other items 2,110 432 (19) 341 - 2,864
Tax on net operating income (18,837) (107) (505) 54 - (19,395)
Adjusted net operating income 14,798 1,173 1,147 (306) - 16,812
Net cost of net debt (466)
Non-controlling interests (398)
Adjusted net income 15,948
Adjusted fully-diluted earnings per share ($) 7.07
(a) Except for earnings per share.
For the year ended December 31, 2011(M$)
UpstreamRefining & Chemicals
Marketing & Services
Corporate Intercompany Total
Total expenditures 28,761 2,659 2,553 188 - 34,161
Total divestments 3,607 3,492 2,721 2,120 - 11,940
Cash flow from operating activities 23,724 2,987 753 (271) - 27,193
Balance sheet as of December 31, 2011
Property, plant and equipment, intangible assets, net 81,839 11,693 5,613 317 - 99,462
Investments & loans in equity affiliates 13,691 2,145 978 - - 16,814
Other non-current assets 3,162 1,914 1,523 3,988 - 10,587
Working capital 904 12,788 3,784 (1,778) - 15,698
Provisions and other non-current liabilities (25,961) (4,166) (2,153) (1,554) - (33,834)
Assets and liabilities classified as held for sale - - - - - -
Capital Employed (balance sheet) 73,635 24,374 9,745 973 - 108,727
Less inventory valuation effect - (4,357) (863) 17 - (5,203)
Capital Employed (Business segment information) 73,635 20,017 8,882 990 - 103,524
ROACE as a percentage 22% 5% 14% - - 17%
(a) Adjustments include special items, inventory valuation effect and the effect of changes in fair value.
(b) Of which inventory valuation effect
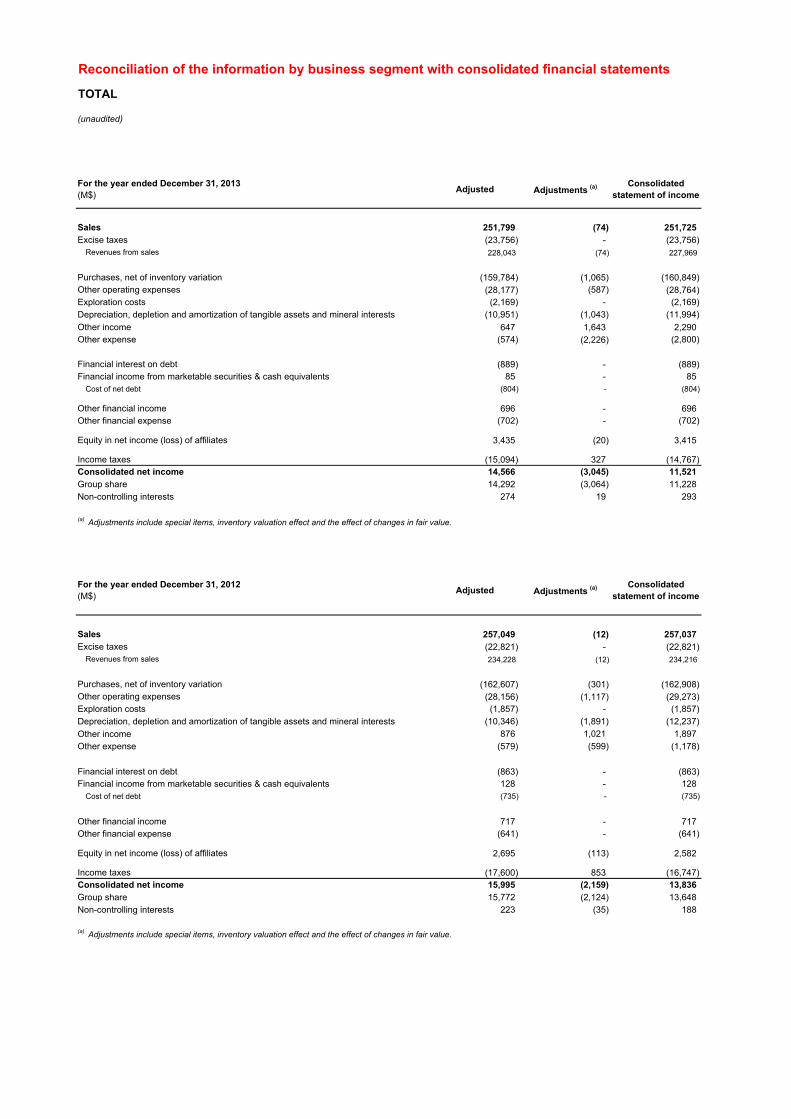
Reconciliation of the information by business segment with consolidated financial statements
TOTAL
(unaudited)
For the year ended December 31, 2013(M$)
Adjusted Adjustments (a) Consolidated statement of income
Sales 251,799 (74) 251,725Excise taxes (23,756) - (23,756)
Revenues from sales 228,043 (74) 227,969
Purchases, net of inventory variation (159,784) (1,065) (160,849)Other operating expenses (28,177) (587) (28,764)Exploration costs (2,169) - (2,169)Depreciation, depletion and amortization of tangible assets and mineral interests (10,951) (1,043) (11,994)
Other income 647 1,643 2,290Other expense (574) (2,226) (2,800)
Financial interest on debt (889) - (889)Financial income from marketable securities & cash equivalents 85 - 85
Cost of net debt (804) - (804)
Other financial income 696 - 696Other financial expense (702) - (702)
Equity in net income (loss) of affiliates 3,435 (20) 3,415
Income taxes (15,094) 327 (14,767)Consolidated net income 14,566 (3,045) 11,521Group share 14,292 (3,064) 11,228Non-controlling interests 274 19 293
(a) Adjustments include special items, inventory valuation effect and the effect of changes in fair value.
For the year ended December 31, 2012(M$)
Adjusted Adjustments (a) Consolidated statement of income
Sales 257,049 (12) 257,037Excise taxes (22,821) - (22,821)
Revenues from sales 234,228 (12) 234,216
Purchases, net of inventory variation (162,607) (301) (162,908)Other operating expenses (28,156) (1,117) (29,273)Exploration costs (1,857) - (1,857)Depreciation, depletion and amortization of tangible assets and mineral interests (10,346) (1,891) (12,237)
Other income 876 1,021 1,897Other expense (579) (599) (1,178)
Financial interest on debt (863) - (863)Financial income from marketable securities & cash equivalents 128 - 128
Cost of net debt (735) - (735)
Other financial income 717 - 717Other financial expense (641) - (641)
Equity in net income (loss) of affiliates 2,695 (113) 2,582
Income taxes (17,600) 853 (16,747)Consolidated net income 15,995 (2,159) 13,836Group share 15,772 (2,124) 13,648Non-controlling interests 223 (35) 188
(a) Adjustments include special items, inventory valuation effect and the effect of changes in fair value.
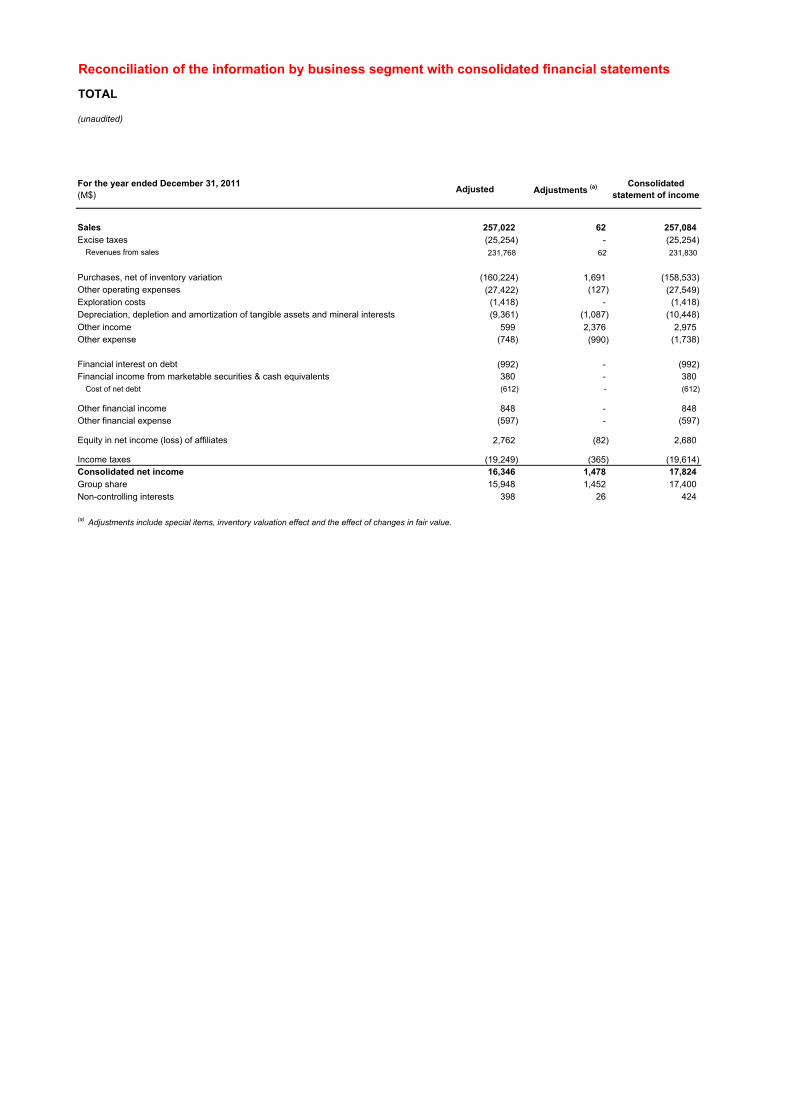
Reconciliation of the information by business segment with consolidated financial statements
TOTAL
(unaudited)
For the year ended December 31, 2011(M$)
Adjusted Adjustments (a) Consolidated statement of income
Sales 257,022 62 257,084Excise taxes (25,254) - (25,254)
Revenues from sales 231,768 62 231,830
Purchases, net of inventory variation (160,224) 1,691 (158,533)Other operating expenses (27,422) (127) (27,549)Exploration costs (1,418) - (1,418)Depreciation, depletion and amortization of tangible assets and mineral interests (9,361) (1,087) (10,448)
Other income 599 2,376 2,975Other expense (748) (990) (1,738)
Financial interest on debt (992) - (992)Financial income from marketable securities & cash equivalents 380 - 380
Cost of net debt (612) - (612)
Other financial income 848 - 848Other financial expense (597) - (597)
Equity in net income (loss) of affiliates 2,762 (82) 2,680
Income taxes (19,249) (365) (19,614)Consolidated net income 16,346 1,478 17,824Group share 15,948 1,452 17,400Non-controlling interests 398 26 424
(a) Adjustments include special items, inventory valuation effect and the effect of changes in fair value.

Return on EquityTOTAL(unaudited)
For the year ended December 31,(M$)
2013 2012 2011
Adjusted net income - Group share 14,292 15,772 15,948Adjusted non-controlling interests 274 223 398Adjusted consolidated net income 14,566 15,995 16,346
Shareholders' equity - Group share 100,241 93,969 86,667Distribution of the income based on existing shares at the closing date (1,908) (1,757) (1,668)Non-controlling interests 3,138 1,689 1,749
Adjusted shareholders' equity(a) 101,471 93,901 86,748
ROE 15% 18% 20%
(a) Adjusted shareholders' equity as of December 31, 2010 amounted to $ 77,492 million.
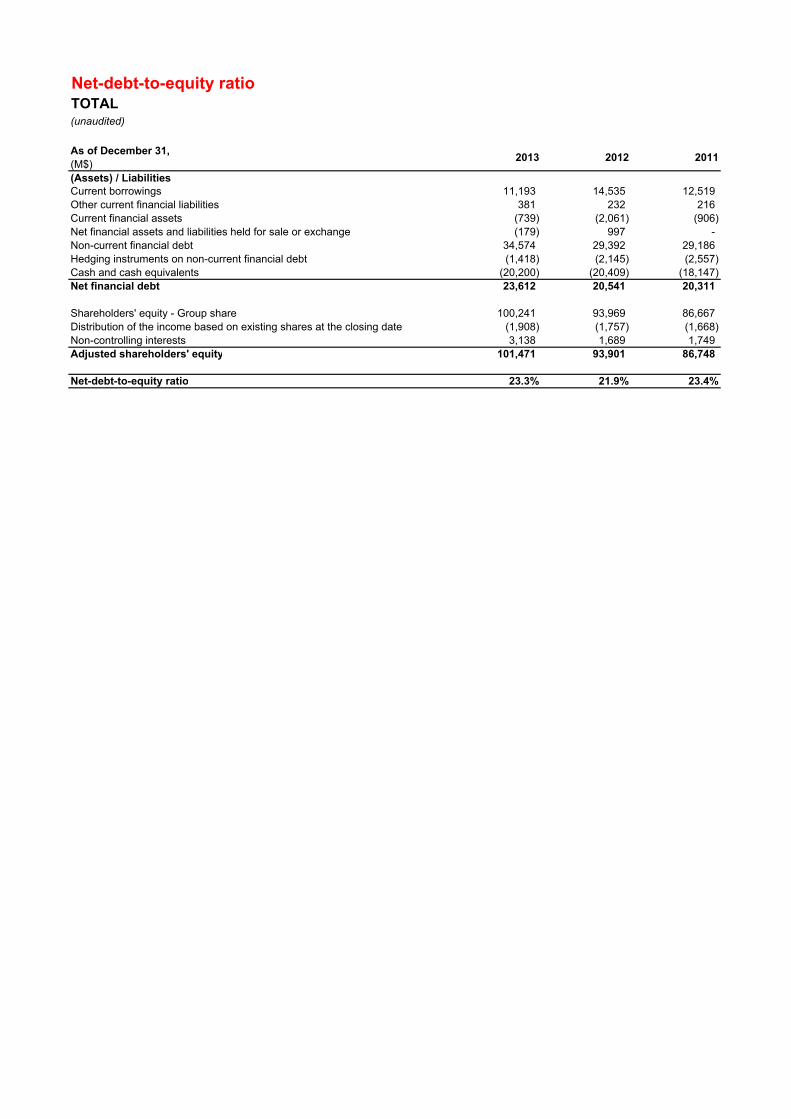
Net-debt-to-equity ratioTOTAL(unaudited)
As of December 31, (M$)
2013 2012 2011
(Assets) / LiabilitiesCurrent borrowings 11,193 14,535 12,519Other current financial liabilities 381 232 216Current financial assets (739) (2,061) (906)Net financial assets and liabilities held for sale or exchange (179) 997 -Non-current financial debt 34,574 29,392 29,186Hedging instruments on non-current financial debt (1,418) (2,145) (2,557)Cash and cash equivalents (20,200) (20,409) (18,147)Net financial debt 23,612 20,541 20,311
Shareholders' equity - Group share 100,241 93,969 86,667Distribution of the income based on existing shares at the closing date (1,908) (1,757) (1,668)Non-controlling interests 3,138 1,689 1,749Adjusted shareholders' equity 101,471 93,901 86,748
Net-debt-to-equity ratio 23.3% 21.9% 23.4%
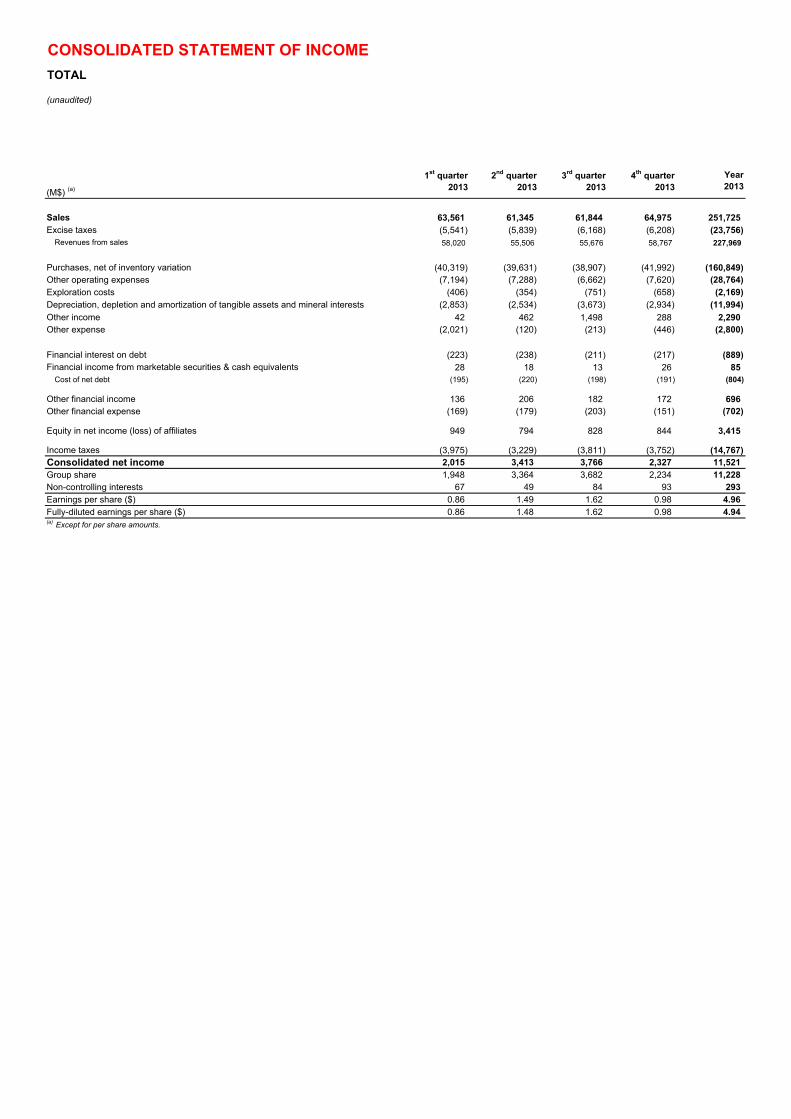
CONSOLIDATED STATEMENT OF INCOME
TOTAL
(unaudited)
(M$) (a)
1st quarter2013
2nd quarter2013
3rd quarter2013
4th quarter2013
Year2013
Sales 63,561 61,345 61,844 64,975 251,725Excise taxes (5,541) (5,839) (6,168) (6,208) (23,756)
Revenues from sales 58,020 55,506 55,676 58,767 227,969
Purchases, net of inventory variation (40,319) (39,631) (38,907) (41,992) (160,849)Other operating expenses (7,194) (7,288) (6,662) (7,620) (28,764)Exploration costs (406) (354) (751) (658) (2,169)Depreciation, depletion and amortization of tangible assets and mineral interests (2,853) (2,534) (3,673) (2,934) (11,994)
Other income 42 462 1,498 288 2,290Other expense (2,021) (120) (213) (446) (2,800)
Financial interest on debt (223) (238) (211) (217) (889)Financial income from marketable securities & cash equivalents 28 18 13 26 85
Cost of net debt (195) (220) (198) (191) (804)
Other financial income 136 206 182 172 696Other financial expense (169) (179) (203) (151) (702)
Equity in net income (loss) of affiliates 949 794 828 844 3,415
Income taxes (3,975) (3,229) (3,811) (3,752) (14,767)Consolidated net income 2,015 3,413 3,766 2,327 11,521Group share 1,948 3,364 3,682 2,234 11,228Non-controlling interests 67 49 84 93 293Earnings per share ($) 0.86 1.49 1.62 0.98 4.96 Fully-diluted earnings per share ($) 0.86 1.48 1.62 0.98 4.94 (a) Except for per share amounts.

CONSOLIDATED STATEMENT OF COMPREHENSIVE INCOME
TOTAL
(unaudited)
(M$)1st quarter
20132nd quarter
20133rd quarter
20134th quarter
2013
Year2013
Consolidated net income 2,015 3,413 3,766 2,327 11,521
Other comprehensive income
Actuarial gains and losses 223 (248) 44 663 682
Tax effect (87) 95 (11) (284) (287)
Currency translation adjustment generated by the mother company (2,212) 1,613 2,244 1,484 3,129
Items not potentially reclassifiable to profit and loss (2,076) 1,460 2,277 1,863 3,524
Currency translation adjustment 597 (988) (766) (768) (1,925)
Available for sale financial assets (5) 8 5 25 33
Cash flow hedge 15 80 38 23 156
Share of other comprehensive income of equity affiliates, net amount 47 (541) (113) (198) (805)
Other (11) (1) (3) 3 (12)
Tax effect (3) (32) (15) (12) (62)Items potentially reclassifiable to profit and loss 640 (1,474) (854) (927) (2,615)Total other comprehensive income (net amount) (1,436) (14) 1,423 936 909
Comprehensive income 579 3,399 5,189 3,263 12,430
- Group share 540 3,368 5,109 3,176 12,193- Non-controlling interests 39 31 80 87 237

CONSOLIDATED BALANCE SHEET
TOTAL
(unaudited)
(M$)March 31,
2013June 30,
2013September 30,
2013December 31,
2013
ASSETS
Non-current assetsIntangible assets, net 17,354 17,424 17,007 18,395Property, plant and equipment, net 90,505 93,387 97,134 104,480Equity affiliates : investments and loans 19,385 19,037 19,750 20,417Other investments 1,566 1,583 1,777 1,666Hedging instruments of non-current financial debt 1,885 1,708 1,840 1,418Deferred income taxes 3,297 3,704 3,691 3,838Other non-current assets 3,643 3,813 3,930 4,406
Total non-current assets 137,635 140,656 145,129 154,620
Current assetsInventories, net 21,890 20,196 21,469 22,097Accounts receivable, net 28,164 25,587 24,883 23,422Other current assets 13,956 14,850 15,185 14,892Current financial assets 799 668 457 739Cash and cash equivalents 17,178 15,118 20,111 20,200Assets classified as held for sale 5,833 5,104 3,112 3,253
Total current assets 87,820 81,523 85,217 84,603
Total assets 225,455 222,179 230,346 239,223
LIABILITIES & SHAREHOLDERS' EQUITY
Shareholders' equityCommon shares 7,454 7,490 7,491 7,493Paid-in surplus and retained earnings 94,559 94,637 96,442 98,254Currency translation adjustment (3,215) (3,063) (1,695) (1,203)Treasury shares (4,274) (4,274) (4,300) (4,303)
Total shareholders' equity - Group Share 94,524 94,790 97,938 100,241
Non-controlling interests 2,286 2,225 2,328 3,138
Total shareholders' equity 96,810 97,015 100,266 103,379
Non-current liabilitiesDeferred income taxes 16,480 16,736 17,442 17,850Employee benefits 4,486 4,751 4,799 4,235Provisions and other non-current liabilities 14,795 14,464 14,786 17,517Non-current financial debt 29,294 29,557 33,937 34,574
Total non-current liabilities 65,055 65,508 70,964 74,176
Current liabilitiesAccounts payable 27,927 26,380 27,811 30,282Other creditors and accrued liabilities 19,581 18,162 19,299 18,948Current borrowings 13,751 13,119 11,086 11,193Other current financial liabilities 114 59 57 381Liabilities directly associated with the assets classified as held for sale 2,217 1,936 863 864
Total current liabilities 63,590 59,656 59,116 61,668
Total liabilities and shareholders' equity 225,455 222,179 230,346 239,223

CONSOLIDATED STATEMENT OF CASH FLOW
TOTAL
(unaudited)
(M$)
1st quarter
2013
2nd quarter
2013
3rd quarter
2013
4th quarter
2013
Year2013
CASH FLOW FROM OPERATING ACTIVITIES
Consolidated net income 2,015 3,413 3,766 2,327 11,521Depreciation, depletion and amortization 3,046 2,759 4,190 3,363 13,358Non-current liabilities, valuation allowances and deferred taxes 59 (108) 791 825 1,567Impact of coverage of pension benefit plans - - - - -(Gains) losses on disposals of assets 1,873 (363) (1,397) (193) (80)Undistributed affiliates' equity earnings (466) 94 (301) (102) (775)(Increase) decrease in working capital (1,726) (1,025) 2,009 3,267 2,525Other changes, net 112 68 126 91 397Cash flow from operating activities 4,913 4,838 9,184 9,578 28,513
CASH FLOW USED IN INVESTING ACTIVITIES
Intangible assets and property, plant and equipment additions (6,489) (6,836) (6,801) (9,622) (29,748)Acquisitions of subsidiaries, net of cash acquired (21) - - - (21)Investments in equity affiliates and other securities (770) (256) (268) (462) (1,756)Increase in non-current loans (624) (367) (682) (1,233) (2,906)Total expenditures (7,904) (7,459) (7,751) (11,317) (34,431)Proceeds from disposals of intangible assets and property, plant and equipment 554 1,106 56 50 1,766Proceeds from disposals of subsidiaries, net of cash sold - 264 2,369 21 2,654Proceeds from disposals of non-current investments - 23 23 284 330Repayment of non-current loans 259 357 449 584 1,649Total divestments 813 1,750 2,897 939 6,399Cash flow used in investing activities (7,091) (5,709) (4,854) (10,378) (28,032)
CASH FLOW USED IN FINANCING ACTIVITIES
Issuance (repayment) of shares: - Parent company shareholders - 432 24 29 485 - Treasury shares - - (236) (2) (238)Dividends paid: - Parent company shareholders (1,760) (1,772) (1,775) (1,821) (7,128) - Non-controlling interests (2) (92) (13) (49) (156)Other transactions with non-controlling interests 471 (7) 50 1,639 2,153Net issuance (repayment) of non-current debt 3,765 734 4,466 2,137 11,102Increase (decrease) in current borrowings (4,268) (894) (2,457) (1,418) (9,037)Increase (decrease) in current financial assets and liabilities 1,178 6 66 48 1,298Cash flow used in financing activities (616) (1,593) 125 563 (1,521)Net increase (decrease) in cash and cash equivalents (2,794) (2,464) 4,455 (237) (1,040)Effect of exchange rates (437) 404 538 326 831Cash and cash equivalents at the beginning of the period 20,409 17,178 15,118 20,111 20,409Cash and cash equivalents at the end of the period 17,178 15,118 20,111 20,200 20,200

Consolidated statement of changes in shareholders’ equityTOTAL
(unaudited)
(M$) Number Amount Number Amount
As of January 1, 2013 2,365,933,146 7,454 92,485 (1,696) (108,391,639) (4,274) 93,969 1,689 95,658
Net income 1st
quarter 2013 - - 1,948 - - - 1,948 67 2,015
Other comprehensive income - - 111 (1,519) - - (1,408) (28) (1,436)
Comprehensive Income - - 2,059 (1,519) - - 540 39 579
Dividend - - - - - - - (2) (2)
Issuance of common shares 480 - - - - - - - -
Purchase of treasury shares - - - - - - - - -
Sale of treasury shares(a) - - - - 220 - - - -
Share-based payments - - 55 - - - 55 - 55
Share cancellation - - - - - - - - -
Other operations with non-controlling interests
- - (87) - - - (87) 558 471
Other items - - 47 - - - 47 2 49
As of March 31, 2013 2,365,933,626 7,454 94,559 (3,215) (108,391,419) (4,274) 94,524 2,286 96,810
Net income 2nd
quarter 2013 - - 3,364 - - - 3,364 49 3,413
Other comprehensive income - - (148) 152 - - 4 (18) (14)
Comprehensive Income - - 3,216 152 - - 3,368 31 3,399
Dividend - - (3,526) - - - (3,526) (92) (3,618)
Issuance of common shares 10,802,365 36 396 - - - 432 - 432
Purchase of treasury shares - - - - - - - - -
Sale of treasury shares(a) - - - - 760 - - - -
Share-based payments - - 42 - - - 42 - 42
Share cancellation - - - - - - - - -
Other operations with non-controlling interests
- - (5) - - - (5) (2) (7)
Other items - - (45) - - - (45) 2 (43)
As of June 30, 2013 2,376,735,991 7,490 94,637 (3,063) (108,390,659) (4,274) 94,790 2,225 97,015
Net income 3rd
quarter 2013 - - 3,682 - - - 3,682 84 3,766
Other comprehensive income - - 60 1,367 - - 1,427 (4) 1,423
Comprehensive Income - - 3,742 1,367 - - 5,109 80 5,189
Dividend - - (1,774) - - - (1,774) (13) (1,787)
Issuance of common shares 460,188 1 23 - - - 24 - 24
Purchase of treasury shares - - - - (4,414,200) (236) (236) - (236)
Sale of treasury shares(a) - - (210) - 3,589,661 210 - - -
Share-based payments - - 51 - - - 51 - 51
Share cancellation - - - - - - - - -
Other operations with non-controlling interests
- - (28) 1 - - (27) 31 4
Other items - - 1 - - - 1 5 6
As of September 30, 2013 2,377,196,179 7,491 96,442 (1,695) (109,215,198) (4,300) 97,938 2,328 100,266
Net income 4th
quarter 2013 - - 2,234 - - - 2,234 93 2,327
Other comprehensive income - - 450 492 - - 942 (6) 936
Comprehensive Income - - 2,684 492 - - 3,176 87 3,263
Dividend - - (1,816) - - - (1,816) (49) (1,865)
Issuance of common shares 481,981 2 27 - - - 29 - 29
Purchase of treasury shares - - - - - (2) (2) - (2)
Sale of treasury shares(a) - - 1 - 750 (1) - - -
Share-based payments - - 41 - - - 41 - 41
Share cancellation - - - - - - - - -
Other operations with non-controlling interests
- - 869 - - - 869 768 1,637
Other items - - 6 - - - 6 4 10
As of December 31, 2013 2,377,678,160 7,493 98,254 (1,203) (109,214,448) (4,303) 100,241 3,138 103,379
As of January 1, 2013 2,365,933,146 7,454 92,485 (1,696) (108,391,639) (4,274) 93,969 1,689 95,658
Net income 2013 - - 11,228 - - - 11,228 293 11,521
Other comprehensive income - - 473 492 - - 965 (56) 909
Comprehensive Income - - 11,701 492 - - 12,193 237 12,430
Dividend - - (7,116) - - - (7,116) (156) (7,272)
Issuance of common shares 11,745,014 39 446 - - - 485 - 485
Purchase of treasury shares - - - - (4,414,200) (238) (238) - (238)
Sale of treasury shares(a) - - (209) - 3,591,391 209 - - -
Share-based payments - - 189 - - - 189 - 189
Share cancellation - - - - - - - - -
Other operations with non-controlling interests
- - 749 1 - - 750 1,355 2,105
Other items - - 9 - - - 9 13 22
As of December 31, 2013 2,377,678,160 7,493 98,254 (1,203) (109,214,448) (4,303) 100,241 3,138 103,379
(a) Treasury shares related to the restricted stock grants.
Total shareholders'
equity
Common shares issued Paid-in surplus and retained
earnings
Currency translation adjustment
Treasury shares Shareholders' equity -
Group Share
Non-controlling interests
BUSINESS SEGMENT INFORMATIONTOTAL
(unaudited)
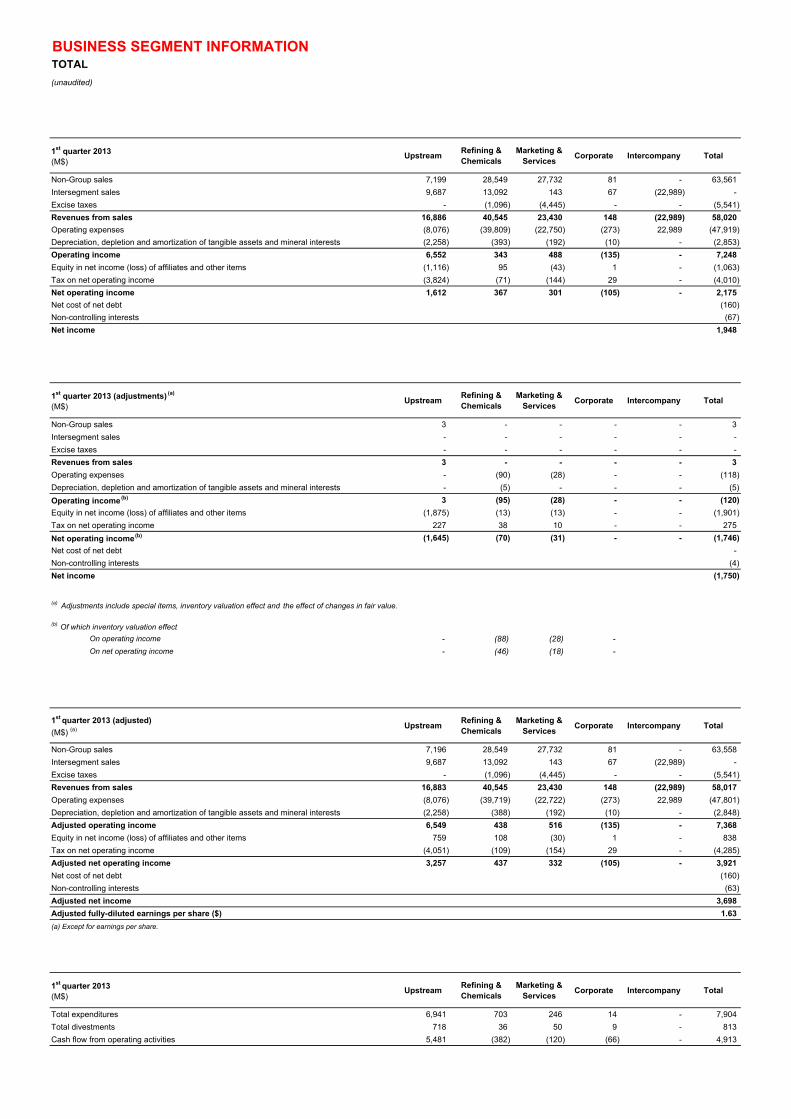
1st quarter 2013(M$)
UpstreamRefining & Chemicals
Marketing & Services
Corporate Intercompany Total
Non-Group sales 7,199 28,549 27,732 81 - 63,561
Intersegment sales 9,687 13,092 143 67 (22,989) -
Excise taxes - (1,096) (4,445) - - (5,541)
Revenues from sales 16,886 40,545 23,430 148 (22,989) 58,020
Operating expenses (8,076) (39,809) (22,750) (273) 22,989 (47,919)
Depreciation, depletion and amortization of tangible assets and mineral interests (2,258) (393) (192) (10) - (2,853)
Operating income 6,552 343 488 (135) - 7,248
Equity in net income (loss) of affiliates and other items (1,116) 95 (43) 1 - (1,063)
Tax on net operating income (3,824) (71) (144) 29 - (4,010)
Net operating income 1,612 367 301 (105) - 2,175
Net cost of net debt (160)
Non-controlling interests (67)
Net income 1,948
1st quarter 2013 (adjustments) (a)
(M$)Upstream
Refining & Chemicals
Marketing & Services
Corporate Intercompany Total
Non-Group sales 3 - - - - 3
Intersegment sales - - - - - -
Excise taxes - - - - - -
Revenues from sales 3 - - - - 3
Operating expenses - (90) (28) - - (118)
Depreciation, depletion and amortization of tangible assets and mineral interests - (5) - - - (5)
Operating income (b) 3 (95) (28) - - (120)
Equity in net income (loss) of affiliates and other items (1,875) (13) (13) - - (1,901)
Tax on net operating income 227 38 10 - - 275
Net operating income (b) (1,645) (70) (31) - - (1,746)
Net cost of net debt -
Non-controlling interests (4)
Net income (1,750)
On operating income - (88) (28) -
On net operating income - (46) (18) -
1st quarter 2013 (adjusted)
(M$) (a) UpstreamRefining & Chemicals
Marketing & Services
Corporate Intercompany Total
Non-Group sales 7,196 28,549 27,732 81 - 63,558
Intersegment sales 9,687 13,092 143 67 (22,989) -
Excise taxes - (1,096) (4,445) - - (5,541)
Revenues from sales 16,883 40,545 23,430 148 (22,989) 58,017
Operating expenses (8,076) (39,719) (22,722) (273) 22,989 (47,801)
Depreciation, depletion and amortization of tangible assets and mineral interests (2,258) (388) (192) (10) - (2,848)
Adjusted operating income 6,549 438 516 (135) - 7,368
Equity in net income (loss) of affiliates and other items 759 108 (30) 1 - 838
Tax on net operating income (4,051) (109) (154) 29 - (4,285)
Adjusted net operating income 3,257 437 332 (105) - 3,921
Net cost of net debt (160)
Non-controlling interests (63)
Adjusted net income 3,698
Adjusted fully-diluted earnings per share ($) 1.63
(a) Except for earnings per share.
1st quarter 2013(M$)
UpstreamRefining & Chemicals
Marketing & Services
Corporate Intercompany Total
Total expenditures 6,941 703 246 14 - 7,904
Total divestments 718 36 50 9 - 813
Cash flow from operating activities 5,481 (382) (120) (66) - 4,913
(a) Adjustments include special items, inventory valuation effect and the effect of changes in fair value.
(b) Of which inventory valuation effect

BUSINESS SEGMENT INFORMATIONTOTAL
(unaudited)
2nd quarter 2013(M$)
UpstreamRefining & Chemicals
Marketing & Services
Corporate Intercompany Total
Non-Group sales 6,240 28,160 26,851 94 - 61,345
Intersegment sales 8,508 12,809 1,058 35 (22,410) -
Excise taxes - (1,091) (4,748) - - (5,839)
Revenues from sales 14,748 39,878 23,161 129 (22,410) 55,506
Operating expenses (7,195) (39,672) (22,541) (275) 22,410 (47,273)
Depreciation, depletion and amortization of tangible assets and mineral interests (1,974) (390) (160) (10) - (2,534)
Operating income 5,579 (184) 460 (156) - 5,699
Equity in net income (loss) of affiliates and other items 1,022 62 51 28 - 1,163
Tax on net operating income (3,160) 88 (138) (57) - (3,267)
Net operating income 3,441 (34) 373 (185) - 3,595
Net cost of net debt (182)
Non-controlling interests (49)
Net income 3,364
2nd quarter 2013 (adjustments) (a)
(M$)Upstream
Refining & Chemicals
Marketing & Services
Corporate Intercompany Total
Non-Group sales (42) - - - - (42)
Intersegment sales - - - - - -
Excise taxes - - - - - -
Revenues from sales (42) - - - - (42)
Operating expenses - (704) (107) - - (811)
Depreciation, depletion and amortization of tangible assets and mineral interests - - - - - -
Operating income (b) (42) (704) (107) - - (853)
Equity in net income (loss) of affiliates and other items 331 (48) - - - 283
Tax on net operating income 111 200 34 - - 345
Net operating income (b) 400 (552) (73) - - (225)
Net cost of net debt -
Non-controlling interests 8
Net income (217)
On operating income - (655) (107) -
On net operating income - (460) (73) -
2nd quarter 2013 (adjusted)
(M$) (a) UpstreamRefining & Chemicals
Marketing & Services
Corporate Intercompany Total
Non-Group sales 6,282 28,160 26,851 94 - 61,387
Intersegment sales 8,508 12,809 1,058 35 (22,410) -
Excise taxes - (1,091) (4,748) - - (5,839)
Revenues from sales 14,790 39,878 23,161 129 (22,410) 55,548
Operating expenses (7,195) (38,968) (22,434) (275) 22,410 (46,462)
Depreciation, depletion and amortization of tangible assets and mineral interests (1,974) (390) (160) (10) - (2,534)
Adjusted operating income 5,621 520 567 (156) - 6,552
Equity in net income (loss) of affiliates and other items 691 110 51 28 - 880
Tax on net operating income (3,271) (112) (172) (57) - (3,612)
Adjusted net operating income 3,041 518 446 (185) - 3,820
Net cost of net debt (182)
Non-controlling interests (57)
Adjusted net income 3,581
Adjusted fully-diluted earnings per share ($) 1.57
(a) Except for earnings per share.
2nd quarter 2013(M$)
UpstreamRefining & Chemicals
Marketing & Services
Corporate Intercompany Total
Total expenditures 6,603 499 318 39 - 7,459
Total divestments 1,456 272 16 6 - 1,750
Cash flow from operating activities 2,764 1,713 542 (181) - 4,838
(a) Adjustments include special items, inventory valuation effect and the effect of changes in fair value.
(b) Of which inventory valuation effect

BUSINESS SEGMENT INFORMATIONTOTAL
(unaudited)
3rd quarter 2013(M$)
UpstreamRefining & Chemicals
Marketing & Services
Corporate Intercompany Total
Non-Group sales 5,938 28,161 27,912 (167) - 61,844
Intersegment sales 9,237 13,334 570 18 (23,159) -
Excise taxes - (1,290) (4,878) - - (6,168)
Revenues from sales 15,175 40,205 23,604 (149) (23,159) 55,676
Operating expenses (7,106) (39,601) (22,826) 54 23,159 (46,320)
Depreciation, depletion and amortization of tangible assets and mineral interests (3,106) (377) (180) (10) - (3,673)
Operating income 4,963 227 598 (105) - 5,683
Equity in net income (loss) of affiliates and other items 1,974 99 85 (66) - 2,092
Tax on net operating income (3,396) (243) (156) (43) - (3,838)
Net operating income 3,541 83 527 (214) - 3,937
Net cost of net debt (171)
Non-controlling interests (84)
Net income 3,682
3rd quarter 2013 (adjustments) (a)
(M$)Upstream
Refining & Chemicals
Marketing & Services
Corporate Intercompany Total
Non-Group sales (12) - - - - (12)
Intersegment sales - - - - - -
Excise taxes - - - - - -
Revenues from sales (12) - - - - (12)
Operating expenses (113) (153) 54 - - (212)
Depreciation, depletion and amortization of tangible assets and mineral interests (855) (7) - - - (862)
Operating income (b) (980) (160) 54 - - (1,086)
Equity in net income (loss) of affiliates and other items 1,239 (5) 40 (34) - 1,240
Tax on net operating income 195 (213) (14) (45) - (77)
Net operating income (b) 454 (378) 80 (79) - 77
Net cost of net debt -
Non-controlling interests (23)
Net income 54
On operating income - (153) 93 -
On net operating income - (84) 65 -
3rd quarter 2013 (adjusted)
(M$) (a) UpstreamRefining & Chemicals
Marketing & Services
Corporate Intercompany Total
Non-Group sales 5,950 28,161 27,912 (167) - 61,856
Intersegment sales 9,237 13,334 570 18 (23,159) -
Excise taxes - (1,290) (4,878) - - (6,168)
Revenues from sales 15,187 40,205 23,604 (149) (23,159) 55,688
Operating expenses (6,993) (39,448) (22,880) 54 23,159 (46,108)
Depreciation, depletion and amortization of tangible assets and mineral interests (2,251) (370) (180) (10) - (2,811)
Adjusted operating income 5,943 387 544 (105) - 6,769
Equity in net income (loss) of affiliates and other items 735 104 45 (32) - 852
Tax on net operating income (3,591) (30) (142) 2 - (3,761)
Adjusted net operating income 3,087 461 447 (135) - 3,860
Net cost of net debt (171)
Non-controlling interests (61)
Adjusted net income 3,628
Adjusted fully-diluted earnings per share ($) 1.59
(a) Except for earnings per share.
3rd quarter 2013(M$)
UpstreamRefining & Chemicals
Marketing & Services
Corporate Intercompany Total
Total expenditures 6,708 550 430 63 - 7,751
Total divestments 2,800 12 57 28 - 2,897
Cash flow from operating activities 6,302 1,113 1,693 76 - 9,184
(a) Adjustments include special items, inventory valuation effect and the effect of changes in fair value.
(b) Of which inventory valuation effect
BUSINESS SEGMENT INFORMATIONTOTAL
(unaudited)
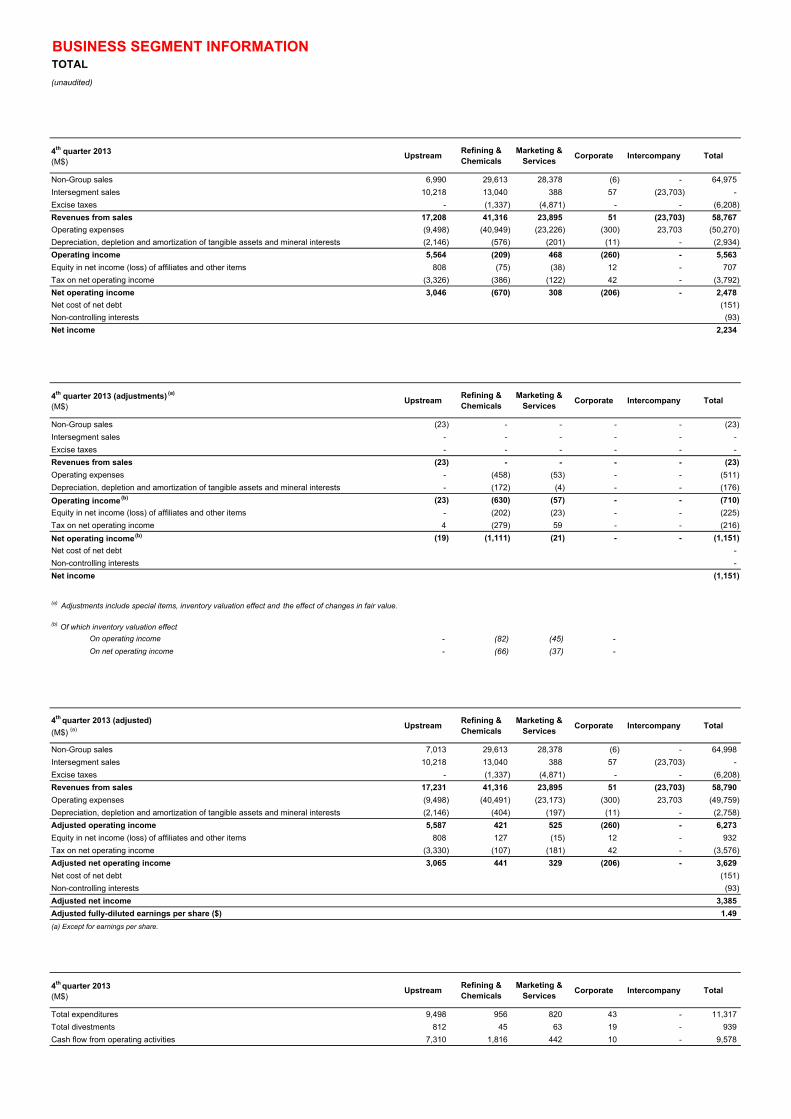
4th quarter 2013(M$)
UpstreamRefining & Chemicals
Marketing & Services
Corporate Intercompany Total
Non-Group sales 6,990 29,613 28,378 (6) - 64,975
Intersegment sales 10,218 13,040 388 57 (23,703) -
Excise taxes - (1,337) (4,871) - - (6,208)
Revenues from sales 17,208 41,316 23,895 51 (23,703) 58,767
Operating expenses (9,498) (40,949) (23,226) (300) 23,703 (50,270)
Depreciation, depletion and amortization of tangible assets and mineral interests (2,146) (576) (201) (11) - (2,934)
Operating income 5,564 (209) 468 (260) - 5,563
Equity in net income (loss) of affiliates and other items 808 (75) (38) 12 - 707
Tax on net operating income (3,326) (386) (122) 42 - (3,792)
Net operating income 3,046 (670) 308 (206) - 2,478
Net cost of net debt (151)
Non-controlling interests (93)
Net income 2,234
4th quarter 2013 (adjustments) (a)
(M$)Upstream
Refining & Chemicals
Marketing & Services
Corporate Intercompany Total
Non-Group sales (23) - - - - (23)
Intersegment sales - - - - - -
Excise taxes - - - - - -
Revenues from sales (23) - - - - (23)
Operating expenses - (458) (53) - - (511)
Depreciation, depletion and amortization of tangible assets and mineral interests - (172) (4) - - (176)
Operating income (b) (23) (630) (57) - - (710)
Equity in net income (loss) of affiliates and other items - (202) (23) - - (225)
Tax on net operating income 4 (279) 59 - - (216)
Net operating income (b) (19) (1,111) (21) - - (1,151)
Net cost of net debt -
Non-controlling interests -
Net income (1,151)
On operating income - (82) (45) -
On net operating income - (66) (37) -
4th quarter 2013 (adjusted)
(M$) (a) UpstreamRefining & Chemicals
Marketing & Services
Corporate Intercompany Total
Non-Group sales 7,013 29,613 28,378 (6) - 64,998
Intersegment sales 10,218 13,040 388 57 (23,703) -
Excise taxes - (1,337) (4,871) - - (6,208)
Revenues from sales 17,231 41,316 23,895 51 (23,703) 58,790
Operating expenses (9,498) (40,491) (23,173) (300) 23,703 (49,759)
Depreciation, depletion and amortization of tangible assets and mineral interests (2,146) (404) (197) (11) - (2,758)
Adjusted operating income 5,587 421 525 (260) - 6,273
Equity in net income (loss) of affiliates and other items 808 127 (15) 12 - 932
Tax on net operating income (3,330) (107) (181) 42 - (3,576)
Adjusted net operating income 3,065 441 329 (206) - 3,629
Net cost of net debt (151)
Non-controlling interests (93)
Adjusted net income 3,385
Adjusted fully-diluted earnings per share ($) 1.49
(a) Except for earnings per share.
4th quarter 2013(M$)
UpstreamRefining & Chemicals
Marketing & Services
Corporate Intercompany Total
Total expenditures 9,498 956 820 43 - 11,317
Total divestments 812 45 63 19 - 939
Cash flow from operating activities 7,310 1,816 442 10 - 9,578
(a) Adjustments include special items, inventory valuation effect and the effect of changes in fair value.
(b) Of which inventory valuation effect

Reconciliation of the information by business segment with consolidated financial statements
TOTAL
(unaudited)
1st quarter 2013(M$)
Adjusted Adjustments (a) Consolidated statement of income
Sales 63,558 3 63,561Excise taxes (5,541) - (5,541)
Revenues from sales 58,017 3 58,020
Purchases, net of inventory variation (40,203) (116) (40,319)Other operating expenses (7,192) (2) (7,194)Exploration costs (406) - (406)Depreciation, depletion and amortization of tangible assets and mineral interests (2,848) (5) (2,853)
Other income 42 - 42Other expense (127) (1,894) (2,021)
Financial interest on debt (223) - (223)Financial income from marketable securities & cash equivalents 28 - 28
Cost of net debt (195) - (195)
Other financial income 136 - 136Other financial expense (169) - (169)
Equity in net income (loss) of affiliates 956 (7) 949
Income taxes (4,250) 275 (3,975)Consolidated net income 3,761 (1,746) 2,015Group share 3,698 (1,750) 1,948Non-controlling interests 63 4 67
(a) Adjustments include special items, inventory valuation effect and the effect of changes in fair value.
2nd quarter 2013(M$)
Adjusted Adjustments (a) Consolidated statement of income
Sales 61,387 (42) 61,345Excise taxes (5,839) - (5,839)
Revenues from sales 55,548 (42) 55,506
Purchases, net of inventory variation (38,869) (762) (39,631)Other operating expenses (7,239) (49) (7,288)Exploration costs (354) - (354)Depreciation, depletion and amortization of tangible assets and mineral interests (2,534) - (2,534)
Other income 131 331 462Other expense (89) (31) (120)
Financial interest on debt (238) - (238)Financial income from marketable securities & cash equivalents 18 - 18
Cost of net debt (220) - (220)
Other financial income 206 - 206Other financial expense (179) - (179)
Equity in net income (loss) of affiliates 811 (17) 794
Income taxes (3,574) 345 (3,229)Consolidated net income 3,638 (225) 3,413Group share 3,581 (217) 3,364Non-controlling interests 57 (8) 49
(a) Adjustments include special items, inventory valuation effect and the effect of changes in fair value.
Reconciliation of the information by business segment with consolidated financial statements
TOTAL
(unaudited)
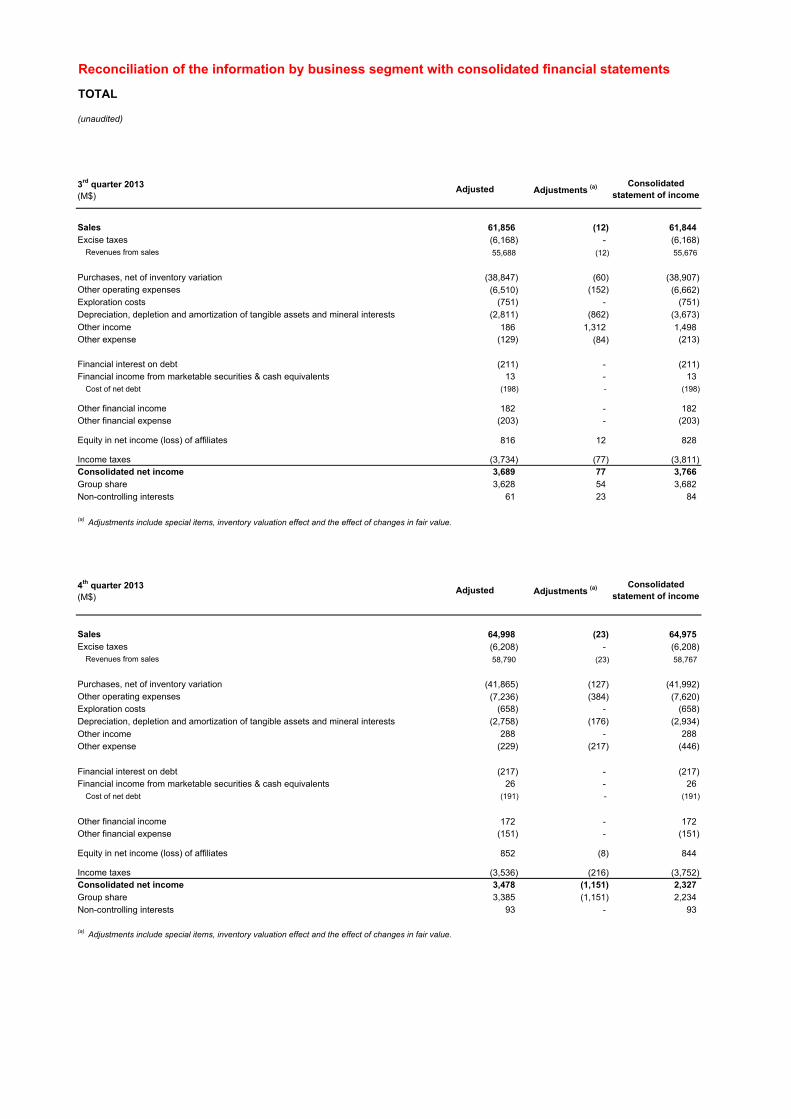
3rd quarter 2013(M$)
Adjusted Adjustments (a) Consolidated statement of income
Sales 61,856 (12) 61,844Excise taxes (6,168) - (6,168)
Revenues from sales 55,688 (12) 55,676
Purchases, net of inventory variation (38,847) (60) (38,907)Other operating expenses (6,510) (152) (6,662)Exploration costs (751) - (751)Depreciation, depletion and amortization of tangible assets and mineral interests (2,811) (862) (3,673)
Other income 186 1,312 1,498Other expense (129) (84) (213)
Financial interest on debt (211) - (211)Financial income from marketable securities & cash equivalents 13 - 13
Cost of net debt (198) - (198)
Other financial income 182 - 182Other financial expense (203) - (203)
Equity in net income (loss) of affiliates 816 12 828
Income taxes (3,734) (77) (3,811)Consolidated net income 3,689 77 3,766Group share 3,628 54 3,682Non-controlling interests 61 23 84
(a) Adjustments include special items, inventory valuation effect and the effect of changes in fair value.
4th quarter 2013(M$)
Adjusted Adjustments (a) Consolidated statement of income
Sales 64,998 (23) 64,975Excise taxes (6,208) - (6,208)
Revenues from sales 58,790 (23) 58,767
Purchases, net of inventory variation (41,865) (127) (41,992)Other operating expenses (7,236) (384) (7,620)Exploration costs (658) - (658)Depreciation, depletion and amortization of tangible assets and mineral interests (2,758) (176) (2,934)
Other income 288 - 288Other expense (229) (217) (446)
Financial interest on debt (217) - (217)Financial income from marketable securities & cash equivalents 26 - 26
Cost of net debt (191) - (191)
Other financial income 172 - 172Other financial expense (151) - (151)
Equity in net income (loss) of affiliates 852 (8) 844
Income taxes (3,536) (216) (3,752)Consolidated net income 3,478 (1,151) 2,327Group share 3,385 (1,151) 2,234Non-controlling interests 93 - 93
(a) Adjustments include special items, inventory valuation effect and the effect of changes in fair value.

Notes to the unaudited consolidated financial information in U.S. dollars
The unaudited consolidated financial information in U.S. dollars of TOTAL S.A. (“TOTAL”) and its
subsidiaries (the “Group”, with TOTAL and Group used interchangeably herein) included in this
Exhibit has been prepared on the basis of IFRS (International Financial Reporting Standards) as
adopted by the European Union and IFRS as issued by the IASB (International Accounting Standard
Board).
Change in presentation currency of the Consolidated Financial Statements
In order to make the financial information of TOTAL more readable by better reflecting the
performance of its activities mainly carried out in U.S. dollars, TOTAL has changed, effective
January 1, 2014, the presentation currency of the Group’s Consolidated Financial Statements from
the Euro to the US Dollar. The statutory financial statements of TOTAL S.A., the parent company of
the Group, remain prepared in euro. The dividend paid remains fixed in euro.
Following this change in accounting policy, the comparative consolidated financial statements are
presented in U.S. dollars.
Currency translation adjustments have been set to zero as of January 1, 2004, the date of transition
to IFRS. Cumulative currency translation adjustments are presented as if the Group had used the
US Dollar as the presentation currency of its Consolidated Financial Statements since that date.
The change in the presentation currency will have the following effects on the Group’s Consolidated
Financial Statements:
The different components of assets and liabilities in dollars correspond to the amounts published in Euros converted at the US Dollar/Euro closing rate applicable at the end of the reporting period. The same methodology is applied for shareholders’ equity as a whole. As a result, the change in presentation currency has no impact on the different components of assets and liabilities, shareholders’ equity as a whole or the net-debt-to-equity ratio(1).
The recalculation of currency translation adjustments in dollars has an impact on the distribution of shareholders’ equity for comparative periods between currency translation adjustment and other components of equity and on other comprehensive income at year end 2011, 2012 and 2013 as set out in the following tables:
(1)
Net-debt-to-equity ratio = net debt (the sum of current borrowings, other current financial liabilities and non-current financial debt, net of current financial assets, net financial assets and liabilities related to assets classified in accordance with IFRS 5 as non-current assets held for sale, hedging instruments on non-current financial debt and cash and cash equivalents) divided by the sum of shareholders’ equity and non-controlling interests after expected dividends payable.

Statement of income and statement of cash flow amounts in dollars correspond to the amounts published in Euros converted at the US Dollar/Euro average rate of the reporting period. The reclassification on the disposal of foreign operations from equity to profit or loss of the cumulative amount of exchange differences relating to the disposed assets has an impact on net income for the years 2011, 2012 and 2013 as set out in the following table:
December 31, 2013
Historical
consolidated
financial
statements in
million euros
Historical
consolidated
financial
statements in
million dollars (a)
Restatements (b)
Impact of
applying
interpretation
IFRIC 21
Consolidated
financial
statements in
million dollars
Shareholders' equity
Common shares 5 944 8 197 (704) 7 493
Paid-in surplus and retained earnings 74 449 102 673 (4 488) 69 98 254
Currency translation adjustment (4 385) (6 047) 4 840 4 (1 203)
Treasury shares (3 379) (4 660) 357 (4 303)
Total shareholders' equity - Group Share 72 629 100 163 5 73 100 241
(a) Conversion at the closing exchange rate applicable at the end of the reporting period (0,72511 euro per dollar)
(b) Differences between historical exchange rates and the closing exchange rate applicable at the end of the reporting period (0,72511 euro per dollar)
December 31, 2012
Historical
consolidated
financial
statements in
million euros
Historical
consolidated
financial
statements in
million dollars (a)
Restatements (b)
Impact of
applying
interpretation
IFRIC 21
Consolidated
financial
statements in
million dollars
Shareholders' equity
Common shares 5 915 7 804 (350) 7 454
Paid-in surplus and retained earnings 70 116 92 511 (72) 46 92 485
Currency translation adjustment (1 504) (1 984) 287 1 (1 696)
Treasury shares (3 342) (4 409) 135 (4 274)
Total shareholders' equity - Group Share 71 185 93 922 - 47 93 969
(a) Conversion at the closing exchange rate applicable at the end of the reporting period (0,75792 euro per dollar)
(b) Differences between historical exchange rates and the closing exchange rate applicable at the end of the reporting period (0,75792 euro per dollar)
December 31, 2011
Historical
consolidated
financial
statements in
million euros
Historical
consolidated
financial
statements in
million dollars (a)
Restatements (b)
Impact of
applying
interpretation
IFRIC 21
Consolidated
financial
statements in
million dollars
Shareholders' equity
Common shares 5 909 7 646 (199) 7 447
Paid-in surplus and retained earnings 65 430 84 660 1 755 46 86 461
Currency translation adjustment (1 004) (1 299) (1 585) (2 884)
Treasury shares (3 390) (4 386) 29 (4 357)
Total shareholders' equity - Group Share 66 945 86 621 - 46 86 667
(a) Conversion at the closing exchange rate applicable at the end of the reporting period (0,772857 euro per dollar)
(b) Differences between historical exchange rates and the closing exchange rate applicable at the end of the reporting period (0,772857 euro per dollar)

Excluding the above reclassification adjustments, the change in presentation currency has no
impact on TOTAL’s net income for comparative periods. Such reclassification adjustments are
not included in adjusted net operating income for the business segments, and are also
excluded from adjusted net income.
Return on average capital employed (ROACE) and return on equity (ROE) for comparative periods presented in euro are converted to dollars by dividing the applicable statement of income item (converted at the US Dollar/Euro average rate for the reporting period) by the applicable balance sheet item (converted at the US Dollar/Euro closing rate applicable at the end of the reporting period). The difference between average exchange rates and closing exchange rates has an insignificant effect on ROACE and ROE.
As the functional currency of the parent company of the Group remains the Euro, translation adjustments resulting from translation to the US Dollar are presented in the new line item “Currency translation adjustment generated by the parent company” included in “Items not potentially reclassifiable to profit and loss” of the statement of Other Comprehensive Income. These translation adjustments are presented in the line item “Currency Translation Adjustment” of the balance sheet.
Application of interpretation IFRIC 21 “Levies”
In May 2013, the IASB issued the interpretation IFRIC 21 “Levies”. This interpretation is applicable
retrospectively for annual periods beginning on or after January 1, 2014. The text indicates that the
obligating event for the recognition of a liability is the activity described in the relevant legislation
that triggers the payment of the levy. Comparative Consolidated Financial Statements have been
restated accordingly.
The impact on shareholders’ equity as of January 1, 2011, is +$46 million. The impact on statements
of income for 2011 and 2012 is not significant. Net income, Group share, for 2013 is increased by $24
million (1st quarter: -$83 million, 2nd quarter: +$48 million, 3rd quarter: +$37 million, 4th quarter: +$22
million).
In 2014, application of IFRIC 21 will have a similar effect as in 2013 due to the accounting of levies in
the statement of income of the first quarter.
Net income, Group share
Historical
consolidated
financial
statements in
million euros
Historical
consolidated
financial
statements in
million dollars (a)
Restatements (b)
Impact of
applying
interpretation
IFRIC 21
Consolidated
financial
statements in
million dollars
2013 8 440 11 209 (5) 24 11 228
2012 10 609 13 630 18 - 13 648
2011 12 309 17 134 266 - 17 400
(a) Conversion at the average exchange rate, i.e. 0,752945 euro per dollar in 2013, 0,778338 euro per dollar in 2012 and 0,718414 euro per dollar in 2011
(b) Reclassification on the disposal of foreign operations from equity to profit or loss of the cumulative amount of exchange differences relating to the disposed assets