Embed Size (px)
Citation preview

Total Cost of Ownership (TCO) Comparison
For Web Applications (Beta)
Thank You This summary report includes a total cost of ownership comparison which takes into account the full costs of running your web application in physical infrastructure and compares it to the cost of running it in AWS. The infrastructure is based on the description of the physical infrastructure you provided in the online tool. The AWS infrastructure is an approximation of the physical infrastructure you described. These calculations use third-party estimates and actual customer data. Calculator results are estimates, and your actual results may vary. Both summary and detailed comparisons follow. For more information, please consult the references listed at the end of this document.
Contents
1. Summary ................................................................................................... 2
2. Detailed Cost Comparison and Explanations............................................. 3
3. Frequently Asked Questions and Additional Information............................ 4
4. References …............................................................................................. 12
Powered By:
Page 1 of 13 Created On 3/12/2013 7:42:20 AM

1. Summary
Total Cost of Ownership Calculator for Web Applications* (Beta)
You could save $213,244 per year running on AWS.
Based on your inputs and our TCO calculations you could save $213,244 per year running on Amazon Web Services
vs. running your web applications on the physical infrastructure you described.
Over 3 years this equates to $639,732 in savings.
*AWS Server pricing includes reserved instances fees.
*This calculator uses third-party estimates and actual customer data. Calculator results are estimates, and your actual results may
vary.
On-Premises AWS Difference
Servers $26,579 $13,547 $13,031
Storage $47,919 $11,192 $36,728
Network $25,767 $972 $24,795
Environment $93,150 $0 $93,150
Administration $60,720 $15,180 $45,540
Total / year $254,135 $40,891 $213,244
Region: US East (Northern Virginia)Usage Pattern: Spikey Predictable
Page 2 of 13 Created On 3/12/2013 7:42:20 AM
2. Detailed Cost Comparison and Explanations
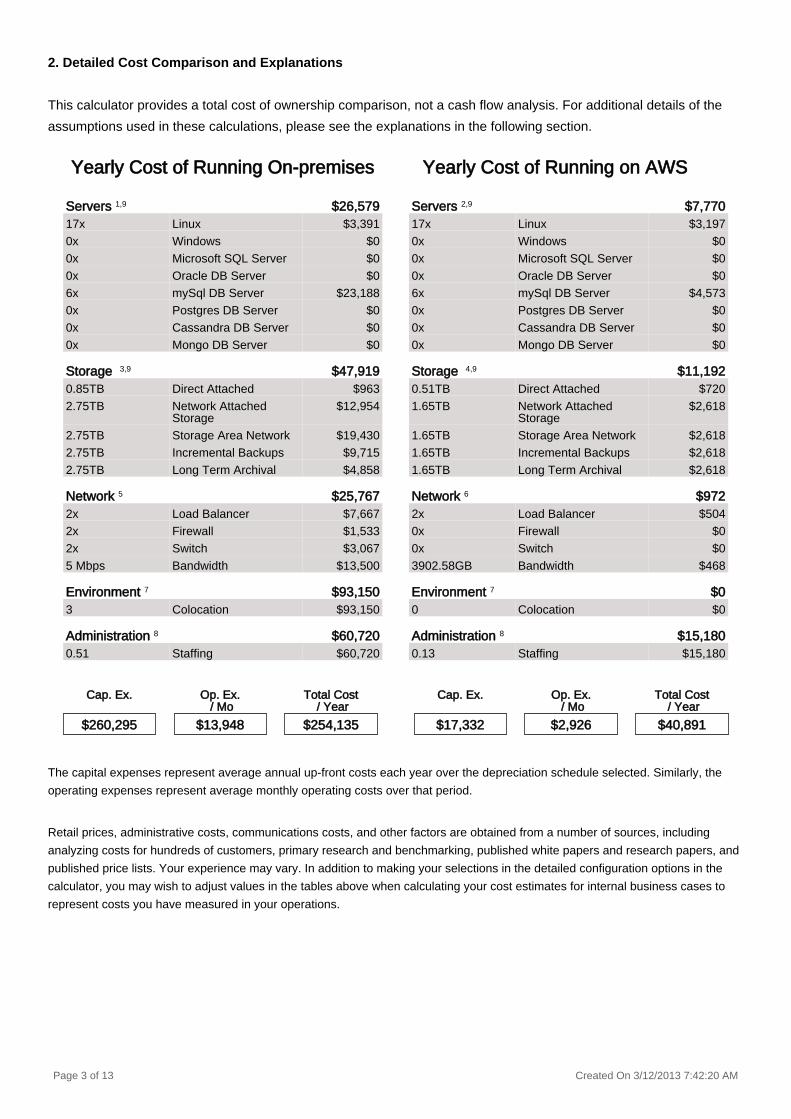
This calculator provides a total cost of ownership comparison, not a cash flow analysis. For additional details of the
assumptions used in these calculations, please see the explanations in the following section.
The capital expenses represent average annual up-front costs each year over the depreciation schedule selected. Similarly, the
operating expenses represent average monthly operating costs over that period.
Retail prices, administrative costs, communications costs, and other factors are obtained from a number of sources, including
analyzing costs for hundreds of customers, primary research and benchmarking, published white papers and research papers, and
published price lists. Your experience may vary. In addition to making your selections in the detailed configuration options in the
calculator, you may wish to adjust values in the tables above when calculating your cost estimates for internal business cases to
represent costs you have measured in your operations.
Yearly Cost of Running On-premises Yearly Cost of Running on AWS
Servers 1,9 $26,579 Servers 2,9 $7,77017x Linux $3,391 17x Linux $3,1970x Windows $0 0x Windows $00x Microsoft SQL Server $0 0x Microsoft SQL Server $00x Oracle DB Server $0 0x Oracle DB Server $06x mySql DB Server $23,188 6x mySql DB Server $4,5730x Postgres DB Server $0 0x Postgres DB Server $00x Cassandra DB Server $0 0x Cassandra DB Server $00x Mongo DB Server $0 0x Mongo DB Server $0
Storage 3,9 $47,919 Storage 4,9 $11,1920.85TB Direct Attached $963 0.51TB Direct Attached $7202.75TB Network Attached
Storage$12,954 1.65TB Network Attached
Storage$2,618
2.75TB Storage Area Network $19,430 1.65TB Storage Area Network $2,6182.75TB Incremental Backups $9,715 1.65TB Incremental Backups $2,6182.75TB Long Term Archival $4,858 1.65TB Long Term Archival $2,618
Network 5 $25,767 Network 6 $9722x Load Balancer $7,667 2x Load Balancer $5042x Firewall $1,533 0x Firewall $02x Switch $3,067 0x Switch $05 Mbps Bandwidth $13,500 3902.58GB Bandwidth $468
Environment 7 $93,150 Environment 7 $03 Colocation $93,150 0 Colocation $0
Administration 8 $60,720 Administration 8 $15,1800.51 Staffing $60,720 0.13 Staffing $15,180
Cap. Ex. Op. Ex. / Mo
Total Cost / Year
Cap. Ex. Op. Ex. / Mo
Total Cost / Year
$260,295 $13,948 $254,135 $17,332 $2,926 $40,891
Page 3 of 13 Created On 3/12/2013 7:42:20 AM
3. Frequently Asked Questions (FAQ) and Additional Information on How Costs are Computed
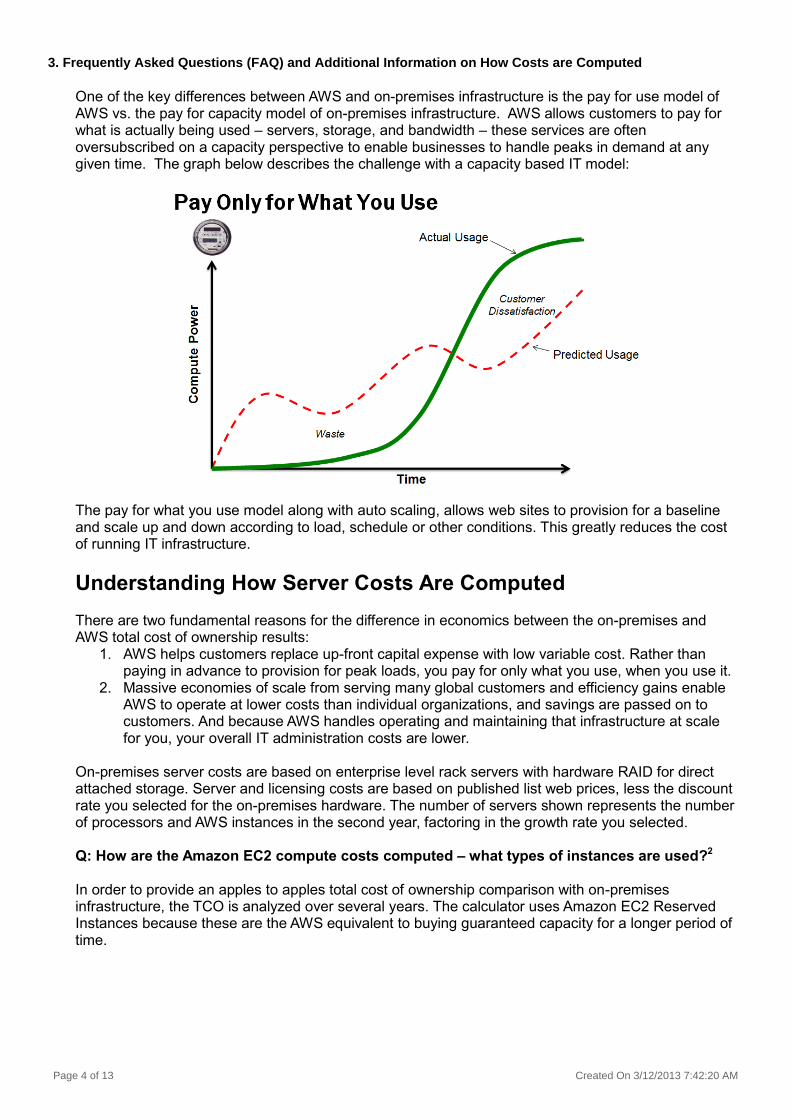
One of the key differences between AWS and on-premises infrastructure is the pay for use model of AWS vs. the pay for capacity model of on-premises infrastructure. AWS allows customers to pay for what is actually being used – servers, storage, and bandwidth – these services are often oversubscribed on a capacity perspective to enable businesses to handle peaks in demand at any given time. The graph below describes the challenge with a capacity based IT model:
The pay for what you use model along with auto scaling, allows web sites to provision for a baseline and scale up and down according to load, schedule or other conditions. This greatly reduces the cost of running IT infrastructure.
Understanding How Server Costs Are Computed There are two fundamental reasons for the difference in economics between the on-premises and AWS total cost of ownership results:
1. AWS helps customers replace up-front capital expense with low variable cost. Rather than paying in advance to provision for peak loads, you pay for only what you use, when you use it.
2. Massive economies of scale from serving many global customers and efficiency gains enable AWS to operate at lower costs than individual organizations, and savings are passed on to customers. And because AWS handles operating and maintaining that infrastructure at scale for you, your overall IT administration costs are lower.
On-premises server costs are based on enterprise level rack servers with hardware RAID for direct attached storage. Server and licensing costs are based on published list web prices, less the discount rate you selected for the on-premises hardware. The number of servers shown represents the number of processors and AWS instances in the second year, factoring in the growth rate you selected. Q: How are the Amazon EC2 compute costs computed – what types of instances are used?2 In order to provide an apples to apples total cost of ownership comparison with on-premises infrastructure, the TCO is analyzed over several years. The calculator uses Amazon EC2 Reserved Instances because these are the AWS equivalent to buying guaranteed capacity for a longer period of time.
Page 4 of 13 Created On 3/12/2013 7:42:20 AM
Reserved Instances (RIs) allow you to make a low, one-time payment to reserve instance capacity and further reduce your ongoing Amazon EC2 costs. There are multiple Reserved Instance types that enable you to balance the amount you pay up front with your effective hourly price. Two types of RIs are used by the calculator:
Medium Utilization RIs – Medium Utilization RIs are the same Reserved Instances that Amazon EC2 has offered for the last several years. They have a higher upfront payment than Light Utilization RIs, but a much lower hourly usage fee. Medium Utilization RIs allow you to turn off your instance at any point and not pay the hourly fee. Medium Utilization RIs are best suited for workloads that run most of the time, but have some variability in usage (like web server traffic where demand may increase or decrease throughout the year). Using Medium Utilization RIs, you can save up to 49% for a 1-year term and 66% for a 3-year term vs. running On-Demand Instances. The break-even point for a Medium Utilization Linux RI (vs. Light Utilization Reserved Instances) is 69% utilization for a 1-year term or 44% of a 3-year term. If you expect to use your instance more than that, an RI will save you money.
Heavy Utilization RIs – Heavy Utilization RIs offer the most absolute savings of any Reserved Instance type. They’re most appropriate for steady-state workloads where you’re willing to commit to always running these instances in exchange for our lowest hourly usage fee. With this RI, you pay a little higher upfront payment than Medium Utilization RIs, a significantly lower hourly usage fee, and you’re charged that lower hourly rate for every hour in the Reserved Instance term you purchase. Using Heavy Utilization RIs, you can save up to 54% for a 1-year term and 71% for a 3-year term vs. running On-Demand Instances. The break-even point for a Heavy Utilization Linux RI (vs. Medium Utilization Reserved Instances) is 85% utilization for a 1-year term or 76% of a 3-year term. If you expect to use your instance more than that, RIs will save you money.
Costs are compared for the period of time selected in the Depreciation Schedule in Years specified in the Data Centers configuration section of the calculator. This allows us to look at AWS as a long term resource similar to hardware purchased for an on-premises data center. Reserved Instances are used for both the baseline workloads and for the spikes in utilization. Q. What are the Utilization Rates for the Web Application Usage Patterns? Usage traffic can dramatically affect the TCO of a web application. When determining TCO, you should consider the nature of the application and historical statistical data. This information can help you determine the usage pattern of the application that you plan to deploy. The calculator compares costs for three different usage patterns:
1. Steady State. The load remains at a fairly constant level over time and you can accurately forecast the likely compute load for these applications.
2. Spiky but Predictable. You can accurately forecast the likely compute load for these applications, even though usage varies by time of day, time of month, or time of year.
3. Uncertain and Unpredictable. It is difficult to forecast the compute needs for these applications because there is no historical statistical data available.
This table contains a summary of how Reserved Instances are purchased for each of the usage patterns in the calculator:
Page 5 of 13 Created On 3/12/2013 7:42:20 AM

Usage Model Baseline Workload Type of RI purchased in AWS cost calculation RI Term
Spikey Predictable 30% 30% Heavy Utilization run constantly 70% Medium Utilization run 50% of the time
3 year
Spikey Unpredictable 50% 50% Heavy Utilization run constantly 50% Medium Utilization run 50% of the time
3 year
Steady State 90% 90% Heavy Utilization run constantly 10% Medium Utilization run 50% of the time
3 year
Q: What baseline is the TCO calculator using? What utilization do you use for non-baseline workloads? A combination of Amazon EC2 instances running all the time and instances running only when needed are computed. For the spikey portion of the loads, Amazon EC2 instances are projected to be spun up and down to meet the needs of the apps based on the Usage Pattern that is selected. The table in the previous section quantifies how the baseline and non-baseline workloads are computed. Q: Why would the calculator include RIs when they require a commitment? With the introduction of the Reserved Instance Marketplace, there is flexibility to purchasing and reselling RIs which is more flexible than your options with physical infrastructure. The Reserved Instance Marketplace allows you to sell your Amazon EC2 Reserved Instances to other businesses and organizations if your needs change. Q: Do you take into account actual server utilization? Physical servers are assumed to be powered on at all times. The Usage Pattern you select is used to calculate the percentage of time that Amazon EC2 instances need to run, as described earlier in this document.
Q: How do you calculate your on-premises Server cost?
The calculator averages market rate pricing from multiple enterprise vendors to determine an average price per CPU, per GB RAM, and per GB of storage. Software licenses for operating systems and databases are included in the per-server costs displayed in the calculations.
Q: Do you apply any discounts to on-premises Server costing?
Yes, there is a user defined discount slider, which is defaulted to 15%, and applied to the industry standard pricing being calculated. Discount sliders are available within the servers configure dropdown.
Q: Is “Hardware/Software Maintenance Cost Percentage” applied to on-premises Server costing?
Yes, if you move this slider within the servers configure dropdown, you will see your cost per server change. Q: Are the AWS Server costs all On-Demand Amazon EC2 instances?
Page 6 of 13 Created On 3/12/2013 7:42:20 AM
The yearly costs for compute in AWS are a combination of Reserved Instances, based on these heuristics:
Reserved Instance Offering Types Savings over On-Demand Instances
Light Utilization Reserved Instances up to 42%( 1-year) up to 56% (3-year)
Medium Utilization Reserved Instances up to 49% (1-year) up to 66% (3-year)
Heavy Utilization Reserved Instances up to 54% (1-year) up to 71% (3-year)
Q: What AWS pricing schemes are you using? The calculator uses Heavy Utilization Reserved Instances for baseline workloads and Medium Utilization Reserved Instances for transient workloads. Q: How do you calculate the amount of used rack space for the specified on-premises servers?
The calculator uses 2 units (2U) of rack space per web and application server, and 4 units (4U) of rack space per database server. This will allow for adequate room for disks, cabling, cooling, and power.
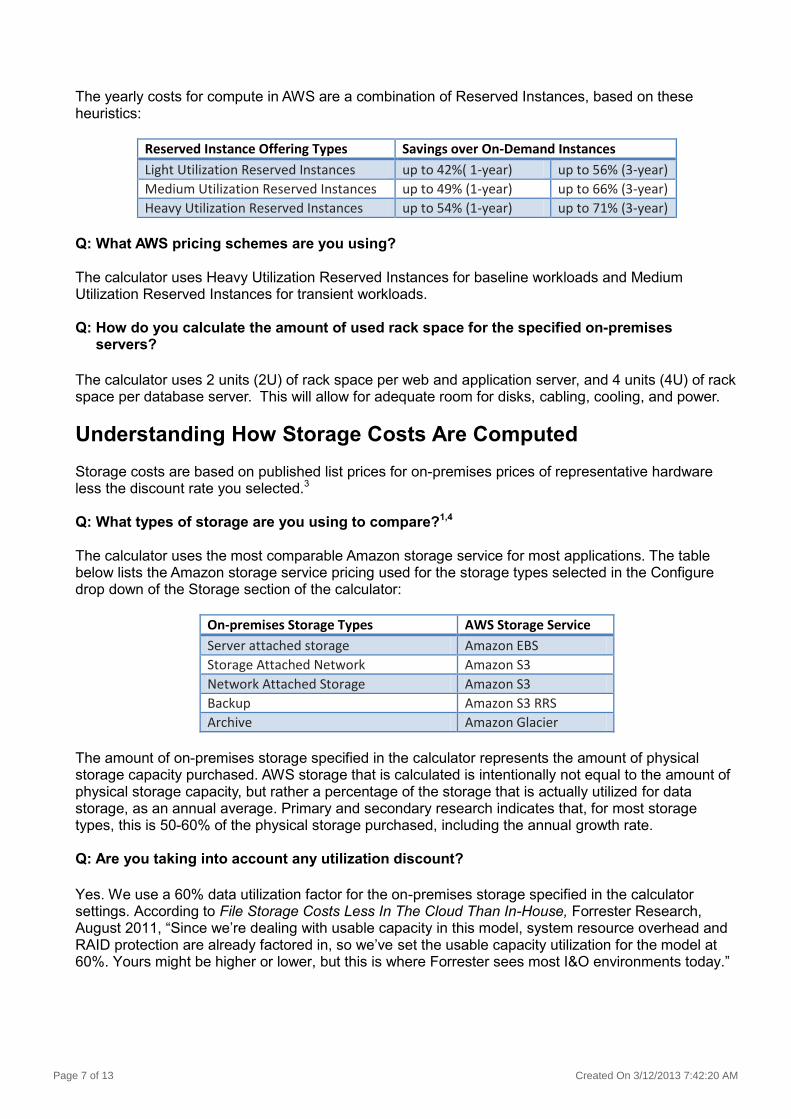
Understanding How Storage Costs Are Computed Storage costs are based on published list prices for on-premises prices of representative hardware less the discount rate you selected.3 Q: What types of storage are you using to compare?1,4 The calculator uses the most comparable Amazon storage service for most applications. The table below lists the Amazon storage service pricing used for the storage types selected in the Configure drop down of the Storage section of the calculator:
On-premises Storage Types AWS Storage Service
Server attached storage Amazon EBS
Storage Attached Network Amazon S3
Network Attached Storage Amazon S3
Backup Amazon S3 RRS
Archive Amazon Glacier
The amount of on-premises storage specified in the calculator represents the amount of physical storage capacity purchased. AWS storage that is calculated is intentionally not equal to the amount of physical storage capacity, but rather a percentage of the storage that is actually utilized for data storage, as an annual average. Primary and secondary research indicates that, for most storage types, this is 50-60% of the physical storage purchased, including the annual growth rate. Q: Are you taking into account any utilization discount?
Yes. We use a 60% data utilization factor for the on-premises storage specified in the calculator settings. According to File Storage Costs Less In The Cloud Than In-House, Forrester Research, August 2011, “Since we’re dealing with usable capacity in this model, system resource overhead and RAID protection are already factored in, so we’ve set the usable capacity utilization for the model at 60%. Yours might be higher or lower, but this is where Forrester sees most I&O environments today.”
Page 7 of 13 Created On 3/12/2013 7:42:20 AM

Note that if you need to buy capacity for high growth rates, your utilization rate will likely be lower than 60% on average, as you purchase capacity in advance of eventual growth in the data footprint.
With AWS you pay only for the storage you use. For example, if you have 100TB of data, you pay for 100TB of storage, and it’s stored, starting at $0.125/GB per month, designed for 99.999999999% durability, (or $0.01 for archiving, or $0.093 for Amazon Reduced Redundancy Storage, designed for 99.99% durability) with no operating costs.
Q: Are data transfer costs included in the AWS storage cost?
No, all AWS data transfer costs are calculated in the bandwidth details under the Network section.
Q: Are you using AWS storage Free Tier in your calculations?
No, we are not using any AWS Free Tier discounts.
Q: How are you calculating on-premises Storage costs?
We are using industry standard pricing based on GB per month. Costs also include the “Hardware/Software Maintenance Percentage” selected from the “Overall Storage” configure dropdown. Direct Attached storage is using the maintenance percentage from the servers configure dropdown. Q: Do you apply any discounts to on-premises Storage costing?
Yes, there is a user defined discount slider, which is defaulted to 50%, and applied to the industry standard pricing being calculated for all storage that is not directly attached to the servers. The discount slider is available within the “Overall Storage” configure dropdown. Direct attached storage is discounted at the server discount slider value since this storage is purchased at the same time. Q: How do you calculate the amount of rack space the specified on-premises storage uses?
We are calculating 1 unit (1U) of rack space per TB. This will allow adequate room for cabling, switches, cooling, and power. Incremental Backup Storage and Long Term Archival Storage are considered to be stored off-premises, so they are not counted in the rack space calculation. Q: How do I factor in upgrading storage annually?
The “Growth Rate” selection determines server and storage growth rates annually.
Understanding How Network Costs Are Computed Network costs are based on a number of factors in the configuration specified in the calculator. If you require a physical second site, additional network costs are included.5,6 Q: How are you calculating the number of Load Balancers?
We are using enterprise standard architectures and best practices. If you have specified 2 or more web / application servers you will have at least one load balancer. The level of “Network Redundancy” will also increase this number.
Page 8 of 13 Created On 3/12/2013 7:42:20 AM

Q: How are you calculating the number of Firewalls?
We are using enterprise standard architectures and best practices. If you have a data center, you will have a firewall per data center. The level of “Network Redundancy” will also increase this number.
Q: How are you calculating the number of Switches?
We are calculating the total number of ports required for all the computing hardware you have specified. We then take this total and determine the number of 48 port enterprise level switches that are required to connect your computing hardware.
Q: What does the “Network Redundancy” affect?
This controls a factor in the calculator, which drives the quantity of your network computing infrastructure. If you are fully-redundant, you get a “doubling” of your network computing infrastructure costs.
Q: How are you calculating bandwidth costs? We use a sampling of average market rates for datacenter telecom from major markets and assume a 50% utilization ratio. Q: How are you treating multiple telecommunication providers? It is common for larger or critical websites to buy bandwidth from multiple carriers. This is done to extend capacity, performance and reliability. AWS does this for you and so there is no additional cost for having redundant carriers. We factor a 50% increase for the 2nd carrier and an additional 10% increase for each additional carrier after the second.
Understanding How Environment Costs Are Computed Q: What is the difference between a private data center and colocation?
A private data center is a brick and mortar structure that contains all the required systems / facilities to house computing hardware running 24 x 7 x 365. A private data center is owned and operated by the owners of the computing hardware. A colocation is usually offered by a provider that owns their own “private data center” and rents out rack space and/or computing hardware. A private data center is considered a less expensive resource as businesses typically own these and the costs can be spread out over a long period of time. Q: How are you calculating cost of environment? We use the number of servers, network redundancy and amount of storage to calculate how many racks the equipment requires based on industry average footprints. We use a sample of market rates for datacenter floor space for colocation and on-premises to calculate costs per rack and multiply this by the number of racks required to house the equipment. Q: How are you calculating the number of equipment racks required?7
We calculate the total rack units required to “rack” your specified computing hardware. We then apply a rack density factor of 80% utilization. This allows for a conservative number of required racks due to the extra space needed for cooling, cabling, and power requirements.
Page 9 of 13 Created On 3/12/2013 7:42:20 AM
Q: Why is the AWS cost for environment $0? There is no cost for datacenter overhead in the AWS model. It is included in all the individual service pricing. Customers do not pay extra to use the AWS services above the actual service pricing.
Understanding How Administration Costs Are Computed A baseline of administrative costs is assumed. Additional costs may be added based on your calculator settings. Q: How do you calculate administration costs?8
According to File Storage Costs Less In The Cloud Than In-House, Forrester Research, August 2011, “for the salary, Forrester uses $120,000 as a fully loaded admin staff cost. Substitute your firm’s standard rate for modeling if you have one.” Industry research also indicates that in larger deployments, the ratio of physical or virtual servers to admins (all IT admins combined) is about 50:1. We use these two variables and the rest of the inputs of the tool to calculate the percentage administrative cost. We calculate one FTE for administration per 50 servers, with a minimum of 1/25 of an FTE. You can also adjust the administrative overhead of your environment in order to dial in appropriate costs to support your environment.
In addition to that, the Administration Overhead amount, specified as a percentage of overall physical infrastructure costs, is added to the Staffing costs under the Administration category. This represents typical admin burden that is associated with planning, purchasing, receiving, inventory, cost of capital, equipment recycling, building maintenance, and other ongoing costs associated with owning and operating infrastructure. If you are running at a smaller scale, have lower (or non-existent) SLAs, or there are other factors that would reduce your Administration costs, you may choose to modify this cost when customizing your TCO comparison.
Q: What is the AWS Server to Admin ratio? We have found a 200:1 Server to Admin ratio is appropriate when running your web apps on AWS. This is a conservative ratio based on customer engagements. Q: Why does the Maintenance Cost slider only go down to 10%? The Hardware/Software Maintenance Cost Percentage slider in the Configure drop downs for the Web/App and Database server detailed value drop downs in the calculator represent the cost of hardware maintenance and support packages plus software maintenance and support fees. It is common for the combined average cost to be between 10% and 28%, often averaging between 18% and 22%. The calculator does not allow a value lower than 10%, as that would imply that the on-premises hardware and software does not have any maintenance or support. This would not be an apples to apples comparison to AWS, which provides infrastructure services which AWS manages and maintains in their data centers. The cost of that administration is included in the price of the AWS services.
Page 10 of 13 Created On 3/12/2013 7:42:20 AM
Understanding General Topics Q: What scenario does this TCO calculator not cover? This calculator is not intended for heterogeneous web tiers and multiple hardware refresh cycles. Q: Why always use AWS Reserved Instances for utilization > 20%? 20% annual utilization is the minimum threshold where reserved instances become more cost effective than On-Demand instances. Q: Why are my quantities larger than what I selected?9 Based on your selected growth rate percentage, we apply this to your initial entries to help you plan for your expected growth this year. This percentage is being applied to all server and storage quantities. These “new” quantities are then used in all other calculations which affect network, bandwidth, environment and administrative quantities and costs. Q: Why is AWS GovCloud (US) option missing from the selection dropdown?
We currently do not import pricing information for this region.
Page 11 of 13 Created On 3/12/2013 7:42:20 AM
4. References
Additional Reading 1. The Total Cost of (Non) Ownership of Web Applications in the Cloud -
http://goo.gl/wexNo. AWS. 2012.
2. The Business Value of Amazon Web Services Accelerates over time - http://media.amazonwebservices.com/idc_aws_business_value_report_2012.pdf. AWS. 2012.
3. File Storage Costs Less In The Cloud Than In-House - http://goo.gl/0BKFg. Forrester.
August 2011.
4. Is There Best Practice For A Server To System Administrator Ratio - http://goo.gl/TI76E . Computer World. July 2010.
5. Cloudonomics, The Economics Of Cloud Computing - http://goo.gl/UQJcV . Diversity,
Limited. 2011.
6. Don’t Bring A Differentiated Knife To A Commodity Gun Fight - http://goo.gl/cFG4M . Gartner. March 2012.
7. Private Cloud Computing - http://goo.gl/XILZE . Gartner. 2012.
8. What Every CEO Needs To Know About The Cloud - http://goo.gl/K9TjG . Harvard
Business Review. November 2011.
9. Understand The True Cost Of Cloud Services - http://goo.gl/nmQG8 (Requires
Subscription) . Forrester. June 2012.
Additional References 1. AWS Economics Center - http://aws.amazon.com/economics
2. Amazon EC2 Cost Comparison Calculator - http://goo.gl/ZfucQ
3. AWS Simple Monthly Calculator - http://aws.amazon.com/calculator 4. AWS Architecture Center – http://aws.amazon.com/architecture 5. AWS Free Usage Tier – http://aws.amazon.com/free
6. AWS Documentation – http://goo.gl/FKyzd 7. Amazon EC2 Reserved Instances – http://aws.amazon.com/ec2/reserved-instances
Publish Date September 21, 2012 For more information on 2nd Watch, visit http://www.2ndwatch.com/
Powered By:
Page 12 of 13 Created On 3/12/2013 7:42:20 AM

Notices © 2012 Amazon.com, Inc., or its affiliates. This workbook and accompanying user guide is provided for informational purposes only. Amazon Web Services LLC is not responsible for any damages related to the information in these documents, which are provided “as is” without warranty of any kind, whether express, implied, or statutory. Nothing in this workbook or accompanying user guide creates any warranties or representations from Amazon Web Services LLC, its affiliates, suppliers, or licensors. This workbook and accompanying user guide do not modify the applicable terms and conditions governing your use of Amazon Web Services technologies, including the Amazon Web Services website. This workbook and accompanying user guide represents Amazon Web Services' current product offerings as of the date of issue and are subject to change without notice.
Page 13 of 13 Created On 3/12/2013 7:42:20 AM