Embed Size (px)
Citation preview

P1.3 Tornadoes in a Deceptively Small CAPE Environment: The 4/20/04 Outbreak in Illinois and Indiana
Albert E. Pietrycha* Jonathan M. Davies#, Mark Ratzer*, and Paul Merzlock*
*National Weather Service, Chicago, Illinois
#Private Meteorologist, Wichita, Kansas
1. INTRODUCTION
On the late afternoon and early evening of
20 April 2004, an outbreak of tornadoes occurred across northern Illinois and central Indiana, including an F3 tornado that killed eight people. Over a four and a half hour period, 30 tornadoes occurred from discrete ‘low-topped’ supercells that developed along a rapidly advancing warm front (Fig. 1). The storms formed in an environment where convective available potential energy (CAPE) was relatively small compared with typical tornadic supercells. Several of these supercells produced more than five tornadoes each. Some of the tornadoes could be classified as large and long tracked (e.g., 0.8 km wide with path lengths greater than 24 km).
This severe weather event was largely unanticipated and one of the more difficult outbreaks in recent history to forecast. A pattern-recognition based forecast approach suggested very low probabilities for tornadoes, given the large-scale environment sampled by conventional observational platforms early in the day. Late morning and early afternoon surface observations indicated a relatively cool, moist, stable air mass along and north of a warm front across northern Illinois and central / northern Indiana. Numerical guidance by the Rapid Update Cycle version 2 (RUC; Benjamin et al. 1998) less than six hours prior to thunderstorm initiation indicated that this stable air mass would remain in place through the afternoon and early evening hours, and offered little to suggest instability supportive of an outbreak of tornadoes. However, in retrospect, the trends and evolution of observed data, when used to
Corresponding author address: Albert Pietrycha, 333 W. University Drive Romeoville, IL 60446 Email: [email protected]
modify model forecast data, presented subtle clues that rapid air mass destabilization would occur within an already strongly sheared environment, suggesting a setting more favorable for tornadoes.
Studies such as Johns et al. (1993, see their Fig. 1) and Thompson et al. (2003, see their Fig. 6) have shown that significant tornadoes are most often associated with CAPE greater than 1000 J kg-1 when using mixed-layer lifted parcels in the lowest 100 mb (MLCAPE). However, it is also well documented in Johns et al. (1993, their Fig. 1), Rasmussen and Blanchard (1998, see their Fig. 7), and other studies that significant tornadoes can and occasionally do occur in environments with smaller MLCAPE ("small CAPE", generally less than 1000 J kg-1). Studies of tropical storm environments (e.g., McCaul 1990; 1991), and case studies of low-topped supercells in the Great Plains (e.g., Davies 1993; Markowski and Straka 2000) have certainly illustrated that tornadoes can occur in low buoyancy, high shear environments. Instability on 20 April 2004 along and near the warm front in Illinois, using buoyancy derived from RUC soundings as a proxy, could definitely be characterized as deceptively small; little or no MLCAPE was evident on unmodified RUC soundings across much of the area affected by tornadoes.
This paper is a post-analysis of the 20 April 2004 event, and will examine the synoptic setting, forecasts and analyses from RUC soundings, and evolution of observed data. Some unusual aspects of the associated thermodynamic profiles will be discussed. The conclusion section will make some suggestions for forecasters toward better diagnosis of settings that involve deceptively small CAPE and poor forecasts by model products.

2. BRIEF SYNOPTIC OVERVIEW A deep, negatively tilted, upper-level
trough was present over the central and northern plains at 1200 UTC 20 April 2004. The 1200 UTC 500 mb analysis (not shown) indicated a 50 knot speed maxima rounding the base of the upper trough, spreading from the southern Rockies into southern Kansas and Oklahoma, while farther to the northeast, an upper jet speed maxima of 110 knots was analyzed at 250 mb (not shown) over the upper Mississippi valley and western Great Lakes. Strong low-level warm air advection was occurring over northern Missouri and Iowa on the nose of a 40 knot 850 mb jet (not shown), under an area of strong upper level divergence in the right entrance region of the upper level jet streak. In response to these features, surface low pressure developed over the plains, with the 1200 UTC surface analysis (not shown) showing a 1003 mb low over Nebraska. East of the developing low, a warm front stretched across northern Missouri and southern Illinois into the lower Ohio valley. South of the warm front, dewpoint temperatures ranged 15.5-18.3ºC, while north of the front, in an area of extensive stratiform cloud cover and rain showers, dewpoints ranged 5-9ºC. The upper trough continued to deepen during the day as it translated into the middle and upper Mississippi valley, with the associated surface low deepening to 996 mb over northern Iowa by 0000 UTC 21 April 2004 (Fig. 2). At that time, the warm front extended from the low across northern Iowa into northern Illinois, northern Indiana and central Ohio.
Late that afternoon, thermodynamic and kinematic parameters were sufficient for supercell development near the warm front. In response to the deepening low, strong low-level warm advection ensued over Illinois and Indiana. As a result, the front mixed north into central Illinois and central Indiana. Visible satellite imagery (not shown) combined with surface observations indicated rapid air mass destabilization within the warm sector as skies cleared over an area of increasing dewpoint temperatures. Regional wind profilers and velocity azimuth display wind profiles from Weather Surveillance Radar-1998 (WSR-88D; Crum and Alberty 1993) near the warm front in Iowa and Illinois indicated 0-3 km storm-relative helicity (SRH; Davies-Jones et al. 1990) in excess of 360 m2 s-2. Deep layer
shear in the 0-6 km layer was greater than 40 knots. As will be shown in the following section, CAPE within the warm sector south of the warm front was on the order of 1000 J kg-1.
Thunderstorms initially formed east of the surface low immediately along and ahead of the warm front over west central Illinois after 2000 UTC. They quickly developed into discreet, low-topped, tornadic supercells near 2100 UTC. WSR-88D echo top heights were generally less than 12 km above ground level. Additional low-topped tornadic supercell thunderstorms developed from northern Illinois into central Indiana, and propagated northeast with the frontal zone. 3. RAPID UPDATE CYCLE CAPE ANALYSIS
A few hours prior to a major tornado event, sizable CAPE is commonly evident in observational data and / or forecast by short-range numerical models over the area where the event occurs. However, on 20 April 2004, CAPE appeared small or largely absent over Illinois and Indiana in the RUC forecasts during the period before convection initiation at 2100 UTC. The RUC forecasts from 1200 UTC and 1500 UTC RUC data on 20 April 2004 failed to indicate the northward advancement of the warm front and subsequent destabilization within the warm sector near the time of convection initiation. Nonetheless, as will be shown, the RUC output in conjunction with real-time observational data, were able to provide beneficial forecast information about the evolving CAPE fields.
a) Plan-view depictions
Figure 3 depicts a plan-view of the 6-hr RUC forecast of MLCAPE valid at 21 UTC on 20 April 2004 using mixed-layer lifted parcels in the lowest 100 mb. Notice that little or no MLCAPE was forecast across northern Illinois and most of central and northern Indiana. This misleading forecast of MLCAPE appeared to result from a fictitious, shallow dry layer above the surface that was not representative of observed low-level, near-saturated conditions that existed along and close to the warm front (see next section and Fig. 10).
In contrast to MLCAPE, the corresponding RUC 6-hr forecast of surface-based CAPE (SBCAPE) integrated over the lowest 3 km revealed an instability axis across central Illinois to southern Indiana, with values up to 230 J kg-1 (Fig. 4). Furthermore, forecast combinations of
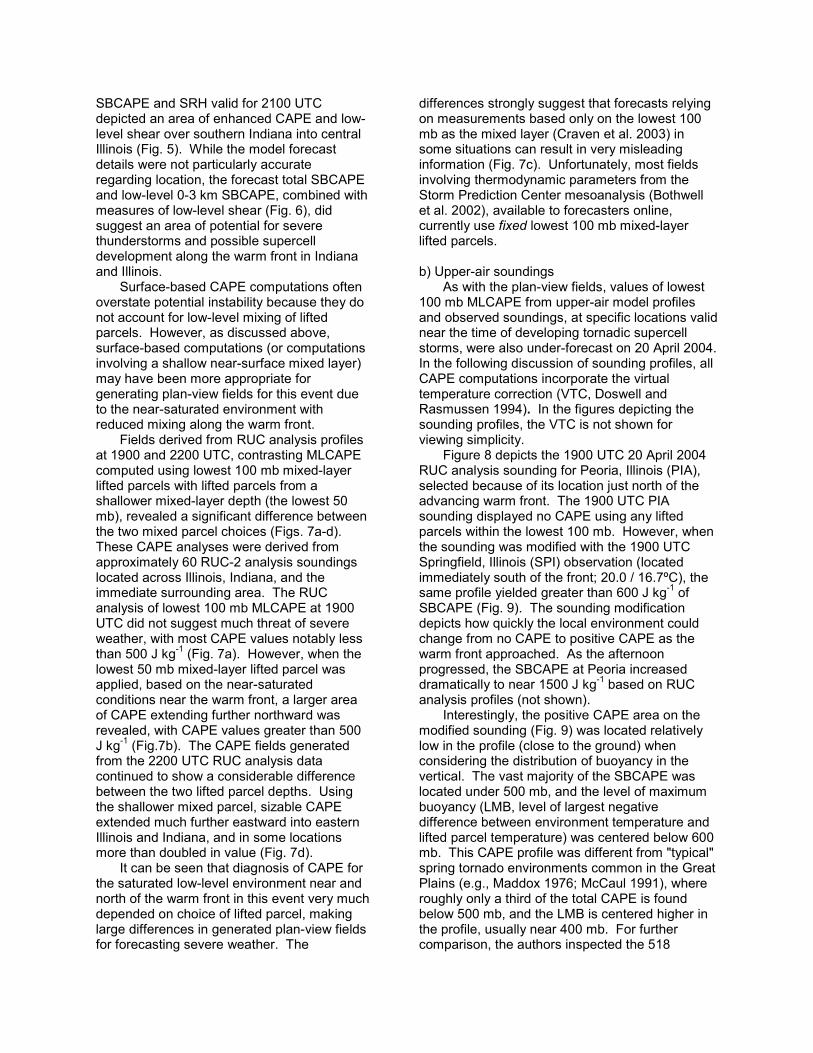
SBCAPE and SRH valid for 2100 UTC depicted an area of enhanced CAPE and low-level shear over southern Indiana into central Illinois (Fig. 5). While the model forecast details were not particularly accurate regarding location, the forecast total SBCAPE and low-level 0-3 km SBCAPE, combined with measures of low-level shear (Fig. 6), did suggest an area of potential for severe thunderstorms and possible supercell development along the warm front in Indiana and Illinois.
Surface-based CAPE computations often overstate potential instability because they do not account for low-level mixing of lifted parcels. However, as discussed above, surface-based computations (or computations involving a shallow near-surface mixed layer) may have been more appropriate for generating plan-view fields for this event due to the near-saturated environment with reduced mixing along the warm front.
Fields derived from RUC analysis profiles at 1900 and 2200 UTC, contrasting MLCAPE computed using lowest 100 mb mixed-layer lifted parcels with lifted parcels from a shallower mixed-layer depth (the lowest 50 mb), revealed a significant difference between the two mixed parcel choices (Figs. 7a-d). These CAPE analyses were derived from approximately 60 RUC-2 analysis soundings located across Illinois, Indiana, and the immediate surrounding area. The RUC analysis of lowest 100 mb MLCAPE at 1900 UTC did not suggest much threat of severe weather, with most CAPE values notably less than 500 J kg-1 (Fig. 7a). However, when the lowest 50 mb mixed-layer lifted parcel was applied, based on the near-saturated conditions near the warm front, a larger area of CAPE extending further northward was revealed, with CAPE values greater than 500 J kg-1 (Fig.7b). The CAPE fields generated from the 2200 UTC RUC analysis data continued to show a considerable difference between the two lifted parcel depths. Using the shallower mixed parcel, sizable CAPE extended much further eastward into eastern Illinois and Indiana, and in some locations more than doubled in value (Fig. 7d).
It can be seen that diagnosis of CAPE for the saturated low-level environment near and north of the warm front in this event very much depended on choice of lifted parcel, making large differences in generated plan-view fields for forecasting severe weather. The
differences strongly suggest that forecasts relying on measurements based only on the lowest 100 mb as the mixed layer (Craven et al. 2003) in some situations can result in very misleading information (Fig. 7c). Unfortunately, most fields involving thermodynamic parameters from the Storm Prediction Center mesoanalysis (Bothwell et al. 2002), available to forecasters online, currently use fixed lowest 100 mb mixed-layer lifted parcels.
b) Upper-air soundings
As with the plan-view fields, values of lowest 100 mb MLCAPE from upper-air model profiles and observed soundings, at specific locations valid near the time of developing tornadic supercell storms, were also under-forecast on 20 April 2004. In the following discussion of sounding profiles, all CAPE computations incorporate the virtual temperature correction (VTC, Doswell and Rasmussen 1994). In the figures depicting the sounding profiles, the VTC is not shown for viewing simplicity.
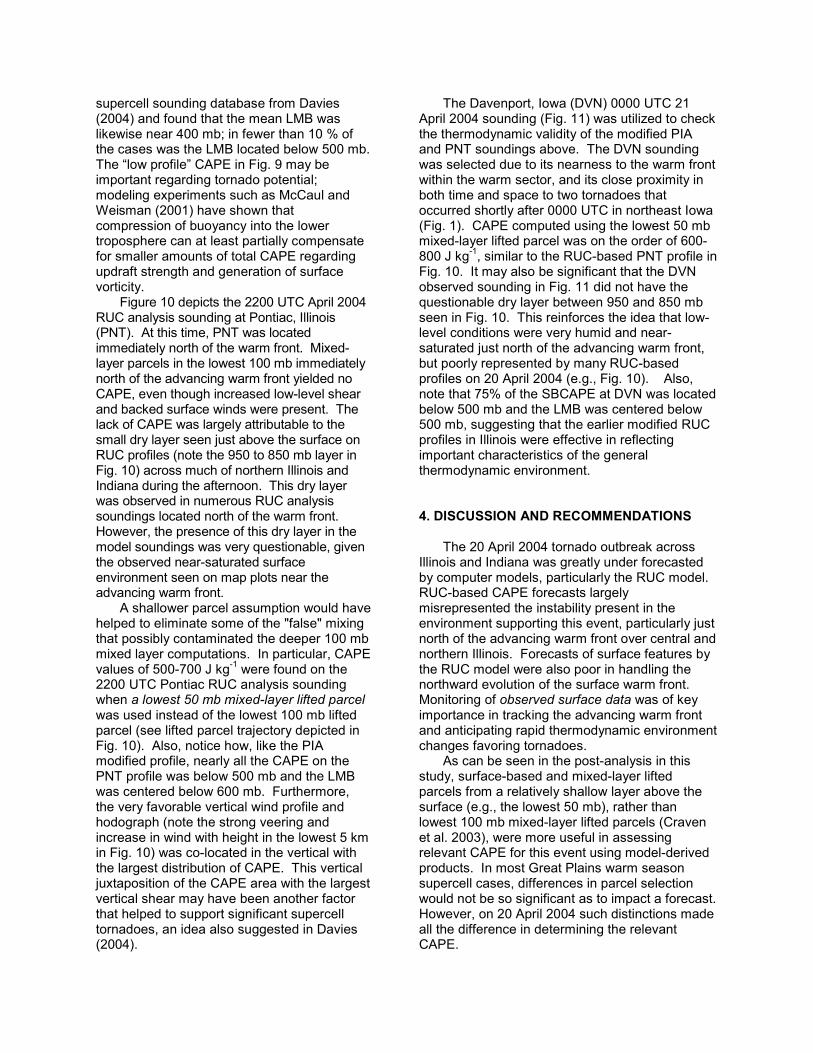
Figure 8 depicts the 1900 UTC 20 April 2004 RUC analysis sounding for Peoria, Illinois (PIA), selected because of its location just north of the advancing warm front. The 1900 UTC PIA sounding displayed no CAPE using any lifted parcels within the lowest 100 mb. However, when the sounding was modified with the 1900 UTC Springfield, Illinois (SPI) observation (located immediately south of the front; 20.0 / 16.7ºC), the same profile yielded greater than 600 J kg-1 of SBCAPE (Fig. 9). The sounding modification depicts how quickly the local environment could change from no CAPE to positive CAPE as the warm front approached. As the afternoon progressed, the SBCAPE at Peoria increased dramatically to near 1500 J kg-1 based on RUC analysis profiles (not shown).
Interestingly, the positive CAPE area on the modified sounding (Fig. 9) was located relatively low in the profile (close to the ground) when considering the distribution of buoyancy in the vertical. The vast majority of the SBCAPE was located under 500 mb, and the level of maximum buoyancy (LMB, level of largest negative difference between environment temperature and lifted parcel temperature) was centered below 600 mb. This CAPE profile was different from "typical" spring tornado environments common in the Great Plains (e.g., Maddox 1976; McCaul 1991), where roughly only a third of the total CAPE is found below 500 mb, and the LMB is centered higher in the profile, usually near 400 mb. For further comparison, the authors inspected the 518
supercell sounding database from Davies (2004) and found that the mean LMB was likewise near 400 mb; in fewer than 10 % of the cases was the LMB located below 500 mb. The “low profile” CAPE in Fig. 9 may be important regarding tornado potential; modeling experiments such as McCaul and Weisman (2001) have shown that compression of buoyancy into the lower troposphere can at least partially compensate for smaller amounts of total CAPE regarding updraft strength and generation of surface vorticity.
Figure 10 depicts the 2200 UTC April 2004 RUC analysis sounding at Pontiac, Illinois (PNT). At this time, PNT was located immediately north of the warm front. Mixed-layer parcels in the lowest 100 mb immediately north of the advancing warm front yielded no CAPE, even though increased low-level shear and backed surface winds were present. The lack of CAPE was largely attributable to the small dry layer seen just above the surface on RUC profiles (note the 950 to 850 mb layer in Fig. 10) across much of northern Illinois and Indiana during the afternoon. This dry layer was observed in numerous RUC analysis soundings located north of the warm front. However, the presence of this dry layer in the model soundings was very questionable, given the observed near-saturated surface environment seen on map plots near the advancing warm front.
A shallower parcel assumption would have helped to eliminate some of the "false" mixing that possibly contaminated the deeper 100 mb mixed layer computations. In particular, CAPE values of 500-700 J kg-1 were found on the 2200 UTC Pontiac RUC analysis sounding when a lowest 50 mb mixed-layer lifted parcel was used instead of the lowest 100 mb lifted parcel (see lifted parcel trajectory depicted in Fig. 10). Also, notice how, like the PIA modified profile, nearly all the CAPE on the PNT profile was below 500 mb and the LMB was centered below 600 mb. Furthermore, the very favorable vertical wind profile and hodograph (note the strong veering and increase in wind with height in the lowest 5 km in Fig. 10) was co-located in the vertical with the largest distribution of CAPE. This vertical juxtaposition of the CAPE area with the largest vertical shear may have been another factor that helped to support significant supercell tornadoes, an idea also suggested in Davies (2004).
The Davenport, Iowa (DVN) 0000 UTC 21 April 2004 sounding (Fig. 11) was utilized to check the thermodynamic validity of the modified PIA and PNT soundings above. The DVN sounding was selected due to its nearness to the warm front within the warm sector, and its close proximity in both time and space to two tornadoes that occurred shortly after 0000 UTC in northeast Iowa (Fig. 1). CAPE computed using the lowest 50 mb mixed-layer lifted parcel was on the order of 600-800 J kg-1, similar to the RUC-based PNT profile in Fig. 10. It may also be significant that the DVN observed sounding in Fig. 11 did not have the questionable dry layer between 950 and 850 mb seen in Fig. 10. This reinforces the idea that low-level conditions were very humid and near-saturated just north of the advancing warm front, but poorly represented by many RUC-based profiles on 20 April 2004 (e.g., Fig. 10). Also, note that 75% of the SBCAPE at DVN was located below 500 mb and the LMB was centered below 500 mb, suggesting that the earlier modified RUC profiles in Illinois were effective in reflecting important characteristics of the general thermodynamic environment. 4. DISCUSSION AND RECOMMENDATIONS
The 20 April 2004 tornado outbreak across
Illinois and Indiana was greatly under forecasted by computer models, particularly the RUC model. RUC-based CAPE forecasts largely misrepresented the instability present in the environment supporting this event, particularly just north of the advancing warm front over central and northern Illinois. Forecasts of surface features by the RUC model were also poor in handling the northward evolution of the surface warm front. Monitoring of observed surface data was of key importance in tracking the advancing warm front and anticipating rapid thermodynamic environment changes favoring tornadoes.
As can be seen in the post-analysis in this study, surface-based and mixed-layer lifted parcels from a relatively shallow layer above the surface (e.g., the lowest 50 mb), rather than lowest 100 mb mixed-layer lifted parcels (Craven et al. 2003), were more useful in assessing relevant CAPE for this event using model-derived products. In most Great Plains warm season supercell cases, differences in parcel selection would not be so significant as to impact a forecast. However, on 20 April 2004 such distinctions made all the difference in determining the relevant CAPE.
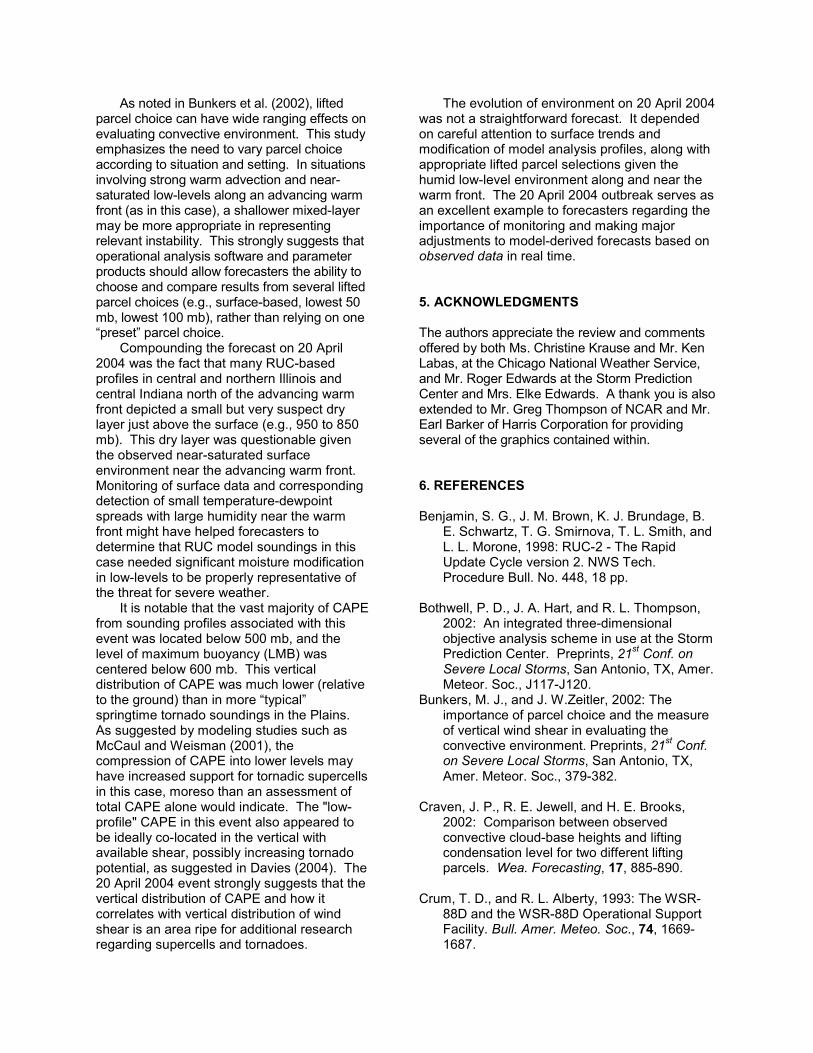
As noted in Bunkers et al. (2002), lifted parcel choice can have wide ranging effects on evaluating convective environment. This study emphasizes the need to vary parcel choice according to situation and setting. In situations involving strong warm advection and near-saturated low-levels along an advancing warm front (as in this case), a shallower mixed-layer may be more appropriate in representing relevant instability. This strongly suggests that operational analysis software and parameter products should allow forecasters the ability to choose and compare results from several lifted parcel choices (e.g., surface-based, lowest 50 mb, lowest 100 mb), rather than relying on one “preset” parcel choice.
Compounding the forecast on 20 April 2004 was the fact that many RUC-based profiles in central and northern Illinois and central Indiana north of the advancing warm front depicted a small but very suspect dry layer just above the surface (e.g., 950 to 850 mb). This dry layer was questionable given the observed near-saturated surface environment near the advancing warm front. Monitoring of surface data and corresponding detection of small temperature-dewpoint spreads with large humidity near the warm front might have helped forecasters to determine that RUC model soundings in this case needed significant moisture modification in low-levels to be properly representative of the threat for severe weather.
It is notable that the vast majority of CAPE from sounding profiles associated with this event was located below 500 mb, and the level of maximum buoyancy (LMB) was centered below 600 mb. This vertical distribution of CAPE was much lower (relative to the ground) than in more “typical” springtime tornado soundings in the Plains. As suggested by modeling studies such as McCaul and Weisman (2001), the compression of CAPE into lower levels may have increased support for tornadic supercells in this case, moreso than an assessment of total CAPE alone would indicate. The "low-profile" CAPE in this event also appeared to be ideally co-located in the vertical with available shear, possibly increasing tornado potential, as suggested in Davies (2004). The 20 April 2004 event strongly suggests that the vertical distribution of CAPE and how it correlates with vertical distribution of wind shear is an area ripe for additional research regarding supercells and tornadoes.
The evolution of environment on 20 April 2004 was not a straightforward forecast. It depended on careful attention to surface trends and modification of model analysis profiles, along with appropriate lifted parcel selections given the humid low-level environment along and near the warm front. The 20 April 2004 outbreak serves as an excellent example to forecasters regarding the importance of monitoring and making major adjustments to model-derived forecasts based on observed data in real time.
5. ACKNOWLEDGMENTS The authors appreciate the review and comments offered by both Ms. Christine Krause and Mr. Ken Labas, at the Chicago National Weather Service, and Mr. Roger Edwards at the Storm Prediction Center and Mrs. Elke Edwards. A thank you is also extended to Mr. Greg Thompson of NCAR and Mr. Earl Barker of Harris Corporation for providing several of the graphics contained within. 6. REFERENCES Benjamin, S. G., J. M. Brown, K. J. Brundage, B.
E. Schwartz, T. G. Smirnova, T. L. Smith, and L. L. Morone, 1998: RUC-2 - The Rapid Update Cycle version 2. NWS Tech. Procedure Bull. No. 448, 18 pp.
Bothwell, P. D., J. A. Hart, and R. L. Thompson,
2002: An integrated three-dimensional objective analysis scheme in use at the Storm Prediction Center. Preprints, 21st Conf. on Severe Local Storms, San Antonio, TX, Amer. Meteor. Soc., J117-J120.
Bunkers, M. J., and J. W.Zeitler, 2002: The importance of parcel choice and the measure of vertical wind shear in evaluating the convective environment. Preprints, 21st Conf. on Severe Local Storms, San Antonio, TX, Amer. Meteor. Soc., 379-382.
Craven, J. P., R. E. Jewell, and H. E. Brooks,
2002: Comparison between observed convective cloud-base heights and lifting condensation level for two different lifting parcels. Wea. Forecasting, 17, 885-890.
Crum, T. D., and R. L. Alberty, 1993: The WSR-
88D and the WSR-88D Operational Support Facility. Bull. Amer. Meteo. Soc., 74, 1669-1687.
Davies, J. M., 1990: Small tornadic supercells
in the Central Plains. Preprints, 17th Conf. on Severe Local Storms, St. Louis, MO, Amer. Meteor. Soc., 305-309.
_____, 2004: Estimations of CIN and LFC
associated with tornadic and nontornadic supercells. Wea. Forecasting, 19, 714-726.
Davies-Jones, R. P., D. Burgess, and M.
Foster, 1990: Test of helicity as a tornado forecast parameter. Preprints, 16th Conf. on Severe Local Storms, Kananaskis Park, AB, Canada, Amer. Meteor. Soc., 588-592.
Doswell, C. A. III, and E. N. Rasmussen,
1994: The effect of neglecting the virtual temperature correction on CAPE calculations. Wea. Forecasting, 9, 619-623.
Johns, R. H., J. M. Davies, and P. W.
Leftwich, 1993: Some wind and instability parameters associated with strong and violent tornadoes. 2. Variations in the combinations of wind and instability parameters. The Tornado: Its Structure, Dynamics, Prediction, and Hazards, Geophys. Monogr., No. 79, Amer. Geophys. Union, 583-590.
Maddox, R. A., 1976: An evaluation of tornado
proximity wind and stability data. Mon. Wea. Rev., 104, 133-142.
Markowski, P. M., and J. M. Straka, 2000: Some
observations of rotating updrafts in a low- buoyancy, highly sheared environment. Mon. Wea. Rev., 128, 449-461.
McCaul, E. W., Jr., 1991: Buoyancy and shear
characteristics of hurricane tornado environments. Mon. Wea. Rev., 119, 1954-1978.
_____, 1993: Observations and simulations of
hurricane-spawned tornadic storms. The Tornado: Its Structure, Dynamics, Prediction, and Hazards, Geophys. Monogr., No. 79, Amer. Geophys. Union, 119-142.
_____, and M. L. Weisman, 2001: The sensitivity
of simulated supercell structure and intensity to variations in the shapes of environmental buoyancy and shear profiles. Mon. Wea. Rev., 129, 664–687.
Rasmussen, E. N., and D. O. Blanchard, 1998: A
baseline climatology of sounding-derived supercell and tornado forecast parameters. Wea. Forecasting, 13, 1148-1164.
Thompson, R. L., R. Edwards, J. A. Hart, K. L.
Elmore, and P. Markowski, 2003: Close proximity soundings within supercell environments obtained from the Rapid Update Cycle. Wea. Forecasting, 18, 1243–1261.

Fig. 1. Locations of soundings mentioned in text. The asterisk denotes the approximate starting locations of the 30 tornadoes.
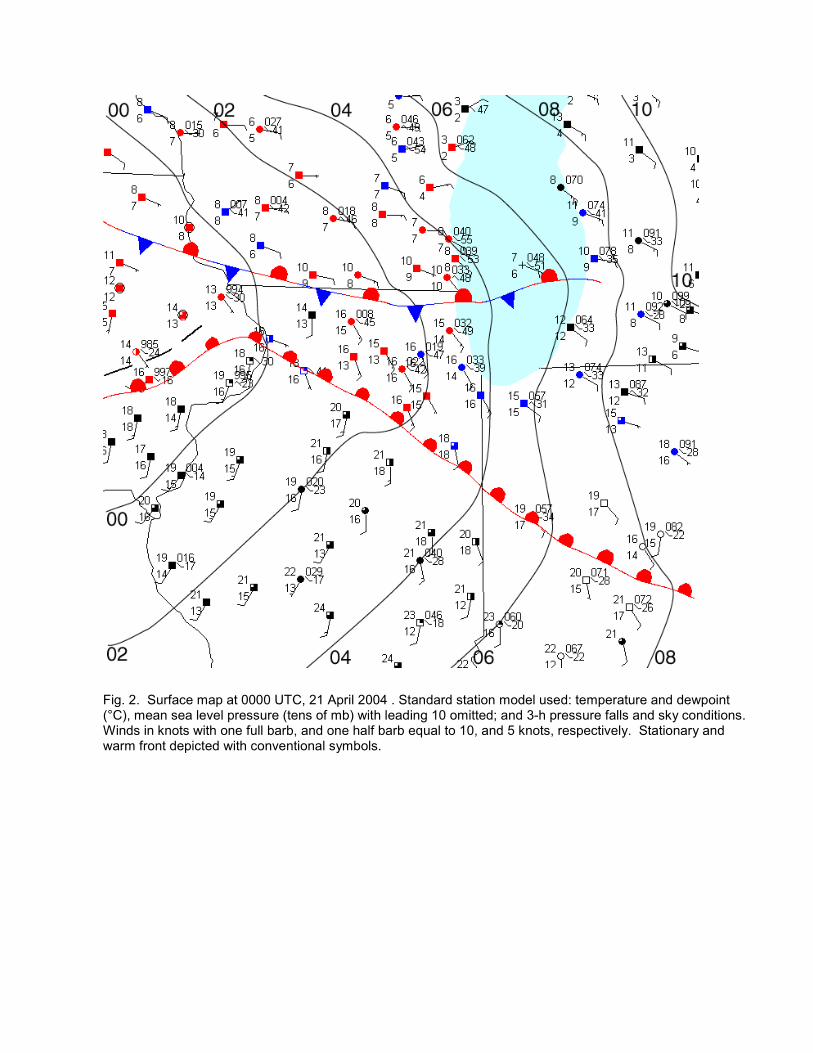
Fig. 2. Surface map at 0000 UTC, 21 April 2004 . Standard station model used: temperature and dewpoint (°C), mean sea level pressure (tens of mb) with leading 10 omitted; and 3-h pressure falls and sky conditions. Winds in knots with one full barb, and one half barb equal to 10, and 5 knots, respectively. Stationary and warm front depicted with conventional symbols.

Fig. 3. RUC 6-hr forecast of CAPE using lifted mixed-layer parcels in the lowest 100 mb, valid 2100 UTC, 20 April 2004.
Fig. 4. RUC 6-hr forecast of 0-3 km surface-based CAPE, valid 2100 UTC, 20 April 2004.
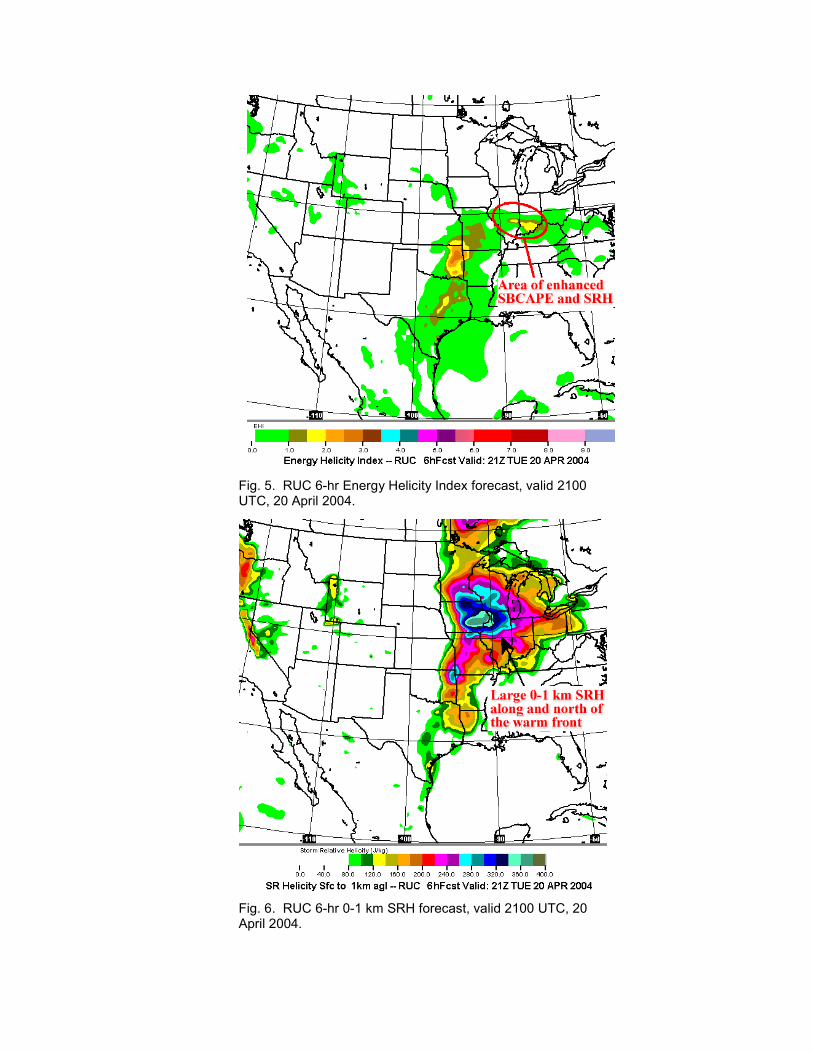
Fig. 5. RUC 6-hr Energy Helicity Index forecast, valid 2100 UTC, 20 April 2004.
Fig. 6. RUC 6-hr 0-1 km SRH forecast, valid 2100 UTC, 20 April 2004.

Figure 7. (a). Generated RUC CAPE fields using the lowest 100 mb mean parcels, valid for 1900 UTC, 20 April 2004. (b) as in (a) but using the lowest 50 mb mean parcels. (c) as in (a) but for 2200 UTC. (d) as in (b) but for 2200 UTC.

Figure 8. Skew-T log p diagram depicting the Peoria, Illinois RUC analysis at 1900 UTC, 20 April 2004. Winds as in Fig. 2.
Figure 9. As in Fig. 8 except modified using a surface parcel of temperature of 20.0ºC and a dewpoint temperature of 16.7ºC.

Figure 10. As in Fig. 8 except at Pontiac, Illinois at 2200 UTC, 20 April 2004. Note the shallow, dry layer of air immediately above the surface.
Figure 11. Skew-T log p diagram depicting the 0000 UTC, 21 April 2004 Davenport, Iowa sounding. Winds as in Fig. 2.