Embed Size (px)
Citation preview
Copyright © 2013 The Brattle Group, Inc.
Topology Control Algorithms (TCA) Simulations in PJM Day Ahead Market and Outage Coordination
Pablo A. Ruiz, Michael Caramanis, Evgeniy Goldis, David Hislop, Bhavana Keshavamurthy, Xiaoguang Li, Daniel Moscovitz, Russ Philbrick, Alex Rudkevich, Richard Tabors, Bruce Tsuchida
Techn ica l Con fe rence On Inc reas ing Rea l - T ime And Day-Ahead Marke t E f f ic iency Th rough Improved So f twareFERC, Docket No . AD10-12 -006Wash i n gt on DCJune 24 , 2015
| brattle.com1
Topology Control Algorithms (TCA)
▀ Motivation and Objectives
▀ Illustration of Topology Control
▀ ARPA‐E TCA Project
▀ Applications to Outage Coordination and Op. Guide Development
▀ Simulation Results on PJM DA Markets – Limited Switchable Set
▀ Concluding Remarks
▀ Appendix: TCA Simulation on PJM RT Markets – Full Switchable Set
Agenda
| brattle.com2
Motivation and Objectives
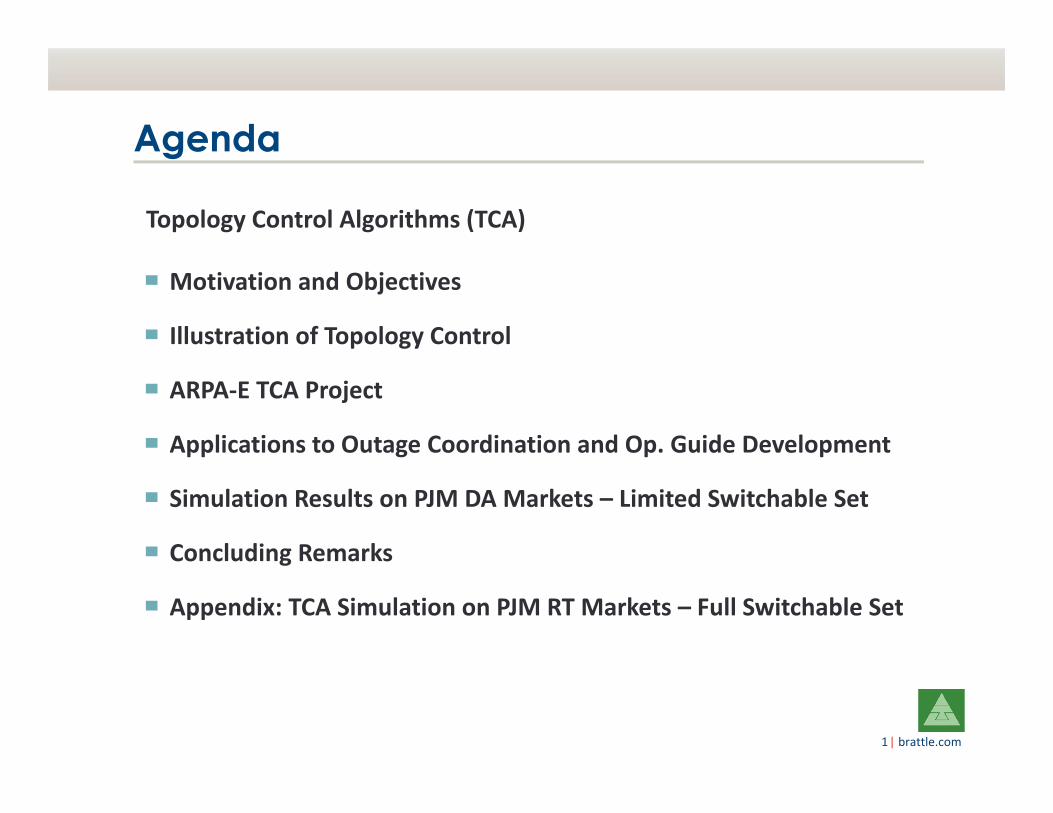
Congestion in Power Markets: PJM
In the course of a day, congestion patterns and prices can change significantly:− Fuel diversity− Lack of flexibility in the resource mix Having the ability to dynamically increase transfer capability from low price areas to high price areas will help to relieve congestion, improve dispatch of renewable resources, reduce dispatch costs and increase system flexibility.
18‐Jul‐2013 15:30
18‐Jul‐2013 12:2018‐Jul‐2013 11:55
| brattle.com3
Motivation and Objectives
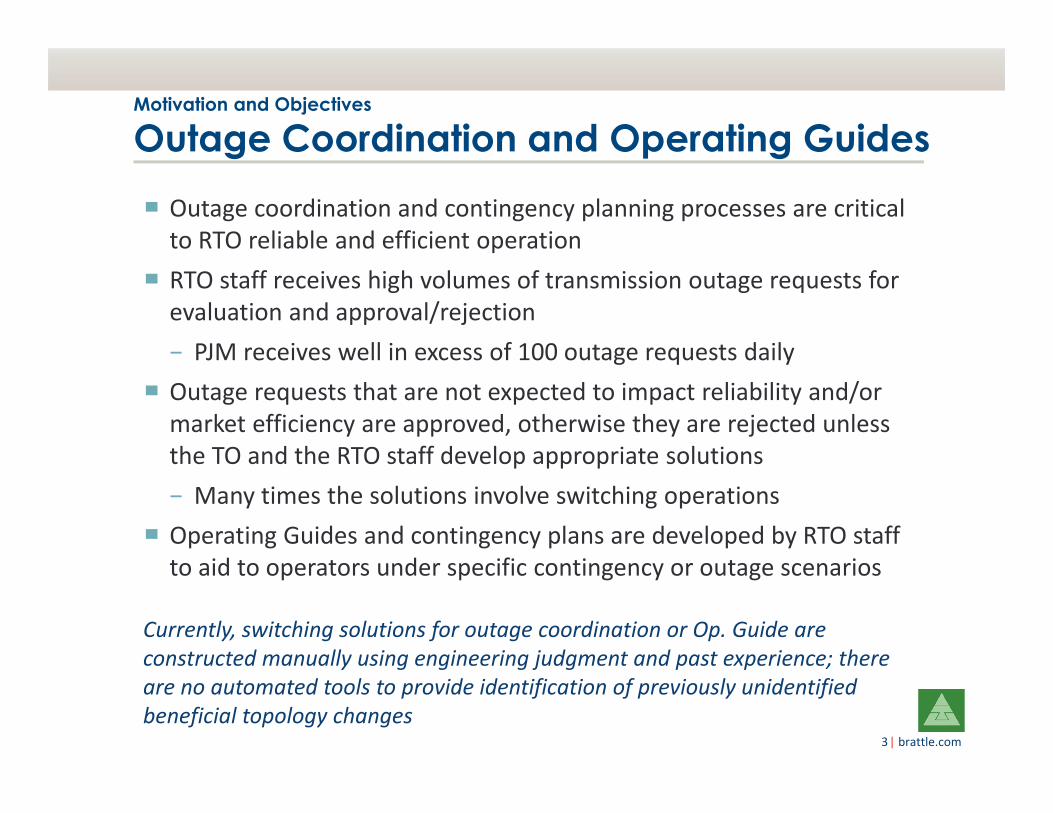
Outage Coordination and Operating Guides▀ Outage coordination and contingency planning processes are critical to RTO reliable and efficient operation
▀ RTO staff receives high volumes of transmission outage requests for evaluation and approval/rejection − PJM receives well in excess of 100 outage requests daily
▀ Outage requests that are not expected to impact reliability and/or market efficiency are approved, otherwise they are rejected unless the TO and the RTO staff develop appropriate solutions− Many times the solutions involve switching operations
▀ Operating Guides and contingency plans are developed by RTO staff to aid to operators under specific contingency or outage scenarios
Currently, switching solutions for outage coordination or Op. Guide are constructed manually using engineering judgment and past experience; there are no automated tools to provide identification of previously unidentified beneficial topology changes
| brattle.com4
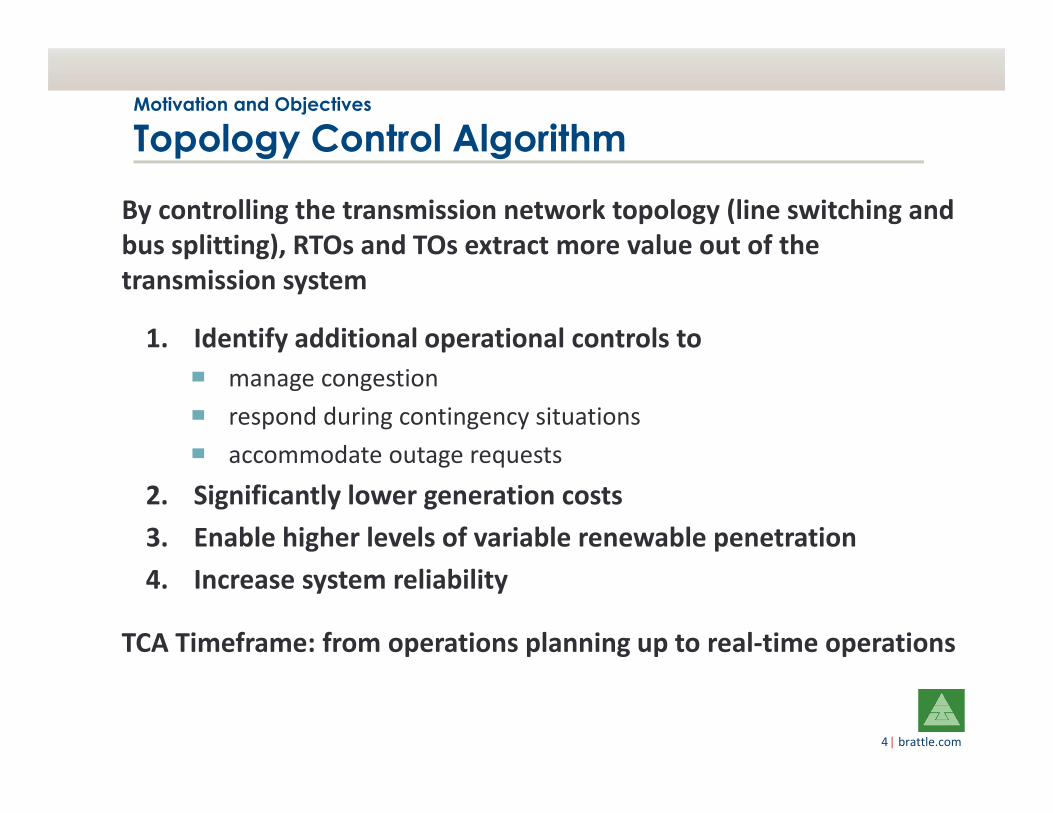
By controlling the transmission network topology (line switching and bus splitting), RTOs and TOs extract more value out of the transmission system
1. Identify additional operational controls to▀ manage congestion ▀ respond during contingency situations▀ accommodate outage requests
2. Significantly lower generation costs 3. Enable higher levels of variable renewable penetration4. Increase system reliability
TCA Timeframe: from operations planning up to real‐time operations
Motivation and Objectives
Topology Control Algorithm
| brattle.com5
Illustration of Topology Control
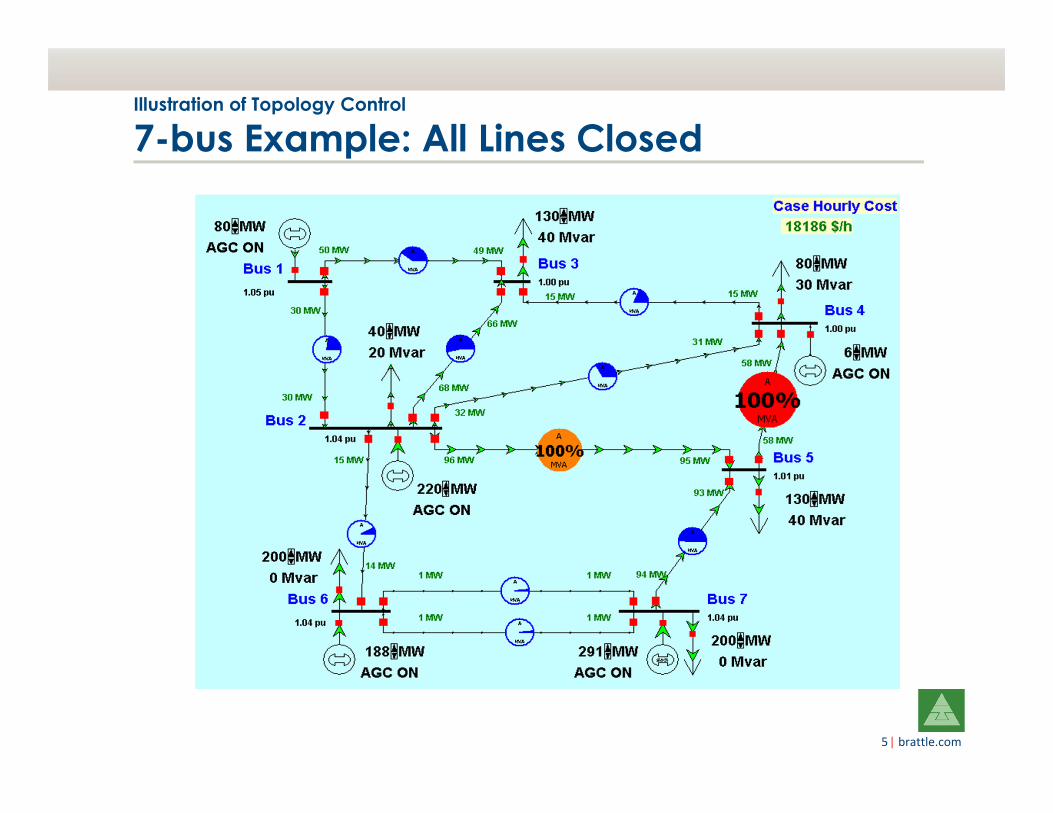
7-bus Example: All Lines Closed
| brattle.com6
Illustration of Topology Control
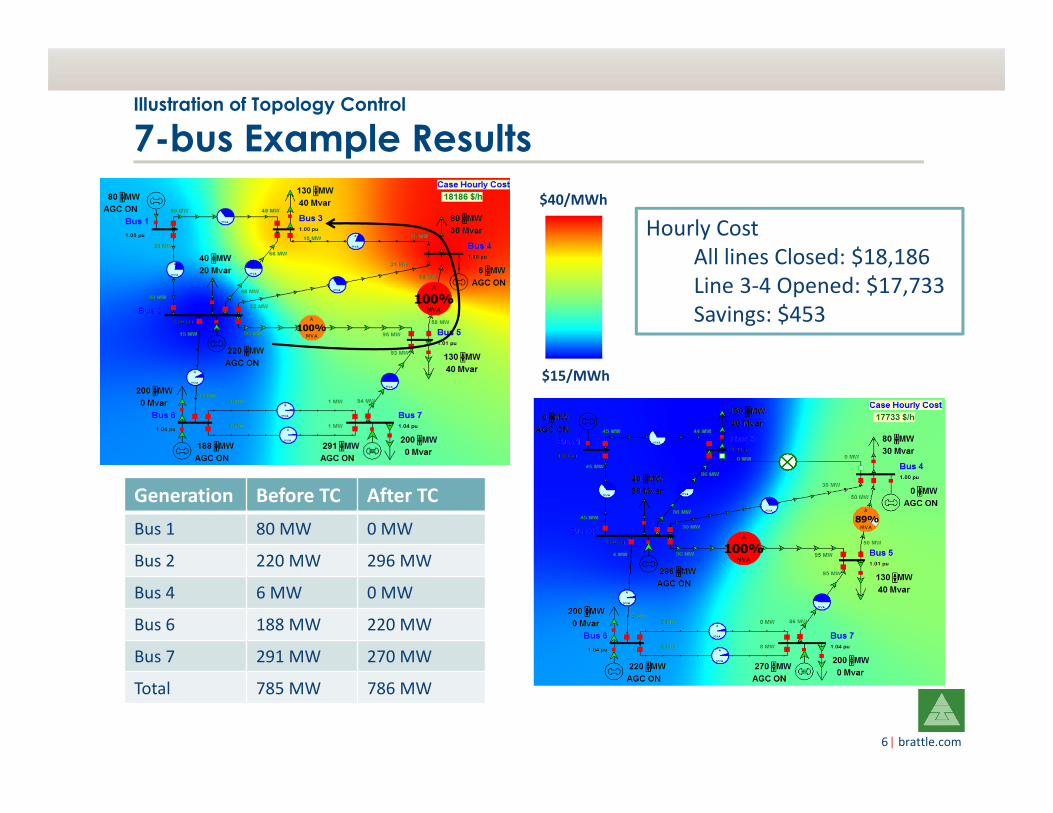
7-bus Example Results$40/MWh
$15/MWh
Hourly CostAll lines Closed: $18,186 Line 3‐4 Opened: $17,733 Savings: $453
Generation Before TC After TCBus 1 80 MW 0 MW
Bus 2 220 MW 296 MW
Bus 4 6 MW 0 MW
Bus 6 188 MW 220 MW
Bus 7 291 MW 270 MW
Total 785 MW 786 MW
| brattle.com7
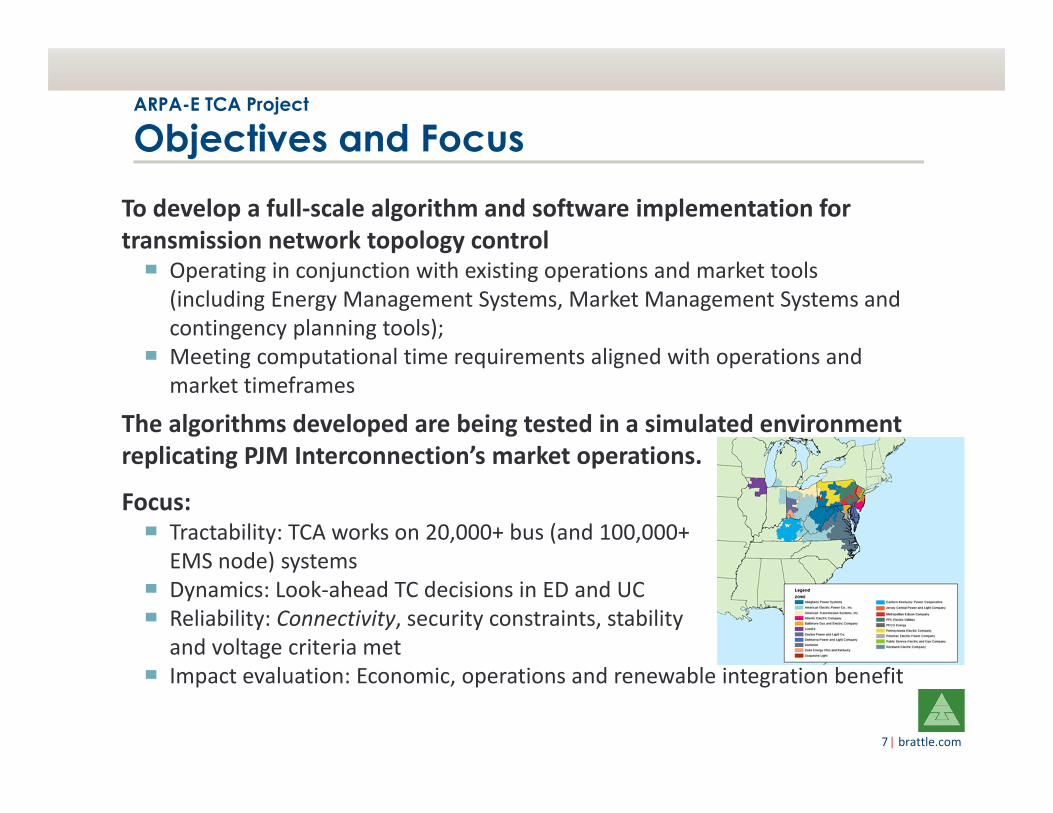
To develop a full‐scale algorithm and software implementation for transmission network topology control
▀ Operating in conjunction with existing operations and market tools (including Energy Management Systems, Market Management Systems and contingency planning tools);
▀ Meeting computational time requirements aligned with operations and market timeframes
The algorithms developed are being tested in a simulated environment replicating PJM Interconnection’s market operations.
Focus:▀ Tractability: TCA works on 20,000+ bus (and 100,000+ EMS node) systems
▀ Dynamics: Look‐ahead TC decisions in ED and UC▀ Reliability: Connectivity, security constraints, stability and voltage criteria met
▀ Impact evaluation: Economic, operations and renewable integration benefit
ARPA-E TCA Project
Objectives and Focus
| brattle.com8
ARPA-E TCA Project
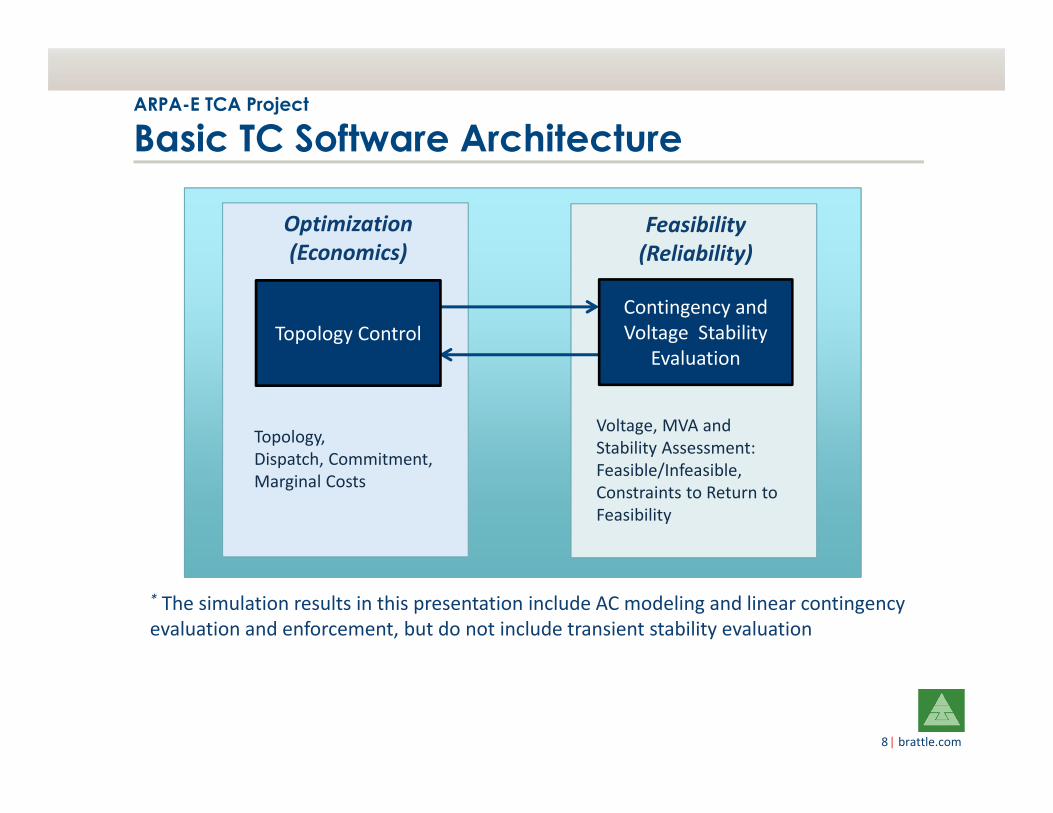
Basic TC Software Architecture
Topology Control Contingency and Voltage Stability
Evaluation
Voltage, MVA and Stability Assessment: Feasible/Infeasible, Constraints to Return to Feasibility
Topology, Dispatch, Commitment, Marginal Costs
* The simulation results in this presentation include AC modeling and linear contingency evaluation and enforcement, but do not include transient stability evaluation
Optimization(Economics)
Feasibility (Reliability)
| brattle.com9
TCA in Outage Coordination & Op. Guide Development
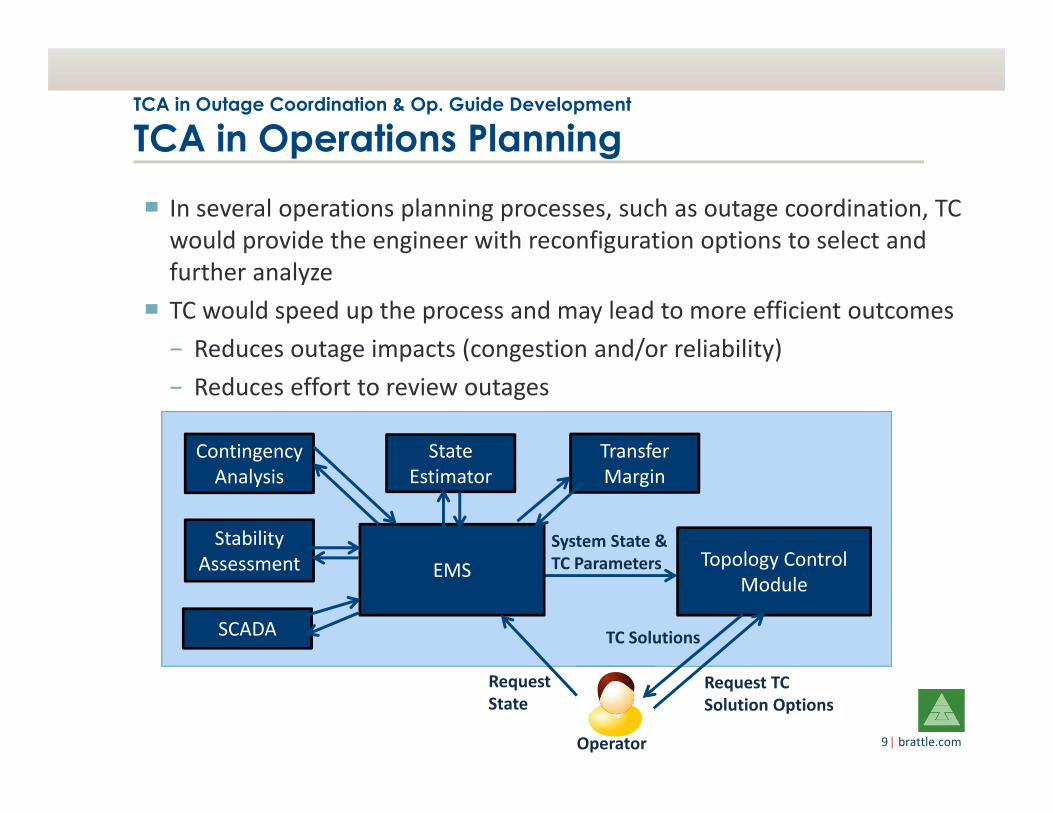
TCA in Operations Planning▀ In several operations planning processes, such as outage coordination, TC would provide the engineer with reconfiguration options to select and further analyze
▀ TC would speed up the process and may lead to more efficient outcomes− Reduces outage impacts (congestion and/or reliability)− Reduces effort to review outages
EMS Topology Control Module
Request TC Solution Options
System State & TC Parameters
SCADA
Transfer Margin
Stability Assessment
Contingency Analysis
State Estimator
TC Solutions
Request State
Operator
| brattle.com10
TCA in Outage Coordination & Op. Guide Development
Stress Test – 500 kV Facility Overload Relief▀ We simulated a 300 MW overload on an important contingency constraint of a 500 kV branch by reducing the facility rating on a recent (July 2014) system snapshot
▀ In this analysis, transmission topology was the only variable allowed to be modified to relieve the induced overload – fixed dispatch
▀ TCA identified a collection of potential switching solutions, which included between 1 and 5 switching actions
▀ The potential solutions were tested by PJM staff on the EMS model▀ Solutions were able to relieve the overload without causing other post‐ or pre‐contingency violations
▀ Relieving a large overload on a 500 kV facility required removingother 500 kV facilities from service, to force power flow away from the overloaded branch
| brattle.com11
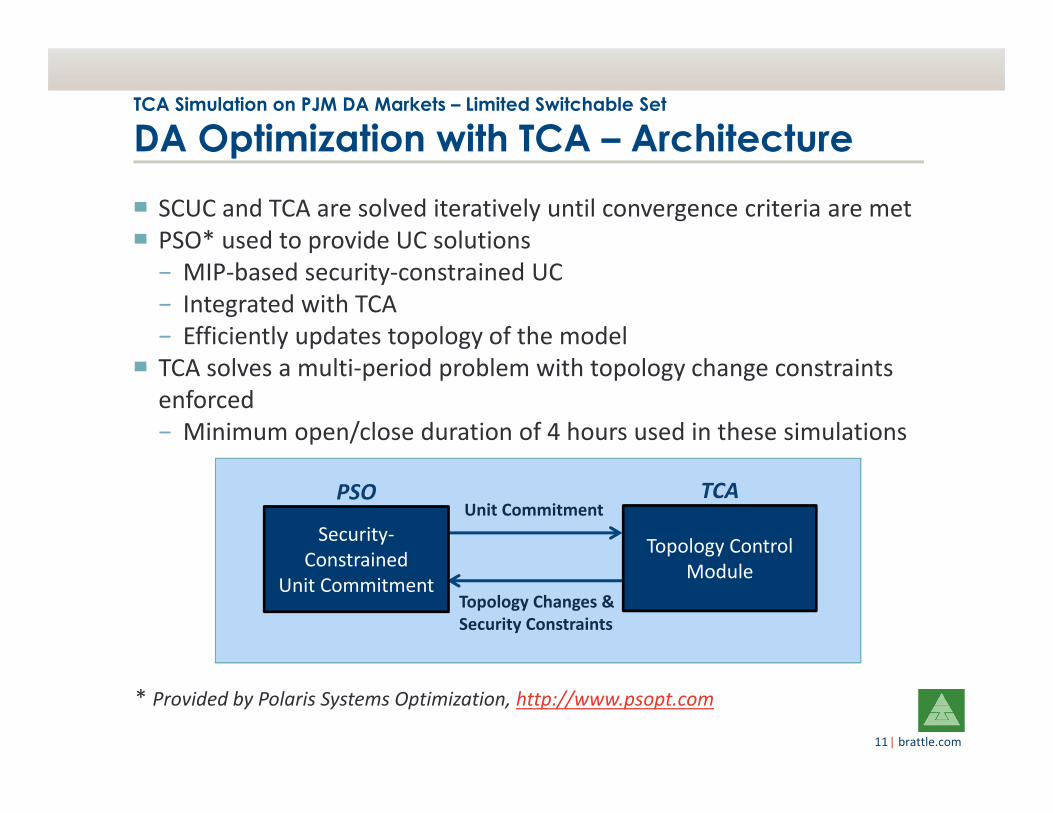
▀ SCUC and TCA are solved iteratively until convergence criteria are met▀ PSO* used to provide UC solutions− MIP‐based security‐constrained UC− Integrated with TCA− Efficiently updates topology of the model
▀ TCA solves a multi‐period problem with topology change constraints enforced− Minimum open/close duration of 4 hours used in these simulations
* Provided by Polaris Systems Optimization, http://www.psopt.com
TCA Simulation on PJM DA Markets – Limited Switchable Set
DA Optimization with TCA – Architecture
Security‐Constrained
Unit Commitment
Topology Control Module
Topology Changes & Security Constraints
Unit CommitmentPSO TCA
| brattle.com12
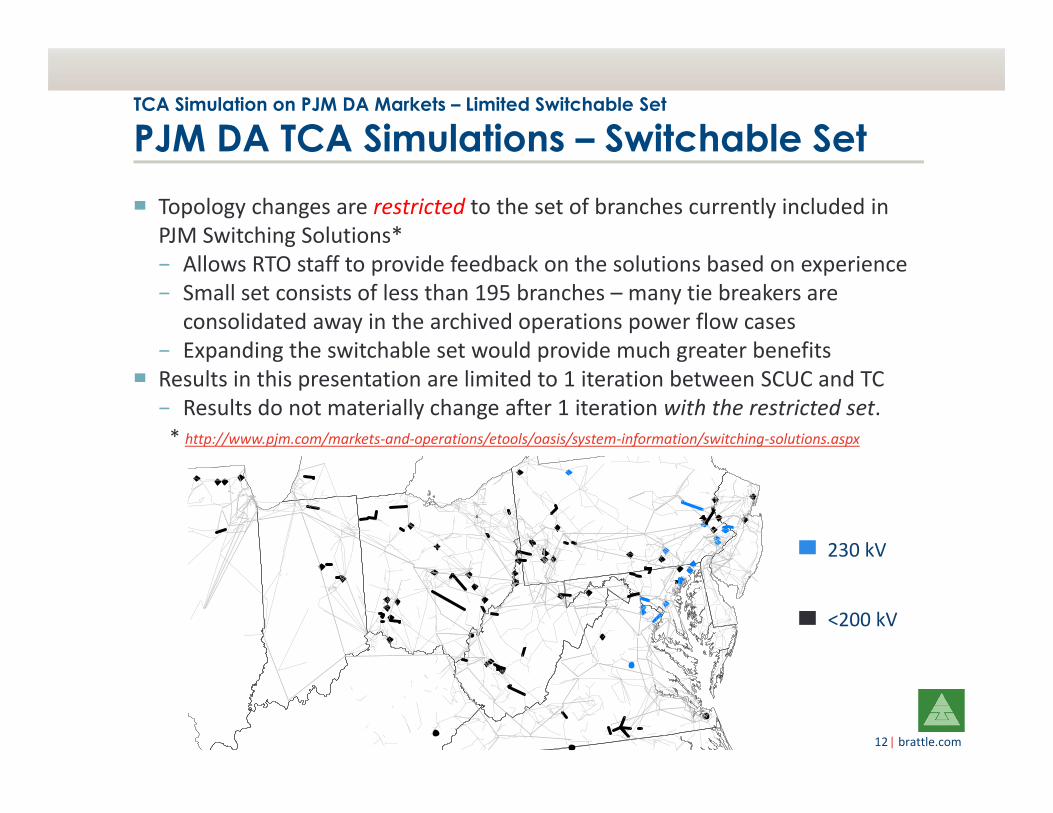
▀ Topology changes are restricted to the set of branches currently included in PJM Switching Solutions*− Allows RTO staff to provide feedback on the solutions based on experience− Small set consists of less than 195 branches – many tie breakers are
consolidated away in the archived operations power flow cases− Expanding the switchable set would provide much greater benefits
▀ Results in this presentation are limited to 1 iteration between SCUC and TC− Results do not materially change after 1 iteration with the restricted set. * http://www.pjm.com/markets‐and‐operations/etools/oasis/system‐information/switching‐solutions.aspx
TCA Simulation on PJM DA Markets – Limited Switchable Set
PJM DA TCA Simulations – Switchable Set
<200 kV
230 kV
| brattle.com13
▀ Solution time: under 5 hours for each DA simulation▀ Cost of switching: minimum savings of $800 per open or close breaker operation required to switch in the summer week, $400 in the winter and shoulder weeks
▀ Reliability− Full security evaluation (6,000 contingencies) and enforcement (included
in the 5 hour time limit)
▀ Network service requirements for all non‐radial loads and generators
▀ Caveat: The congestion savings and percentages in the slides that follow make the presumption that the TCA solutions are viable. In practice, each solution requires full verification by PJM RTO staff and the individual facility owner(s) to verify the solution’s viability
TCA Simulation on PJM DA Markets – Limited Switchable Set
PJM DA TCA Simulations – Other Settings
| brattle.com14
▀ Models based on one operational power flow real‐time snapshot per day for three representative historical weeks of average conditions in 2010 (summer, shoulder and winter weeks). Data used from the power flows:− Transmission topology and branch parameters− External system conditions (e.g., interchange, reciprocal flowgate use)− Dispatch of hydro, wind, landfill, nuclear and reliability must‐run thermal
units− Load time series (adjusted based on DA load forecasts for the day)
▀ Generation economic and transmission constraint data from operations and historical market conditions
▀ Model dimensions: up to 15,200 nodes and 650 dispatchable thermal PJM units, about 4,700 monitored branches and 6,100 single and multi‐element contingencies
TCA Simulation on PJM DA Markets – Limited Switchable Set
PJM DA Market Models: Historical Conditions
| brattle.com15
0%10%20%30%40%50%60%70%80%90%100%
Summer Winter Shoulder
% of Initia
l Cost o
f Con
gestion
TCA Simulation on PJM DA Markets – Limited Switchable Set
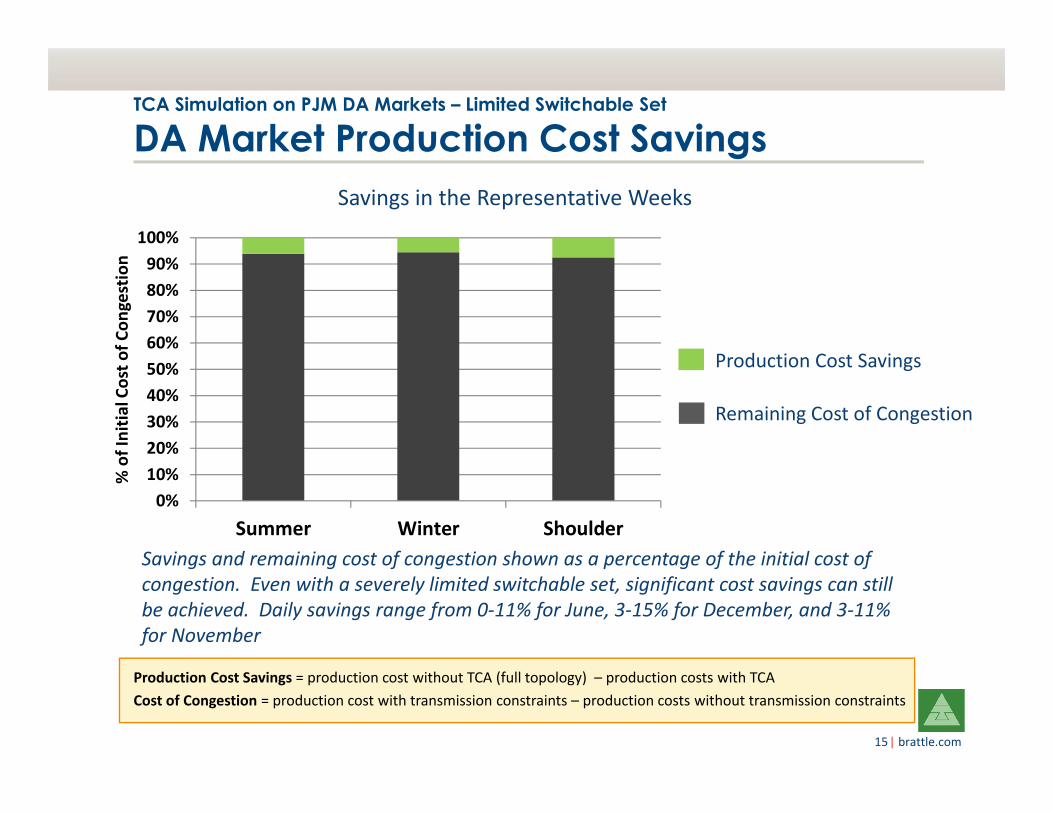
DA Market Production Cost Savings
Production Cost Savings
Remaining Cost of Congestion
Savings and remaining cost of congestion shown as a percentage of the initial cost of congestion. Even with a severely limited switchable set, significant cost savings can still be achieved. Daily savings range from 0‐11% for June, 3‐15% for December, and 3‐11% for November
Production Cost Savings = production cost without TCA (full topology) – production costs with TCACost of Congestion = production cost with transmission constraints – production costs without transmission constraints
Savings in the Representative Weeks
| brattle.com16
TCA Simulation on PJM DA Markets – Limited Switchable Set
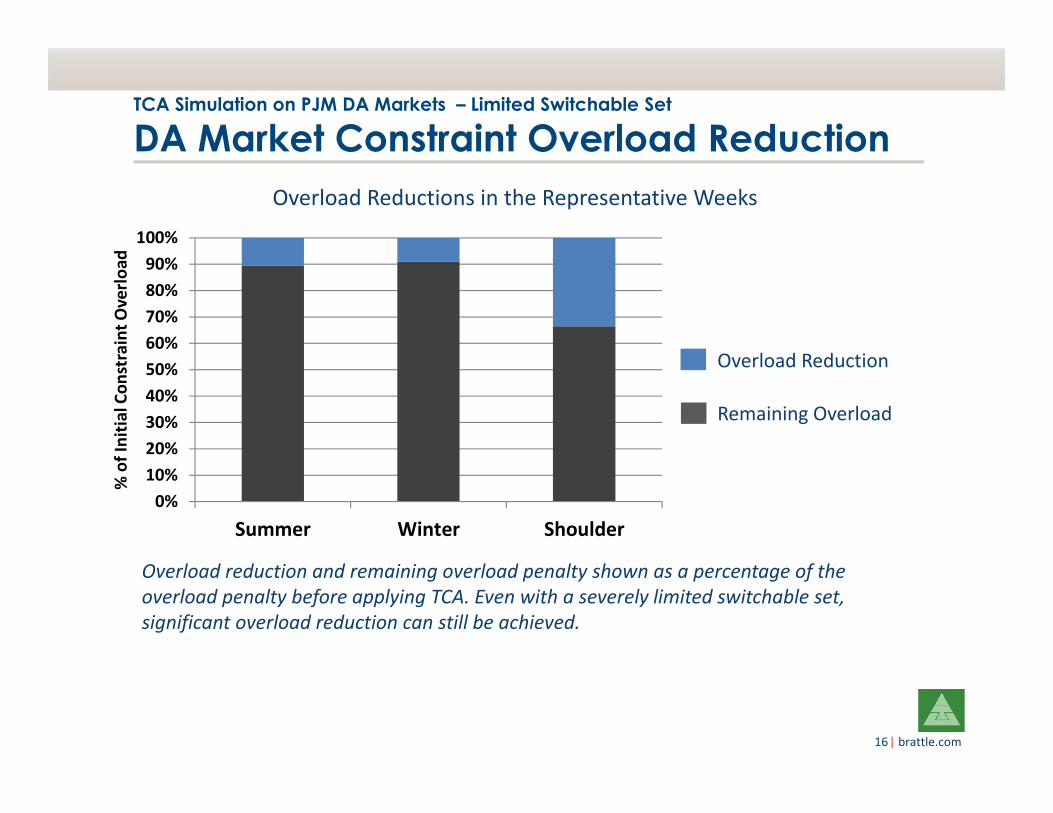
DA Market Constraint Overload Reduction
Overload Reduction
Remaining Overload
Overload reduction and remaining overload penalty shown as a percentage of the overload penalty before applying TCA. Even with a severely limited switchable set, significant overload reduction can still be achieved.
Overload Reductions in the Representative Weeks
0%10%20%30%40%50%60%70%80%90%
100%
Summer Winter Shoulder
% of Initia
l Con
straint O
verlo
ad
| brattle.com17
TCA Simulation on PJM DA Markets – Limited Switchable Set
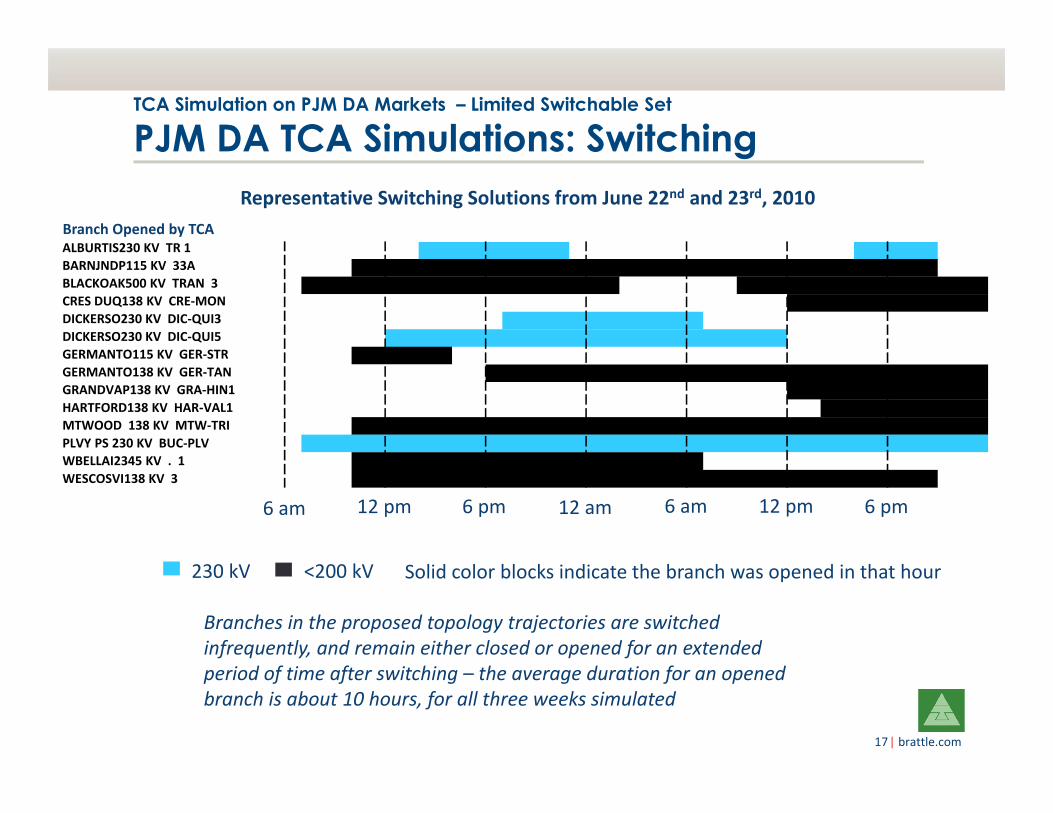
PJM DA TCA Simulations: Switching
<200 kV230 kV Solid color blocks indicate the branch was opened in that hour
Representative Switching Solutions from June 22nd and 23rd, 2010
6 am 12 pm 6 pm
0 0 0 0 0 0 0 0 0 0 0 0 0 0 230 230 230 230 230 230 230 230 230 0 0 0 0 0 0 0 0 0 0 0 0 0 0 0 0 0 230 230 230 230 230 0 0 00 0 0 0 0 0 0 0 0 0 115 115 115 115 115 115 115 115 115 115 115 115 115 115 138 138 138 138 138 138 138 138 138 138 138 138 138 138 138 138 138 138 138 138 138 0 0 00 0 0 0 0 0 0 138 138 138 138 138 138 138 138 138 138 138 138 138 138 138 138 138 138 138 0 0 0 0 0 0 0 138 138 138 138 138 138 138 138 138 138 138 138 138 138 1380 0 0 0 0 0 0 0 0 0 0 0 0 0 0 0 0 0 0 0 0 0 0 0 0 0 0 0 0 0 0 0 0 0 0 0 138 138 138 138 138 138 138 138 138 138 138 1380 0 0 0 0 0 0 0 0 0 0 0 0 0 0 0 0 0 0 230 230 230 230 230 230 230 230 230 230 230 230 0 0 0 0 0 0 0 0 0 0 0 0 0 0 0 0 00 0 0 0 0 0 0 0 0 0 0 0 230 230 230 230 230 230 230 230 230 230 230 230 230 230 230 230 230 230 230 230 230 230 230 230 0 0 0 0 0 0 0 0 0 0 0 00 0 0 0 0 0 0 0 0 0 115 115 115 115 115 115 0 0 0 0 0 0 0 00 0 0 0 0 0 0 0 0 0 0 0 0 0 0 0 0 0 138 138 138 138 138 138 138 138 138 138 138 138 138 138 138 138 138 138 138 138 138 138 138 138 138 138 138 138 138 1380 0 0 0 0 0 0 0 0 0 0 0 0 0 0 0 0 0 0 0 0 0 0 0 0 0 0 0 0 0 0 0 0 0 0 0 138 138 138 138 138 138 138 138 138 138 138 1380 0 0 0 0 0 0 0 0 0 0 0 0 0 0 0 0 0 0 0 0 0 0 0 0 0 0 0 0 0 0 0 0 0 0 0 0 0 138 138 138 138 138 138 138 138 138 1380 0 0 0 0 0 0 0 0 0 138 138 138 138 138 138 138 138 138 138 138 138 138 138 138 138 138 138 138 138 138 138 138 138 138 138 138 138 138 138 138 138 138 138 138 138 138 1380 0 0 0 0 0 0 230 230 230 230 230 230 230 230 230 230 230 230 230 230 230 230 230 230 230 230 230 230 230 230 230 230 230 230 230 230 230 230 230 230 230 230 230 230 230 230 2300 0 0 0 0 0 0 0 0 0 138 138 138 138 138 138 138 138 138 138 138 138 138 138 138 138 138 138 138 138 138 0 0 0 0 0 0 0 0 0 0 0 0 0 0 0 0 00 0 0 0 0 0 0 0 0 0 138 138 138 138 138 138 138 138 138 138 138 138 138 138 138 138 138 138 138 138 138 138 138 138 138 138 138 138 138 138 138 138 138 138 138 0 0 0
12 am 6 am 12 pm 6 pm
Branches in the proposed topology trajectories are switched infrequently, and remain either closed or opened for an extended period of time after switching – the average duration for an opened branch is about 10 hours, for all three weeks simulated
ALBURTIS230 KV TR 1BARNJNDP115 KV 33ABLACKOAK500 KV TRAN 3CRES DUQ138 KV CRE‐MONDICKERSO230 KV DIC‐QUI3DICKERSO230 KV DIC‐QUI5GERMANTO115 KV GER‐STRGERMANTO138 KV GER‐TANGRANDVAP138 KV GRA‐HIN1HARTFORD138 KV HAR‐VAL1MTWOOD 138 KV MTW‐TRIPLVY PS 230 KV BUC‐PLVWBELLAI2345 KV . 1WESCOSVI138 KV 3
Branch Opened by TCA
| brattle.com18
0
2
4
6
8
10
12
14
# of Branche
s Ope
n
TCA Simulation on PJM DA Markets – Limited Switchable Set
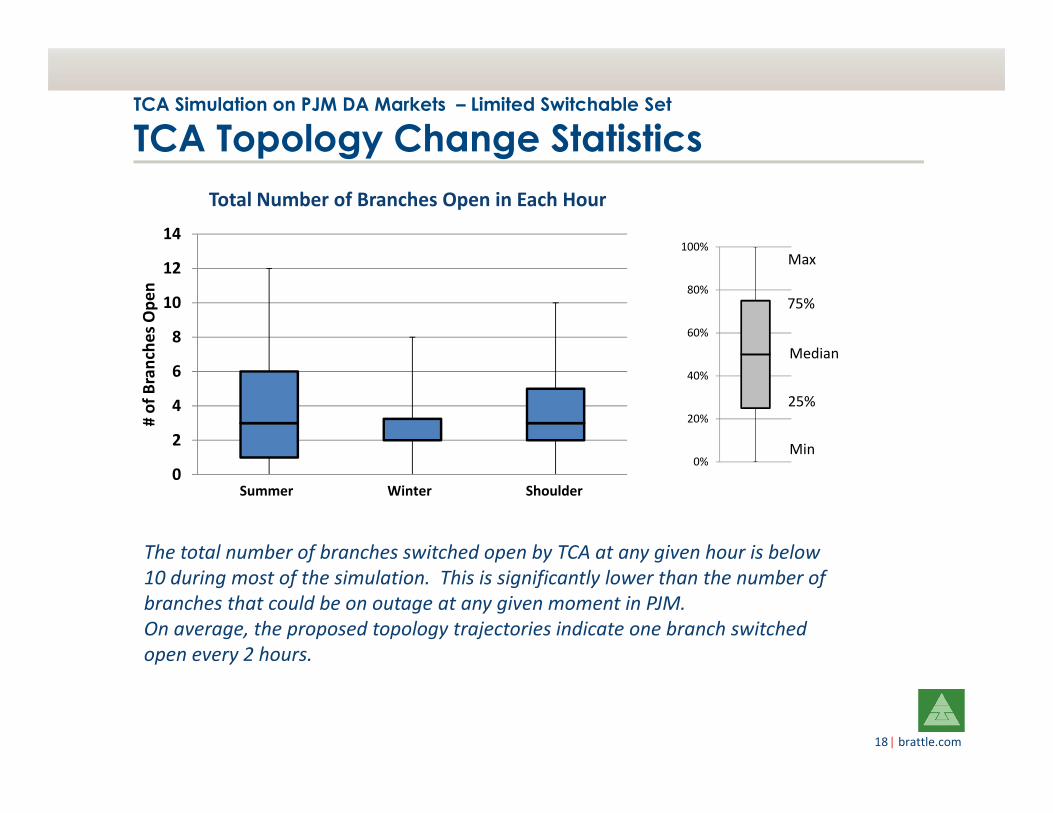
TCA Topology Change Statistics
0%
20%
40%
60%
80%
100%
75%
25%
Median
Max
Min
Summer Winter Shoulder
Total Number of Branches Open in Each Hour
The total number of branches switched open by TCA at any given hour is below 10 during most of the simulation. This is significantly lower than the number of branches that could be on outage at any given moment in PJM. On average, the proposed topology trajectories indicate one branch switched open every 2 hours.
| brattle.com19
$0
$20
$40
$60
$80
$100
$120
$140
$160
$180
Margina
l Cost a
t Min Gen
($/M
Wh)
TCA Simulation on PJM DA Markets – Limited Switchable Set
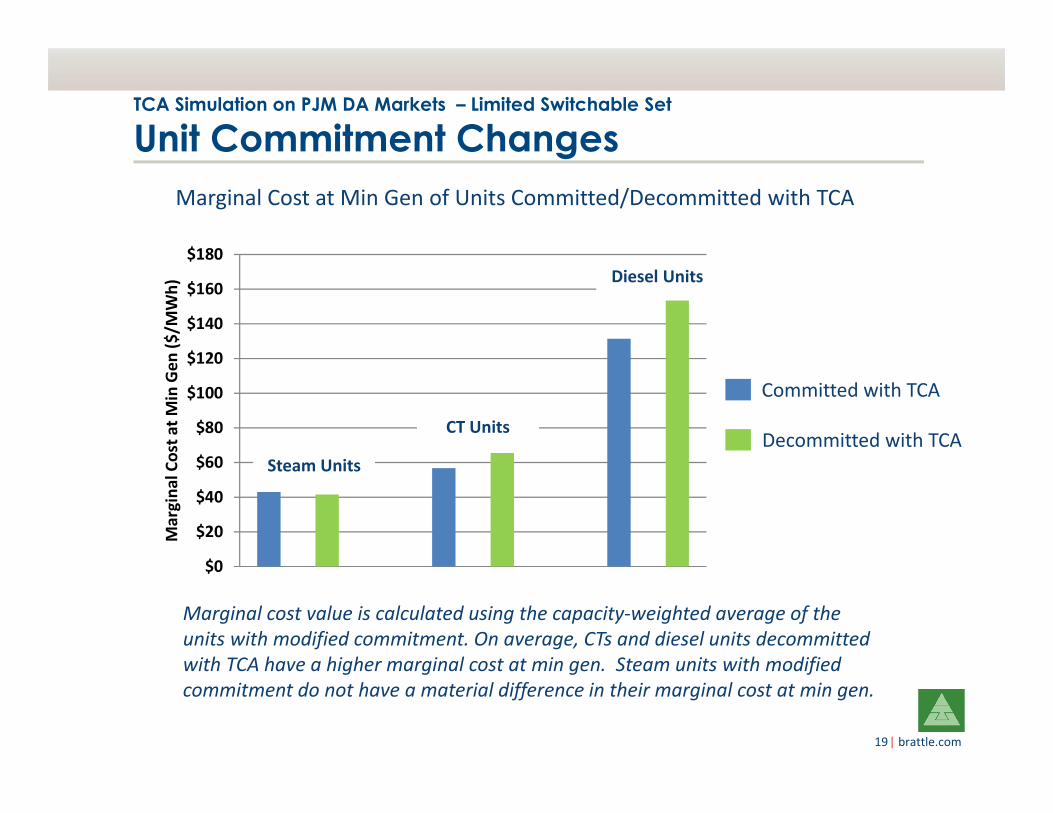
Unit Commitment Changes
Marginal cost value is calculated using the capacity‐weighted average of the units with modified commitment. On average, CTs and diesel units decommittedwith TCA have a higher marginal cost at min gen. Steam units with modified commitment do not have a material difference in their marginal cost at min gen.
Decommitted with TCA
Committed with TCA
Steam Units
CT Units
Diesel Units
Marginal Cost at Min Gen of Units Committed/Decommitted with TCA
| brattle.com20
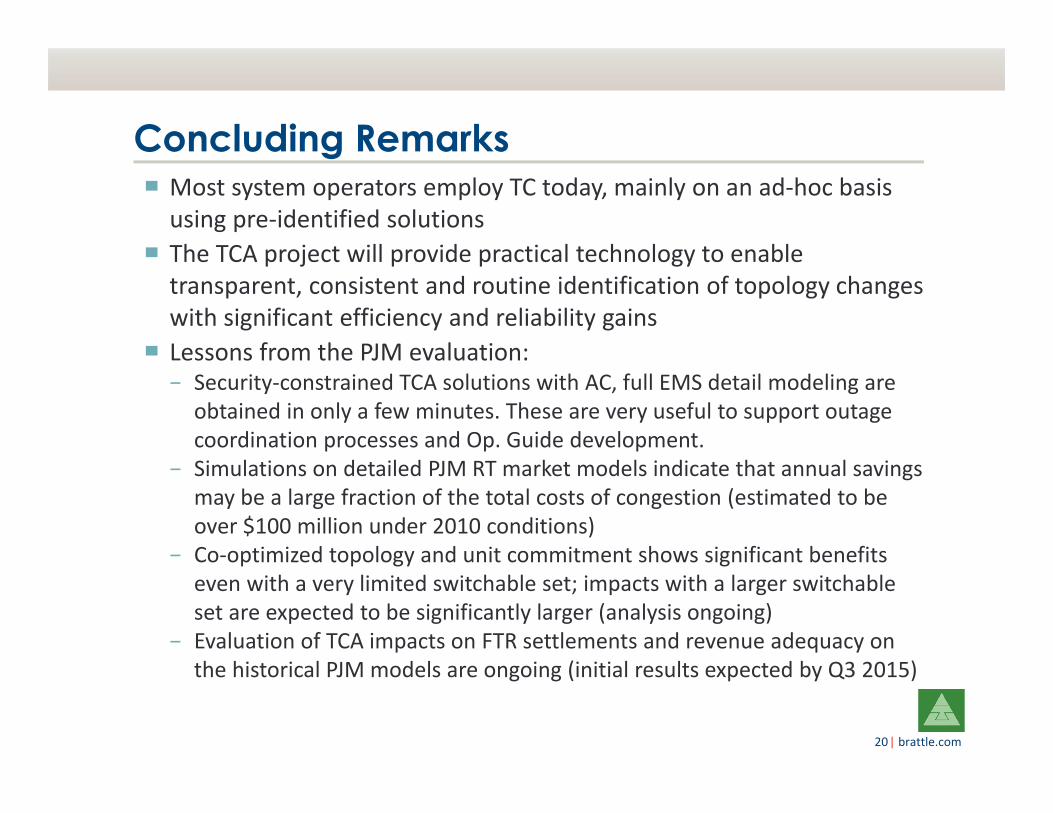
▀ Most system operators employ TC today, mainly on an ad‐hoc basis using pre‐identified solutions
▀ The TCA project will provide practical technology to enable transparent, consistent and routine identification of topology changes with significant efficiency and reliability gains
▀ Lessons from the PJM evaluation:− Security‐constrained TCA solutions with AC, full EMS detail modeling are
obtained in only a few minutes. These are very useful to support outage coordination processes and Op. Guide development.
− Simulations on detailed PJM RT market models indicate that annual savings may be a large fraction of the total costs of congestion (estimated to be over $100 million under 2010 conditions)
− Co‐optimized topology and unit commitment shows significant benefits even with a very limited switchable set; impacts with a larger switchable set are expected to be significantly larger (analysis ongoing)
− Evaluation of TCA impacts on FTR settlements and revenue adequacy on the historical PJM models are ongoing (initial results expected by Q3 2015)
Concluding Remarks
| brattle.com21
Pablo A. Ruiz, Principal InvestigatorBoston University and The Brattle Group, [email protected], (617) 234‐5748
http://www.topologycontrol.com
Contact
The TCA Team would like to thank the PJM staff for their continued cooperation and collaboration in data provision, model and results review, operational insights, and overall project guidance. We would also like to thank the ARPA‐E GENI team for their ongoing leadership and support. Opinions expressed in this report, as well as any errors or omissions, are the authors’ alone.
Funding for the TCA project is provided by the Advanced Research Projects Agency – Energy (ARPA‐E), U.S. Department of Energy, under the Green Energy Network Integration (GENI) program, Award Number DE‐AR0000223, by the Massachusetts Clean Energy Center (MassCEC), and by the team member institutions.
Acknowledgments
| brattle.com22
$0M
$2M
$4M
$6M
$8M
Summer Winter Shoulder
56%
44%
32%
68%
33%67%
Production Cost Savings
Remaining Cost of Congestion
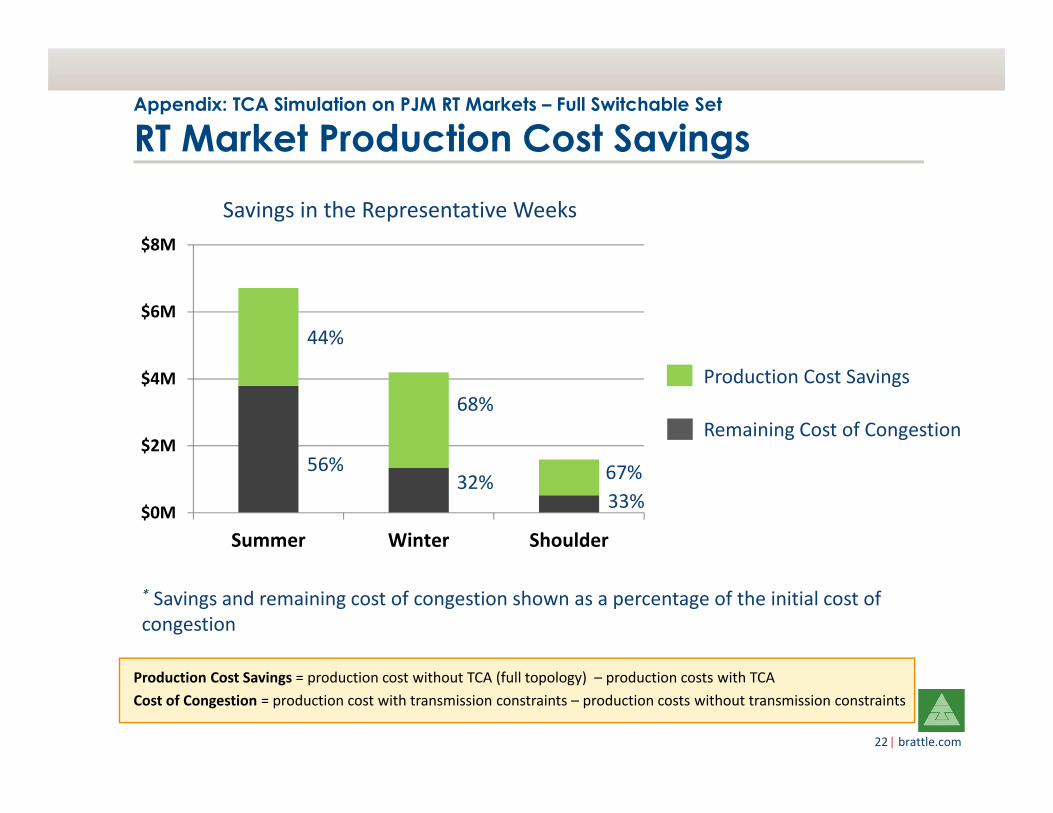
* Savings and remaining cost of congestion shown as a percentage of the initial cost of congestion
Savings in the Representative Weeks
Production Cost Savings = production cost without TCA (full topology) – production costs with TCACost of Congestion = production cost with transmission constraints – production costs without transmission constraints
Appendix: TCA Simulation on PJM RT Markets – Full Switchable Set
RT Market Production Cost Savings
| brattle.com23
References[1] E. A. Goldis, M. C. Caramanis, C. R. Philbrick, A. M. Rudkevich and P. A. Ruiz, “Security‐constrained MIP
formulation of topology control using loss‐adjusted shift factors,” in Proc. 47th Hawaii Int. Conf. System Science, Waikoloa, HI, January 2014
[2] P. A. Ruiz, M. C. Caramanis, E. Goldis, B. Keshavamurthy, X. Li, M. Patel, C. R. Philbrick, A. M. Rudkevich, R. D. Tabors, T. B. Tsuchida, “Transmission Topology Control for System Efficiency: Simulations on PJM Real Time Markets,” presented at 2013 IEEE Power and Energy Society General Meeting, Vancouver, Canada, July 2013.
[3] P. A. Ruiz, J. M. Foster, A. Rudkevich and M. C. Caramanis, “Tractable transmission topology control using sensitivity analysis,” IEEE Transactions on Power Systems, vol. 27, no. 3, Aug 2012, pp. 1550 – 1559.
[4] P. A. Ruiz, A. Rudkevich, M. C. Caramanis, E. Goldis, E. Ntakou and C. R. Philbrick, “Reduced MIP formulation for transmission topology control,” in Proc. 50th Allerton Conference on Communications, Control and Computing, Monticello, IL, October 2012.
[5] J. M. Foster, P. A. Ruiz, A. Rudkevich and M. C. Caramanis, “Economic and corrective applications of tractable transmission topology control,” in Proc. 49th Allerton Conference on Communications, Control and Computing, Monticello, IL, September 2011.
[6] P. A. Ruiz, J. M. Foster, A. Rudkevich and M. C. Caramanis, “On fast transmission topology control heuristics,” in Proc. 2011 IEEE Power and Energy Society General Meeting, Detroit, MI, July 2011.
[7] R. O’Neill, R. Baldick, U. Helman, M. Rothkopf, and W. Stewart, “Dispatchable transmission in RTO markets,” IEEE Trans. Power Syst., vol. 20, no. 1, pp. 171–179, Feb. 2005
[8] E. B. Fisher, R. P. O’Neill, and M. C. Ferris, “Optimal transmission switching,” IEEE Trans. Power Syst., vol. 23, no. 3, pp. 1346–1355, Aug. 2008.
[9] K. W. Hedman, R. P. O’Neill, E. B. Fisher, and S. S. Oren, “Optimal transmission switching with contingency analysis,” IEEE Trans. Power Syst., vol. 23, no. 3, pp. 1577–1586, Aug. 2009.